
Submitted:
06 February 2026
Posted:
09 February 2026
You are already at the latest version
Abstract
Land use change profoundly impacts the trade-offs and synergies among ecosystem services in ecologically fragile watersheds. Optimizing land use patterns based on ecological function zoning is an important approach to coordinate multiple ecosystem services and promote sustainable watershed management. This study focuses on the Wuding River Basin within the Chinese Loess Plateaue, using Self-Organizing Map (SOM), multi-objective genetic algorithms, and the Future Land-Use Simulation (FLUS) model to explore land use optimization schemes. The results show that the windbreak and sand fixation service (WS) in the Wuding River Basin presents a spatial pattern of higher values in the northwest and lower values in the southeast, while the other six services exhibit a pattern of higher values in the east and lower values in the west. Based on the ecosystem service cluster characteristics, the basin can be divided into soil and water conservation zones, habitat conservation zones, and ecologically fragile zones. The trade-offs and synergies between ecosystem services within different zones differ significantly, with the trade-off between food supply (FS), soil conservation (SC), and habitat quality (HQ) being particularly prominent. After optimization, the FS and SC in the soil and water conservation zones increased by an average of 0.63×10⁴t and 1.94×10⁵t, respectively. The FS in the habitat conservation zones increased by 0.11×10⁴t, while HQ remained stable. In the ecologically fragile area, water production (WP) and carbon sequestration (CS) services increased by an average of 0.26×10⁴t and 0.58×10⁵t, respectively. During the optimization process, the reasonable allocation of grassland and unused land played a key role in balancing service conflicts. This study provides a scientific basis for coordinating trade-offs in watershed ecosystem services and achieving land use optimization management through the framework of service clusters, functional zones, and multi-objective optimization.
Keywords:
ecosystem services
; ecological function zoning
; multi-objective genetic algorithm
; land use optimization
; Wuding River Basin
1. Introduction
The ecosystem services are the natural capital and foundation upon which human survival and development depend, and their provision is crucial for achieving sustainable development [1,2]. However, since the mid-20th century, intense human activities have profoundly altered surface landscape patterns and ecological processes, leading to a series of ecological degradation issues such as soil erosion and biodiversity loss. These changes have weakened the continuous supply capacity of ecosystem services in ecologically fragile watersheds and pose a potential threat to the long-term development of human society [3,4,5]. In the context of global sustainable development, integrating ecosystem services into regional planning and land management systems, and implementing differentiated zoning management measures, is considered an important approach to coordinating economic development with ecological protection and promoting regional sustainable development [2,6].
Ecological function zoning, as an effective policy tool for achieving spatially differentiated and precise management, focuses on the reasonable division and integration of ecological regions and units [7,8]. Traditional zoning methods mainly emphasize regional characteristics and natural geographic factors [9], while recent research trends highlight the importance of considering the balance between ecosystem service provision and human well-being needs [10,11]. In this context, ecosystem service clusters provide a novel and powerful analytical perspective for zoning. A service cluster refers to a group of ecosystem services that repeatedly occur together in space [12]. Identifying service clusters not only reveals the dominant service functions within a region but also aids in the comprehensive management of multiple ecosystem services. K-Means and Self-Organizing Maps (SOM) are typical methods for clustering multiple ecosystem services to identify service clusters [13]. SOM networks are unsupervised, self-organizing, self-learning networks with strong memory, robustness, nonlinear mapping ability, and self-learning characteristics [14]. Conducting ecological function zoning based on service clusters allows for the delineation of spatial units with homogeneous service provision and consistent management needs, thus providing a scientific basis for zonal management and targeted interventions [15]. At the watershed scale, ecosystem services often exhibit spatially dynamic changes. Using ecosystem service clusters helps promote comprehensive watershed management, minimizing trade-offs between services and enhancing their synergistic effects [16]. Therefore, ecological function zoning based on ecosystem service clusters is crucial for improving ecosystem service governance effectiveness, promoting multifunctional landscape management, and optimizing land use [17,18].
Land use patterns profoundly impact ecosystem services, and their planning and management are directly related to the availability and quality of these services [19]. For a long time, humans have adjusted land use patterns to meet their demands for land resources, and this process has continuously altered the trade-offs and synergies between ecosystem services [20]. By assessing the historical changes in land use, simulating future scenarios, and analyzing the relationship between land use intensity and ecosystem service value [18,21], a solid foundation has been established for understanding the interactive processes between human activities and the natural environment. In terms of land use optimization, related research typically uses land use simulation models to set future scenarios, simulating various scenarios such as natural development, economic growth, and ecological protection, or predicting land use scenarios under CMIP climate models [22,23]. However, existing studies mostly focus on single-objective optimization at a regional scale or global trade-offs across all ecosystem services, lacking differentiated optimization strategies based on ecological function zoning. This is especially true for addressing the most prominent service conflicts within different functional zones, which limits the universality and practicality of optimization strategies. Currently, research that organically integrates the identification of ecosystem service clusters, the delineation of ecological function zones, and differentiated land use optimization within these zones is still relatively rare [24]. From the perspective of multi-objective optimization, taking ecosystem services under trade-offs as the goal, and incorporating government policy guidance to set reasonable constraints, differentiated land use management optimization can not only improve land use efficiency but also maximize and balance ecological services across different regions [25]. This coherent optimization logic is key to enhancing the relevance, precision, and effectiveness of land resource management measures [26].
In summary, this study takes the Wuding River Basin as a case example and constructs a service-cluster-oriented land use optimization framework based on ecological function zoning. Through the “diagnosis-zoning-optimization” research path, the aim is to provide scientific support and practical reference for mitigating ecosystem service conflicts in the ecologically fragile watershed and promoting sustainable land use management. The specific objectives are to (1) reveal the supply capacity and spatial distribution characteristics of various ecosystem services in the watershed; (2) perform ecological function zoning of the watershed through service cluster identification and clarify the trade-offs and synergies of ecosystem services within each functional zone; (3) explore differentiated land use optimization solutions for the two core services with the most significant trade-offs within each zone, providing feasible recommendations for watershed government land use planning. The core contribution of this study lies in focusing on land use optimization for the two most significant trade-offs in each ecological function zone, constructing a multi-objective function based on ecosystem service material value, setting land use constraints that align with government policy guidance, and using genetic algorithms to obtain feasible land use optimization solutions.
2. Materials and Methods
2.1. Study Area and Data Sources
The Wuding River Basin (37°14′N-39°35′N, 108°18′E-111°45′E) is located in the northwest of the Loess Plateau and serves as a first-level tributary of the middle Yellow River. It lies at the junction of semi-humid and semi-arid areas, with a total basin area of 30,261km2 (Figure 1). Climate change has exacerbated ecological risks in the ecologically vulnerable watersheds.The Wuding River experiences severe and complex soil erosion. The western part of the basin is the southern edge of the Mu Us Desert, with relatively high but flat terrain, classified as a wind-sand area. Before large-scale sand control projects were implemented, sand dunes were widely distributed, and wind erosion was the dominant factor. The northwest and southwest areas have higher wind erosion intensity, with lighter water erosion. Soil nutrient content is low, the sand layer is thick, vegetation is sparse, and arable land is scarce. The southeastern part of the basin belongs to the Loess Plateau hilly and gully region, where the elevation is lower than in the west, but the terrain is highly undulating with numerous gullies, and the landscape is fragmented. Land use in this area is mainly cultivated land, with frequent human activity, prominent water erosion, and severe soil erosion. Since 2000, thanks to the implementation of grain-for-green and sand control projects [27], vegetation coverage in the basin has improved, though the overall ecosystem remains fragile.
This study integrates various geographic information data, covering hydrology, meteorology, soil, land use, and socio-economic aspects of the basin. A detailed description of the data and specific sources can be found in Table 1.
2.2. Simulation of Multiple Ecosystem Services
Based on the actual natural conditions of the Wuding River Basin and the availability of data in the study area, this research selected seven types of ecosystem services for quantitative simulation: water production (WP), soil conservation (SC), cultural services (CT), food supply (FS), carbon sequestration (CS), habitat quality (HQ), and windbreak and sand fixation (WS), using data from 2020. Among these, WP and SC services were simulated using the SWAT model, which divides the sub-basins based on topography and outputs the calculation results. To ensure spatial consistency and comparability among different services, this study used sub-basins as a unified analysis unit to spatially represent each ecosystem service. This generated spatial distribution patterns for the seven ecosystem services in the Wuding River Basin, which were then used for ecosystem service cluster identification and ecological function zoning analysis. The specific simulation methods for each ecosystem service and the result verification process are detailed in Appendix.
2.3. Identification of Ecosystem Service Clusters and Ecological Function Zoning
The SOM model, proposed by Finnish scholar Kohonen [28], is capable of mapping high-dimensional inputs to a lower-dimensional space while preserving the similarity of input signals, ensuring that similar input signals remain adjacent in the mapped space. The SOM network consists of two layers: an input layer and a mapping layer. The two-dimensional plane organization is the most typical structure of the SOM network. Therefore, this study uses the SOM model for ecosystem service cluster identification. The steps of the SOM learning algorithm are as follows:
- (1)
- Network initialization: Set the initial weights between the input layer and the mapping layer.
- (2)
- Input vector: Input the vector into the input layer.
- (3)
- For each input pattern, calculate the Euclidean distance between each neuron and the input vector, select the neuron with the smallest distance as the winning neuron, and determine the neighboring neuron set.
- (4)
- Adjust the weights according to the following formula:
In the formula, ∆ωij represents the updated and adjusted weight, η(t) is the learning rate, Tj,Ix(t) is the topological neighborhood, xi is the input data, and ωji is the weight vector between neuron j and input data i.
- (5)
- Repeat the above steps until the neural network converges.
This study applies the SOM algorithm for ecological function zoning. First, the seven different types of ecosystem services are standardized, and then the SOM algorithm is implemented in Matlab for spatial clustering of these services. In the experiment, the number of clusters is set to 2, 3, 4, and 5, and the spatial aggregation effect of ecosystem service clusters is analyzed under different clustering numbers. The results show that when the number of clusters is set to 3, the spatial aggregation of each cluster is relatively high, and the division of sub-basin quantities is reasonable, with significant heterogeneity between categories. Therefore, the final number of ecosystem service clusters is determined to be 3, and based on this, the final ecological function zoning is derived.
2.4. Trade-Offs and Synergies Among Ecosystem Services
To explore the trade-offs and synergies between various services within each ecological function zone, this study uses Pearson correlation analysis to assess their relationships [29]. The specific calculation formula is as follows:
In the formula, r is the correlation coefficient, Xi and Yi are the observation values of the two services; are the means of variables Xi and Yi respectively, and n is the number of observations. In this study, when r > 0, it indicates a synergistic relationship between the two services; when r < 0, it indicates a trade-off relationship between them.
2.5. Land Use Optimization Based on Multi-Objective Genetic Algorithms
2.5.1. Multi-Objective Genetic Algorithm Configuration
The multi-objective genetic algorithm, based on genetic algorithms, introduces a multi-objective optimization framework that can generate a set of Pareto solutions, providing multiple options for land use optimization [30]. This method can flexibly handle trade-offs between different ecosystem service objectives and achieve higher flexibility and precision in planning. In this study, multi-objective functions are constructed based on the two ecosystem services with the greatest trade-offs in each functional zone, exploring ecosystem service optimization solutions for different functional zones.
The objective function for ecosystem service optimization is as follows:
In the formula, Yk represents the material quantity of ecosystem service k; ai denotes the coefficient of ecosystem service k for the i land use type; xi represents the area of the i land use type (hm²), with the areas of cultivated land, forest land, grassland, waterbody, artificial land, and unused land denoted as x1, x2, x3, x4, x5, and x6, respectively. Through ecosystem service simulation, the coefficients ai for the target ecosystem services in the three ecological function zones of the Wuding River Basin corresponding to each land use type are obtained, representing the ecosystem service quantity per unit area. The specific objective functions for each function zone are as follows:
- (i)
- The optimization objective function for the soil and water conservation zone is:
In the formula, Y1 and Y2 represent the food supply (t) and soil conservation (t) in the soil and water conservation zone, respectively.
- (ii)
- The optimization objective function for the habitat conservation zone is:
In the formula, Y3 and Y4 represent habitat quality (dimensionless) and food supply service (t) in the habitat conservation zone, respectively.
- (iii)
- The optimization objective function for the ecologically fragile zone is:
In the formula, Y5 and Y6 represent carbon sequestration service (t) and water supply service (m3) in the ecologically fragile zone, respectively.
In setting the upper limits for variable constraints, this study takes into account the actual land use planning of the Wuding River Basin as much as possible. Since the Wuding River is the mother river of Yulin City, which occupies the largest proportion of the basin, the study refers to the land use goals related to cultivated land, forest land, and grassland in Yulin City’s 14th Five-Year Plan and uses these as constraints. For land use types not clearly defined in the 14th Five-Year Plan, such as waterbody and artificial land, the constraints are set based on historical data (e.g., statistical yearbooks and land use data). The area of unused land is not allowed to exceed the existing area in 2020. For the lower bound constraints on the independent variables, based on the “cultivated land red line” policy, the cultivated land area should not be less than the existing cultivated land area in 2020. The areas of forest land and grassland should not be smaller than the minimum area in 2000 and 2020, and the waterbody area should not be lower than the existing water body area in 2020.
2.5.2. Selection of Land Use Optimization Scenarios
Based on relevant literature and data, this study sets the population size of the genetic algorithm to 100 and the maximum number of evolution generations to 1000 [31]. When the coefficient for the optimal individual is set to 0.8, a relatively smooth and clearly trending Pareto curve can be obtained. After solving with the algorithm, 80 predicted land use scenarios are generated for each ecological function zone. To analyze the land use change trends in the scenarios and to simulate and visualize the spatial distribution of land use types after objective optimization, this study selected three scenarios from the 80 predicted ones and used the Future Land-Use Simulation (FLUS) model for land use simulation. The scenario selection method was based on assigning three sets of weights to the two objectives of each ecological function zone, specifically: (I) the weight of target service 1 is 0.2, and the weight of target service 2 is 0.8; (II) the weight of target service 1 and target service 2 is both 0.5; (III) the weight of target service 1 is 0.8, and the weight of target service 2 is 0.2.
2.6. Simulation of Land Use Patterns Based on the FLUS Model
The FLUS model is a land use simulation model that combines cellular automata and artificial neural network algorithms [32]. It can simulate land use changes under natural conditions and human activities, and can also simulate future land use spatial patterns based on land use demands. After obtaining the land use optimization solutions for each ecological function zone using the multi-objective genetic algorithm, it is necessary to visualize the land use optimization prediction scenarios within each ecological function zone to present the spatial distribution of land use under each scenario, providing more specific and clear guidance for land use planning and management. To this end, this study uses the FLUS model to simulate the spatial distribution of land use types under different optimization scenarios. By incorporating the land use type objectives corresponding to the three sets of target weights for each ecological function zone into the FLUS model, land use optimization spatial distribution maps were generated under the three weight configurations.
To ensure the accuracy of the FLUS model in simulating land use and to localize the model parameters, this study performed accuracy evaluation and parameter adjustment of the FLUS model’s simulation results based on historical land use data. Specifically, two rounds of model accuracy verification were conducted: one using 2000 as the baseline to simulate and predict land use in 2010, and another using 2010 as the baseline to simulate and predict land use in 2020. Finally, the simulated predictions for 2010 were compared with the actual land use map, yielding a Kappa coefficient of 0.94; the simulated predictions for 2020 were compared with the actual land use map, yielding a Kappa coefficient of 0.76. The higher the Kappa coefficient, the better the simulation accuracy. Both validation accuracies were greater than 0.75, indicating that the FLUS model’s simulation performance is good and can be used for simulating and predicting different land use scenarios in the region.
3. Results
3.1. Spatial Patterns of Ecosystem Services in the Wuding River Basin
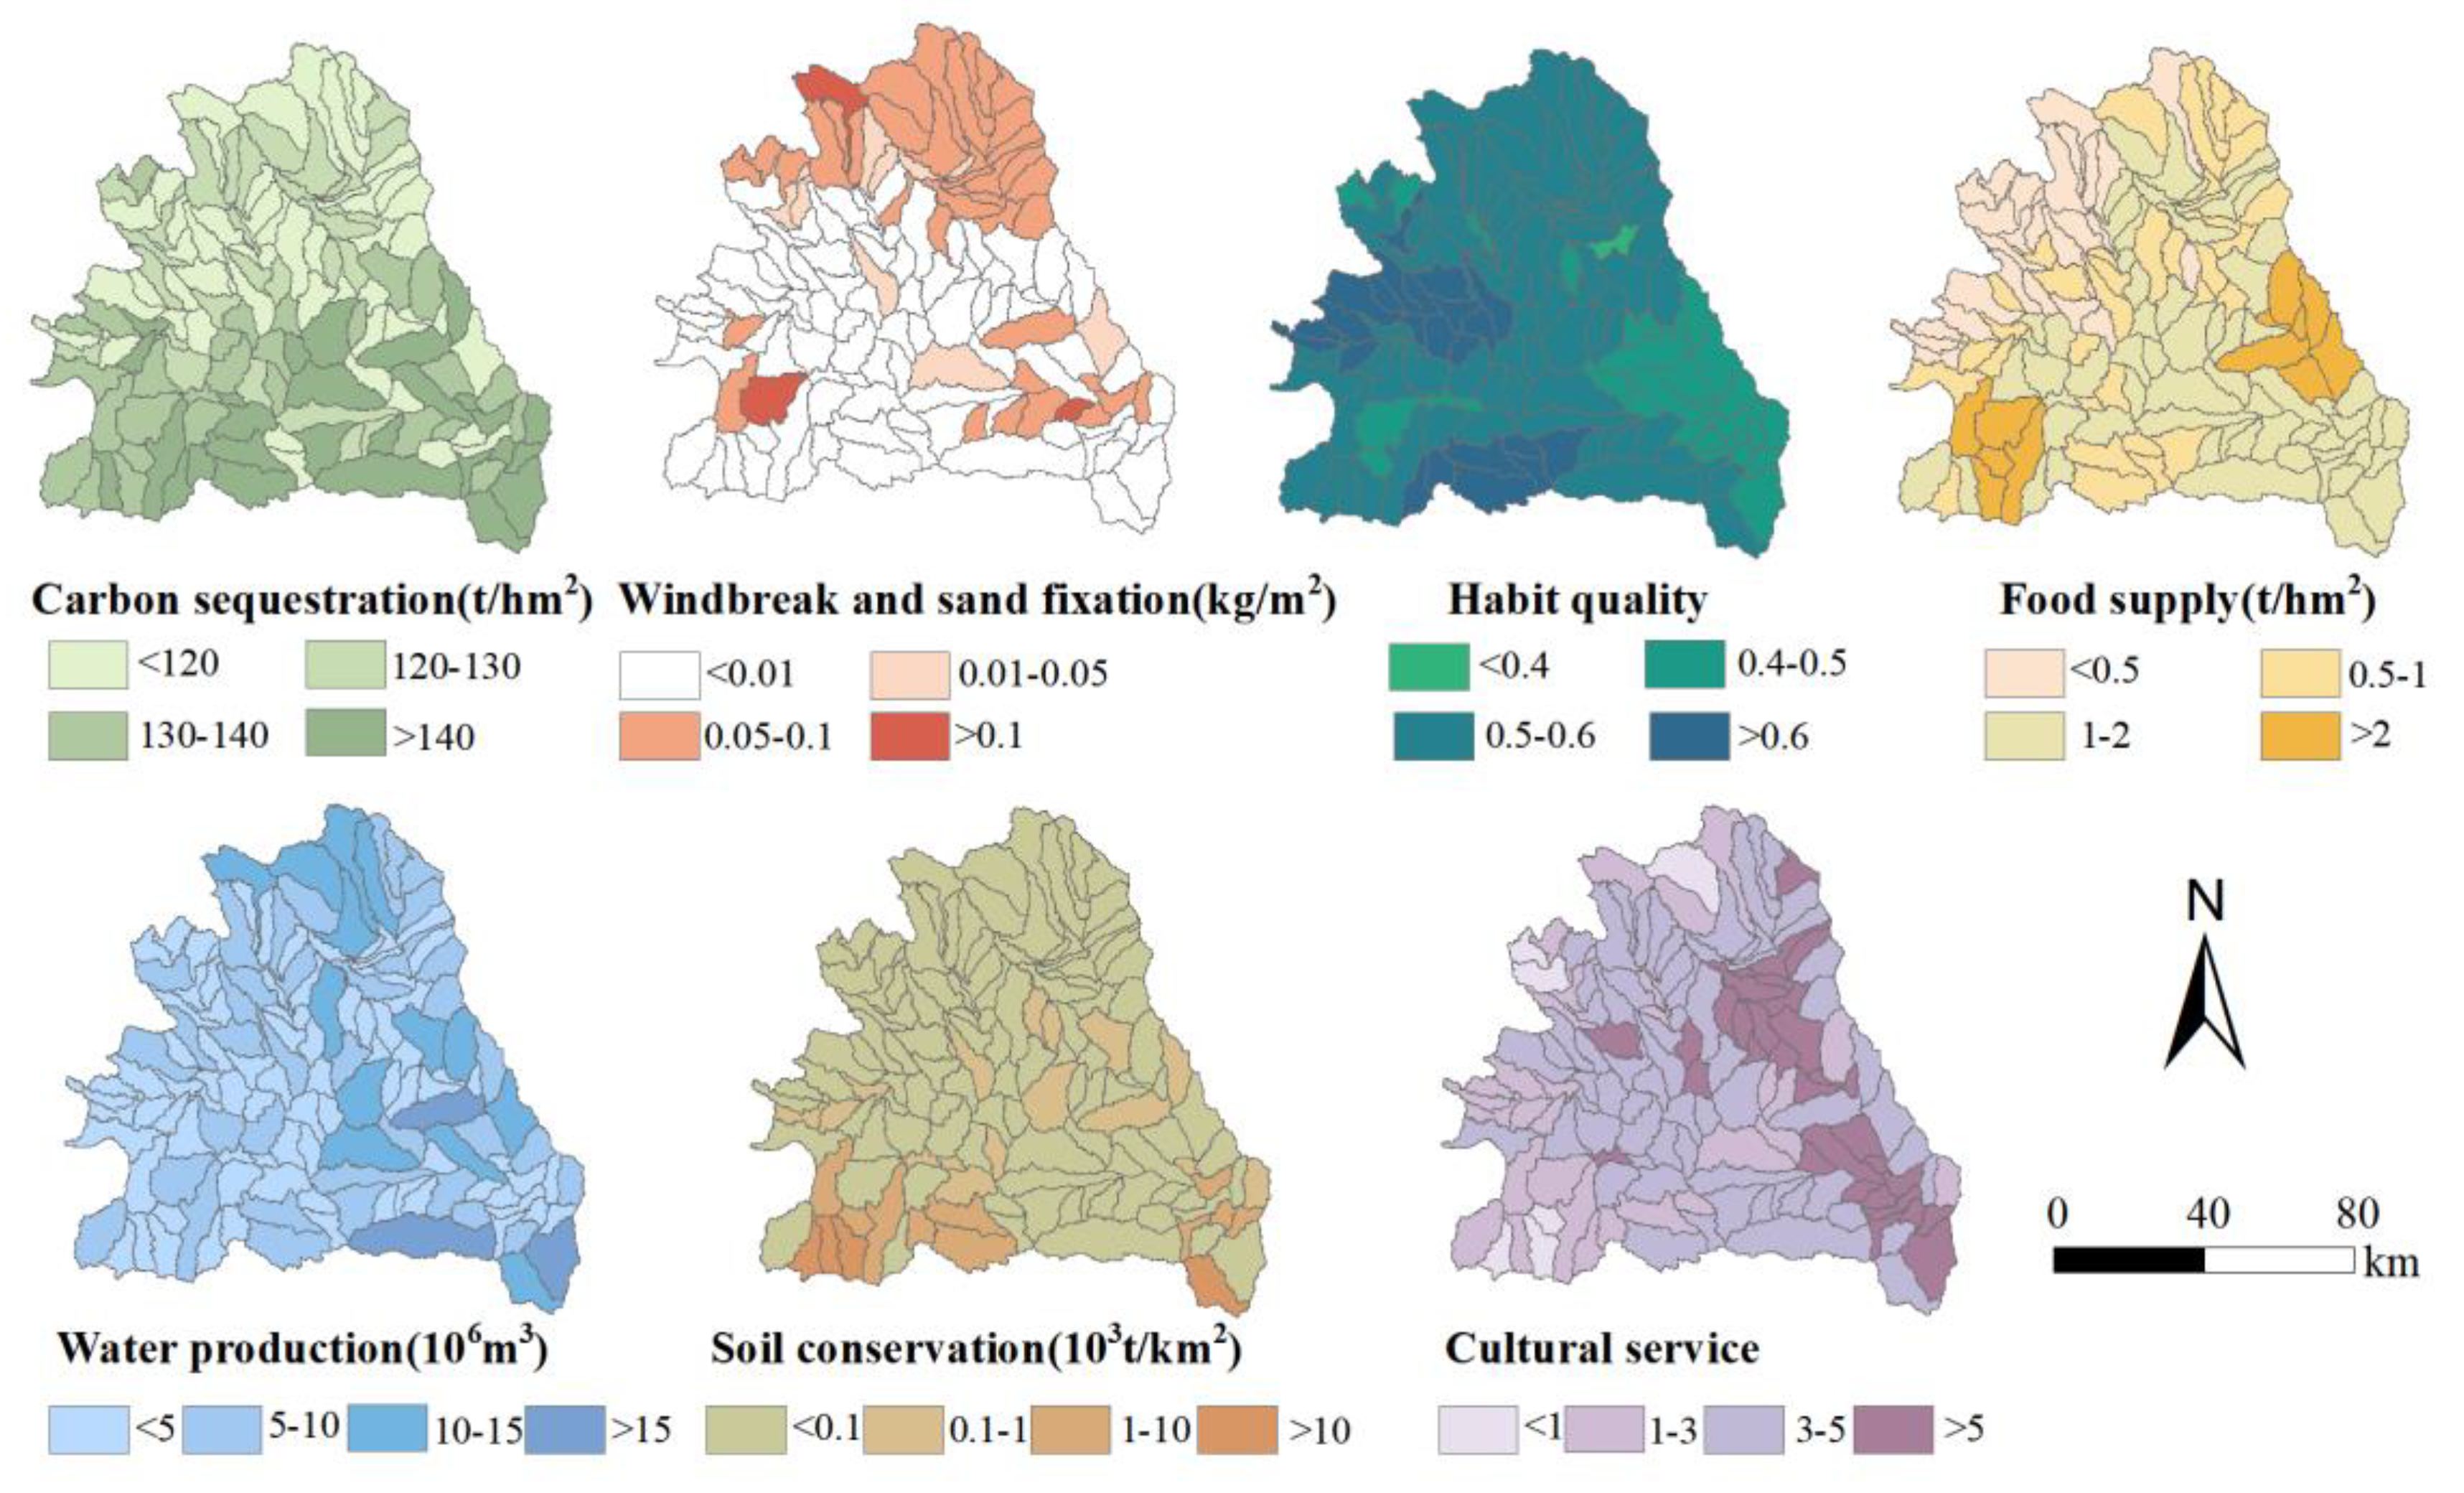
In 2020, the total CS service in the Wuding River Basin was 378.84×10⁶t, with high-value areas concentrated in the southeastern part of the basin. Low-value areas were mainly located in the northwest and central regions, where the northwest had a higher distribution of unused land, and the central area had a higher proportion of artificial land, resulting in overall weaker carbon sequestration capacity. The WS service exhibited a spatial distribution pattern of higher values in the west and lower values in the east. In the western region, due to stronger wind erosion, the ecosystem’s windbreak and sand fixation function was more pronounced. The HQ index, with values greater than 0.6, was mainly distributed in the upper and southern parts of the basin. The upper region is primarily grassland, with relatively low human activity disturbance, while the southern region has concentrated grassland and forest areas with low human activity intensity, resulting in overall higher HQ. Areas with a HQ index below 0.5 were mainly concentrated in the southeastern part of the basin, where cultivated land is the dominant land use type, and human activity disturbance is relatively high. High FS service value areas were mainly located in the southwest and southeast of the basin, while the northwest had relatively weak food supply capacity, due to limited precipitation, infertile soil, and a dominance of grassland with little cultivated land. The total WP was 1.69×10⁹m3, with a spatial distribution pattern of higher values in the southeast and lower values in the west. Some sub-basins with larger areas exhibited high values. SC in the basin showed significant spatial differences. The northwest, located in the transition zone of the Mu Us Desert, receives relatively little precipitation and has a flat terrain, resulting in overall low SC. The middle and lower reaches, dominated by cultivated land and grassland and with better precipitation conditions, exhibited higher potential and actual erosion and stronger soil conservation capacity. The CT service mean value index showed a decreasing spatial distribution from southeast to northwest, with high-value areas concentrated along the riverbanks and urban areas, while low-value areas were mainly in the northwest and southwest of the basin.
Figure 2.
Spatial pattern of ecosystem services in the Wuding River Basin.
3.2. Trade-Offs and Synergistic Relationships Among Ecosystem Services Across Ecological Functional Zones
Hot point and cold point analysis can provide a reference for the spatial clustering of ecosystem service clusters. The study found significant differences in the spatial distribution characteristics of the seven ecosystem services in the Wuding River Basin (Figure 3). Except for WS service, the spatial distribution of the other services mainly exhibited insignificant regional characteristics. Specifically, the hot point sub-basins for CS service are mainly located in the lower reaches of the basin, while the cold point sub-basins are concentrated in the central and northern parts. The hot point sub-basins for WS service are mainly located in the northern and southwestern parts of the basin, particularly in the Yuyang District, northern Wushen Banner, and southern Jingbian County, while the cold point sub-basins are distributed in the central part of the basin, covering Wushen Banner, Yuyang District, and Jingbian County. The hot point sub-basins for HQ are mainly located in the southern part of Wushen Banner and the eastern part of Jingbian County, while the cold point sub-basins are concentrated in the southern part of Yuyang District, the western part of Hengshan District, and the eastern part of Zizhou County. The hot point sub-basins for FS service are mainly distributed in the southern part of Yuyang District, the eastern part of Hengshan District, and Mizhi County, while the cold point sub-basins are located in the central and southern parts of Wushen Banner. The hot point sub-basins for WP service are more scattered, concentrated in the northern part of Yuyang District near the Wushen Banner border, the southern part of Hengshan District, the southern part of Zizhou County, and the northern part of Qingjian County, while the cold point sub-basins are mainly located in the southern part of Wushen Banner. The hot point sub-basins for SC service are mainly concentrated in the lower reaches of the basin, with no significant cold point sub-basins. The hot point sub-basins for CT service are distributed in the eastern part of Zizhou County, the western part of Suide County, and the northern part of Qingjian County, while the cold point sub-basins are mainly located in the southern part of Jingbian County, and the central and southern parts of Wushen Banner.
Based on the strength of ecosystem services within the ecosystem service clusters, the differences in dominant ecosystem services, and the regional characteristics of each cluster, this study divides the Wuding River Basin into three main ecological function zones: soil and water conservation zone, habitat conservation zone, and ecologically fragile zone (Figure 4). The soil and water conservation zone is located in the lower reaches of the basin, primarily covering sub-basin areas in Zizhou County, Mizhi County, Suide County, and Qingjian County. The habitat conservation zone is situated in the central part of the Wuding River Basin, mainly including Hengshan District, the northern part of Jingbian County, the southern part of Wushen Banner, and the southern part of Yuyang District. The ecologically fragile zone is located in the northern and southwestern parts of the Wuding River Basin, primarily covering sub-basins in Yuyang District, the northern part of Wushen Banner, and Jingbian County.
In the soil and water conservation zone, wind erosion is minimal, and the WS service is almost zero. However, except for the WS service, the standardized values of the other six ecosystem services are relatively high (Figure 5). Among them, CS service is dominant, followed by CT and WP services, with average values exceeding 0.65. SC, FS, and HQ have average values of 0.48, 0.37, and 0.36, respectively. This region provides a relatively high level of food supply, but due to frequent human development activities, it also faces corresponding environmental issues. In the habitat conservation zone, CS service is also dominant, with an average value of 0.78, followed by HQ with an average value of 0.69. CT, WP, FS, WS, and SC services are relatively low, with average values of 0.48, 0.31, 0.18, 0.02, and 0.003, respectively. The western part of this zone is semi-arid and wind-sand prone, with a relatively gentle slope, while the eastern part is semi-humid and characterized by hilly and gully areas with steeper slopes. In the ecologically fragile zone, CS service also shows strong performance, with an average value of 0.62, and HQ has an average value of 0.61. The standardized average values for WS, CT, WP, FS, and SC services are 0.51, 0.44, 0.34, 0.19, and 0.006, respectively. Compared to other function zones, the WS service stands out in this zone because it is located at the southern edge of the Mu Us Desert, an area prone to wind and sand, and is semi-arid, with relatively high wind erosion.
Based on the ecological function zones, the trade-offs and synergies between ecosystem services are shown in Figure 6. In the soil and water conservation zone, the strongest synergies are observed between CS and HQ services, and between CS and SC services, with a correlation coefficient of 0.37. A relatively smaller synergy exists between CT and WP services, with a correlation coefficient of 0.10. On the other hand, the strongest trade-off is between SC and FS, with a correlation coefficient of -0.65, while the smallest trade-off is between WP and CS services, with a correlation coefficient of -0.11. In the habitat conservation zone, the strongest synergy is between WP and SC, with a correlation coefficient of 0.49, while the weakest synergy is between WS and CS services, with a correlation coefficient of 0.03. In the trade-offs, HQ and FS show the strongest negative correlation, with a correlation coefficient of -0.54. This reflects the inverse relationship between cultivated land, human activity impacts on food supply, and habitat quality. The trade-off between CS and WP is the smallest, with a correlation coefficient of -0.01. The habitat conservation zone, located between the soil and water conservation zone and the ecologically fragile zone, has lower values for SC and WS services, resulting in lower trade-offs between the two. In the ecologically fragile zone, the strongest synergy is observed between CS and HQ, with a correlation coefficient of 0.69, while the weakest synergy occurs between CT and WS services, with a correlation coefficient of only 0.05. Regarding trade-offs, HQ and FS show the smallest trade-off, with a correlation coefficient of -0.03, while the largest trade-off is between WP and CS services, with a correlation coefficient of -0.67. The strong trade-off between CS and WP services can be explained by the fact that forest land has a much higher carbon sequestration capacity than other land types, while the reverse is true for WP services, as forest land has strong water retention capacity, whereas unused land has the poorest ability to intercept and absorb precipitation.
3.3. Multi-Objective Optimization of Land Use Based on Ecological Functional Zoning
Based on the multi-objective genetic algorithm, the Pareto optimization curves for different services in each ecological function zone are shown in Figure 7. In the soil and water conservation zone, as FS service increased from 1.24483×10⁶ t to 1.24495×10⁶ t, the SC service, which are in trade-off, decreased from 3.75559×10⁷ t to 3.75548×10⁷ t. Compared to 2020, FS service increased by an average of 0.63×10⁴ t, while SC service increased by an average of 1.94×10⁵ t, achieving the maximum possible increase in FS service while maintaining the existing soil conservation capacity in the Wuding River Basin. In the habitat conservation zone, as HQ increased from 0.57019 to 0.57031, FS service decreased from 1.29357×10⁶ t to 1.29210×10⁶ t. Compared to 2020, HQ increased from 0.56985 in 2020 to an average of 0.57025, while FS service increased by an average of 0.11×10⁴ t, indicating that the multi-objective genetic algorithm optimization could maximize food supply while maintaining the current habitat quality index. In the ecologically fragile zone, as WP service increased from 2.37773×10⁸ m3 to 2.37891×10⁸ m3, CS services decreased from 1.52775×10⁸ t to 1.52746×10⁸ t. Compared to 2020, WP services increased by an average of 0.26×10⁴ m3, while CS services increased by 0.58×10⁵ t compared to 2020.
Under the three selected scenarios from the predicted 80 scenarios, the trade-offs and synergies between two services in each ecological zone showed good optimization effects. In Scenario I, when the weights of FS and SC services in the soil and water conservation zone were 0.2 and 0.8, respectively, the FS service was 1.24485×10⁶ t, and the SC service was 3.75557×10⁷ t. In the habitat conservation zone, when the weights of HQ and FS services were 0.2 and 0.8, respectively, the HQ index was 0.57021, and the FS service reached 1.29329×10⁶ t. In the ecologically fragile zone, when the weights of WP and CS services were 0.2 and 0.8, respectively, the WP service was 2.37797×10⁸ t, and the CS service was 1.52770×10⁸ t. In Scenario II, when the weights of the objective functions were both 0.5, the FS service in the soil and water conservation zone was 1.24489×10⁶ t, and the SC service was 3.75554×10⁷ t. In the habitat conservation zone, HQ increased to 0.57025, and the FS service decreased to 1.29281×10⁶ t. In the ecologically fragile zone, the WP service reached 2.37832×10⁸ t, and the CS service decreased to 1.52761×10⁸ t. In Scenario III, when the weights of WP and SC services in the soil and water conservation zone were 0.8 and 0.2, respectively, the FS service was 1.24493×10⁶ t, and the SC service decreased to 3.75551×10⁷ t. In the habitat conservation zone, when the weights of HQ and FS services were 0.8 and 0.2, respectively, the HQ was 0.57028, and the FS was 1.29239×10⁶ t. In the ecologically fragile zone, when the weights of WP and CS services were 0.8 and 0.2, respectively, the WP service was 2.37867×10⁸ t, and the CS service was 1.52752×10⁸ t.
Analysis of predicted land use changes under different scenarios reveals the following (Figure 8). From Scenario I to Scenario III, in the soil and water conservation zone, as the weight of the FS service objective increases and the weight of the SC service objective decreases, the area of cultivated land increased by 11.0 hm2, the area of forest land changed minimally, increasing by only 4.9 hm2, the area of grassland decreased by 162.1 hm2, the area of waterbody increased by 148.4 hm2, artificial land decreased by 161.3 hm2, and unused land increased by 159.0 hm2. The increase in cultivated land and waterbody facilitated the improvement in grain and aquatic production, thereby contributing to the increase in FS service. As the weight of the SC service increased, the expansion of grassland and the full utilization of unused land helped to enhance SC service. For the habitat conservation zone, from Scenario I to Scenario III, as the weight of the HQ objective increased and the weight of the FS service objective decreased, the area of cultivated land decreased by 232.4 hm2, grassland increased by 242.7 hm2, and other land use types changed minimally. Among these, forest land and waterbody increased, while artificial land and unused land decreased. There is still a large area of unused land that remains underutilized in the habitat conservation zone, mainly because cultivated land and grassland have a significant impact on the trade-off between HQ and FS services, while the influence of other land use types is relatively small. In the ecologically fragile zone, as the weight of the WP service objective increased and the weight of the CS service objective decreased, the area of unused land increased by 500.4 hm2, while areas of other land use types generally decreased. The rational utilization of unused land is key to land use optimization in this zone. This is mainly because unused land has poor ability to intercept and absorb precipitation and weak carbon sequestration capacity. Further development of unused land utilization will help improve ecosystem services in this region.
4. Discussion
4.1. Ecological Function Zoning Based on Ecosystem Service Cluster Identification
The SOM was used to identify ecosystem service clusters in the Wuding River Basin, and by comparing the service cluster structures laterally, the basin was divided into three ecological function zones. Compared with traditional zoning methods that mainly rely on regional characteristics and natural geographic factors, this method not only considers geographical and natural conditions but also comprehensively reflects the ecosystem service supply capacity and spatial composition characteristics within the basin [33,34]. As a result, the delineation of the ecological function zones is more closely aligned with the actual functional layout of ecosystem services within the basin.
The ecological function zones under the service clusters have distinct characteristics. In the soil and water conservation zone, SC and WP services are particularly prominent, mainly due to the relatively abundant precipitation and good water resource conditions in the area. However, as this region is predominantly agricultural, with cultivated land accounting for 67.1% of the area and located in the Loess Plateau hilly and gully region, it has a steep slope, numerous gullies, and loose loess structure. The summer rainfall is concentrated, leading to severe soil erosion [35]. Therefore, strengthening soil and water conservation remains a key task in this area. Additionally, the main river of the Wuding River flows through this region, providing abundant water resources. This ecological function zone also includes the Wuding River Wetland Provincial Nature Reserve in Shaanxi. The presence of wetlands makes CS and HQ services particularly prominent in this zone. The habitat conservation zone is located in the central part of the basin, and the status of ecosystem services within it is of great significance for the stability of the entire Wuding River Basin ecosystem. As an important support for ecological functions in the basin, the ecosystem services in this zone directly affect the ecological quality of the Wuding River Basin and play a fundamental role in biodiversity and ecological restoration [36]. In the ecologically fragile zone, although significant progress has been made in the management of the Mu Us Desert in recent years, with a substantial decrease in wind erosion, the core urban area of Yulin City is located within this functional zone. The area is industrialized, densely developed, with frequent human activities and a high proportion of unused land, while also facing water shortages. As a result, the ecological environment remains fragile. Therefore, adjusting the land use distribution, maintaining the current sand control achievements, and continuously expanding windbreak and sand fixation efforts, while simultaneously enhancing other ecosystem services, will remain the key tasks for the future of the ecologically fragile zone.
4.2. Predictive Scenarios and Optimization Recommendations for Multi-Objective Land Use Optimization
For the two most significant trade-off services in each ecological function zone, this study constructs a multi-objective optimization function and sets land use constraints based on the five-year planning goals and historical statistical data. Multi-objective genetic algorithms are then used to explore land use optimization scenarios. In the optimization scenarios for the habitat conservation zone and the ecologically fragile zone, there remains a large area of unused land that has not been effectively utilized. The constraints on the most dominant land types, such as cultivated land and grassland, are restrictive and cannot expand without limitation. This is partly due to the area constraints on cultivated land and grassland, and partly because, in the habitat conservation zone, the greatest trade-off is between HQ and FS. In this ecological function zone, the trade-off relationship between cultivated land and grassland for HQ and FS services has a significant impact, and the change in area is more pronounced compared to other land use types. As a result, unused land has not been more extensively utilized [37,38].
Based on the research findings, the following land use optimization recommendations are proposed for each ecological function zone. In the soil and water conservation zone, the configuration of cultivated land, grassland, water bodies, and unused land should be coordinated. When the area of cultivated land and water bodies increases, improvements in grain and aquatic production can boost food supply. Meanwhile, the expansion of grassland and full utilization of unused land can enhance SC services. In the habitat conservation zone, due to the unfavorable natural conditions such as precipitation and soil quality for large-scale afforestation, it is necessary to focus on adjusting the proportion of cultivated land and grassland. This will ensure food supply while maintaining high habitat quality, and strengthen the systematic management and ecological utilization of existing unused land. In the ecologically fragile zone, unused land management should be prioritized. This is not only directly related to alleviating the trade-off between WP and CS services but also crucial for consolidating windbreak and sand fixation achievements and enhancing the overall quality of regional ecosystem services. Therefore, it is recommended to incorporate comprehensive unused land management into the regional ecological management policy system, gradually promoting its ecological restoration and rational utilization.
4.3. Limitations and Future Perspectives
This study has several limitations that warrant further exploration in future research. First, in quantifying the various services, multiple models, including SWAT, SolVES, InVEST, RWEQ model, and statistical models, was employed. While these models provided strong support for service quantification, there remains some uncertainty during the simulation process. Although the study ensured global accuracy through comparisons with previous studies and some measured data, this validation was limited to the overall model accuracy and did not delve into the details of the model. Furthermore, in setting up the land use optimization scenarios, only three out of 80 predicted scenarios were subjectively selected for simulation and prediction. This selection did not fully showcase the optimal outcomes across all possible scenarios. Future research could attempt to use more objective modeling methods to select predicted scenarios, or conduct a comprehensive analysis of all predicted scenarios to obtain more precise and comprehensive optimization results. This would help provide a more comprehensive basis for land use optimization decisions.
5. Conclusions
Based on the organic integration of three key components: the identification of ecosystem service clusters, the delineation of ecological function zones, and the differentiated land use optimization within these zones, this study conducted ecological function zoning for the Wuding River Basin and constructed a multi-objective optimization model targeting the core trade-off services of each zone, proposing differentiated land use optimization solutions. The study found that the trade-off and synergy relationships between ecosystem services differ significantly across different zones. In the soil and water conservation zone, the strongest trade-off is observed between SC and FS. In the habitat conservation zone, the most prominent conflict is between HQ and FS, while in the ecologically fragile zone, the intense trade-off is primarily between CS and WP. After optimization, the FS and SC in the soil and water conservation zone, as well as the WP and CS in the ecologically fragile zone, were synergistically enhanced. The optimization process revealed that in the soil and water conservation zone, there is a need to coordinate cultivated land and forest-grassland areas; in the habitat conservation zone, moderate increases in grassland should be made to balance HQ and FS; and in the ecologically fragile zone, the key is to regulate unused land reasonably to alleviate the conflict between WP and CS services. The study confirms that the framework based on service cluster identification, function zoning, and differentiated optimization can effectively coordinate ecosystem service trade-offs at the watershed scale through land use structure adjustments, providing actionable planning guidance for the sustainable development of ecologically fragile areas.
Author Contributions
Conceptualization, Zixiang Zhou and Jing Li; methodology, Zixiang Zhou and Jing Li; software, Weijuan Zhao; validation, Jiao Ding; formal analysis, Jiao Ding; investigation, Zixiang Zhou and Jing Li; resources, Zixiang Zhou and Jing Li; data curation, Jing Li; writing—original draft preparation, Weijuan Zhao; writing—review and editing, Jiao Ding; visualization, Weijuan Zhao and Jiao Ding; supervision, Zixiang Zhou and Jing Li.; project administration, Zixiang Zhou and Jing Li; funding acquisition, Xiaofeng Wang. All authors have read and agreed to the published version of the manuscript.
Funding
This research was funded by the open fund of the Shaanxi Key Laboratory of Land Consolidation (Chang’an University) (grant number 300102355502) and the National Natural Science Foundation of China (grant number 42371297, 41771576).
Data Availability Statement
Data will be made available on request.
Conflicts of Interest
The authors declare that they have no known competing financial interests or personal relationships that could have appeared to influence the work reported in this paper.
Abbreviations
The following abbreviations are used in this manuscript:
| SOM | Self-Organizing Maps |
| FLUS model | the Future Land-Use Simulation model |
| WP | Water Production |
| SC | Soil Conservation |
| CT | Cultural services |
| FS | Food Supply |
| CS | Carbon Sequestration |
| HQ | Habitat Quality |
| WS | Windbreak and Sand fixation |
References
- Hao, Y.Q.; Lü, Y.H.; Dang, H.; Lü, D.; Du, C.J.; Wang, Y.; Wang, L.N.; Wang, X.F.; Li, X.; Fu, B.J. Optimizing zonal management framework suitable for mountain ecosystems by linking landscape, ecosystem service capacities and bundles nested. Journal of Environmental Management 2025, 389, 125998. [Google Scholar] [CrossRef]
- Langemeyer, J.; Benra, F.; Nahuelhual, L.; Zoderer, B.M. Ecosystem Services Justice: The Emergence of a Critical Research Field. Ecosystem Services 2024, 69, 101655. [Google Scholar] [CrossRef]
- Jiang, Z.M.; Li, Y.; Wu, H.; Mohamed Shariff, A.R.B.; Zhou, H.; Fan, K.X. Unveiling the impacts of climate change and human activities on land-use evolution in ecologically fragile urbanizing areas: A case study of China’s Central Plains urban agglomeration. Ecological Indicators 2024, 169, 112936. [Google Scholar] [CrossRef]
- Wang, S.; Song, S.; Zhang, H.Y.; Yu, L.; Jiao, C.T.; Li, C.J.; Wu, X.T.; Zhao, W.W.; Best, J.; Roberts, P.; Fu, B.J. Anthropogenic impacts on the Yellow River Basin. Nature Reviews Earth Environment 2025, 6, 656–671. [Google Scholar] [CrossRef]
- Zhao, W.J.; Li, J.; Li, B.Y.; Wang, Y.D.; Zhou, Z.X.; Su, Y.; Ren, J.X. Integrated watershed management under dual ecological compensation for water quantity and water quality. Applied Geography 2026, 186, 103829. [Google Scholar] [CrossRef]
- Mamitimin, Y.; Nuerla, A.; Abudushalamu, Z.; Huang, M. From Land Use Change to Ecosystem Service Sustainability: Multi-Scenario Projections for Urban Agglomerations in Arid Northwest China. Urban Science 2025, 9, 433. [Google Scholar] [CrossRef]
- Li, J.L.; Hu, D.W.; Wang, Y.Z.; Chu, J.L.; Yin, H.W.; Ma, M. Study of identification and simulation of ecological zoning through integration of landscape ecological risk and ecosystem service value. Sustainable Cities and Society 2024, 107, 105442. [Google Scholar] [CrossRef]
- Liang, S.H.; Yang, F.; Zhang, J.Y.; Xiong, S.W.; Xu, Z.N. Assessment and Management Zoning of Ecosystem Service Trade-Off/Synergy Based on the Social–Ecological Balance: A Case of the Chang-Zhu-Tan Metropolitan Area. Land 2024, 13, 127. [Google Scholar] [CrossRef]
- McMahon, G.; Wiken, E.B.; Gauthier, D.A. Toward a Scientifically Rigorous Basis for Developing Mapped Ecological Regions. Environmental Management 2004, 34(S1), S111–S124. [Google Scholar] [CrossRef]
- Ketema, H.; Wei, W.; Legesse, A.; Wolde, Z.; Endalamaw, T. Quantifying ecosystem service supply-demand relationship and its link with smallholder farmers’ well-being in contrasting agro-ecological zones of the East African Rift. Global Ecology and Conservation 2021, 31, e01829. [Google Scholar] [CrossRef]
- Xia, Z.Y.; Wang, Y.; Lu, Q.L.; Shen, Z.; Liu, K.; Wei, X.; Yuan, C.C.; Gao, Y.; Liu, L.M. Understanding residents’ perspectives on cultural ecosystem service supply, demand and subjective well-being in rapidly urbanizing landscapes: A case study of peri-urban Shanghai. Landscape Ecology 2024, 39, 22. [Google Scholar] [CrossRef]
- Guan, D.J.; Cao, J.M.; Fan, X.F.; Zhou, L.L.; He, X.J.; Liu, X.Y.; Zhu, X.S.; Zhu, K.W. Spatial–Temporal Heterogeneity of Ecosystem Service Supply–Demand at the Grid and Watershed Scales. Water Resources Management 2026, 40, 3. [Google Scholar] [CrossRef]
- You, C.; Qu, H.J.; Feng, C.-C.; Guo, L. Evaluating the match between natural ecosystem service supply and cultural ecosystem service demand: Perspectives on spatiotemporal heterogeneity. Environmental Impact Assessment Review 2024, 108, 107592. [Google Scholar] [CrossRef]
- Agboka, K.M.; Abdel-Rahman, E.M.; Salifu, D.; Kanji, B.; Ndjomatchoua, F.T.; Guimapi, R.A.Y.; Ekesi, S.; Tobias, L. Towards combining self-organizing maps (SOM) and convolutional neural network (CNN) for improving model accuracy: Application to malaria vectors phenotypic resistance. MethodsX 2025, 14, 103198. [Google Scholar] [CrossRef]
- Zhao, H.Z.; He, J.H.; Liu, D.F.; Han, Y.; Zhou, Z.K.; Niu, J.F. Incorporating ecological connectivity into ecological functional zoning: A case study in the middle reaches of Yangtze River urban agglomeration. Ecological Informatics 2023, 75, 102098. [Google Scholar] [CrossRef]
- Aryal, K.; Maraseni, T.; Apan, A. Spatial dynamics of biophysical trade-offs and synergies among ecosystem services in the Himalayas. Ecosystem Services 2023, 59, 101503. [Google Scholar] [CrossRef]
- Dabalà, A.; Dahdouh-Guebas, F.; Dunn, D.C.; Everett, J.D.; Lovelock, C.E.; Hanson, J.O.; Buenafe, K.C.V.; Neubert, S.; Richardson, A.J. Priority areas to protect mangroves and maximise ecosystem services. Nature Communications 2023, 14, 5863. [Google Scholar] [CrossRef]
- Gao, L.N.; Tao, F.; Liu, R.R.; Wang, Z.L.; Leng, H.J.; Zhou, T. Multi-scenario simulation and ecological risk analysis of land use based on the PLUS model: A case study of Nanjing. Sustainable Cities and Society 2022, 85, 104055. [Google Scholar] [CrossRef]
- Hasan, S.S.; Zhen, L.; Miah, M.G.; Ahamed, T.; Samie, A. Impact of land use change on ecosystem services: A review. Environmental Development 2020, 34, 100527. [Google Scholar] [CrossRef]
- Güneralp, B.; Ahasan, R. Urban land-change futures: Current understanding, challenges, and implications. Npj Urban Sustainability 2025, 6, 1–11. [Google Scholar] [CrossRef]
- Nie, Y.; Zhang, X.Y.; Yang, Y.M.; Liu, Z.F.; He, C.Y.; Chen, X.; Lu, T. Assessing the impacts of historical and future land-use/cover change on habitat quality in the urbanizing Lhasa River Basin on the Tibetan Plateau. Ecological Indicators 2023, 148, 110147. [Google Scholar] [CrossRef]
- Wu, H.; Yang, Y.; Li, W. Spatial optimization of land use and carbon storage prediction in urban agglomerations under climate change: Different scenarios and multiscale perspectives of CMIP6. Sustainable Cities and Society 2024, 116, 105920. [Google Scholar] [CrossRef]
- Zhao, Q.J.; Shao, J.F. Evaluating the impact of simulated land use changes under multiple scenarios on ecosystem services in Ji’an, China. Ecological Indicators 2023, 156, 111040. [Google Scholar] [CrossRef]
- Liu, J.; Jin, X.B.; Xu, W.Y.; Fan, Y.T.; Ren, J.; Zhang, X.L.; Zhou, Y.K. Spatial coupling differentiation and development zoning trade-off of land space utilization efficiency in eastern China. Land Use Policy 2019, 85, 310–327. [Google Scholar] [CrossRef]
- Zhu, J.L.; Liu, W.X.; Zheng, S.X.; Sun, Y.Y. Unraveling drivers of land use efficiency in rapidly urbanizing areas: A hybrid SBM-DDF and explainable machine learning framework. Habitat International 2025, 164, 103518. [Google Scholar] [CrossRef]
- Xu, Z.H.; Peng, J. Recognizing ecosystem service’s contribution to SDGs: Ecological foundation of sustainable development. Geography and Sustainability 2024, 5, 511–525. [Google Scholar] [CrossRef]
- Zhang, Y.; Li, J.; Liu, X.F.; Bai, J.Z.; Wang, G.Y. Do carbon sequestration and food security in urban and rural landscapes differ in patterns, relationships, and responses? Applied Geography 2023, 160, 103100. [Google Scholar] [CrossRef]
- Kohonen, T. The self-organizing map. Neurocomputing 1998, 21, 1–6. [Google Scholar] [CrossRef]
- Wang, J.N.; Wu, W.J.; Yang, M.; Gao, Y.M.; Shao, J.C.; Yang, W.S.; Ma, G.X.; Yu, F.; Yao, N.; Jiang, H.Q. Exploring the complex trade-offs and synergies of global ecosystem services. Environmental Science and Ecotechnology 2024, 21, 100391. [Google Scholar] [CrossRef]
- Luan, C.X.; Liu, R.Z.; Zhang, Q.Y.; Sun, J.; Liu, J. Multi-objective land use optimization based on integrated NSGA–II–PLUS model: Comprehensive consideration of economic development and ecosystem services value enhancement. Journal of Cleaner Production 2024, 434, 140306. [Google Scholar] [CrossRef]
- Akbari, R.; Pourmanafi, S.; Soffianian, A.R.; Galalizadeh, S.; Khodakarami, L. Enhancing ecotourism site suitability assessment using multi-criteria evaluation and NSGA-II. Environment, Development and Sustainability 2024, 26, 28663–28698. [Google Scholar] [CrossRef]
- Chen, Z.Z.; Huang, M.; Zhu, D.Y.; Altan, O. Integrating Remote Sensing and a Markov-FLUS Model to Simulate Future Land Use Changes in Hokkaido, Japan. Remote Sensing 2021, 13, 2621. [Google Scholar] [CrossRef]
- Han, T.T.; Luo, J.; Gan, Y.L.; Sun, Y.R.; Tian, L.L. Synergistic Zoning and Management Strategies for Ecosystem Service Value and Ecological Risk at the County Level: A Case Study of Songzi City, Hubei Province, China. Land 2025, 14, 1021. [Google Scholar] [CrossRef]
- Meng, X.X.; Ling, Z.X.; Chen, Y.B.; Zheng, X.H.; Shi, X.H.; Kuang, J.Y.; Chen, W.T.; Yang, Y.F.; Wu, Z.F.; Zheng, Z.H. Exploring the differential responses of ecosystem services to urbanization: A perspective from the metropolitan area as a whole and internal service bundles. Ecological Indicators 2025, 176, 113685. [Google Scholar] [CrossRef]
- Wang, Y.D.; Li, J.; Wang, Y.D.; Bai, J.Z. Regional social-ecological system coupling process from a water flow perspective. Science of the Total Environment 2022, 853, 158646. [Google Scholar] [CrossRef] [PubMed]
- Zhao, L.Y.; Brika, S.K.; Lui, L. Designing Ecological Networks to Foster Regional Economic Sustainability: Source identification in the Longdong Loess Plateau using self-organizing map and complex network theory. Ecological Modelling 2025, 509, 111211. [Google Scholar] [CrossRef]
- Liu, Y.; Wan, C.Y.; Xu, G.L.; Chen, L.T.; Yang, C. Exploring the relationship and influencing factors of cultivated land multifunction in China from the perspective of trade-off/synergy. Ecological Indicators 2023, 149, 110171. [Google Scholar] [CrossRef]
- Zeng, S.Y.; Liu, J.N.; Ma, J.; Yang, Y.J.; Liu, G.J.; Chen, F. Optimizing cropland expansion for minimizing ecosystem service loss in China. Geography and Sustainability 2025, 6, 100299. [Google Scholar] [CrossRef]
Figure 1.
Location and land use of the Wuding River Basin (2020).
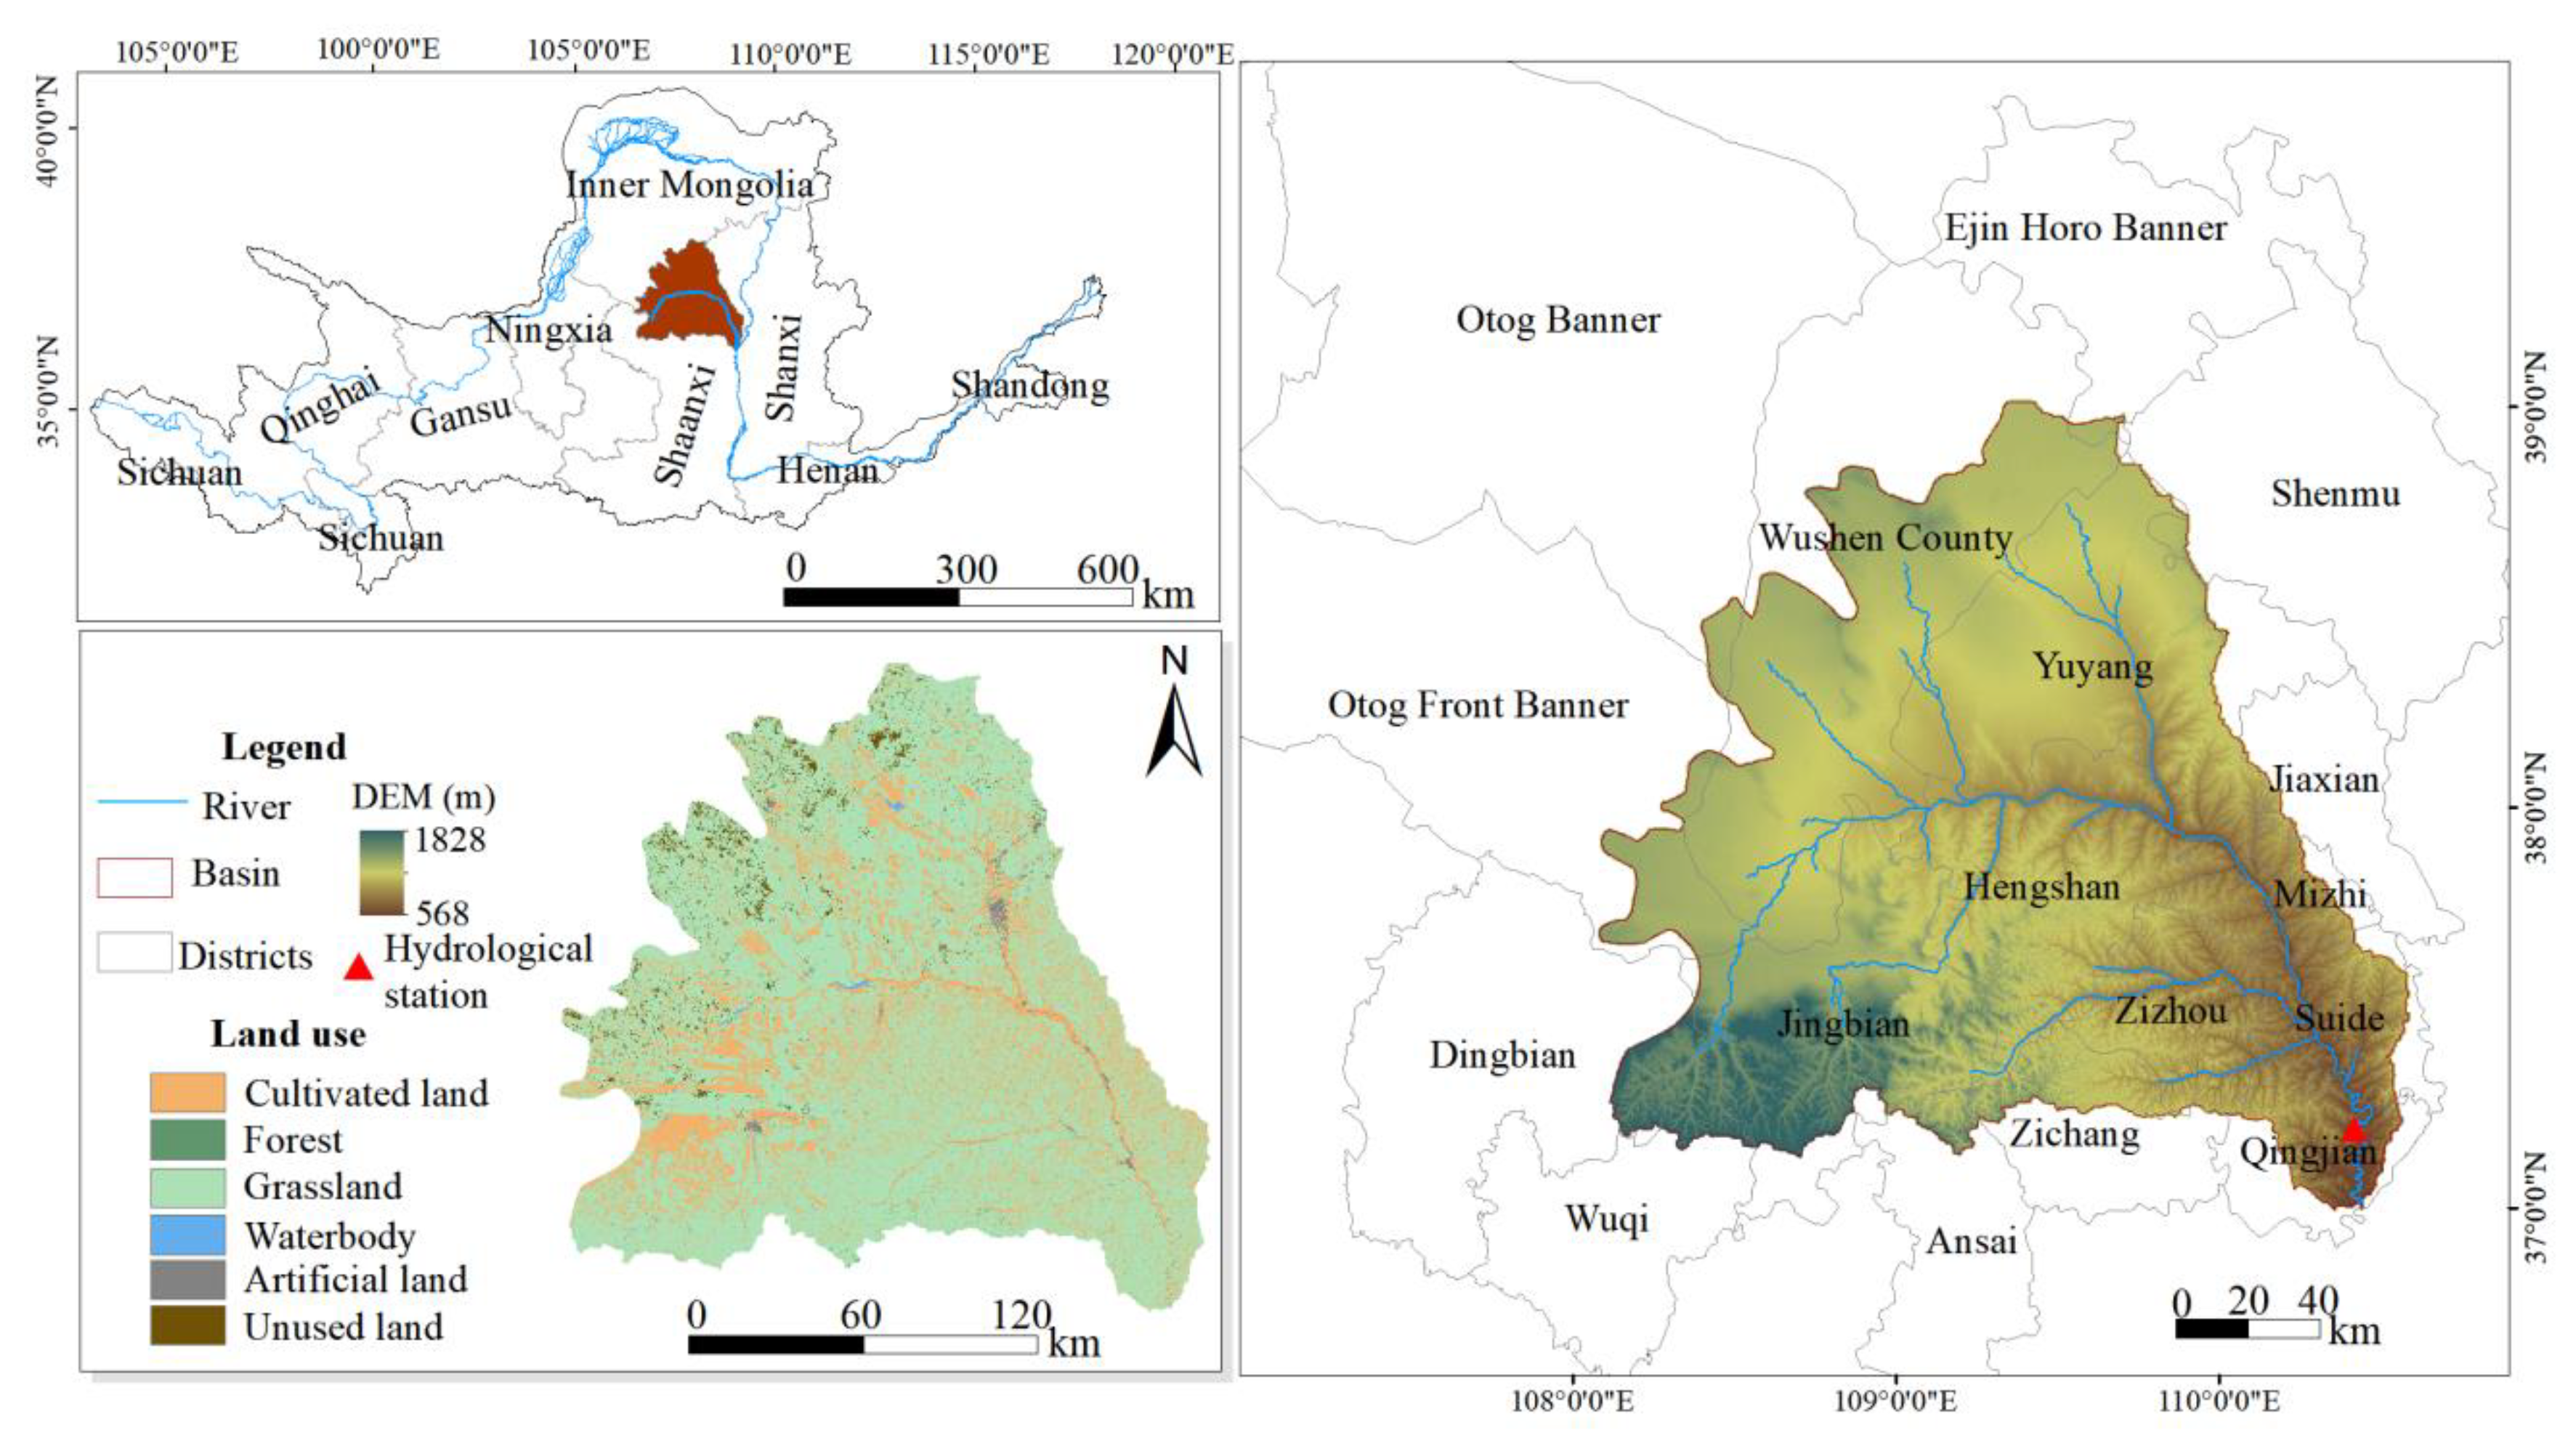
Figure 3.
Spatial distribution of hot point and cold point of ecosystem services in the Wuding River Basin.
Figure 3.
Spatial distribution of hot point and cold point of ecosystem services in the Wuding River Basin.
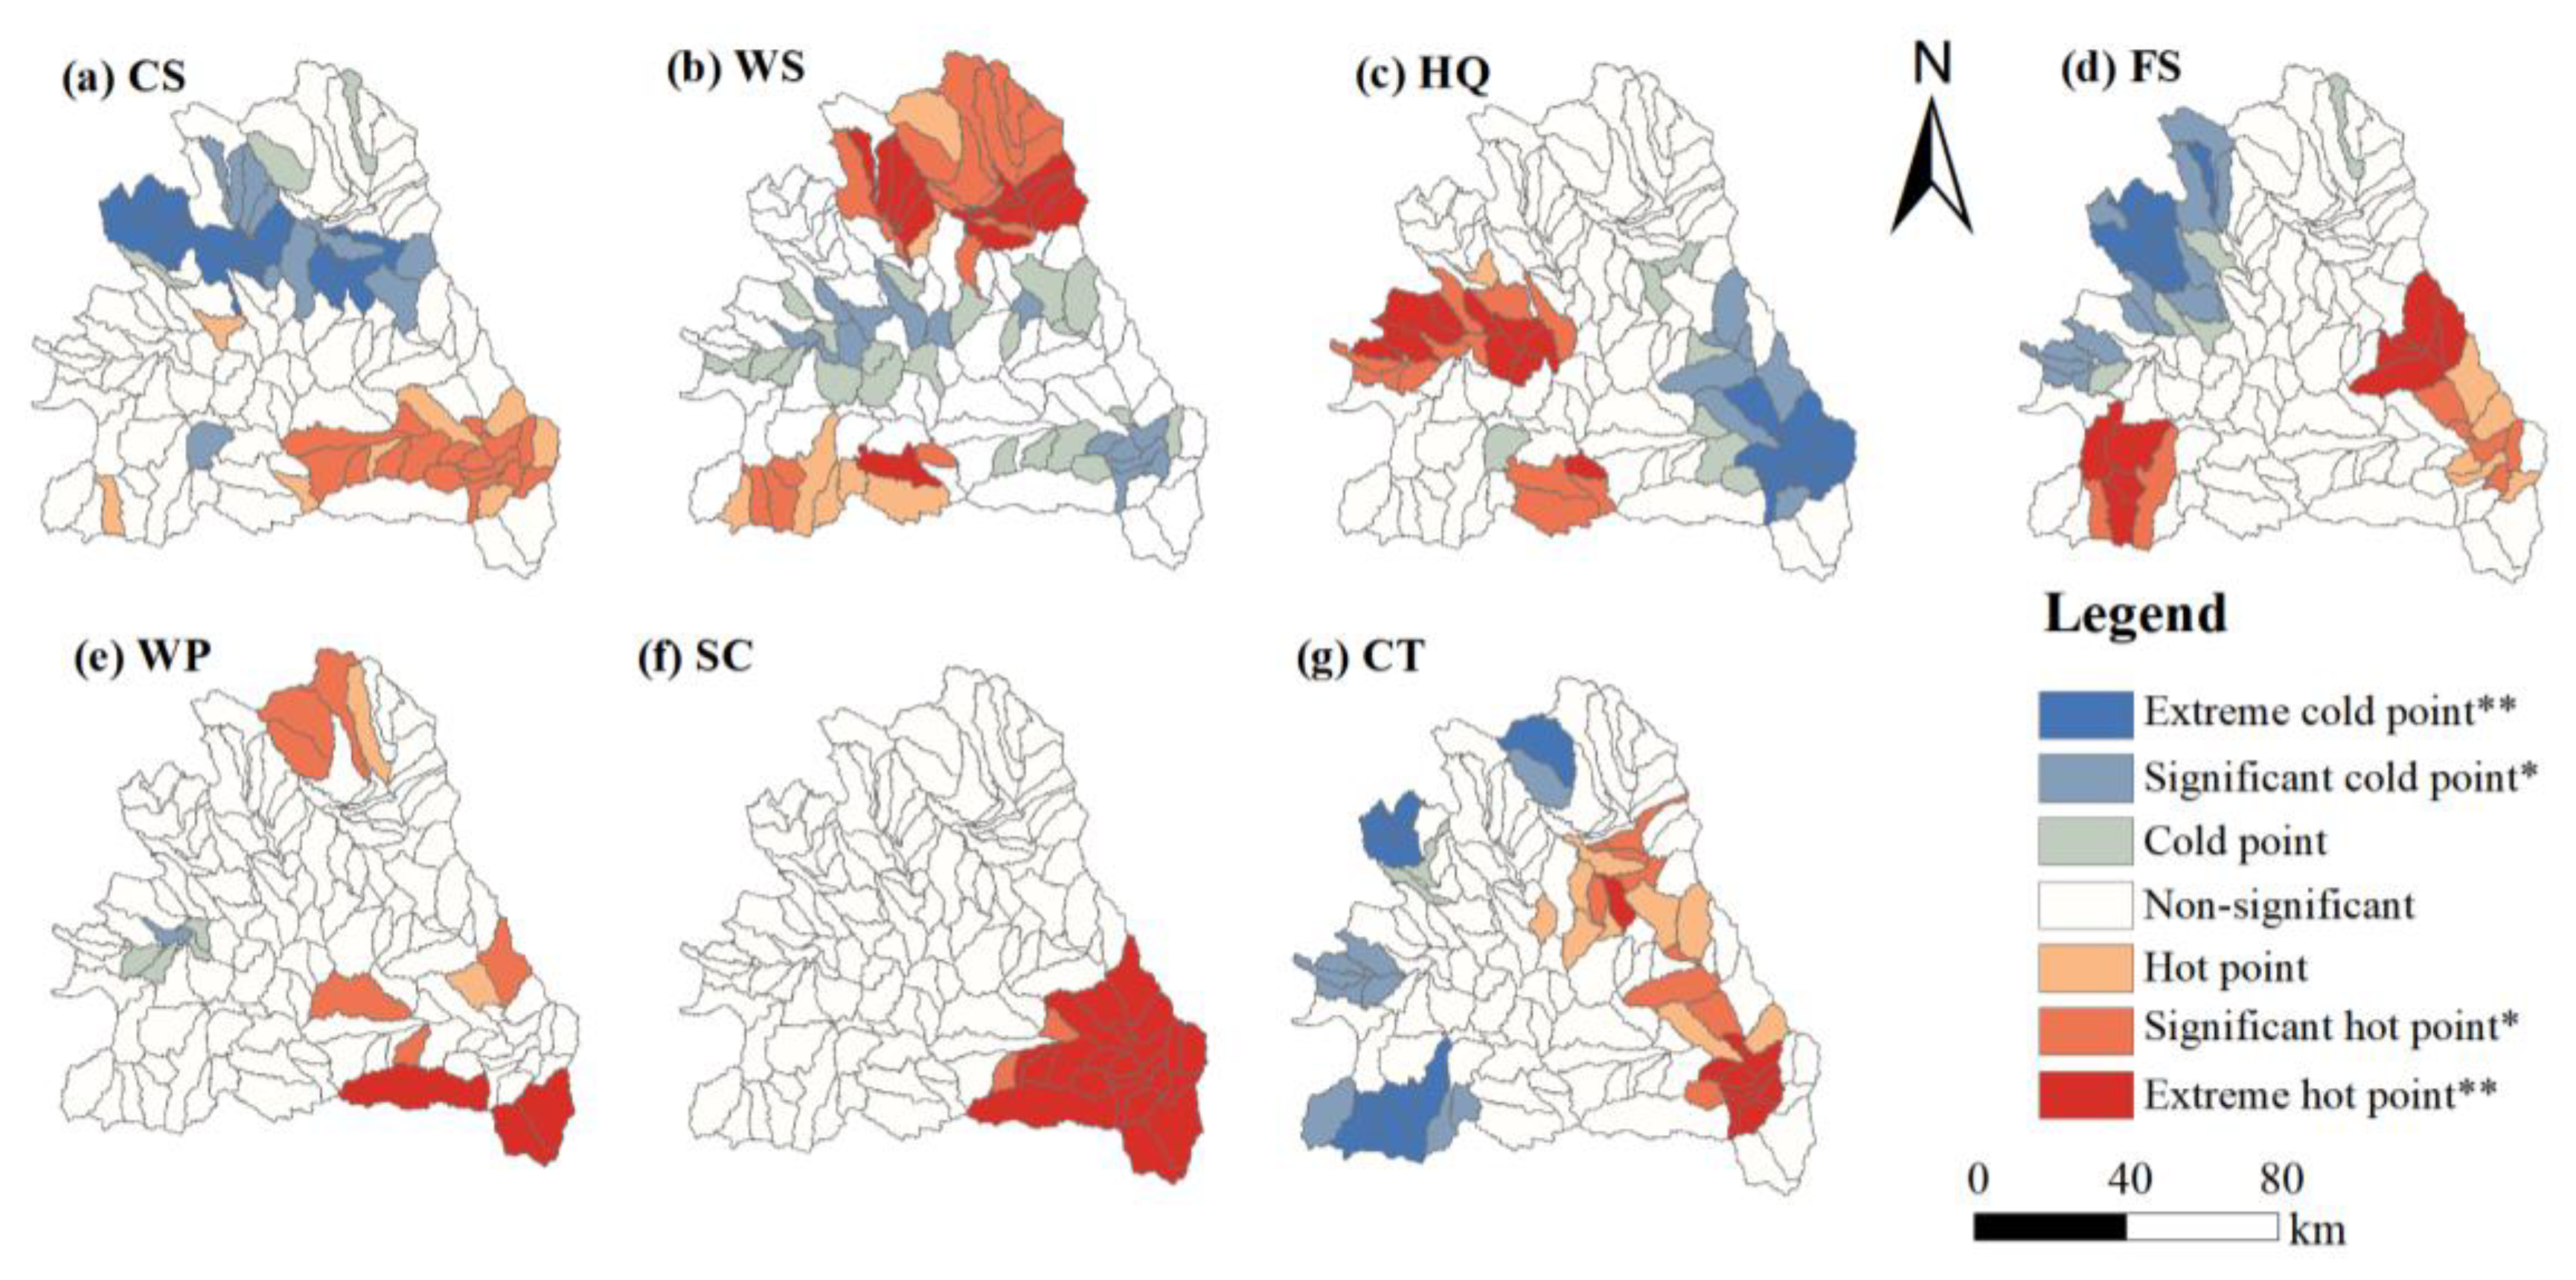
Figure 4.
Spatial distribution of ecological function zoning in the Wuding River Basin.
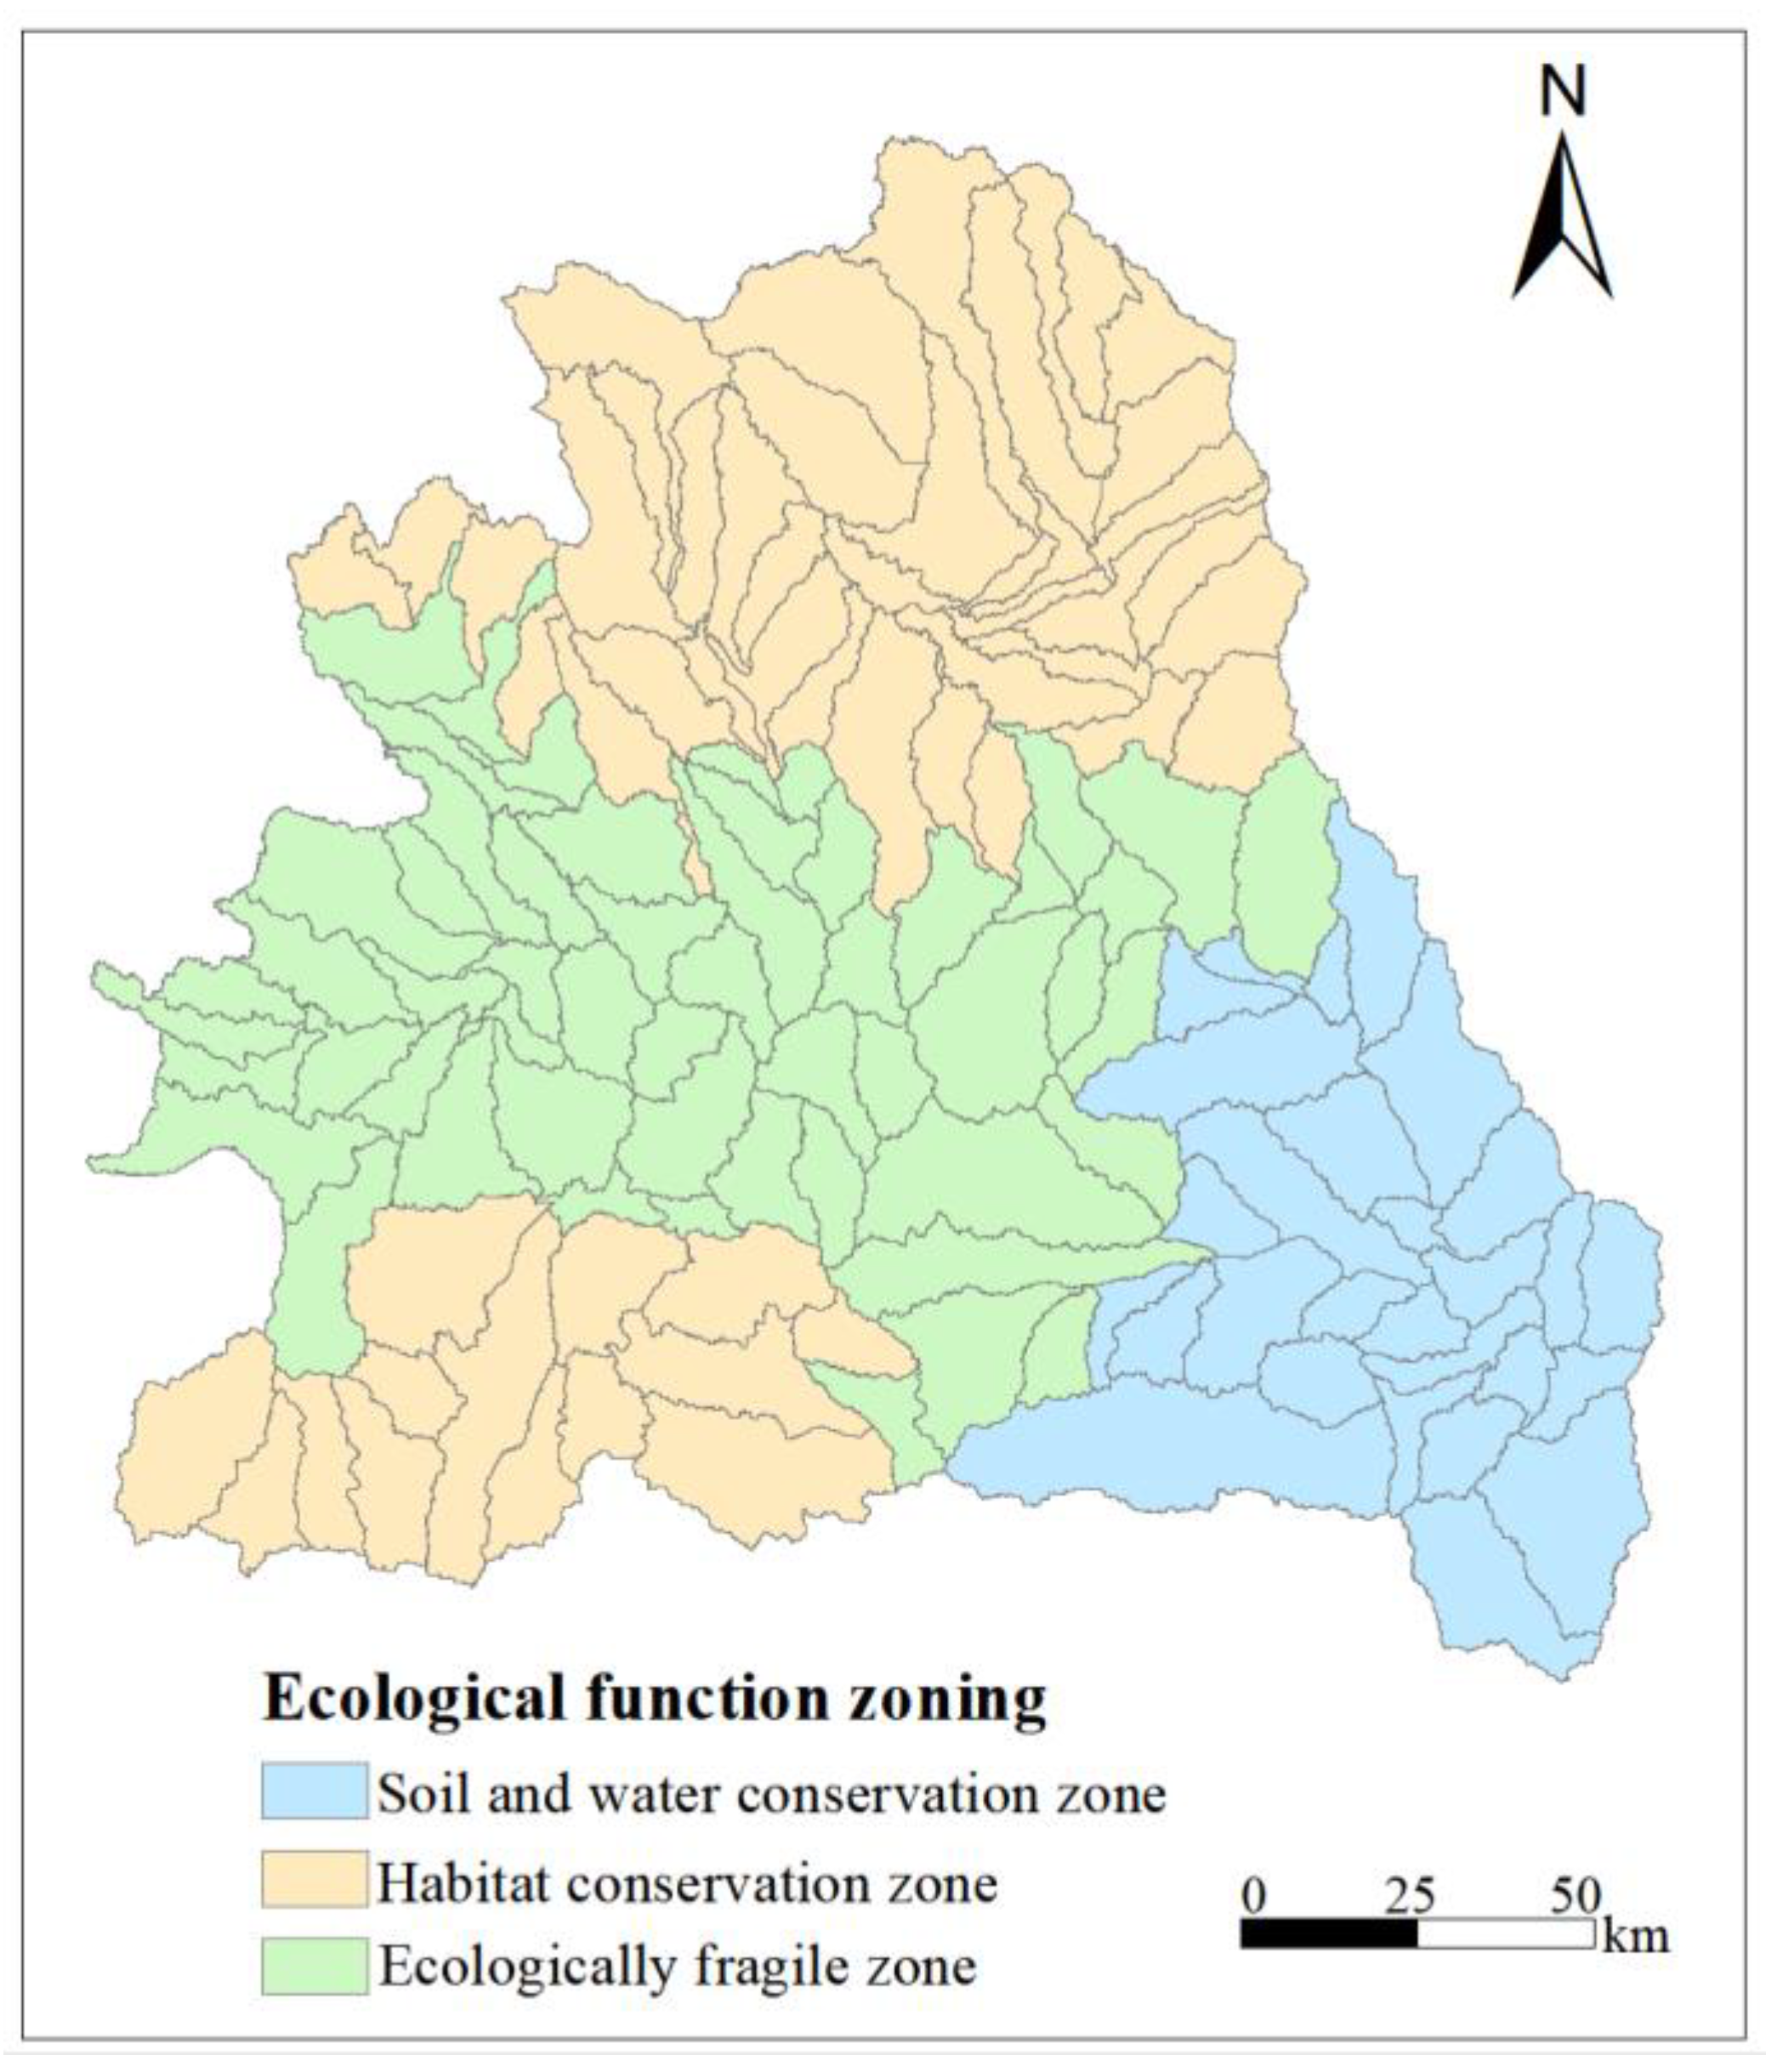
Figure 5.
Cluster structure of ecosystem services.
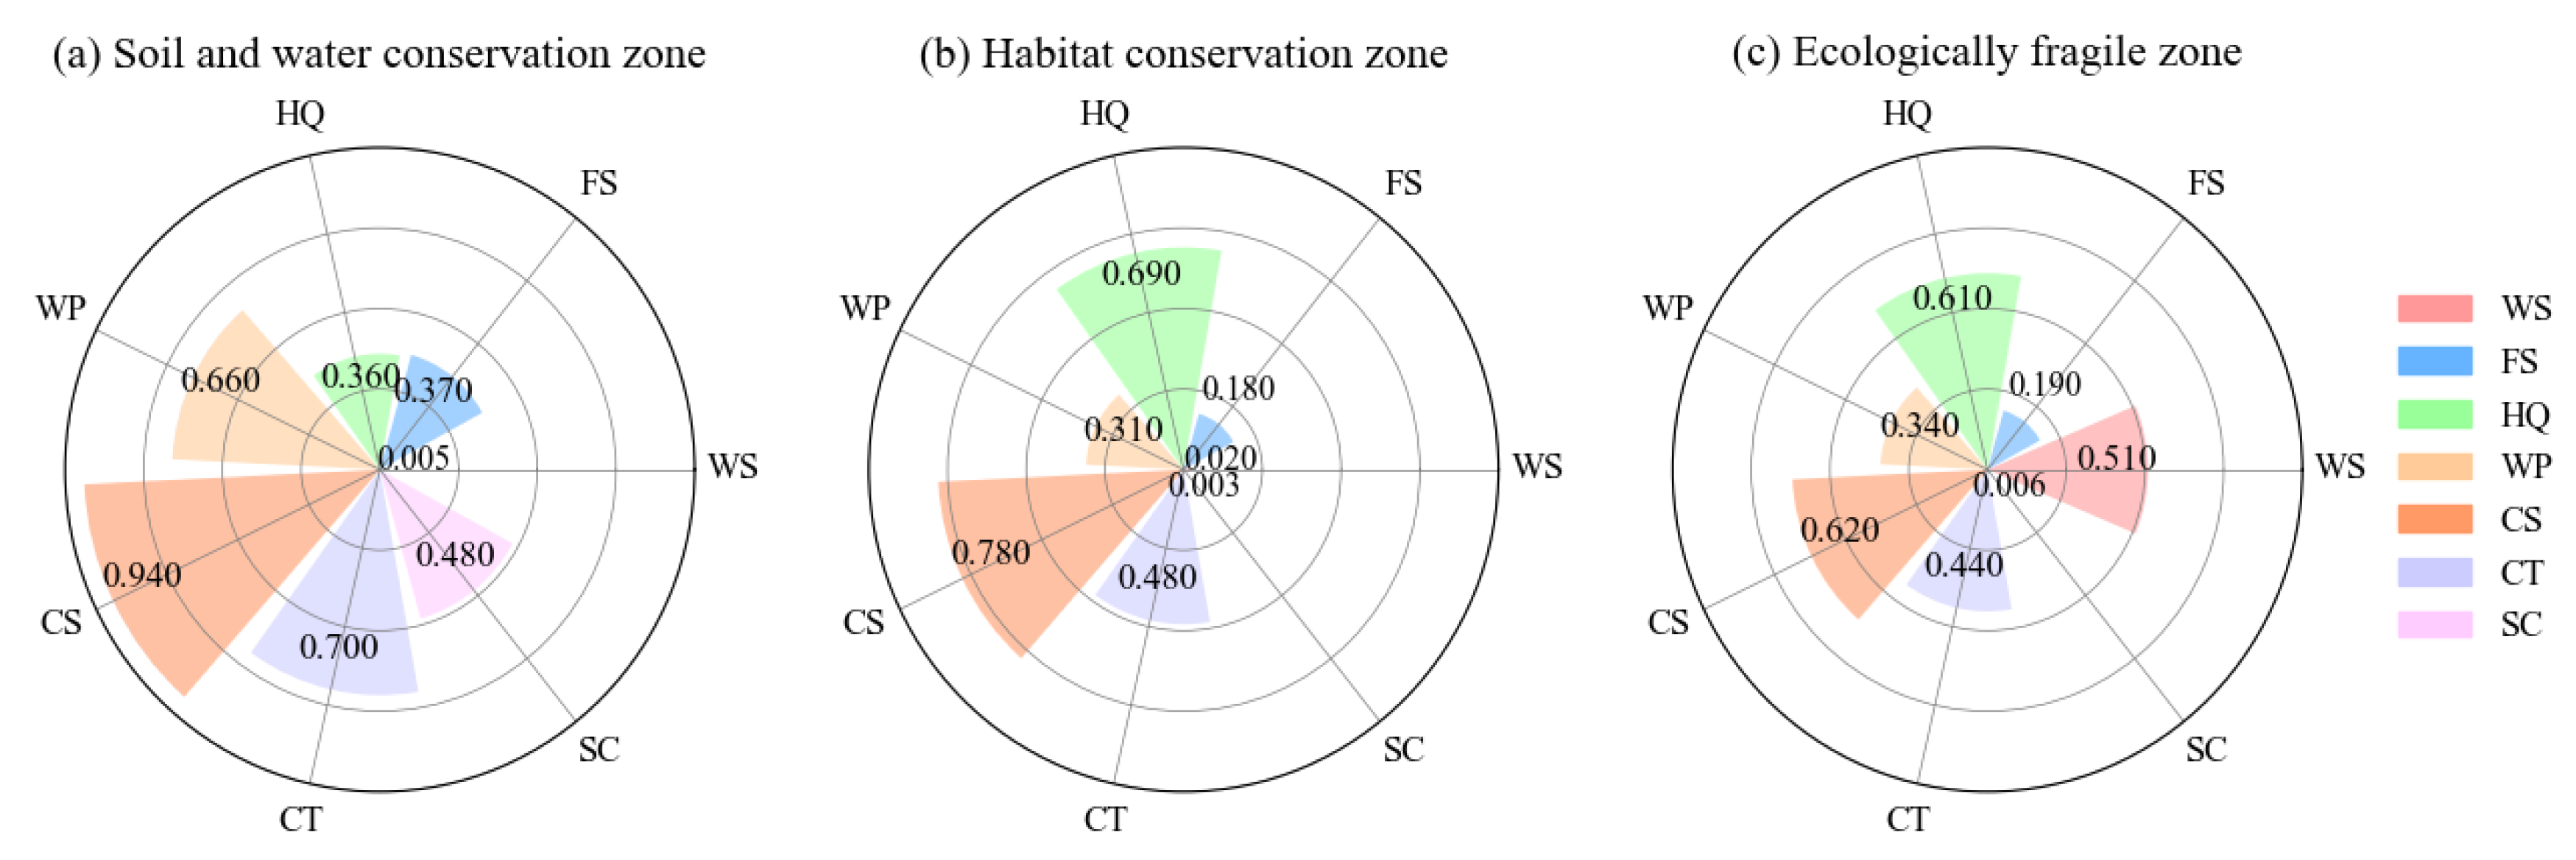
Figure 6.
Correlation of ecosystem services in different ecological function Zoning.
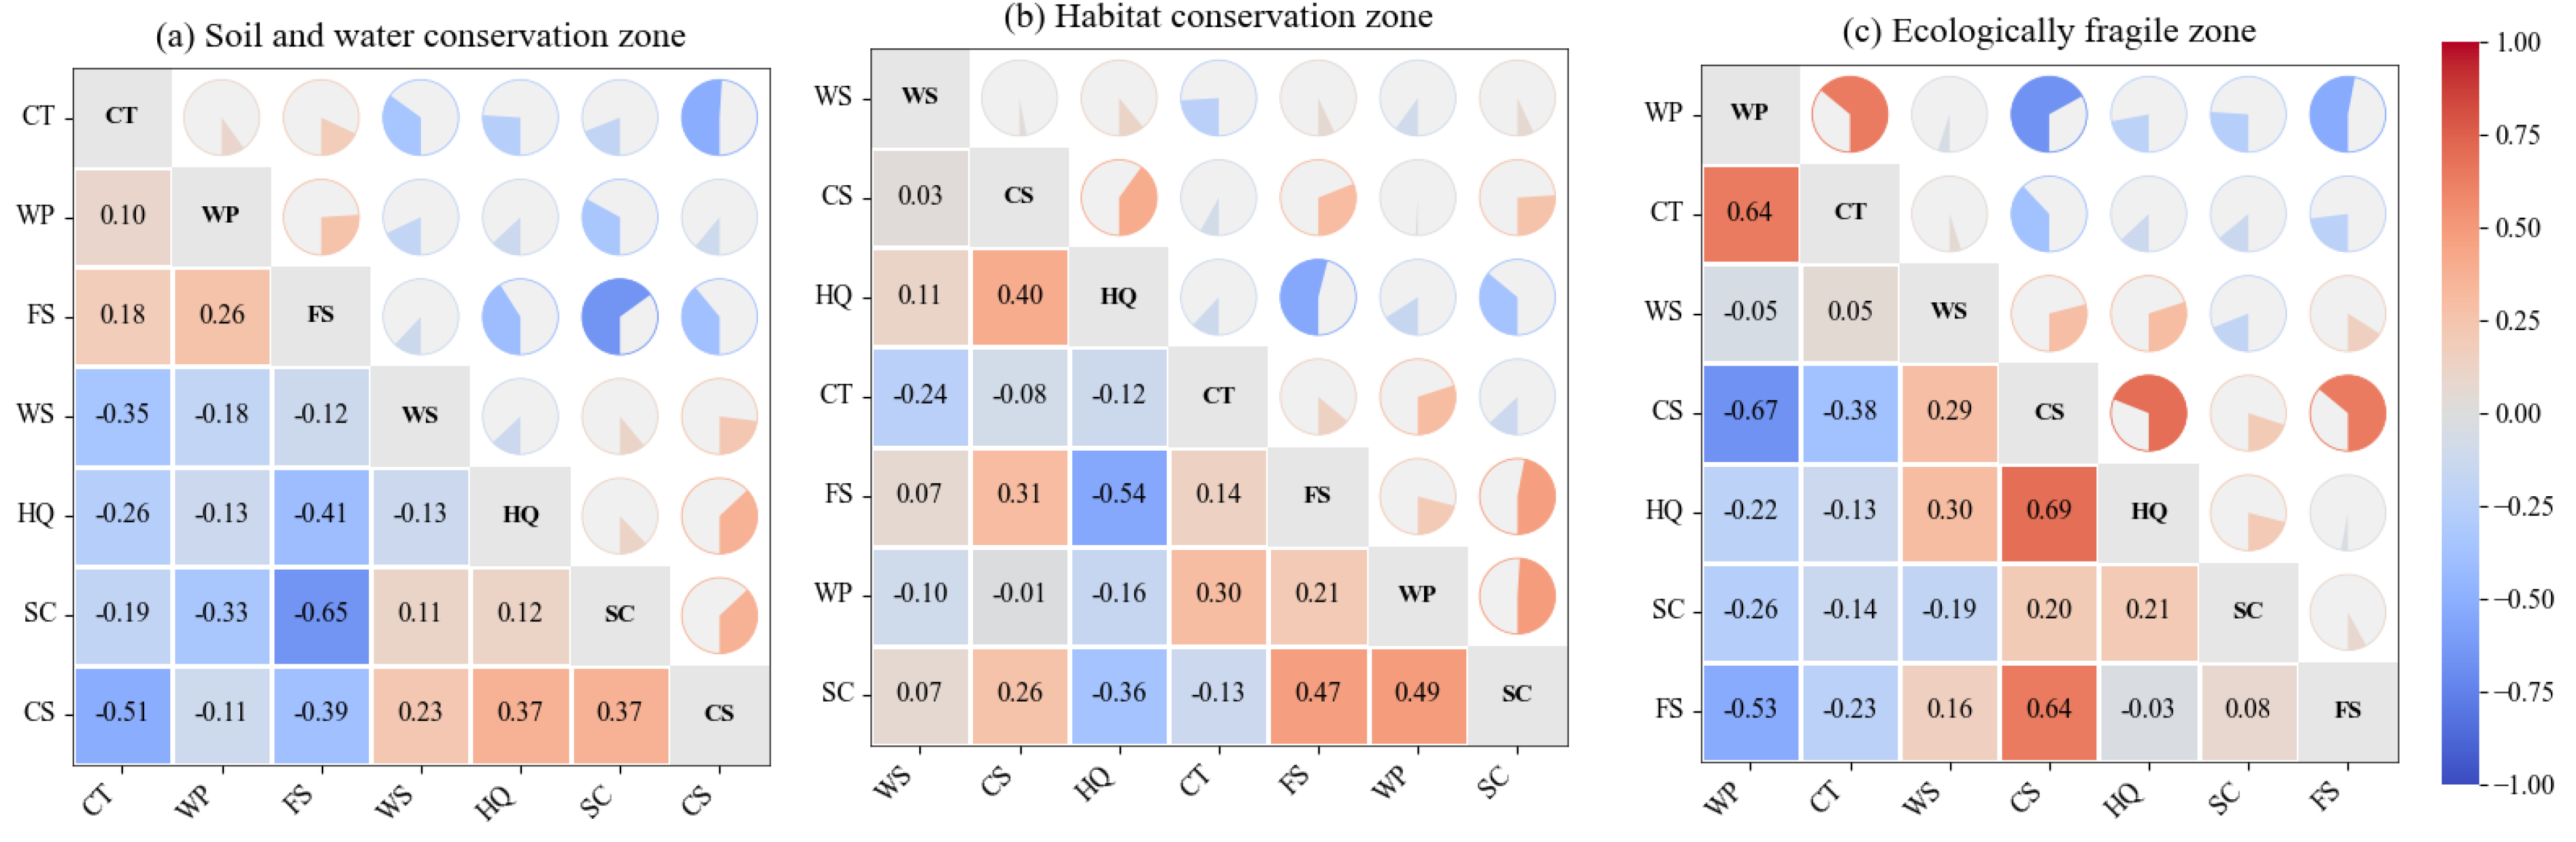
Figure 7.
Pareto frontier curves of ecosystem services in different ecological functionzoning.(a) Soil and water conservation zone. (b) Habitat conservation zone. (c) Ecologically fragile zone.
Figure 7.
Pareto frontier curves of ecosystem services in different ecological functionzoning.(a) Soil and water conservation zone. (b) Habitat conservation zone. (c) Ecologically fragile zone.
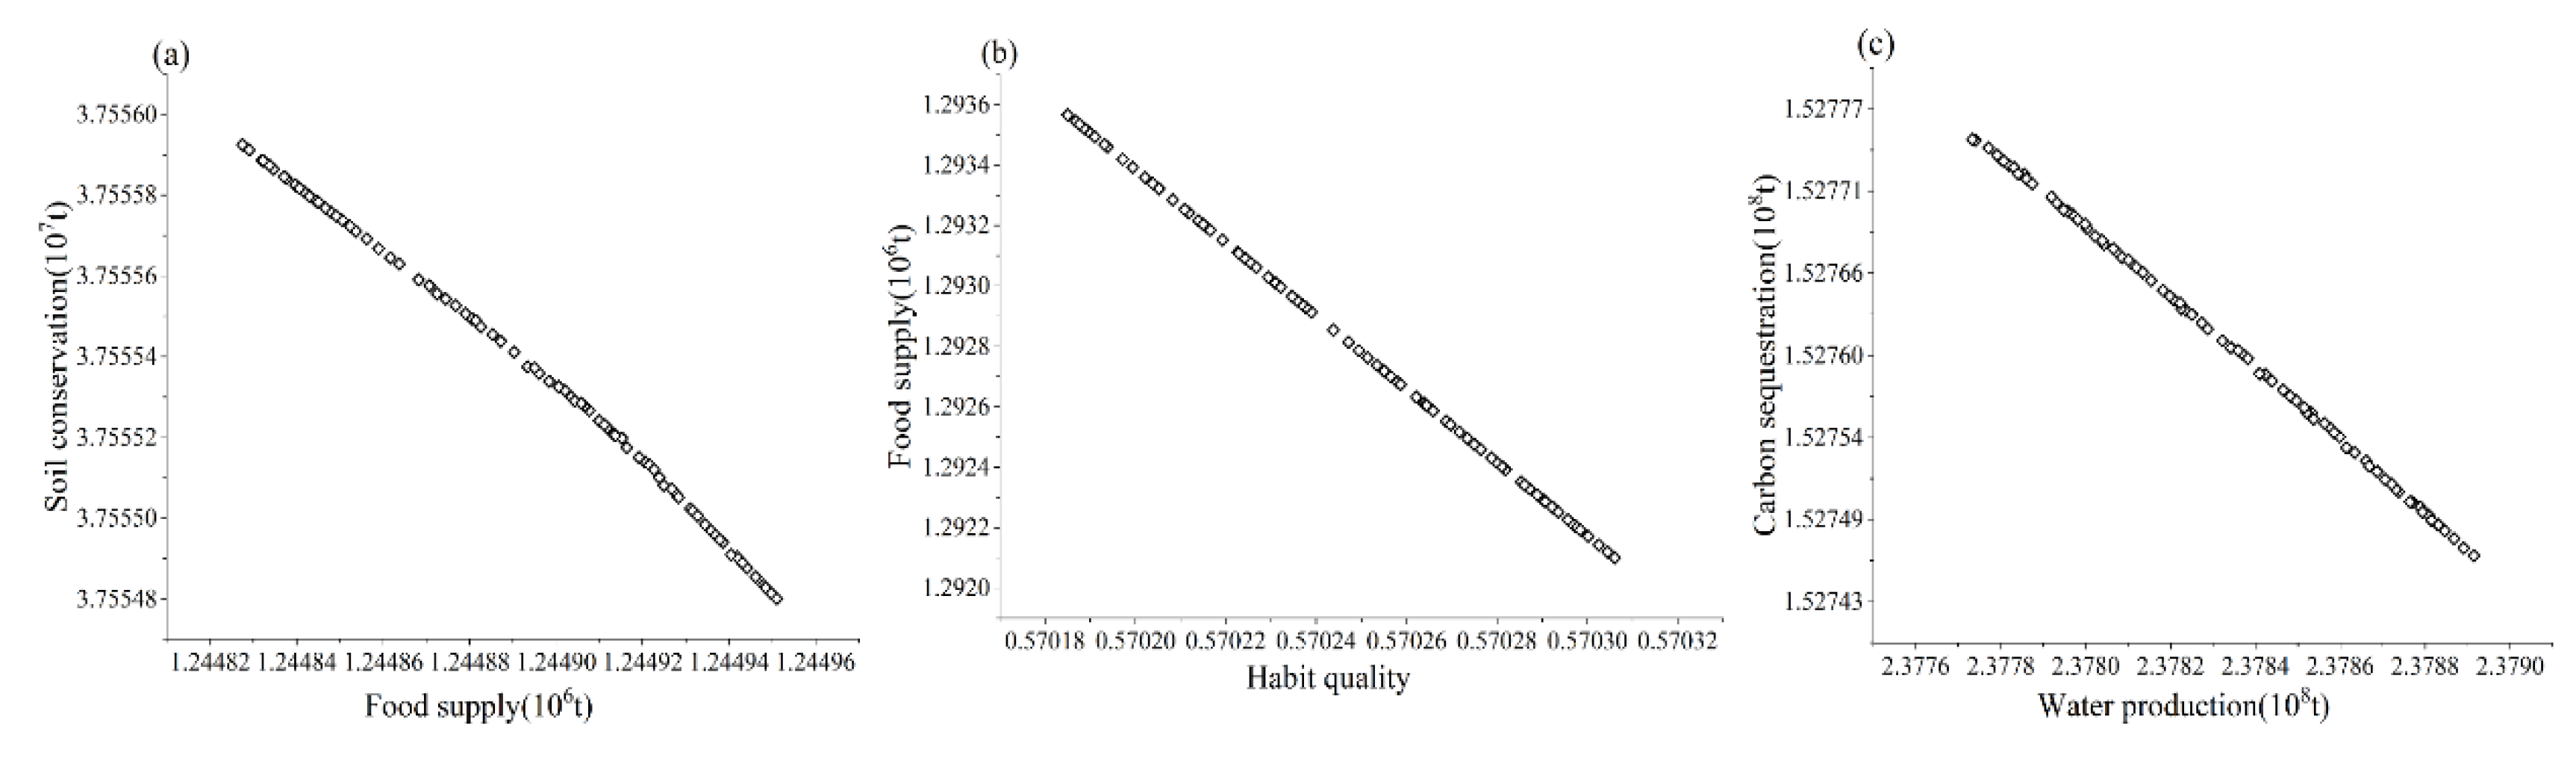
Figure 8.
Optimized land use in different ecological function zoning of the Wuding River under various scenarios.
Figure 8.
Optimized land use in different ecological function zoning of the Wuding River under various scenarios.
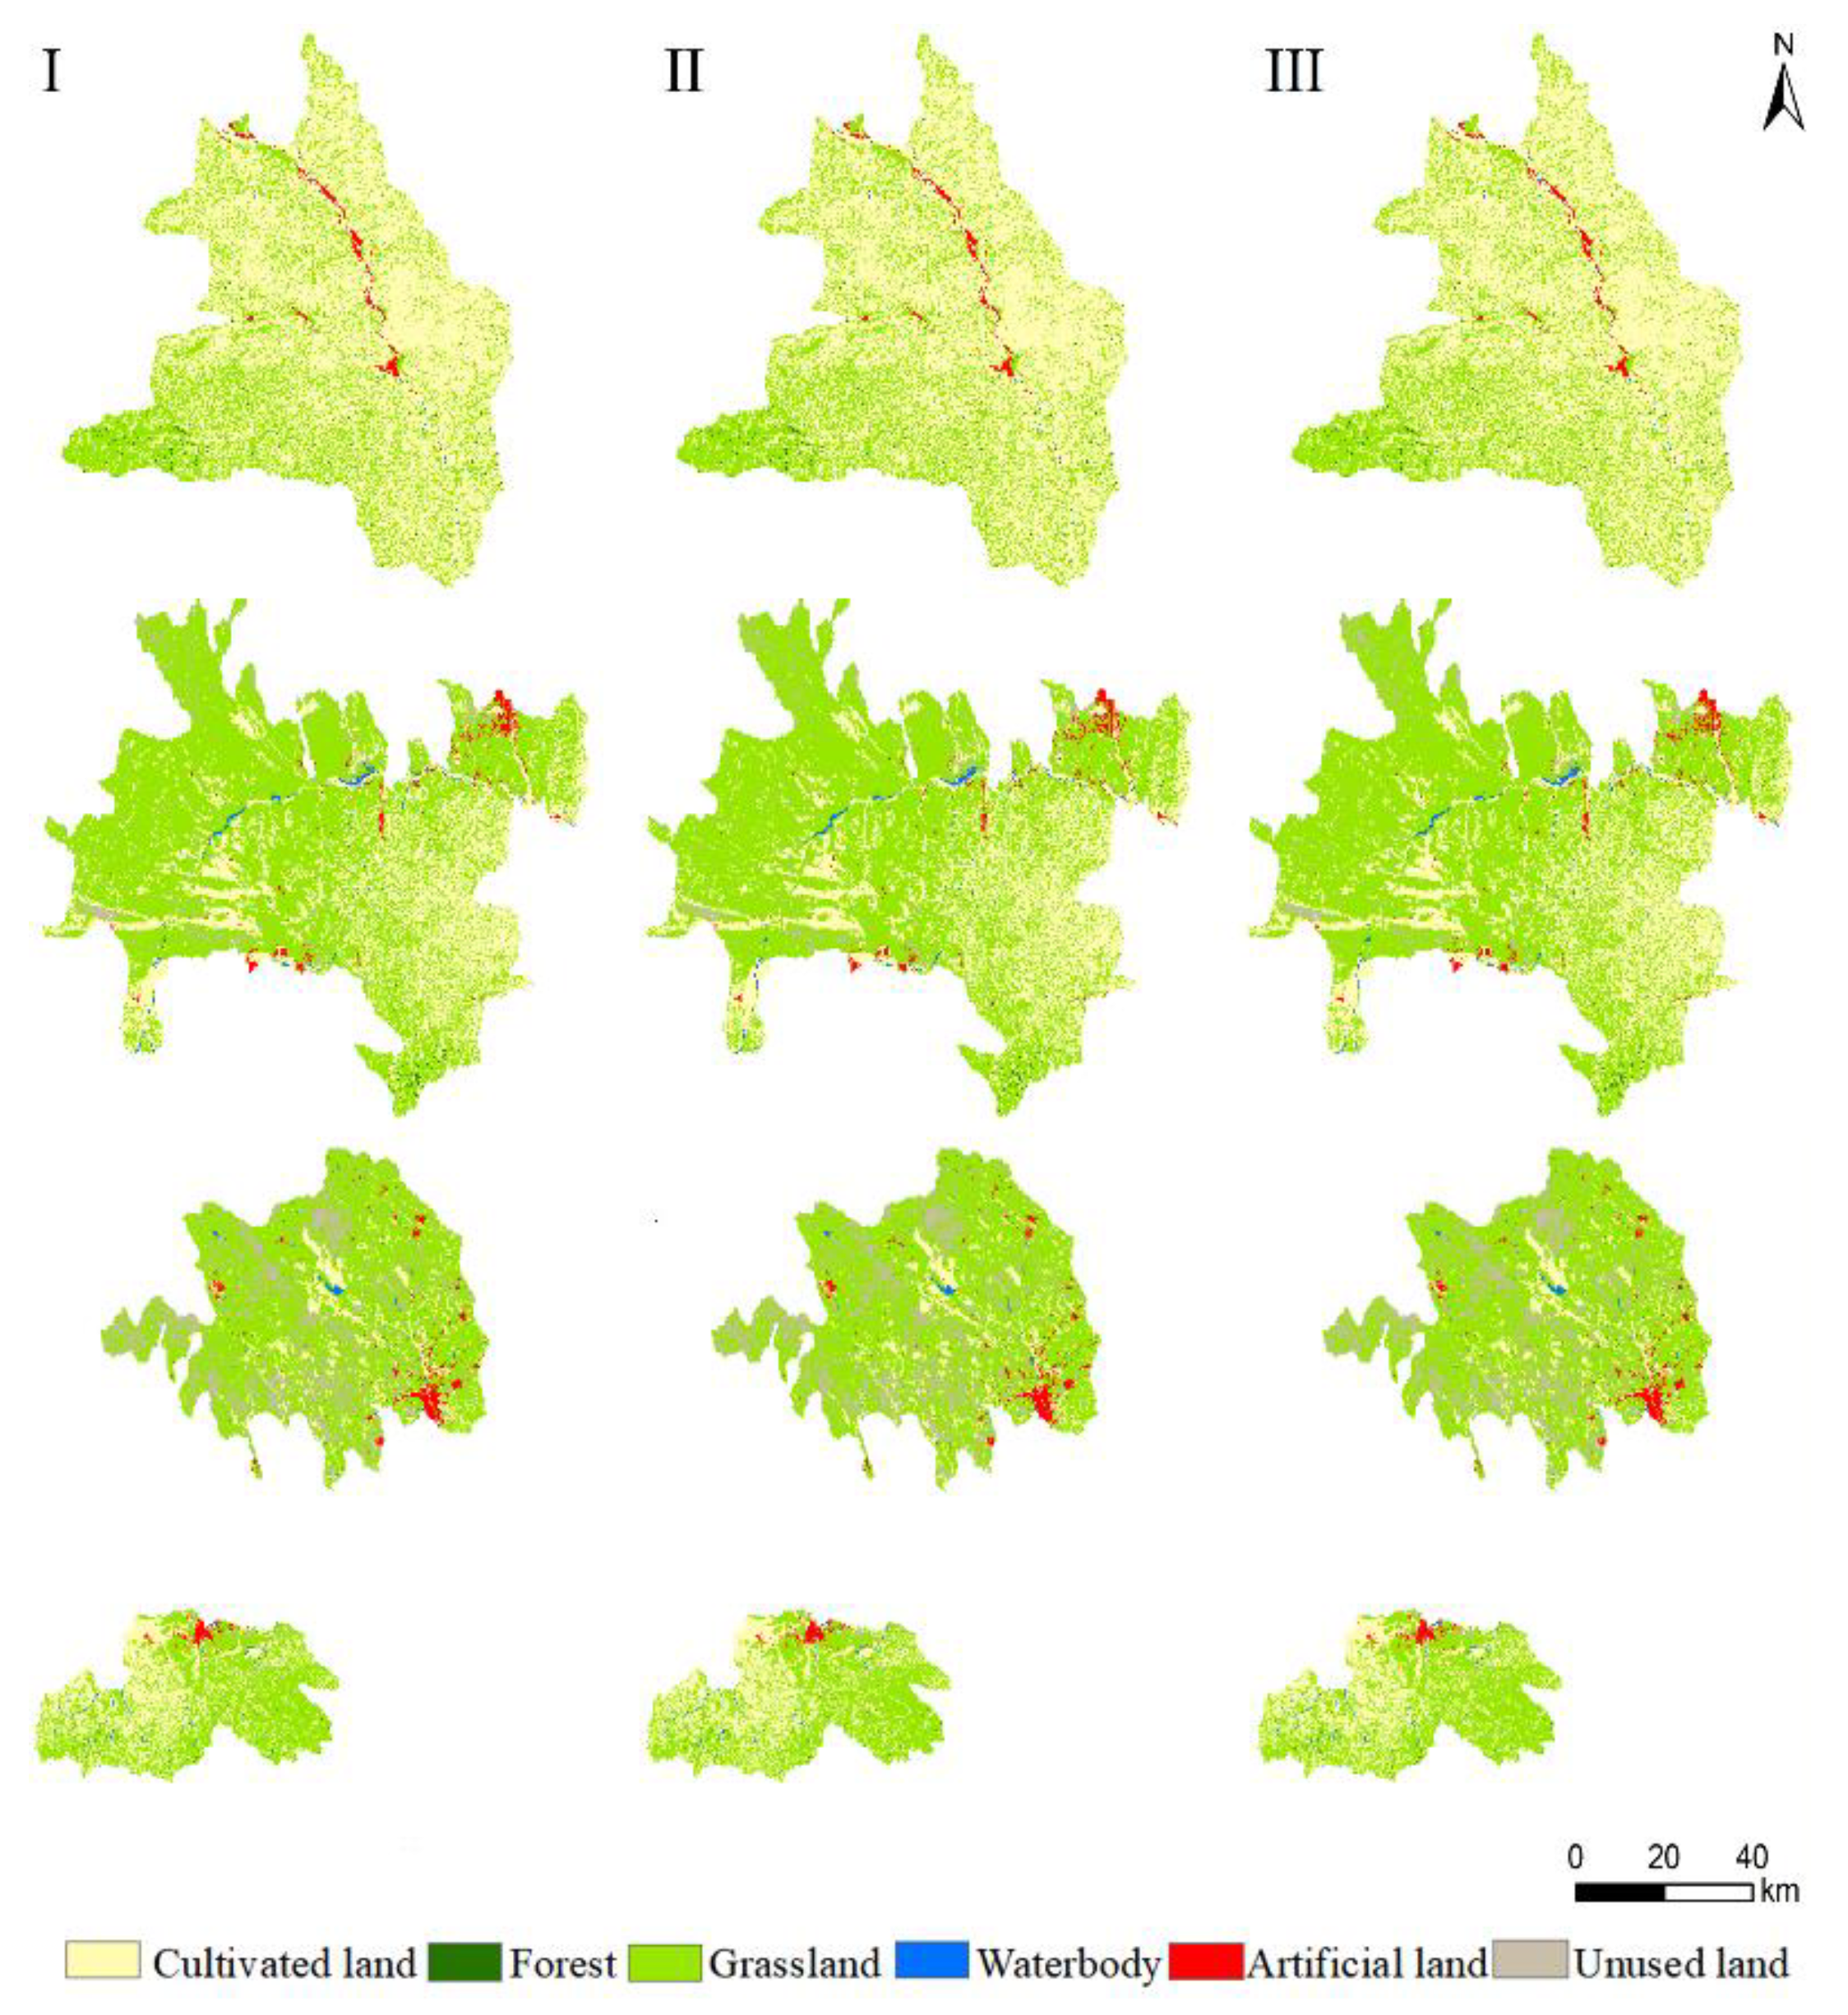

Table 1.
Data sources.
| Data type | Data description | Source |
|---|---|---|
| Basic geographic data | Administrative divisions and water system vector map | Data Center for Resources and Environment, Chinese Academy of Sciences |
| Digital Elevation Data (DEM) |
Spatial resolution 30m×30m | Japan Aerospace Exploration Agency |
| Land use data | Spatial resolution 30m×30m | Data Center for Resources and Environment, Chinese Academy of Sciences |
| Road traffic data | National road, provincial road, county road and railway |
Data Center for Resources and Environment, Chinese Academy of Sciences |
| Soil data | Spatial resolution 1km×1km | Harmonized World Soil Database(HWSD) |
| Meteorological data |
Daily observed meteorological element data (precipitation, relative humidity, solar radiation, temperature, wind speed, etc.) for 1990-2020 |
National Meteorological Science Data Centre |
| NDVI | Spatial resolution 250m×250m | National Aeronautics and Space Administration |
| Hydrological data | Measured runoff data from the Baijiachuan hydrological station from 2008 to 2013, the measured sediment data from the Baijiachuan hydrological station from 2008 to 2018 |
Yellow River Water Conservancy Commission (YRWC) |
| Food production | County (district) data | Yulin City, Yan’an City, and Ordos City Statistical Year book |
| Survey data | Survey questionnaire data collected from field visits |
Disclaimer/Publisher’s Note: The statements, opinions and data contained in all publications are solely those of the individual author(s) and contributor(s) and not of MDPI and/or the editor(s). MDPI and/or the editor(s) disclaim responsibility for any injury to people or property resulting from any ideas, methods, instructions or products referred to in the content. |
© 2026 by the authors. Licensee MDPI, Basel, Switzerland. This article is an open access article distributed under the terms and conditions of the Creative Commons Attribution (CC BY) license.
Copyright: This open access article is published under a Creative Commons CC BY 4.0 license, which permit the free download, distribution, and reuse, provided that the author and preprint are cited in any reuse.


