Submitted:
08 February 2026
Posted:
10 February 2026
You are already at the latest version
Abstract
The growing importance of integrating renewable energy sources (RES) into mainline railway traction networks stems from the sector's substantial electricity demands, traditionally met by carbon-intensive thermal generation. This paper addresses the potential of wind and solar power to enhance energy efficiency and reduce emissions in rail transport. It details the devel-opment of digital models for simulating DC traction power systems (TPS) coupled with RES, specifically wind turbines. Given the complexity of TPS, effective integration requires digital modeling that accounts for their unique properties. The proposed methodology, based on phase coordinates algorithms, offers a universal and comprehensive framework. It enables the identi-fication of various operational modes (normal, emergency, special) for diverse network com-ponents, including traction networks, transmission lines, and transformers. These models were used to simulate real-world train operations, generating data on electrical parameter dynamics and transformer thermal conditions. The results confirm that wind integration can improve energy efficiency, validating the methodology's practical applicability for RES projects in DC traction networks, including advanced high-voltage systems.
Keywords:
DC railways
; traction power systems
; integration of renewable energy sources into traction networks
1. Introduction
The integration of renewable energy sources (RES) into mainline railway traction networks is growing in importance due to the large electricity requirements of rolling stock. Since much of this power is currently supplied by carbon-emitting thermal plants, deploying RES such as wind and solar energy offers a way to lower emissions and improve the overall energy efficiency of rail transport. In this context, the work in [1] addresses the integration of RES and energy storage into AC traction power systems (TPS) to reduce both carbon footprints and energy costs. The study highlights the significant expenses railway operators face from electricity and carbon taxes. Accordingly, incorporating RES and storage into TPS can lead to considerable savings by decreasing reliance on grid power and reducing associated carbon tax charges.
2. State-of-Arts of Research
A comparative analysis of topologies for integrating photovoltaic sources into an AC railway TPS is conducted in [2]. It demonstrates that the increasing application of RES in energy systems will extend to railway power supply in the near future. This paper compares the technical and economic advantages of several configurations with power electronic converters for integrating photovoltaic sources into TPS. The authors propose a design methodology for selecting components for each of these configurations. Requirements for unbalance on the power transmission line are adopted in accordance with current standards.
The design methodology can be applied to power a high-speed railway. The configurations examined are numerically compared based on technical feasibility and cost. In so doing, the generating capacity of RES is treated as an independent variable. The analysis reveals that with gradual integration of RES into TPSs, configurations with power converters feeding overhead lines may become more advantageous. The integration of a photovoltaic power plant into a TPS is discussed in [3]. The paper shows that supercapacitors are a suitable technology for traction applications, but are limited by energy density. The use of supercapacitors and storage devices can reduce peak power and enable utilization of recuperation energy. An optimal design is proposed to cut down the cost of batteries integrated with photovoltaic power plants. A method for reducing carbon emissions when scheduling train traffic, given wind turbines, is proposed in [4]. Reducing carbon emissions has currently become a priority in most countries of the world, while the transport and energy sectors still generate high emissions. The advancement of intelligent transport systems and RES integration can reduce the emissions. This paper proposes a linear programming model for train scheduling where a traction power system and a power system incorporating wind generation are coordinated to minimize emissions. The running time for each inter-station section can be changed and the optimal output for wind power plants can be obtained after optimization. The results yielded indicate that the coordination of TPS and power system can reduce the energy consumption and carbon emissions during train operation by 12% and 13%, respectively, compared to the original solution.
A traction power system incorporating photovoltaic panels to address power quality issues is described in [5]. The authors solve the problem of power quality improvement in TPS based on the integration of RES and distributed generation. Consideration is given to the design and control issues of a photovoltaic solar and two single-phase five-level inverters associated with a Le Blanc transformer for connecting two single-phase loads and generation. The proposed configuration fully compensates for the unbalance, reactive power, and current harmonics in a three-phase network. A sliding mode is used to control the inverters. On this basis, the DC bus voltage is regulated, reactive power and current harmonics are compensated for. In addition, the unbalance is reduced. A hybrid DC TPS with hydrogen production is discussed in [6]. The combined use of electric trains and hydrogen locomotives is becoming an important trend for the future of metro. This paper presents an innovative DC hybrid TPS integrating RES and hydrogen subsystems. A router based on a triple active bridge converter was developed for efficient integration of these subsystems. A power management and control strategy of the hybrid DC TPS is proposed to achieve smooth transition between different modes. Simulation results are presented to validate the proposed approach and control structure. The proposed TPS can effectively use RES and regenerative braking energy to save energy costs. The performance of a hybrid traction network incorporating RES is analyzed in [7]. The study notes that Indian Railways use electric traction based on DC drives powered by 25 kV network. Single-phase alternating current is converted into direct current by a control rectifier. Due to the limited availability of conventional energy sources and the pollution caused by burning fossil fuels, renewable energy sources should be actively used. The study proposes a new control strategy in which the renewable energy source is coupled with TPS and at the same time is synchronized with the power grid that powers locomotives. The TPS operating modes are analyzed using simulations and experimental tests carried out on the developed hybrid system. The advantages and limitations of the proposed configuration are considered. The use of renewable energy to improve the performance of the Indian TPS is the focus of [8,9].
The studies emphasize that the insufficient conventional sources and the ongoing release of carbon emissions into the atmosphere generate the need to use renewable energy sources as their alternative. The authors propose utilizing wind generators that are connected to the network that feeds traction substations. A control strategy for the TPS incorporating an energy storage system and renewable sources is proposed in [10]. The study reveals a significant rise in energy consumption by urban railways, driven by the escalating demand for travel. This situation creates big problems for TPS. Based on the findings of their study, the authors propose a control strategy for the TPS that incorporates energy storage devices (ES) and RES. A detailed equivalent model of the rolling stock, traction network, and energy storage system is designed. A control strategy aimed at reducing peak power and voltage fluctuations is developed. The study is conducted for a line with multiple trains.
The simulation results demonstrate the effectiveness of the proposed approach in reducing peak power and voltage fluctuations. Short-circuit currents in a distributed TPS with RES are studied in [11]. The study examines the nature of changes in short-circuit currents when renewable energy sources are used. A trend toward an increase in the share of renewable energy sources in the overall energy balance and a rise in electricity consumption on mainline railways is revealed. The study involved developing a method for assessing the effect of renewable energy sources on short-circuit current values. The developed method is based on the established techniques for identifying equivalent circuits, yet it innovatively models a “solar panel - inverter” type pair as an EMF with equivalent resistance, which significantly simplifies further calculations. The calculation results show that the use of renewable energy sources will not lead to a significant increase in short-circuit currents in the traction network even when the power of photovoltaic sources is comparable to the power of existing converter units at traction substations. This is explained by the physical nature of the panels and their operating modes. Therefore, from the perspective of short-circuit currents, the integration of power-boost points powered by solar power plants with the operating sections of traction power system is quite possible. A scheme of a neural network-based selection of renewable energy sources for auxiliary power supply to non-traction consumers based on wind-solar renewable systems is presented in [12]. A concept proposed for power supply to auxiliary loads of subway cars relies on wind-solar renewable energy sources. Existing RES selection schemes are hardware-oriented, which leads to insensitivity of components. The authors use a neural network-based approach. The proposed method is simple, cost-effective, and highly precise. A review of sustainable TPS with a microgrid is presented in [13]. An analysis of modern TPSs on DC and AC railways is given. Consideration is given to various architectures of sustainable TPSs for the integration of renewable energy. They ensure reliable power supply in case of disruptions and failures, including those caused by natural disasters and extreme weather conditions. This approach facilitates the development of next-generation TPSs that offer enhanced flexibility and resilience. Through a comparative analysis of various TPSs, the authors give a brief description of emerging trends and conclude that the proposed TPSs provide a universal solution for integrating RES and ensuring a high-quality power supply protected against grid disturbances. A coordinated control strategy for TPS with energy storage systems and RES is described in [14]. The authors note that the growing demand for travel and the expansion of settlements make the establishment of urban rail transit (URT) systems particularly important. Based on the existing traction substation, a configuration of a multi-source TPS is proposed for URT with a coordinated control strategy following the load curve. The proposed TPS, incorporating a conventional traction network, a renewable energy source, and an energy storage system is modeled. Given the dynamic characteristics of the system and the energy storage capacity, a coordinated control strategy is developed. It considers the traction substation voltage as a control signal, which is optimized based on the proposed performance index. The studies are conducted for a three-station route with two substations. The proposed TPS is compared with a conventional TPS under various train schedules. The simulation results show that the proposed approach can maintain energy storage system state- of-charge and reduce the substation peak power and voltage fluctuations. In addition, the capacity of the traction network increases. Energy saving can reach 36% and the peak power is reduced by 46%. Solving the problems of integrating RES into TPS necessitates estimation of the negative sequence unbalance indicator. The method for such an estimation is proposed in [15]. It factors in the results of traction calculations, as well as the connections between the TPS and the power system. The TPS presented enables the implementation of compensation for negative sequence currents. Traction calculations are performed to obtain spatial coordinates, speeds, and power of trains at given moments in time.
A TPS model is designed to calculate power flows. An energy management strategy for an advanced TPS that incorporates photovoltaic panels and power plants is proposed in [16]. This TPS, when integrated with PV and energy storage system, enables the efficient use of the regenerative braking energy and RES. The authors propose a multitime-scale management strategy, including optimal minute-by-minute dispatch for the main station and real-time second-by-second control for the substation. The level of the main station suggests minimizing the operating costs to obtain reference operating points of the output port converter, PV, and energy storage system at each substation. At the substation level, an adaptive operating point control strategy is proposed to ensure voltage and frequency stability. The feasibility and merits of the proposed strategy are verified through simulation and experiments. The issues of RES integration and energy storage optimization to reduce energy costs on railways are discussed in [17].
Climate change is one of the biggest global challenges. The transport sector accounts for about 30% of greenhouse gas emissions that need to be decarbonized. Railway electrification is a low-carbon solution, but it uses carbon-emitting power plants. Renewable energy sources and energy storage systems can be used for decarbonization. The authors have developed an energy management system for calculating its flows and costs. Additionally, losses in the traction network are considered and the problem of finding optimal capacities and locations of photovoltaic and wind power plants is solved. The high-speed railway traction network is taken as an example. The findings reveal that the deployment of RES diminishes energy supply costs and reduces carbon emissions. Given all variables, wind power plants prove to be a more cost-effective option than solar power plants. The study also shows that the optimal locations for connecting RES differ depending on the scenario. The development of a hybrid source, including a solar panel, a wind generator, and supercapacitors for train traction is the focus of [18]. The study explores the design of an embedded power source using supercapacitors that are charged by solar panels and have an electronic converter powered by a wind generator. These supercapacitors supply power to the 60 kW electrical network by utilizing the sliding mode principle for control. The operating principle of this device and some experimental results are presented.
A new single-phase inverter with an interphase bridge for photovoltaic systems and energy storage devices connected to TPS is described in [19]. The router is designed for balancing the traction network, using braking energy, and accessing renewable energy sources. The existing technologies, however, are highly expensive. This study proposes a new router with an interphase bridge single-phase inverter structure to implement three-port power transmission. The power flows among the three ports are thoroughly analyzed, and a mathematical model is developed to quantitatively examine the power transfer among them. In order to solve the problem of three-port interactions of active and reactive power, a hybrid decoupling method based on additional compensation devices and an optimization algorithm is proposed. The functional efficiency and economic superiority of the proposed approach are verified through comparative experiments.
The results of dynamic modeling of a DC TPS, considering energy storage devices, are presented in [20]. The study examines models of various parts of the TPS, including energy storage devices (supercapacitors). When designing the supercapacitor model, the threshold values of charging and discharging voltage are factored in. In combination with the states of the traction network, the control strategy of the supercapacitors is thoroughly analyzed. Dynamic simulation relies on the method of chain - rule reduction of ladder circuit Jacobian matrices. To compare the effects of energy saving and voltage stabilization, three scenarios of equipment installation were set: with braking resistors alone, with supercapacitors alone, with neither of these components. The simulation program is implemented in Matlab. With its help, the results of simulation for a metro line are compared and analyzed.
A review of renewable microgrid technologies for electrified transport is presented in [21]. The advancement of transport powered by renewable energy sources is increasingly important in today’s context. This paper is concerned with the renewable microgrids and energy router technology. The integration of such microgrids with electrified transport infrastructure provides increased reliability, improved utilization of renewable energy sources, and optimized energy management. Routers additionally provide flexible energy distribution. Thus, based on renewable energy sources, opportunities are created to implement sustainable and efficient traction power systems. The prospect for using solar energy in China’s railway transport is discussed in [22]. In today’s landscape, there is a swift surge in both freight and passenger transportation, leading to a significant rise in electricity consumption. At present, solar generation is widely used as an additional source. The paper focuses on the current state of solar power generation and its extensive integration into the transportation sector. The potential of photovoltaic generation for China’s railways is assessed. The prospects for the implementation of solar-powered rail transportation, which contributes to the reduction in carbon emissions and the expansion of renewable energy sources, are presented. This approach is shown to be promising for sustainable transportation. An integrated rail system and parking lots for electric vehicles with regenerative braking energy, energy storage system, and photovoltaic systems are described in [23]. The study emphasizes the remarkable advancements made in the electrification of transport in recent years. A new concept is proposed for integrating rail transport systems with parking lots for electric vehicles (EV). In the proposed framework, the EV charging power requirement is met by different strategies that take into account the unused capacity of the energy infrastructure and regenerative energy of the railway. The project of a carport type renewable energy production unit based on photovoltaic panels for EV parking lots is described. An optimal control system is implemented considering the uncertainty of the demand for EV charging. The concept is tested and comprehensive results are obtained.
The problem of distributing renewable energy in the traction network for light rail transport is solved in [24]. Electric light rail transport is considered as an environmentally friendly alternative to public transport in densely populated areas. The energy source, however, must be renewable. Solar power plants and modules on public buildings in the city center can be such a source. Traction overhead lines are loaded at only 20% of their capacity. Therefore, it is proposed to use them as a DC network for the distribution of renewable energy.
Achievements in the field of renewable energy for transport are analyzed in [25]. Solar-powered trains are a new approach with great potential for the transformation of rail transport in the future. These trains offer environmental benefits such as significant reduction in greenhouse gas emissions and improved air quality through the use of solar energy. Because these trains use decentralized infrastructure rather than conventional fossil fuels, they facilitate energy independence and security. Although initial costs can be high, solar trains are a financially feasible option lowering costs and enhancing energy storage technologies. Moreover, by increasing stability, the integration of solar-powered trains into the current railway infrastructure and intelligent grid systems further boosts their potential.
The optimal use of photovoltaic systems for electrified railways and charging stations for electric vehicles is discussed in [26]. The integration of renewable energy sources into conventional energy systems is becoming crucial for achieving sustainable energy solutions. The requirement for such integration is essential in megacities to reduce carbon emissions and electricity costs. This paper studies an energy management scheme for optimal use of photovoltaic panels for electrified railways and EV charging stations. The energy management system is designed to prioritize the use of photovoltaic energy, using the maximum power point tracking method relying on perturbation and observation algorithm. In the cases of insufficient PV power, the system smoothly receives power from the AC grid through the converter to maintain a stable power supply for the metro and EV charging station. When PV generation exceeds demand, the excess power is returned to the AC grid. The proposed approach works effectively for the uninterrupted management of charging stations and electrified railways, while simultaneously reducing carbon emissions. The problem of integrating photovoltaic technologies into railway trains is solved in [27]. The study indicates that the TPS of the metro consumes a large quantity of electricity, which causes an urgent need to use RES. Photovoltaic technology can significantly lower greenhouse gas emissions. The paper provides a feasibility study for using photovoltaic systems for interior lighting of urban rail vehicles.
Technologies for integrating renewable energy sources at railway freight stations in South Africa are proposed in [28]. The mission to enhance technologies and preserve the environment using RES-based microgrids is attracting global attention. The South African rail freight industry still lags behind in adopting renewable energy technologies at freight stations. The study examines an efficient method of supplying electricity from a hybrid renewable energy system to the Salkor freight station. The hybrid microgrid is designed using a photovoltaic system and wind turbines. Lithium-ion batteries provide energy storage. A feasibility study was conducted to assess the viability of incorporating an electric generator into the hybrid microgrid system.
3. Modeling Methodology
Modeling the operating modes of power grid and DC TPS relied on the approach proposed in [29,30,31,32]. This approach is based on multiphase modeling. In this case, the power components of the power grid and TPS are represented in the form of lattice equivalent circuits (LEC), (Figure 1 and Figure 2).
Following the findings of the studies conducted, computer models were implemented. The core principles guiding their development are as follows:
- Systems approach;
- Comprehensiveness;
- Versatility.
The first principle ensures the correct consideration of the interaction between AC and DC subsystems when modeling the operating modes of the power grid that powers DC traction substations. The second principle makes it possible to solve a range of problems in modeling power flows and thermal conditions, such as heating of live parts and transformers, as well as removal of ice formations. Additionally, simultaneously with identifying power flows, one can calculate the electromagnetic fields of power transmission lines and traction networks. The third principle enables modeling of the power transmission lines, traction networks, and transformers of various designs; as well as smart grid devices, such as active harmonic filters, controlled reactive power sources (RPS), inverter generators, and others.
The models were implemented in the Fazonord AC - DC software [29,31], designed to solve the following groups of problems (Figure 3):
- identification of complex asymmetrical, non-sinusoidal, partial-phase, and emergency modes of electric power systems and railway power supply systems;
- calculation of electromagnetic field strengths generated by power transmission lines and traction networks;
- determination of heating of current-carrying parts and transformers, modeling of ice melting modes on power transmission line wires and traction networks
- parametric identification of power transmission lines, traction networks, and transformers based on synchronized measurements.
The railway power supply system has its own unique characteristics, including traction and external power supply subsystems, as well as network areas used to supply power to non-traction and non-transport consumers. When modeling its operation, the elements considered include power and instrument transformers, sections of the overhead contact network, overhead and cable power lines, power sources, and loads. The specifics of modeling these elements determine the characteristics of the computer model.
Railway power supply systems have a number of unique characteristics that can create challenges when solving problems related to modeling and managing electricity distribution and consumption processes. These characteristics can be divided into two groups: structural and operational. Structural characteristics include the following factors:
- significant spatial distribution; the length of the traction network can exceed several thousand kilometers;
- heterogeneity in the structure of subsystems, characterized by the fact that the power grid networks are three-phase, while the traction power supply system is single-phase.
The following characteristics can be attributed to operational conditions:
- pulsating active power in the traction network and at the high-voltage inputs of traction substations;
- spatial movement of electricity consumers;
- abruptly variable dynamics of traction load changes;
- significant asymmetry and harmonic distortion;
- electromagnetic influence of the traction network on adjacent power transmission and communication lines, as well as on metal structures installed along the railway route;
- significant levels of electromagnetic fields generated by an unbalanced traction network.
Calculating the operating modes and determining the load capacity of traction power supply systems are extremely important tasks during their design and operation. These tasks, solved using modeling methods, include the following steps:
- obtaining and processing train schedules;
- generating instantaneous diagrams based on the electrical connections of components and the train schedule, and determining the flow distribution for each of them;
- extracting data from instantaneous diagrams and generating integrated calculation indicators.
The purpose of such calculations is to determine the electrical energy consumption during train movement and energy losses in traction and external power supply system components, monitoring voltages at electric locomotive pantographs and currents in the components. Energy consumption during movement with relatively small voltage changes is determined by average currents, while energy losses and heating of current-carrying parts depend on root-mean-square values, which are significantly influenced by maximum currents.
Modeling moving traction loads is based on a motion graph relating the train’s position coordinate to time. The magnitudes of these loads are determined based on traction calculations or experimentally. Traction loads are typically specified by current values. Therefore, the Fazonord AC-DC software package converts currents into power consumption at the rated voltage at the pantograph.
Deterministic and random train motion graphs are used in the mode calculations. The first type of schedule is used to determine the capacity of a road section using an electrical power supply system. Typically, this involves calculating the modes of a series of sequential instantaneous circuits spaced at small, equal intervals (usually 0.5 or 1 minute) to ensure continuous monitoring of the traffic schedule. Modeling based on random schedules is also used in the design of electrical power supply systems and in determining energy losses in their components.
The software enables modeling of overhead and cable power transmission lines of various designs (Figure 4), power transmission lines of railway transport (Figure 5), rectifier-inverter converters (Figure 6), power and instrument transformers (Figure 7), and active components of smart grid (Figure 8).
The software package allows modeling the following types of transmission lines (Figure 4):
- overhead power lines: single-circuit, double-circuit, and multi-circuit;
- cable transmission lines with impregnated paper insulation, as well as with cross-linked polyethylene insulation;
- controlled self-compensating transmission lines
- compact, high-capacity lines with any conductor arrangement, such as flat, triangular, parabolic, elliptical, two-segment, and four-segment coaxial;
- open transmission lines, in which each phase includes two conductors insulated from each other; one of these conductors, called the direct conductor, is connected to the busbars of the transmitting substation, and the other, called the counter conductor, is connected to the busbars of the receiving substation;
- power transmission lines using the ground as a current-carrying part, including dual “two wires-ground” power transmission lines of overhead and cable types, as well as “wire-rail”, “two wires-rail” lines and power transmission lines with a grounded phase, widely used in railway transport (Figure 5).
When modeling DC segments, the following types of rectifier-inverter converters can be simulated: six-pulse and twelve-pulse, controlled and uncontrolled (Figure 6).
This software suite provides modeling capabilities for a comprehensive range of transformer types. These include single-phase, three-phase, two-winding, and multi-winding power transformers and autotransformers, including step-up variants. The library also encompasses current and voltage measuring transformers of various designs, symmetrical component filters, and specialized transformers such as Scott, Woodbridge, Kübler, Leblanc, and other baluns. Additionally, models are available for phase-shifting, cross-, and booster transformers (Figure 7).
Modeling of active elements of smart grids is also possible: phase-controlled reactive power sources, active harmonic filters, and inverter generation units (Figure 8).
The modeling foundation is a calculation scheme, which requires the following inputs:
- A single-line diagram of the integrated traction and external power supply network, detailing element types, line lengths, and the active/reactive power of stationary loads.
- Availability of the necessary element models in the software library, with the option for users to create custom models if needed.
- Specifications for the power sources, distinguishing between: reactive power-balancing nodes with fixed active generation and swing buses (slack nodes) that balance both active and reactive power.
A critical aspect of modeling a combined traction and external power supply system is the connection of traction transformers to the external power lines. In a 1x25 kV system, six types of traction substations can be defined based on their phasing configuration.
The simulation works by sequentially calculating the operating conditions for a series of system snapshots, each representing the network state at an instant in time as trains move. Generating each snapshot requires the following inputs:
- a connection diagram of the stationary network elements, including their parameters, along with the loads and generation within the static part of the power system.
- the position of all trains at a specific point in time, as defined by the schedule. These positions set the parameters for the model’s variable portion, which consists of the relevant traction network sections.
- the load demand of each train at that specific time, which is determined from traction calculations or test runs based on the train’s current coordinates.
The Fazonord AC-DC software supports the simulation of DC traction power supply systems with six-pulse and twelve-pulse converters, along with an external power supply system. Calculations are performed at the fundamental frequency for the AC subsystem and at the DC voltage for the DC subsystem, as well as at the higher harmonic frequencies generated by the substation converters. On the rectified voltage side, the substation converters are modeled as no-load EMF sources with an internal resistance determined by the reactances of the supply transformers and the external power supply system. On the AC side, they are represented by fundamental frequency current sources, the parameters of which are determined by both the rectified current and the three-phase supply network. Simulation of a controlled rectifier and inverter mode of the converter is implemented.
A smoothed rectified current waveform is assumed, since a large inductive reactance is connected to the traction network side, composed of the reactances of the traction network and the smoothing device reactor. The converter model separates the AC and DC subsystems.
In harmonic calculations, the converter model nodes on the AC side are represented by harmonic current sources, since the inductive reactance of the step-down and converter transformers is much greater than the reactance of the power supply network. The influence of higher harmonics on the switching of the converter valves is not taken into account.
The rectifier section of the harmonic model is assumed to contain an EMF source of the corresponding frequency; traction loads at harmonics are assumed to be absent due to the relatively high inductive reactance of the electric rolling stock. The amplitudes and frequencies of higher harmonics for the AC and DC subsystems are determined based on the fundamental mode parameters.
The harmonic composition of the line current of the converter model is determined by transforming and summing the harmonics of the input currents, taking into account the asymmetry of the supply network voltages. To obtain the harmonic currents, including the first, the switching times by phase and the switching angle of the next diode are calculated, and the harmonic composition of the current, represented by positive and negative trapezoidal pulses, is calculated. The rise and fall of the pulses are assumed to be quadratic.
The calculation scheme for a DC traction power supply system includes models of step-down and converter transformers with corresponding winding connection diagrams, as well as models of rectifier-inverter converters. A series connection of two models of six-pulse converters allows for the simulation of twelve-pulse circuits.
The steady state equations (SSEs) for a DC segment are formed based on the node potential method. The SSEs of a network containing n nodes are written as follows [31]:
where ; gshk is the shunt conductance to ground at node k; gki is the conductance of the branch between nodes k and i; is the sum of currents of the current sources, which flow into node k , and the products , if there is an electromotive force source at node with a grounded node and conductance gk.
In matrix form, system (1) can be written as follows:
where is the matrix of nodal conductances; is the column vector of nodal voltages; is the column vector of driving currents.
If each equation of system (1) is multiplied by the voltage of the corresponding node, then the following steady state equations can be obtained:
In matrix form, equations (2) can be written as follows:
where is a diagonal matrix, with its k -th diagonal element equal to the voltage of the k -th node; is a column vector of powers at the nodes.
4. Renewable Energy Sources in Traction Power Supply Systems
To increase the reliability of power supply, improve power quality, and reduce energy costs, rail transport is beginning to utilize on-site power generation systems based on renewable energy sources, such as microhydroelectric power plants, wind turbines, and solar power plants [33]. Renewable energy sources can be used in the following areas:
- power supply to facilities located in regions with unstable power supply;
- improving the reliability of power supply to consumers whose outage could have serious consequences;
- power supply to individual facilities with relatively low power.
In the current energy landscape, the challenges of integrating renewable energy into railway power supply systems must be addressed using digital models that account for the following specific factors:
- Power Quality Degradation: Electric rolling stock significantly degrades power quality in non-traction networks, which are the very networks where renewable energy units are typically connected.
- Voltage Fluctuations: The highly variable nature of traction load consumption leads to large voltage fluctuations on the substation busbars that connect renewable energy sources.
- Phase Imbalance: Single-phase traction loads cause significant system imbalance, often exceeding permissible limits.
Typical railway facilities, such as locomotive and wagon depots, consume power on the order of several MVA. Completely replacing grid-based electricity supply with renewable energy sources is difficult. However, their availability makes it possible to reduce energy costs and improve the reliability and power quality. Distributed generation technologies, including those based on renewable energy sources, can be used in railway transport to address the following issues:
- increasing the reliability of power supply to traction substations and non-traction consumers located in regions with insufficient grid development;
- reducing the number of emergency outages for consumers, the disruption of which can lead to significant damage, accidents, and threats to human life;
- implementing a third independent source for a special group of consumers;
- combining railway lines, highways, high-voltage power lines, and telecommunications networks in the implementation of the transport and energy corridor concept;
- significantly reducing energy supply costs;
- radical improvement in the power quality.
The following types of renewable energy sources are used in rail transport: small hydroelectric power plants, wind turbines, and photovoltaic panels.
For small hydroelectric power plants built on rivers, efficient electricity generation is possible under the following conditions:
- a guaranteed water supply, little dependent on season;
- a certain riverbed slope.
To increase the pressure, hydraulic structures are built, which makes it possible to increase the capacity of hydropower plants. Two main methods are used to increase the pressure:
- pressure is created using dams;
- bypass (diversion) canals are constructed in mountainous areas.
The main advantages of small hydropower plants are as follows:
- electricity is generated from a renewable source, which is significantly more stable than solar power plants and wind turbines;
- proximity to the consumer helps reduce energy losses;
- low cost of electricity, given the zero cost of the original fuel.
Furthermore, these units have a minimal negative impact on the environment. Of particular note is their high maneuverability, which is crucial when solving automatic control issues.
A wind turbine converts wind energy into electrical energy. It can operate independently, in conjunction with another energy source, or within the power grid. Wind turbines are divided into two types: horizontal and vertical axis.
Simple wind turbines operate at a constant angular velocity regardless of wind speed, and their generators are directly connected to the electrical grid. These systems typically use asynchronous generators with a squirrel-cage winding or wound rotor. Additional capacitor banks are used for reactive power compensation. The main disadvantages of such systems are as follows:
- uncontrolled reactive power consumption;
- reduced efficiency at wind speeds different from the nominal;
- high mechanical stress;
- transmission of wind speed fluctuations to the electrical grid.
The output power of wind turbines can be controlled using the following principles:
- speed regulation;
- pitch control;
- active speed loss control.
Variable-speed wind turbines are currently the most widely used. They enable optimal output power to be achieved over a wide range of wind speeds by adjusting the rotational speed as the wind speed changes. Typical of this group are generators connected to the grid using frequency converters.
Modern wind turbines employ two basic control concepts:
- Control using a doubly fed asynchronous generator;
- Control using a direct-drive synchronous generator.
The wind turbine control system plays a crucial role. Due to changes in wind speed, the turbine’s mechanical output power continuously changes. Frequency converters are required to connect a synchronous generator operating at variable speed. By completely eliminating the dependence of the generator on the grid, the operation of such wind turbines becomes more flexible. Parameters at the connection point, such as voltage and frequency, can be better adjusted. There are two main types of converter systems used for this purpose:
- Diode rectifiers on the generator side
- Pulse Width Modulation (PWM) inverter on the grid side;
- PWM rectifiers from the generator side and PWM inverter from the network side.
Two additional controllers are used to control frequency converters:
- a maximum power limiting controller;
- a speed limiting controller.
To increase the generated power, individual wind turbines are combined into wind farms, which can be onshore or offshore. The main requirements for wind farm electrical circuits can be formulated as follows:
- fulfillment of operational tasks;
- installation of a minimum number of synchronizing devices.
The use of asynchronous generators eliminates the need for synchronizing devices. However, this entails the need to pay for reactive power consumed from the grid. Reactive power compensation can be used to reduce costs. Compensating devices can be installed on each generator or a group compensation approach can be used. Similar schemes can be used for wound-rotor asynchronous generators with variable slip. Such schemes are equipped with static frequency converters.
For large-capacity wind farms, trunk and mixed wind turbine connection schemes are typically used. The task of developing efficient wind farm schemes is complicated by the fact that wind turbines with different designs and operating principles may be used during expansion or reconstruction of existing wind farms.
Solar energy can be converted into various forms of energy:
- thermal – using collectors for heating buildings and hot water;
- electrical – based on photovoltaic generation;
- chemical – through photocatalysis in a chemical reactor.
Photovoltaic modules are formed by connecting individual converters in series or parallel. Freewheeling diodes are used in the protection system for power consumers when connected in series, and blocking diodes when connected in parallel. There are many variations and industrial developments of photovoltaic cells and their manufacturing methods. However, all photovoltaic cells must meet the following technical requirements:
- be made from chemically highly pure source material with stable properties;
- have minimal cost when produced in large quantities;
- have a service life of at least 20 years under environmental conditions.
The operating temperature of the solar cell can vary between -30 and +200 °C. It must have stable electrical contacts protected from all types of corrosion. The device must be waterproof and designed so that the failure of one element does not lead to the failure of the entire device, which is manufactured as prefabricated modules suitable for transportation to hard-to-reach areas.
For renewable energy installations with alternating current generators, the Fazonord AC-DC PC mathematical models presented below can be used. A renewable energy installation with a generator not equipped with automatic voltage regulation is represented by the following system of nonlinear equations:
where are active and reactive power of the renewable energy installation for phase k (k = A, B, C) of the j-th network node; are active and reactive power of the load connected to phase k of the j-th network node; are network power of phase k of the j-th network node; X is the vector of nodal voltages presented in Cartesian or polar coordinates.
The following system of nonlinear equations corresponds to a renewable energy installation with a generator having automatic voltage regulation:
where are the real and imaginary components of the voltage of phase k (k = A, B, C) for the j-th network node; are the limitations on the reactive power generated by the EGS unit; is the specified modulus of phase k.
For renewable energy sources connected to DC, a model in the form of a graph of generated active power can be used. When connecting renewable energy sources with AC generators to DC traction networks, a model incorporating a controlled rectifier can be used. For connecting DC renewable energy sources, such as solar power plants, to an AC grid, a model incorporating an inverter can be used.
These models can be used to solve the following problems:
- assessing the impact of renewable energy sources on power quality; determining areas of their application in rail transport power supply systems;
- identifying the best locations for renewable energy sources in the traction network;
- analyzing the thermal conditions of step-down and converter transformers.
For a transformer with an ONAF cooling system (forced air circulation and natural oil circulation), the established maximum temperature of the hottest point (HTP) is equal to the sum of the temperature of the cooling medium (air) , the excess temperature of the oil in the upper layers and the temperature difference between the HTP winding θM and the oil in the upper layers θDM:
where K is the ratio of the load current to the rated current; is the ratio of short-circuit losses to no-load losses; is the steady-state value of the temperature rise of the upper layers of oil under rated load, taken to be 55 °C; is the temperature difference between the HTP winding and the oil in the upper layers under rated load, equal to 23 °C; X is the power exponent equal to 0.9 for medium-power transformers, which include railway traction transformers; Y is the winding power exponent equal to 1.6.
In the transient thermal mode, the absolute temperature of the hottest point of the winding during the simulation time interval ∆t is calculated using the following formulas, taking into account the smallness of ∆t compared to the thermal constants of the transformer:
where is the initial rise in oil temperature; is the steady-state rise in oil temperature under the load applied during this time interval; is the oil time constant, equal to 120 min for traction transformers; is the initial rise in the HTP winding temperature over the oil temperature; is the steady-state rise in HTP temperature; is the thermal constant of the winding, the value of which lies within the range from 5 to 10 min.
For a situation with an asymmetrical transformer load, it is advisable to separate the heating of the winding phase and the heating of the upper layers of oil:
where is the ratio of the effective current of the primary winding to the nominal current; is the ratio of the primary winding phase current with the highest current to the rated current.
The effective current determines the oil heating from the different phases of the windings:
For outdoor air-cooled transformers, the actual air temperature is taken as the cooling medium temperature.
5. Modeling Results
The effects of using renewable energy sources were quantitatively assessed through modeling of the TPS (Figure 9) operating modes, in which wind turbines were connected via rectifiers to the 3 kV inlets of each substation. The modeling was performed in the Fazonord AC DC software. The power of wind turbines changed over time according to the graphs shown in Figure 10. The modeling results are presented in Figure 11, Figure 12, Figure 13, Figure 14, Figure 15, Figure 16, Figure 17, Figure 18, Figure 19, Figure 20, Figure 21 and Figure 22 and in Table 1, Table 2, Table 3, Table 4 and Table 5. The nature of the voltage changes on the current collectors of electric locomotives is shown in Figure 11. As seen in the Figures, when the wind turbines are switched on, the voltage supplied to the pantographs increases by 1 to 2.5%.
Figure 11 shows the graphs of relationships between voltage U on the current collectors of electric locomotives and mileposts s of a railway track with the wind turbines switched on. With the turbines switched off, the curves change insignificantly. In this case, the minimum three-minute voltages decrease by 1.5%.
Figure 12 depicts the graphs of relationships between the negative sequence unbalance factors and time t with the wind turbines switched on. With the turbines switched off, the curves remain almost unchanged.
Figure 13a presents the graphs of relationships between active power losses in 110 kV power transmission lines and time t with the wind turbines switched on. Similar graphs with the wind turbines switched off are shown in Figure 13b. The maximum values of are summarized in Table 1. It shows that with the wind turbines in operation, the values of decrease by 4 to 19%. The greatest decrease is observed on transmission line 2.
Figure 14a shows the graphs of relationships between active power flows in 110 kV power transmission line and time t with the wind turbines switched on. Similar graphs with the wind turbines switched off are shown in Figure 14b. The maximum values of are summarized in Table 1. It shows that with the wind turbines in operation, the values of Pmax decrease by 2 to 9%. The greatest decrease is observed on transmission line 2.
Figure 15a shows the graphs of relationships between total active power losses in 110/10 kV step-down transformers and time t with the wind turbines switched on. The graphs of copper losses are presented in Figure 15b. The maximum values of and are given in Table 2. As seen in the Table, with the wind turbines in operation, the values of decrease by 2 to 8%. The greatest decrease is observed at traction substation (TS) 1.
Figure 17a presents the graphs of relationships between total active power losses in 10/3 kV converter transformers and time t with the wind turbines switched on. The graphs of copper losses are shown in Figure 17b. The maximum values of and are given in Table 3. As seen in the Table, with the wind turbines in operation, the values of decrease by 2 to 11%. The greatest decrease is observed at TS 1 and TS 2.
The graphs of and with the wind turbines switched off are shown in Figure 18.
Figure 19a demonstrates the graphs of relationships between the hot spot temperatures of 110/10 kV step-down transformers and time t with the wind turbines switched on. Similar graphs for converter transformers are shown in Figure 19b. The maximum values of are given in Table 4. As seen in the Table, with wind turbines in operation, the values of decrease by 1 to 3%. No decrease in is observed on step-down transformers of TS 1.
Figure 20, Figure 21 and Figure 22 present the results of identifying non-sinusoidal conditions. Figure 20 shows the graphs of relationships 
with the wind turbines switched on and off. The maximum and average values of kU are given in Table 5. The presented materials demonstrate that the harmonic distortion levels on the 110 kV buses exceed the maximum permissible values. When the wind turbines are switched on, the maximum values of increase by a factor of 1.08, while the average values decrease by 3%. The values of can be reduced by using active and passive filters of harmonic components [34].
6. Conclusions
The paper presents an original methodology for the comprehensive modeling of traction power supply systems for mainline DC railways that incorporate renewable energy sources, specifically wind turbines, into their traction networks. The methodology is implemented in the Fazonord AC-DC software package. The digital data generated on its basis characterize the dynamics of changes in the electrical parameters of the traction power supply systems as trains operate along real-world routes. Furthermore, this methodology can be used to determine indicators related to the thermal conditions of step-down and converter transformers. Analysis of the results reveals that the use of wind turbines can improve the energy efficiency of transportation processes, leading to a reduction in power transmission line flows by 2–9% and a decrease in line losses by 4–19%. Maximum active power losses in step-down transformers are reduced by 2–8%, while those in converter transformers see a decline of 2–11%. The operation of wind turbines does not have a noticeable effect on the indicators characterizing power quality in the 110 kV supply network.
The proposed methodology is of practical value for projects aimed at integrating renewable energy sources into DC traction power supply systems. The developed models are versatile and can be adapted to various traction network designs, including advanced high-voltage systems.
Author Contributions
Conceptualization, I.I, Andrey Kryukov, K.S., A.C., Aleksandr Kryukov, I.B., Y.V. and H.B.; methodology, Andrey Kryukov, K.S., A.C., and Aleksandr Kryukov; software, Andrey Kryukov, A.C., and Aleksandr Kryukov; validation, I.I., Andrey Kryukov, K.S., H.B., and Y.V.; formal analysis, I.I, Andrey Kryukov, A.C., I.B., and H.B. ; investigation, Andrey Kryukov, K.S., A.C., Aleksandr Kryukov, I.B., and H.B.; resources, I.I, I.B., and K.S.; data curation, Andrey Kryukov, K.S., A.C., and Aleksandr Kryukov,; writing—original draft preparation, I.I, Andrey Kryukov, K.S., A.C., Aleksandr Kryukov, I.B., Y.V. and H.B.; writing—review and editing, I.I, Andrey Kryukov, K.S., A.C., Aleksandr Kryukov, I.B., Y.V. and H.B.; visualization, Andrey Kryukov, K.S., A.C., Aleksandr Kryukov,; supervision, Andrey Kryukov and H.B.; project administration, K.S., I.B., I.I., and Y.V.; funding acquisition, K.S., I.I., I.B. and H.B. All authors have read and agreed to the published version of the manuscript.
Funding
This study is financed by the European Union-NextGenerationEU, through the National Recovery and Resilience Plan of the Republic of Bulgaria, project № BG-RRP-2.013-0001-C01.
Data Availability Statement
The original contributions presented in this study are included in the article. Further inquiries can be directed to the corresponding authors.
Conflicts of Interest
The funders had no role in the design of the study; in the collection, analyses, or interpretation of data; in the writing of the manuscript, or in the decision to publish the results.
References
- Tian, Z., Kano, N., Hillmansen, S. Integration of Energy Storage and Renewable Energy Sources into AC Railway System to Reduce Carbon Emission and Energy Cost. Proc. of 2020 IEEE Vehicle Power and Propulsion Conference (VPPC). 2020.
- D’Arco, S., Piegari, L., Tricoli, P. Comparative Analysis of Topologies to Integrate Photovoltaic Sources in the Feeder Stations of AC Railways. IEEE Transactions on Transportation Electrification. 2018, Vol.4, Issue 4. [CrossRef]
- Di Noia, L.P., Rizzo, R. Analysis of Integration of PV Power Plant in Railway Power Systems. 2019 8th International Conference on Modern Power Systems (MPS). 2019.
- Wu, C., Han, B., Lu, S., Xue, F., Zhong, F. Carbon-reducing Train Rescheduling Method for Urban Railway Systems considering the Grid with Wind Power Supply. Proc. of 2022 IEEE 25th International Conference on Intelligent Transportation Systems (ITSC). 2022.
- Rageh, M., Ndtoungou, A., Hamadi, A., Al-Haddad, K. Railway Traction Supply with PV integration for Power Quality Issues. Proc. of IECON 2018 - 44th Annual Conference of the IEEE Industrial Electronics Society. 2018.
- Yu, H., Wang,Y., Chen, Z. A Renewable Electricity-Hydrogen-Integrated Hybrid DC Traction Power System. Proc. of 2021 IEEE Southern Power Electronics Conference (SPEC). 2021.
- Singh, L., Vaishnav, C., Shrivastava, V. Performance Analysis of Hybrid Network of Indian Traction Power System Using Renewable Energy Sources. Proc. of 2016 International Conference on Micro-Electronics and Telecommunication Engineering (ICMETE). 2016 .
- Bade, S.K., Kulkarni, V. Use of Renewable energy in performance enhancement of Indian Traction Power Supply System. Proc. of 2018 International Conference on Smart Electric Drives and Power System (ICSEDPS). 2018.
- Bade, S.K., Kulkarni, V. Analysis of Railway Traction Power System Using Renewable Energy: A Review. 2018 International Conference on Computation of Power, Energy, Information and Communication (ICCPEIC). 2018.
- Dong, H., Tian, Z., Spencer, J.W. Fletcher, D., Fang, L. Control Strategy and Analysis of Railway Traction System with Energy Storage System and Renewable Energy Source. Proc. of 2022 3rd International Conference on Advanced Electrical and Energy Systems (AEES).2022.
- Kuznetsov, V., Kuznetsov, V., Bondar, O., Rojek, A., Hubskyi, P., Stypulkowski, P. Study of Short Circuit Currents in a Distributed Traction Power Supply System with Renewable Electric Power Sources. Proc. of 2022 IEEE 3rd KhPI Week on Advanced Technology (KhPIWeek).
- Bakre, S., Gokhale,P. Neural Network Based Source Selection Scheme for Wind-solar Based Auxiliary Supply in Railway Traction Systems. Proc. of 2020 IEEE Pune Section International Conference (PuneCon). 2020.
- Cheng, P., Kong, H., Ma, J., Jia, L. Overview of resilient traction power supply systems in railways with interconnected microgrid. CSEE Journal of Power and Energy Systems. 2021. Volume: 7. Issue: 5.
- Dong, H., Tian, Z., Spencer, J.W. Fletcher, D., Hajiabady, S. Coordinated Control Strategy of Railway Multisource Traction System With Energy Storage and Renewable Energy. IEEE Transactions on Intelligent Transportation Systems. 2023, Volume: 24, Issue: 12. [CrossRef]
- Li, W., Xie, S., Wang, H. An Assessment Method of Negative Sequences Aiming at the Continuous Co-Phase Traction Power Supply System. Proc. of 2024 7th International Conference on Renewable Energy and Power Engineering (REPE).2024. Publisher IEEE.
- Guo, Q., Wang, X., Tu, C., Che, L., Xiao, F., Hou, Y. A Multitimescale Energy Management Strategy for Advanced Cophase Traction Power Supply System With PV and ES. IEEE Transactions on Transportation Electrification. 2025. Volume: 11. Issue: 1. [CrossRef]
- Kano, N., Tian, Z., Chinomi, N., Wei, X., Hillmansen, S. Renewable Sources and Energy Storage Optimization to Minimize the Global Costs of Railways. IEEE Transactions on Vehicular Technology. 2023. [CrossRef]
- Ayad, M.Y., Becherif, M., Henni, A., Aboubou, A., Benaouadj, M. Design and realization of hybrid source using solar panel, wind generator and supercapacitors for train traction. Proc. of 11th International Conference on Electrical Power Quality and Utilisation. 2011.
- Lian, J., Dai, C., Yao, Z., Hu, H., Chen, W., Wang, C. A Novel Interphase-Bridging Single-Phase Inverter for Photovoltaic and Energy Storage Connected to Railway Traction Power Supply System. IEEE Transactions on Transportation Electrification. 2025. Volume: 11. Issue: 1. [CrossRef]
- Jia, Z., Yang, Z., Lin, F., Fang, X. Dynamic simulation of the DC traction power system considering energy storage devices. Proc. of 2014 IEEE Conference and Expo Transportation Electrification Asia-Pacific (ITEC Asia-Pacific). 2014.
- Wan, Y., Wang, Y., Han, P., He, X., Chen, Z. Renewable Microgrid Technology for Electrified Transportation: A Review. Proc. of 2024 13th International Conference on Renewable Energy Research and Applications (ICRERA).2024.
- Jia, L., Ma, J., Cheng, P., Liu Y. A perspective on solar energy-powered road and rail transportation in China. CSEE Journal of Power and Energy Systems. 2020, Volume: 6, Issue: 4.
- Çiçek, A., Şengör, I., Güner, S., Karakuş, F., Erenoğlu, A.K., Erdinç, O., Shafie-Khah, M., João, P. S. Integrated Rail System and EV Parking Lot Operation With Regenerative Braking Energy, Energy Storage System and PV Availability. Catalão IEEE Transactions on Smart Grid 2022. Volume: 13. Issue: 4. [CrossRef]
- van Duijsen, P.J., Zuidervliet, D.C. Distribution Of Renewable Energy In Light-Rail Traction Grids. Proc. of 2022 International Symposium on Electronics and Telecommunications (ISETC) 2022.
- Nale, R.S., Jadhav, T.T., Chobe, P.S., Pardeshi, D.B.. Solar Rails: Advancements in Renewable Energy for Transportation. Proc. of 2024 4th Asian Conference on Innovation in Technology (ASIANCON) 2024.
- Khan, M.M., Khan, I., Rauf, M., Ullah, I., Aatif, S., Al Bayati, M.M.. Electrified Transportation in Smart Cities: Optimal Utilization of PV for Electrified Railways and EV Charging Station. Proc. of 2024 International Conference on IT and Industrial Technologies (ICIT). 2024.
- Kilic, B., Dursun, E. Integration of innovative photovoltaic technology to the railway trains: A case study for Istanbul airport-M1 light metro line. Proc. of IEEE EUROCON 2017 -17th International Conference on Smart Technologies.2017.
- Dekeda, B., Adonis, M. The Case for Integration of Renewables in Rail Freight Yards in South Africa Proc. of 2019 International Conference on the Domestic Use of Energy (DUE) 2019.
- Zakaryukin V. P., Kryukov A. V. Complex asymmetric modes of electrical systems. Irkutsk: Irkutsk University. 2005. 273 p.
- Suslov, K., Kryukov, A., Ilyushin, P., Kryukov, A., Shepovalova, O. Modeling of modes of traction power supply systems equipped with renewable energy sources. Energy Reports, 2023, 9, pp. 447–461.
- Iliev, I., Kryukov, A., Bulatov, Y., Suslov, K., Beloev, I., Valeeva, Y. Methods for ensuring stability of operating conditions of an electric power system with distributed generation plants. International Journal of Power Electronics and Drive Systems, 2025, 16(1), pp.138–150. [CrossRef]
- Bulatov, Y.N., Cherepanov, A.V., Kryukov, A.V., Suslov, K. Distributed Generation in Railroad Power Supply Systems. Proc. of 2020 3rd International Colloquium on Intelligent Grid Metrology, SMAGRIMET 2020, pp. 54–60, 9264013. [CrossRef]
- Smirnov, A.S., Solonina, N.N., Suslov, K.V. Separate measurement of fundamental and high harmonic energy at consumer inlet - A way to enhancement of electricity use efficiency. Proc. of 2010 International Conference on Power System Technology Technological Innovations Making Power Grid Smarter Powercon2010, 2010, 5666617.
- Iliev, I.K., Kryukov, A.V., Suslov, K.V., Cherepanov, A.V., Hieu, N.Q., Beloev, I.H., Valeeva, Y.S. Modeling the Operating Conditions of Electric Power Systems Feeding DC and AC Traction Substations. Energies, 2024, 17(18), 4692. [CrossRef]
Figure 1.
LEC of a two-wire power transmission line.
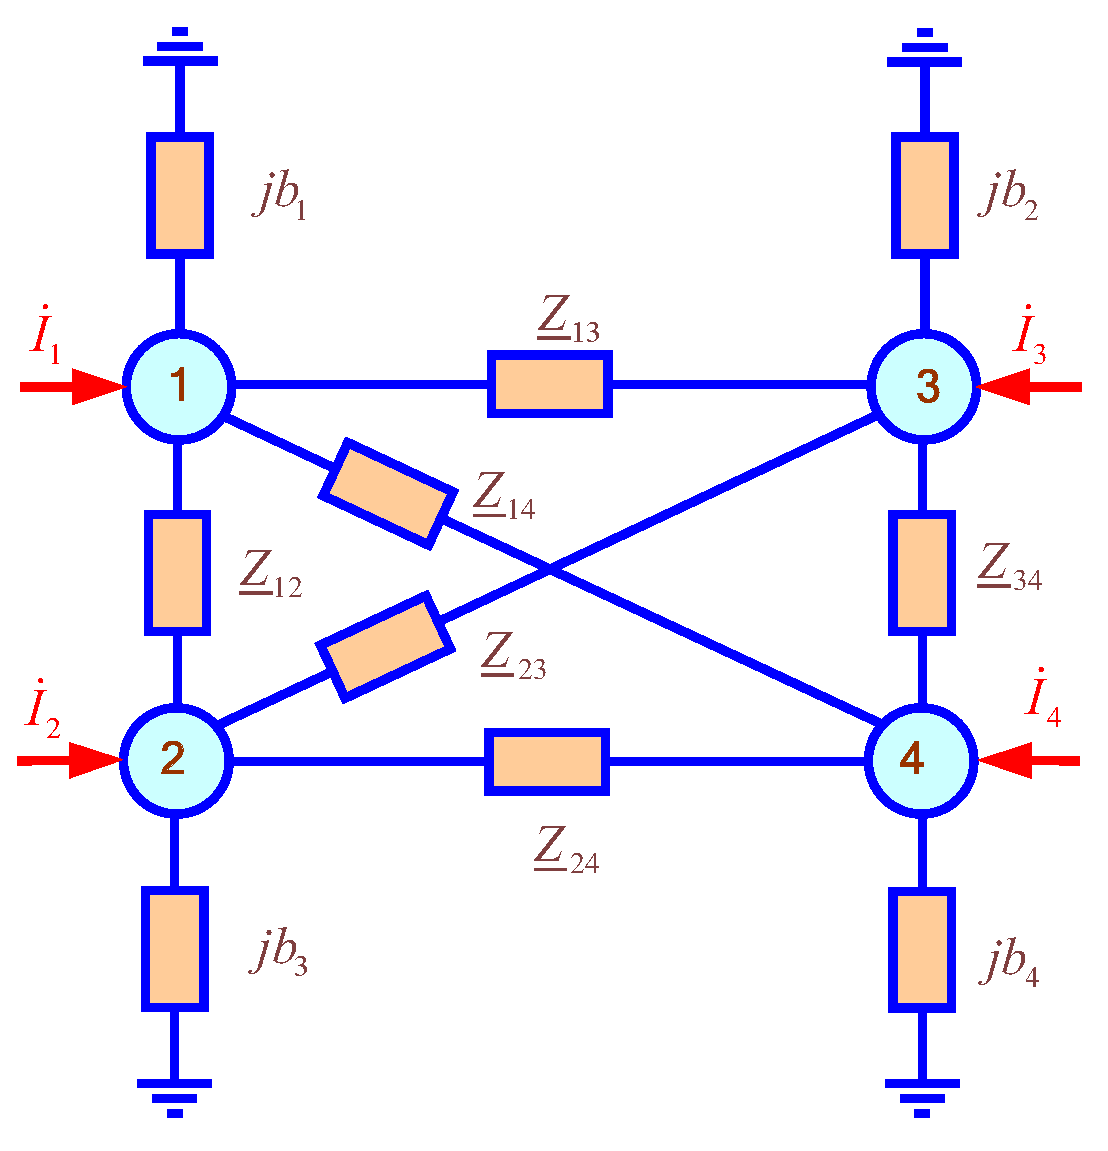
Figure 2.
LEC of a a two-winding transformer.
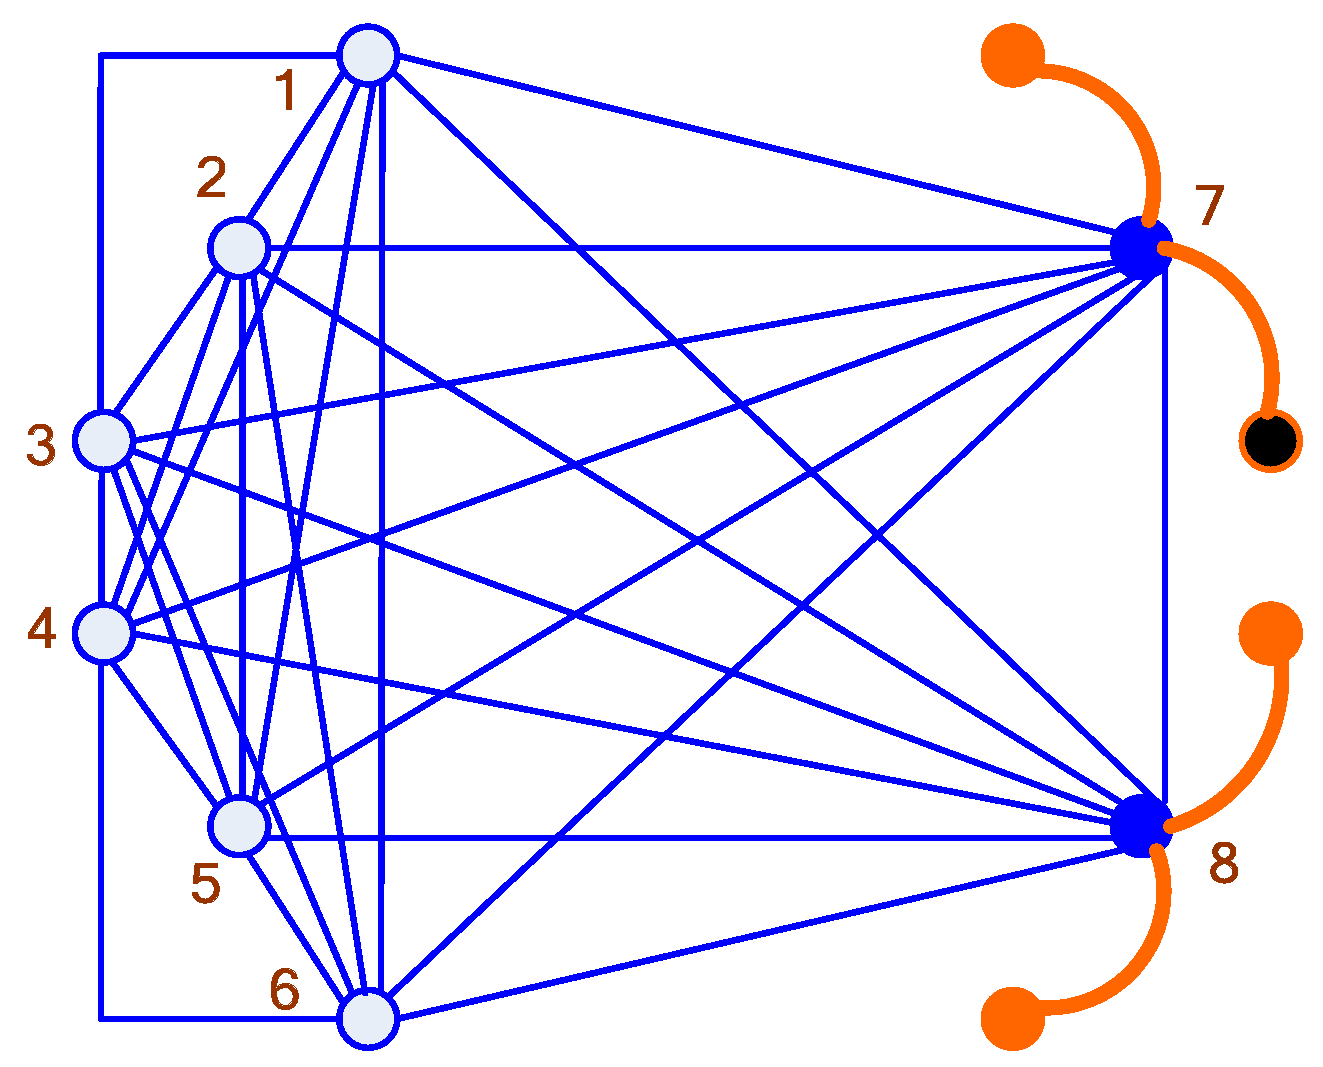
Figure 3.
A group of problems solved in the Fazonord software.
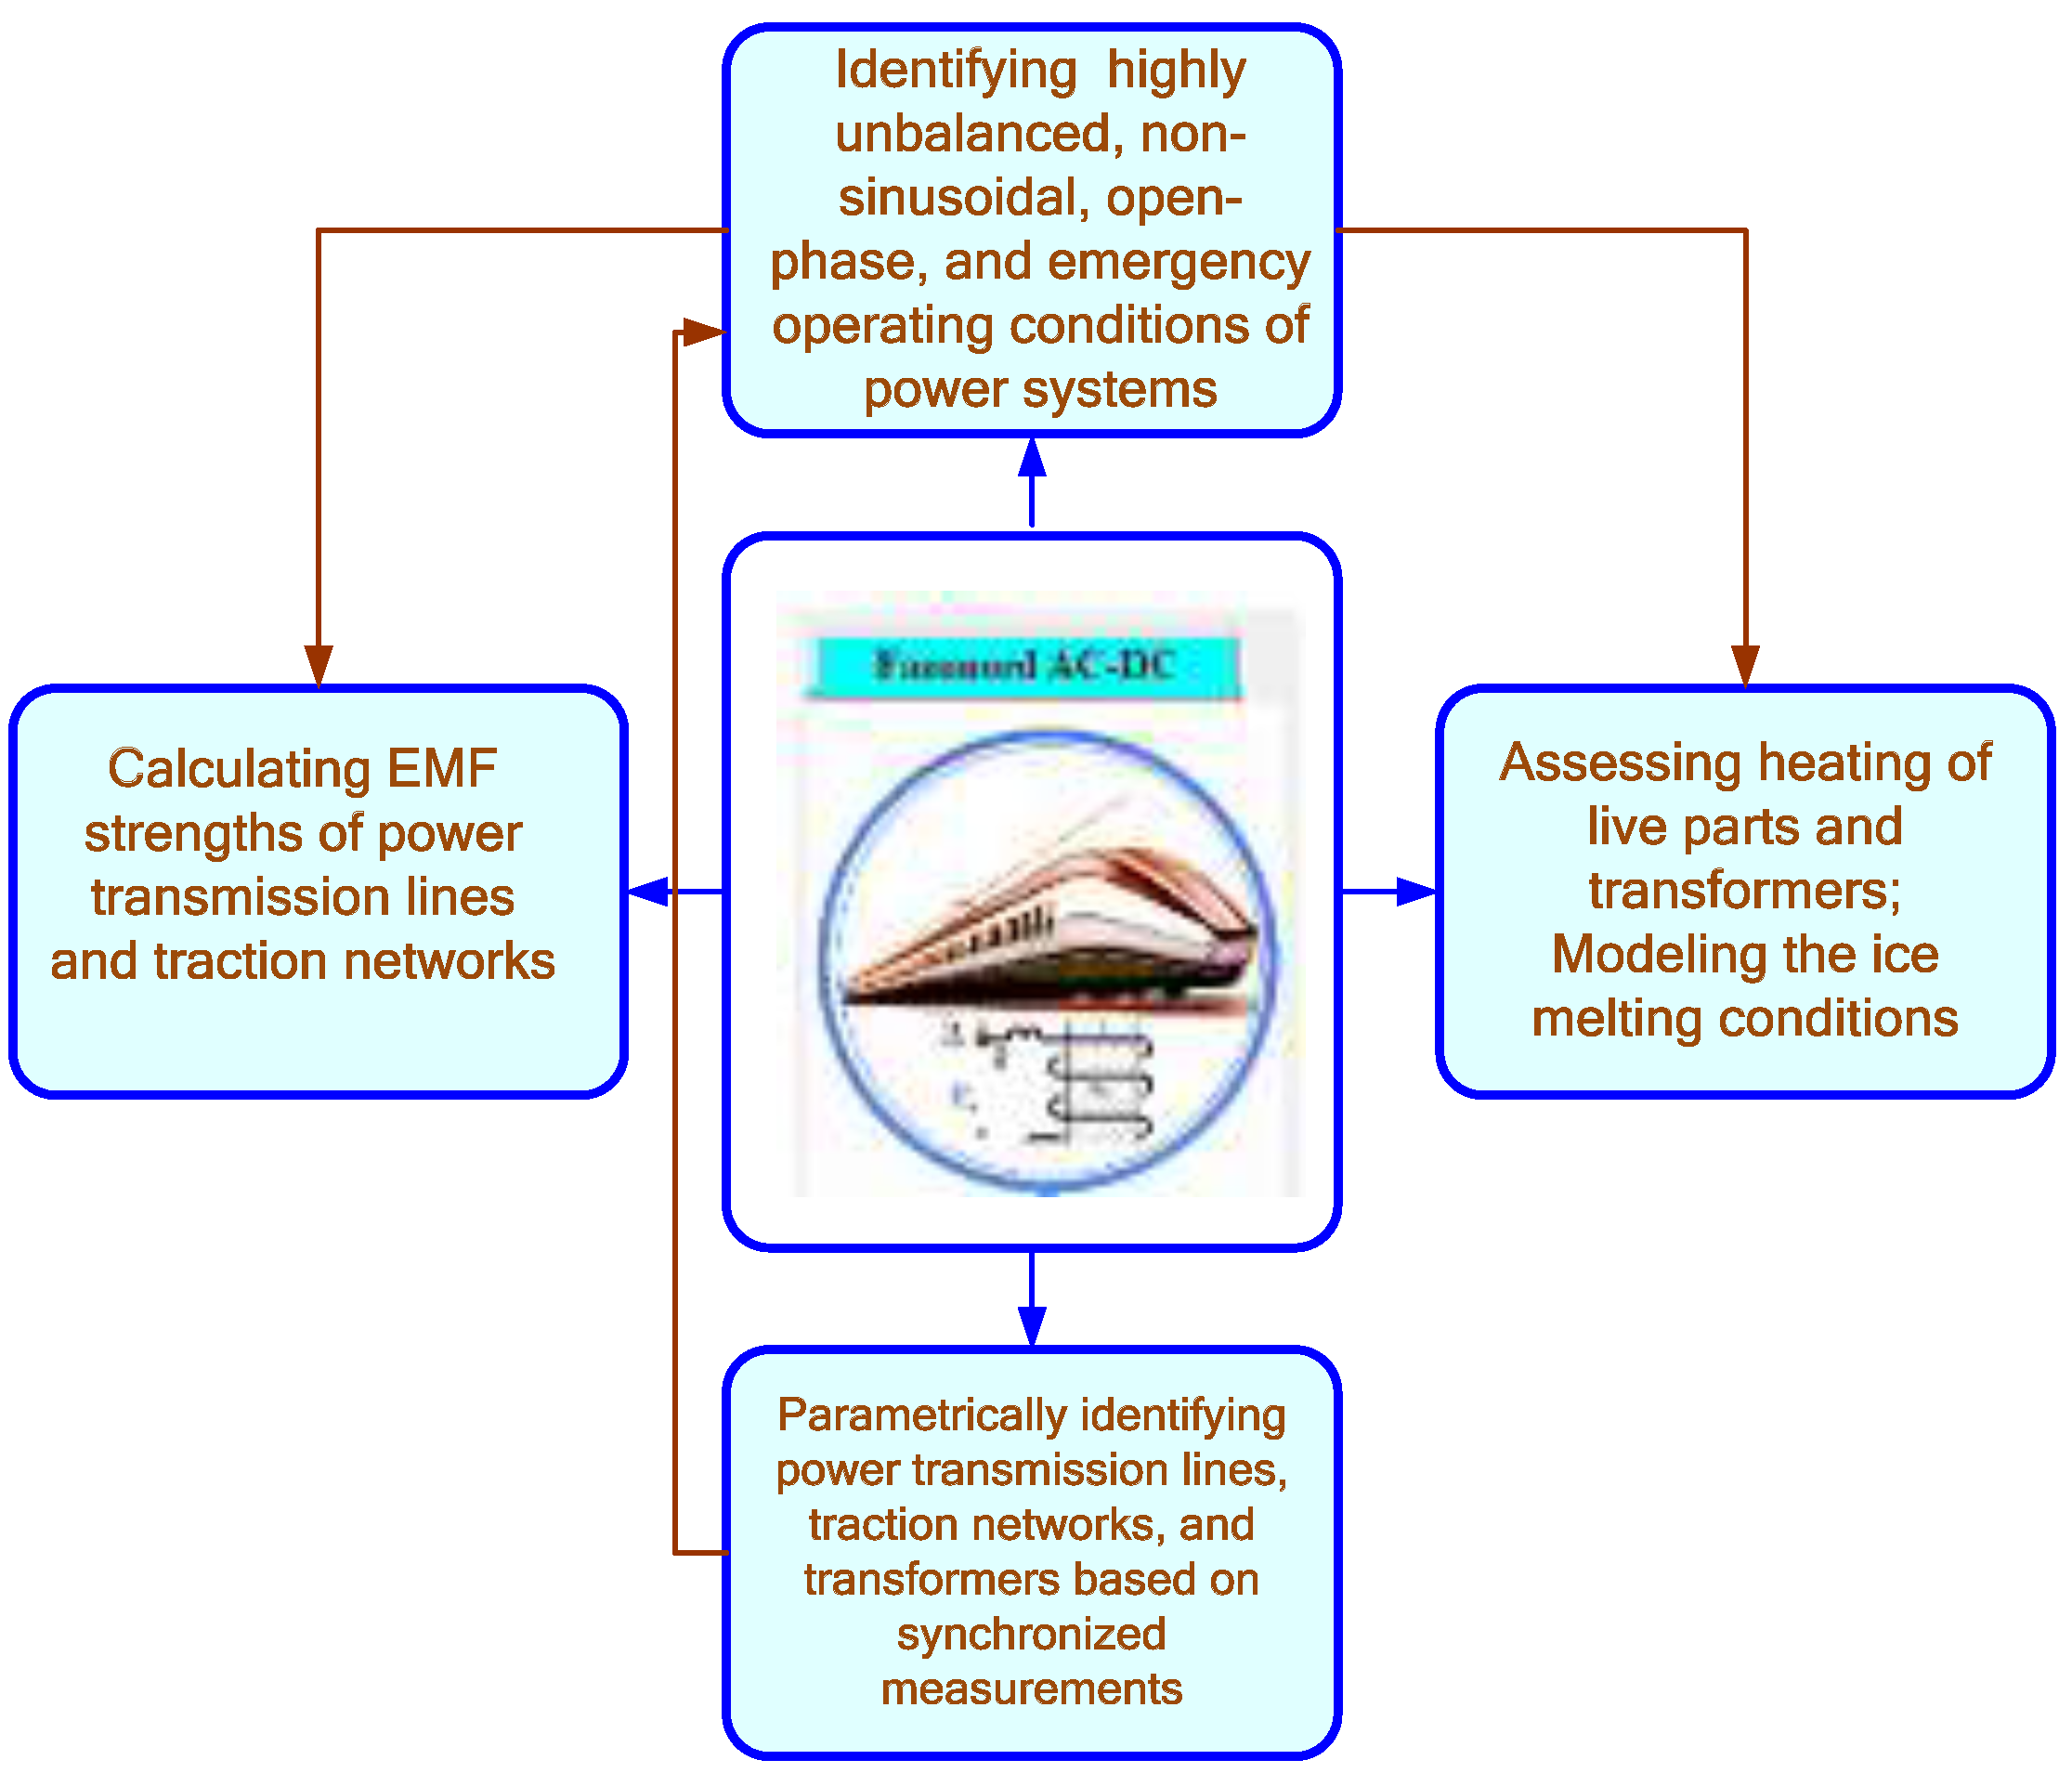
Figure 4.
Modeled power transmission lines.
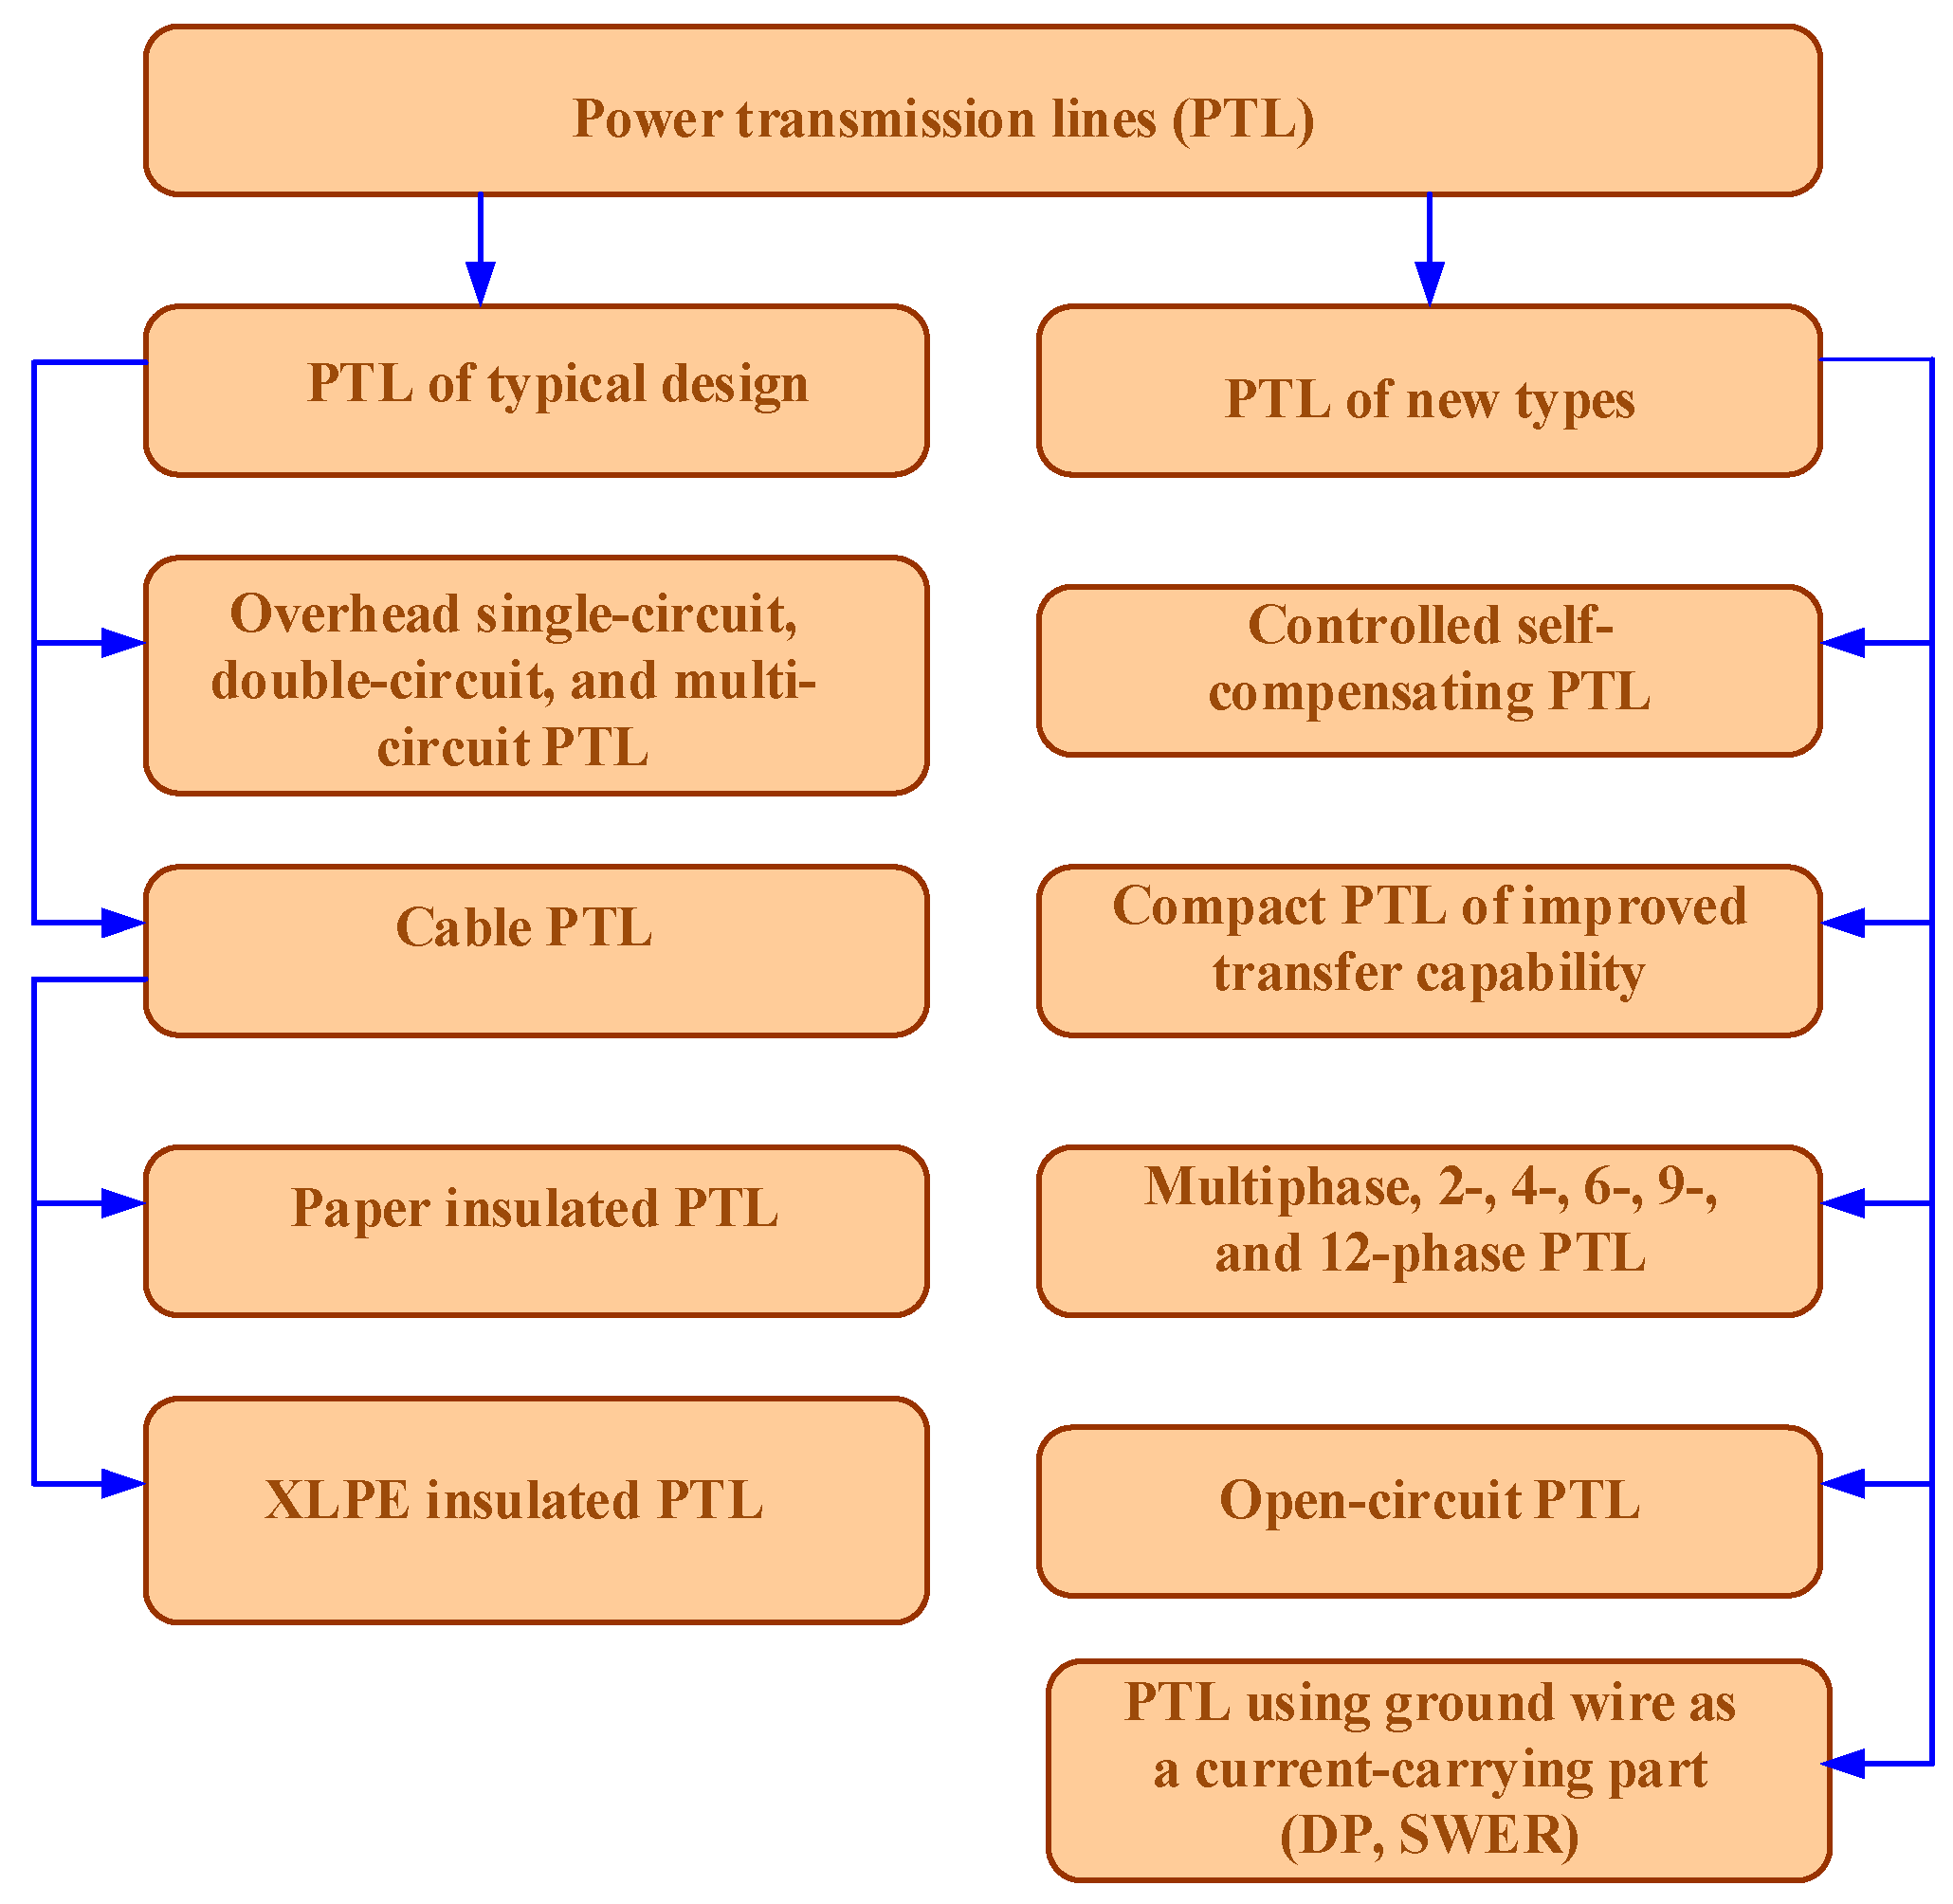
Figure 5.
Power transmission lines of railway transport.
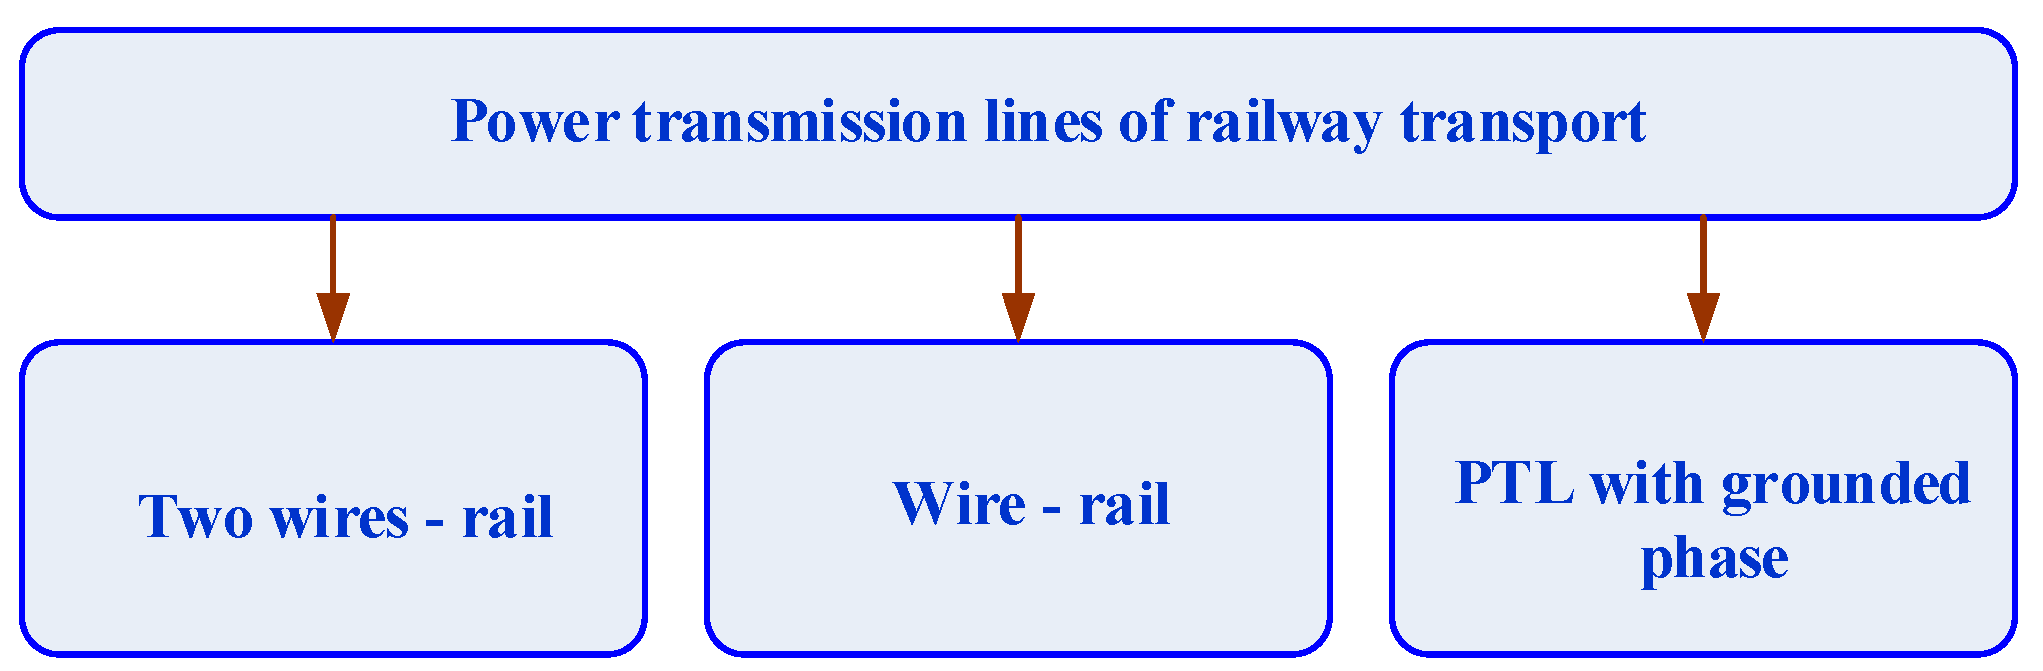
Figure 6.
Rectifier-inverter units.
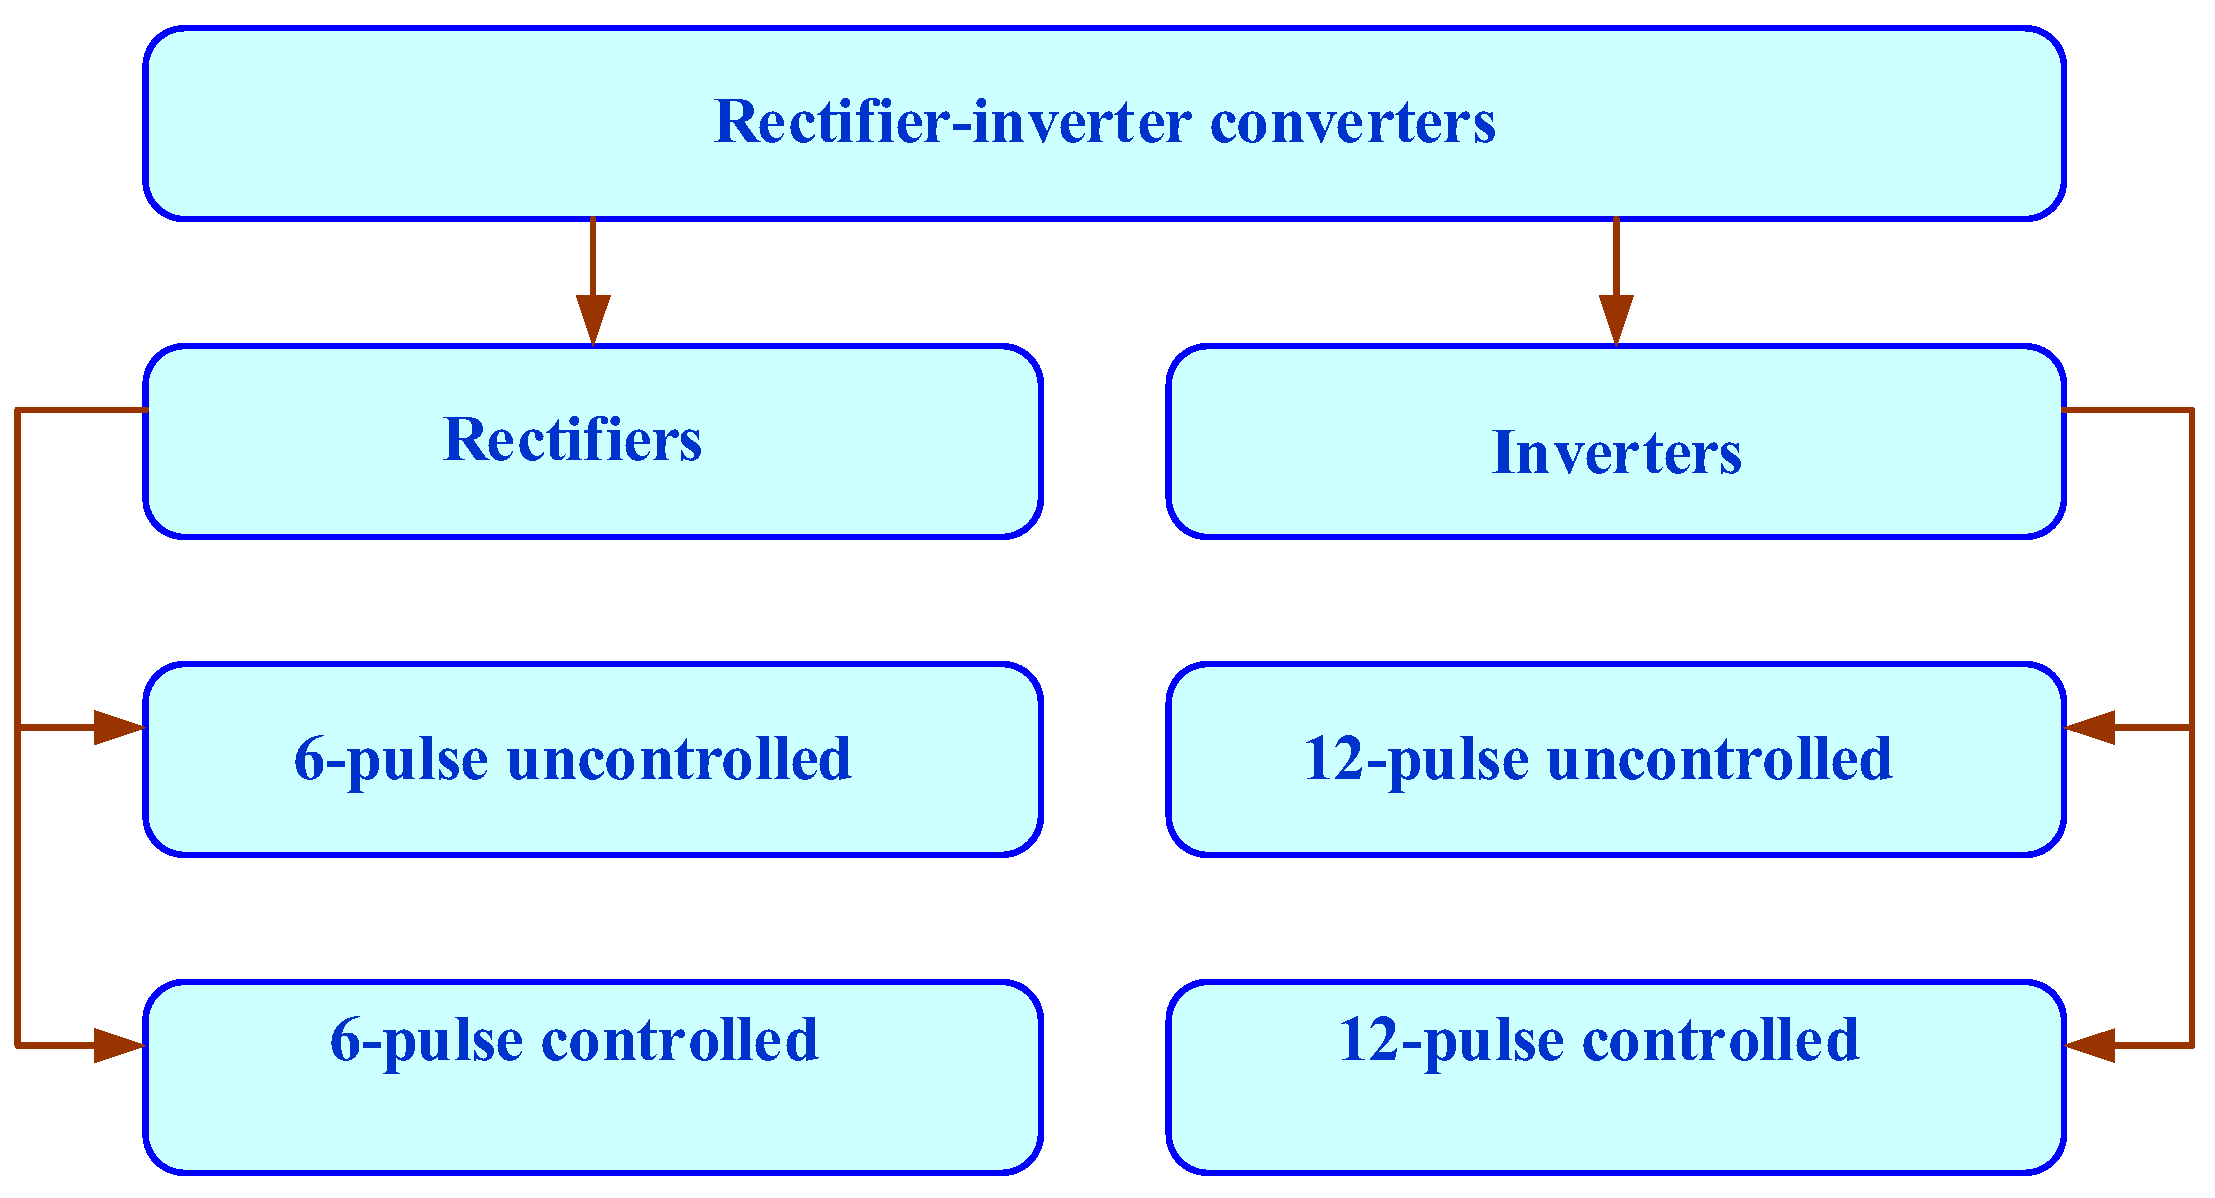
Figure 7.
Power and instrument transformers.
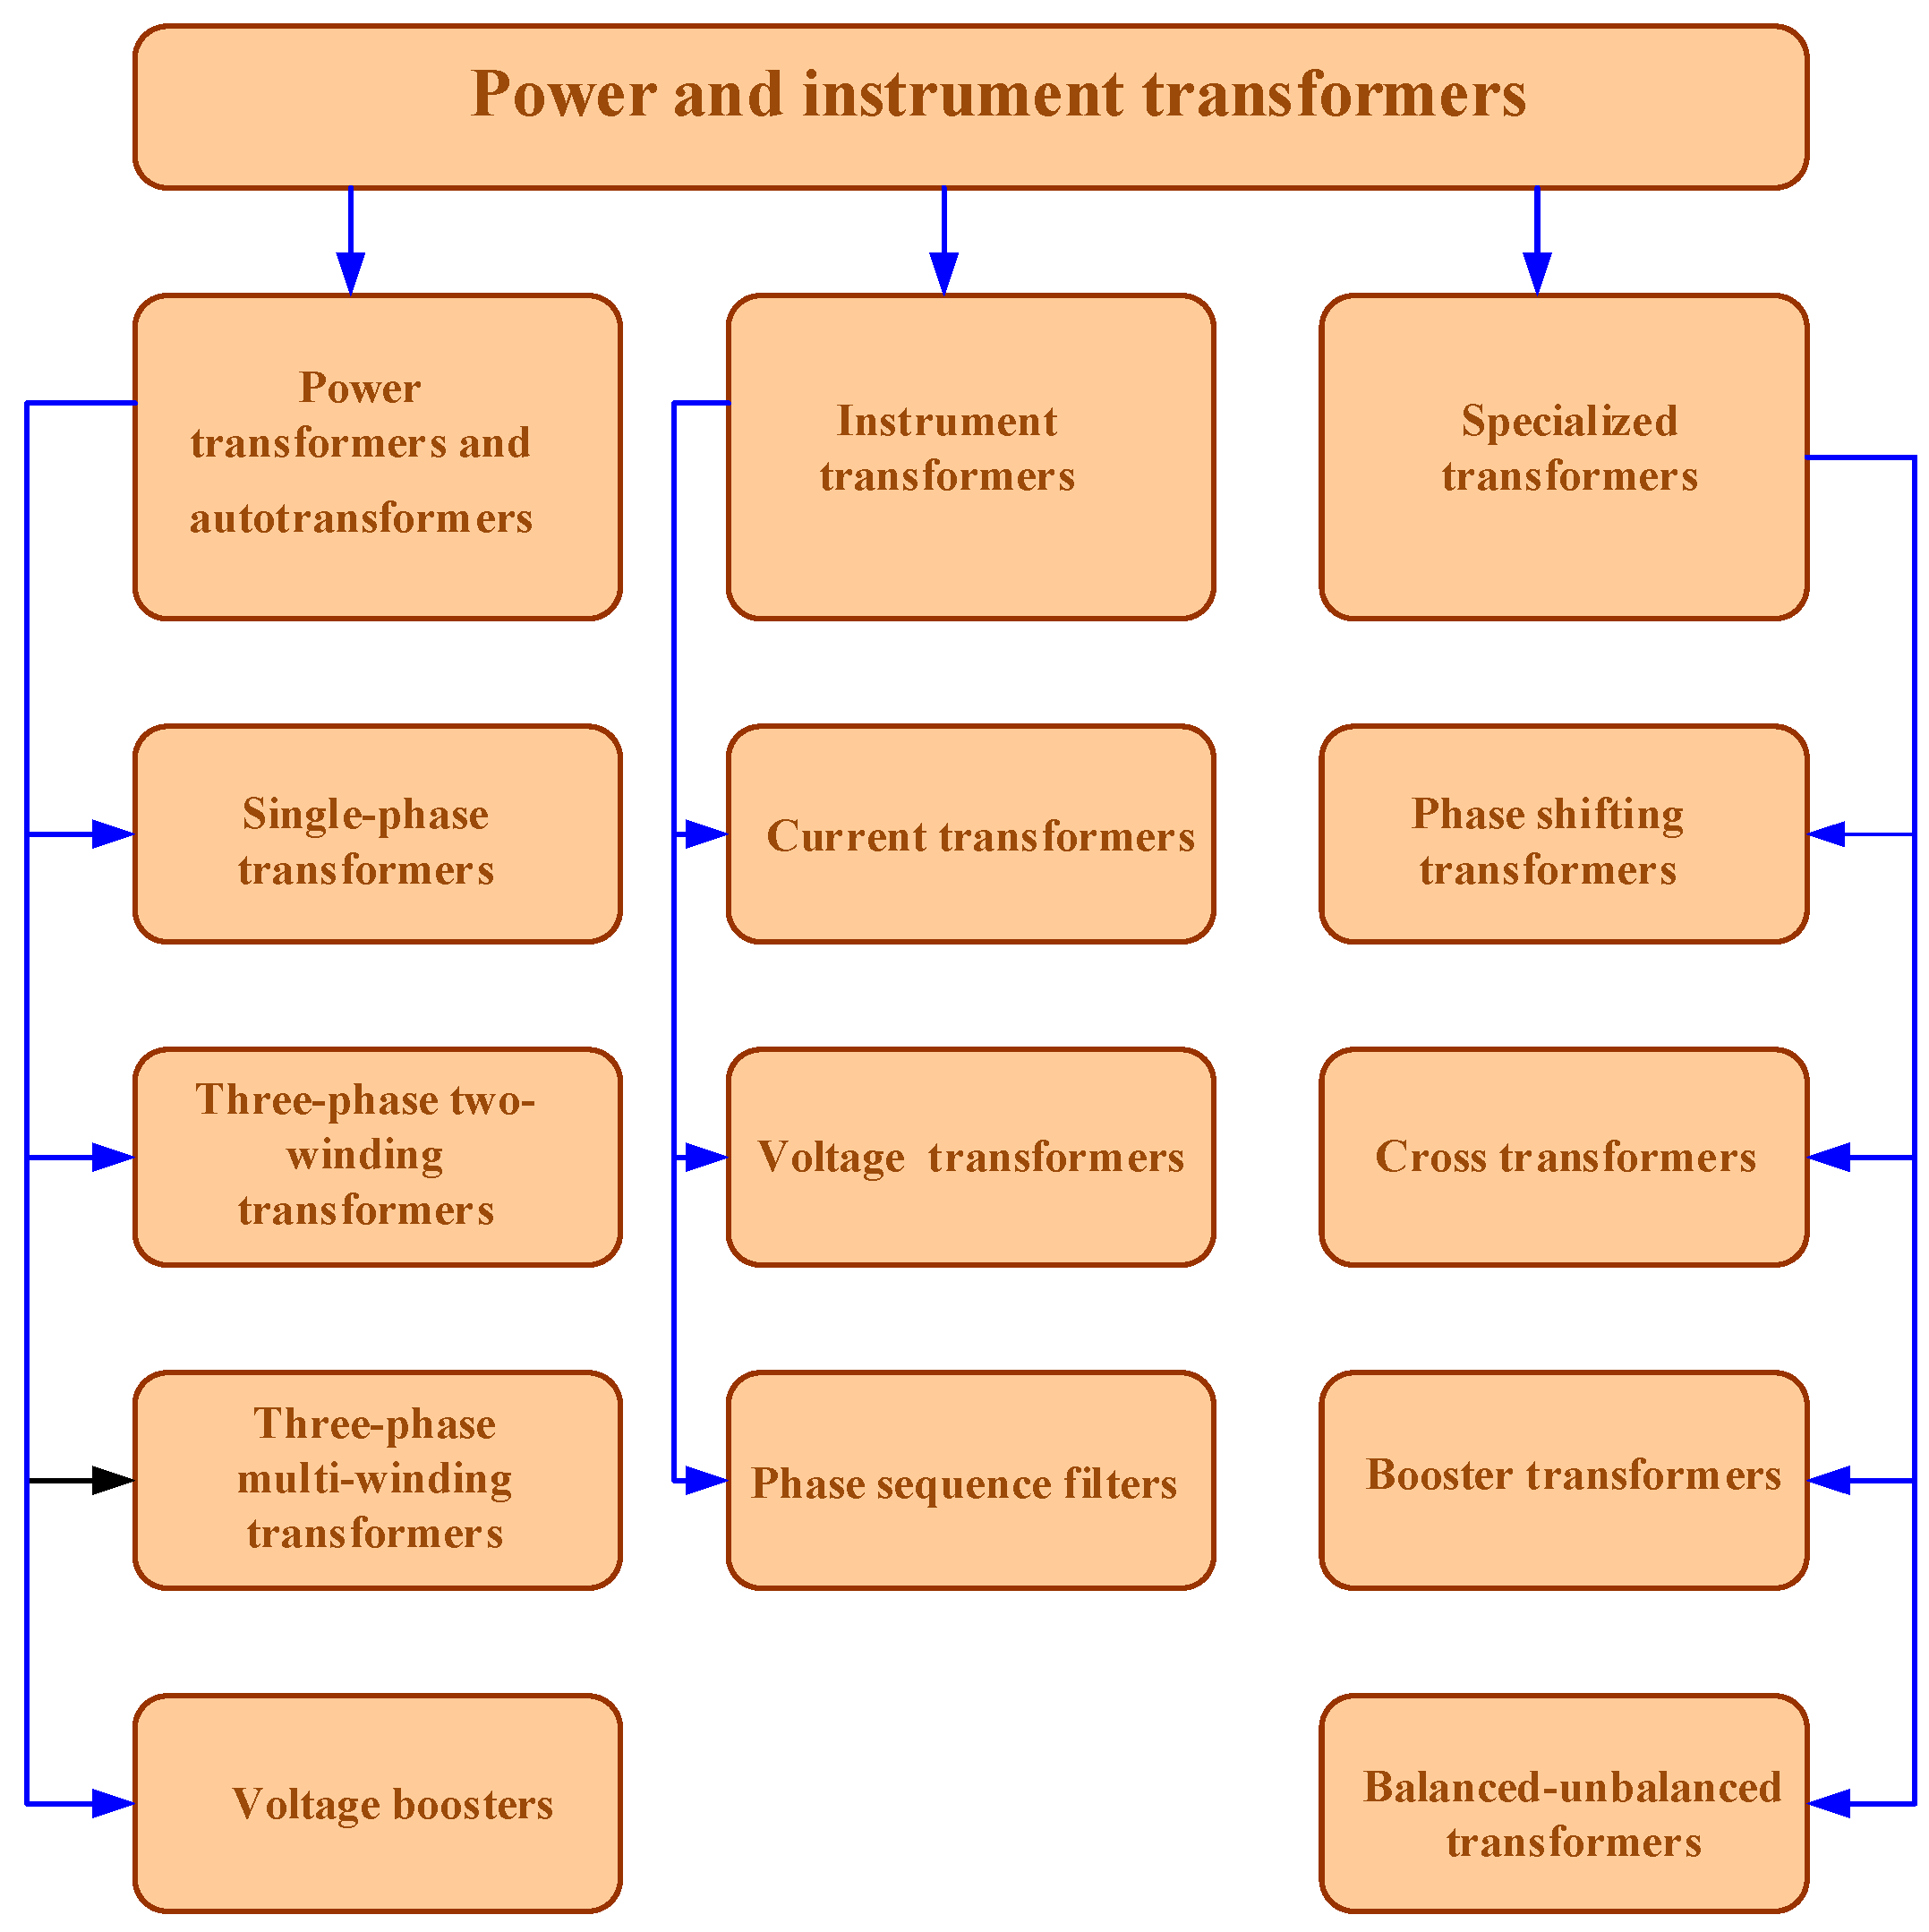
Figure 8.
Active components of smart grid.
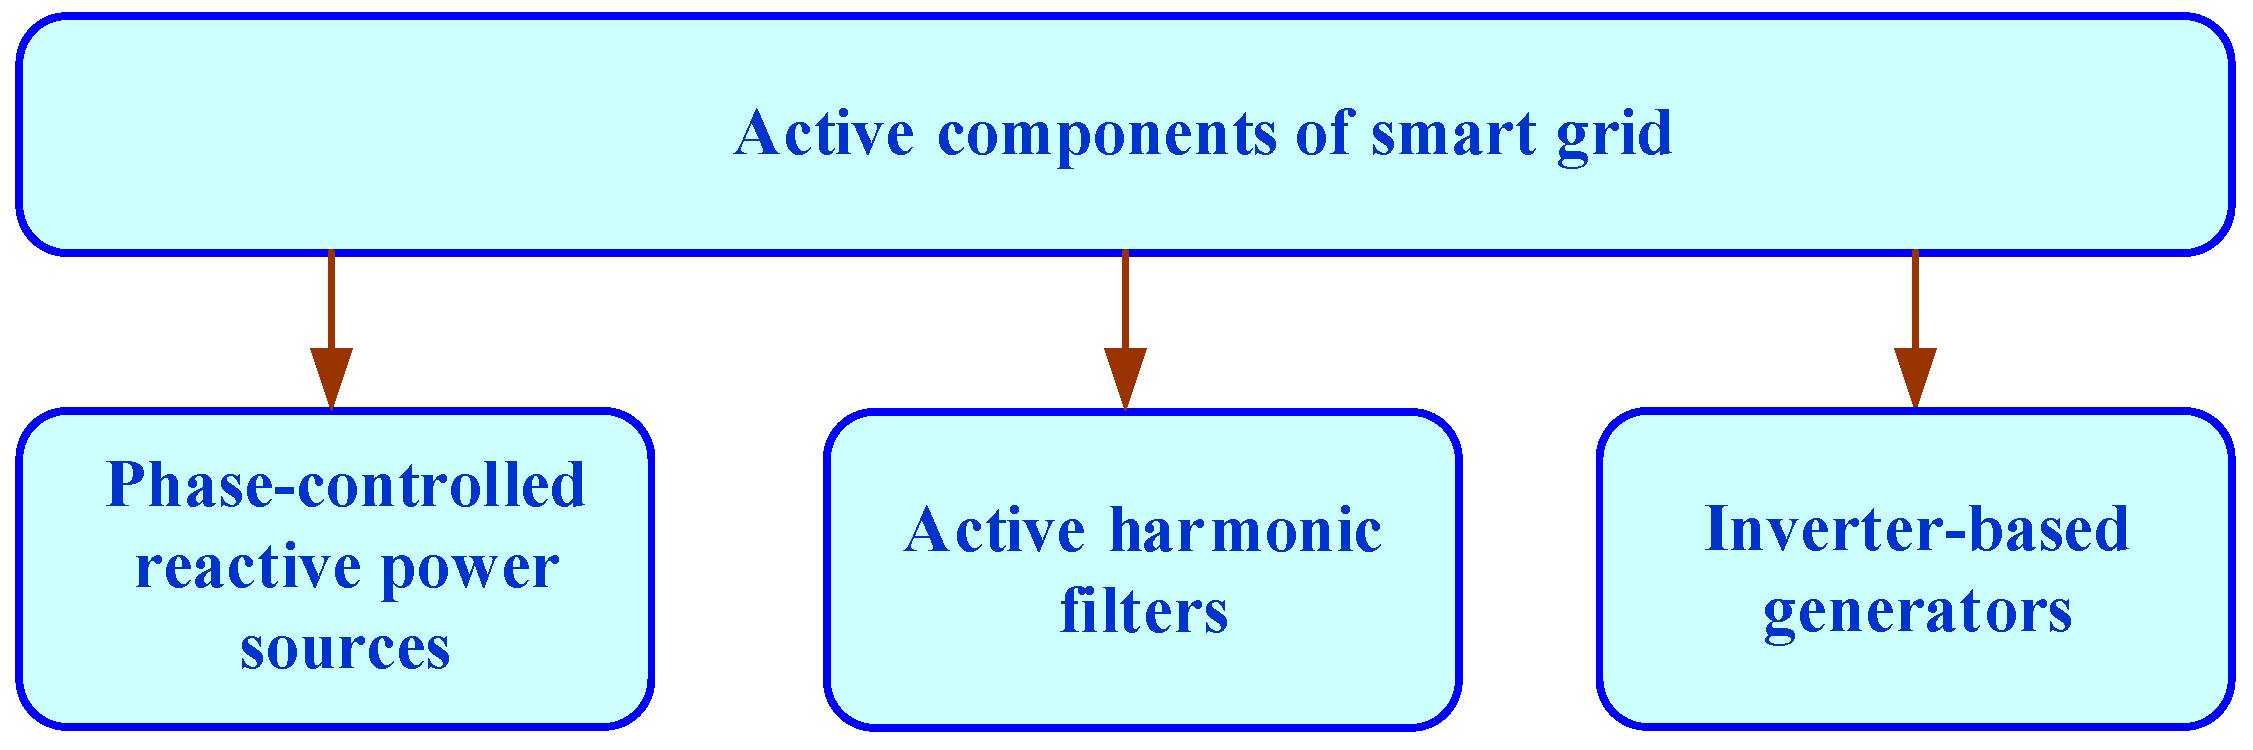
Figure 9.
Traction power system diagram.
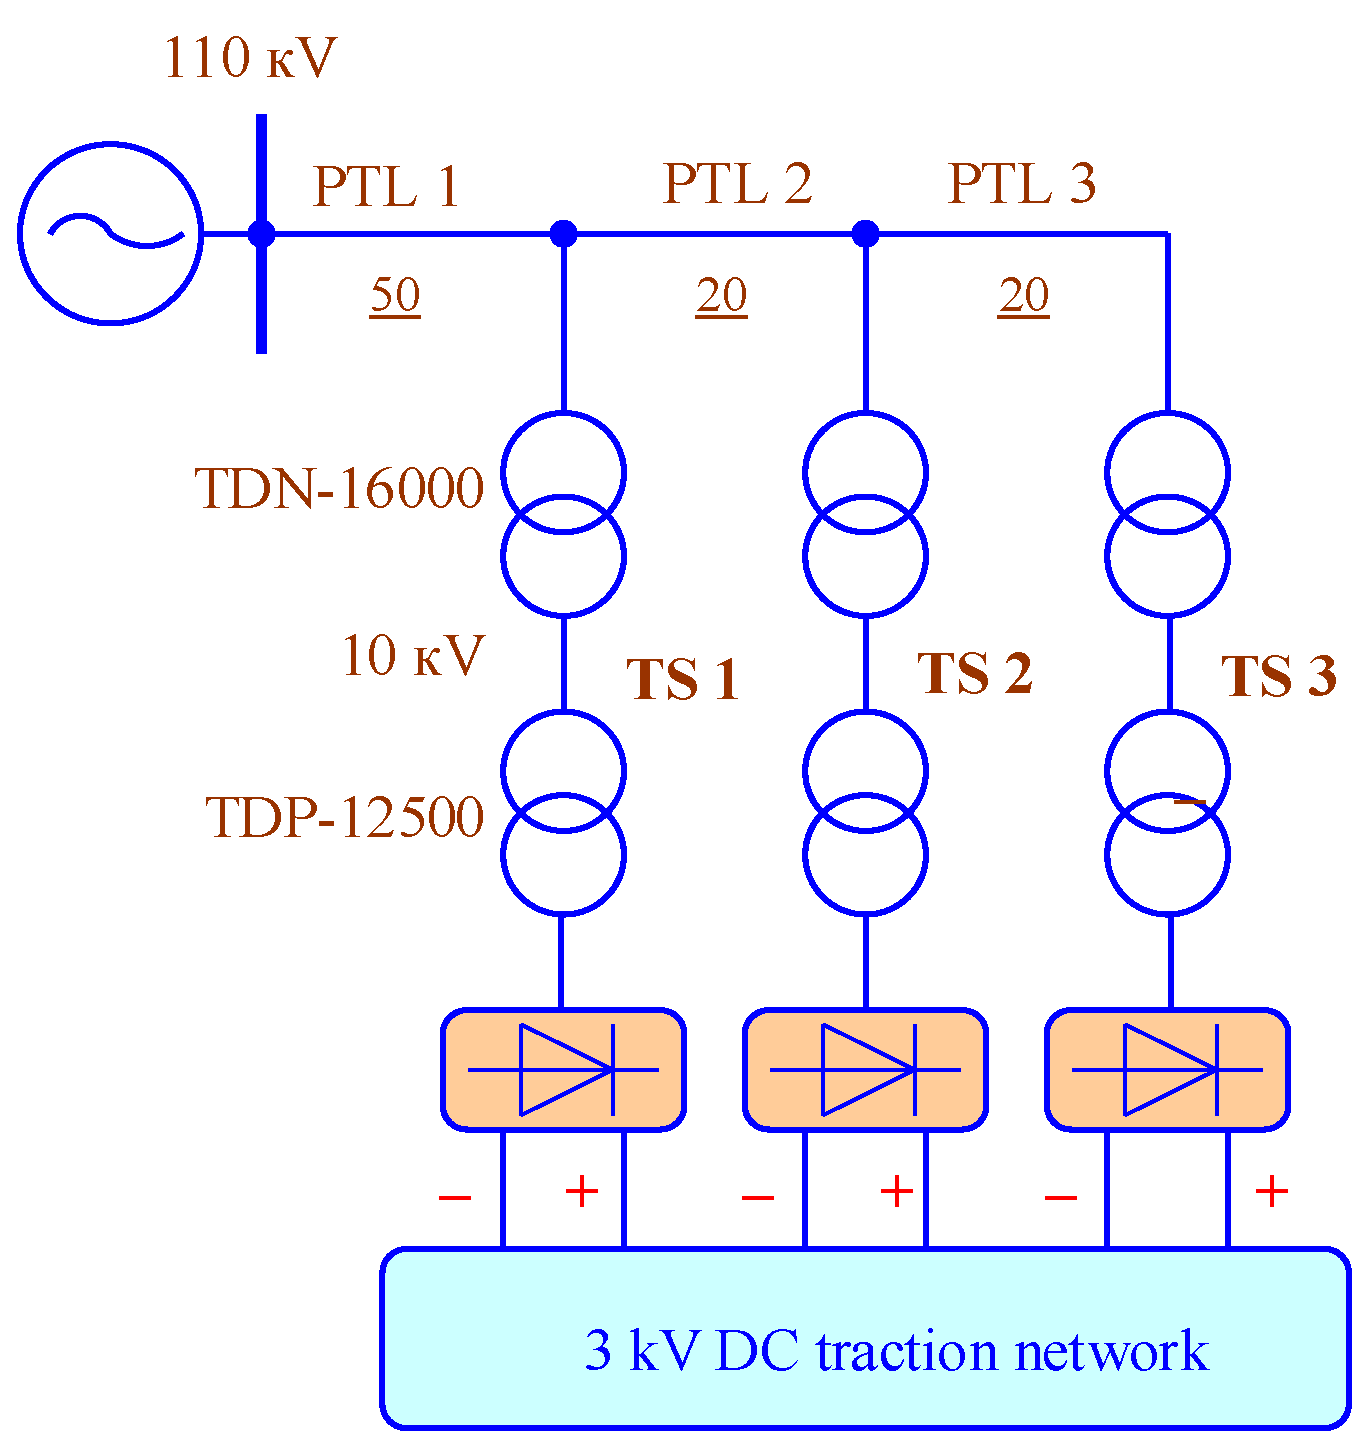
Figure 10.
Wind turbine power graph.
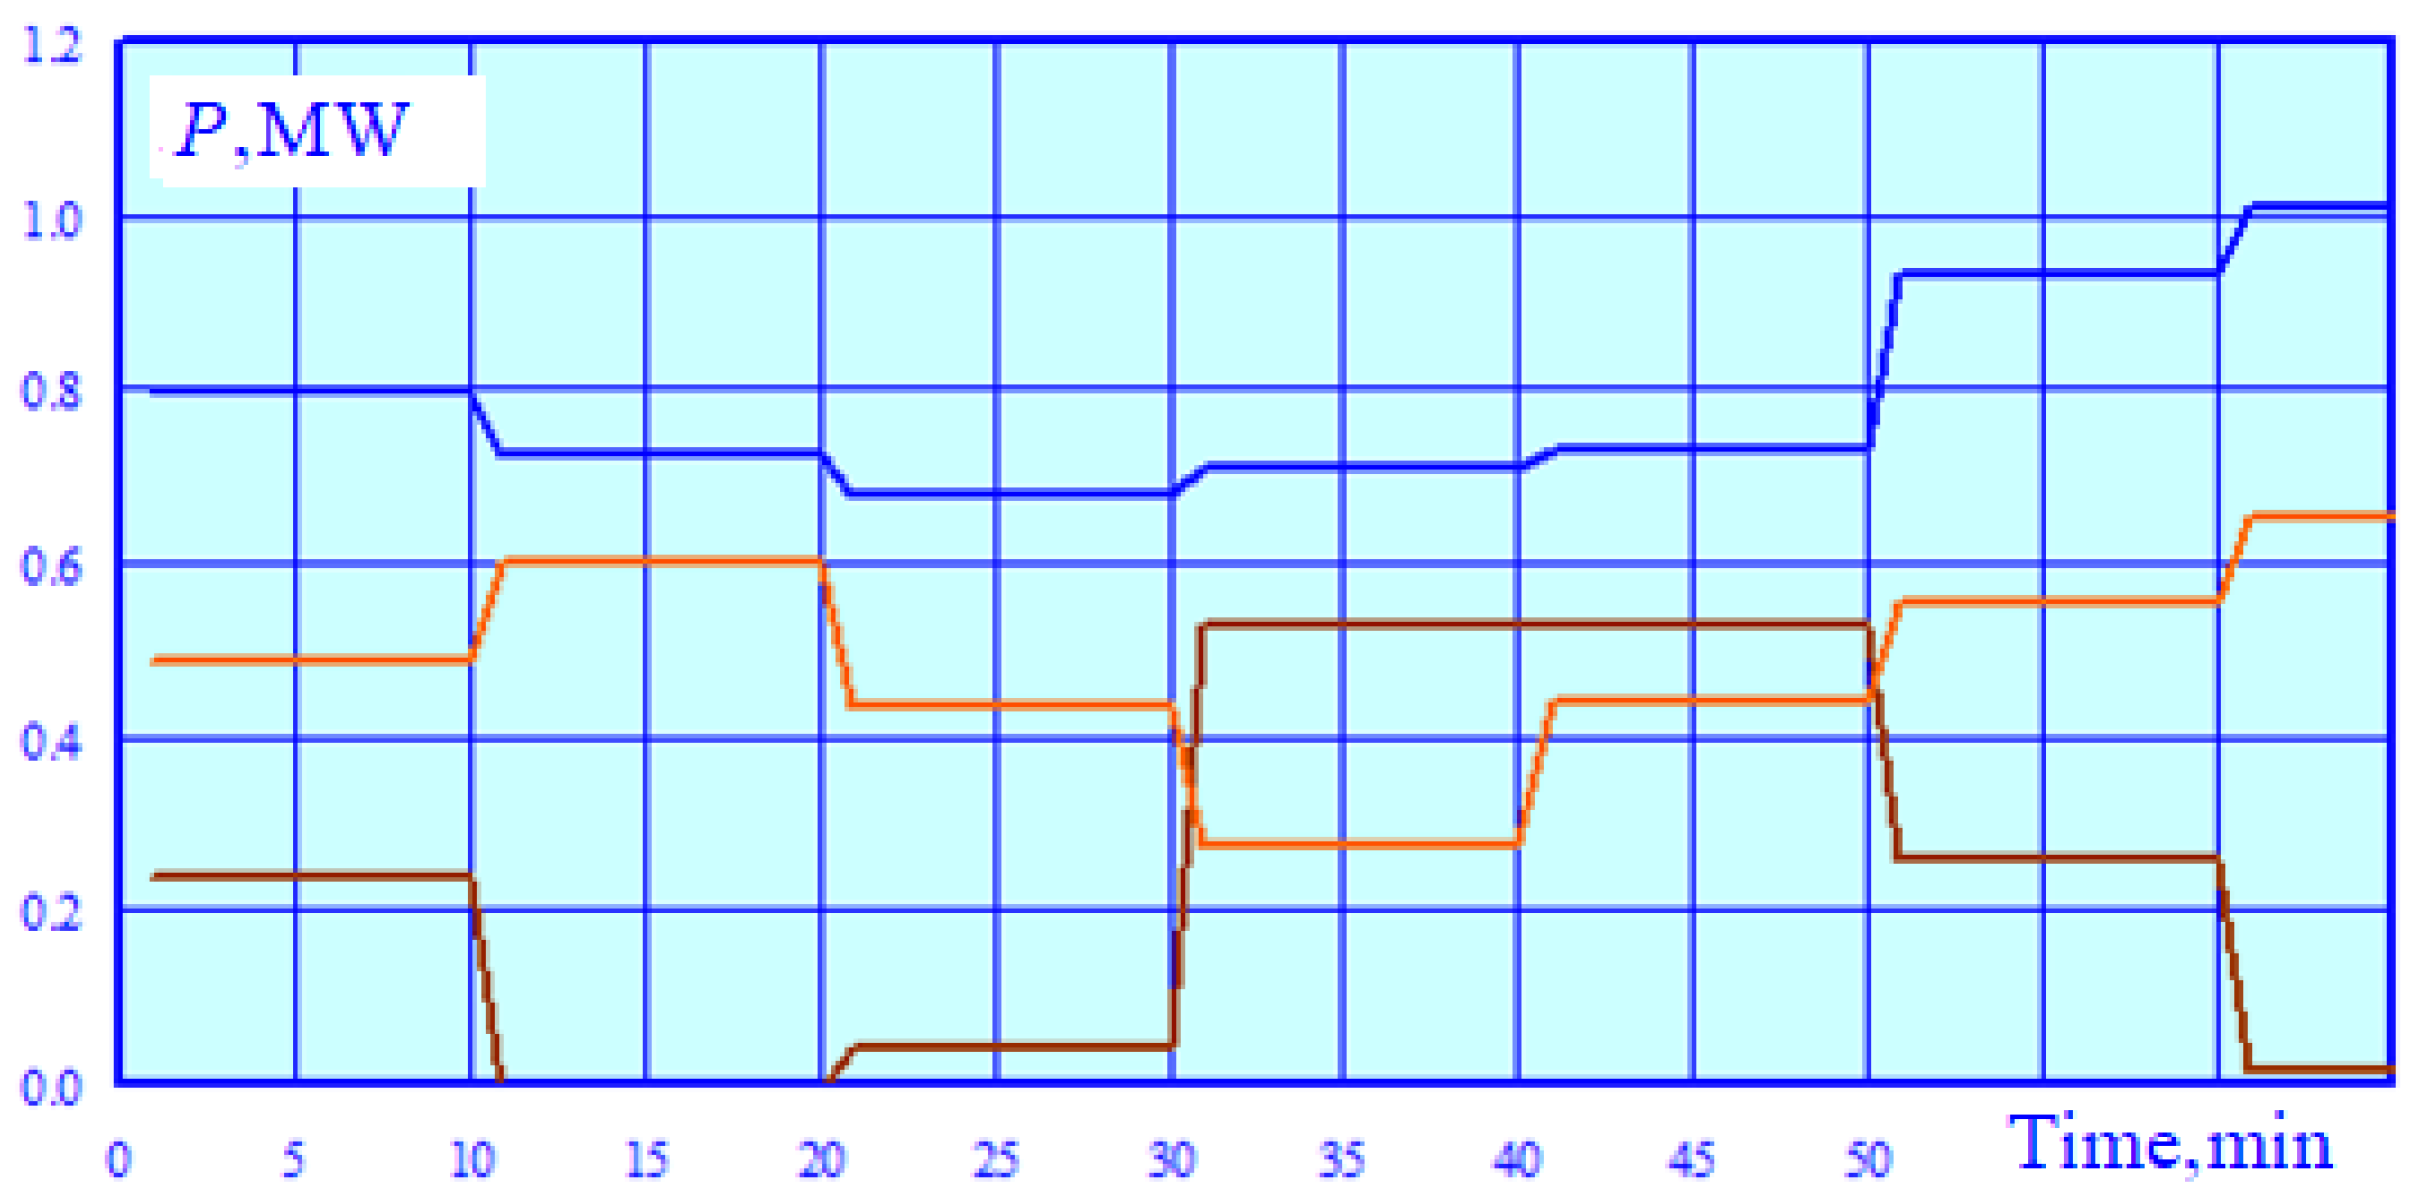
Figure 11.
Voltage on electric locomotive pantographs with wind turbines switched on: The numbers indicate train numbers.
Figure 11.
Voltage on electric locomotive pantographs with wind turbines switched on: The numbers indicate train numbers.
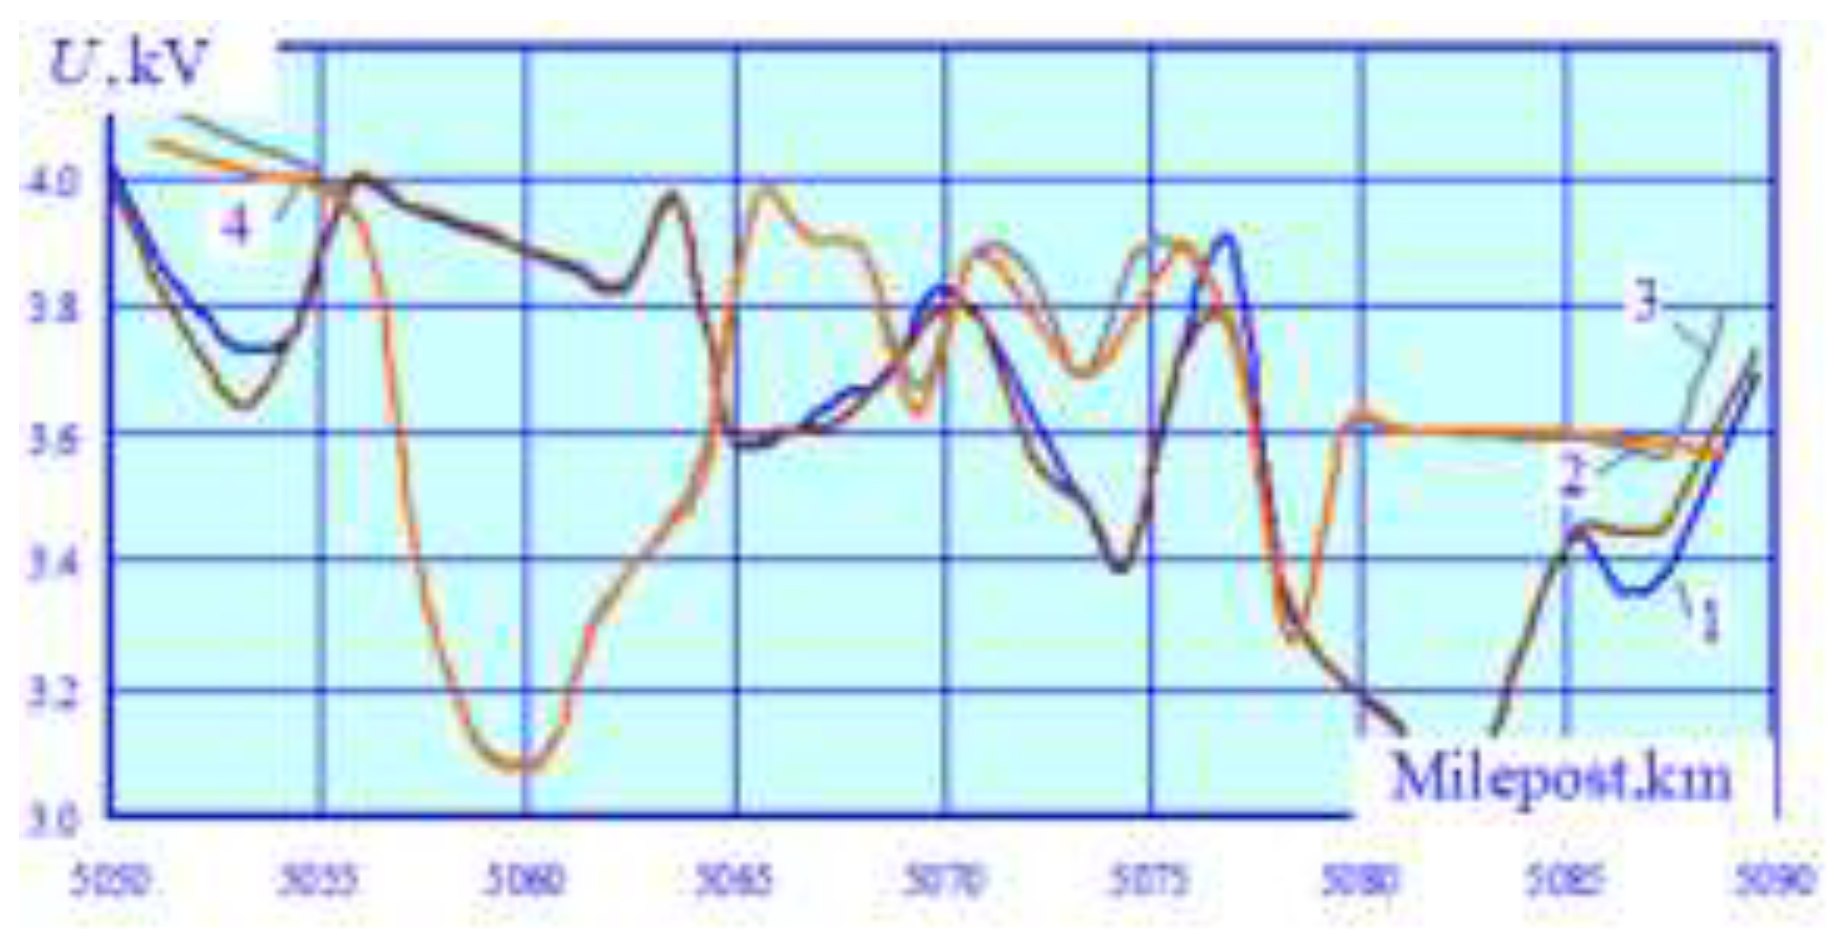
Figure 12.
Unbalance factors on high-voltage buses of the substation with wind turbines switched on.
Figure 12.
Unbalance factors on high-voltage buses of the substation with wind turbines switched on.
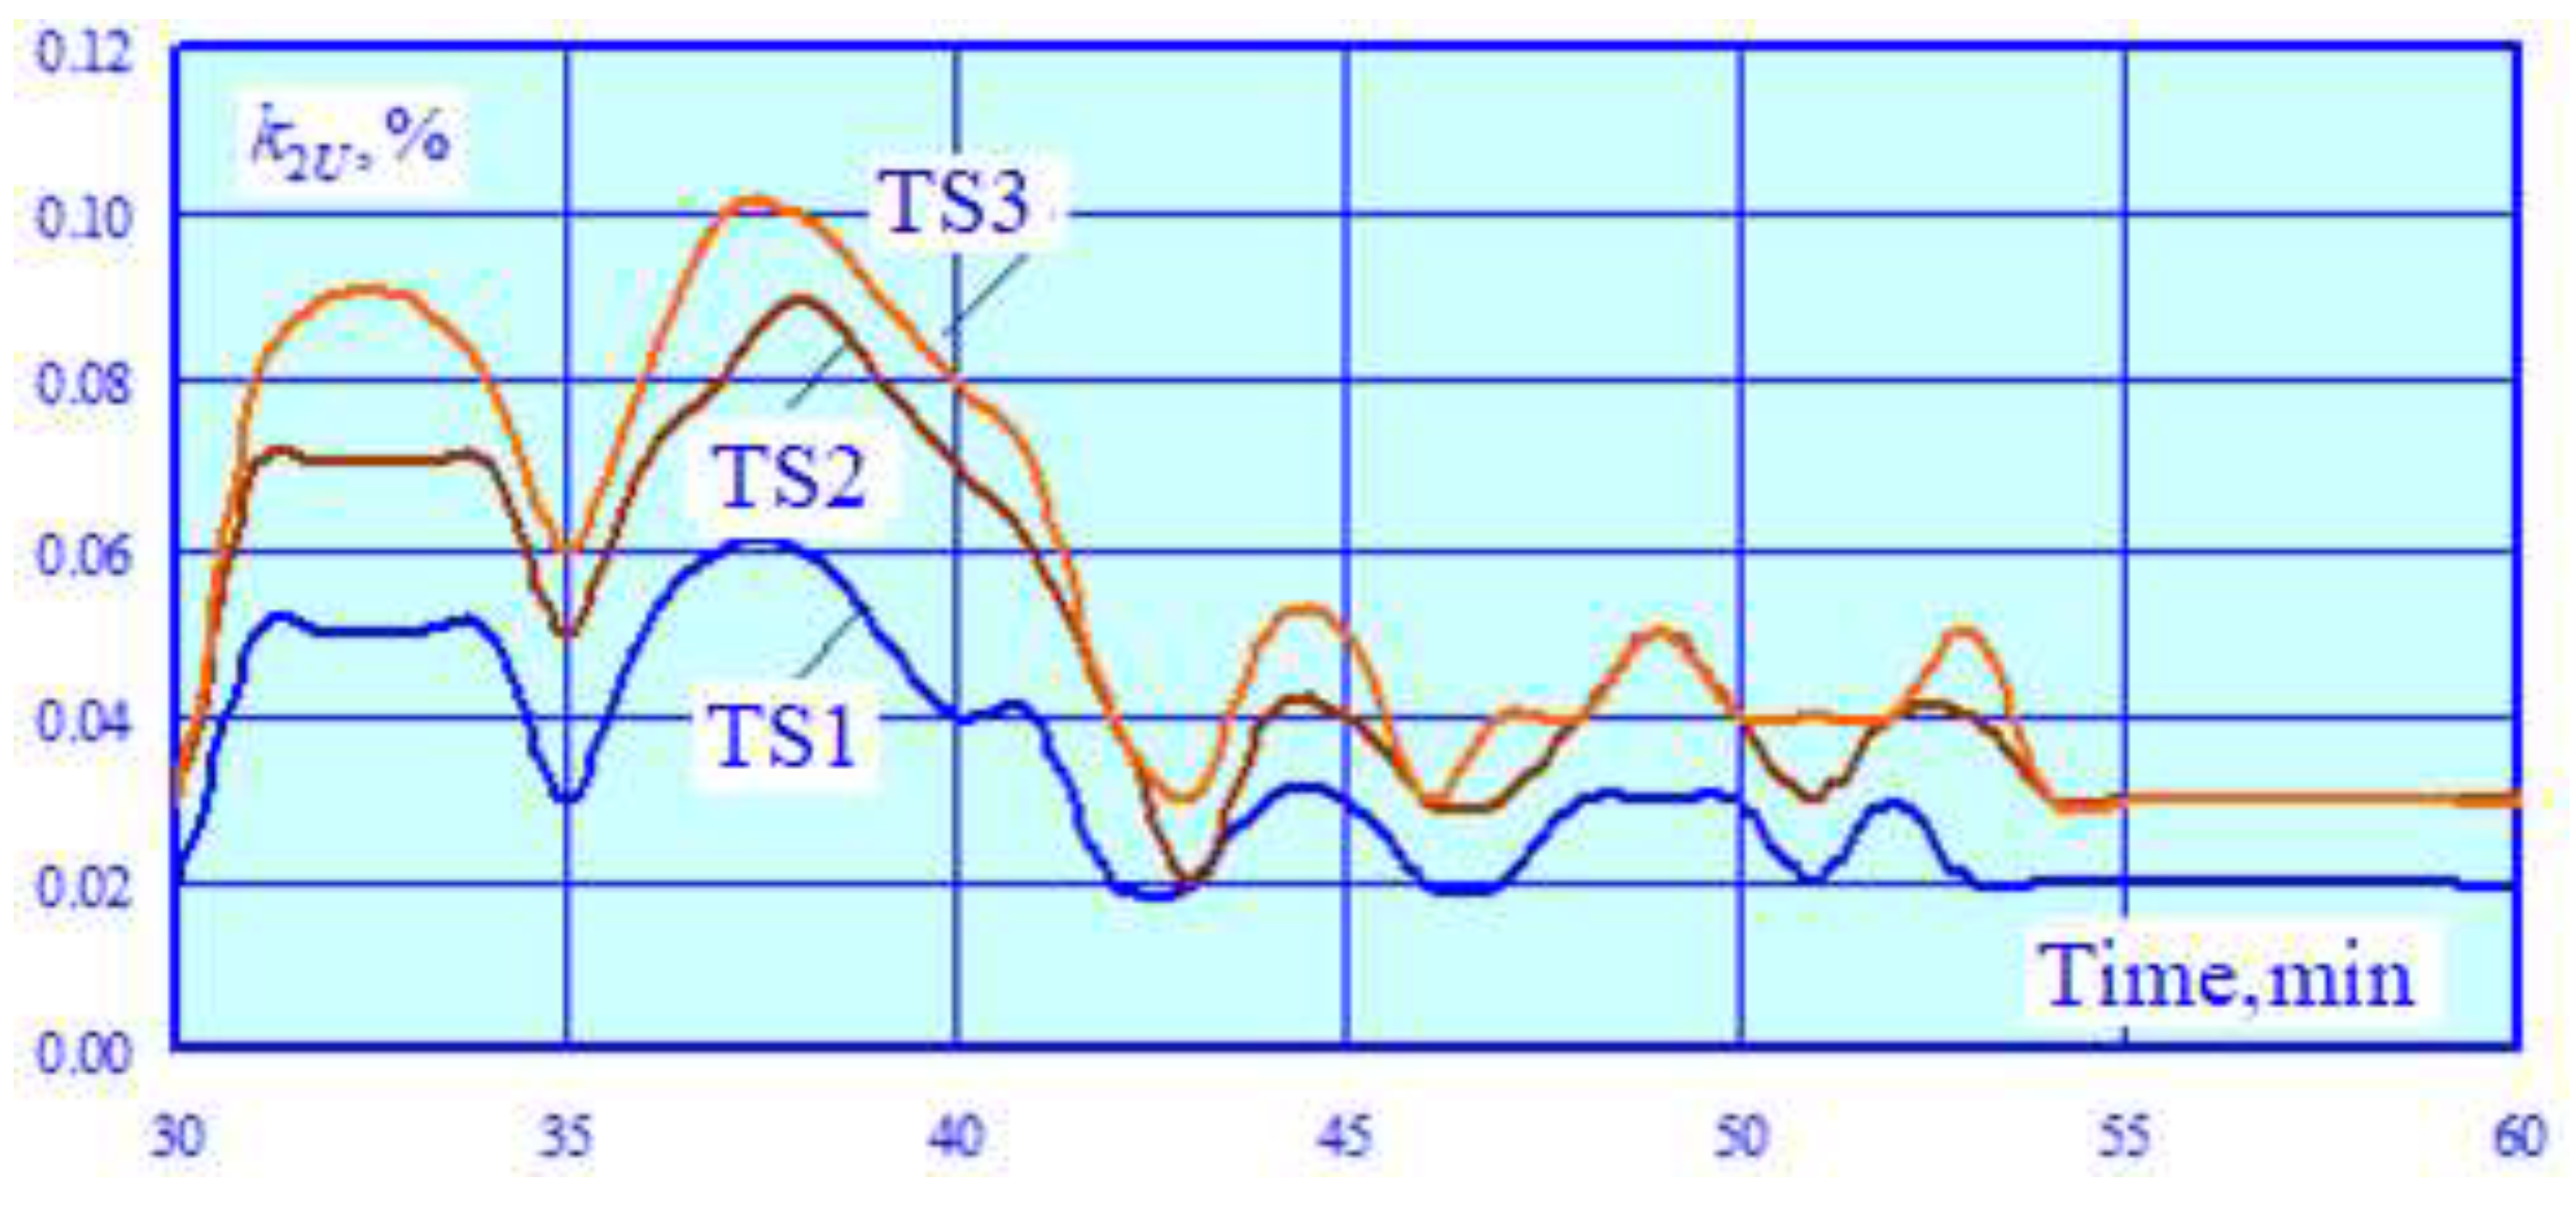
Figure 13.
Active power losses in power transmission lines: a – wind turbines are switched on; b – wind turbines are switched off.
Figure 13.
Active power losses in power transmission lines: a – wind turbines are switched on; b – wind turbines are switched off.
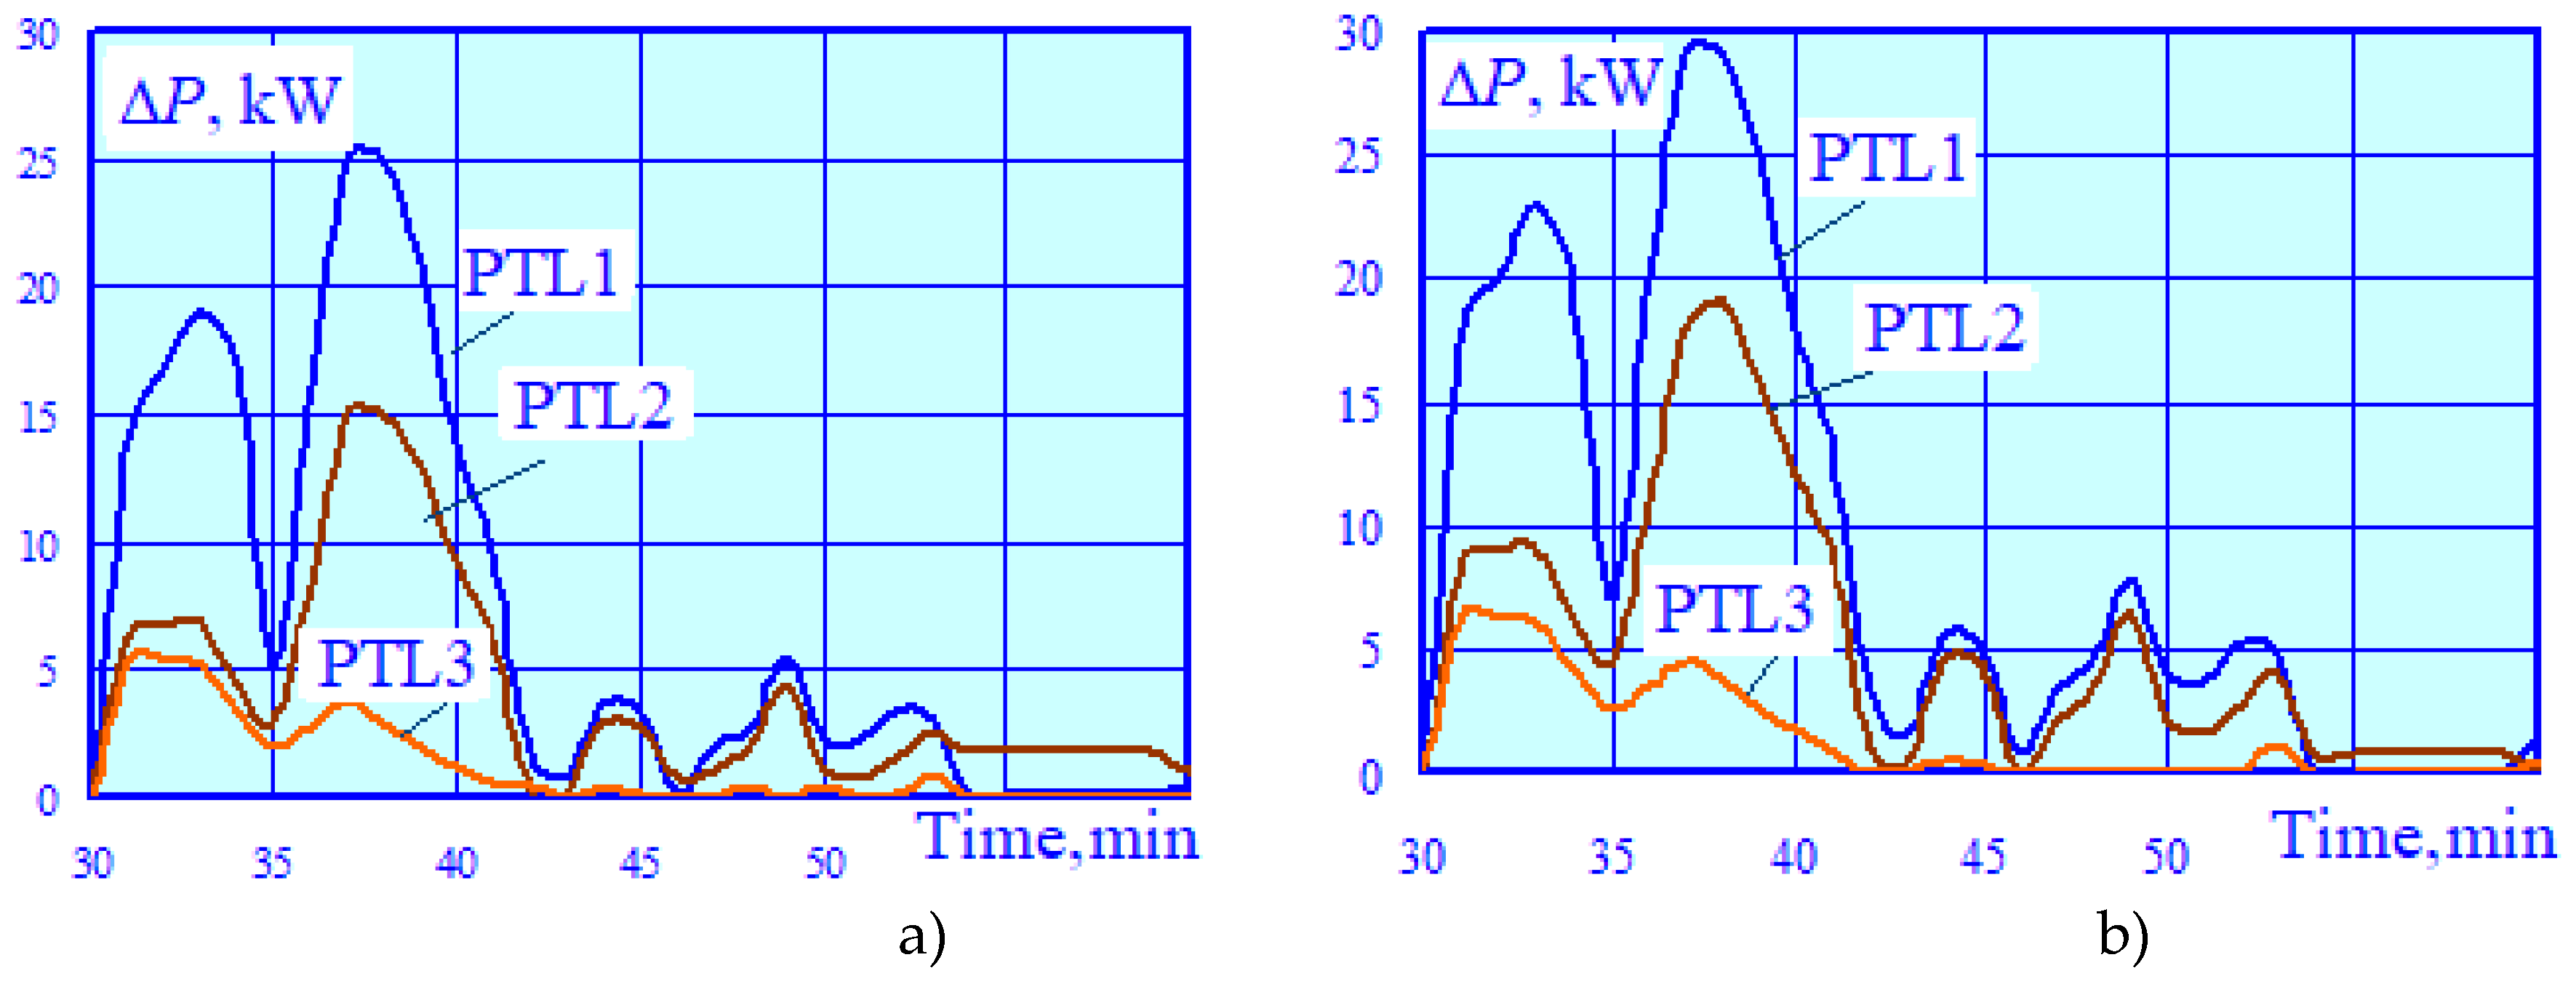
Figure 14.
Active power flows in power transmission lines: a – wind turbines are switched on; b – wind turbines are switched off.
Figure 14.
Active power flows in power transmission lines: a – wind turbines are switched on; b – wind turbines are switched off.
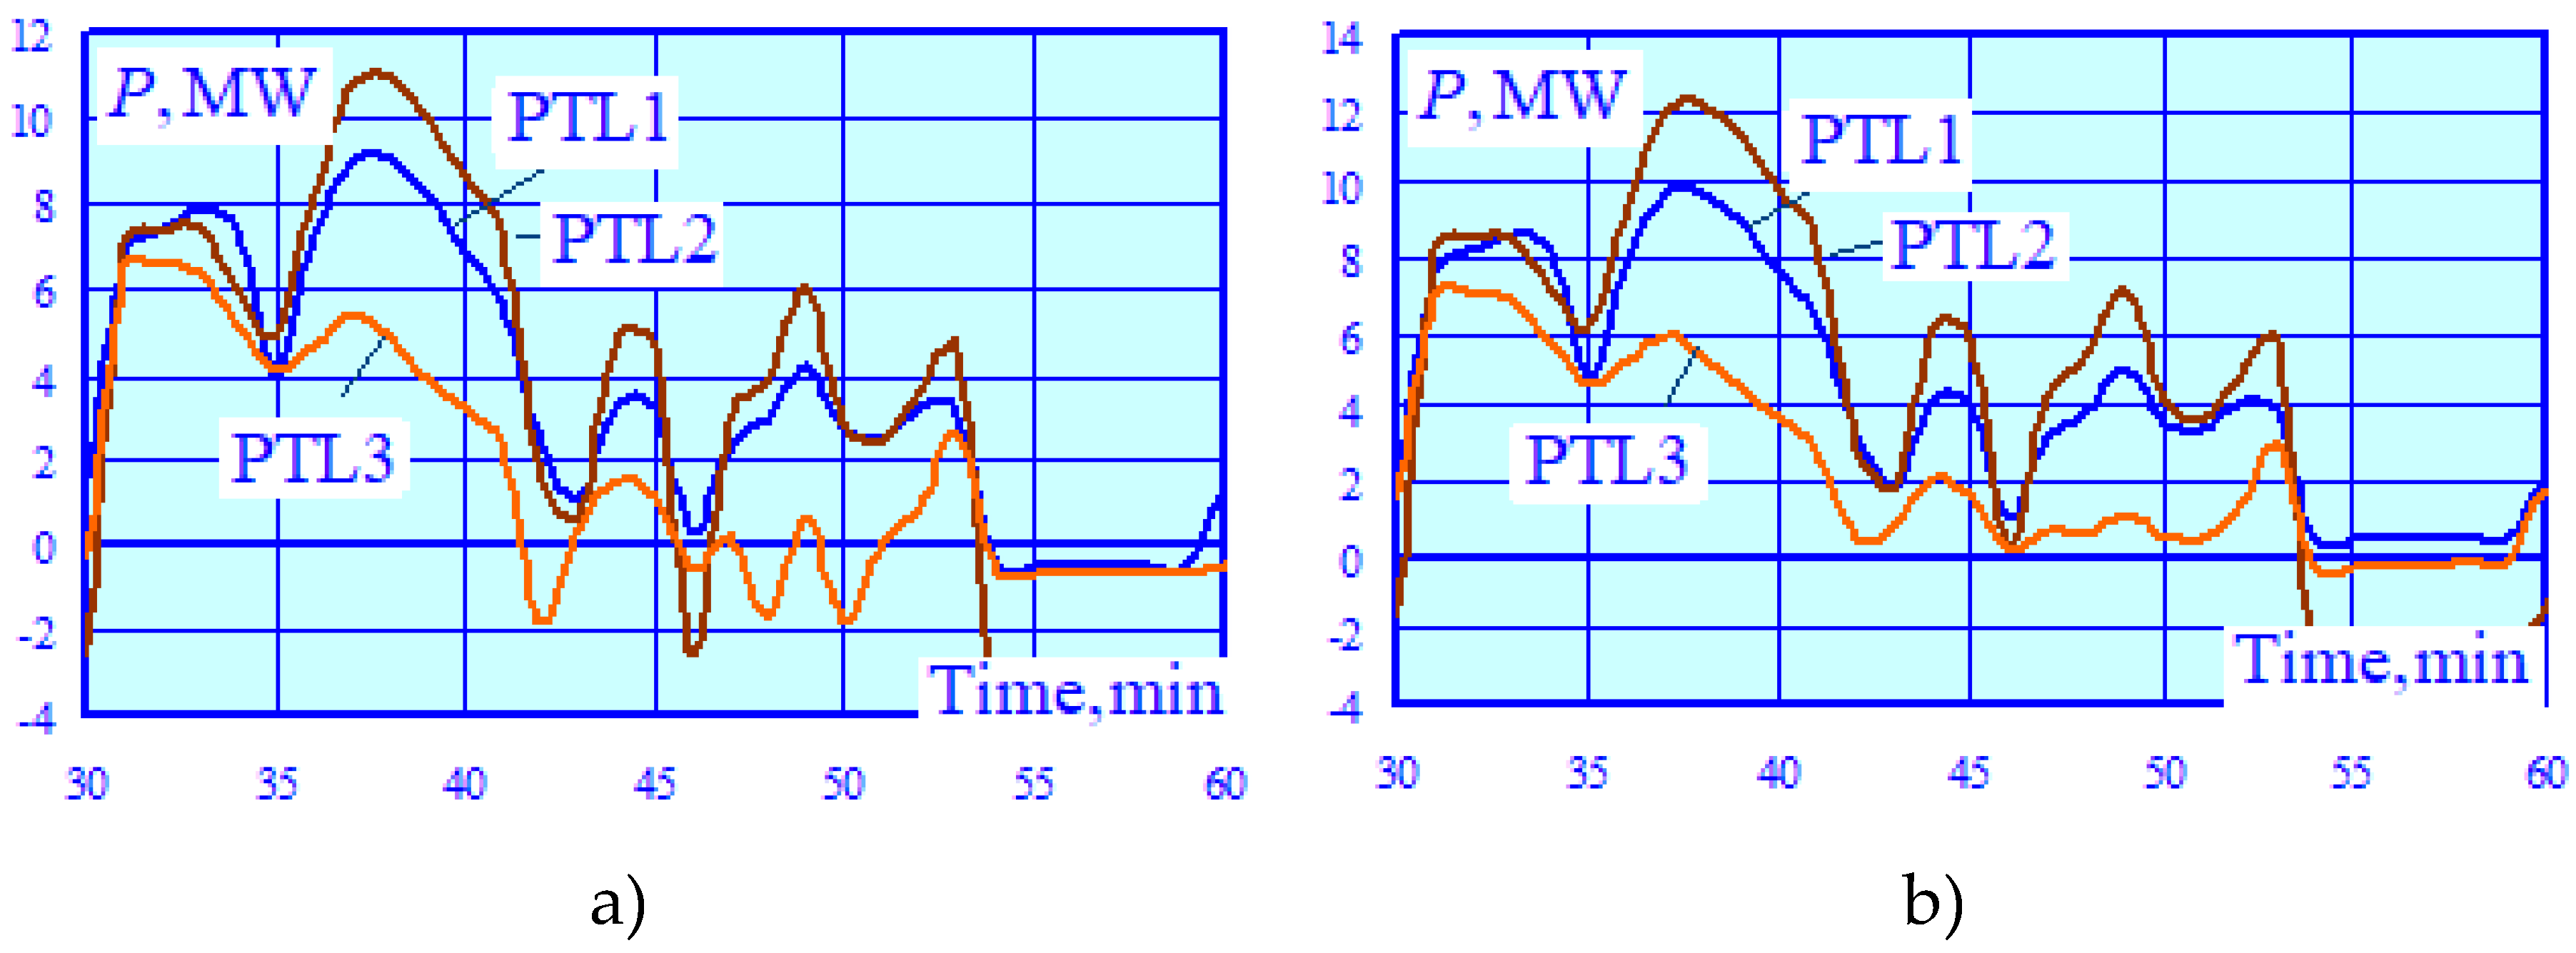
Figure 15.
Power losses in 110/10 kV step-down transformers with wind turbines switched on: a – total losses; b – copper losses.
Figure 15.
Power losses in 110/10 kV step-down transformers with wind turbines switched on: a – total losses; b – copper losses.
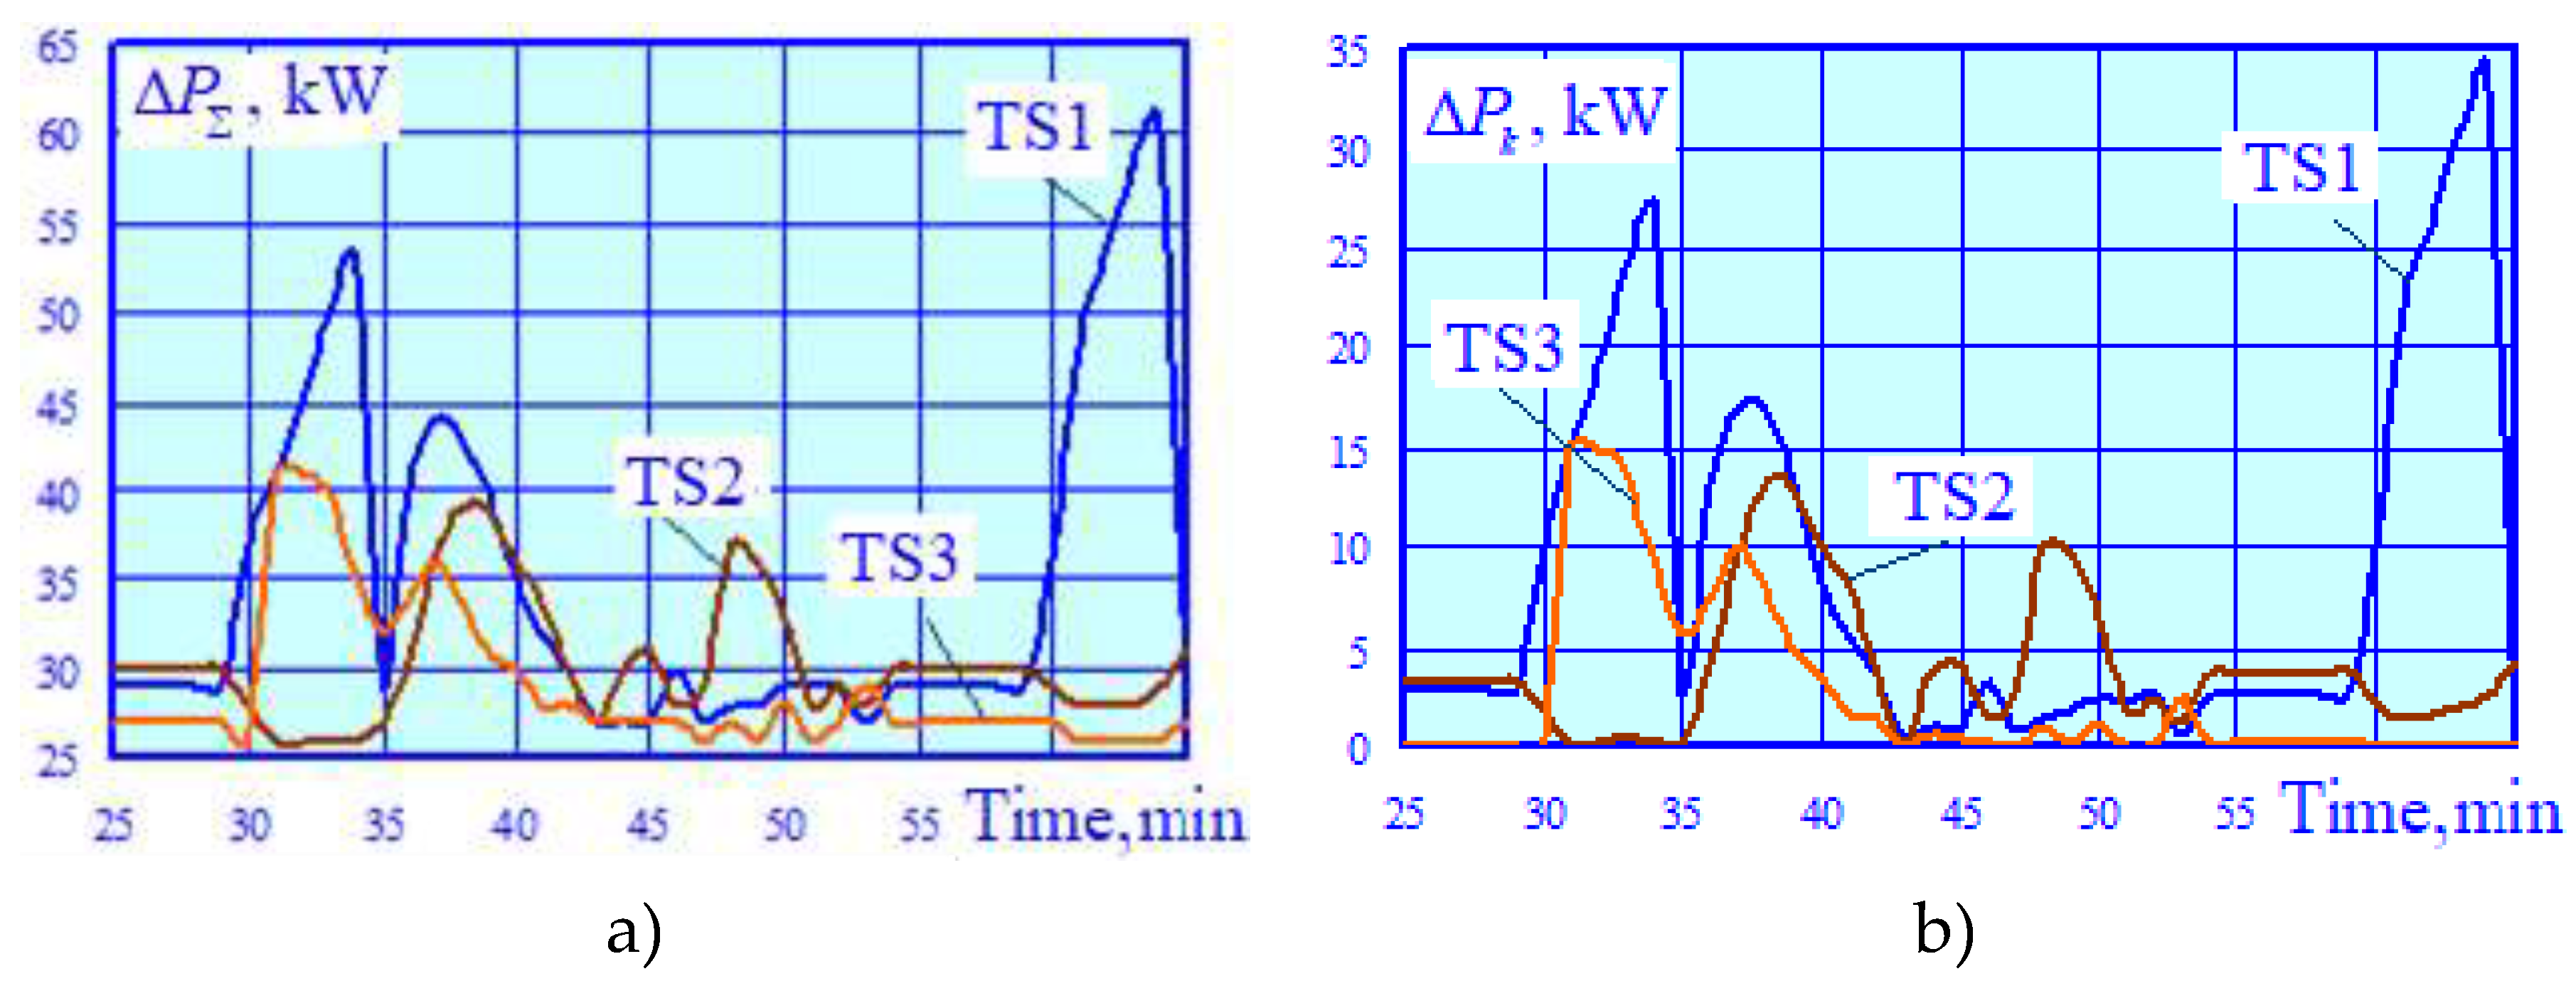
Figure 16.
Power losses in 110/10 kV step-down transformers with wind turbines switched off: a – total losses; b – copper losses.
Figure 16.
Power losses in 110/10 kV step-down transformers with wind turbines switched off: a – total losses; b – copper losses.
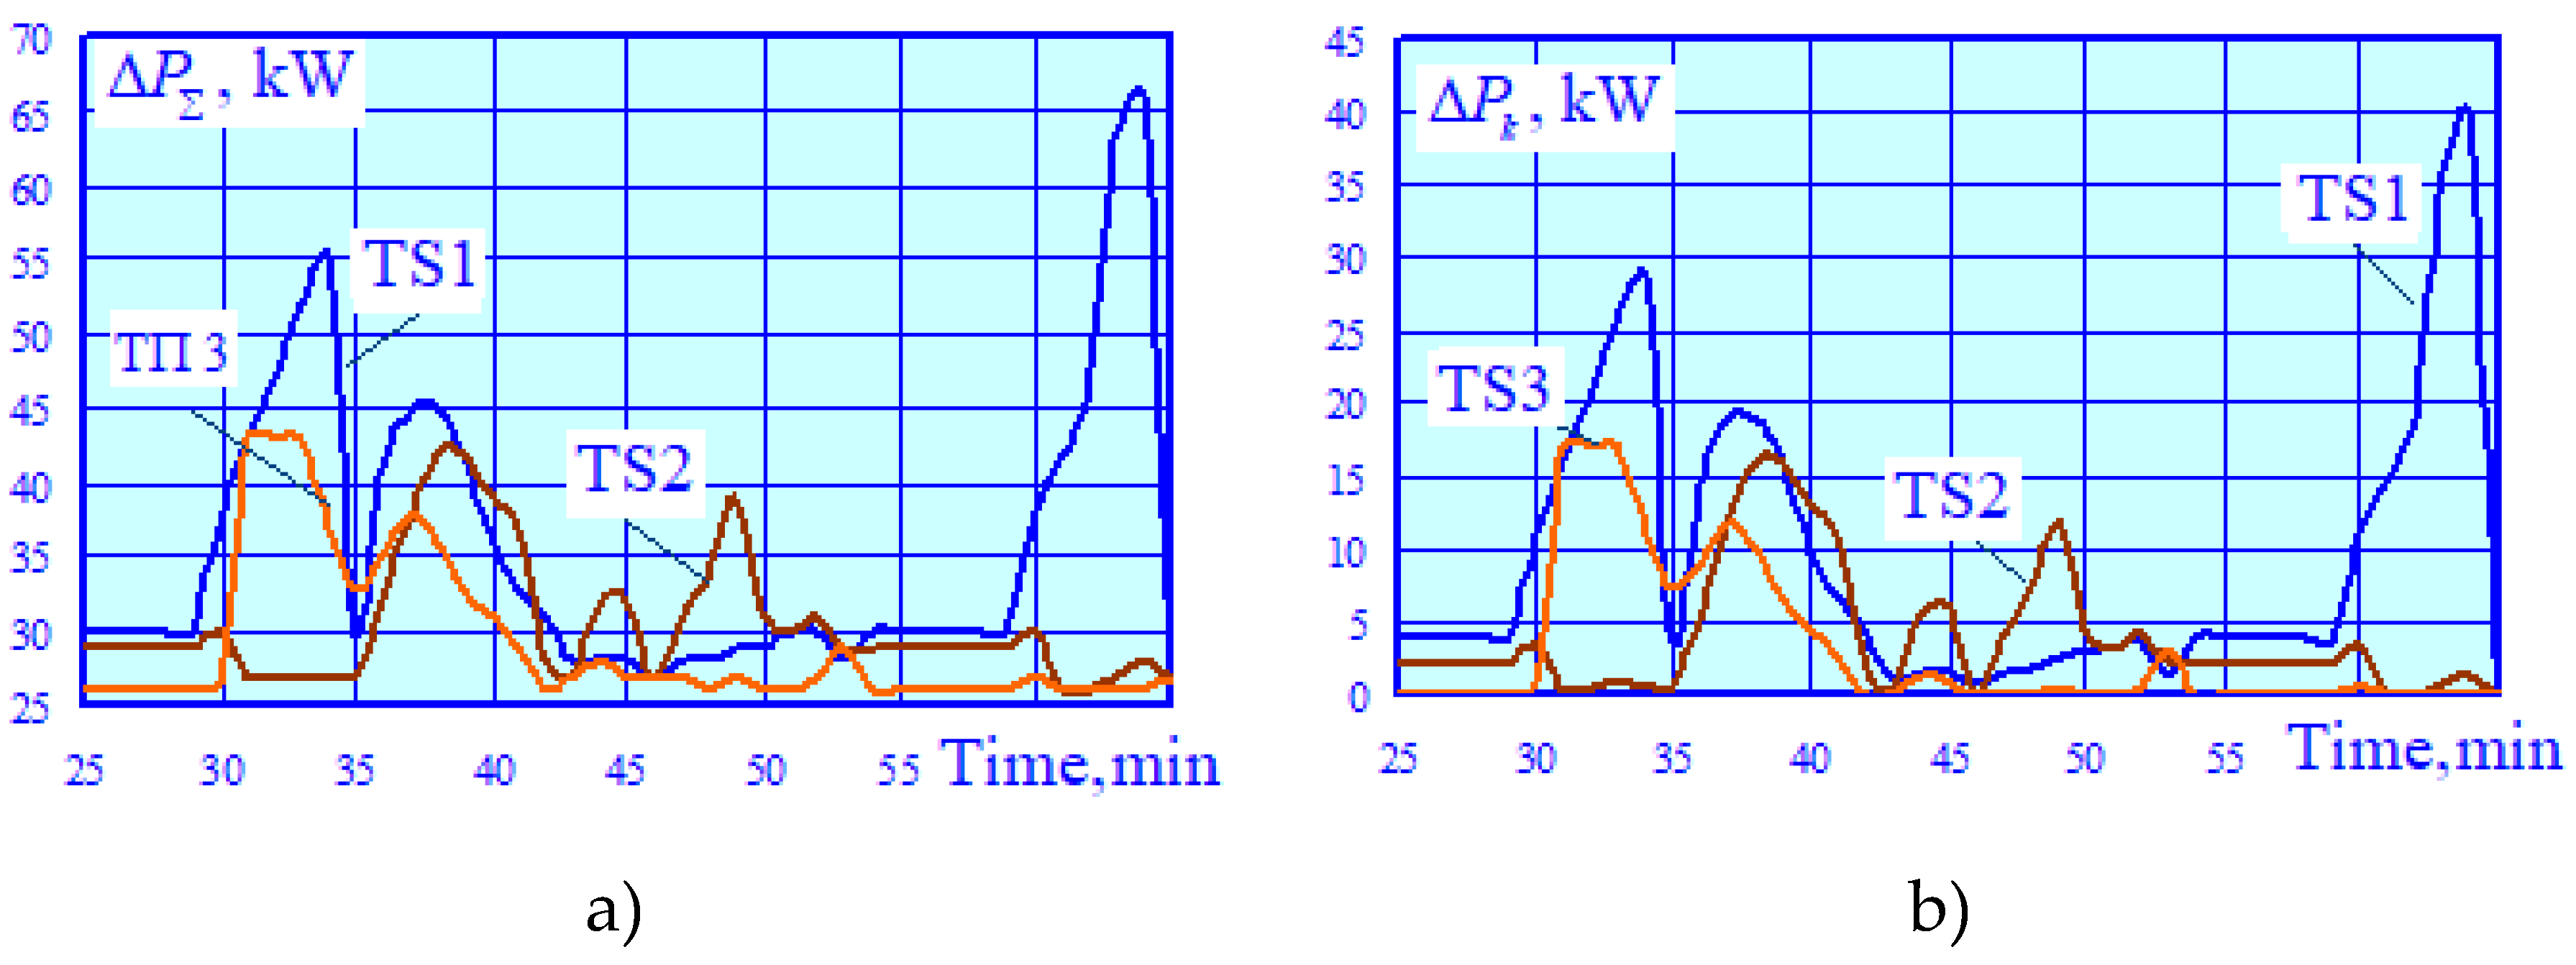
Figure 17.
Power losses in 10/3 kV converter transformers with wind turbines switched on: a – total losses; b – copper losses.
Figure 17.
Power losses in 10/3 kV converter transformers with wind turbines switched on: a – total losses; b – copper losses.
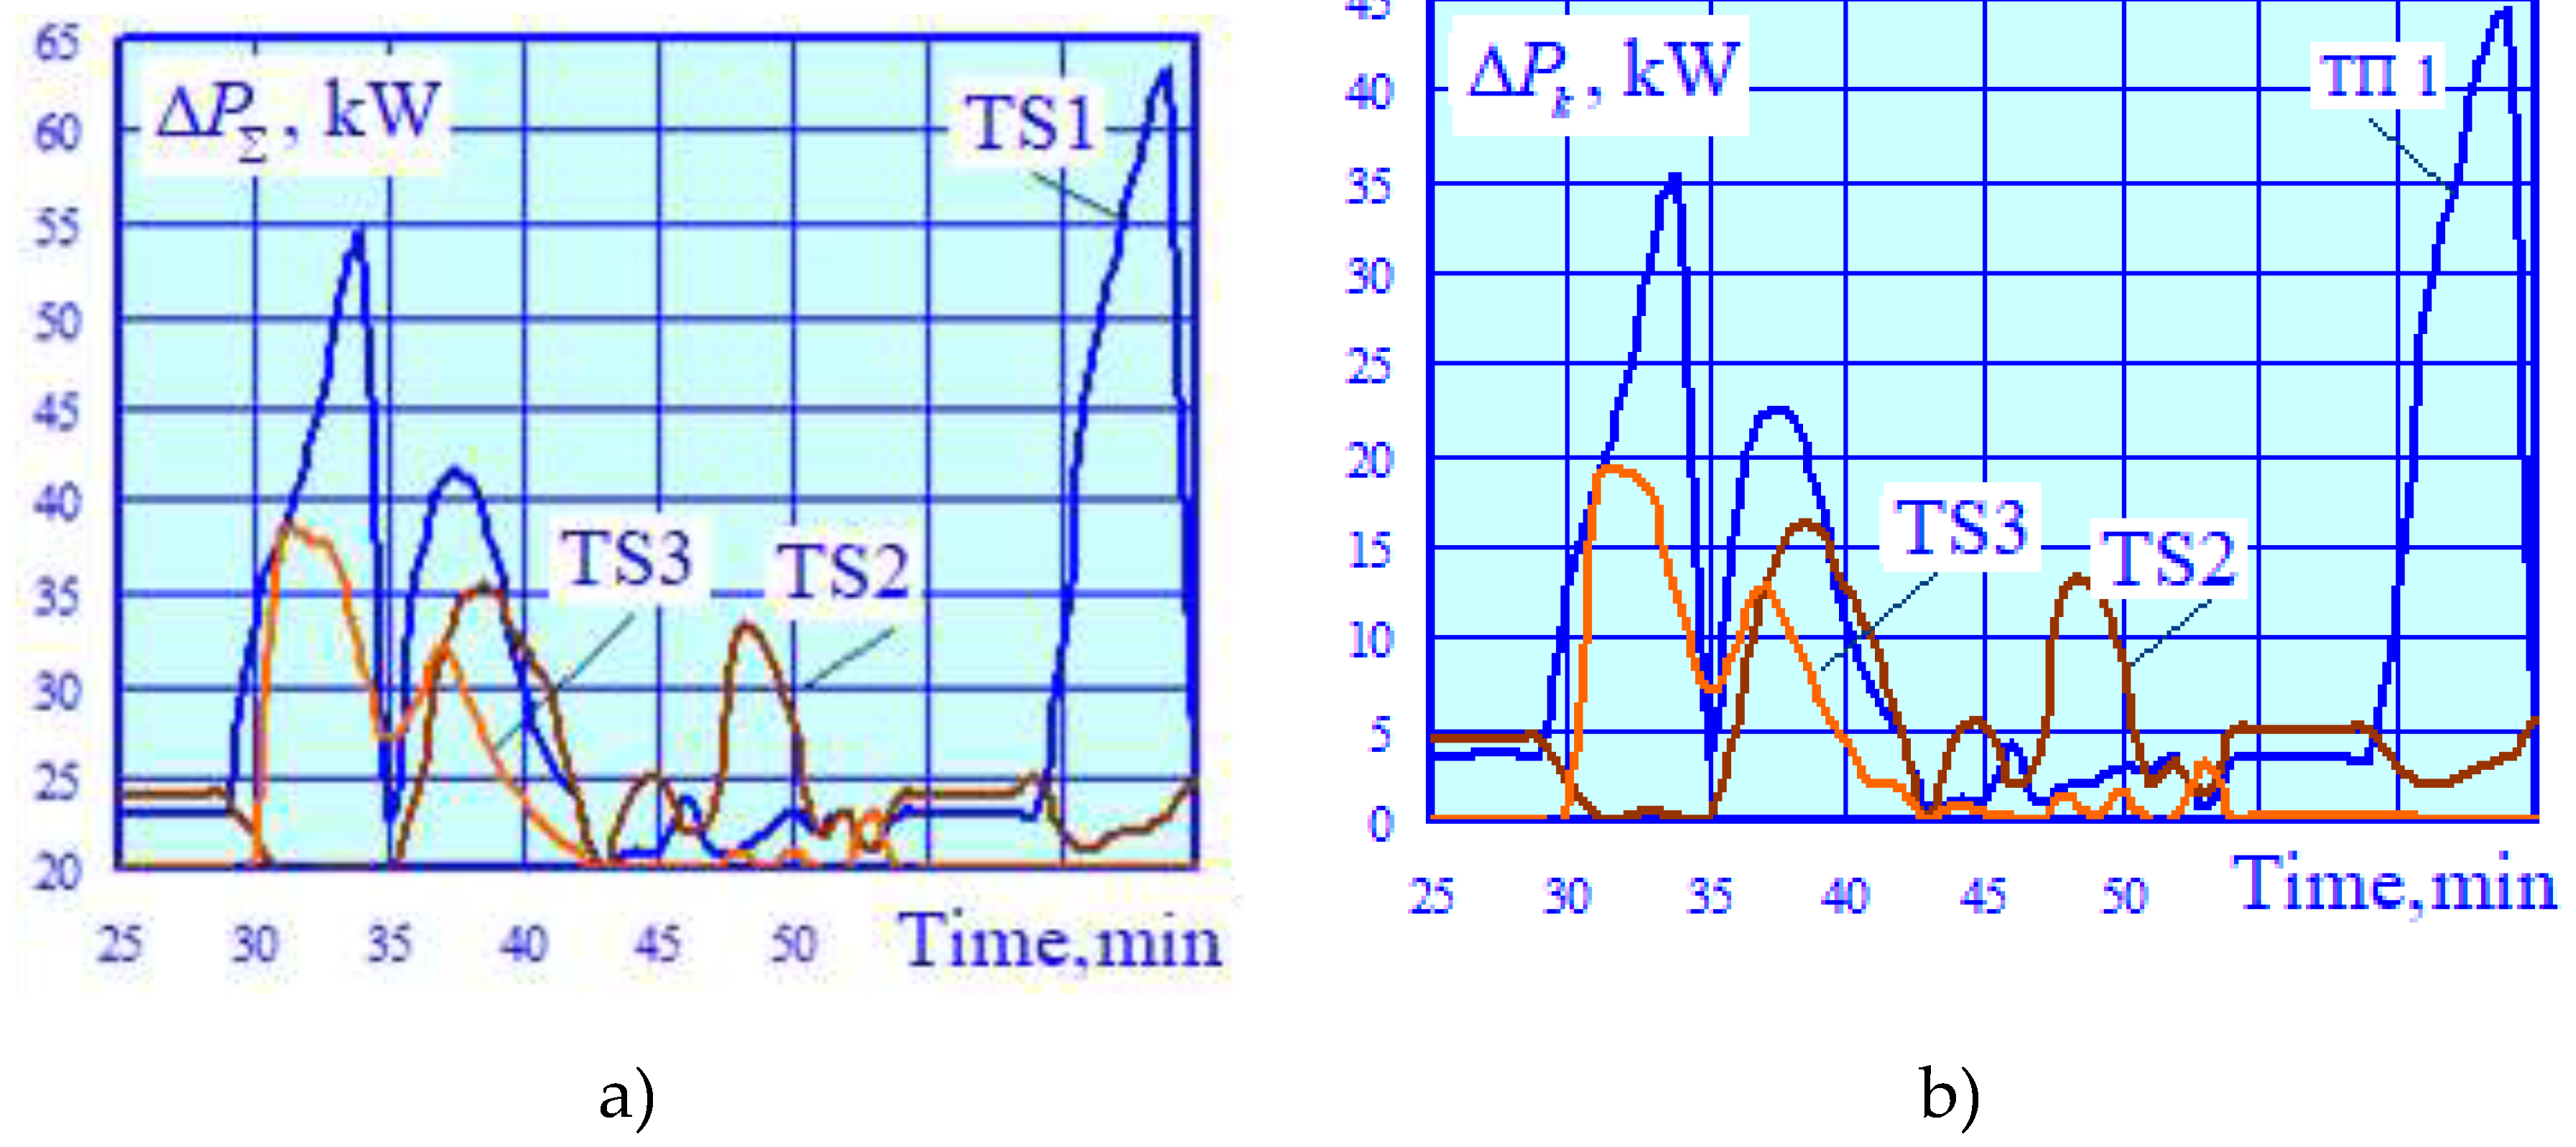
Figure 18.
Power losses in 10/3 kV converter transformers with wind turbines switched off: a – total losses; b – copper losses.
Figure 18.
Power losses in 10/3 kV converter transformers with wind turbines switched off: a – total losses; b – copper losses.
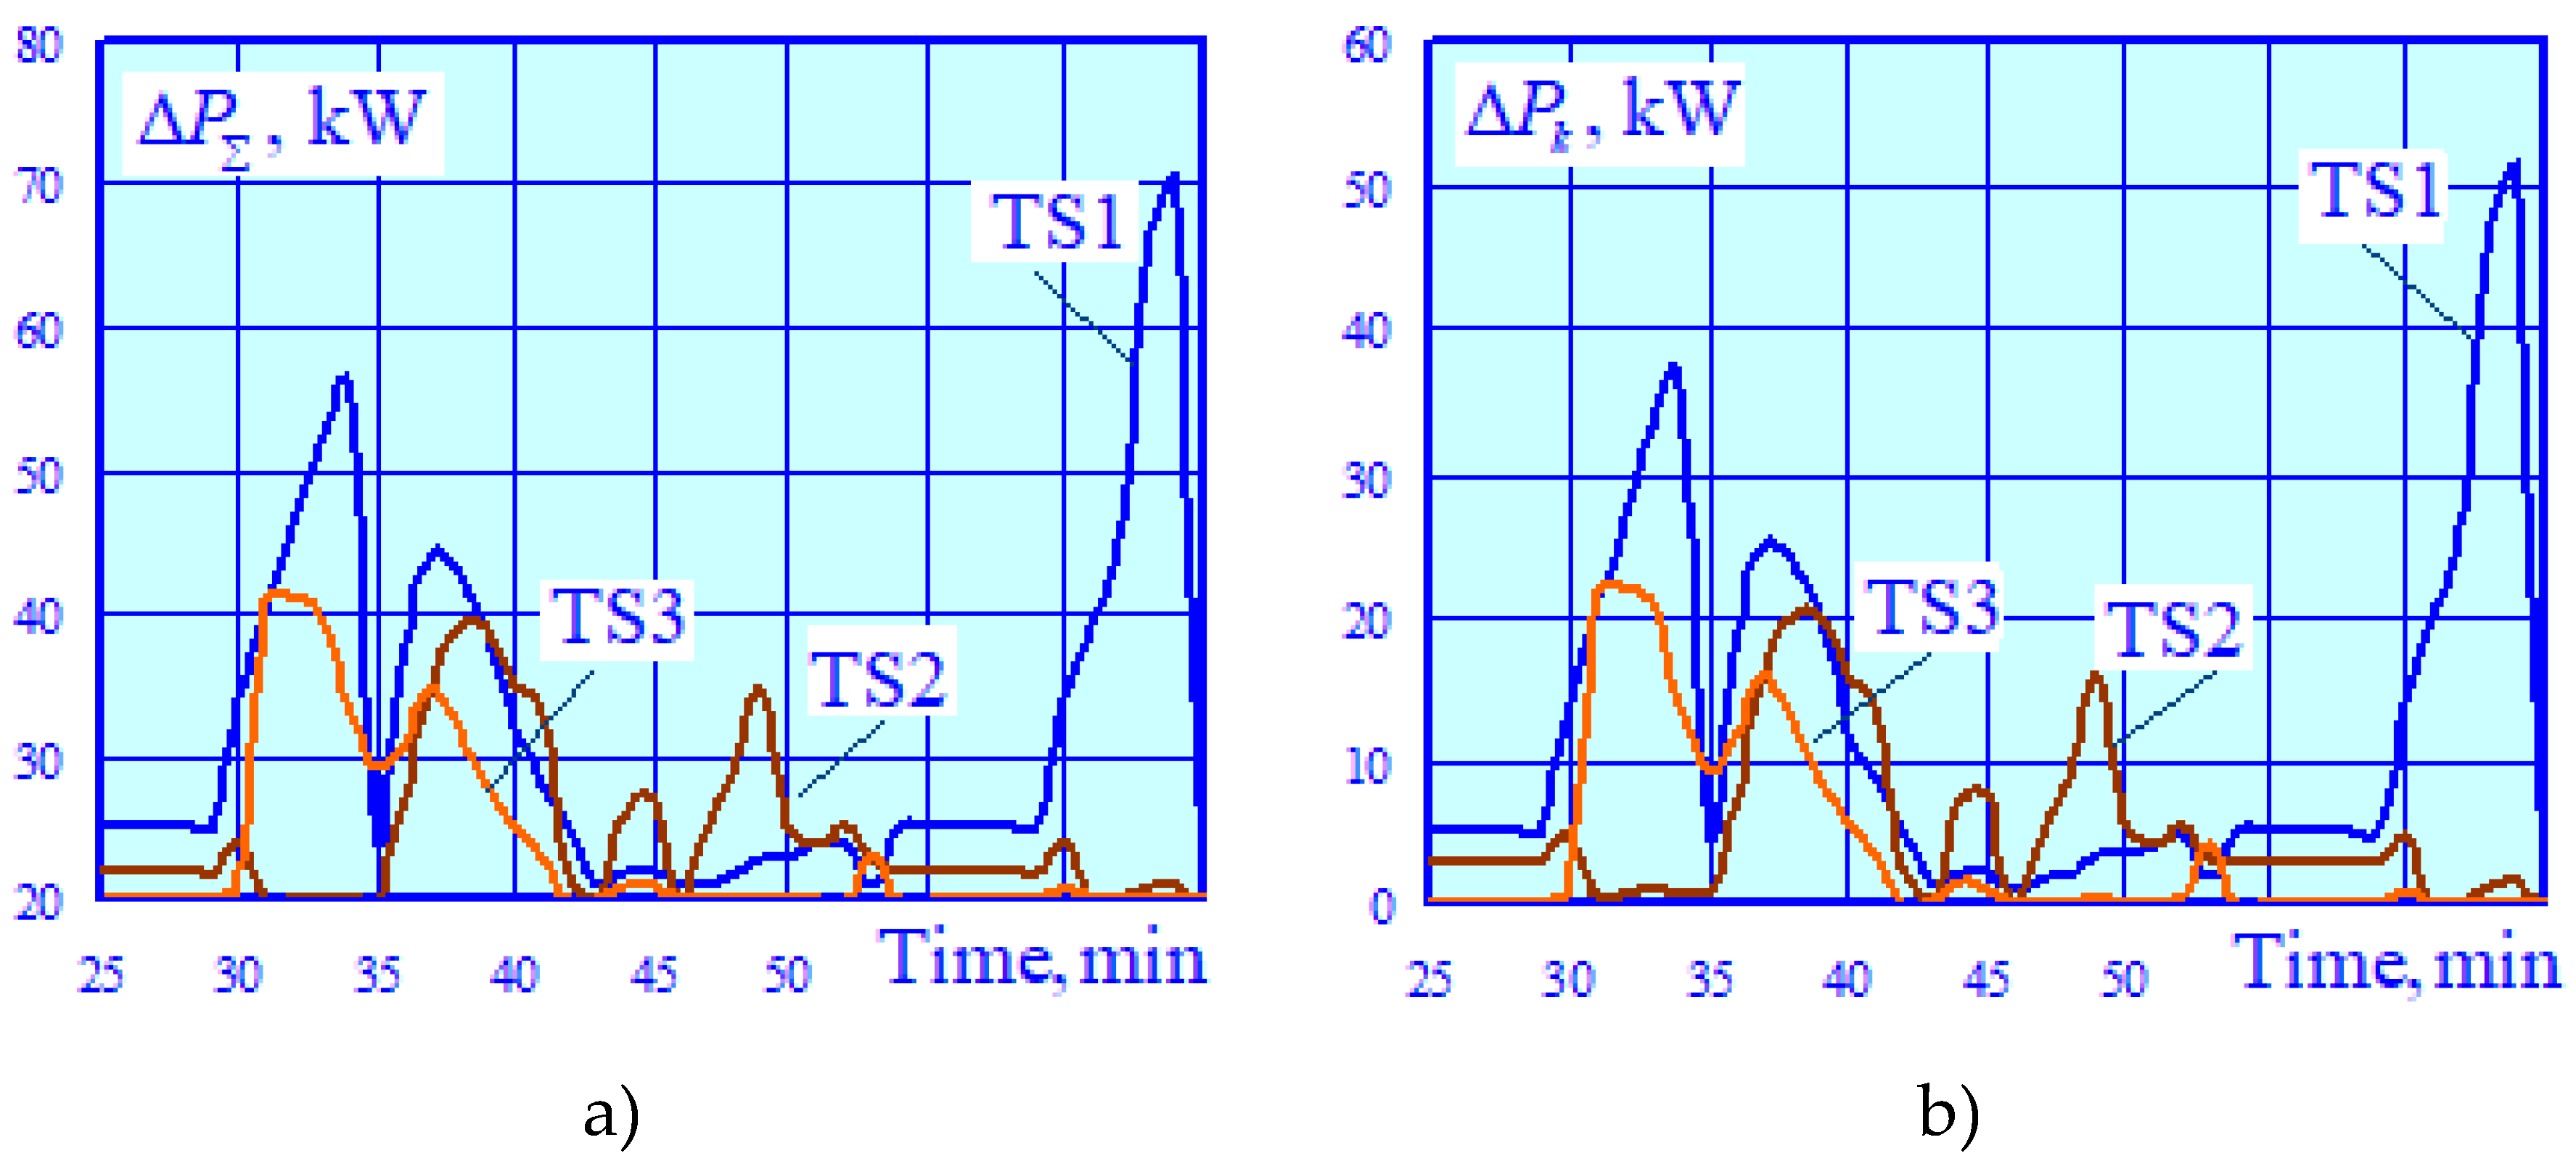
Figure 19.
Hot spot temperatures of transformers with wind turbines switched on: a – step-down transformers; b – converter transformers.
Figure 19.
Hot spot temperatures of transformers with wind turbines switched on: a – step-down transformers; b – converter transformers.
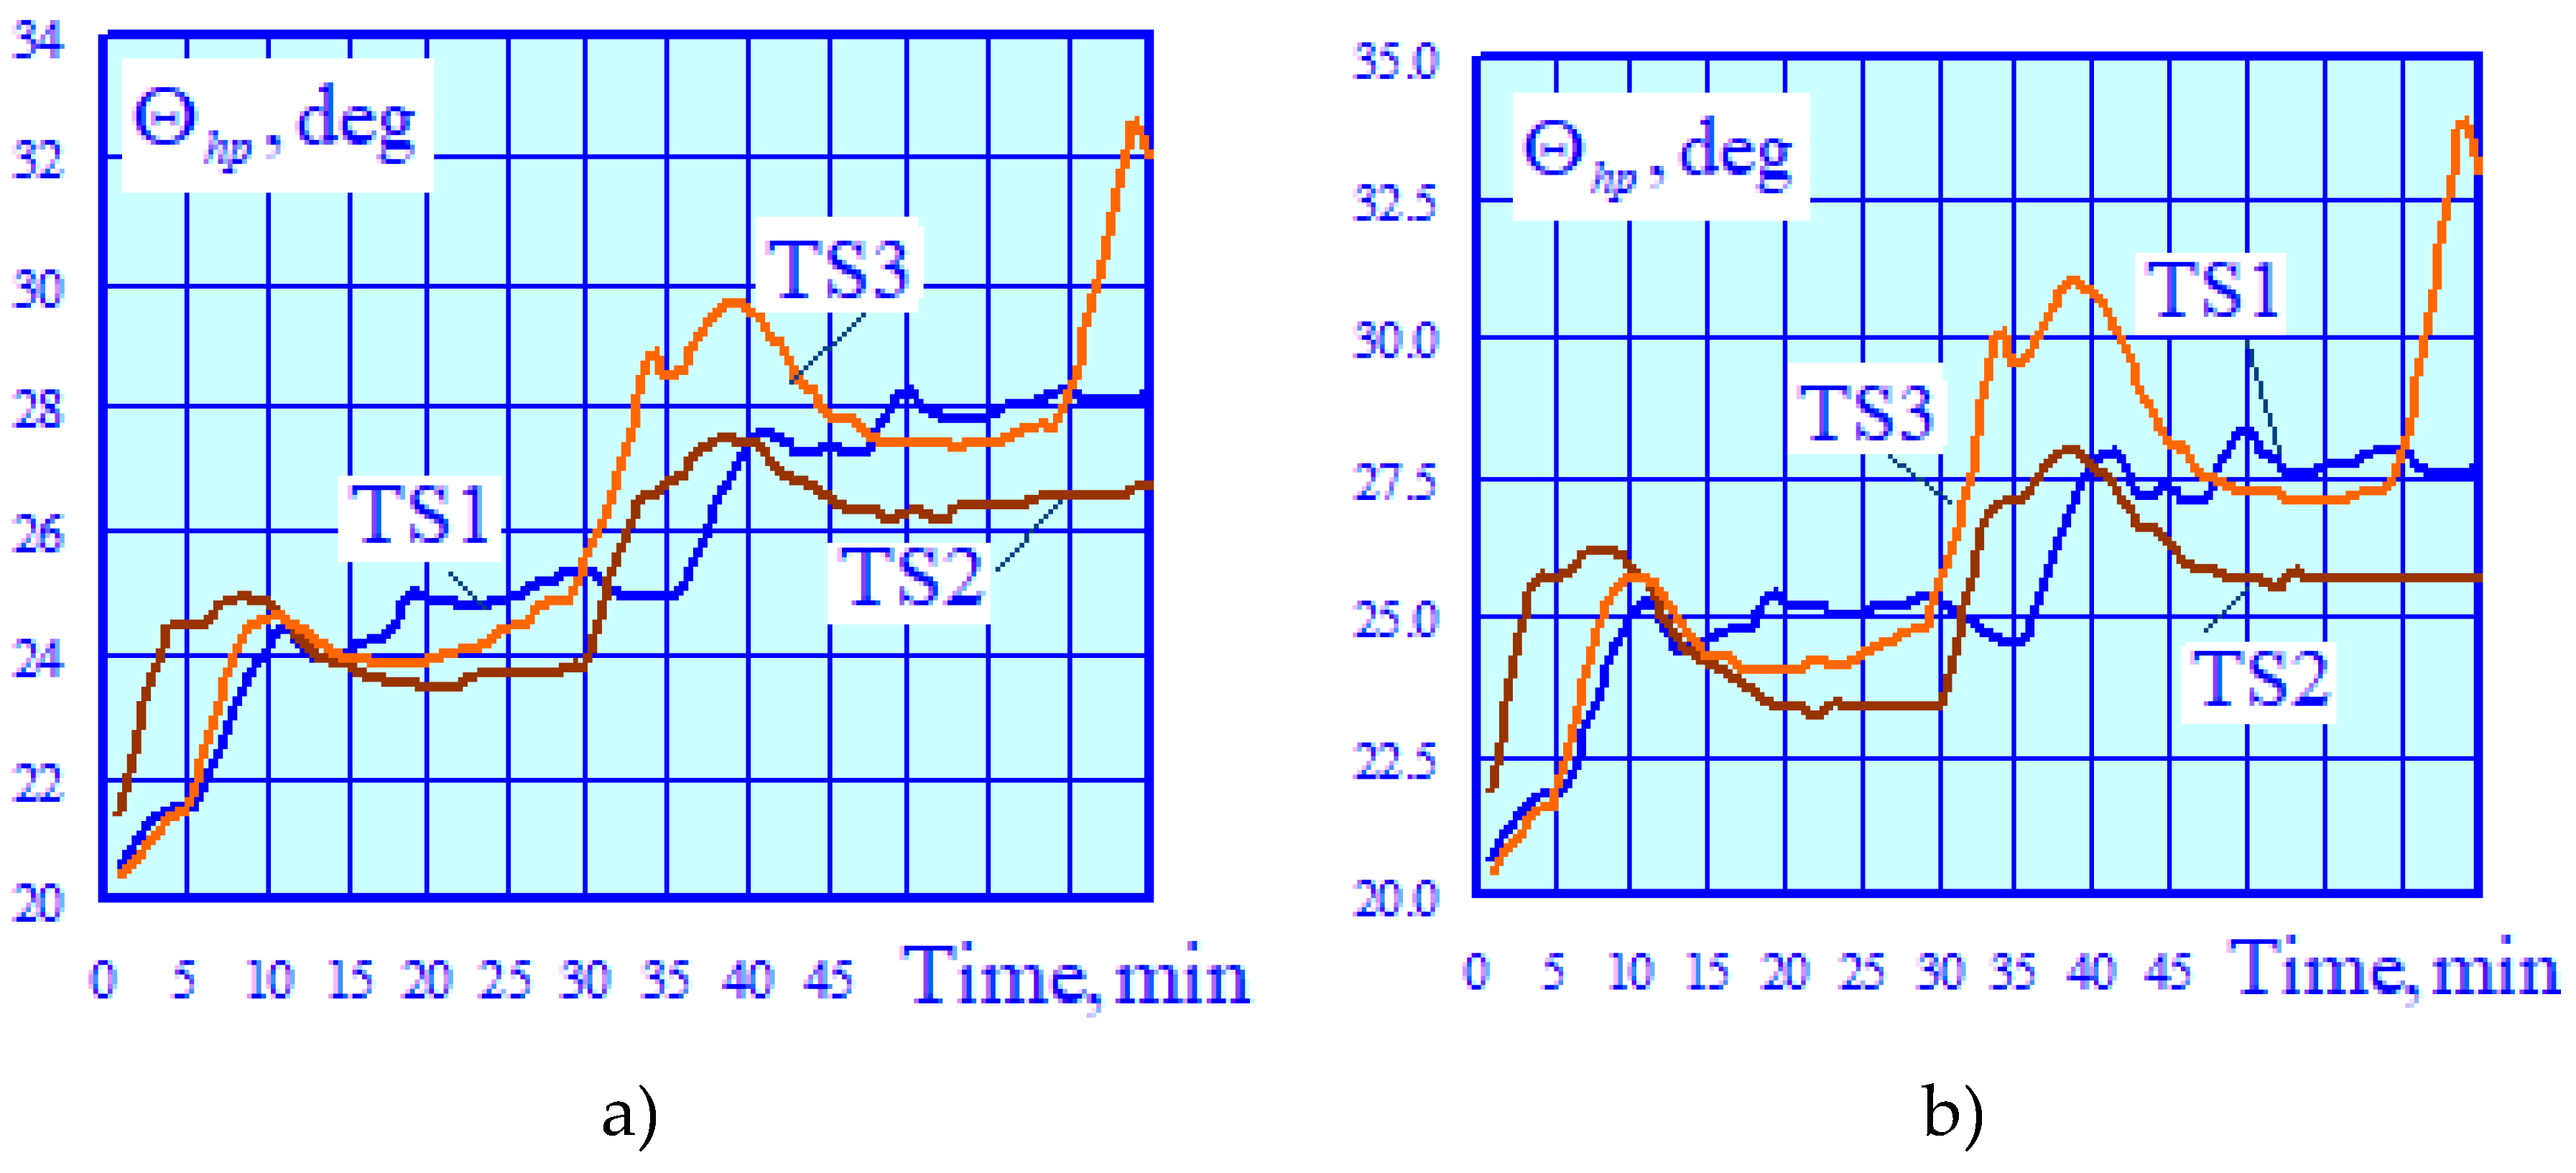
Figure 20.
Total harmonic distortion on 110 kV buses of TS 3: a – wind turbines are switched on; b – wind turbines are switched off.
Figure 20.
Total harmonic distortion on 110 kV buses of TS 3: a – wind turbines are switched on; b – wind turbines are switched off.
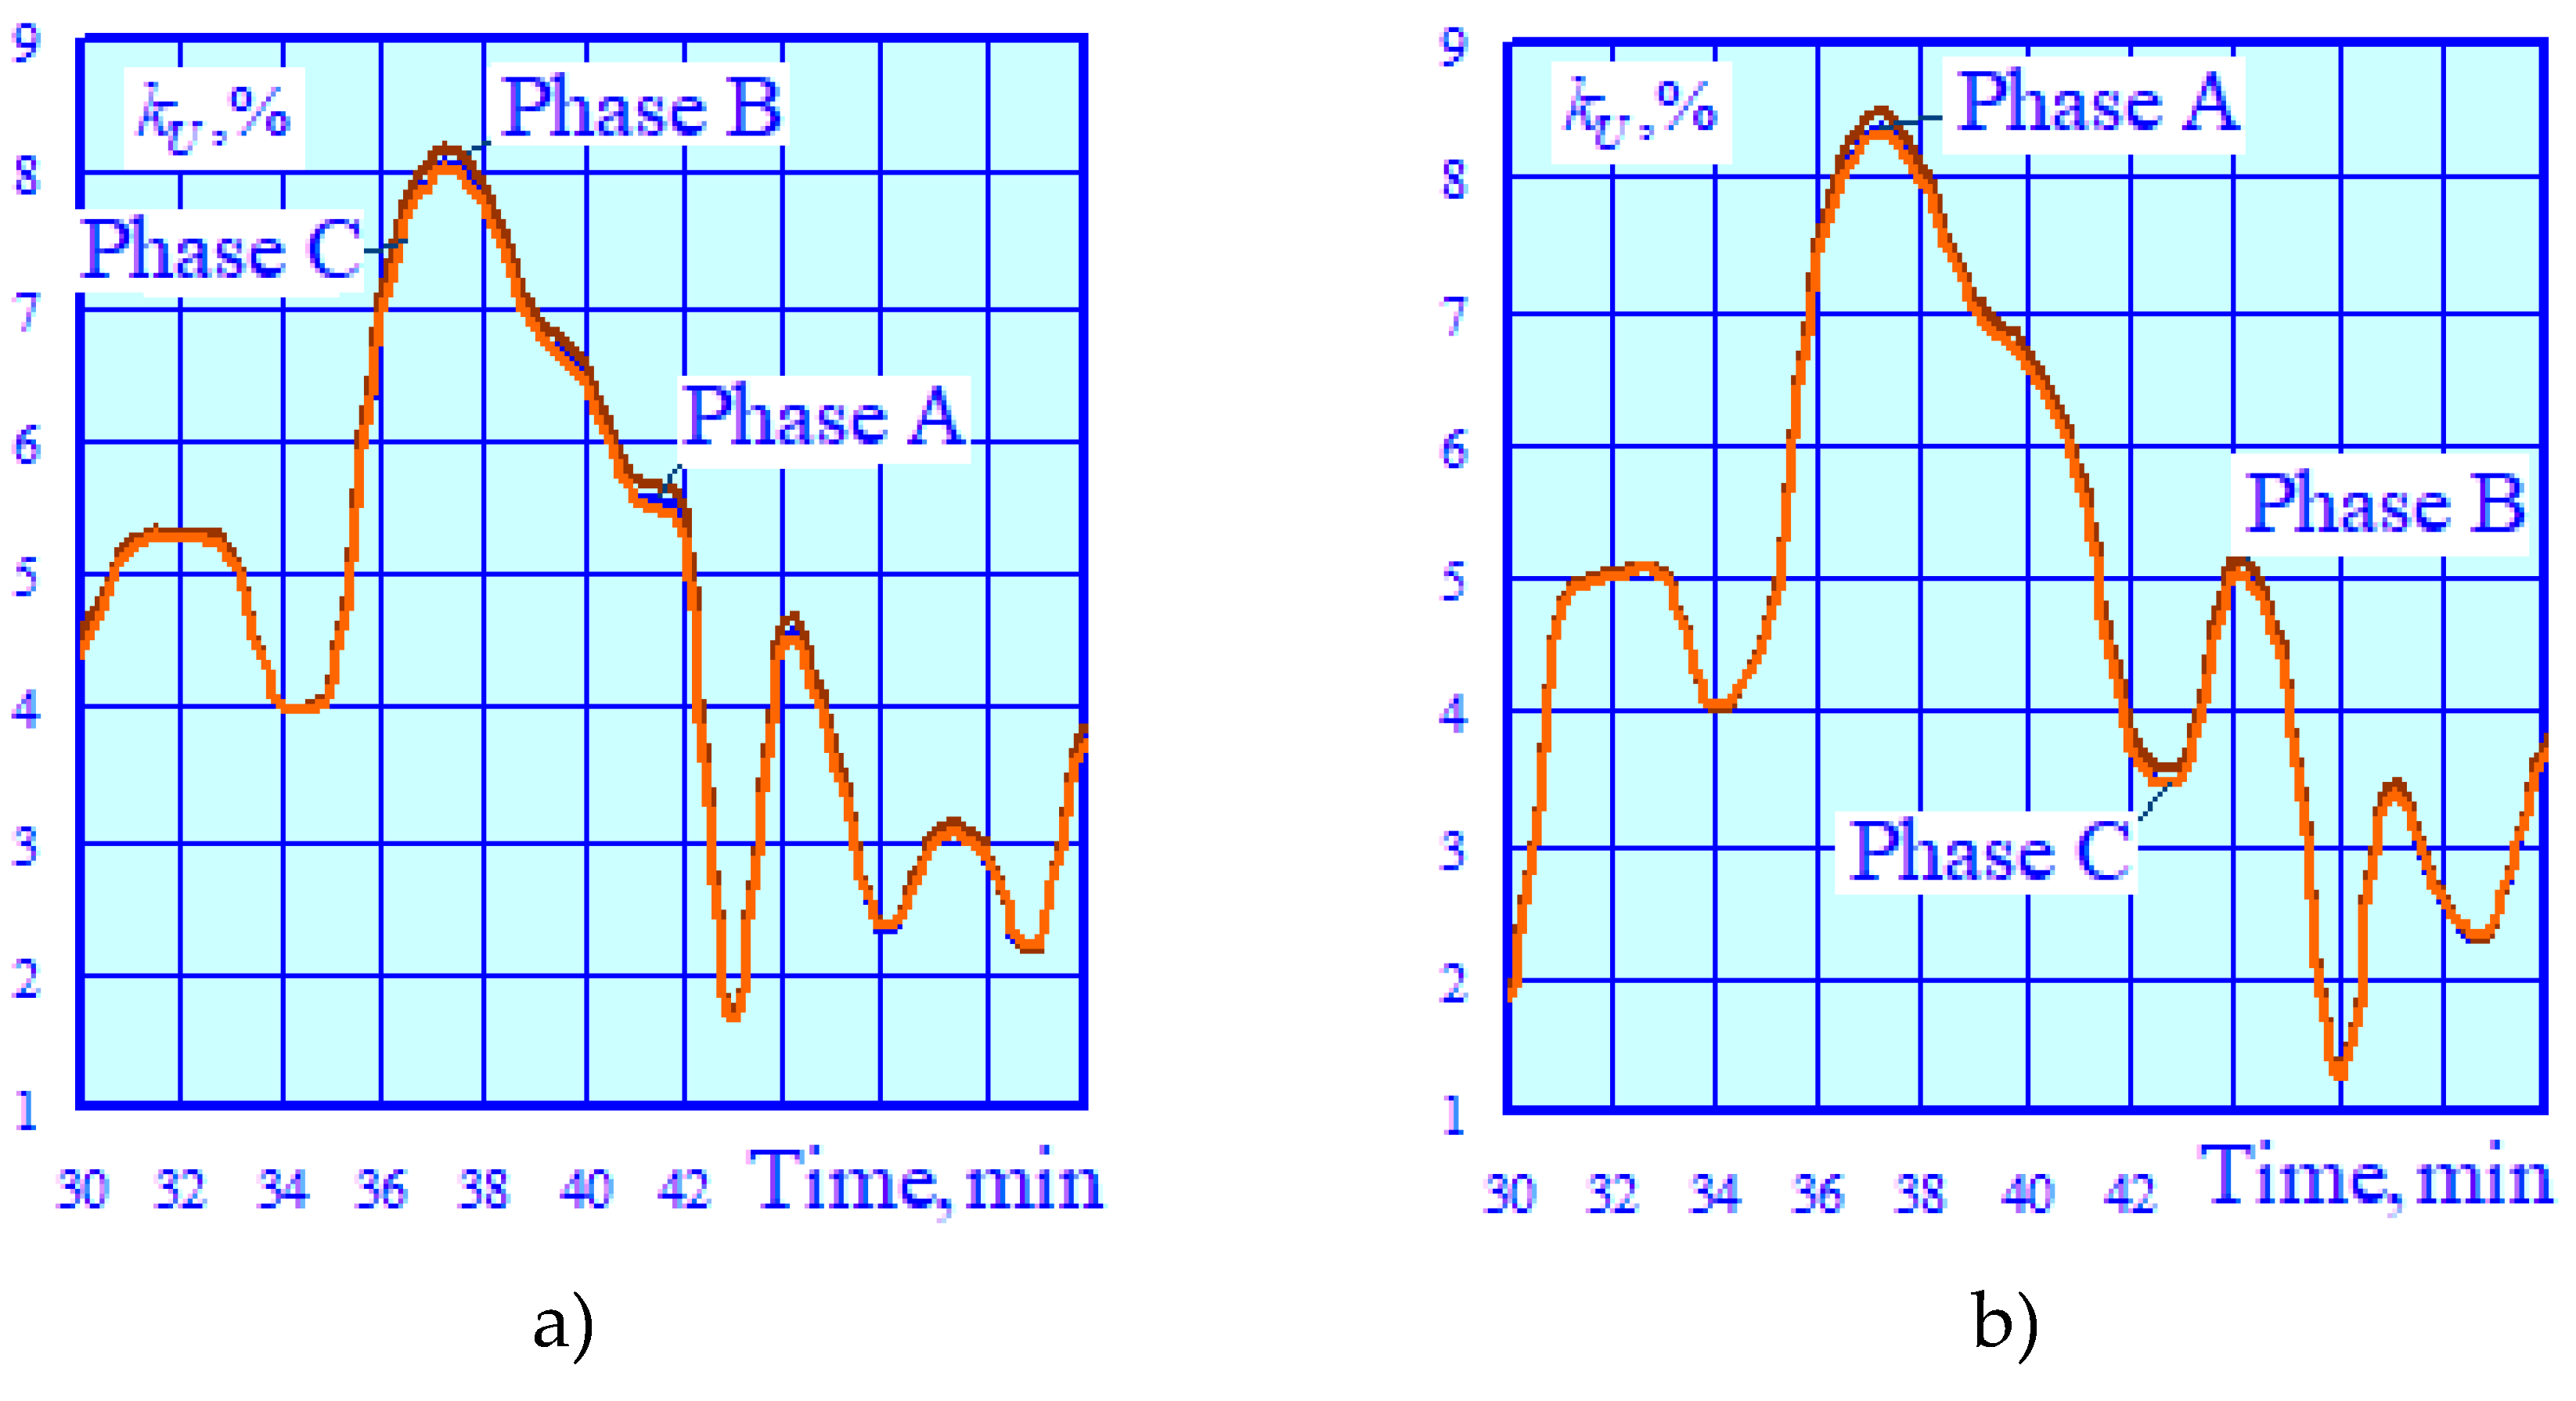
Figure 21.
Voltage curve shapes on 110 kV buses of TS 3 at the 37th minute of modeling.
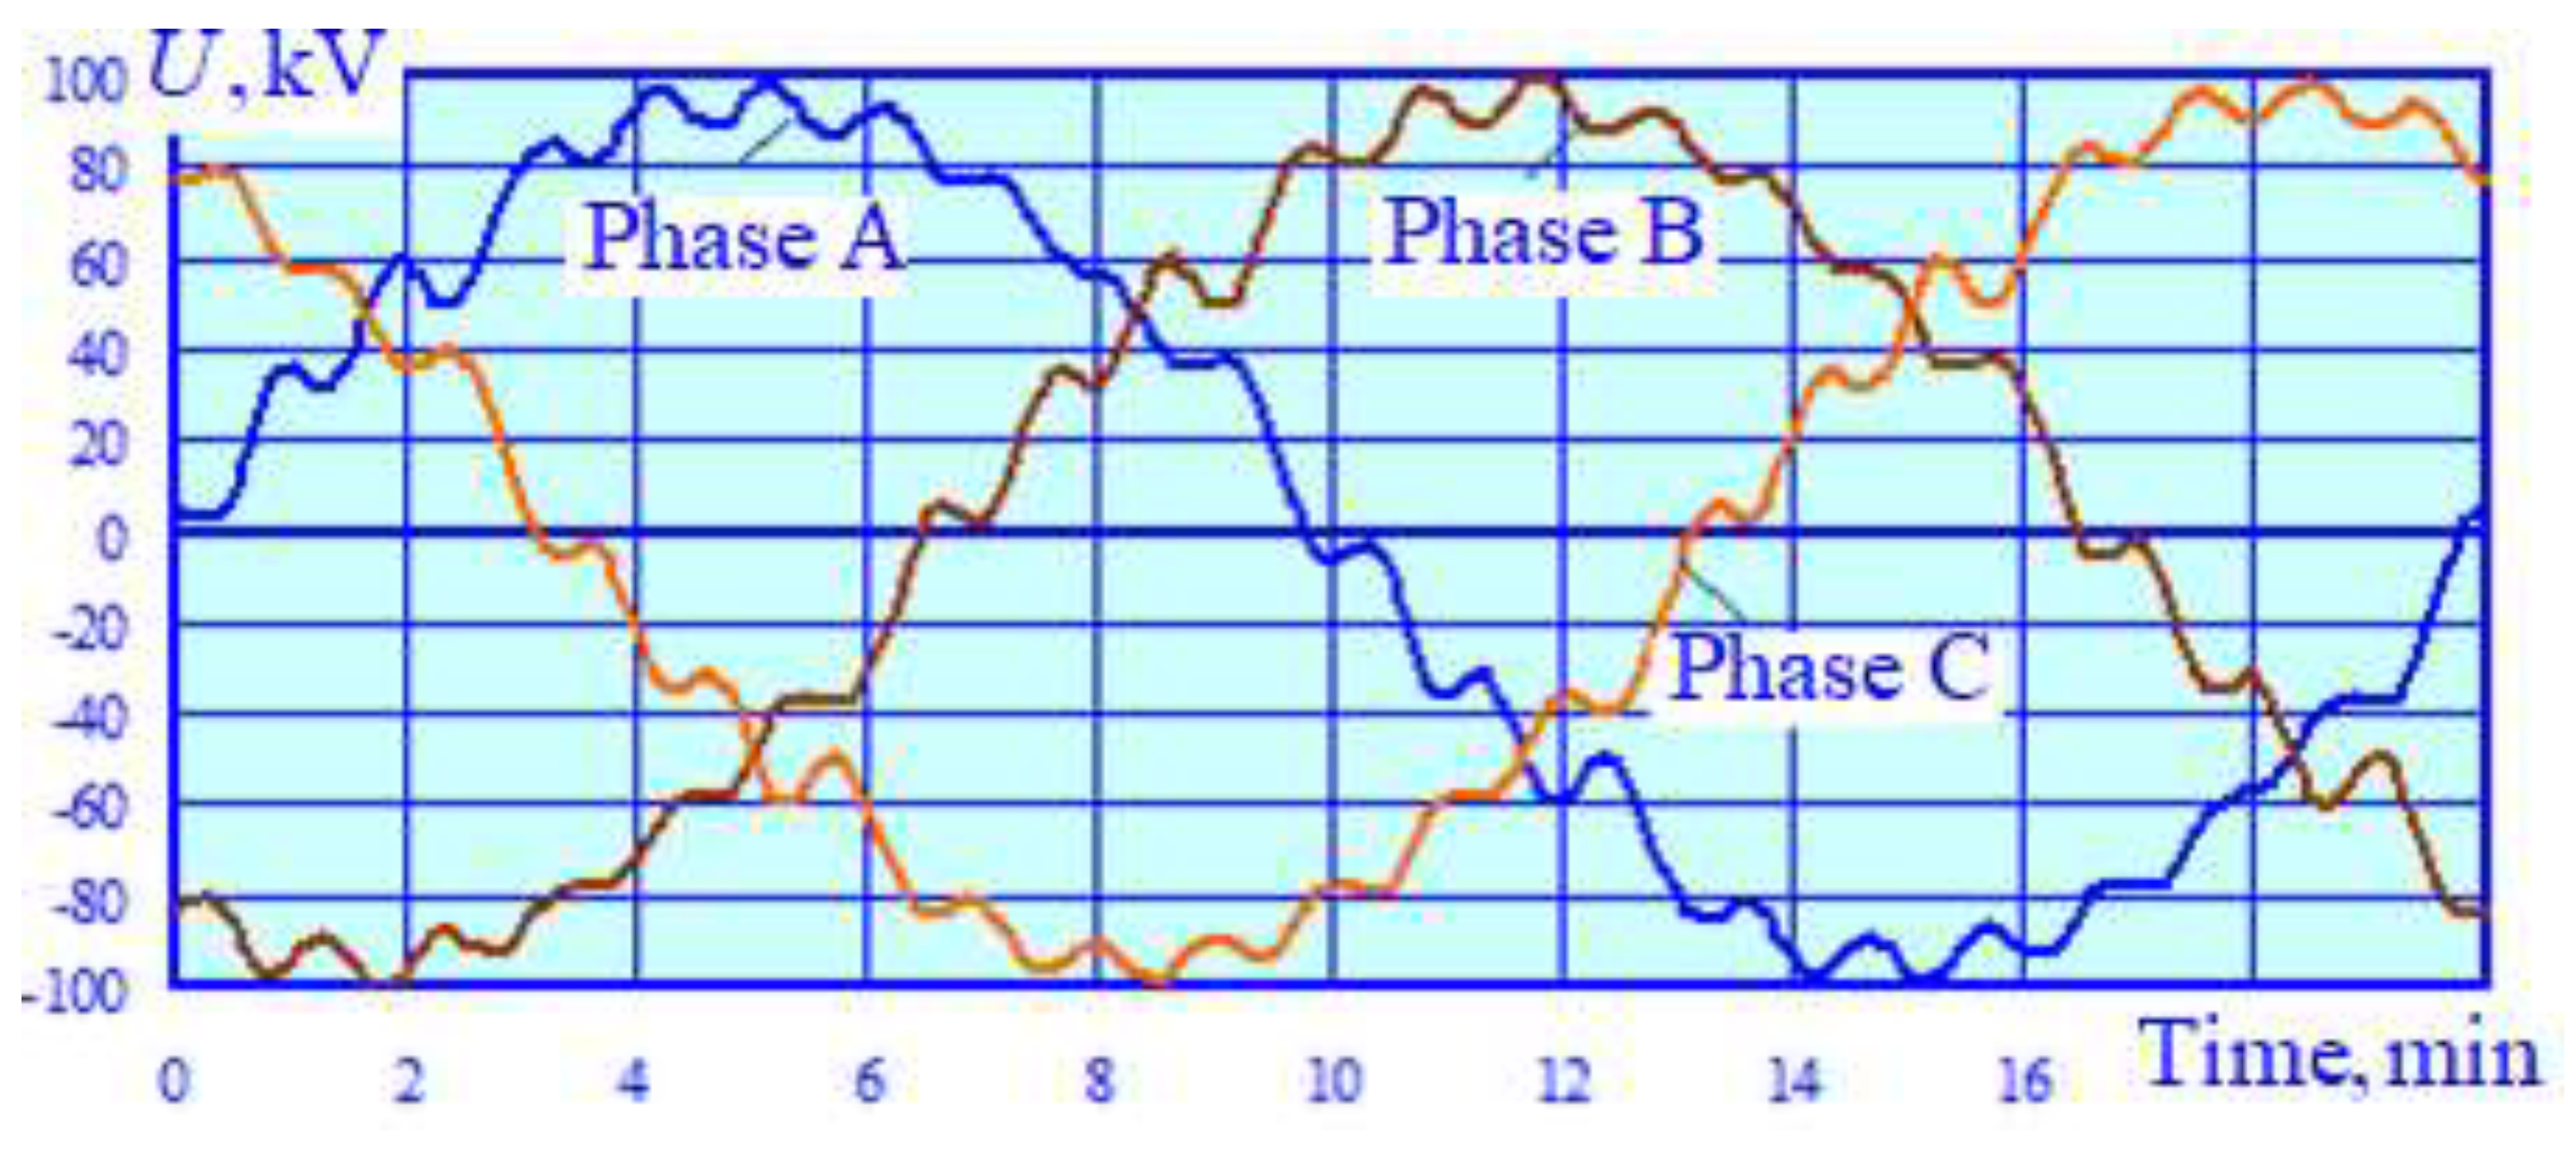
Figure 22.
Maximum kU on 110 kV TS buses: a – TS1; b – TS2; c – TS3.
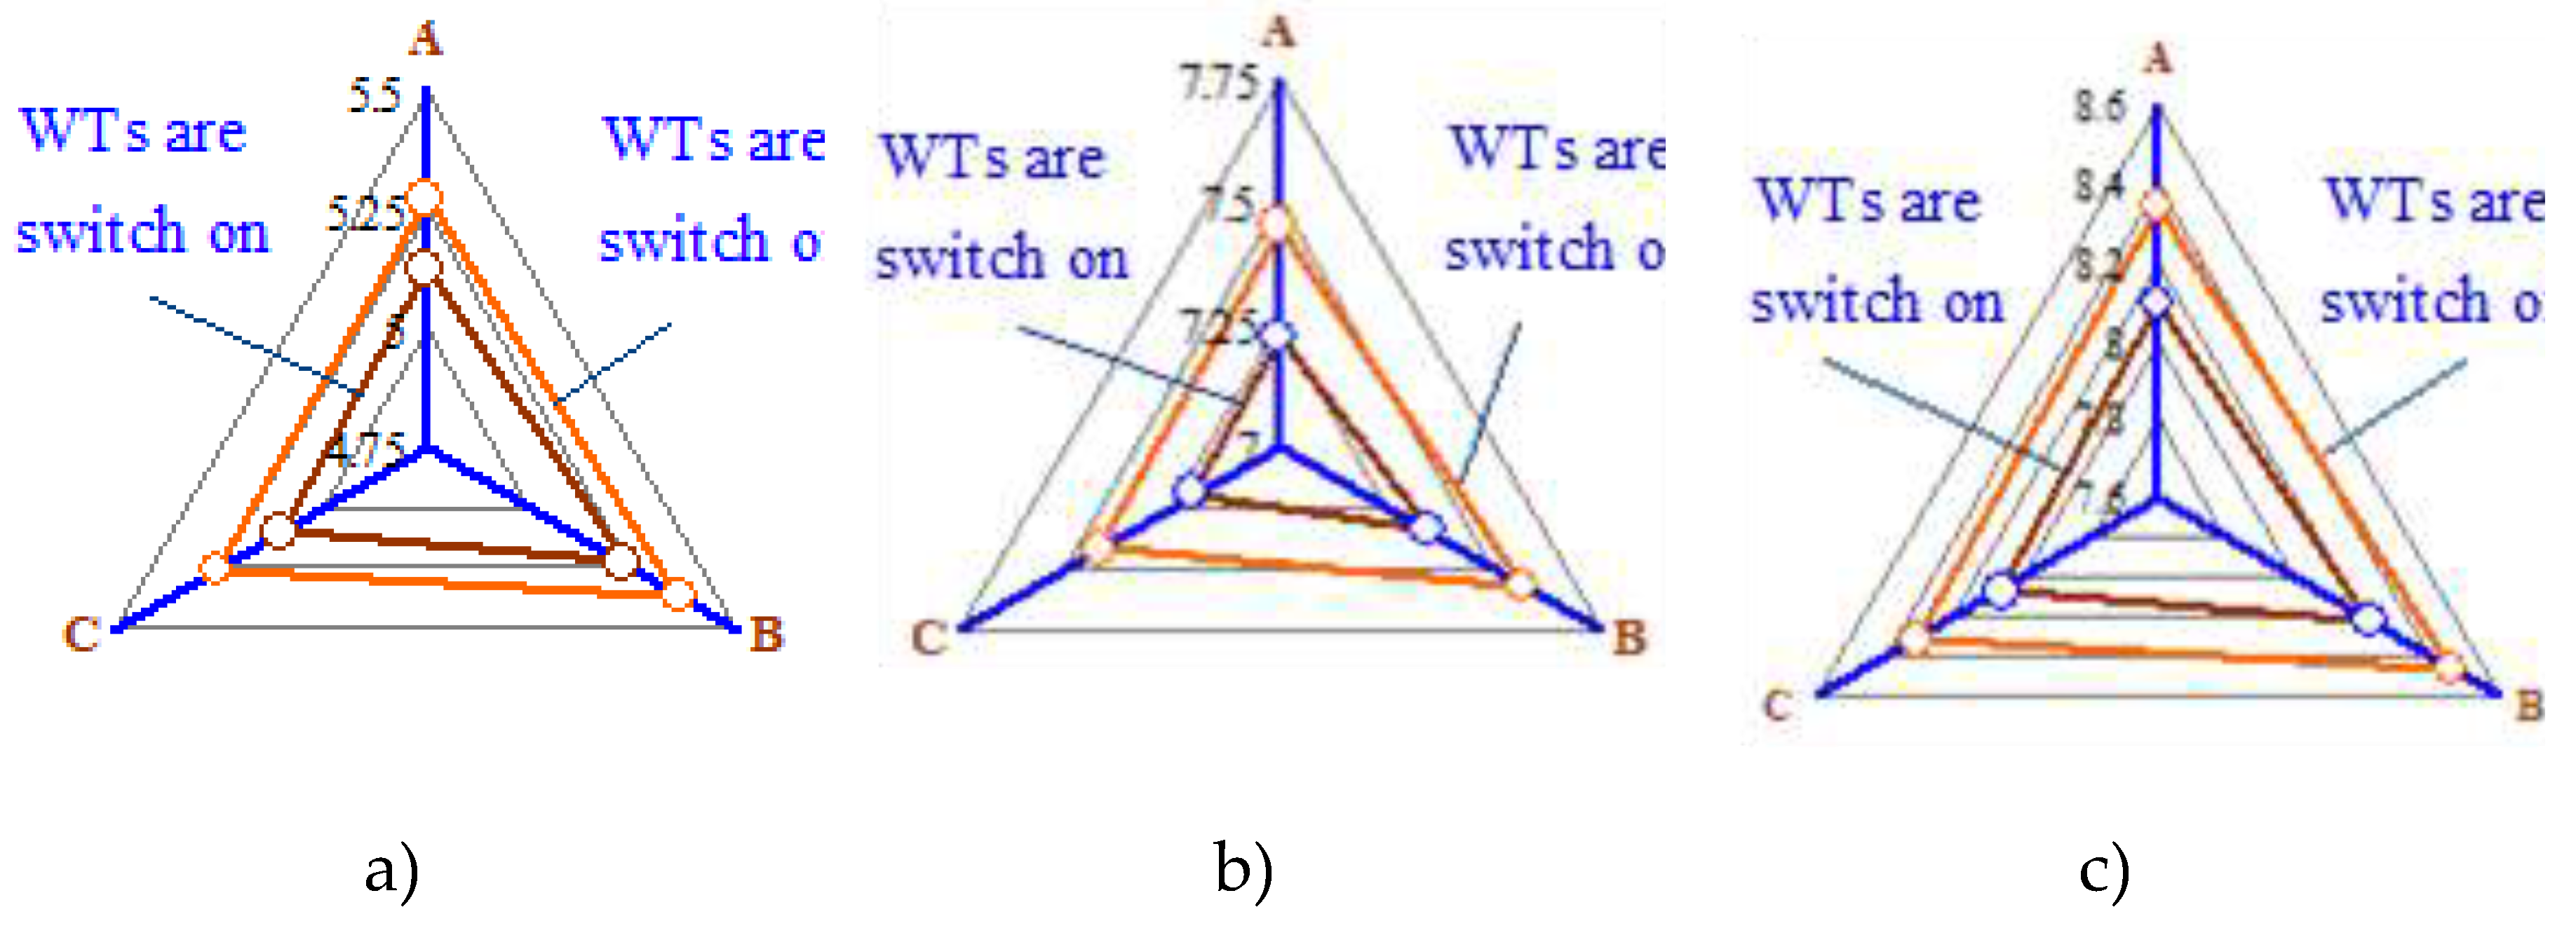

Table 1.
Maximum active power losses and flows in power transmission lines.
| Wind turbine mode | Losses, kW | Flows, MW | ||||
|---|---|---|---|---|---|---|
| Switched on | 25.00 | 16.00 | 8.63 | 9.00 | 11.12 | 8.11 |
| Switched off | 29.00 | 19.00 | 9.00 | 9.79 | 12.17 | 8.28 |
| Difference, % | 16.00 | 18.75 | 4.33 | 8.84 | 9.39 | 2.05 |
Table 2.
Maximum active power losses in step-down transformers, kW.
| Wind turbine mode | Total losses | Copper losses | ||||
|---|---|---|---|---|---|---|
| TS 1 | TS 2 | TS 3 | TS 1 | TS 2 | TS 3 | |
| Switched on | 61 | 39 | 49 | 34.00 | 13.00 | 23.00 |
| Switched off | 66 | 42 | 50 | 40 | 16 | 24 |
| Difference, % | 8.20 | 7.69 | 2.04 | 17.65 | 23.08 | 4.35 |
Table 3.
Maximum active power losses in converter transformers, kW.
| Wind turbine mode | Total losses | Copper losses | ||||
|---|---|---|---|---|---|---|
| TS 1 | TS 2 | TS 3 | TS 1 | TS 2 | TS 3 | |
| Switched on | 63 | 35 | 49 | 44 | 16 | 30 |
| Switched off | 70 | 39 | 50 | 51 | 20 | 31 |
| Difference, % | 11.11 | 11.43 | 2.04 | 15.91 | 25.00 | 3.33 |
Table 4.
Maximum hot spot temperatures of transformers, degrees.
| Wind turbine mode | Step-down transformers | Converter transformers | ||||
|---|---|---|---|---|---|---|
| TS 1 | TS 2 | TS 3 | TS 1 | TS 2 | TS 3 | |
| Switched on | 28.3 | 27.5 | 32.6 | 28.3 | 27.9 | 33.9 |
| Switched off | 28.3 | 28.1 | 32.9 | 28.8 | 28.7 | 34.3 |
| Difference, % | 0.00 | 2.18 | 0.92 | 1.77 | 2.87 | 1.18 |
Table 5.
Maximum and average values of kU on 110 kV TS buses, %.
| Wind turbine mode | TS number | Phase A | Phase B | Phase C | |||
|---|---|---|---|---|---|---|---|
| Aver. | Max. | Aver. | Max. | Aver. | Max. | ||
| Switched on | 1 | 2.91 | 5.12 | 2.97 | 5.22 | 2.89 | 5.1 |
| 2 | 4.09 | 7.22 | 4.18 | 7.35 | 4.07 | 7.2 | |
| 3 | 4.54 | 8.09 | 4.63 | 8.22 | 4.52 | 8.06 | |
| Switched off | 1 | 2.7 | 5.27 | 2.75 | 5.36 | 2.7 | 5.25 |
| 2 | 3.79 | 7.45 | 3.85 | 7.57 | 3.78 | 7.42 | |
| 3 | 4.2 | 8.34 | 4.26 | 8.46 | 4.19 | 8.31 | |
Disclaimer/Publisher’s Note: The statements, opinions and data contained in all publications are solely those of the individual author(s) and contributor(s) and not of MDPI and/or the editor(s). MDPI and/or the editor(s) disclaim responsibility for any injury to people or property resulting from any ideas, methods, instructions or products referred to in the content. |
© 2026 by the authors. Licensee MDPI, Basel, Switzerland. This article is an open access article distributed under the terms and conditions of the Creative Commons Attribution (CC BY) license (http://creativecommons.org/licenses/by/4.0/).
Copyright: This open access article is published under a Creative Commons CC BY 4.0 license, which permit the free download, distribution, and reuse, provided that the author and preprint are cited in any reuse.


