
Submitted:
28 January 2026
Posted:
06 February 2026
You are already at the latest version
Abstract
Background/Objectives: Rapid and accurate electrocardiogram (ECG) interpretation is essential for timely recognition of ST-elevation myocardial infarction (STEMI) and initiation of reperfusion therapy in the emergency department (ED). We evaluated the diagnostic performance of a real-time artificial intelligence (AI) ECG interpretation system and its pragmatic impact when integrated into routine ED workflows. Methods: This prospective, single-center pragmatic observational study was conducted in a regional emergency medical center ED in Busan, Republic of Korea (1 January–31 December 2024). Consecutive adults (≥18 years) undergoing 12-lead ECG for cardiovascular-related symptoms were enrolled (N = 1524). A predefined alternating-day protocol allocated visits to physician-only interpretation days (physician-days, n = 763) or AI-output disclosure days (AI-days, n = 761). Diagnostic performance for STEMI was assessed using paired ECG-level comparisons between physician-alone interpretation and AI output against a blinded expert-panel reference standard; clinical impact outcomes included reperfusion-related time metrics, hospital length of stay (LOS), and in-hospital mortality. Results: Against the expert reference standard, AI showed higher STEMI sensitivity than physician-alone interpretation (96.7% vs. 68.3%; McNemar p = 0.027), while specificity was lower (75.9% vs. 84.5%; p = 0.018). In pragmatic day-level comparisons, door-to-balloon time was shorter on AI-days (40.0 ± 19.81 vs. 47.34 ± 21.90 min; p = 0.001), and time to PCI was significantly reduced among patients with atypical presentations (42.3 ± 18.21 vs. 57.1 ± 20.11 min; p = 0.013). Among admitted patients, hospital LOS was shorter on AI-days (13 ± 9.21 vs. 17 ± 10.31 days; p = 0.010), whereas in-hospital mortality did not differ significantly between groups (17.0% vs. 16.77%; p = 0.191). Conclusions: Real-time AI-ECG integration in the ED was associated with improved STEMI detection sensitivity and shorter reperfusion-related time metrics, particularly in atypical presentations, and with reduced hospital LOS among admitted patients. Short-term mortality was comparable between groups. Further multicenter studies are warranted to confirm generalizability and to balance benefits against potential false-positive–related operational impacts.
Keywords:
artificial intelligence
; electrocardiogram
; emergency department
; ST-elevation myocardial infarction
; diagnostic performance
1. Introduction
Electrocardiography (ECG) performed in the emergency department (ED) is an essential diagnostic tool for the early identification of acute cardiovascular diseases and can also provide important clues for systemic conditions such as electrolyte disturbances, drug toxicity, and respiratory disorders [1]. In patients presenting with chest pain, palpitations, or dyspnea, rapid ECG-based evaluation plays a pivotal role in the early detection and management of acute coronary syndrome (ACS) [2]. Current guidelines recommend obtaining and interpreting a 12-lead ECG within 10 minutes of ED presentation for patients with suspected ACS [3], underscoring the clinical value of ECG as a frontline screening and decision-support test in time-sensitive cardiovascular emergencies [4].
Beyond the ED, prehospital care increasingly emphasizes early assessment, enabling trained providers to acquire 12-lead ECGs in the field and share results with receiving hospitals to facilitate early identification of ST-elevation myocardial infarction (STEMI) and streamline preparation for reperfusion therapy within guideline-recommended time windows [5,6,7]. Nevertheless, reliance on symptoms and clinical signs alone has notable limitations in accurately identifying acute cardiovascular conditions, particularly among patients with atypical presentations, reinforcing the need for rapid ECG acquisition and interpretation in emergency care since its introduction in the early 20th century [8,9,10].
With the rapid development of artificial intelligence (AI), deep learning–based algorithms capable of learning complex patterns from large-scale datasets have been proposed as tools to reduce interpretation errors and support clinical decision-making [11,12,13]. In Korea, an AI-based ECG analysis program has been developed using deep learning technology that can analyze ECG images and provide an automated interpretation; importantly, in ED settings, the system can be implemented to generate outputs immediately after ECG acquisition and display them to clinicians in real time (Figure 1).
Figure 1.
A. Workflow of the ECG Buddy Analyzer. The application captures a photo.
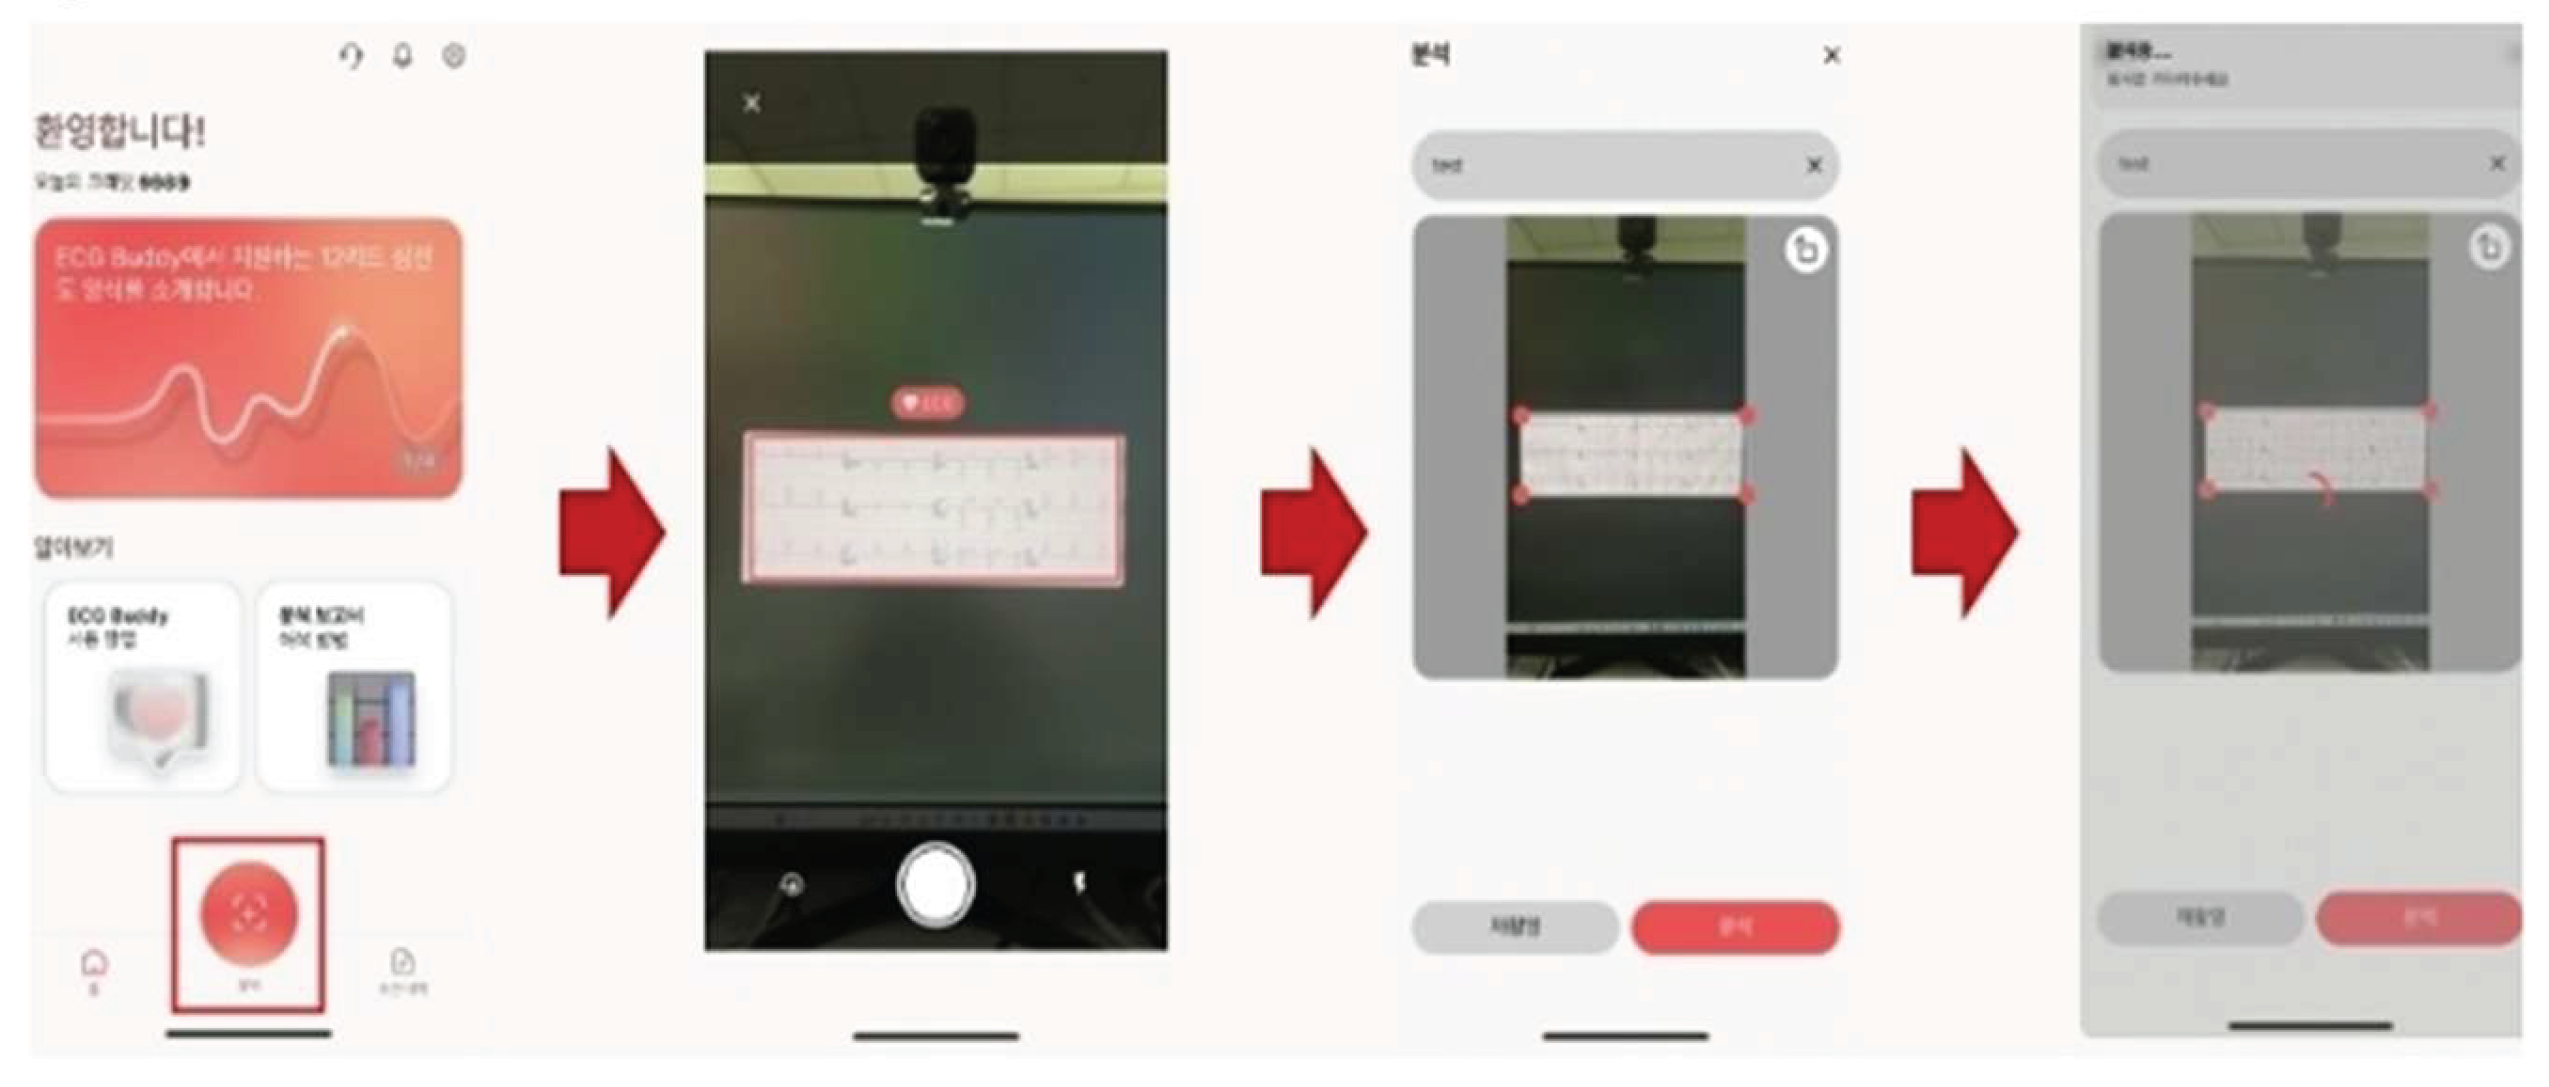
graphed ECG, processes the image using a deep learning convolutional neural network, and displays the analysis results within approximately 10 seconds. Higher-resolution images and clearer labeling have been applied to improve readability.
Figure 1.
B. Record sheet for emergency situations and cardiac dysfunction risk.
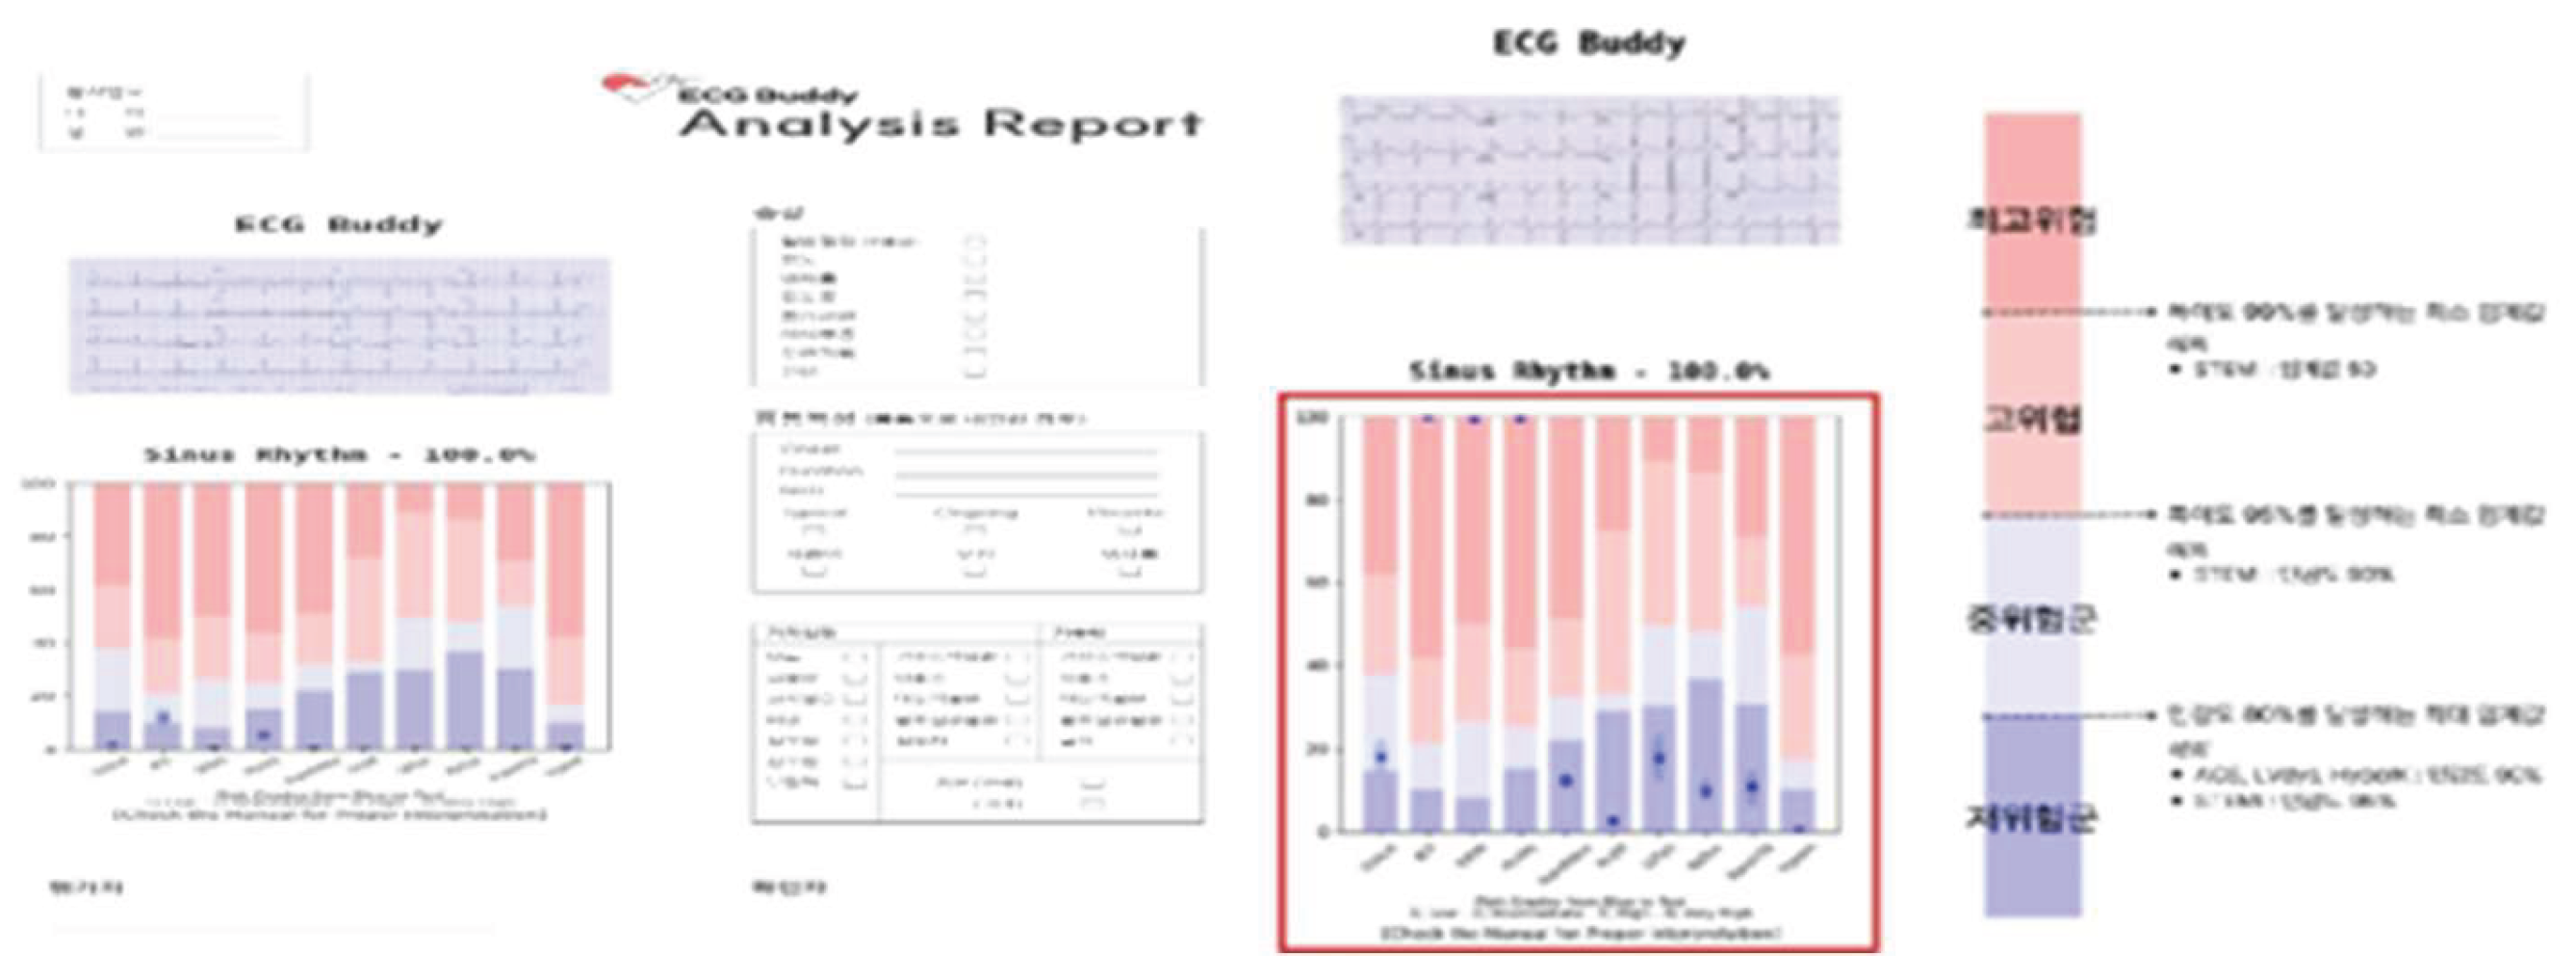
Assessment. It is capable of classifying 35 different types of cardiac rhythms. One of its core features is the stratification of cardiac dysfunction risk into four categories: very high risk, high risk, intermediate risk, and low risk.
Against this backdrop, the present study evaluates the diagnostic performance of an AI-based ECG interpretation system and examines its pragmatic impact when integrated into real-world ED workflows. Although prior work suggests that AI-assisted ECG analysis may improve detection of ischemia and other acute conditions, evidence remains limited regarding real-time workflow integration and downstream clinical processes—such as time to intervention, length of stay, and short-term outcomes—across broad ED populations [14,15].
This study had three objectives: (1) to assess diagnostic concordance between emergency physicians and an AI-based ECG analysis system among adult ED patients presenting with cardiovascular symptoms; (2) to evaluate the association of early AI-assisted ECG interpretation with key clinical process metrics and short-term outcomes among patients diagnosed with myocardial infarction; and (3) to provide empirical evidence on the feasibility and potential clinical impact of integrating AI-driven ECG decision-support tools into emergency care.
2. Materials and Methods
This study was a prospective, single-center, pragmatic observational investigation conducted in the emergency department (ED) of a regional emergency medical center in Busan, Republic of Korea, between 1 January and 31 December 2024. The study evaluated the diagnostic performance and clinical impact of integrating a real-time artificial intelligence (AI) electrocardiogram (ECG) interpretation system (ECG Buddy Analyzer, South Korea) into routine ED care. The manuscript is reported in accordance with STROBE and the AI-specific reporting guidance (CONSORT-AI extension and DECIDE-AI) where applicable, and completed checklists are provided in the Supplementary Materials.
2.1. Clinical workflow and exposure protocol.
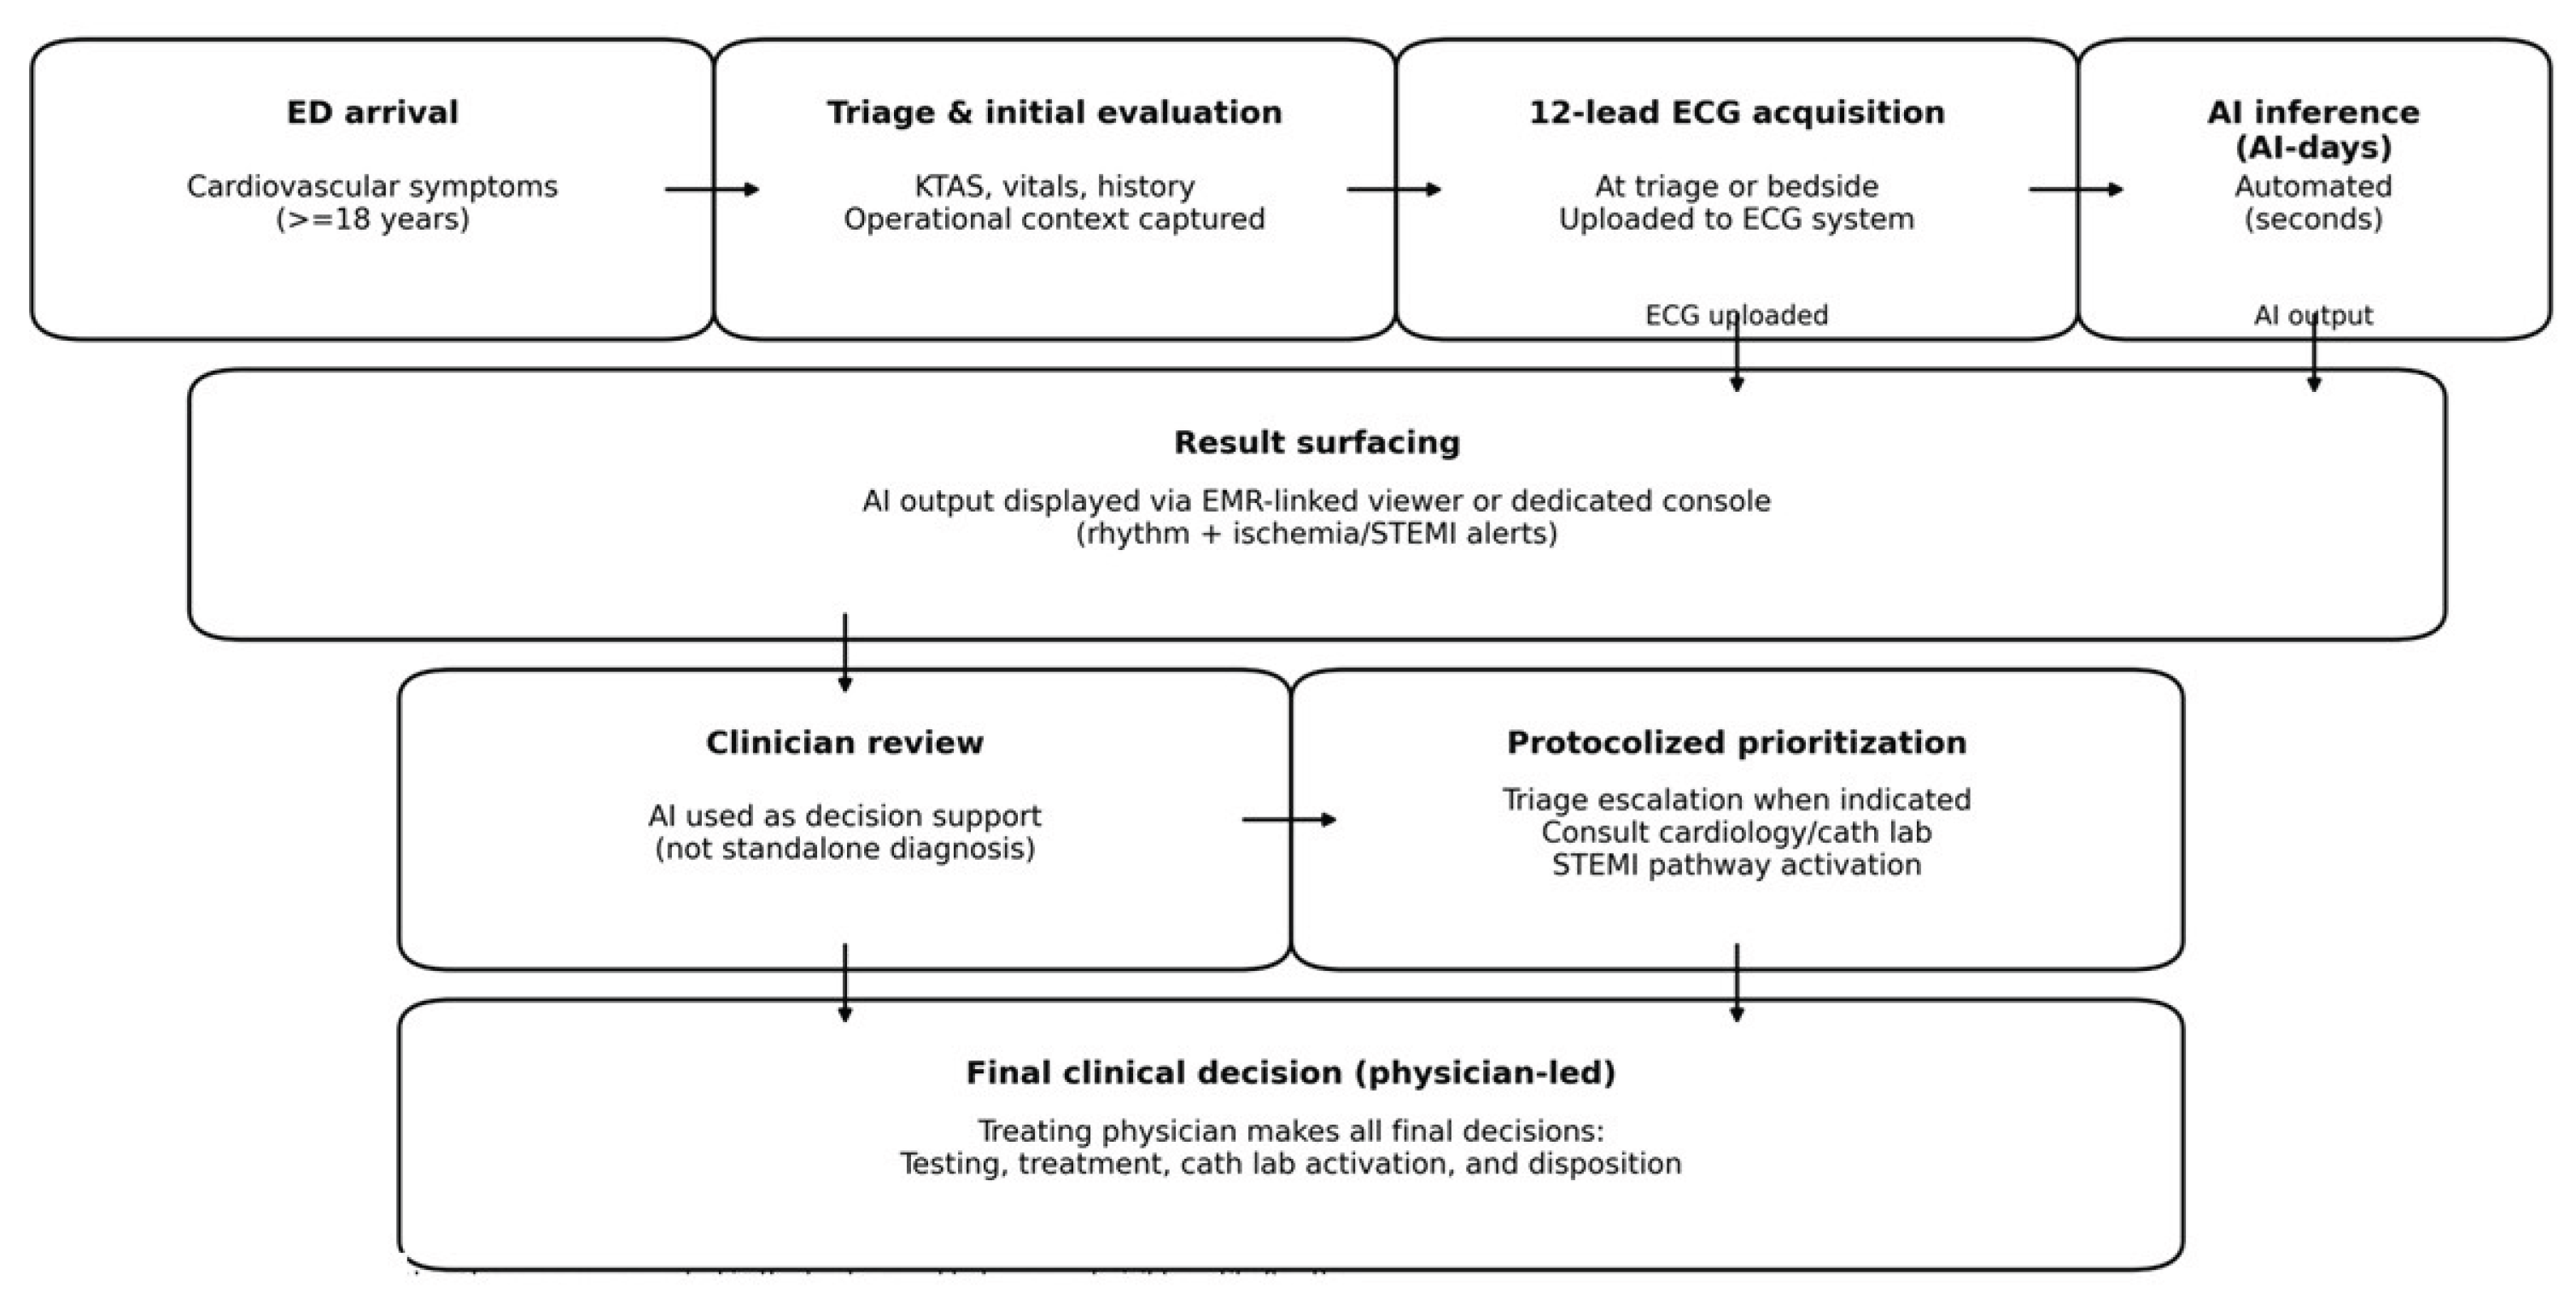
A predefined alternating-day exposure protocol was applied at the ED level. On physician-exposure days (“physician-days”), 12-lead ECGs were interpreted according to usual care by the treating emergency physicians, without real-time AI display. On AI-exposure days (“AI-days”), AI outputs were automatically generated immediately after ECG acquisition and displayed to the treating team in real time via the site’s designated viewing interface as a decision-support tool. In both conditions, the attending physician retained full responsibility for all clinical decisions, including triage escalation, diagnostic testing, activation of STEMI pathways, catheterization laboratory consultation, and disposition. The study did not mandate any specific actions in response to AI outputs. The end-to-end workflow for ECG acquisition, AI inference, and result surfacing is summarized in Figure 2.
Figure 2.
Clinical workflow integration of real-time AI-ECG interpretation on AI-days.
To minimize contamination, on physician-days the AI system performed background analyses for study purposes, but outputs were not visible to clinicians until after the initial physician interpretation had been documented in the medical record. Clinicians received standardized training on the interface and were instructed to use AI outputs as decision support rather than as a standalone diagnosis.
2.2. Study setting and participants.
The study site provides 24/7 cardiology consultation and on-site catheterization laboratory capability and serves as a major regional referral destination for suspected acute coronary syndrome (ACS). Eligible participants were consecutive adult patients (≥18 years) presenting to the ED with cardiovascular-related symptoms for whom a 12-lead ECG was obtained as part of routine care. In total, 1,543 patients were screened. Patients were excluded if they declined participation or withdrew after screening (n = 19). The final analytic cohort comprised 1,524 patients (Figure 3).
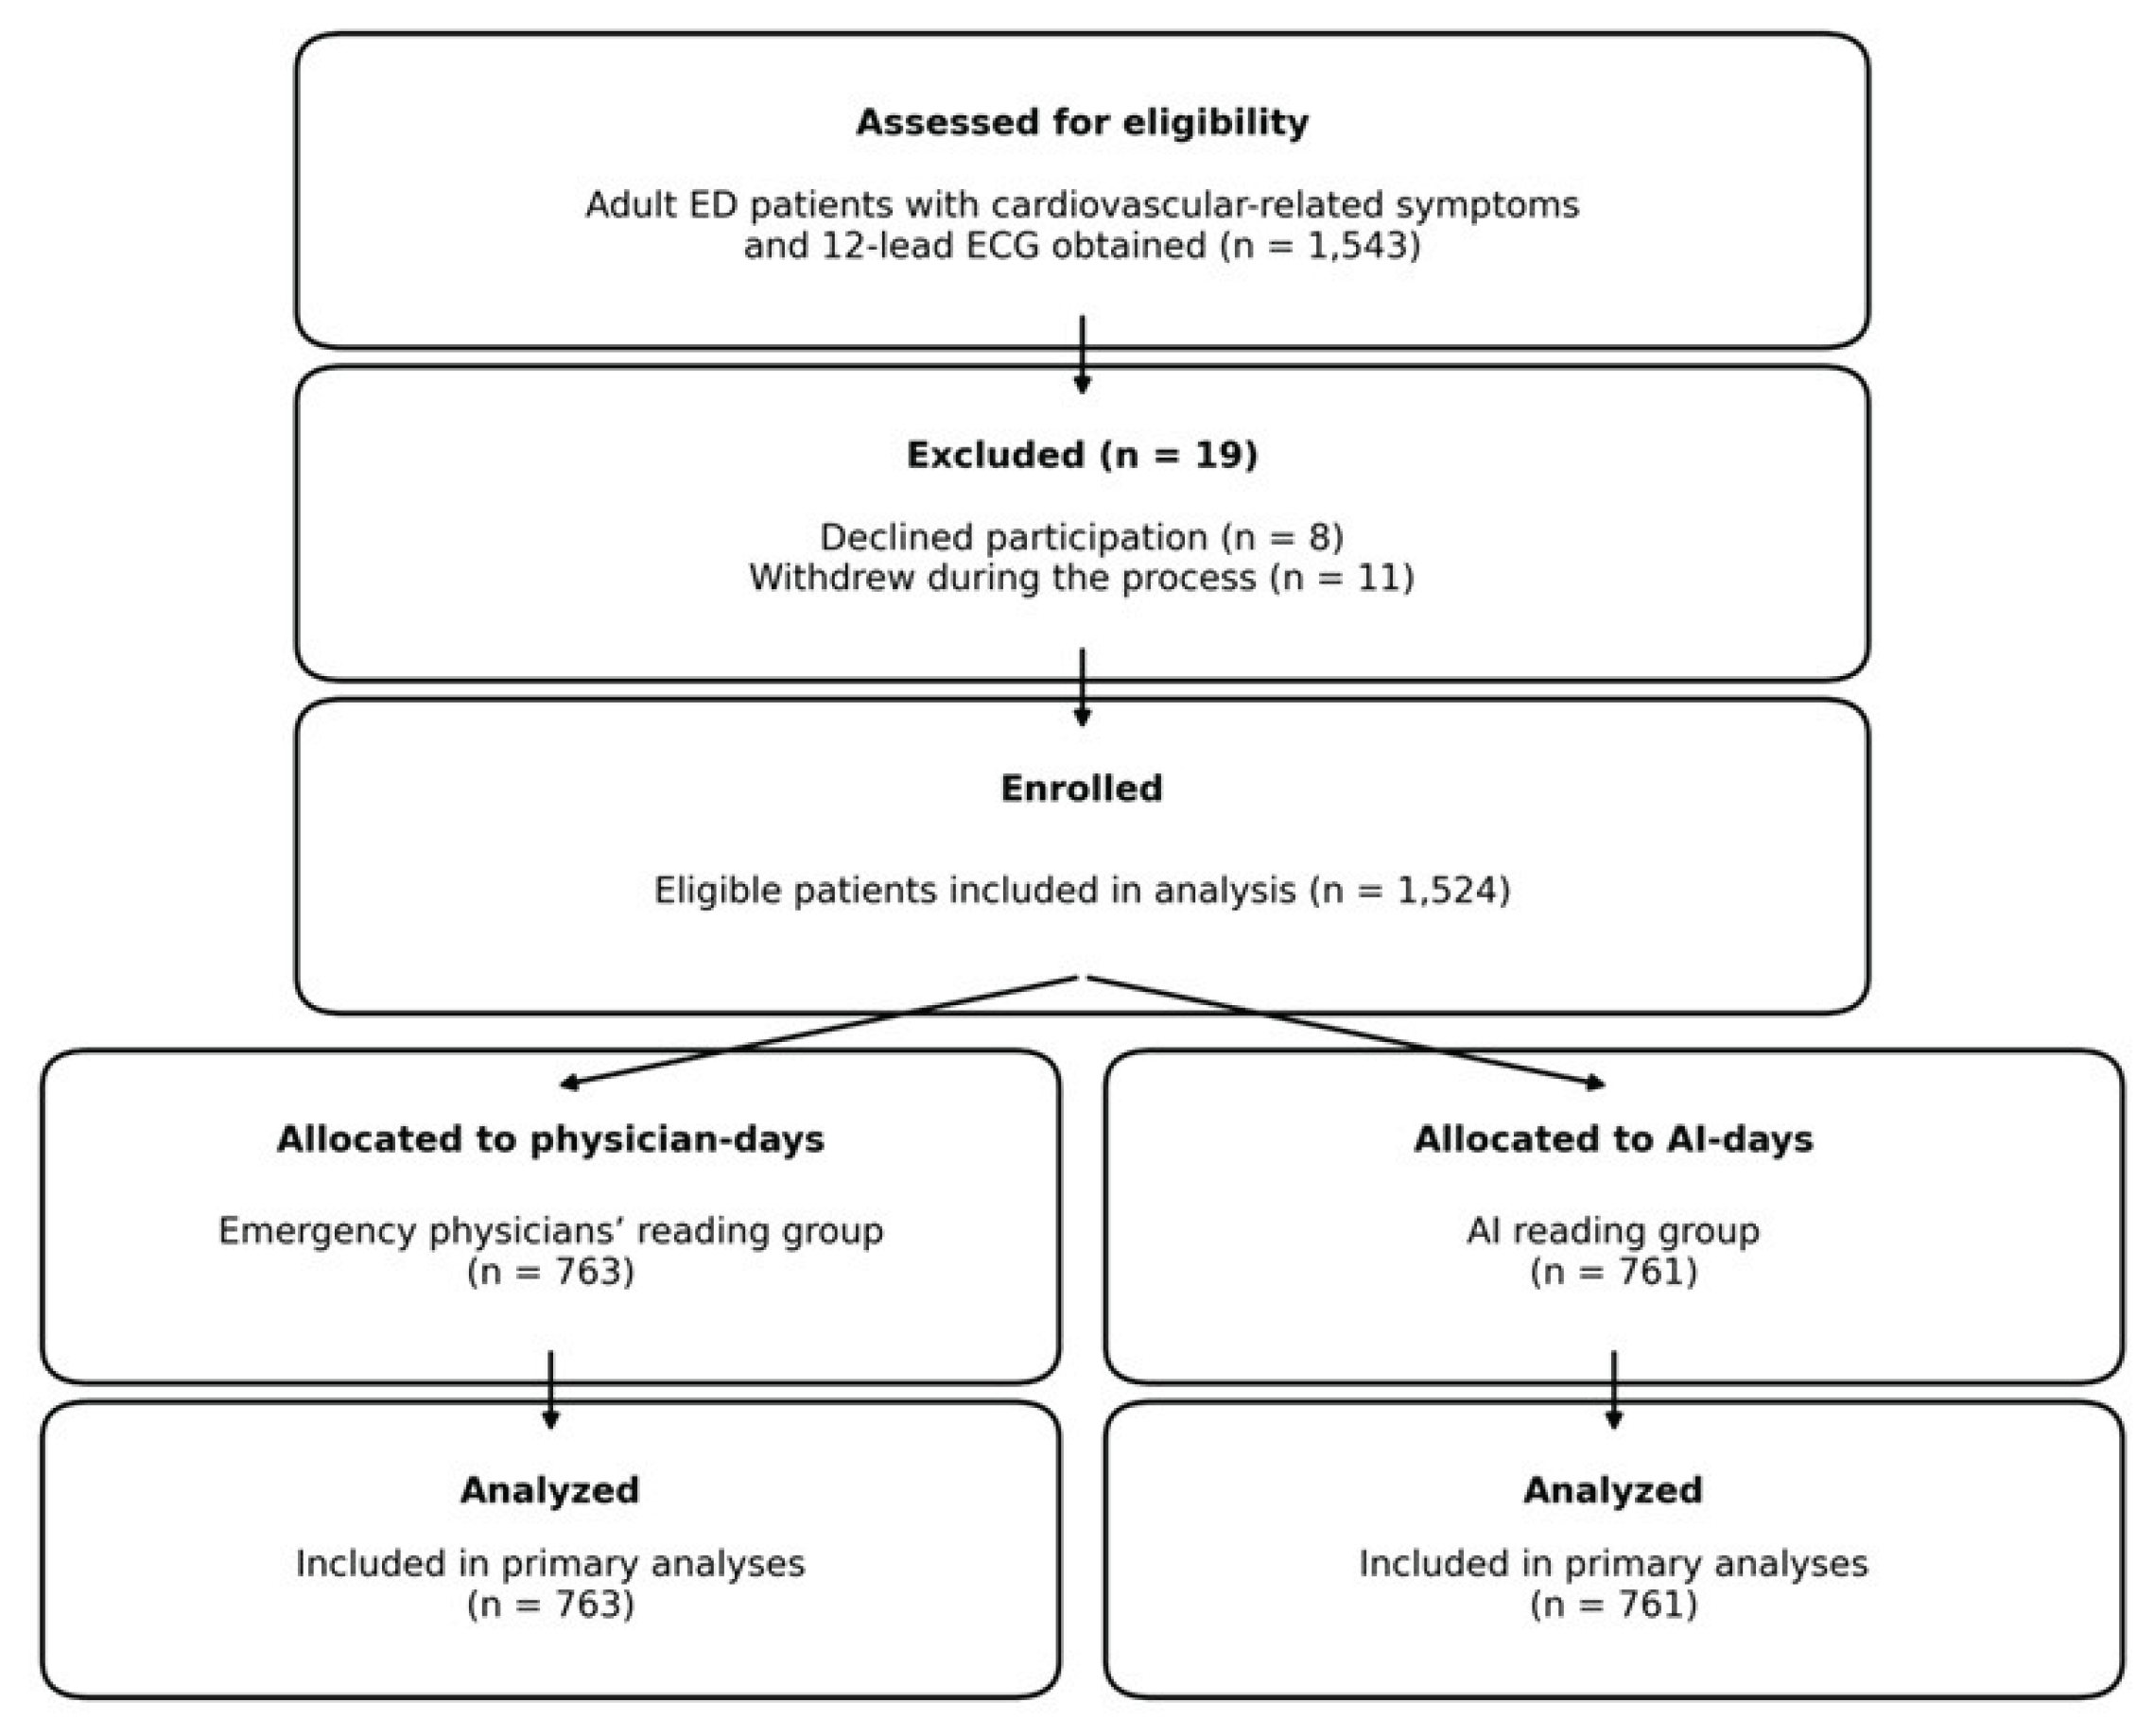
Figure 3.
Study flow diagram. A total of 1,543 adult patients presenting to the emergency department with cardiovascular-related symptoms were screened. After excluding 19 patients (8 declined to participate and 11 withdrew during the process), 1,524 patients were enrolled and allocated by a predefined alternating-day protocol to the emergency physicians’ reading group (n = 763) or the AI reading group (n = 761); all were included in the primary analyses.
Scheme 2. 3. Ethics and consent.
Written informed consent was obtained whenever feasible. For critically ill patients unable to provide consent at presentation, consent was obtained from a legally authorized representative. When neither the patient nor a proxy was immediately available and time-sensitive care was required, enrollment proceeded under an institutional review board–approved emergency waiver/deferred consent process, and written consent was obtained as soon as practicable. Research staff supported enrollment procedures to avoid delaying emergency care. The study was conducted in accordance with the Declaration of Helsinki and received approval from the institutional ethics committee ([Institution], IRB No.: [Approval ID]).
2.4. AI system and ECG acquisition
Upon ED arrival, patients underwent standard triage and initial evaluation, and a 12-lead ECG was acquired per institutional protocol and uploaded to the hospital ECG management system. On AI-days, uploaded or photographed ECGs were analyzed by the AI engine within seconds, and interpretation outputs—including rhythm classification and ischemia/myocardial infarction alerts—were surfaced to the treating team through the designated clinical interface.
The ECG Buddy Analyzer is a deep learning–based AI-ECG program designed to analyze photographed ECGs and detect a range of cardiac abnormalities, including arrhythmias and cardiac dysfunction, and to provide alerts relevant to ACS and ST-segment elevation myocardial infarction (STEMI). The system can classify 35 rhythm categories and stratifies cardiac dysfunction risk into four levels (very high, high, intermediate, and low), while also providing STEMI-related risk information. Key deployment characteristics (automatic inference immediately following ECG acquisition, result surfacing via the designated viewer, and principles governing clinical exposure and use) are documented in Figure 1. The structured ECG response form used for reference-standard labeling is provided in the Supplementary Appendix.
2.5. Reference standard and outcomes
2.5.1. Diagnostic performance evaluation (paired ECG-level analysis)
Diagnostic accuracy was evaluated using an ECG-level paired-comparison framework. For each ECG, two index assessments were defined the treating emergency physician’s initial clinical interpretation documented in the medical record and the AI system output generated for the same ECG. These assessments were compared against a common reference standard derived from a blinded expert-panel consensus. To preserve a “physician-alone” evaluation, the primary paired diagnostic-performance analysis used ECGs from physician-days, during which AI outputs were generated in the background for study purposes but were not visible to clinicians until after physician documentation was completed. The primary diagnostic endpoint for accuracy analysis was STEMI presence/absence. ECG evidence consistent with NSTEMI was evaluated as a secondary endpoint, acknowledging that definitive NSTEMI diagnosis may require biomarker and clinical information; therefore, NSTEMI findings are interpreted as ECG-based detection performance and are complemented by visit-level clinical outcome analyses.
Performance metrics (sensitivity, specificity, positive predictive value [PPV], and negative predictive value [NPV]) were calculated with exact (Clopper–Pearson) 95% confidence intervals (CIs). Because physician and AI classifications were available for the same ECGs, discordant paired classifications were compared using McNemar’s test (two-sided).
2.5.2. Clinical impact evaluation (pragmatic day-level comparison)
Pragmatic clinical impact was evaluated at the visit level using the predefined alternating-day exposure protocol. On physician-days, ECG interpretation proceeded under usual care without real-time AI display, whereas on AI-days, AI outputs were generated immediately after ECG acquisition and displayed to the treating team as a decision-support tool; clinical decisions remained at the discretion of the attending physician. Prespecified visit-level outcomes included time to PCI, hospital length of stay, ICU admission, in-hospital mortality, and utilization outcomes (angiography/PCI) and disposition.
For clinical impact analyses, regression models compared AI-days versus physician-days with adjustment for baseline covariates (e.g., age, sex, comorbidity burden, KTAS, arrival mode, and initial vital signs) and operational covariates (hour-of-day, weekday/weekend, and calendar month), with additional adjustment for ED crowding surrogates when available. Because exposure assignment occurred by calendar day, cluster-robust standard errors at the day level were used to account for within-day correlation.
2.5.3. Expert panel reference standard
The reference standard was derived from offline review by an expert panel comprising five board-certified emergency medicine specialists with substantial ECG interpretation experience (≥10 years post–board certification). Expert reviewers interpreted ECGs offline using only the ECG tracing and were blinded to study arm assignment, AI outputs, symptoms, vital signs, laboratory/imaging results, treatments, and clinical outcomes. Interpretations were recorded using a structured ECG response form (Supplementary Appendix) and included rhythm classification and the presence/absence of STEMI and ECG evidence consistent with NSTEMI. A consensus reference label was determined by majority vote (≥3 of 5 reviewers). A board-certified cardiologist (>10 years of clinical experience) adjudicated ECGs with discordant expert votes (no majority) and reviewed a random sample of majority-negative ECGs to assess internal consistency. Inter-rater reliability was summarized using Fleiss’ kappa, and the proportion of adjudicated changes was reported.
2.6. Data collection and variables
Data were collected via structured electronic medical record review using predefined variable definitions. Baseline variables included age, sex, arrival mode, triage acuity (Korean Triage and Acuity Scale, KTAS), initial vital signs, and comorbidity burden (Charlson Comorbidity Index, CCI). To capture operational confounding, visit timing (day/evening/night), day of week (weekday/weekend), and calendar month were extracted, along with contemporaneous ED crowding surrogates at ECG time when available (e.g., ED census and boarding count). Follow-up variables included final diagnoses, coronary angiography/PCI, admission, ICU admission, hospital length of stay, in-hospital mortality, and discharge status. Time to PCI was defined as the interval from ED arrival to initiation of PCI. Laboratory data (including CK-MB and troponin I) were extracted, and initial chest radiographs were reviewed for secondary signs of cardiac dysfunction when available.
2.7. Statistical analysis
Statistical analyses were performed using IBM SPSS Statistics (version 27, IBM Corp., Armonk, NY, USA). Categorical variables are presented as counts (percentages) and continuous variables as mean (standard deviation) or median (interquartile range), as appropriate.
2.7.1. Diagnostic performance (paired metrics)
Primary diagnostic performance metrics (sensitivity, specificity, positive predictive value, and negative predictive value) for STEMI and NSTEMI were calculated for (i) clinician interpretation and (ii) AI output, each against the expert panel consensus reference standard. Ninety-five percent confidence intervals were estimated using exact (Clopper–Pearson) methods. Between-method differences were summarized as absolute differences with 95% confidence intervals. Because clinician and AI assessments were available for the same ECGs, paired comparisons of discordant classifications were performed using McNemar’s test, and agreement between clinician and AI was additionally summarized.
Non-inferiority of AI performance versus clinician interpretation was assessed using a prespecified absolute margin of −0.05 for sensitivity and specificity. Non-inferiority was concluded when the lower bound of the 95% confidence interval for the AI-minus-clinician difference exceeded −0.05.
2.7.2. Clinical impact (AI-days vs physician-days)
For pragmatic outcomes (time to PCI, hospital length of stay, and in-hospital mortality), regression models comparing AI-days versus physician-days were fitted with adjustment for baseline covariates (age, sex, CCI, KTAS, arrival mode, and initial vital signs) and operational covariates (hour-of-day, weekday/weekend, and calendar month), with additional adjustment for ED operational context (crowding proxies) when available. Because exposure was assigned by calendar day, day-level cluster-robust standard errors were applied to account for within-day correlation. Prespecified sensitivity analyses included stratified models for on-hours versus off-hours and for daytime versus nighttime presentations. As an additional sensitivity analysis, propensity score matching (1:1 nearest-neighbor matching with a caliper of 0.2 standard deviations of the logit) was performed using the same covariates, and matched results were compared with the primary adjusted models.
To avoid post-treatment bias, time to PCI and hospital length of stay were not included as predictors in mortality models; mortality models included baseline and operational covariates only. All tests were two-sided, and p-values < 0.05 were considered statistically significant.
3. Results
3.1. Baseline characteristics at ED presentation (physician-days vs AI-days).
A total of 1524 patients were included in the analysis (physician-days, n = 763; AI-days, n = 761). The mean age was similar between the physician-day and AI-day groups (60.7 ± 19.23 vs. 59.43 ± 21.83 years; p = 0.151). Sex distribution did not differ significantly between groups (female: 63.1% vs. 48.3%; male: 36.9% vs. 51.7%). The AI-day group had a lower comorbidity burden, with a significantly lower Charlson Comorbidity Index compared with the physician-day group (2.7 ± 1.0 vs. 3.2 ± 1.1; p = 0.018). Triage acuity differed between groups: KTAS level 1 presentations were more frequent on AI-days than physician-days (43.5% vs. 36.7%; p = 0.021), whereas KTAS level 2 (26.4% vs. 24.6%; p = 0.671) and KTAS levels 3–5 (30.3% vs. 38.7%; p = 0.723) showed no statistically significant differences.
Regarding presenting symptoms, chest pain (62.6% vs. 65.3%; p = 0.012) and dyspnea (26.0% vs. 27.2%; p = 0.013) were common in both groups, with statistically significant differences in proportions. Among atypical symptoms, epigastric pain was more frequent on AI-days (5.9% vs. 4.4%; p = 0.015), while dizziness (2.3% vs. 1.6%; p = 0.232) and other atypical symptoms (15.8% vs. 13.5%; p = 0.811) did not significantly differ between groups(Table 1).
3.2. Diagnostic performance for STEMI detection versus expert reference standard.
Using the blinded expert-panel consensus as the reference standard, the AI system demonstrated markedly higher sensitivity for STEMI detection compared with treating physician interpretation (97.9% [95% CI, 93.2–100.0] vs. 68.4% [95% CI, 44.2–78.6]; p < 0.001). Specificity was not significantly different between the AI-day and physician-day groups (76.9% [95% CI, 60.7–93.1] vs. 84.6% [95% CI, 70.7–98.5]; p = 0.734).
The positive predictive value (PPV) was high in both groups, with a statistically significant difference favoring AI (89.8% [95% CI, 82.1–97.5] vs. 87.8% [95% CI, 78.1–98.9]; p = 0.003). The negative predictive value (NPV) was substantially higher on AI-days than physician-days (95.2% [95% CI, 86.1–100.0] vs. 48.9% [95% CI, 34.3–63.5]; p < 0.001)(Table 2A).
3.3. Non-inferiority assessment for STEMI detection.
Non-inferiority was assessed using a prespecified absolute margin of −0.05. For sensitivity, the difference (AI minus physician) was +29.5 percentage points (95% CI, −2.5 to 36.9), and the lower bound exceeded −5 percentage points, confirming non-inferiority. For specificity, the difference was −7.7 percentage points (95% CI, −10.7 to 8.9), and non-inferiority was also confirmed because the lower bound remained above margin −5 percentage points (−0.05) (Table 3).
3.4. Treatments and process metrics.
Treatment patterns differed between groups. PCI was performed more frequently on AI-days than on physician-days (57.6% vs. 51.2%; p = 0.021). Use of anticoagulation did not significantly differ between groups (26.6% vs. 35.3%; p = 0.392), and other treatments were also comparable (15.8% vs. 13.5%; p = 0.811). Process measures indicated faster reperfusion-related timelines on AI-days.
The mean door-to-balloon time was significantly shorter in the AI-day group compared with the physician-day group (40.0 ± 19.81 vs. 47.34 ± 21.90 min; p = 0.001). When stratified by presenting symptom type, time to PCI did not differ significantly for typical symptom presentations (40.1 ± 17.61 vs. 43.4 ± 19.22 min; p = 0.064), whereas a significant reduction was observed for atypical symptom presentations on AI-days (42.3 ± 18.21 vs. 57.1 ± 20.11 min; p = 0.013)(Table 4).
3.5. Disposition and clinical outcomes.
ED disposition patterns were generally similar between groups, although admission was more frequent on physician-days than on AI-days (59.5% vs. 52.2%; p = 0.043). Discharge (26.3% vs. 12.8%; p = 0.001), transfer (9.0% vs. 2.3%; p = 0.003), and death in the ED (5.1% vs. 5.9%; p = 0.219) did not differ significantly between groups. In-hospital mortality was comparable between physician-days and AI-days (16.77% vs. 17.0%; p = 0.191). However, among admitted patients, the duration of hospitalization was significantly shorter on AI-days than on physician-days (13 ± 9.21 vs. 17 ± 10.31 days; p = 0.010). Biomarker levels were not significantly different between groups, including NT-proBNP (10,373 ± 11,915vs17,035 ± 19,005; p = 0.002) and troponin I (median [IQR], 0.8 [0.1–9.8] vs. 0.9 [0.1–10.8]; p = 0.881).

Table 5.
Disposition and clinical outcomes.
| Outcome | Physician-days (N=763) | AI-days (N=761) | p value |
| ED disposition, n (%) | |||
| Discharge | 201(26.3) | 98(12.8) | 0.001 |
| Transfer | 69(9.0) | 18(2.3) | 0.003 |
| Admission | 454(59.5) | 398(52.2) | 0.043 |
| Died (in ED) | 39(5.1) | 45(5.9) | 0.219 |
| In-hospital mortality, n (%) | 128 (16.77) | 130 (17.0) | 0.191 |
| Duration of admission, days, mean ± SD | 17±10.31 | 13±9.21 | 0.010 |
| Biomarkers | |||
| NT-proBNP (mean ± SD) | 10,373±11,915 | 17,035±19,005 | 0.002 |
| Troponin I (median, IQR) | 0.9(0.1–10.8) | 0.8 (0.1–9.8) | 0.881 |
ED disposition categories were discharge, transfer, admission, and death in the ED. In-hospital mortality was defined as death occurring during the index hospitalization. Length of stay (LOS) refers to hospital LOS among admitted patients. Biomarker values are reported as shown in the table (mean ± SD or median [IQR]). P values compare physician-days versus AI-days; two-sided p-values < 0.05 were considered statistically significant.
4. Discussion
This study is a prospective, single-center, pragmatic investigation evaluating the impact of integrating a real-time artificial intelligence–based 12-lead electrocardiogram interpretation system into routine emergency department care for adult patients presenting with cardiovascular symptoms. The study was implemented using an alternating-day exposure scheme that distinguished physician-only interpretation days from AI-output disclosure days. Across both conditions, all final clinical decisions—including triage escalation, activation of ST-elevation myocardial infarction pathways, referral for and performance of coronary angiography and percutaneous coronary intervention, as well as transfer, admission, and discharge—remained entirely under the responsibility of the treating physician. To minimize the possibility that AI information could influence initial clinical judgment in the comparison arm, AI analyses were performed in the background on physician-only days, but the results were made available only after the physician’s initial interpretation had been documented in the medical record, thereby reducing exposure contamination.
Within this real-world clinical integration context, the findings can be summarized along three main axes. First, on AI-output disclosure days, sensitivity for detecting ST-elevation myocardial infarction increased and false-negative cases decreased, indicating improved performance toward reducing early missed diagnoses. Because missed ST-elevation myocardial infarction in the emergency department can be catastrophic, the reduction in false negatives carries important clinical implications. Second, on AI-output disclosure days, process metrics leading to reperfusion therapy improved, suggesting an earlier progression along the care pathway; notably, time to intervention was reduced more substantially among patients with atypical presentations. This pattern suggests that in situations where symptoms alone may not immediately prompt prioritization of high-risk cardiovascular emergencies, AI alerts may have heightened risk recognition and facilitated team communication and preparedness, thereby accelerating clinical flow. Third, a reduction in length of stay among admitted patients was observed, whereas no statistically significant difference in short-term mortality was identified. Collectively, these findings suggest that AI does not replace clinical diagnosis but may function as a decision-support tool that more rapidly highlights high-risk signals early in the pathway, contributing to greater efficiency in care processes.
Nevertheless, clinical value cannot be inferred from improved sensitivity alone; specificity, potential increases in false positives, and the associated operational costs must also be considered. In this study, a decrease in specificity or a possible increase in false-positive alerts was observed, implying a potential burden related to additional testing, increased consultations, more frequent catheterization laboratory discussions, and alert fatigue. Accordingly, AI-based ECG interpretation should be positioned not as an independent diagnostic tool but as an adjunct that supports clinicians by prompting earlier attention to high-risk signals. Net benefit is likely to be maximized when institutional operational guidance accompanies implementation, including standardized minimum verification steps in response to AI alerts, standardized pathway activation criteria, and clarified team communication workflows. Even when non-inferiority results are presented, it is more appropriate to interpret them conservatively—as suggesting potential sensitivity gains within a safe performance range—rather than extending them to a claim that AI can substitute for physician interpretation.
Improvements in process metrics are driven not only by algorithmic performance but also by workflow design. When AI outputs are displayed in real time immediately after ECG acquisition, speed and standardization of initial interpretation may increase, and earlier triggering of risk recognition, consultation requests, and catheterization laboratory preparation may become more likely. The observed shortening of reperfusion-related time metrics in this study is consistent with this mechanistic explanation, and the more pronounced effect among atypical presentations further suggests that AI utility may be greater in diagnostically challenging contexts. Conversely, time reductions do not necessarily translate directly into improvements in patient-centered final outcomes, and the realized effect is likely influenced by contextual factors such as consultation infrastructure, catheterization laboratory availability, emergency department crowding, team experience, and the distribution of patient severity.
The observed reduction in length of stay among admitted patients suggests that earlier diagnostic and treatment pathways may advance in-hospital care planning, improve complication prevention, and enhance treatment efficiency, thereby improving downstream resource utilization. However, length of stay is influenced by multiple factors, including disease severity, complications, comorbidity burden, discharge planning, and social determinants. Therefore, it is prudent to interpret this finding not as definitive evidence of improved prognosis, but as an indication that process improvements may positively affect certain resource-utilization outcomes. In addition, the absence of a significant difference in short-term mortality should not be interpreted as evidence that AI integration has no impact on mortality; rather, mortality is multifactorial and highly constrained by study design and event counts. In particular, the alternating-day approach is pragmatic and feasible in real-world practice but is not randomized, and thus baseline imbalances and residual confounding may have influenced mortality comparisons. Consequently, conclusions regarding mortality should be limited to stating that no significant difference was detected, and future verification should rely on multicenter studies with adequate event numbers and designs such as cluster randomization or stepped-wedge implementation.
In comparison with prior studies, multiple investigations have consistently reported that AI-based ECG interpretation improves diagnostic performance—particularly sensitivity—centered on ST-elevation myocardial infarction and supports early risk recognition [16,17,19]. In real emergency department settings, the use of AI-assisted ECG interpretation may accelerate decision-making such as catheterization laboratory activation, with the potential to shorten time to reperfusion therapy [16,17]. However, prior work has also emphasized the possibility of reduced specificity or increased false positives, raising operational concerns that AI adoption may increase testing, consultations, and catheterization laboratory discussions [16]. Moreover, mortality as a final clinical outcome is strongly influenced by multiple factors, and results across studies are often inconsistent or vary depending on event counts and study designs [16,18]. The present study aligns broadly with this literature: it demonstrates improved sensitivity for detecting ST-elevation myocardial infarction and improved reperfusion-related process metrics, while showing no clear mortality difference; the pronounced time reduction among atypical presentations provides additional support for the hypothesis that AI utility may be greatest in diagnostically difficult contexts [17]. At the same time, the need to consider potential increases in false positives and changes in resource utilization reinforces the prevailing recommendation that AI should be interpreted as a clinical decision-support tool rather than a replacement for clinician judgment [19].
From an operational standpoint, the increased proportion of cases proceeding to invasive intervention on AI-output disclosure days suggests that AI alerts may have prompted more proactive evaluation and treatment. This could be beneficial in reducing missed diagnoses, but when coupled with higher false-positive rates it may also raise concerns about unnecessary resource utilization or overtreatment of lower-risk patients. Therefore, evaluating the impact of AI implementation should extend beyond diagnostic accuracy to include changes in disposition patterns, consultation frequency, testing and procedure volumes, alert fatigue, and potential patient-centered harms. This study is meaningful in that it evaluated real-world effects by integrating AI into the live clinical display rather than limiting assessment to offline performance. Future studies should confirm external validity through multicenter validation, reduce confounding through cluster-randomized or stepped-wedge designs, and quantify intermediate process measures capturing how AI alerts alter clinician behavior. In addition, future evaluations should assess operational costs and safety associated with false positives, as well as performance and fairness across vulnerable subgroups such as patients with atypical symptoms, older adults, and women [19].
In conclusion, real-time integration of AI-based ECG interpretation in the emergency department may improve sensitivity for ST-elevation myocardial infarction detection, shorten reperfusion-related time metrics, and potentially improve certain downstream resource-utilization outcomes; however, the magnitude and direction of benefit are likely to depend not only on algorithmic performance but also on workflow design elements such as output presentation, user education, and operational protocols.
5. Conclusions
In conclusion, real-time integration of AI-based ECG interpretation in the emergency department improved sensitivity for STEMI detection and was associated with shorter reperfusion-related process times. A reduction in length of stay among admitted patients was observed, whereas short-term mortality did not differ significantly between groups. These findings support AI-ECG as a clinical decision-support tool that may enhance workflow efficiency, particularly in diagnostically challenging presentations. Further multicenter, rigorously designed studies are needed to confirm generalizability and to balance benefits against false-positive–related operational costs.
Author Contributions
Conceptualization, M.S.C. and Y.D.J.; methodology, M.S.C.; software, M.S.C.; validation, M.S.C., Y.D.J. and W.B.J.; formal analysis, M.S.C.; investigation, M.S.C.; resources, S.J.K. and I.H.K.; data curation, M.S.C., S.I.K. and W.B.J.; writing—original draft preparation, M.S.C.; writing—review and editing, M.S.C., Y.D.J., S.J.K. and I.H.K.; visualization, M.S.C.; supervision, S.I.K.; project administration, Y.D.J.; funding acquisition, W.B.J.. All authors have read and agreed to the published version of the manuscript.
Funding
This research received no external funding.
Institutional Review Board Statement
“The study was conducted in accordance with the Declaration of Helsinki, and approved by the Institutional Review Board of inje university busan paik hospital (IRB No. 2024-11-051).” for studies involving humans.
Informed Consent Statement
“Informed consent was obtained from all subjects involved in the study.”
Data Availability Statement
The data presented in this study are not publicly available due to privacy and ethical restrictions involving human participant data.
Conflicts of Interest
“The authors declare no conflicts of interest.”
Abbreviations
The following abbreviations are used in this manuscript:
ACS Acute coronary syndrome
AI Artificial intelligence
AUC Area under the curve
CAD Coronary artery disease
CCI Charlson Comorbidity Index
CI Confidence interval
KTAS Korean Triage and Acuity Scale
MI Myocardial infarction
NPV Negative predictive value
NSTEMI Non–ST-elevation myocardial infarction
PCI Percutaneous coronary intervention
PPV Positive predictive value
References
- Sattar, Y.; Chhabra, L. Electrocardiogram. StatPearls; StatPearls Publishing: Treasure Island, FL, USA, 2023.
- Amsterdam, E.A.; Wenger, N.K.; Brindis, R.G.; Casey, D.E., Jr.; Ganiats, T.G.; Holmes, D.R., Jr.; Jaffe, A.S.; Jneid, H.; Kelly, R.F.; Kontos, M.C.; et al. 2014 AHA/ACC Guideline for the Management of Patients with Non–ST-Elevation Acute Coronary Syndromes. Circulation 2014, 130(25), e344–e426. [CrossRef]
- Gulati, M.; Levy, P.D.; Mukherjee, D.; Amsterdam, E.; Bhatt, D.L.; Birtcher, K.K.; Blankstein, R.; Boyd, J.; Bullock-Palmer, R.P.; Conejo, T.; et al. 2021 AHA/ACC/ASE/CHEST/SAEM/SCCT/SCMR Guideline for the Evaluation and Diagnosis of Chest Pain. Circulation 2021, 144(22), e368–e454. [CrossRef]
- Bellolio, F.; Gottlieb, M.; Body, R.; Than, M.P.; Hess, E.P. Evaluating Patients with Chest Pain in the Emergency Department. BMJ 2025, 388, r136. [CrossRef]
- Pitta, S.R.; Myers, L.A.; Bjerke, C.M.; White, R.D.; Ting, H.H. Using Prehospital Electrocardiograms to Improve Door-to-Balloon Time for Transferred Patients with ST-Elevation Myocardial Infarction: A Case of Extreme Performance. Circ. Cardiovasc. Qual. Outcomes 2010, 3(1), 93–97. [CrossRef]
- Afolabi, B.A.; Novaro, G.M.; Pinski, S.L.; Fromkin, K.R.; Bush, H.S. Use of the Prehospital ECG Improves Door-to-Balloon Times in ST Segment Elevation Myocardial Infarction Irrespective of Time of Day or Day of Week. Emerg. Med. J. 2007, 24(8), 588–591. [CrossRef]
- O’Gara, P.T.; Kushner, F.G.; Ascheim, D.D.; Casey, D.E., Jr.; Chung, M.K.; de Lemos, J.A.; Ettinger, S.M.; Fang, J.C.; Fesmire, F.M.; Franklin, B.A.; et al. 2013 ACCF/AHA Guideline for the Management of ST-Elevation Myocardial Infarction. Circulation 2013, 127(4), e362–e425. [CrossRef]
- Rivera-Ruiz, M.; Cajavilca, C.; Varon, J. Einthoven’s String Galvanometer: The First Electrocardiograph. Tex. Heart Inst. J. 2008, 35(2), 174–178.
- Swap, C.J.; Nagurney, J.T. Value and Limitations of Chest Pain History in the Evaluation of Patients with Suspected Acute Coronary Syndromes. JAMA 2005, 294(20), 2623–2629. [CrossRef]
- Bruyninckx, R.; Aertgeerts, B.; Bruyninckx, P.; Buntinx, F. Signs and Symptoms in Diagnosing Acute Myocardial Infarction and Acute Coronary Syndrome: A Diagnostic Meta-analysis. Br. J. Gen. Pract. 2008, 58(547), 105–111. [CrossRef]
- Hannun, A.Y.; Rajpurkar, P.; Haghpanahi, M.; Tison, G.H.; Bourn, C.; Turakhia, M.P.; Ng, A.Y. Cardiologist-Level Arrhythmia Detection and Classification in Ambulatory Electrocardiograms Using a Deep Neural Network. Nat. Med. 2019, 25(1), 65–69. [CrossRef]
- Ribeiro, A.H.; Ribeiro, M.H.; Paixão, G.M.M.; Oliveira, D.M.; Gomes, P.R.; Canazart, J.A.; Ferreira, M.P.S.; Andersson, C.R.; Macfarlane, P.W.; Meira, W., Jr.; et al. Automatic Diagnosis of the 12-Lead ECG Using a Deep Neural Network. Nat. Commun. 2020, 11, 1760. [CrossRef]
- Zhang, D.; Yang, S.; Yuan, X.; Zhang, P. Interpretable Deep Learning for Automatic Diagnosis of 12-Lead Electrocardiogram. iScience 2021, 24(4), 102373. [CrossRef]
- Choi, Y.J.; Park, M.J.; Cho, Y.; Kim, J.; Lee, E.; Son, D.; Kim, S.-Y.; Soh, M.S. Screening for RV Dysfunction Using Smartphone ECG Analysis App: Validation Study with Acute Pulmonary Embolism Patients. J. Clin. Med. 2024, 13(16), 4792. [CrossRef]
- Kim, D.; Hwang, J.E.; Cho, Y.; Cho, H.-W.; Lee, W.; Lee, J.H.; Oh, I.-Y.; Baek, S.; Lee, E.; Kim, J.; et al. A Retrospective Clinical Evaluation of an Artificial Intelligence Screening Method for Early Detection of STEMI in the Emergency Department. J. Korean Med. Sci. 2022, 37, e81. [CrossRef]
- Gustafsson, S.; Gedon, D.; Lampa, E.; Gedeborg, R.; Schön, T.B.; Holzmann, M.J.; Sundström, J. Development and Validation of Deep Learning ECG-Based Prediction of Myocardial Infarction in Emergency Department Patients. Sci. Rep. 2022, 12, 20434. [CrossRef]
- Lin, C.; Liu, W.-T.; Chang, C.-H.; Lee, C.-C.; Hsing, S.-C.; Fang, W.-H.; Tsai, D.-J.; Chen, K.-C.; Lee, C.-H.; Cheng, C.-C.; et al. Artificial Intelligence–Powered Rapid Identification of ST-Elevation Myocardial Infarction via Electrocardiogram (ARISE)—A Pragmatic Randomized Controlled Trial. NEJM AI 2024, 1(7), AIoa2400190. [CrossRef]
- Hadida Barzilai, D.; Sudri, K.; Goshen, G.; Klang, E.; Zimlichman, E.; Barbash, I.; Cohen Shelly, M. Randomized Controlled Trials Evaluating Artificial Intelligence in Cardiovascular Care: A Systematic Review. JACC Adv. 2025, 4(11), 102152. [CrossRef]
- Attia, Z.I.; Harmon, D.M.; Behr, E.R.; Friedman, P.A. Application of Artificial Intelligence to the Electrocardiogram. Eur. Heart J. 2021, 42(46), 4717–4730.
Table 1.
Baseline characteristics(N=1,524).
| Characteristic | Physician-days (N=763) | AI-days (N=761) |
p value |
| Age, years, mean ± SD | 60.7±19.23 | 59.43±21.83 | 0.151 |
| Sex, Female n (%) | 481(63.1) | 368(48.3) | 0.232 |
| Charlson Comorbidity Index, mean ± SD | 3.2 ± 1.1 | 2.7 ± 1.0 | 0.018 |
| KTAS level, n (%) | |||
| Level 1 | 280(36.7) | 330(43.5) | 0.021 |
| Level 2 | 189(24.6) | 201(26.4) | 0.671 |
| Level 3–5 | 294(38.7) | 230(30.3) | 0.723 |
| Presenting symptoms, n (%) | |||
| Typical symptoms | |||
| Chest pain | 499(65.3) | 477(62.6) | 0.012 |
| Dyspnea | 208(27.2) | 198(26.0) | 0.013 |
| Atypical symptoms | |||
| Epigastric pain | 34(4.4) | 45(5.9) | 0.015 |
| Dizziness | 12(1.6) | 16(2.3) | 0.232 |
| Others | 102(13.5) | 119(15.8) | 0.811 |
Values are presented as mean ± standard deviation (SD), or number (%), as appropriate. Typical symptoms were defined as chest pain/pressure and dyspnea; atypical symptoms included epigastric discomfort, dizziness, syncope, and other non–chest-pain presentations. KTAS indicates Korean Triage and Acuity Scale; CCI, Charlson Comorbidity Index.
Table 2.
Paired diagnostic performance (ECG-level) of physician-alone interpretation vs AI output for STEMI detection against the blinded expert-panel reference standard.
Table 2.
Paired diagnostic performance (ECG-level) of physician-alone interpretation vs AI output for STEMI detection against the blinded expert-panel reference standard.
| Metric | Physician-alone | AI output | Paired p-value (McNemar) |
| Counts (reference standard) | |||
| Reference positive (P = TP + FN) | 60 | 60 | — |
| Reference negative (Q = TN + FP) | 58 | 58 | — |
| True positives (TP) | 41 | 58 | — |
| False negatives (FN) | 19 | 2 | — |
| True negatives (TN) | 49 | 44 | — |
| False positives (FP) | 9 | 14 | — |
| Performance | |||
| Sensitivity, % (95% CI) | 68.3 (55.0–79.7) | 96.7 (88.5–99.6) | 0.027 |
| Specificity, % (95% CI) | 84.5 (72.6–92.7) | 75.9 (62.8–86.1) | 0.018 |
| PPV, % (95% CI) | 82.0 (68.6–91.4) | 80.6 (69.5–88.9) | — |
| NPV, % (95% CI) | 72.1 (59.9–82.3) | 95.7 (85.2–99.5) | — |
Values are proportions (percent) with 95% confidence intervals (CIs) shown in parentheses. The reference standard was the blinded expert-panel consensus (offline ECG review). Sensitivity was calculated among reference-positive cases (P = TP + FN) and specificity among reference-negative cases (Q = TN + FP). PPV was calculated as TP/(TP+FP) and NPV as TN/(TN+FN). CIs were estimated using exact (Clopper–Pearson) methods. Paired p-values were obtained using McNemar’s test (two-sided) to compare physician-alone interpretation versus AI output on the same ECGs; PPV and NPV are presented descriptively without paired hypothesis testing. Abbreviations: AI, artificial intelligence; CI, confidence interval; PPV, positive predictive value; NPV, negative predictive value; TP, true positive; FP, false positive; FN, false negative; TN, true negative.
Table 3.
Non-inferiority assessment (AI vs physician interpretation) for STEMI detection.
| Metric | Physician-days (N=763) |
AI-days (N=761) |
Difference, %p | Non-inferiority test, margin −5 percentage points (−0.05) |
| Sensitivity (95% CI) | 68.4 (44.2-78.6) | 97.9 (93.2-100.0) | +29.5 (−2.5, 36.9) | Confirmed (−2.5 > −5) |
| Specificity (95% CI) | 84.6 (70.7–98.5) | 76.9 (60.7–93.1) | -7.7 (−10.7, 8.9) | Confirmed (−4.7 > −5) |
Non-inferiority was evaluated for sensitivity and specificity using a prespecified absolute margin of −0.05. Differences are shown as AI minus physician interpretation with 95% CIs. Non-inferiority was concluded when the lower bound of the 95% CI for the difference exceeded margin −5 percentage points (−0.05)
Table 4.
Treatments and process metrics.
| Measure | Physician-days (N=763) | AI-days (N=761) | p value |
| Treatment, n (%) | |||
| PCI | 391(51.2) | 439(57.6) | 0.021 |
| Anticoagulation | 270(35.3) | 203(26.6) | 0.392 |
| Others | 102(13.5) | 119(15.8) | 0.811 |
| Door-to-balloon time, min (mean ± SD) | 47.34±21.90 | 40±19.81 | 0.001 |
| Time to PCI, min (mean ± SD) | |||
| Typical symptom presentations | 43.4±19.22 | 40.1±17.61 | 0.064 |
| Atypical Symptoms presentations | 57.1±20.11 | 42.3±18.21 | 0.013 |
Values are presented as mean ± SD, or number (%), as appropriate. Time-based process metrics were defined a priori: door-to-balloon time was measured from ED arrival to first balloon inflation (or device activation) during PCI, and time to PCI was measured from ED arrival to initiation of PCI. For subgroup comparisons (typical vs atypical symptom presentations), symptom definitions follow Table 1. P values compare physician-days versus AI-days.
Disclaimer/Publisher’s Note: The statements, opinions and data contained in all publications are solely those of the individual author(s) and contributor(s) and not of MDPI and/or the editor(s). MDPI and/or the editor(s) disclaim responsibility for any injury to people or property resulting from any ideas, methods, instructions or products referred to in the content. |
© 2026 by the authors. Licensee MDPI, Basel, Switzerland. This article is an open access article distributed under the terms and conditions of the Creative Commons Attribution (CC BY) license (http://creativecommons.org/licenses/by/4.0/).
Copyright: This open access article is published under a Creative Commons CC BY 4.0 license, which permit the free download, distribution, and reuse, provided that the author and preprint are cited in any reuse.


