Submitted:
06 February 2026
Posted:
06 February 2026
You are already at the latest version
Abstract
This paper proposes a self-supervised modeling framework based on contrastive time-series representation learning to address the complexity of backend system performance anomaly prediction in cloud computing and microservice environments. The method constructs a time-varying service dependency graph and a temporal encoding mechanism to achieve joint representation of spatial structural features and temporal dynamic features, enabling the unsupervised identification of potential performance degradation patterns. The model consists of four main components: a dynamic graph construction module, a graph convolution feature extraction module, a time-series encoding module, and a contrastive learning optimization module. The dynamic graph module captures the evolving dependencies among services, while the time-series encoding module extracts multi-scale temporal features. The contrastive learning module builds positive and negative sample pairs to achieve representation aggregation and differentiation in the latent space. Extensive experiments on real backend system monitoring datasets, along with sensitivity analyses on learning rate, optimizer, temperature coefficient, and data missing rate, demonstrate that the proposed model outperforms mainstream methods in accuracy, precision, recall, and AUC, showing strong generalization and robustness. This study provides a new technical approach for early identification of performance anomalies in complex distributed systems and offers practical, theoretical, and methodological support for intelligent operation and performance assurance in cloud platforms.
Keywords:
spatiotemporal representation learning
; contrastive learning
; performance anomaly prediction
; microservice systems
I. Introduction
With the rapid adoption of cloud computing and microservice architecture, performance anomalies in backend systems have become a key factor affecting service stability and user experience. As the complexity of business systems increases, microservice design decomposes large monolithic applications into numerous fine-grained services [1]. This architecture greatly enhances system flexibility and scalability, yet it also introduces challenges such as complex service dependency chains and dynamically changing invocation paths [2]. System performance is no longer determined by the load of a single node but is influenced by multiple coupled factors, including network latency, resource contention, traffic fluctuations, and service orchestration strategies. This highly dynamic, concurrent, and interdependent environment makes traditional threshold-based or single-dimensional anomaly detection and prediction methods ineffective in capturing potential abnormal patterns, resulting in delayed responses to system health changes. Identifying potential performance degradation or risky nodes in complex microservice systems in advance has therefore become an essential prerequisite for achieving intelligent operation and adaptive scheduling [3].
In microservice systems, performance anomalies often exhibit strong spatiotemporal correlations. On one hand, service nodes are connected through invocation relationships, forming complex dependency topologies where the performance fluctuation of one node may propagate along the call chain and cause cascading effects. On the other hand, system performance metrics such as CPU, memory, latency, and throughput evolve and are affected by multi-scale factors, showing periodic, abrupt, and non-stationary characteristics. Therefore, relying solely on single-point monitoring or static features cannot reveal the internal dynamic evolution of the system. With the refinement of monitoring systems in recent years, large volumes of time-series monitoring data have provided a foundation for anomaly prediction. However, learning discriminative dynamic representations from heterogeneous, multi-source, and noisy data remains a major challenge for high-accuracy prediction. Compared with traditional statistical or machine learning approaches, representation learning can uncover latent structural relationships among data through self-supervised or contrastive mechanisms, offering a new path for modeling complex system states [4].
Contrastive time-series representation learning, as an unsupervised or self-supervised modeling method, can construct a discriminative feature space by measuring the similarity between samples without labeled data. In backend microservice scenarios, performance segments from different time windows can be viewed as temporal slices of the system state. Through contrastive learning mechanisms, the model can enhance its ability to cluster normal patterns and separate abnormal ones, thus effectively depicting the evolution of system health in the latent space. This approach helps capture cross-scale temporal consistency and, through structured temporal contrastive constraints, improves the model's robustness against abnormal disturbances. Particularly in complex systems with multiple nodes and metrics, contrastive representation learning can effectively capture both shared and distinctive patterns among services, providing theoretical and algorithmic support for early detection of performance degradation [5].
From an application perspective, early identification of performance anomalies is critical not only for system stability but also for service quality, resource utilization, and cost control. Traditional alerting mechanisms often depend on post-event detection or manual intervention, which leads to delayed responses and high false alarm rates. In contrast, anomaly prediction models based on contrastive time-series representation learning can detect potential risks before full system degradation occurs. This provides prior information for automated scheduling, elastic scaling, and resource orchestration, enabling the construction of truly intelligent operation systems. Such capability holds significant practical value in large-scale cloud platforms, financial trading systems, online services, and edge computing environments. It enhances the system's self-awareness and self-recovery abilities and establishes the foundation for predictive maintenance and adaptive optimization.
Overall, exploring contrastive time-series representation learning for backend performance anomaly prediction holds important research and practical value. On one hand, it promotes a paradigm shift in time-series modeling, evolving from shallow statistical features to deep structured representations. On the other hand, it offers interpretable and transferable learning mechanisms for intelligent management of complex systems. By constructing multi-scale temporal dependencies in latent space, this method reveals potential collaboration patterns and propagation paths among microservices, laying the groundwork for future self-learning, self-optimization, and self-diagnosis capabilities. Therefore, research on performance anomaly prediction based on contrastive time-series representation learning is not only of academic significance but also shows great potential in engineering applications, serving as a key direction for advancing intelligent operation systems toward adaptive intelligence.
II. Related Work
With the widespread deployment of cloud computing and microservice architectures, performance anomaly detection and prediction in backend systems have gradually become one of the core directions of research in AIOps (Artificial Intelligence for IT Operations). Early studies mainly focused on threshold-based and statistical modeling methods for anomaly identification. These approaches determine whether a system is abnormal by analyzing individual performance metrics such as CPU utilization, response time, or request rate. Such methods are simple to implement and computationally efficient, but they often fail in complex multi-service collaborative scenarios. In microservice architectures with a large number of dynamically dependent nodes, performance fluctuations are rarely isolated events. They usually arise from complex propagation processes triggered by interactions among multiple nodes. Therefore, univariate or static modeling approaches cannot capture the true operational mechanisms of the system. They are unable to effectively represent the spatial propagation paths and temporal evolution of anomalies, leading to problems of detection delay and instability [6].
To address anomaly detection problems under complex dependency structures, researchers have gradually introduced time-series modeling frameworks. Recurrent neural networks, convolutional neural networks, and their deep variants have been widely applied to time-series modeling of performance metrics. These models learn historical patterns to perform anomaly prediction and detection. They show advantages in capturing short-term dynamics and periodic variations, but they struggle with multi-scale changes and asynchronous dependencies. As system scale continues to grow, nonlinear relationships among time-series features become increasingly complex, making it difficult for conventional deep networks to explicitly model spatial dependencies across nodes. Moreover, metric data in microservice systems are often affected by noise and missing values. As a result, prediction models based solely on temporal modeling face clear limitations in robustness and generalization. This issue has led research to shift toward integrating graph structural modeling with temporal learning, aiming to describe the evolutionary patterns of microservice systems within a unified spatiotemporal framework.
In recent years, graph neural networks (Graph Neural Networks) have been introduced into cloud service performance modeling and anomaly detection tasks, becoming a key research direction. These methods treat service nodes as vertices in a graph and call chains or resource dependencies as edges. They aggregate and propagate multi-node features through graph convolution or graph attention mechanisms, thereby capturing the global dependency structure of the system. This approach can effectively describe the interaction characteristics between microservices and achieve structured modeling at the spatial level. However, most graph neural networks still rely on static topology assumptions, making it difficult to handle the dynamic nature of service topology changes over time. Furthermore, traditional supervised modeling methods rely on a large number of labeled anomaly samples, but in real-world operational scenarios, anomaly events are scarce and unevenly distributed, making supervised training difficult. How to construct a unified representation sensitive to spatiotemporal dependencies under dynamic topology conditions and capturing anomaly patterns under unsupervised conditions has become a major research challenge [7].
Against this backdrop, the idea of contrastive representation learning has been introduced into the fields of anomaly detection and temporal modeling, providing a new solution for feature extraction in unsupervised scenarios. By constructing positive and negative sample pairs, contrastive learning can bring similar samples closer together and distinguish dissimilar samples in the latent space, thereby learning discriminative temporal feature representations. In microservice performance modeling, this mechanism helps strengthen the aggregation of normal states and improve the separation of potential abnormal patterns, thereby achieving more stable predictive results. Compared to traditional reconstructive autoencoder models or predictive temporal networks, contrastive learning has stronger representation consistency constraints and generalization capabilities across time scales. Combining dynamic graph modeling and temporal encoding mechanisms, contrastive temporal representation learning can further explore the dynamic dependency structure between nodes and the covariation patterns among multidimensional indicators, providing a more robust theoretical framework and methodological foundation for the early identification and trend prediction of backend performance anomalies. The rise of this research direction signifies that cloud service anomaly prediction is evolving from shallow feature modeling to a deep representation learning stage that emphasizes structure awareness and semantic alignment.
III. Proposed Framework
A. General Introduction
This paper proposes a backend microservice performance anomaly prediction method based on a contrastive temporal representation learning framework. It achieves self-supervised representation of the system state through dynamic graph modeling, temporal coding, and a contrastive optimization mechanism. First, to characterize the dynamic dependencies between microservices, the system's monitoring metrics at time step t are constructed as a graph structure , where the node set represents each service instance, and the edge set represents service call dependencies. The node features are denoted as , where N is the number of nodes and d is the feature dimension. The learnable adjacency matrix is calculated based on the Pearson correlation coefficient between service metrics.
Here, represents the structural correlation between services i and j at time step. The adjacency matrix generated in this way can adaptively reflect the dynamic evolution relationship between services, providing structural support for subsequent graph structure feature extraction. Its overall model architecture is shown in Figure 1.
At the spatial level, to capture the dependency propagation features between nodes, graph convolution operations are used to aggregate node features. The feature update method for each layer is defined as follows:
Where represents the normalized adjacency matrix, is the degree matrix, is the learnable weights of the l-th layer, and is the nonlinear activation function. This process achieves multi-hop information aggregation of node features on the graph structure, enabling the model to capture dependent paths and potential anomaly propagation directions in the topological space.
At the time level, to model the dynamic evolution of performance indicators, a time encoding mechanism and a sequence modeling network are introduced. For each node , its time series representation is . A gated recurrent unit (GRU) is used to model its time dependencies.
Here, and are the update gate and reset gate, respectively, control the forgetting and transmission of state information. Through time-dimensional sequence modeling, the model can simultaneously capture short-term fluctuations and long-term trends, providing a temporal basis for identifying anomaly precursors.
To learn discriminative temporal features under unsupervised conditions, a contrastive learning mechanism is introduced, which optimizes the latent space by constructing pairs of positive and negative samples. Let the spatiotemporally encoded representations be A and B, then the contrastive loss function is defined as:
Where A represents cosine similarity and B is the temperature coefficient. This loss minimizes the distance between similar samples and maximizes the distance between dissimilar samples, enabling the model to achieve clearer class boundaries and structural separation in the latent space. Ultimately, the overall optimization objective is jointly constituted by temporal prediction constraints and contrastive loss:
Where is the reconstruction constraint term used to maintain feature consistency, and is the weight hyperparameter. By jointly optimizing three types of objectives-spatial dependency, temporal evolution, and semantics the model can form multi-scale, structure-aware temporal representations with predictive and discriminative capabilities in dynamic systems, providing a theoretical foundation and methodological support for the early identification and adaptive monitoring of backend microservice performance anomalies.
IV. Experimental Analysis
A. Dataset
This study uses the Alibaba Cluster Trace 2018 dataset as the primary data source for model validation and methodological analysis. The dataset consists of real backend system monitoring information from an actual cloud platform, covering a wide range of computing, storage, and scheduling activities of online services. It includes multiple performance indicators such as CPU utilization, memory usage, network latency, task scheduling, and request throughput of microservice instances. These metrics comprehensively reflect the dynamic characteristics of the system under different loads and operational states. Compared with traditional single-node monitoring data, this dataset more closely resembles a real distributed environment. It features multi-tenant, multi-task, and strongly coupled dynamics, making it highly suitable for research on performance anomaly prediction and time-series modeling in backend microservices.
The dataset records continuous system operation cycles over multiple days, with a temporal resolution down to the second. It contains the complete lifecycle of tasks, including submission, start, execution, and completion. Each record is associated with a specific machine identifier, service instance number, and timestamp, which allows the construction of service dependency graphs that evolve. This high spatiotemporal resolution enables a detailed exploration of system performance variations from both structural and temporal perspectives, facilitating the identification of potential anomaly patterns. In addition, the dataset provides comparisons between resource requests and actual usage, which can be used to describe resource scheduling efficiency and performance degradation trends, offering a realistic basis for dynamic load modeling.
During data preprocessing, sampling errors, missing values, and extreme outliers are first cleaned and imputed to ensure the continuity and stability of the input sequences. Then, all monitoring indicators are standardized and segmented into time windows, transforming the data into a multi-dimensional time-series format. Based on service dependency logs, dynamic adjacency matrices are constructed to generate input samples suitable for contrastive time-series representation learning. The dataset's large scale, high dimensionality, and noisy characteristics provide a solid experimental foundation for validating the robustness and generalization of the proposed model in dynamic environments. It also serves as an important public data resource supporting research in cloud computing and microservice anomaly analysis.
B. Experimental Results
This paper first conducts a comparative experiment, and the experimental results are shown in Table 1.
From the overall results, Table 1 presents the comparative performance of different methods on the backend microservice performance anomaly prediction task. It can be observed that traditional machine learning models, such as Decision Tree and XGBoost, show relatively low accuracy and recall, indicating their limited expressive ability when handling multi-dimensional and complex time-series data. These models rely mainly on static features and shallow architectures, which makes them insufficient in capturing dynamic dependencies and temporal evolution patterns. As a result, they fail to effectively identify potential performance degradation trends in highly dynamic microservice systems. In contrast, deep neural networks such as MLP, Transformer, and BERT demonstrate stronger capabilities in nonlinear mapping and high-dimensional feature extraction, leading to a significant improvement in overall performance metrics.
A further comparison shows that the Transformer and BERT models perform well in time-series feature modeling, achieving AUC values of 0.934 and 0.946, respectively. This demonstrates the advantage of the self-attention mechanism in capturing global dependencies. However, these models mainly focus on sequence modeling at the feature level and lack an integrated consideration of structural dependencies and topological evolution among services. Therefore, in complex distributed environments, they still struggle to capture the complete propagation paths of anomalies. The LSTM-Transformer model, by combining recurrent memory units with attention mechanisms, partially alleviates this issue and improves both recall and precision. Nevertheless, it still shows limitations in learning structural consistency across heterogeneous data.
The proposed model in this study outperforms all other methods across four evaluation metrics, with particularly strong performance in AUC and recall. This indicates that the model not only maintains high detection accuracy but also achieves a significant improvement in anomaly coverage. Such superiority is mainly attributed to the contrastive time-series representation learning framework, which enables adaptive modeling of multi-scale spatiotemporal features under unsupervised conditions. By integrating dynamic graph construction with temporal encoding, the model effectively captures dynamic dependencies among microservices and forms discriminative representations in the latent space that distinguish between normal and abnormal states. This results in more robust performance anomaly prediction and verifies the effectiveness of the proposed approach for dynamic dependency modeling and early risk identification in complex cloud environments. Furthermore, this paper presents the impact of the learning rate on the experimental results, as shown in Table 2.
As shown in Table 2, different learning rate settings have a clear impact on model performance, and the overall trend follows a pattern of "rising first and then stabilizing." When the learning rate is high (for example, 0.0004), the model converges faster in the early training stage. However, the large step size can cause instability in parameter updates, leading to the loss of fine-grained features in modeling complex spatiotemporal dependencies. As a result, both accuracy and recall remain relatively low. As the learning rate decreases, the model approaches the optimal solution in a smoother manner, allowing it to better learn the underlying patterns of backend microservice performance variations.
When the learning rate decreases to 0.0003 and 0.0002, all evaluation metrics improve significantly. This indicates that the parameter update speed and the loss reduction process become more stable, enabling the model to learn both local details and global representations effectively. The improvement at this stage mainly benefits from the enhanced discriminative capability of the contrastive time-series representation learning framework under small-step optimization. This allows the model to more accurately separate the temporal characteristics of normal and abnormal states. The increase in the recall metric, in particular, reflects that the model becomes more sensitive to anomaly detection and can identify potential performance degradation trends earlier.
When the learning rate is further reduced to 0.0001, the model achieves its best performance across all metrics, with an accuracy of 0.947, precision of 0.941, recall of 0.936, and AUC of 0.974. This shows that the optimization process is most stable at this setting. A smaller learning rate enables the model to adjust parameters more delicately during gradient updates, leading to more precise feature alignment and semantic matching in complex dynamic service topologies and multi-source time-series inputs. This result demonstrates that a moderately small learning rate enhances the representational power of the contrastive learning framework, allowing spatiotemporal features to form clearer aggregation and separation structures in the latent space.
Overall, changes in learning rate affect not only the convergence speed of the model but also directly determine the stability and generalization of the latent representations. In backend microservice performance anomaly prediction tasks, an excessively large learning rate can cause the model to overfit local fluctuations, while an overly small one may lead to local minima. The learning rate of 0.0001 used in this study achieves the best balance between optimization efficiency and model stability. This fully demonstrates that an appropriate learning rate plays a crucial role in enabling contrastive spatiotemporal representation learning models to achieve high-precision anomaly prediction in dynamic and complex systems.
In addition, we evaluate the effect of different optimizers on model performance, and the corresponding experimental results are summarized in Table 3.
The choice of optimizer has a significant impact on both model convergence and prediction performance. The overall trend shows a gradual improvement across all metrics, including accuracy, precision, recall, and AUC, from AdaGrad to AdamW. AdaGrad adjusts the learning rate adaptively using the accumulated squared gradients, which allows for rapid convergence in the early stages of training. However, as the training progresses, the learning rate decays to very small values, limiting the model's ability to learn complex patterns in later stages. As a result, its overall performance remains low. SGD alleviates this issue to some extent, but its fixed learning rate mechanism causes slow convergence in high-dimensional non-convex loss spaces and insufficient modeling of dynamic dependencies.
Adam combines the advantages of momentum and adaptive learning rate adjustment, allowing it to dynamically adapt the update magnitude based on gradient changes during training. This enhances the model's ability to learn complex temporal dependencies and service node variations. Such capability is particularly important for multi-metric joint modeling tasks, where large-scale differences exist among feature dimensions. Traditional optimizers often struggle to balance these differences. The results obtained with Adam demonstrate that adaptive optimization strategies can effectively improve model stability and generalization, enabling the contrastive time-series representation learning framework to form clearer feature distribution structures in the latent space.
Further analysis shows that AdamW performs better than all other optimizers, achieving the highest values across all metrics. This indicates that the weight decay mechanism plays an effective regularization role during training. Compared with Adam, AdamW separates the weight decay term from gradient updates, allowing the model to control parameter adjustments more precisely and reduce overfitting. This optimization method is especially critical in contrastive learning frameworks, where excessive fitting of the latent space can weaken semantic separability among features. The superior performance of AdamW in this task demonstrates its ability to balance model complexity and feature consistency, enhancing the model's sensitivity to backend performance degradation.
In summary, the choice of optimizer directly affects the representational power and generalization ability of contrastive time-series representation learning models under complex spatiotemporal structures. Traditional optimizers provide stability but fail to meet the learning requirements of multi-dimensional heterogeneous inputs and dynamic graph features. In contrast, optimizers with adaptive adjustment and weight regularization mechanisms can better capture dynamic dependencies among services. The final results confirm that adopting the AdamW optimization strategy significantly improves model convergence efficiency and anomaly prediction accuracy, providing a stronger foundation for robustness and reliability in backend microservice performance anomaly detection tasks.
Figure 2 illustrates the experimental results obtained under different temperature coefficient settings.
The temperature coefficient has a significant impact on model performance, but different metrics do not respond consistently to this parameter, reflecting a certain "trade-off." When the temperature coefficient is 0.05, both Precision and Recall are at low levels, indicating that the similarity distribution of contrastive learning is too sharp, and sample representations are prone to over-clustering, resulting in insufficient separability between normal and abnormal states in the latent space, thus weakening the anomaly identification ability. As the temperature coefficient increases to 0.1, Precision and Accuracy reach better levels, indicating that moderate temperature can improve the clarity of the discrimination boundary, making the model more robust in reducing false positives.
Further increasing the temperature coefficient to 0.2 and 0.3, Recall shows a continuous upward trend, and AUC also rises accordingly, reaching its highest value at 0.3. This indicates that higher temperatures help to widen the overall ranking difference between abnormal and normal samples, improving the coverage of potential anomalies and the overall discriminative power. However, at the same time, accuracy and precision decrease at higher temperatures, indicating that excessively high temperatures may make the contrast constraints too smooth, reducing the model's sensitivity to fine-grained features and thus increasing false alarms. Overall, the temperature coefficient plays a key moderating role between false alarm control and "abnormal coverage," and a more appropriate value range should be selected based on the operational preferences for missed detections/false alarms.
This paper also presents a sensitivity experiment on the effect of missing data rate on accuracy, and the experimental results are shown in Figure 3.
Figure 3 illustrates that the changes in each indicator are not a simple overall monotonic decrease, but rather exhibit differentiated sensitivity and inflection point characteristics. Accuracy shows a slight increase between 0.25 and 0.5, reaching a peak, and then significantly decreases between 0.75 and 1.0; AUC shows a more stable monotonic decline, indicating that the higher the mixing ratio, the more continuously the model's overall ranking and discriminative ability is weakened. In summary, a lower to moderate mixing ratio is more conducive to maintaining the stability of the representation space, while an excessively high mixing ratio will disrupt the constraint of contrastive learning on structural consistency, making it more difficult to effectively align temporal dependencies and cross-service association information, thus leading to overall performance degradation.
Further analysis of Precision and Recall reveals a stronger nonlinear effect: Precision drops rapidly between 0.25 and 0.75, reaching its lowest point at 0.75, before slightly recovering at 1.0; Recall peaks at 0.25, but experiences a sharp drop at 0.5, then recovers only slightly between 0.75 and 1.0 and stabilizes. This indicates that a higher mixing ratio significantly alters the model's discriminative bias: on the one hand, it reduces sensitivity to capturing anomalous patterns, and on the other hand, it makes predictions more conservative or the boundaries more ambiguous, ultimately reflected in a continuous decline in AUC and a significant drop in Accuracy at high mixing ratios. Overall, this experiment demonstrates that the Mixing Data Ratio is a key factor affecting the robustness of contrastive temporal representation learning, requiring a balance between covering more mixed information and maintaining the separability of representations.
V. Conclusions
This study proposes a self-supervised modeling framework based on contrastive time-series representation learning to address the complexity of performance anomaly prediction in backend microservice systems. The method constructs a dynamic service dependency graph and a multi-scale temporal encoding mechanism to achieve joint modeling of structural and temporal features. It captures the spatiotemporal evolution patterns of system performance under unsupervised conditions. Unlike traditional static monitoring and discriminative models, the proposed approach adaptively extracts latent correlations among multi-source indicators and forms clear feature boundaries in the latent space through contrastive mechanisms, enabling precise identification of early anomaly signals. Extensive experimental results demonstrate that the model achieves stable and superior performance across key metrics such as accuracy, recall, and AUC, confirming its effectiveness and robustness in early anomaly prediction within complex microservice environments.
In terms of research significance, this study overcomes the limitations of traditional anomaly detection methods that rely only on single features or static thresholds. It establishes a dynamic and adaptive spatiotemporal feature fusion mechanism. The proposed method can automatically learn service dependency structures from high-dimensional and non-stationary monitoring data, effectively reflecting performance variations caused by changes in system topology. By introducing contrastive time-series representation learning, the model no longer depends on manually labeled anomaly samples but instead performs unsupervised anomaly identification through consistency constraints on latent features. This not only improves scalability on large-scale cloud platforms but also provides new insights for intelligent operations management systems, endowing them with higher levels of self-awareness, self-diagnosis, and self-adaptation.
From an engineering application perspective, the proposed framework can be widely applied in cloud computing, distributed systems, industrial internet, and intelligent scheduling. In multi-tenant environments with high resource contention or highly dynamic workloads, the model can effectively identify early signs of service degradation, providing valuable decision support for resource allocation, failover, and automated recovery. When integrated with real operational monitoring systems, the method enhances the intelligence level of performance monitoring without adding extra computational or monitoring overhead. Its interpretable spatiotemporal feature structure also supports anomaly root cause analysis and performance optimization, promoting the shift from passive detection to proactive warning. This lays a methodological foundation for building enterprise-level intelligent operations management systems.
Future research can further enhance the model's capabilities in uncertainty modeling, missing data compensation, and multimodal monitoring integration. On one hand, probabilistic inference or generative modeling mechanisms can be introduced to handle modeling biases caused by noisy or incomplete data. On the other hand, the framework can be combined with adaptive techniques such as reinforcement learning and online learning to enable continuous model updating and evolution in dynamic environments. Moreover, future directions may explore transfer generalization across domains and platforms, allowing the model to achieve fast deployment and adaptive adjustment in heterogeneous microservice systems. Overall, this research provides a new theoretical and technical foundation for intelligent backend operations and autonomous performance management, holding significant practical value for advancing cloud computing systems toward self-learning, self-optimization, and self-evolution.
References
- Kim H G, Kim S, Min S, et al. Contrastive time-series anomaly detection[J]. IEEE Transactions on Knowledge and Data Engineering, 2023, 36(10): 5053-5065. [CrossRef]
- Yang Y, Zhang C, Zhou T, et al. Dcdetector: Dual attention contrastive representation learning for time series anomaly detection[C]//Proceedings of the 29th ACM SIGKDD conference on knowledge discovery and data mining. 2023: 3033-3045. [CrossRef]
- Huang X, Chen N, Deng Z, et al. Multivariate time series anomaly detection via dynamic graph attention network and Informer[J]. Applied Intelligence, 2024, 54(17-18): 7636-7658. [CrossRef]
- Ngu H C V, Lee K M. CL-TAD: A contrastive-learning-based method for time series anomaly detection[J]. Applied Sciences, 2023, 13(21): 11938. [CrossRef]
- Panahandeh M, Hamou-Lhadj A, Hamdaqa M, et al. ServiceAnomaly: An anomaly detection approach in microservices using distributed traces and profiling metrics[J]. Journal of Systems and Software, 2024, 209: 111917. [CrossRef]
- Zhong Z, Fan Q, Zhang J, et al. A survey of time series anomaly detection methods in the aiops domain[J]. arXiv preprint arXiv:2308.00393, 2023. [CrossRef]
- Xu N, Kosma C, Vazirgiannis M. TimeGNN: temporal dynamic graph learning for time series forecasting[C]//International Conference on Complex Networks and Their Applications. Cham: Springer Nature Switzerland, 2023: 87-99.
- Yang Z, Abbasi I A, Mustafa E E, et al. An anomaly detection algorithm selection service for IoT stream data based on tsfresh tool and genetic algorithm[J]. Security and Communication Networks, 2021, 2021(1): 6677027. [CrossRef]
- Plazas Olaya M K, Vergara Tejada J A, Aedo Cobo J E. Securing Microservices-Based IoT Networks: Real-Time Anomaly Detection Using Machine Learning[J]. Journal of Computer Networks and Communications, 2024, 2024(1): 9281529. [CrossRef]
- Nobre J, Pires E J S, Reis A. Anomaly detection in microservice-based systems[J]. Applied Sciences, 2023, 13(13): 7891. [CrossRef]
- Nakashima T, Yairi T. Assessing the Performance of Transformer for Time Series Anomaly Detection[C]//PHM Society Asia-Pacific Conference. 2023, 4(1). [CrossRef]
- Jeong Y, Yang E, Ryu J H, et al. Anomalybert: Self-supervised transformer for time series anomaly detection using data degradation scheme[J]. arXiv preprint arXiv:2305.04468, 2023. [CrossRef]
- Shi J, Wang S, Qu P, et al. Time series prediction model using LSTM-Transformer neural network for mine water inflow[J]. Scientific reports, 2024, 14(1): 18284. [CrossRef]
Figure 1.
Overall model architecture.
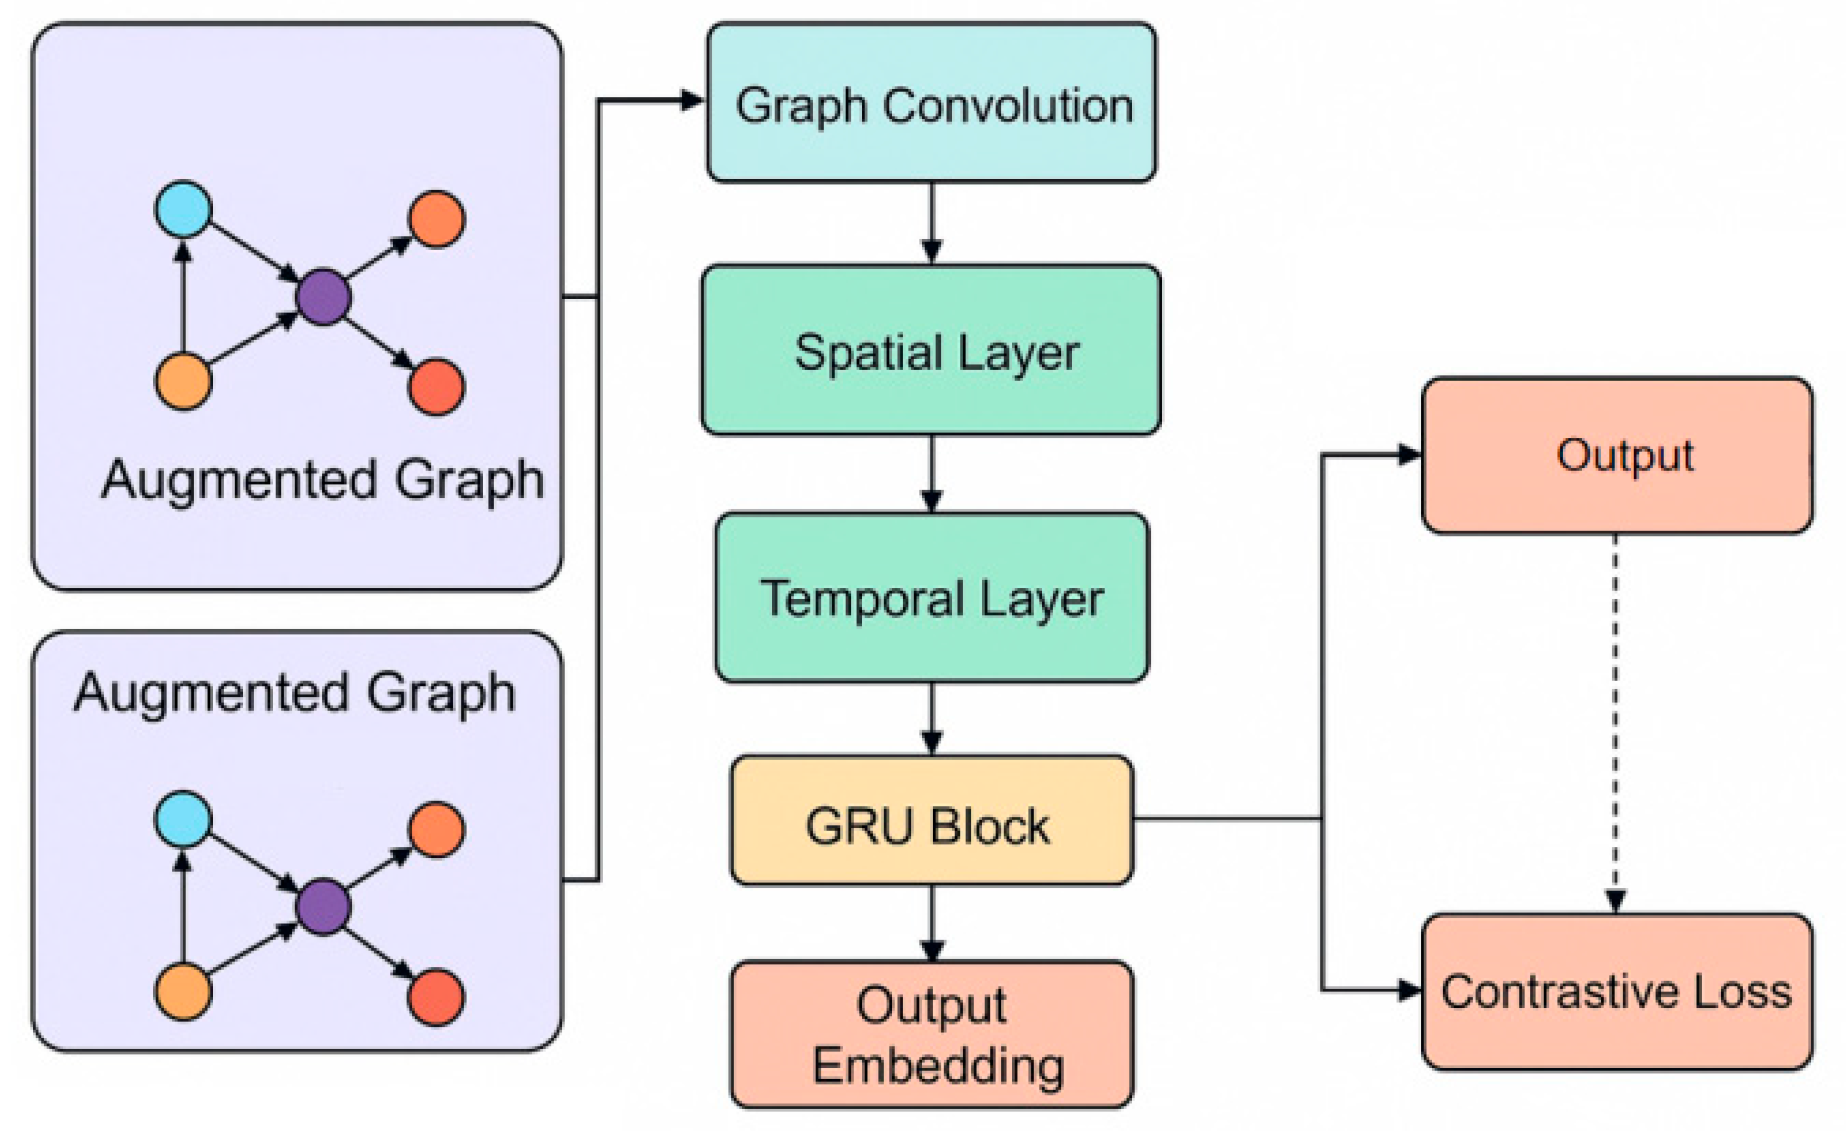
Figure 2.
The effect of the temperature coefficient on experimental results.
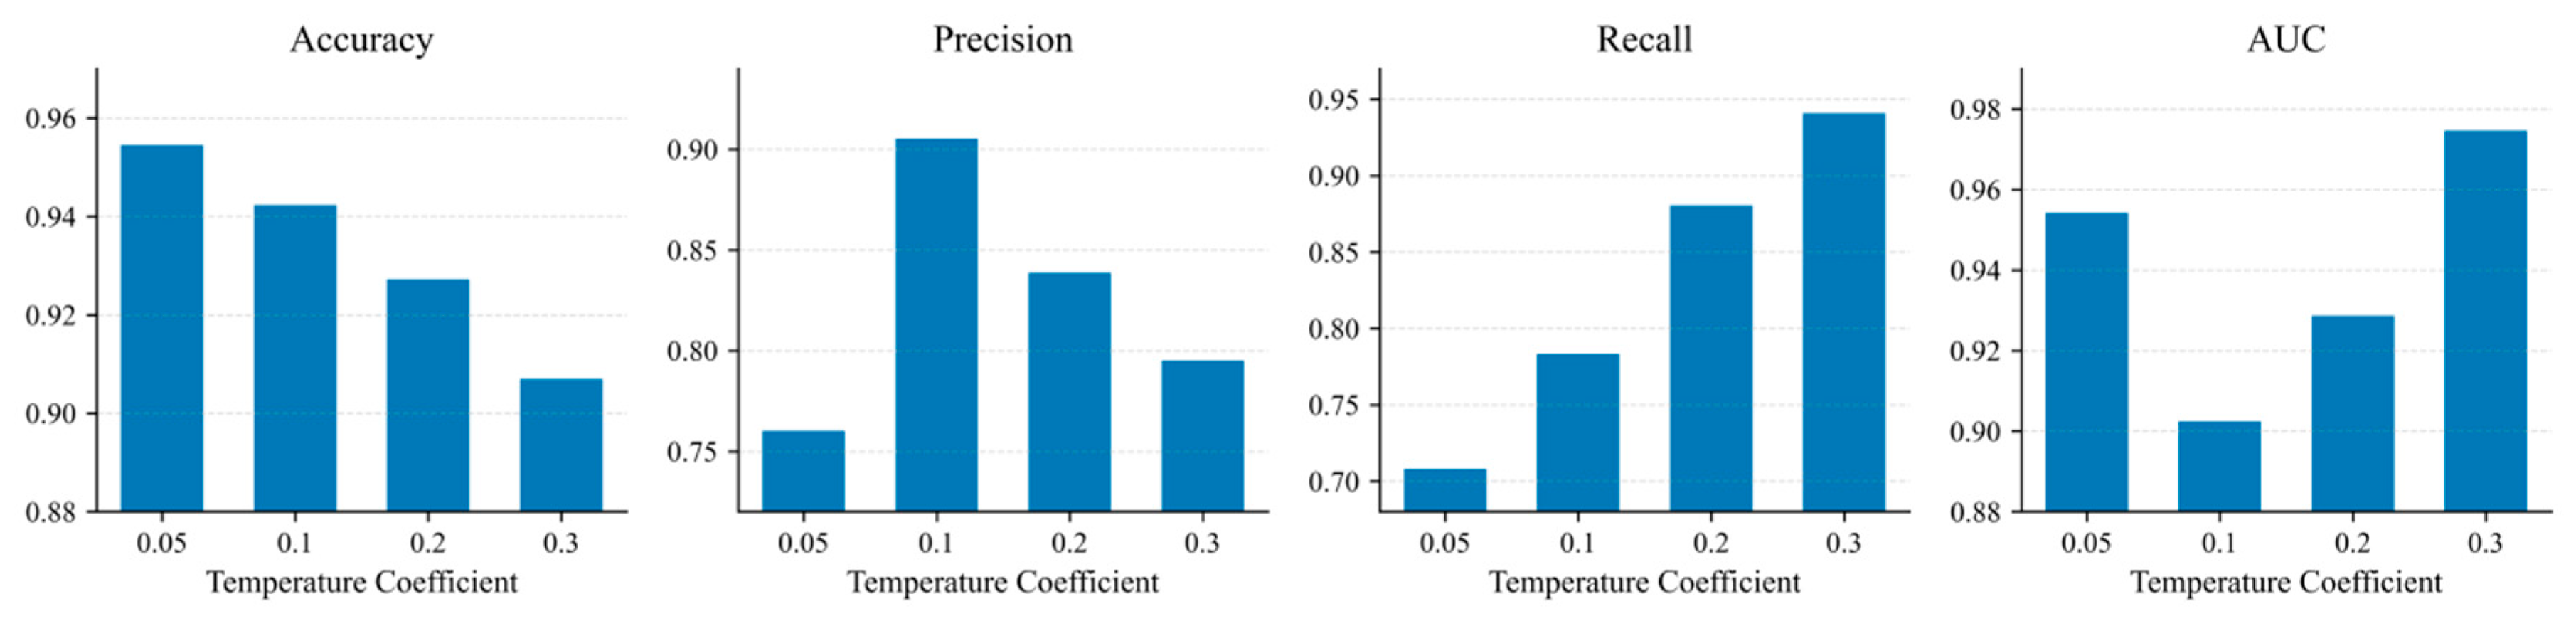
Figure 3.
Sensitivity experiment of missing data rate to accuracy.
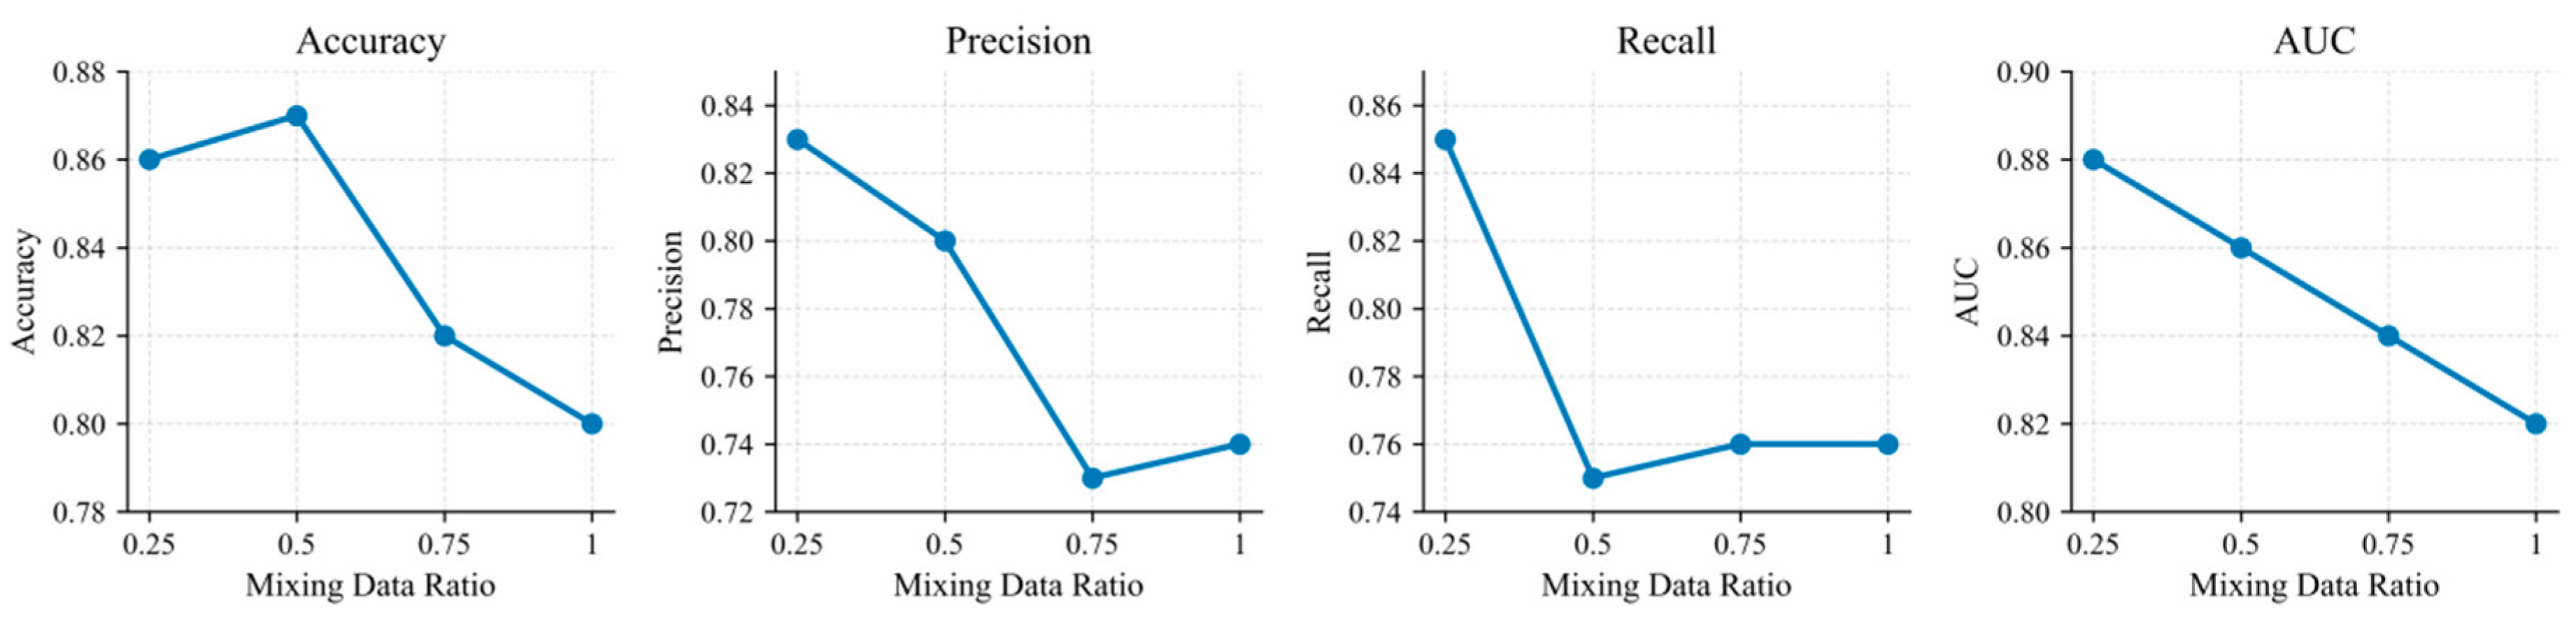

Table 1.
Comparative experimental results.
| Method | Acc | Precision | Recall | AUC |
| XGBoost [8] | 0.871 | 0.864 | 0.852 | 0.903 |
| Decision Tree [9] | 0.842 | 0.835 | 0.821 | 0.881 |
| MLP [10] | 0.884 | 0.872 | 0.861 | 0.915 |
| Transformer [11] | 0.902 | 0.896 | 0.884 | 0.934 |
| BERT [12] | 0.914 | 0.905 | 0.892 | 0.946 |
| LSTM-Transformer [13] | 0.928 | 0.918 | 0.911 | 0.959 |
| Ours | 0.947 | 0.941 | 0.936 | 0.974 |
Table 2.
The impact of the learning rate on experimental results.
| Learning Rate | Acc | Precision | Recall | AUC |
| 0.0004 | 0.921 | 0.914 | 0.905 | 0.954 |
| 0.0003 | 0.934 | 0.928 | 0.918 | 0.963 |
| 0.0002 | 0.942 | 0.936 | 0.928 | 0.969 |
| 0.0001 | 0.947 | 0.941 | 0.936 | 0.974 |
Table 3.
Experimental results of different optimizers.
| Method | Acc | Precision | Recall | AUC |
| AdaGrad | 0.915 | 0.908 | 0.897 | 0.948 |
| SGD | 0.928 | 0.919 | 0.911 | 0.958 |
| Adam | 0.939 | 0.932 | 0.924 | 0.966 |
| AdamW | 0.947 | 0.941 | 0.936 | 0.974 |
Disclaimer/Publisher’s Note: The statements, opinions and data contained in all publications are solely those of the individual author(s) and contributor(s) and not of MDPI and/or the editor(s). MDPI and/or the editor(s) disclaim responsibility for any injury to people or property resulting from any ideas, methods, instructions or products referred to in the content. |
© 2026 by the authors. Licensee MDPI, Basel, Switzerland. This article is an open access article distributed under the terms and conditions of the Creative Commons Attribution (CC BY) license (http://creativecommons.org/licenses/by/4.0/).
Copyright: This open access article is published under a Creative Commons CC BY 4.0 license, which permit the free download, distribution, and reuse, provided that the author and preprint are cited in any reuse.


