Submitted:
05 February 2026
Posted:
06 February 2026
You are already at the latest version
Abstract
Two leading paradigms dominate perspectives on obesity: (1) the Energy Balance Model (EBM), which views obesity as a phenomenon of essentially excess calories consumed over calories expended; and (2) the Carbohydrate-Insulin Model (CIM), which emphasizes carbohydrate-driven metabolic changes that promote fat storage. We introduce the Protein Partitioning Model (PPM) as a muscle-centric perspective on body composition. On this view, dietary protein and muscle activity can critically influence fat gain and loss – even under constant caloric intake – in ways that subsume the CIM-based mechanisms of fat-insulin dynamics. Building on comparisons with CIM, we extend PPM to a Rational Addiction framework to explore how protein and sugar consumption change over time in interaction with their biological stocks, muscle and fat, respectively, allowing total caloric intake to vary. When combined with regular resistance exercise, protein intake builds muscle, which, in turn, increases the marginal utility of protein consumption, contributing to a virtuous feedback loop of “protein addiction”, where consumption is bounded and converges on stable steady states characterised by modest changes in body composition. By contrast, sugar addiction is volatile and binge-prone, driven by insulin-mediated energy partitioning. These differences suggest that PPM offers an important angle in addition to simple EBM-based views because of the differing implications of whether caloric surpluses occur through protein or non-protein sources of energy and the motivations driving consumption behaviour. Put simply, factors promoting addiction to protein may protect against obesity arising from excessive eating in general and from high levels of carbohydrate consumption in particular.
Keywords:
protein
; metabolism
; muscle
; insulin
; obesity
; body composition
; rational addiction
; exercise
; resistance training
Aims and Premise
Obesity is a worldwide health challenge with its underlying causes and cures still widely debated. Two main models dominate both technical and popular discussions of this issue: (1) the Energy Balance Model (EBM), which explains weight gain as primarily due to excess caloric intake relative to expenditure (Swinburn, et al., 2011), and (2) and the Carbohydrate-Insulin Model (CIM), which argues that consumption of carbohydrates elevates insulin secretion, leading to increased fat storage and distortions in the way the body partitions energy (Ludwig & Ebbelin, 2018). Public health guidelines largely follow the EBM, recommending eating less and exercising more as primary strategies for combatting obesity, while the CIM appears to be rising in popularity in public discussions and the media surrounding body composition and health issues more broadly.
This paper describes the Protein Partitioning Model (PPM) of body composition. In a nutshell, we propose that both energy balance and how this is reflected in adiposity is largely regulated by interactions between muscle and protein intake. Unlike CIM and EBM, PPM emphasizes the role of muscle maintenance and dietary protein consumption as critical factors in obesity development and metabolic health. While the extent to which PPM more usefully explains complex phenomena such as metabolic syndrome and obesity as compared to CIM and EBM may require more research, we outline how it promises to transcend these earlier models to offer a more comprehensive understanding of feeding behaviour, body composition dynamics, and related health outcomes.
Background
EBM is the most widely accepted and intuitive framework for understanding shifts in body composition. This explains changes in body fat as due to the difference between energy consumed through food and energy expended through physiological processes and activity (Swinburn, et al., 2011). According to this perspective, the macronutrient source of calories—whether from fats, protein, carbohydrates, or alcohol — is not important for body weight regulation when total caloric intake is held constant (Hall et al., 2016). CIM argues that carbohydrate intake plays a more significant role than calorie content alone by triggering insulin secretion that promotes fat storage (Ludwig & Ebbelin, 2018). EBM and CIM are compared simply in Figure 1 (for an extensive review of their differences see (Magkos et al., 2024)). The debate between proponents of EBM and CIM has been vigorous both in academic literature and popular media, often clouded by stormy rhetoric and ad hominem arguments that obscure substantive scientific differences (Hall & Guo, 2017).
EBM is frequently disregarded based on the perception that it is “obviously” ineffective, since many individuals struggle to lose weight by simply adjusting their caloric balance. The rejoinder from proponents of EBM to this critique is that this mindset overlooks abundant evidence demonstrating that energy balance reliably influences body mass regardless of macronutrient composition (Hall, 2017). Similarly, studies indicate that overfeeding calories through either increased carbohydrate or fat intake can lead to comparable gains in body fat when other dietary factors are held constant (Horton et al., 1995) ([1] Importantly, one often neglected variable in these comparisons is the protein content of the diet (usually kept constant across high carbohydrate versus high fat conditions), which, as we will see below, may significantly modify how energy balance translates into changes in fat and lean mass).
Meanwhile, CIM is commonly dismissed with the criticism that its central claims violate the laws of thermodynamics. But this critique (perhaps sometimes deliberately) misses the point since it is both theoretically and empirically possible for body fat to increase due to elevated dietary carbohydrate intake even if total calories remain constant (Ludwig & Ebbelin, 2018), assuming CIM’s assertions regarding hormone action and alterations in fat cell metabolism triggered by carbohydrates hold true (Hall, 2017). Therefore, the core disagreement between the EBM and CIM centres on the validity of this hormonal and physiological mechanism rather than on energy conservation principles. Another important area of contention involves the nature of the type of psychological mechanisms controlling eating behaviour: EBM often assumes food intake as largely automatic or unconscious, governed by homeostatic mechanisms, whereas CIM supposes that the relevant food-seeking behaviours may be goal-directed and based on the desire to make up for a perceived shortfall in energy (Magkos et al., 2024).
For our present purposes of clarifying the logical structure of CIM, it is worth showing in symbols how CIM can explain changes in fat even when energy intake () is kept constant. Suppose total body mass is the combination of fat, , and lean body mass (e.g., muscle) is that adjusts residually. Assume, for now, that total units of energy in the diet is from carbohydrates () and protein (), so . Suppose that represents the fraction of these calories that are stored as fat (with the energy remaining being used for either maintaining and building or expending in activity as energy out () is . CIM assumes that the insulin effect, , is an increasing function of carbohydrate intake:
,
Where increases fat storage meaning that a higher fraction of calories eaten are stored as fat:
Assuming a fat is also measured in energy units for simplicity, so that changes in fat mass correspond directly to changes in stored energy. Thus, the fraction of calories consumed converted into fat increases with more carbohydrate intake. Comparing body fat across two times, with and kept constant while altering the quantity of ingested, then we have changes in body fat from initially
And then
If is increased while is decreased, such that , then
And the fat storage fraction increases:
To give a change in fat mass as
So, because even though total body mass remains the same, more calories are stored as fat.
Thus, even if total calories stay constant, increasing carbohydrate intake raises insulin, which increases the fraction of calories stored as fat, causing fat mass to increase even without eating more calories overall. Energy balance remaining the same, at low carbohydrate intake, there is lower fat storage, meaning more calories are available for lean mass and use in activity. Meanwhile, at higher carbohydrate intake levels, more fat is stored, leaving fewer calories available for energy expenditure and maintaining lean mass.
Notice that fewer calories being available for activity may lead to increases in hunger and fatigue. This may potentially lead to overeating (raising ) and reducing physical activity (). While more fundamentalist proponents of CIM may suppose this change in energy balance either does not occur or is trivial, moderating CIM in combination with EBM allows us to see how altered insulin dynamics caused by high carbohydrate intake could promote obesity though an energy imbalance through overeating total calories. For example, it is easy to see that such a CIM/EBM approach could be incorporated into a “Rational Addiction” model of food-seeking behaviour. Rational Addiction is a model of how consumption of an addictive commodity, , can escalate over time, , not simply because of impulsive behaviour insensitive to costs, but through rational or goal-directed decision making (Becker & Murphy, 1988). Crucially consumption at different points in time affect the value of more consumption by producing changes in the individual summarized as “addiction capital” (), such that
Where is the rate at which addiction capital naturally depreciates. Utility at any given time is a function such that current consumption is more pleasurable the more addicted the person already is
,
and consumers are forward-looking and maximise utility over the course of time:
Where represents an individual’s lifetime discount factor, that is, how much the individual values future utility relative to present utility. Lower means they are more present-biased while higher beta means more weight is given to future consequences. Sufficiently large means a person may resist consumption of an addictive good because they know it will increase cravings in a way that reduces future utility, while if low, then they discount the future enough to make it rational to prioritize current consumption. A key insight is that this can make continuing to increase consumption the most marginally rewarding choice at any given point in time even though total levels of utility (or overall wellbeing) is lowered, and this can be true despite (or even partly reinforced by) forward looking behaviour: that is, partly because people understand that consuming an addictive substance now will increase future desire to consume even more, the most rational thing to do now may nevertheless be to choose more consumption (depending on how much agents discount the future).
To consider a CIM-based Rational Addiction, let now represent sugar ([2] We are focusing on “sugar” because the carbohydrates CIM is most concerned about are those that tend to trigger high glycemic responses.) (carbohydrate) consumption at a given time, and interpret addiction capital at time t as modified fat tissue, , that increases the marginal utility of sugar consumption (e.g., by increasing cravings or a felt need for more energy intake) and raises the insulin response. Thus, if fat mass is analogous to addiction capital, utility depends on sugar consumption depending on how much stored fat the individual has:
,
Remember that here represents energy consumed form sugar and that S(⋅) includes conversion efficiency. We can then model insulin response as which increases with more fat mass and then model fat dynamics as:
So, if eating sugar increases fat, and fat raises insulin response, then higher insulin drives stronger fat storage and sugar craving to producing a reinforcing loop. The more fat an individual has, the more that their physiology demands sugar and the more urgently they may feel that they need energy to fuel ongoing activities (higher marginal utility of sugar consumption). Rational consumers can therefore continue sugar consumption despite long-run costs because short-run utility gain rises with fat mass. By allowing the consumer to escalate how much sugar they ingest, the system may have stable and unstable equilibria, depending on how steeply fat affects insulin and the marginal utility of sugar. Individuals may be set down this path by exogenous shocks (e.g., a period of prolonged binges on sugar sufficient to raise into the orbit of a higher, stable equilibrium of consumption.
With these reasonable assumptions, it is easy to see both how obesity might develop more rapidly than EBM models would predict based on the gradual accumulation of small caloric surpluses and how some may then find it especially difficult to escape an extreme but stable equilibrium at which they have a very large amount of addiction capital (i.e., being obese). This is because of the self-reinforcing loop making efforts at fat loss require drastically cutting down on sugar (going cold turkey) for sufficiently long such that their addiction capital depreciates until they are within the vicinity of another stable equilibrium.
Meanwhile, small decreases in fat from achieving small calorie deficits, while they may achieve short term tactical success, they may fail to produce lasting strategic victory over obesity and metabolic syndrome because of considerable disutility in the short-to-medium term and the tendency to rapidly regain weight if fat loss is not enough to bring them within the vicinity of another stable steady state. It also illustrates how CIM mechanisms may be importantly involved in driving obesity precisely because of their long-run implications for energy intake. Combining CIM and EBM in this way also shows how stubborn obesity (i.e., high steady states), even if maintained by insulin changes, is very likely to be related to commensurately high habitual levels of caloric consumption.
The Protein Partitioning Model
The elephant in the room of the foregoing discussion is protein. Notice that in the basic model relating carbohydrate intake to body fat above, the CIM-based perspective could be redescribed in terms not so much of excess carbohydrate but from diluting dietary protein intake and from lifestyle factors that affect how much of this protein is translated into muscle. The same model mentioned earlier for CIM can be modified to consider what happens under different dietary conditions to lean mass. The dynamic is captured as follows:
Where is the energy surplus or deficit gap that is split into either storage as lean body mass or fat, which is a function of (calories from protein), (calories available for lean mass and energy needs aside from fat storage), and energy expenditure. So, represents net lean mass change after accounting for maintenance costs and turnover (we abstract from explicit timing and conversion efficiencies). Lower protein intake means fewer building blocks to maintain and grow lean mass and calories to support lean tissue, together leading to reduced lean mass or impairment of its maintenance. Recall that, in a steady state lean mass satisfies whereas out of equilibrium its dynamics are governed by . Under low protein intake, fat could conceivably increase due to higher insulin storage while lean mass simultaneously declines. So, if changes in fat mass remain captured by , we can flip the functional dependencies of the earlier CIM model to show that, keeping calories in and out constant, altering protein intake can drive changes in body fat. Let the term represents the energy partitioning function, reflecting how muscle mass suppresses fat accumulation ([3] Note that the effect this captures in reality may not be identical to partitioning mechanism postulated by CIM because of other ways that muscle can reduce the diversion of energy into fat independently of the insulin mechanism.), altering protein intake will drive changes in body fat if:
- lean mass increases with protein intake and energy availability, (recall that simply represents the fraction of calories not stored as fat and so remaining for maintaining lean body mass and energy needs), such that , assuming
- insulin sensitivity () improves with lean mass such as due to muscle such that (thus, protein intake affects fat accumulation indirectly by increasing lean mass, which improves insulin sensitivity and reduces the fraction of energy partitioned into fat), and
- fat storage fraction decreases as insulin sensitivity improves and so is inversely related to lean mass,
Thus, increased protein intake leads to increased muscle mass which improves insulin sensitivity, thereby lowering fat storage. Lowering fat storage increases energy available for maintenance of lean mass, which in turn may raise lean mass to leave less leftover for fat. Meanwhile, lower protein intake leads to less lean mass, favouring insulin resistance and promoting fat storage.
In other words, whereas CIM claims fat gain is driven by excess insulin due to carbohydrates, PPM suggests fat gain is driven by insufficient muscle and protein, which fails to anchor energy in lean tissue, leading to excessive fat accumulation even if caloric intake does not rise. Formally, exercise shifts the functions and , rather than entering directly as a separate argument. The same conceptual point is summarized in Figure 2 and is made with the crucial caveat concerning exercise. Realistically, exercise affects the nature of how nutrients are used in the body (e.g., disposal of excess carbohydrates leading and so smoothing insulin fluctuations), as well as independent effects on insulin function and energy balance. In particular, the degree to which protein is likely translated into lean mass rather than converted into energy through gluconeogenesis depends on what type of physical activity the individual is engaged in. Individuals may burn the same amount of energy through activity, but resistance training can be a force multiplier of the effects of protein intake on muscle protein turnover. So, again, we may keep energy expenditure constant, but increasing dietary protein would most likely lead to a change in body composition if the energy expenditure side of the equation involves sufficient resistance training.
If muscle and habitual protein consumption are protective from fat gain through CIM-based mechanisms, then let us next consider the differences between a Rational Addiction to foods high in sugar based on consumption of foods high in protein based on PPM. Both can equally support the Rational Addiction logic, while being addicted to one is incompatible with addiction to the other. Suppose instead that represents consumption of protein-rich foods (such as meat and eggs), with consumption of energy from protein at a given time being , while addiction capital is now represented by muscle mass, . Muscle mass increases insulin sensitivity and the marginal utility of protein consumption (e.g., via enhanced muscle maintenance and greater physical capacity). Let utility depend on both protein and muscle mass where where , with the following dynamics:
Where is the amount of energy not stored as fat, is fraction of calories available for muscle building and so contributing to accumulation of , and is the partitioning effect that increases with higher protein consumption and more energy that is available and not being used for fat. In other words, the more muscle mass, the more physiological demands for protein (higher marginal utility of protein consumption).
Next, consider differences in addiction dynamics between the Sugar Addiction (CIM-based) and the Protein Addiction (PPM-based) by factoring in two important biological realities. Firstly, muscle tissue depreciates more rapidly than fat—especially if we suppose that reduced insulin sensitivity not only increases fat deposition but reduces its oxidation. Meanwhile, muscle is metabolically active and catabolized quite quickly, thus, . Secondly, animals (including humans) regulate protein intake more tightly than either carbohydrate or fat, with protein being substantially more potent at inducing satiety than carbohydrate. People cannot binge on protein as easily as sugar. This implies that escalation of protein consumption is constrained. We must consider protein consumption as showing bounded escalation, such as
Where is a physiological ceiling and is a small slope due to muscle feedback., that is, its effect on raising the marginal utility of more protein intake is attenuated and rises slowly (with , reflecting weak feedback of muscle mass on protein appetite relative to sugar–fat feedback). What this means is that the reinforcement loop for the protein addiction is weaker and it has lower escalation potential than sugar addiction. The qualitative differences between the paths of rational addiction to high sugar and to high protein commodities are shown in the Figure 3. It is thus easy to spiral into obesity through addiction to sugar, but hard to become addicted to being muscular. Once fat is accumulated, it does not decline easily without major intervention or efforts to reduce calories. Even sudden cessation of sugar entirely and significant weight loss may not be enough to reach a lower, lasting equilibrium due to the long half-life of fat. Meanwhile, muscle is fragile in that it declines rapidly without sufficient protein intake and resistance exercise. Higher muscle mass raises protein preference, but bounded escalation means there are natural constraints on protein addiction and its trajectory.
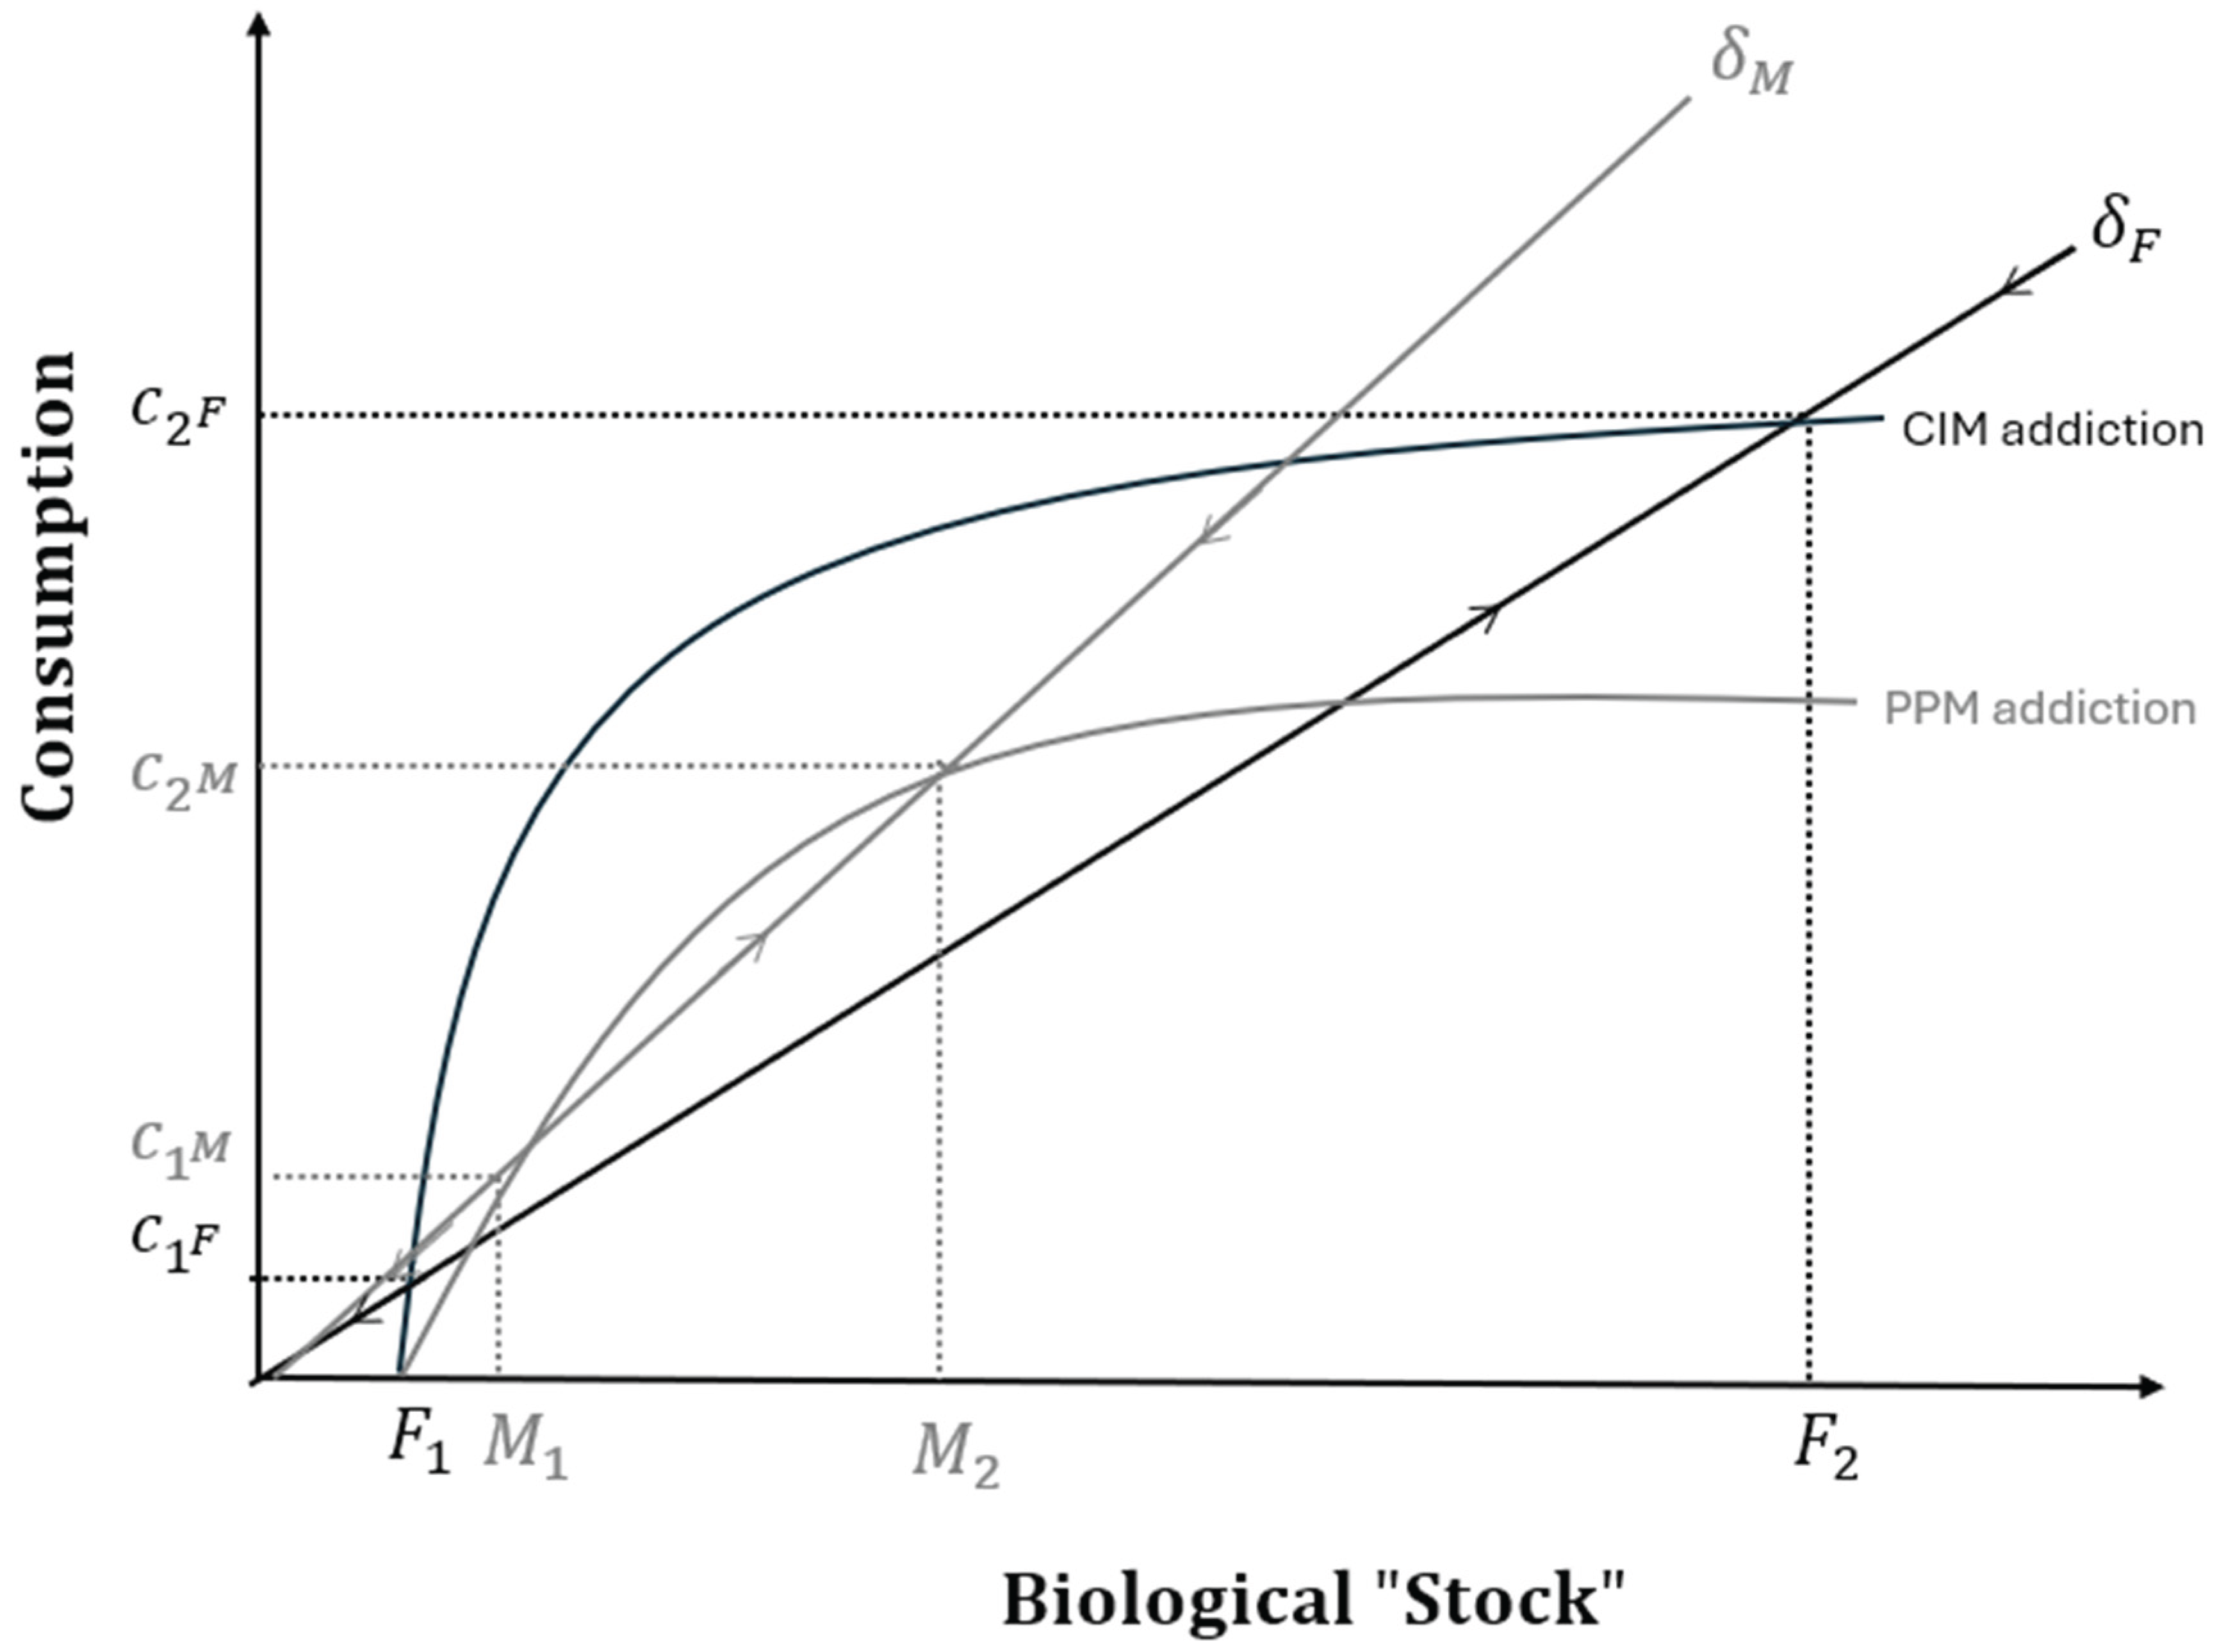
With these differences considered, two hypothetical consumption paths of rational food addictions are superimposed in Figure 3. These consumption paths are a rising positive function of how much of the biological “stock” an individual has. Steady states are determined where the amount of stock added by a level of consumption is balanced by the relevant rate of depreciation (). Away from these steady states, if the level of consumption means more stock is added than the rate of depreciation, this leads to more stock being gained, while net stock is declining in regions where the curve is under the depreciation line. This is represented by arrows along the depreciation lines showing whether current consumption implies future consumption will rise or fall through its effects on biological stocks. Thus, steady states are stable where flanked by arrows pointing towards them and unstable when flanked by arrows pointing away. For simplicity, assume the same amount of distance in consumption along the y-axis of either protein or sugar food corresponds to the same amount of energy intake or grams of protein or carbohydrate, while along the x-axis, the same amount of distance represents the same amount of change in muscle (for the protein addition) and fat (for the sugar addiction). As shown, the higher steady state for the protein corresponds to a lower caloric intake and less extreme change in body composition than the higher steady state for sugar ([4] Factoring in biological realities likely exaggerates the differences shown. For example, eating the same amount of energy from protein as sugar does not lead to as much energy available due to the larger thermic effect of protein metabolism. It is likely very difficult to consume more than a few hundred grams of protein a day due to satiety effects and the larger financial cost, while it is practically easy to achieve this for carbohydrate, implying or where protein consumption asymptotes is probably very low compared to that for sugar.).
It is of course possible to be fat and have much muscle at the same time. However, intrinsic to PPM is that muscle and protein intake tends to interfere with fat deposition and, crucially, to the process by which this fat makes sugar addictive. Therefore, a rational addiction to protein should be protective against a rational addiction to carbohydrate assuming environments have sufficient lean protein options (that is, an individual does not have to eat foods high in both carbohydrate and protein to meet their protein requirements), and that individuals are exercising their muscle tissue in ways that complement the partitioning effect of protein.
Discussion
Although not intended as an exclusive alternative to CIM or EBM, the present model offers clear and testable predictions that contrast with those of these other frameworks. For instance, CIM posits that a rapid increase in high-glycaemic carbohydrate intake triggers fat gain via insulin spikes – regardless of total energy eaten (Ludwig & Ebbelin, 2018). In contrast, PPM predicts that this fat gain will not occur if muscle activity and protein intake are adequate (unless total calories consumed are allowed to vary). This divergence arises not only because protein (and fat) consumption blunts the glycaemic response to sugars but also because muscle acts as a key metabolic regulator (Turner et al., 2014; Wolfe, 2006) — buffering insulin’s effects and redirecting energy away from fat storage (Srikanthan & Karlamangla, 2011).
Within the PPM framework, muscle hypertrophy—stimulated by resistance training and supported by sufficient protein quality and timing—improves insulin sensitivity, increases calorie allocation to muscle, and promotes fat oxidation (Collins et al., 2022; Sartori et al., 2021). Importantly, these benefits can manifest without changes in total body weight, even under high carbohydrate intake (Bosy-Westphal et al., 2015). Conversely, muscle loss due to inadequate protein intake or reduced resistance training diminishes insulin sensitivity and encourages fat accumulation (Beals et al., 2019; Di Meo, Iossa, & Venditty, 2017). Thus, PPM emphasizes that changes in body composition are primarily set into motion by perturbances to dietary protein and muscle dynamics, rather than total energy intake (central to EBM) or insulin levels alone (central to CIM).
Substantial evidence shows that increasing dietary protein intake leads to more favourable body composition changes than merely altering carbohydrate or fat intake. During caloric restriction, higher-protein diets consistently yield greater fat loss and muscle preservation across diverse age groups (Antonio et al., 2020; Aragon et al., 2017; Kanaan, Nait-Yahia, & Doucet, 2025). These findings support the PPM by challenging the fundamental EBM presumption that only total energy balance matters, highlighting protein’s pivotal role in fat mass regulation.
Protein’s ROLE in lean Mass and Energy Partitioning
Evidence for protein’s influence on energy partitioning also strengthens PPM’s position versus CIM. For example, Isacco and colleagues (Isacco et al., 2022) found that protein–energy partitioning, inferred from urinary nitrogen loss, predicted changes in fat and lean mass in adolescents undergoing obesity treatment, indicating metabolic control by protein turnover. Bosy-Westphal et al. (2015) demonstrate that lean mass modulates resting energy expenditure and metabolic risk during weight cycling. Revisiting data from the Minnesota starvation experiment, Dulloo and Jacquet (1999) proposed that the body’s ratio of lean mass to fat influences the mobilization of fat and protein during energy deficits. Together, these studies corroborate PPM’s assertion that lean mass is metabolically active and crucial for determining how incoming energy is partitioned between fat storage and tissue maintenance.
PPM also fits with evidence that greater muscle mass correlates with lower insulin resistance (Srikanthan & Karlamangla, 2011), and that muscle loss (sarcopenia) anticipates metabolic decline and elevated obesity risk (Roh & Choi, 2020; Vincent, Raiser, & Vincent, 2012). Notably, muscle quality matters: mitochondrial dysfunction in muscle, such as due to intramyocellular lipid accumulation (i.e., despite having ostensibly healthy amounts of muscle mass this may heavily “marbleized” or “fatty” muscle tissue in sedentary individuals) often precedes insulin resistance (Shulman, 2000). Moreover, grip strength — a widely used, albeit crude, indicator of muscle health — is among the strongest predictors of all-cause mortality, cardiovascular events, and functional decline, even after adjusting for age, sex, and BMI (Wu et al., 2017). That maintaining grip strength with age is associated with reduced health risks underscores the metabolic importance of maintaining muscle mass and function (Leong et al., 2015).
Taken together, these findings support PPM’s view that protein intake and lean mass are active determinants of metabolic function and body composition, not merely passive outcomes. In contrast, metabolic ward studies challenge CIM by showing that altering dietary carbohydrate-to-fat ratios can produce equal or greater fat loss under higher-carbohydrate conditions (Hall et al., 2016). This is less problematic for PPM, since such studies typically keep protein intake constant (which PPM proposes protects against the supposedly adverse metabolic effects associated with high carbohydrate intake as posited by CIM). This contrast presents a clear, testable hypothesis for future studies, whether in animal models or dietary trials using human participants. With animals fed to maintain constant energy balance, their body fat can be altered by increasing the “effective” protein portion of the diet relative to other macronutrients.
As mentioned, by “effective” protein, we mean protein destined for being used in the building and maintenance of lean tissues. This may be modulated not only through changes in protein quality and timing but also by factors affecting the propensity for protein to be partitioned toward muscle. While there may be others ([5] For instance, mutations in genes such as the myostatin (MSTN) gene, which regulate muscle growth, lead to radically increased rates of muscle accretion and represent a strong test of the model. Animals with MSTN mutations display an endogenous bias to convert more protein into muscle growth, even without exercise, resulting in greater “feed efficiency” — requiring fewer total calories to build and maintain increased lean mass while showing reduced fat accumulation compared to counterparts lacking the mutation (Kahn et al., 2025; McPherron & Lee, 2002; Ren et al., 2020). Indeed, McPherron and Lee (2002) reported that MTSN deficient mice showed partial protection against developing obesity and insulin resistance.), for our purposes, exercise is the major example of such factors. Physical activity constitutes another key point of divergence among PPM and these other perspectives. CIM regards physical activity as of peripheral importance, viewing carbohydrates—and their insulin-stimulating effects—as central to explaining fat gain (Ludwig & Ebbelin, 2018). EBM assigns a more important role to physical activity due to its effect on energy expenditure ("calories out") regardless of exercise type (Westerterp, 2018). PPM offers a different angle, emphasizing physical activity’s role in shaping body composition through interactions with muscle and protein metabolism. Here, exercise effectiveness depends less on calories burned and more on muscle preservation or growth. For example, aerobic activities such as long-distance running may promote short-term weight loss, but without sufficient protein and resistance training, these often cause disproportionate muscle loss. This muscle loss reduces metabolic rate and increases vulnerability to fat regain, undermining long-term weight management. More generally, PPM suggests that weight loss strategies that do not prioritize muscle preservation—such as those focusing on aerobic exercise, caloric restriction, bariatric surgery, or pharmacological methods such as GLP-1 receptor agonists while neglecting protein — are likely followed by rebound fat gain, with regained weight consisting disproportionately of fat rather than lean mass. Thus, PPM reframes the weight loss goal from simply lowering body weight to improving the quality of lost weight by strategically preserving lean tissue.
While resistance training alone may not always lead to greater weight loss than aerobic exercise, strong evidence supports PPM’s prediction that combining resistance training with high protein intake produces synergistic benefits in body composition. Studies show this combination preserves more muscle and enhances fat loss during caloric restriction compared to resistance training alone (Mettler, Mithcell, & Tripton, 2010; Sardeli et al., 2018; Weaver et al., 2016; Wycherley et al., 2010). For instance, Weaver et al. (2016) found that obese diabetic patients that combined high-protein diets with a resistance training regime lost more body fat and reduced their waist circumference more than either those on other diets or not exercising in this way. These results support PPM’s central tenet: muscle-preserving interventions require both mechanical (training) and nutritional (protein) inputs, an interaction neglected in calorie- or insulin-centric models.
Food Addiction and Biological Stocks
The Rational Addiction framework has previously modelled behaviours like smoking and food intake but has yet to explicitly consider metabolic "addiction capital" such as fat and muscle, whose distinct feedback dynamics may interact via dual addiction loops. CIM (Ludwig & Ebbelin, 2018) and the Protein Leverage Hypothesis (Simpson & Raubenheimer, 2005) provide physiological bases supporting components of this framework. The “bounded escalation” implies that consumption can increase in response to higher needs (e.g., muscle hypertrophy and repair), but its rate of increase is slow due to physiological constraints related to digestion, absorption, and anabolic capacity (Phillips, 2014). Likewise, the concept of a biological "ceiling" on protein intake is well supported by protein’s stronger satiety effects compared to carbohydrate (Leidy et al., 2015; Simpson & Raubenheimer, 2005). Sugar consumption can escalate with minimal satiety cues, while muscle accrual from increased protein intake and resistance training is slower and more constrained biologically. Fat accumulation is easier and more rapid through caloric excess, especially from sugar, while taking longer to lose than muscle when the factors that support growth are lessened. This asymmetry is fundamental to the current model.
As mentioned above, another important aspect of the model is that it subsumes the main role of carbohydrates in CIM. This is because muscle mass not only substantially aids in sugar disposal thus smoothing out insulin spikes (Richter, Sylow, & Hargreaves, 2011), and concurrent consumption of protein with sugar blunts the glycaemic response to the sugar, but muscle tissue and protein metabolism have other independent effects on insulin action and additional metabolic benefits (Wolfe, 2006). In other words, protein intake can influence energy partitioning in ways that are both broader than and modify the effects of body fat and sugar. These factors further reinforce the relationship between muscle building and protein intake suppressing fat gain. Exogenous shocks, such as a loss in muscle due to prolonged and serious injury or illness, inactivity, aging, or protein under-nutrition, leads to reduced protein appetite through muscle wastage, possibly subsequently contributing to fat gain and more muscle atrophy if the stock of muscle falls sufficiently low to bring the individual within the orbit of a lower equilibrium. This feature fits nicely with views of “catabolic crisis” models of aging and sarcopenia (English & Paddon-Jones, 2010).
Although less direct evidence exists for conscious selection of foods by protein versus carbohydrate content or for reward variation by body composition, studies in a wide range of species (including humans) suggest behaviours can differentiate foods differing in macronutrient rewards based on their internal nutritional state (Simpson & Raubenheimer, 2012). There is some evidence that protein may play a role in determining how rewarding foods are depending on appetite. In a study of rats, a low-protein diet increased both preference for protein-rich foods and activation of the nucleus accumbens, a reward- and attention-related brain area, compared to a normal diet (Tomé et al., 2019). The ventral tegmental area (VTA), another key reward-processing region, shows similar effects: protein-deprived rats conditioned to associate flavours with casein or polycose prefer casein and exhibit greater VTA activation in response to it (Chiacchierini et al., 2021). Further studies are required to see if these fit into a broader pattern with other regions involved in learning about and evaluating rewards, such as the ventral pallidum, are also be modulated by protein status (Ottenheimer, Richard, & Janak, 2018). Comparable effects may occur in humans. In obese women, a high-protein meal increased plasma homovanillic acid—a dopamine metabolite linked to VTA activity—and reduced food cravings relative to a lower-protein meal (Hoertel, Will, & Leidy, 2014). Similarly, Griffioen-Roose and colleagues (2014) found that women on a low-protein diet showed greater activation of reward-related regions (orbitofrontal cortex, striatum) to food cues and, during ad libitum feeding, selected more protein-rich foods, especially savoury items. Together, these findings suggest that under conditions of protein deprivation, neural reward systems bias behaviour toward protein acquisition. A role for nutrient-specific appetites in goal-directed behaviours could be directly tested for using variations of outcome devaluation and contingency degradation procedures (Balleine & Dickinson, 1998). Accordingly, protein-rich foods might be more reinforcing to individuals with higher lean mass or muscle protein turnover (e.g., athletes). Protein deprivation should increase neural reward responses to protein-rich foods among such individuals relative to those with less lean mass. Longitudinal studies tracking macronutrient preferences, body composition, and hormonal markers during controlled dietary interventions could test this hypothesis.
Practical Implications
This perspective has important obesity policy implications: efforts should simultaneously limit sugar exposure to disrupt detrimental metabolic feedback loops and promote environments that support muscle preservation and growth through adequate protein intake and resistance training. While acknowledging sugar addiction and compulsive eating contribute to excessive weight gain and resistance to interventions, PPM suggests that the absence of protein "addiction" may be a critical risk factor predisposing to these patterns. Put differently, EBM and CIM may see obesity prevention as calling for a “defensive” strategy, with recommendations being negative in the sense of stipulating what not to do (e.g., do not eat too much or do not eat sugar), and what must be lost (reduce body fat). The protein-addiction approach instead tackles obesity by going on the offensive, recommending what should be gained (i.e., lean body mass with likely improved performance capabilities, resilience to injuries and disease through accompanying changes in bone density and so forth) and what should be added (resistance training, protein of appropriate quality and timing, and variety of complementary foods). While speculative, we suspect that reframing the challenge in this way may engage people’s motivations differently and be more empowering.
To forestall a likely misunderstanding, it may seem as though PPM would predict trends in obesity should correlate with rises and falls in protein intake. This is not likely to be the case. We must emphasize the protein relevant to the model is that which feeds lean mass in general and muscle protein in particular, with the latter being related to muscle protein synthesis (MPS) (Phillips & van Loon, 2016). At the time of writing, factors that determine MPS include protein quality, meal timing, and the exercise environment (e.g., how much work against resistance muscles have been engaged in) (Layman, 2009; Phillips & van Loon, 2016). Protein quality depends on amino acid profile and bioavailability, with much higher quantities of low-quality protein sources (e.g., rice and beans) required to trigger MPS than higher quality protein sources (e.g., eggs and beef), with many types of foods that people may eat for their protein content ranging along a spectrum in between (legumes, tofu, fish, chicken, pork, etc.) (Layman, 2009; Phillips & van Loon, 2016). Timing of a protein meal is also important, with MPS being primed after a period of fasting (e.g., more than a few hours since the last time it was triggered). Grazing patterns of feeding or consuming most of protein in the last meal of the day, are less likely to translate as much protein eaten into lean tissue than protein meals eaten spaced further apart and/or with a large quantity of protein consumed at breakfast (Gwin, 2018; Leidy et al., 2011). Thus, protein intake levels may remain constant at a population level while the proportion translated into muscle (rather than simply converted to energy) could decline due to differences in dietary and exercise patterns (Phillips & van Loon, 2016). Moreover, because the Protein-Leverage effect predicts that protein satiety mechanisms bias people to keep eating over a 24-hour period or so to maintain some constant amount of protein in the diet, people may satisfy their protein hunger through a range of ways that maintain constant protein intake with variable implications for muscle health. Available evidence suggests that protein consumption has overall remained steady in human populations where obesity has risen (Tomé et al., 2019). We would predict there have been trends in affecting how much that this protein consumption has translated into muscle. For example, it seems reasonable to speculate that, historically, human physical activity likely involved much resistance-type labour and more anerobic or high intensity bouts of activity (e.g., pursuing prey or fleeing from predators) rather than what is typical in the sorts of modern low-impact exercise characteristic of most leisure and incidental physical activity people engage in today. This may mean our bodies evolved in environments more conducive to developing "protein addictions" that helped maintain muscle mass. A decrease in activities like manual labour and an increasing emphasis on low impact (e.g., aerobic) exercise may be an important factor beyond trends in total energy expenditure. Loss of this drive for muscle maintenance may then have been an underlying cause of rising obesity and metabolic syndrome prevalence.
A final point concerns the "discounting parameter" β, representing preference for immediate versus future rewards. In CIM, carbohydrate addiction and elevated β exacerbate metabolic dysfunction by prioritizing short-term cravings despite long-term harm (Ludwig & Ebbelin, 2018). Conversely, PPM portrays protein intake and muscle growth as beneficial addictions with lower β — reflecting effortful but rewarding commitments to protein-rich diets and exercise. This distinction suggests public health messages emphasizing muscle health and education about “effective” protein consumption may better prevent obesity than focusing solely on conveying the long-term harms of obesity and excessive sugar consumption.
Summary and Conclusion
The PPM channels ideas from emerging muscle-centric views that highlight the role of protein metabolism and muscular activity as potentially powerful drivers of body composition. This integrates findings linking muscle with insulin sensitivity and metabolic risks, and accounts for discrepancies in weight loss outcomes associated with different exercise types and diets, arguing that resistance training paired with adequate protein intake better supports long-term weight management by preserving muscle and preventing fat rebound. By applying the Rational Addiction framework, PPM proposes there can be a “beneficial addiction” to protein intake, in contrast to a likely “harmful addiction” to sugar consumption as described by CIM when muscle mass and quality deteriorate. PPM suggests new avenues for obesity interventions, prioritizing strategies that include providing adequate sources of lean protein in the diet while promoting muscle-preserving environments.
Statements and Declarations
I received no funding for the production of this manuscript and have no conflicts of interest to declare.
Data Availability Statement
Data sharing is not applicable to this article as no new data were created or analysed in this study.
References
- Antonio, J.; Candow, D. G.; Forbes, S. C.; Ormsbee, M. J.; Saracino, P. G.; Roberts, J. Effects of dietary protein on body composition in exercising individuals. Nutrients 2020, 12(6), 1890. [Google Scholar] [CrossRef]
- Aragon, A. A.; Schoenfeld, B. J.; Wildman, R.; Kleiner, S.; VanDusseldorp, T.; Taylor, L.; Antonio, J. International society of sports nutrition position stand: diets and body composition. Journal of the International Society of Sports Nutrition 2017, 14(1), 16. [Google Scholar] [CrossRef]
- Balleine, B. W.; Dickinson, A. Goal-directed instrumental action: Contingency and incentive learning and their cortical substrates. Neuropharmacology 1998, 37(4-5), 407–419. [Google Scholar] [CrossRef]
- Beals, J. W.; Burd, N. A.; Moore, D. R.; Van Vliet, S. Obesity alters the muscle protein synthetic response to nutrition and exercise. Frontiers in nutrition 2019, 6, 87. [Google Scholar] [CrossRef]
- Becker, G. S.; Murphy, K. M. A Theory of Rational Addiction. Journal of Political Economy 1988, 96(4), 675–700. [Google Scholar] [CrossRef]
- Bosy-Westphal, A.; Kahlhöfer, J.; Lagerpusch, M.; Skurk, T.; Müller, M. J. Deep body composition phenotyping during weight cycling: relevance to metabolic efficiency and metabolic risk. Obesity Reviews 2015, 16, 36–44. [Google Scholar] [CrossRef] [PubMed]
- Chiacchierini, G.; Naneix, F.; Peters, K. Z.; Apergis-Schoute, J.; Snoeren, E. M. S.; McCutcheon, J. E. Protein appetite drives macronutrient-related differences in ventral tegmental area neural activity. Journal of Neuroscience 2021, 41(23), 5080–5092. [Google Scholar] [CrossRef] [PubMed]
- Collins, K. A.; Ross, L. M.; Slentz, C. A.; Huffman, K. M.; Kraus, W. E. Differential effects of amount, intensity, and mode of exercise training on insulin sensitivity and glucose homeostasis: a narrative review. Sports Medicine-Open 2022, 8(1), 90. [Google Scholar] [CrossRef]
- Di Meo, S.; Iossa, S.; Venditti, P. Improvement of obesity-linked skeletal muscle insulin resistance by strength and endurance training. Journal of Endocrinology 2017, 234(3), R159–R181. [Google Scholar] [CrossRef]
- Dulloo, A. G.; Jacquet, J. The control of partitioning between protein and fat during human starvation: its internal determinants and biological significance. British Journal of Nutrition 1999, 82(5), 339–356. [Google Scholar] [CrossRef]
- English, K. L.; Paddon-Jones, D. Protecting muscle mass and function in older adults during bed rest. Current Opinion in Clinical Nutrition & Metabolic Care 2010, 13(1), 34–39. [Google Scholar]
- Griffioen-Roose, S.; Smeets, P. A.; van den Heuvel, E.; Boesveldt, S.; Finlayson, G.; de Graaf, C. Human protein status modulates brain reward responses to food cues. The American Journal of Clinical Nutrition 2014, 100(1), 113–122. [Google Scholar] [CrossRef] [PubMed]
- Gwin, J. A. The Effects of Dietary Protein at Breakfast and Across the Day on Appetite Control & Satiety, Food Intake, and Sleep Quality . Doctoral dissertation, Purdue University, 2018. [Google Scholar]
- Hall, K. D. A review of the carbohydrate–insulin model of obesity. European Journal of Clinical Nutrition 2017, 71(3), 323–326. [Google Scholar] [CrossRef]
- Hall, K. D.; Guo, J. Obesity energetics: Body weight regulation and the effects of diet composition. Gastroenterology 2017, 152(7), 1718–1727.e3. [Google Scholar] [CrossRef] [PubMed]
- Hall, K. D.; Chen, K. Y.; Guo, J.; Lam, Y. Y.; Leibel, R. L.; Mayer, L. E.; Reitman, M. L.; Rosenbaum, M.; Smith, S. R.; Waslh, B. T.; Ravussin, E. Energy expenditure and body composition changes after an isocaloric ketogenic diet in overweight and obese men. The American Journal of Clinical Nutrition 2016, 104(2), 324–333. [Google Scholar] [CrossRef]
- Hoertel, H. A.; Will, M. J.; Leidy, H. J. A randomized crossover, pilot study examining the effects of a normal protein vs. high protein breakfast on food cravings and reward signals in overweight/obese “breakfast skipping”, late-adolescent girls. Nutrition Journal 2014, 13, 1–8. [Google Scholar] [CrossRef]
- Horton, T. J.; Drougas, H.; Brachey, A.; Reed, G. W.; Peters, J. C.; Hill, J. O. Fat and carbohydrate overfeeding in humans: different effects on energy storage. The American Journal of Clinical Nutrition 1995, 62(1), 19–29. [Google Scholar] [CrossRef]
- Isacco, L.; Lazzer, S.; Pereira, B.; Fearnbach, N.; Montaurier, C.; Vermorel, M.; Rannou, F.; Boirie, Y.; Thivel, D. Association of protein-energy partitioning with body weight and body composition changes in adolescents with severe obesity. International Journal of Obesity 2022, 46(11), 2021–2028. [Google Scholar] [CrossRef] [PubMed]
- Kanaan, M. F.; Nait-Yahia, S.; Doucet, É. The effects of high protein intakes during energy restriction on body composition, energy metabolism and physical performance in recreational athletes. European Journal of Clinical Nutrition 2025, 1–9. [Google Scholar] [CrossRef]
- Khan, N.; Li, Z.; Ali, A.; Quan, B.; Kang, J.; Ullah, M.; Shafiq, M. Comprehensive transcriptomic analysis of myostatin-knockout pigs: insights into muscle growth and lipid metabolism. Transgenic Research 2025, 34(1), 12. [Google Scholar] [CrossRef]
- Layman, D. K. Dietary Guidelines should reflect new understandings about adult protein needs. Nutrition & Metabolism 2009, 6(1), 12. [Google Scholar] [CrossRef]
- Leidy, H. J.; Clifton, P. M.; Astrup, A.; Wycherley, T. P.; Westerterp-Plantenga, M. S.; Luscombe-Marsh, N. D.; Woods, S. C.; Mattes, R. D. The role of protein in weight loss and maintenance. The American Journal of Clinical Nutrition 2015, 101(6), 1320S–1329S. [Google Scholar] [CrossRef]
- Leidy, H. J.; Tang, M.; Armstrong, C. L. H.; Martin, C. B.; Campbell, W. W. The effects of consuming frequent, higher protein meals on appetite and satiety during weight loss in overweight/obese men. Obesity 2011, 19(4), 818–824. [Google Scholar] [CrossRef]
- Leong, D. P.; Teo, K. K.; Rangarajan, S.; Lopez-Jaramillo, P.; Avezum, A.; Orlandini, A.; Yusuf, S. Prognostic value of grip strength: findings from the Prospective Urban Rural Epidemiology (PURE) study. The Lancet 2015, 386(9990), 266–273. [Google Scholar] [CrossRef] [PubMed]
- Ludwig, D. S.; Ebbeling, C. B. The carbohydrate-insulin model of obesity: beyond "calories in, calories out. JAMA Internal Medicine 2018, 178(8), 1098–1103. [Google Scholar] [CrossRef] [PubMed]
- Magkos, F.; Sørensen, T. I.; Raubenheimer, D.; Dhurandhar, N. V.; Loos, R. J.; Bosy-Westphal, A.; Clemmensen, C.; Hjorth, M. F.; Allison, D. B.; Taubes, G.; Astrup, A. On the pathogenesis of obesity: causal models and missing pieces of the puzzle. Nature Metabolism 2024, 6(10), 1856–1865. [Google Scholar] [CrossRef]
- McPherron, A. C.; Lee, S. J. Suppression of body fat accumulation in myostatin-deficient mice. The Journal of Clinical Investigation 2002, 109(5), 595–601. [Google Scholar] [CrossRef]
- Mettler, S.; Mitchell, N.; Tipton, K. D. Increased protein intake reduces lean body mass loss during weight loss in athletes. Medicine and Science in Sports and Exercise 2010, 42(2), 326–337. [Google Scholar] [CrossRef]
- Ottenheimer, D.; Richard, J. M.; Janak, P. H. Ventral pallidum encodes relative reward value earlier and more robustly than nucleus accumbens. Nature Communications 2018, 9(1), 4350. [Google Scholar] [CrossRef] [PubMed]
- Phillips, S. Protein consumption and resistance exercise: maximizing anabolic potential. Sports Sci Exch 2013, 26(107), 1–5. [Google Scholar]
- Phillips, S. M. A brief review of critical processes in exercise-induced muscular hypertrophy. Sports Medicine 2014, 44 (Suppl 1), S71–S77. [Google Scholar] [CrossRef]
- Phillips, S. M.; van Loon, L. J. C. The impact of protein quality on the promotion of resistance exercise-induced changes in muscle mass. Nutrition & Metabolism 2016, 13, 64. [Google Scholar] [CrossRef]
- Ren, H.; Xiao, W.; Qin, X.; Cai, G.; Chen, H.; Hua, Z.; Bi, Y. Myostatin regulates fatty acid desaturation and fat deposition through MEF2C/miR222/SCD5 cascade in pigs. Communications Biology 2020, 3(1), 612. [Google Scholar] [CrossRef] [PubMed]
- Richter, E. A.; Sylow, L.; Hargreaves, M. Interactions between insulin and exercise. Biochemical Journal 2021, 478(21), 3827–3846. [Google Scholar] [CrossRef]
- Roh, E.; Choi, K. M. Health consequences of sarcopenic obesity: a narrative review. Frontiers in Endocrinology 2020, 11, 332. [Google Scholar] [CrossRef] [PubMed]
- Sardeli, A. V.; Komatsu, T. R.; Mori, M. A.; Gáspari, A. F.; Chacon-Mikahil, M. P. T. Resistance training prevents muscle loss induced by caloric restriction in obese elderly individuals: a systematic review and meta-analysis. Nutrients 2018, 10(4), 423. [Google Scholar] [CrossRef] [PubMed]
- Sartori, R.; Romanello, V.; Sandri, M. Mechanisms of muscle atrophy and hypertrophy: implications in health and disease. Nature Communications 2021, 12(1), 330. [Google Scholar] [CrossRef]
- Shulman, G. I. Cellular mechanisms of insulin resistance. Journal of Clinical Investigation 2000, 106(2), 171–176. [Google Scholar] [CrossRef] [PubMed]
- Simpson, S. J.; Raubenheimer, D. Obesity: the protein leverage hypothesis. Obesity Reviews 2005, 6(2), 133–142. [Google Scholar] [CrossRef]
- Simpson, S. J.; Raubenheimer, D. The nature of nutrition: a unifying framework from animal adaptation to human obesity; Princeton University Press, 2012. [Google Scholar]
- Srikanthan, P.; Karlamangla, A. S. Relative muscle mass is inversely associated with insulin resistance and prediabetes. The Journal of Clinical Endocrinology & Metabolism 2011, 96(9), 2898–2903. [Google Scholar] [CrossRef]
- Swinburn, B. A.; Sacks, G.; Hall, K. D.; McPherson, K.; Finegood, D. T.; Moodie, M. L.; Gortmaker, S. L. The global obesity pandemic: shaped by global drivers and local environments. The Lancet 2011, 378(9793), 804–814. [Google Scholar] [CrossRef] [PubMed]
- Tomé, D.; Chaumontet, C.; Even, P. C.; Darcel, N.; Azzout-Marniche, D. Protein status modulates the rewarding value of foods and meals to maintain an adequate protein intake. Physiology & Behavior 2019, 206, 7–12. [Google Scholar] [CrossRef] [PubMed]
- Turner, N.; Cooney, G. J.; Kraegen, E. W.; Bruce, C. R. Fatty acid metabolism, energy expenditure and insulin resistance in muscle. Journal of Endocrinology 2014, 220(2), T61–T79. [Google Scholar] [CrossRef] [PubMed]
- Vincent, H. K.; Raiser, S. N.; Vincent, K. R. The aging musculoskeletal system and obesity-related considerations with exercise. Ageing Research Reviews 2012, 11(3), 361–373. [Google Scholar] [CrossRef]
- Weaver, C. M.; Gordon, C. M.; Janz, K. F.; Kalkwarf, H. J.; Lappe, J. M.; Lewis, R.; Zemel, B. S. The National Osteoporosis Foundation’s position statement on peak bone mass development and lifestyle factors: a systematic review and implementation recommendations. Osteoporosis International 2016, 27(4), 1281–1386. [Google Scholar] [CrossRef]
- Westerterp, K. R. Exercise, energy balance and body composition. European Journal of Clinical Nutrition 2018, 72(9), 1246–1250. [Google Scholar] [CrossRef]
- Wolfe, R. R. The underappreciated role of muscle in health and disease. The American Journal of Clinical Nutrition 2006, 84(3), 475–482. [Google Scholar] [CrossRef]
- Wu, Y.; Wang, W.; Liu, T.; Zhang, D. Association of grip strength with risk of all-cause mortality, cardiovascular diseases, and cancer in community-dwelling populations: a meta-analysis of prospective cohort studies. Journal of the American Medical Directors Association 2017, 18(6), 551–e17. [Google Scholar] [CrossRef]
- Wycherley, T. P.; Noakes, M.; Clifton, P. M.; Cleanthous, X.; Keogh, J. B.; Brinkworth, G. D. A high-protein diet with resistance exercise training improves weight loss and body composition in overweight and obese patients with type 2 diabetes. Diabetes Care 2010, 33(5), 969–976. [Google Scholar] [CrossRef]
Figure 1.
EBM and CIM compared. EBM accounts for obesity as due to changes in the food environment (e.g., abundant high energy foods and associated cues) stimulating feeding responses that lead to more energy being consumed, with the gradual accrual of energy surpluses culminating in more body fat. Exercise plays the potential role of burning off energy that would otherwise contribute to these surpluses. CIM accounts for body fat as caused by high levels of sugar intake, with changes in the nature and quantity of this fat promoting eating behaviour that may increase energy intake.
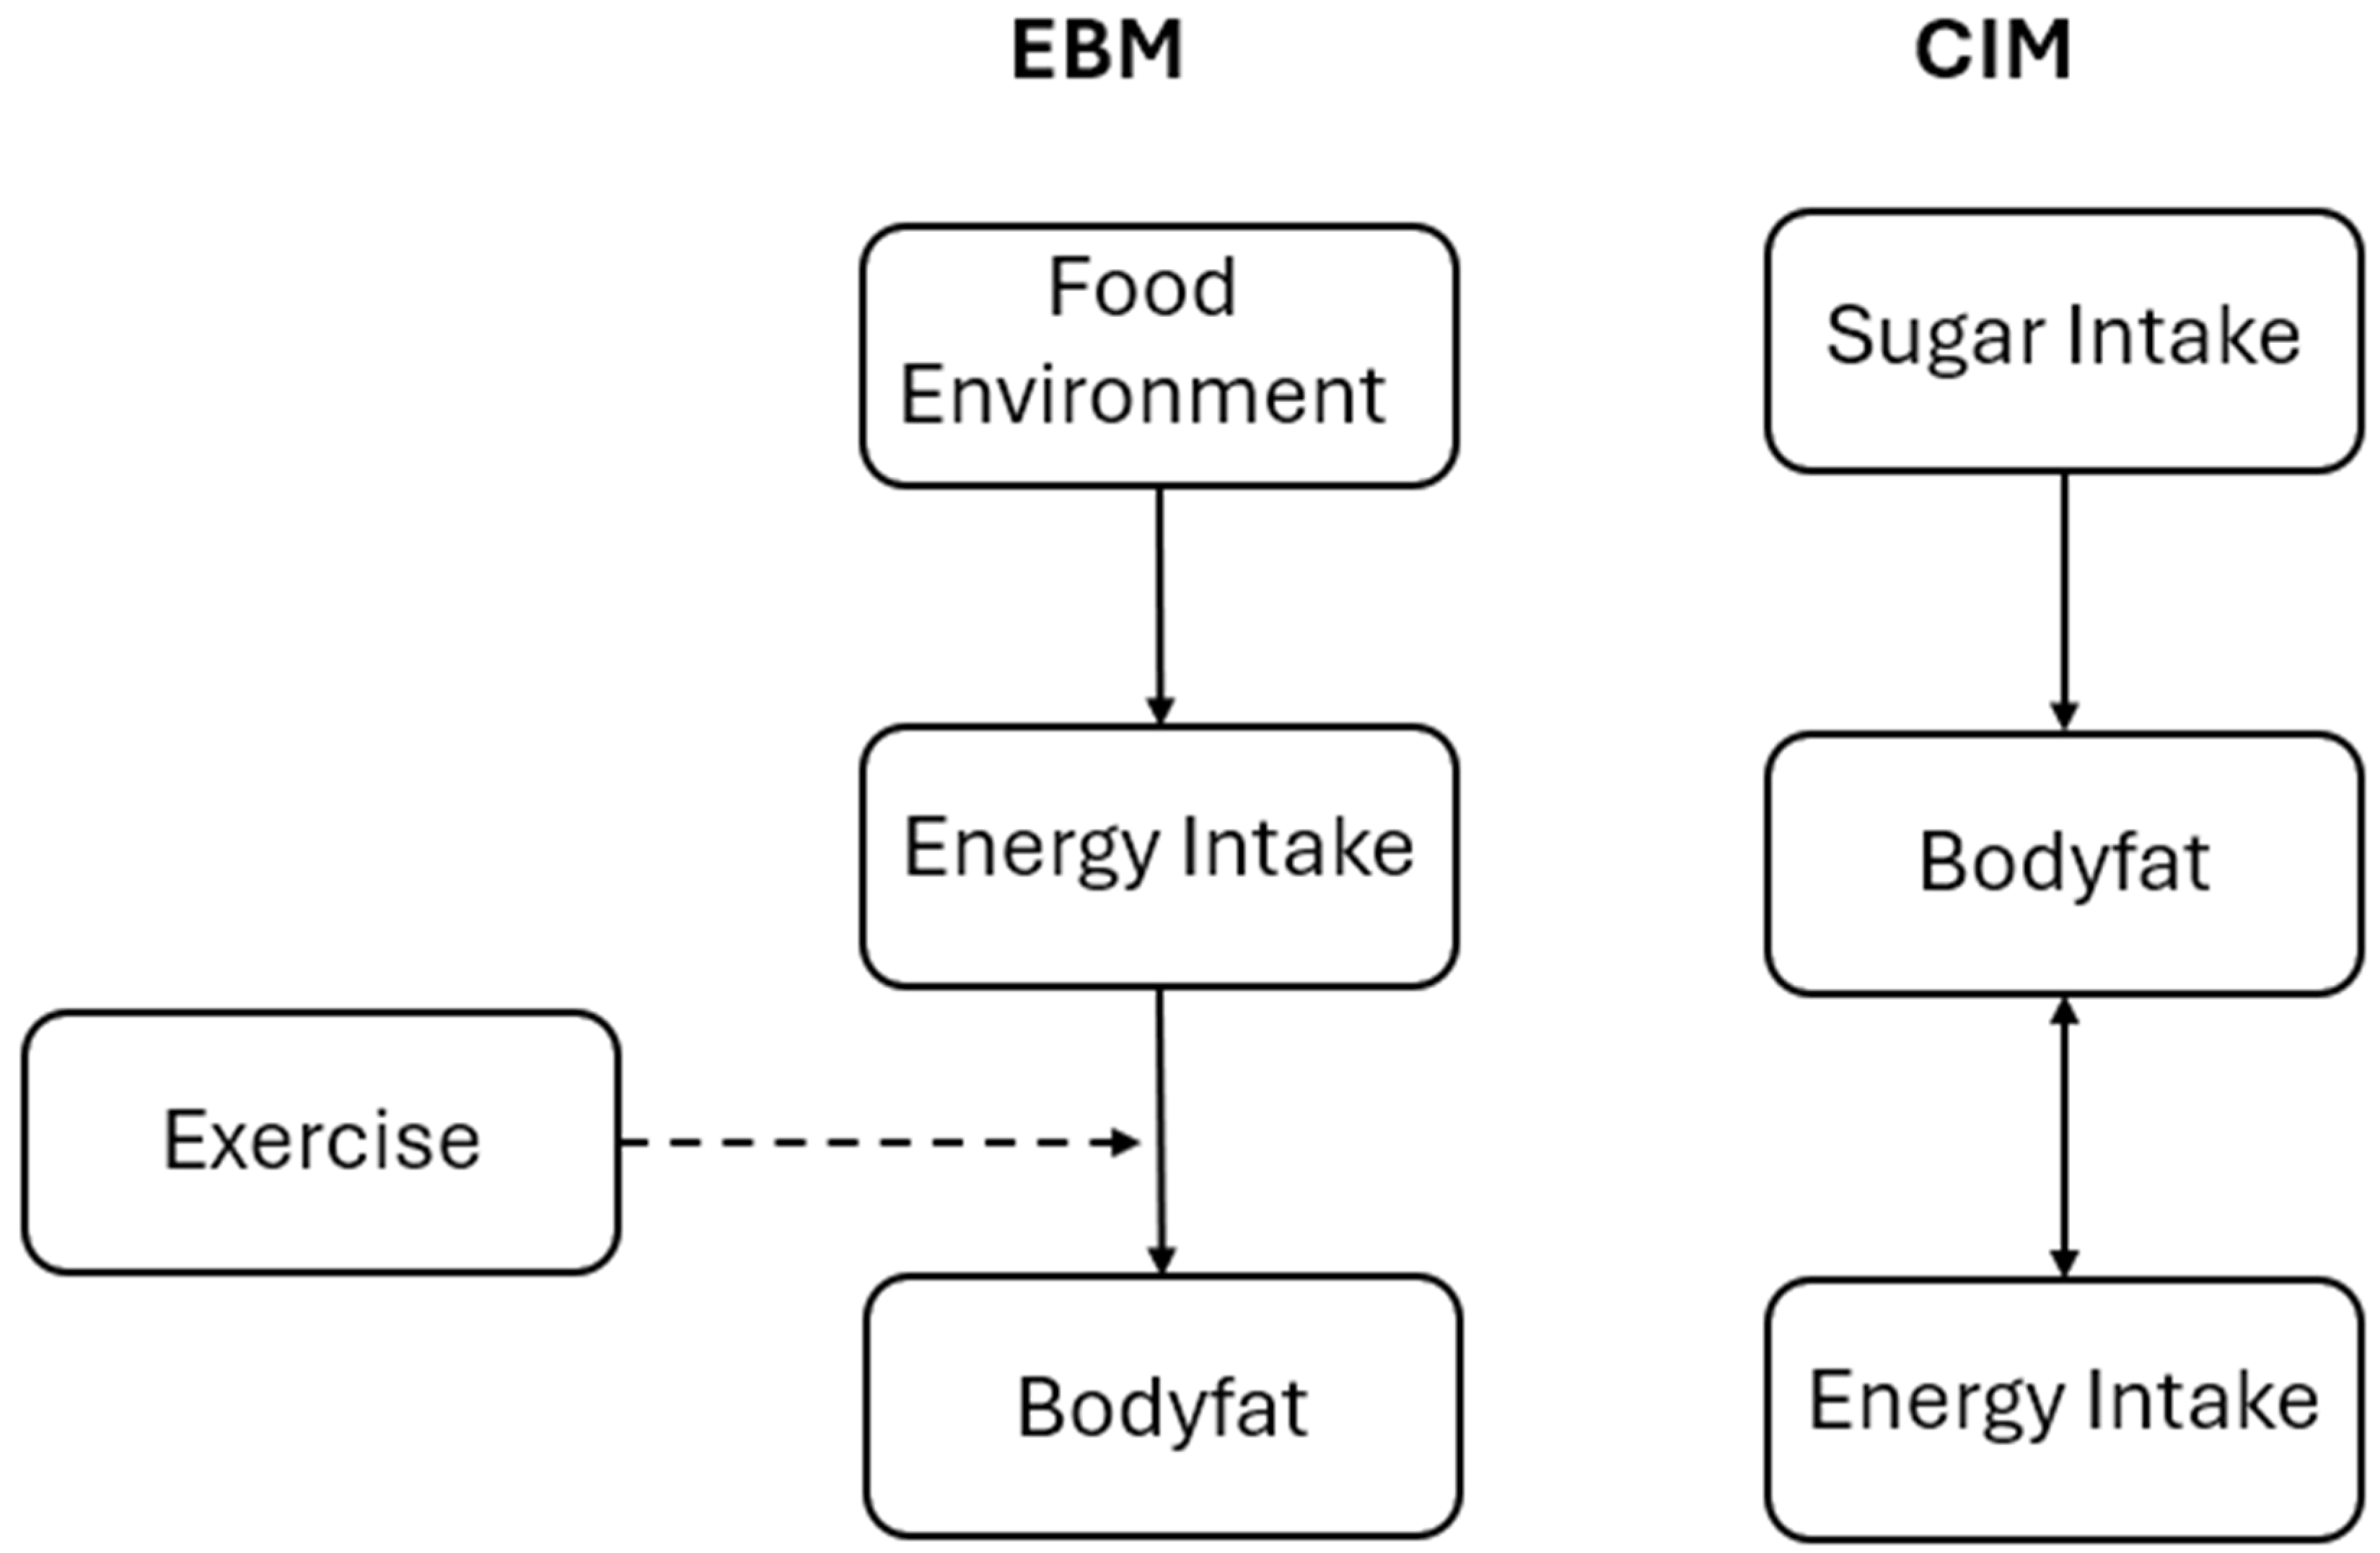
Figure 2.
The Protein Partitioning Model. Amount of “effective” protein in a diet consumed (e.g., protein allocated to muscle protein turnover determined to qualitative aspects of the protein and type of exercise environment) determined quantity of healthy muscle, which in turn dictates how much of energy consumed remains to be partitioned into fat.
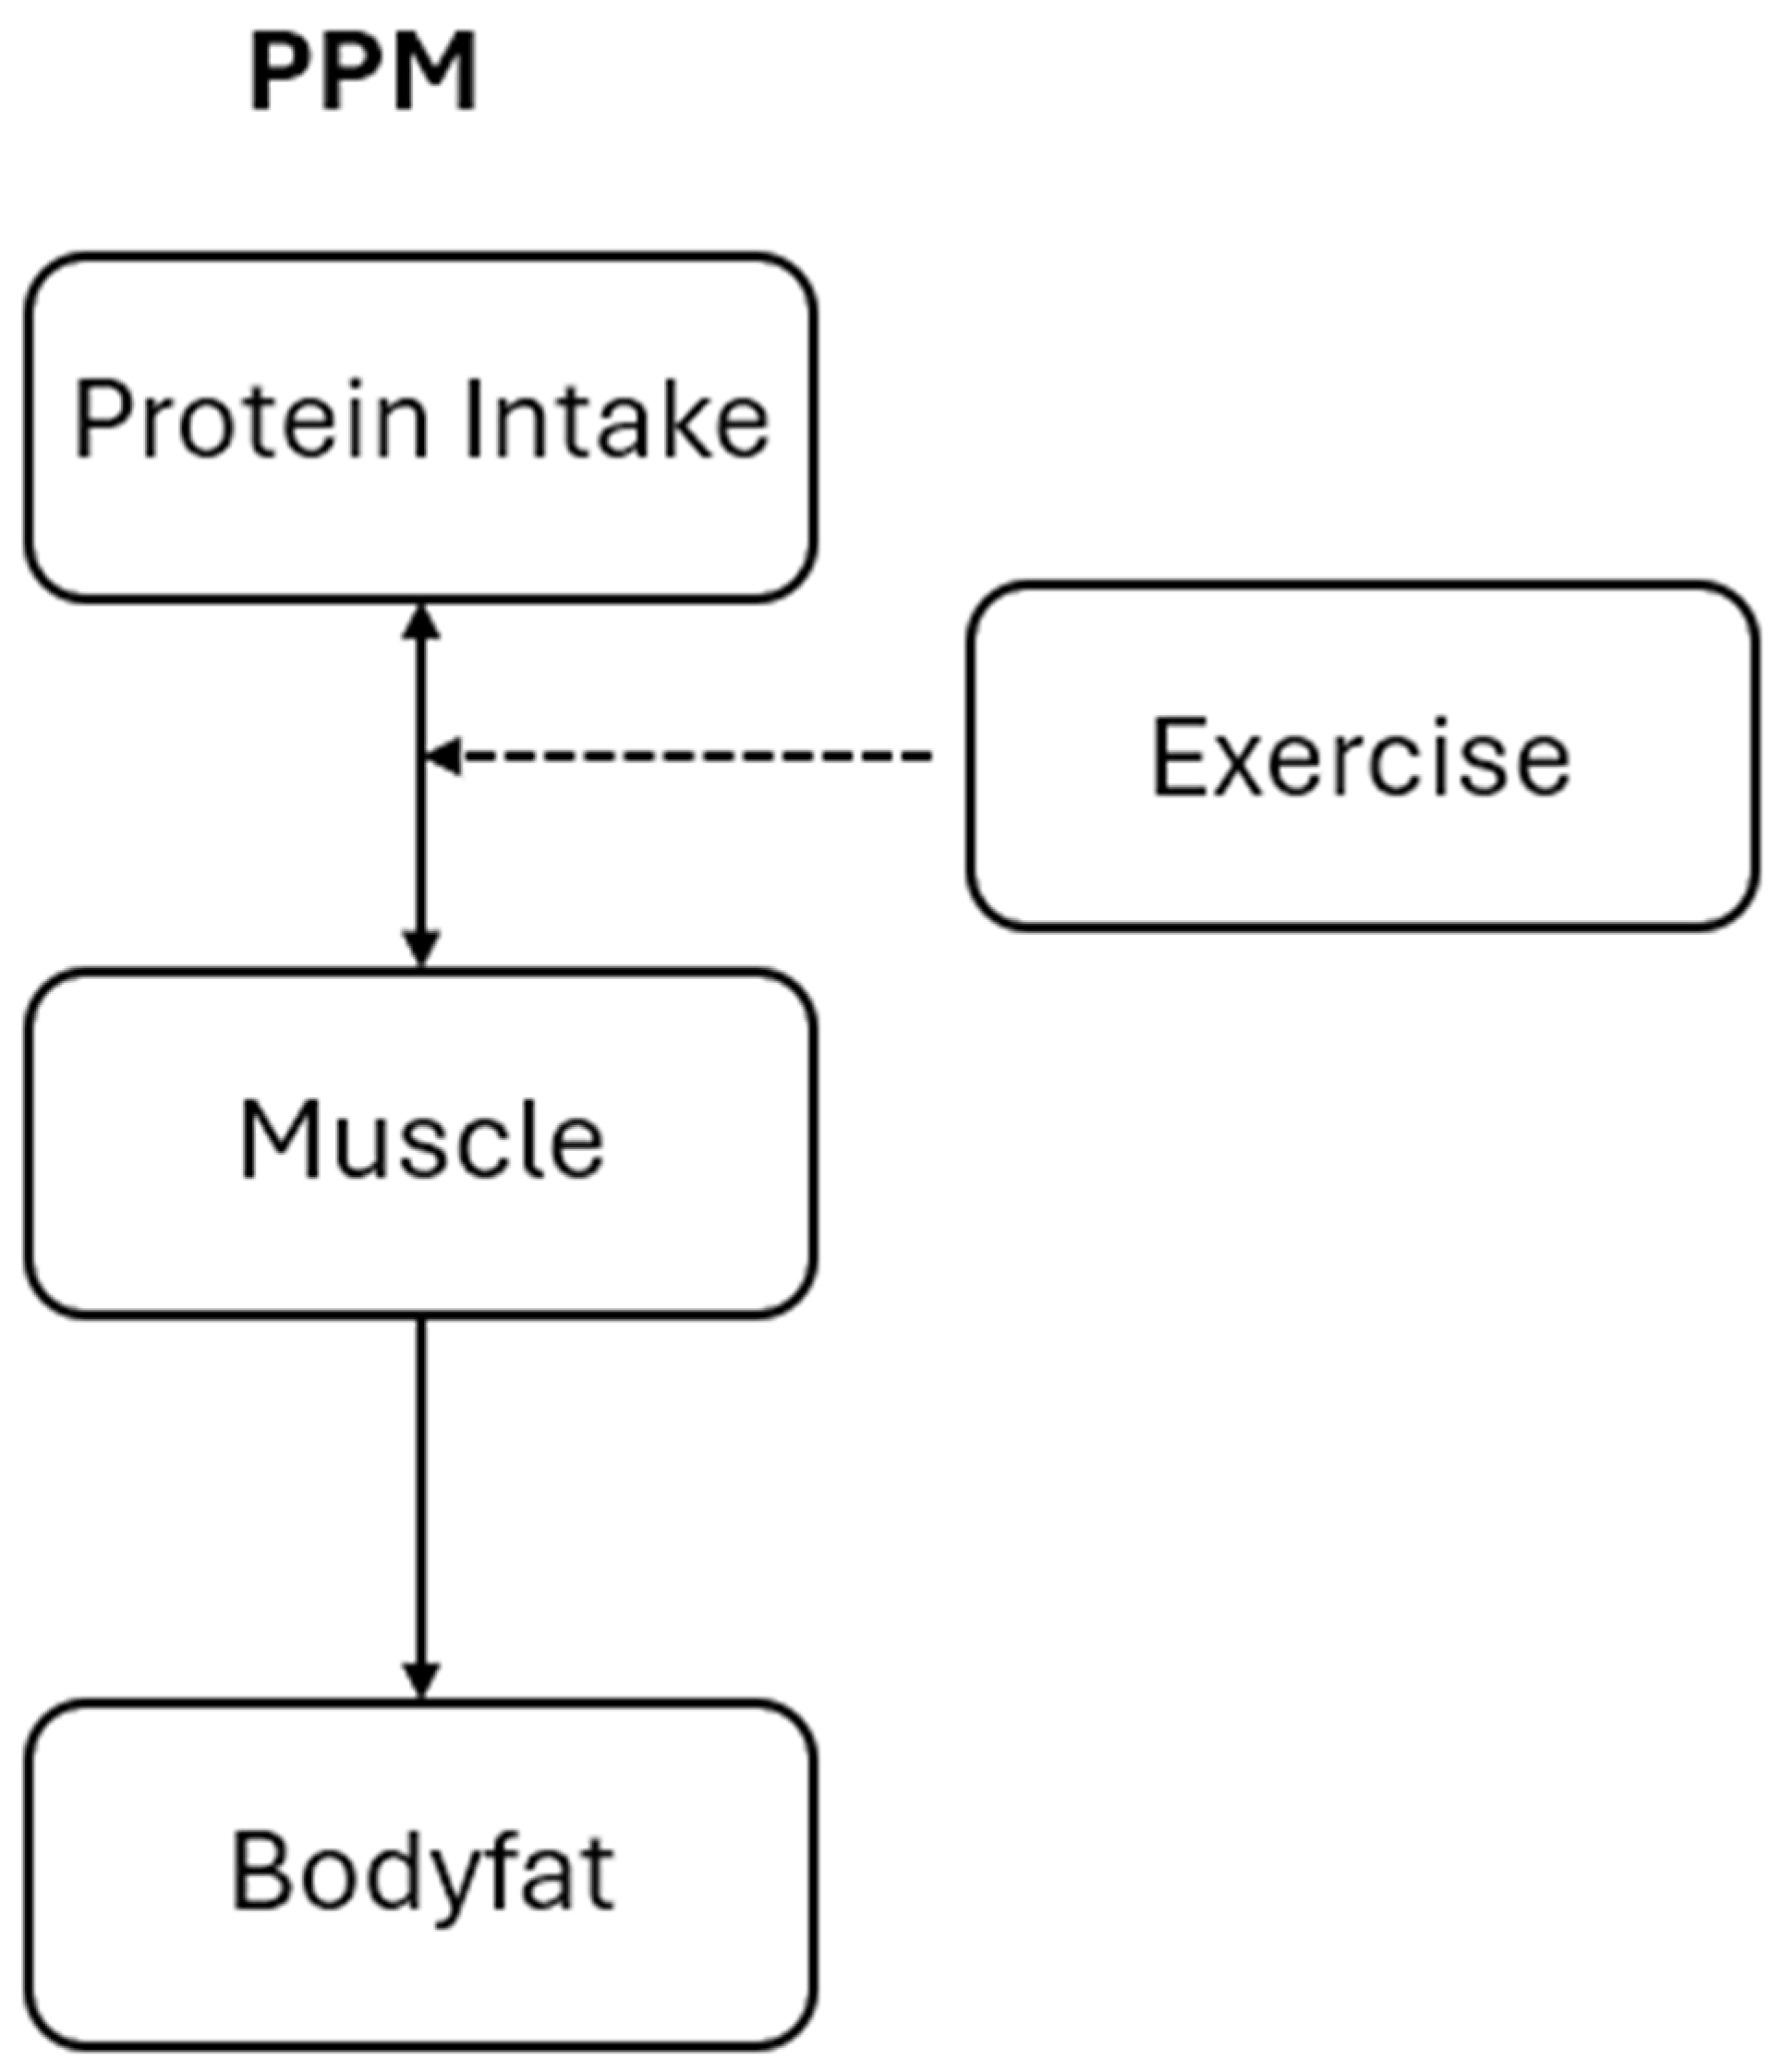
Figure 3.
Dual Rational Food Addictions. Consumption paths for two rational addictions are shown (protein in grey and sugar in black). Low steady states for protein addiction () and sugar addiction () are shown here as unstable, with increases in either consumption of stock driving them into the vicinity of a higher stable steady state. For sugar addiction, this corresponds to a much larger change in stock and regular energy intake, , than for protien addiction, .
Disclaimer/Publisher’s Note: The statements, opinions and data contained in all publications are solely those of the individual author(s) and contributor(s) and not of MDPI and/or the editor(s). MDPI and/or the editor(s) disclaim responsibility for any injury to people or property resulting from any ideas, methods, instructions or products referred to in the content. |
© 2026 by the authors. Licensee MDPI, Basel, Switzerland. This article is an open access article distributed under the terms and conditions of the Creative Commons Attribution (CC BY) license (http://creativecommons.org/licenses/by/4.0/).
Copyright: This open access article is published under a Creative Commons CC BY 4.0 license, which permit the free download, distribution, and reuse, provided that the author and preprint are cited in any reuse.


