Submitted:
05 February 2026
Posted:
06 February 2026
You are already at the latest version
Abstract
The unique visual characteristics of wood can evoke and regulate affect. This study quantitatively investigates the affective responses to the visual characteristics of wood radial sections based on the dimensions of valence and arousal. First, the visual characteristics of radial sections were quantified, proposing the wood color characteristic parameter (c) and density characteristic parameter (d), and defining their respective ranges. Subsequently, by controlling these visual characteristics, the study explored their influence patterns on affective valence and arousal, thereby constructing an affective response model. Finally, the model was evaluated through an eye-tracking experiment, and prediction results were correlated with eye-tracking metrics. Results indicate that the visual characteristic parameters of radial sections range within 20 < c < 80 (dark brown to light yellow) and 5 < d < 25 (dense to sparse). Lighter wood color (higher c values) and denser grain (lower d values) evoked higher valence and lower arousal, indicating emotions tending toward pleasant relaxation. The proposed model effectively predicted the correlation between sections and affects, achieving a Mean Absolute Error (MAE) of 0.2. Predicted valence and arousal values showed high correlation with pupil data, further validating the model's reliability from a physiological perspective.
Keywords:
wood color
; wood grain
; visual perception
; affect
; eye-tracking
1. Introduction
When people interact with natural environments or elements such as plants or water bodies, certain indicators of human stress and well-being often improve, including affective states, cognitive performance, and physiological arousal levels [1,2,3]. As a core natural element indoors, wood possesses unique visual characteristics that can evoke significant affective responses, helping to alleviate stress and enhance psychological well-being [4,5,6]. However, the vast diversity of wood species and their varying visual characteristics yield distinct psychological benefits, resulting in complex and diverse affective responses [7,8]. Therefore, clarifying the quantitative relationship between wood's visual characteristics and affective responses is essential. It enables the fulfillment of psychological and emotional needs, ultimately enhancing human well-being.
Among wood's visual characteristics, color and grain exert the most significant influence on affect [9]. The lightness and red-green components of wood color are closely related to perceptions of warmth/coolness and premiumness; grain line thickness correlates with sensations of softness and naturalness [10]. Some studies have approached wood's visual characteristics from a computer graphics perspective, treating them as pixel variations to explore emotional connections [11,12]. For instance, research has found that the realism of wood images correlates highly with brightness statistics [13]. Despite extensive research on the relationship between wood's visual characteristics and affective responses, these studies remain inductive conclusions and have yet to establish quantitative relationships between visual characteristics and affects. Notably, studies on wood-evoked affect primarily rely on subjectively selected affective vocabulary—such as “luxury” or “naturalness”—to describe these responses [14]. However, this approach suffers from redundant terminology and strong subjectivity in selection, hindering the formation of a unified descriptive framework. Valence-Arousal affective space characterizes most affects through two orthogonal dimensions: valence and arousal [15,16,17,18]. This framework resolves the aforementioned issues by providing a unified structure for affect quantification. Furthermore, wood's visual characteristics not only evoke affect but also sufficiently influence physiological responses such as EEG, heart rate, and eye movements [19,20,21,22,23]. Regarding eye movements, Wan et al. found a positive correlation between eye-tracking data and subjective visual evaluations of materials [24], while Qin et al. observed that color attributes significantly impact a material's visual salience [25]. Moreover, eye-tracking metrics are regulated by the autonomic nervous system and exhibit high correlation with emotions [26]. For instance, the valence and arousal of stimulus materials significantly influence pupil responses [2,27,28]. Therefore, integrating physiological experiments to analyze affective responses substantially enhances research objectivity.
Establishing quantitative relationships between the visual characteristics of wood and affective responses, and constructing corresponding models, not only provides a more refined framework for describing wood's affect but also offers a basis for designers to develop creations that meet psychological needs. For instance, designers can utilize the model to evaluate the affective orientation of designs or match optimal woods to feeling. This paper focuses on wood radial sections. First, parameters describing wood color characteristics (c) are defined based on a standardized colorimetric system. Parameters describing grain density (d) are proposed according to grain formation principles. These are used for quantitative analysis of visual characteristics, combined with the valence-arousal affective space to describe the affective response to wood sections. Next, by controlling the visual characteristics of sections, the study investigates their influence on affective valence and arousal, establishing an Affective Response Model. Finally, through eye-tracking experiments, the model's predictions are compared with participants' actual judgments, and the model parameters were then correlated with eye-tracking metrics.
2. Visual Characteristics and Affective Responses of Wood
To establish a quantitative model between the visual characteristics of wood radial sections and affective responses, both must first be quantified. For visual characteristics, analyzing the distribution patterns of wood color in the color space derived a color distribution curve. Parameters describing color variation were defined, clarifying their range. Meanwhile, analyzing textual characteristics based on formation principles proposed a parameter describing density variation, with its value range determined. For affective responses, based on the Valence-arousal affective space, affective responses to visual characteristics are quantified through two dimensions.
2.1. Characterization of Wood Color
Color spaces used to describe colors include RGB, CMYK, and CIELAB, among which the CIELAB color space is most widely applied in wood color research [29]. Compared to other color spaces, this system offers significant advantages: first, it more closely approximates the true colors perceived by the human eye, unaffected by variations in display device screens; second, its color distribution is more uniform, with color differences being directly proportional to numerical differences within the color space, facilitating quantitative analysis. The CIELAB color space comprises three axes: lightness index (L), red-green index (a), and yellow-blue index (b). Wood color can be represented by coordinates within this color space. Figure 1 lists the average color values of 66 common wood species (e.g., cedar, pine) obtained from multi-point measurements on wood sections [30,31,32,33,34,35].
The color coordinates of wood are discretely distributed within the CIELAB color space. To enable a continuous description of their distribution pattern, the discrete coordinates are fitted to form a color distribution curve C within the color space, whose parametric equation is expressed as follows:
where L represents the lightness index, ranging from pure white at maximum to pure black at minimum; a represents the red-green index, increasing toward red and decreasing toward green; b represents the yellow-blue index, increasing toward yellow and decreasing toward blue. c serves as the wood color characteristic parameter, functioning as the sole independent variable for wood color representation.
In Figure 1, the distribution of material properties exhibits a nonlinear monotonic trend. A quadratic polynomial represents the simplest parametric model for describing this distribution characteristic. Higher-order polynomials may lead to overfitting and increase model complexity. The mathematical relationship between each variable and parameter c is as follows:
where lij is a constant determining the shape of curve C, which is dependent on the selected set of wood color coordinates. Using least squares regression to fit the discrete coordinates of the 66 wood colors, results in l21 = -26.05, l22 = 1.71, l23 = -0.02; l31 = -36.42, l32 = 1.99, l33 = -0.02. The range of c (20 < c < 80, dark brown to light yellow) is determined by wood color coordinate distribution. The distribution curve is shown in Figure 1.
2.2. Characterization of Wood Grain
Tree growth is significantly influenced by climate. Under warm and humid conditions, growth is faster, and the wood exhibits lighter coloration; conversely, in dry and cold climates, growth slows, and colors darken. Due to the annual cyclical changes in climate, alternating light and dark layers form a concentric layered structure known as growth rings [36]. On radial sections, this layered structure manifests as parallel striped grain patterns (Figure 2a). To concisely describe radial grain patterns, parameters p (grain period, reflecting climate cycle variations) and d (grain width, reflecting intra-cycle climate variations) are defined. Sixty-five radial grain images were collected [8], uniformly resized to 450 pixels to ensure a consistent measurement scale (85 DPI resolution, approximately 134.47 mm), and subjected to binarization. Horizontal measurements of p and d were then taken (Figure 2a). Analysis reveals a positive correlation between p and d, with the linear fitting relationship expressed as:
The parameters p and d jointly influence the perception of texture density, but given their linear relationship as described above, texture density can be directly described by d. Therefore, d is defined as the texture density parameter, where a larger d indicates sparser texture, primarily distributed within the range of 5 to 25 pixels (Figure 2b).
2.3. Valence-Arousal Affective Framework
Figure 3 illustrates the Valence-Arousal affect model proposed by Russell et al., which describes affect as two dimensions: valence and arousal. Valence represents the positive or negative quality of an affect, while arousal indicates its intensity [15]. Any affect can be represented by coordinates within this two-dimensional space. For instance, a valence of 3.6 and arousal of 1.5 correspond to the affect “relaxation” [37,38]. This continuous affect model enables the description of discrete affect using minimal parameters, providing a concise quantitative framework for quantifying affective responses to wood. Therefore, this paper employs the dimensions of valence and arousal to describe affective responses evoked by the visual characteristics of wood.
3. Affective Response Experiment
According to the analysis in section 2, the visual characteristics of wood radial grain patterns are primarily governed by the color parameter (c) and density parameter (d), which range from 20 < c < 80 and 5 < d < 25, respectively. This study precisely controls each visual characteristic parameter through color replacement and grain generation techniques. It combines the Valence–arousal model to quantify affect using valence and arousal parameters. Based on this approach, the research investigates the impact of various visual characteristics on affect in radial sections, constructing a comprehensive model of how color and grain influence affect.
3.1. Sample Preparation and Experimental Setup
To precisely control experimental conditions, the study used programming to generate two sets of samples (Figure 4). These included five samples investigating wood color effects (C-i, i = 1, 2, …, 5) and five samples examining wood density effects (D-i, i = 1, 2, …, 5). Detailed parameter values are listed in Table 1. For the color sample group (C-i), to exclude the influence of grain on affective responses, the density parameter d was fixed at 10, and five equidistant values were selected across the entire range of color parameters (20 < c < 80); For the grain sample group (D-i), to eliminate the influence of color on affect, the color parameter c was fixed at 65, and five equidistant values were selected across the entire range of density parameters (5 < d < 25). Subsequently, two sets of samples (450 × 800 pixels) were generated using Eq. (2) and Eq. (3), respectively, with random noise added to simulate real wood.
The experiment utilized a DELL 2007FP monitor with a 15-inch screen and a resolution of 1024 × 768 pixels. The viewing distance was controlled at 45 cm using a chin rest. A total of 50 participants were recruited, all of whom were native Chinese speakers and had normal color vision (no color blindness or color weakness). The experiment comprised two groups, each presented with five samples. Before the formal experiment began, participants were informed of the study's purpose and procedure. Before the formal experiment began, participants were informed of the study's purpose and procedure. Seated before a monitor, participants viewed sample images of wood sections displayed for 2 seconds each. Subsequently, a questionnaire scale (Table 2) appeared, requiring participants to select corresponding affective responses. After responding, the next sample image was presented, continuing until all 5 samples were completed. The next trial group commenced 30 seconds later. To eliminate order effects, the sequence of sample presentation within each group was randomized. Finally, the questionnaire data were collected and organized to obtain the corresponding valence and arousal scores for different sections of wood.
3.2. Experimental Results
When the density parameter d = 10, the effect of different wood colors on affective responses is shown in Figure 5a; when the color parameter c = 65, the effect of radial grain density on affective responses is shown in Figure 5b. Comparing the two, it is evident that variations in wood color exert a greater influence on affective responses than grain density, consistent with the findings of Wan Qian et al. [23]. Regarding wood color, increasing c from 20 to 80 transforms the wood color from dark brown to light yellow. c shows a positive correlation with valence and a negative correlation with arousal. This trend exhibits a “triple-fold curve” pattern, where the intermediate color range (35 < c < 65) demonstrates a more gentle affective response change compared to the dark range (c < 35) and light range (c > 65). Regarding grain density, increasing d from 5 to 25 changes the grain from dense to sparse. d shows a negative correlation with valence and a positive correlation with arousal. A turning point occurs at d = 10, where the dense grain range (5 < d < 10) exerts a more significant effect on affective responses than the sparse range (10 < d < 25). Overall, wood radial sections with lighter colors and denser grains evoke greater feelings of pleasure and relaxation.
3.3. Relationship Between Visual Characteristics and Affective Response
To quantitatively describe the relationship between visual characteristics and affective response. First, based on experimental results, independent relationship equations were established for each characteristic parameter with valence and arousal. Then, since the conditions of the two experiments overlapped at c = 65 and d = 10, their effects were combined using this reference point. Finally, to evaluate the correlation between radial section images and target affect, the correlation parameter r was introduced.
The influence of color parameter (c) and density parameter (d) on affect is defined as follows:
where vc and ac represent the effects of the color characteristic parameter c on valence and arousal, respectively; vd and ad represent the effects of the density characteristic parameter d on valence and arousal, respectively.
In Figure 5, the relationships between c and d with affection exhibit “triple-folded” and “double-folded” patterns, corresponding to the morphological characteristics of third-order and second-order polynomials, respectively. By applying least squares regression analysis to the experimental data, the relationships between these variables and valence and arousal can be derived as follows:
where nij and mij are constants determined by experimental results. Based on samples c and d and their measured valence and arousal, we obtain n11 = -2.77, n12 = 0.35, n13 = -0.01, n14 = 4.50×10⁻⁵; n21 = 7.65, n22 = -0.26, n23 = 0.01, n24 = -3.40×10⁻⁵; m11 = 3.95, m12 = -0.06, m13 = 9.79×10⁻⁴, m21 = 1.84, m22 = 0.08, m23 = -1.51×10⁻³.
The conditions of the two experimental groups coincide at c = 65 and d = 10. Under these conditions, the valence and arousal corresponding to the color and grain samples can be calculated separately using the independent relationship equation Eq. (5): vc(65), vd(10), and ac(65), ad(10). Assuming the affective influences of color and grain are approximately independent and additive, the average of these two sets of calculated values serves as the basis for superposition. After linear superposition, the relationship between visual characteristics and affect is as follows:
where vc(c) and vd(d) represent the relationship equations between color and density with valence (Figure 6a and Figure 6b), while ac(c) and ad(d) represent the relationship equations between color and density with arousal (Figure 6d and Figure 6e). The relationship between the combined visual characteristics and affect is shown in Figure 6c and Figure 6f.
The measured visual characteristic parameters of the wood radial sections are substituted into Eq. (6) to obtain corresponding valence and arousal values. However, describing affect using valence and arousal is not intuitive. Therefore, this study introduces the parameter r to quantify the correlation between radial section image and target affect. It is defined as the inverse of the Euclidean distance between the two in the Valence-Arousal affect space:
where (V, A) represents the affective computation value of the radial section image derived from Eq. (6); (v, a) represents the coordinate of the target affect in the valence-arousal affective space, such as “relaxation” corresponding to (3.6, 1.5) [37,38]. A higher computed r value indicates a stronger correlation between the section and the target affective demand.
4. Eye-Tracking Experiments
This study employs real wood radial section images and specific target affective vocabulary, combined with eye-tracking experiments, to validate the reliability of the wood affect prediction model and its correlation parameter r. On one hand, r is calculated by inputting the visual characteristic parameters of the section, along with the valence and arousal of the target affect, into the model. The actual correlation is then derived from participants' judgments of the section and affect. The consistency between the calculated and actual correlations is compared to evaluate the predictive accuracy of parameter r. On the other hand, given the strong correlation between affects and eye-tracking metrics, we further validated the model's validity at the physiological level by analyzing the relationship between eye-tracking data and the visual characteristic parameters (c, d) and affect parameters (V, A) of the section samples.
4.1. Stimuli for Eye-Tracking Experiments
Five real wood radial section images were used as experimental samples [8], with three words serving as target affects. All sections were uniformly processed into 450×800 pixel JPG format images (Figure 7). Based on the previously proposed visual characteristic quantification method, the c and d values of the radial sections were measured and calculated. Substituting these into Eq. (6) yielded the V and A values (Table 3). To ensure affective distinctiveness, three words exhibiting significant differences in the valence-arousal space were selected as target affects. Corresponding v and a values (Table 4) were obtained using the Chinese EmoBank developed by Lung-Hao Lee et al. [37,38].
4.2. Procedure for Eye-Tracking Experiments
EyeLink II was employed as the eye-tracking data acquisition device, with display equipment and experimental distance identical to those used in the Affective Response Experiment. All 16 participants were native Chinese speakers with no color blindness or color deficiency. The experiment comprised 5 section samples and 3 affective words, totaling 15 trials. Prior to the formal experiment, the equipment was calibrated, and participants were informed of the experiment's purpose and procedure. The presentation sequence for a single trial is illustrated in Figure 8. Participants sat before the display. First, a blank page marked with a central “+” symbol appeared for 2 seconds, guiding participants to focus their gaze at the screen's center. Subsequently, an image of a wood section sample was displayed for 2 seconds. This was followed by a 1-second white screen to eliminate visual persistence. The affective word then appeared, prompting the participant to judge whether the sample matched the word's description (press “A” for match; “L” for mismatch). After pressing the key, the next trial began, continuing until all 15 trials were completed. To eliminate order effects, trials order was randomized. Finally, the participant's eye-tracking data during sample viewing and judgment responses were collected.
4.3. Result of Eye-Tracking Experiments
To quantify participants' actual perception of the degree of correlation between samples and target affects, the ratio of participants judging a sample to match the target affect (by pressing the “A” key) is defined as rmatch, expressed as follows:
where n is the total number of participants, and nA is the number of participants who pressed the “A” key for the corresponding trial. This metric reflects the actual perceived strength of correlation between the samples and target affects.
The correlation analysis between the model-calculated r parameter (Figure 9a) and the rmatch parameter reflecting participants' actual judgments (Figure 9b) was conducted. The r and rmatch values between samples and affects exhibited a significant positive correlation, with a Spearman correlation coefficient of 0.53 (p < 0.05). To evaluate the predictive accuracy of r, we performed Min-Max normalization on r and compared it with rmatch (Figure 9c). The results indicate that r exhibits low prediction error, with a Mean Absolute Error (MAE) of 0.2.
To further validate the model's reliability at the physiological level, this study conducted Pearson correlation analyses between the calculated model parameters for each sample and the eye-tracking data (Figure 10). Results indicate that the color parameter (c) exhibits a more significant correlation with pupil size compared to the density parameter (d), which aligns closely with the conclusion in Section 3.2 that color exerts a stronger influence on affect. Additionally, arousal typically shows a positive correlation with pupil size [27], consistent with eye-tracking experiment findings, while valence correlates negatively with pupil size—likely due to wood evoked valence being negatively associated with arousal.
The above analysis demonstrates that the parameters c and d can effectively quantify the visual characteristics of wood cross-sections. It is also feasible to describe the affective responses evoked by wood based on valence and arousal. Furthermore, the constructed model exhibits high reliability.
5. Conclusions
This study investigates the visual characteristics of wood radial sections based on the valence-arousal affective space. It quantitatively analyzes the visual characteristics of radial sections and describes their affect using the valence-arousal model. Building upon this, an affective response experiment was designed by controlling the visual characteristics of the sections to explore their impact on affect, establishing a relational model between the two. This model can assess the correlation between wood radial sections and target affects by inputting its visual characteristic parameters.
- The color and grain characteristics of radial sections were quantitatively analyzed, proposing simplified visual descriptors: the color parameter (c) and density parameter (d). The valid range for c was determined to be 20–80, corresponding to color transitions from dark brown to light yellow; the valid range for d was 5–25, reflecting grain density variations from dense to sparse.
- Affective response experiments revealed that wood color exerts a more significant influence on affect than grain density. Radial sections with lighter colors and denser grains evoked higher valence and lower arousal, inducing greater feelings of pleasure and relaxation. Wood color exerted a more significant affective impact in the dark range (c < 35) and light range (c > 65) compared to the intermediate range (35 < c < 65). Conversely, grain density had a stronger affective influence in the dense range (5 < d < 10) than in the sparse range (10 < d < 25).
- A relational model linking sectional visual characteristics to affective responses was constructed. This model integrates color and grain properties to derive the valence and arousal of sectional images and assess their correlation with target affect. The model effectively predicts the correlation between section and affect (Mean Absolute Error MAE = 0.2). The color characteristics parameter (c), along with the model-calculated efficacy (V) and arousal (A), showed significant correlation with pupil size (p < 0.05), thereby validating the model's reliability from a physiological perspective.
Author Contributions
Conceptualization, Y.X.; methodology, Y.X.; software, Y.X.; validation, Y.X.; formal analysis, Y.X.; investigation, Y.X.; resources, Y.X.; data curation, Y.X.; writing—original draft preparation, Y.X.; writing—review and editing, Y.X. and Q.H.; visualization, Y.X.; supervision, Q.H.; project administration, Q.H.; funding acquisition, Q.H. All authors have read and agreed to the published version of the manuscript.
Funding
This research was funded by Construction of the Key Laboratory of Philosophy and Social Sciences of the Ministry of Education: Design-AI Lab at China Academy of Art, grant number 9000N63625004.
Institutional Review Board Statement
This study was conducted in accordance with the Declaration of Helsinki. Ethical review and approval were waived for this study according to Article 32 of the Measures for Ethical Review of Life Sciences and Medical Research Involving Human Beings of China, as well as Article 22 of the Measures for Scientific and Technological Ethics Review (for Trial Implementation).
Informed Consent Statement
Every participant gave their written informed consent to participate in the study. No identifying information was recorded.
Data Availability Statement
Data is available upon reasonable request.
Acknowledgments
The authors would like to acknowledge the support of the participants for their cooperation in completing this study. During the preparation of this study, the author used ChatGPT 5 (OpenAI, Inc., San Francisco, CA, USA) for the purposes of debugging python codes and refining the language of the manuscript. The authors have reviewed and edited the output and take full responsibility for the content of this publication.
Conflicts of Interest
The authors declare no conflict of interest.
References
- Kaplan, S. The Restorative Benefits of Nature: Toward an Integrative Framework. Journal of Environmental Psychology 1995, 15, 169–182. [Google Scholar] [CrossRef]
- Luo, W.; Yuan, Y.; Wang, L.; Liu, Q.; Li, L. Neighborhood Blue Spaces as Enabling Places for Emotional Well-Being: How Does Visual Perception Influence Affective Arousal and Valence. Building and Environment 2026, 287, 113795. [Google Scholar] [CrossRef]
- Rivieccio, R.; Meneguzzo, F.; Margheritini, G.; Re, T.; Riccucci, U.; Zabini, F. Therapist-Guided Versus Self-Guided Forest Immersion: Comparative Efficacy on Short-Term Mental Health and Economic Value. Behavioral Sciences 2025, 15, 1618. [Google Scholar] [CrossRef] [PubMed]
- Lipovac, D.; Podrekar, N.; Burnard, M.D.; Šarabon, N. Effect of Desk Materials on Affective States and Cognitive Performance. J Wood Sci 2020, 66, 43. [Google Scholar] [CrossRef]
- Tsunetsugu, Y.; Miyazaki, Y.; Sato, H. Physiological Effects in Humans Induced by the Visual Stimulation of Room Interiors with Different Wood Quantities. J Wood Sci 2007, 53, 11–16. [Google Scholar] [CrossRef]
- Zhang, X.; Lian, Z.; Ding, Q. Investigation Variance in Human Psychological Responses to Wooden Indoor Environments. Building and Environment 2016, 109, 58–67. [Google Scholar] [CrossRef]
- Chen, W.S.; Lee, A.S.; Lin, H.C. Study of Visual Evaluations for Wood Flooring Applying Fuzzy Logic. J Wood Sci 2014, 60, 327–338. [Google Scholar] [CrossRef]
- Lipovac, D.; Burnard, M.D. Human Preferences for the Visual Appearance of Desks: Examining the Role of Wooden Materials and Desk Designs. Buildings 2023, 13, 1680. [Google Scholar] [CrossRef]
- Dai, Z.; Xue, J.; Wang, S. Effects of Wood Texture and Color on Aesthetic Pleasure: Two Experimental Studies. IJRES 2023, 12, 125. [Google Scholar] [CrossRef]
- Chen, T. A Study of the Visual Physical Characteristics and Psychological Images of Select Taiwanese Hardwoods. For. Prod. J. 2012, 62, 18–24. [Google Scholar] [CrossRef]
- Liu, J.; Liu, L. Modeling Visual Aesthetic Perception: Bridges between Computed Texture Features and Perceived Beauty Qualities in Semantic Experiments. Cogn. Neurodynamics 2022, 16, 1379–1391. [Google Scholar] [CrossRef]
- Liu, L.Y.; Fan, X.J. The Design of System to Texture Feature Analysis Based on Gray Level Co-Occurrence Matrix. AMM 2015, 727–728, 904–907. [Google Scholar] [CrossRef]
- Katsura, S.; Mizokami, Y.; Yaguchi, H. Perceived Quality of Wood Images Influenced by the Skewness of Image Histogram. Opt Rev 2015, 22, 565–576. [Google Scholar] [CrossRef]
- Guo, F.; Qu, Q.-X.; Nagamachi, M.; Duffy, V.G. A Proposal of the Event-Related Potential Method to Effectively Identify Kansei Words for Assessing Product Design Features in Kansei Engineering Research. Int. J. Ind. Ergon. 2020, 76. [Google Scholar] [CrossRef]
- Russell, J.A. A Circumplex Model of Affect. Journal of Personality and Social Psychology 1980, 39, 1161–1178. [Google Scholar] [CrossRef]
- Wang, S.; Ding, R. A Qualitative and Quantitative Study of Color Emotion Using Valence-Arousal. Front. Comput. Sci. 2012, 6, 469–476. [Google Scholar] [CrossRef]
- Russell, J.; Weiss, A.; Mendelsohn, G. Affect Grid: A Single-Item Scale of Pleasure and Arousal. Journal of Personality and Social Psychology 1989, 57, 493–502. [Google Scholar] [CrossRef]
- Hanada, M. Correspondence Analysis of Color–Emotion Associations. Color Research & Application 2018, 43, 224–237. [Google Scholar] [CrossRef]
- Hu, Q.; Li, X.; Fang, H.; Wan, Q. The Tactile Perception Evaluation of Wood Surface with Different Roughness and Shapes: A Study Using Galvanic Skin Response. WR 2022, 67, 311–325. [Google Scholar] [CrossRef]
- Huang, T.; Zhou, C.; Wang, X.; Kaner, J. A Study of Visual Perception Based on Colour and Texture of Reconstituted Decorative Veneer. Coatings 2023, 14, 57. [Google Scholar] [CrossRef]
- Nakamura, M.; Ikei, H.; Miyazaki, Y. Physiological Effects of Visual Stimulation with Full-Scale Wall Images Composed of Vertically and Horizontally Arranged Wooden Elements. J Wood Sci 2019, 65, 55. [Google Scholar] [CrossRef]
- Nakamura, M.; Ikei, H.; Miyazaki, Y. Effects of Visual Stimulation Using Wooden-Wall Images with Different Amounts of Knots on Psychological and Physiological Responses. Wood Sci Technol 2022, 56, 1869–1886. [Google Scholar] [CrossRef]
- Wan, Q.; Li, X.; Zhang, Y.; Song, S.; Qing, K. Visual Perception of Different Wood Surfaces: An Event-Related Potentials Study. Annals of Forest Science 2021, 78. [Google Scholar] [CrossRef]
- Wan, Q.; Hu, Q.; Chen, B.; Fang, H.; Ke, Q.; Song, S. Study on the Visual Cognition of Laminated Bamboo Furniture. Forest Products Journal 2021, 71, 84–91. [Google Scholar] [CrossRef]
- Qin, J.; Li, C.; Wang, W.; Yu, Y.; Shen, D.; Bao, D. Through the Lens of Color: Relationships between Color Properties and Visual Perception of Wood (Acer.) Figures. Materials & Design 2024, 243, 113071. [Google Scholar] [CrossRef]
- Skaramagkas, V.; Giannakakis, G.; Ktistakis, E.; Manousos, D.; Karatzanis, I.; Tachos, N.S.; Tripoliti, E.; Marias, K.; Fotiadis, D.I.; Tsiknakis, M. Review of Eye Tracking Metrics Involved in Emotional and Cognitive Processes. IEEE Reviews in Biomedical Engineering 2023, 16, 260–277. [Google Scholar] [CrossRef]
- Oliva, M.; Anikin, A. Pupil Dilation Reflects the Time Course of Emotion Recognition in Human Vocalizations. Sci Rep 2018, 8, 4871. [Google Scholar] [CrossRef]
- Pilarczyk, J.; Kuniecki, M.; Wołoszyn, K.; Sterna, R. Blue Blood, Red Blood. How Does the Color of an Emotional Scene Affect Visual Attention and Pupil Size? Vision Research 2020, 171, 36–45. [Google Scholar] [CrossRef] [PubMed]
- Meints, T.; Teischinger, A.; Stingl, R.; Hansmann, C. Wood Colour of Central European Wood Species: CIELAB Characterisation and Colour Intensification. Eur. J. Wood Prod. 2017, 75, 499–509. [Google Scholar] [CrossRef]
- He, T.; Luo, J. Study on the color and luster of twenty species of rosewood. Journal of Forestry Engineering 2016, 1, 44–48. [Google Scholar] [CrossRef]
- Zhao, F. Identification of wood species and study of wood color on twenty kinds of imported wood used for furniture. Master’s thesis, Northwest A & F University, 2010. [Google Scholar]
- Jia, T.; Niu, X. EvaluationofColorandVisualCharacteristicsof22KindsofMahogany Wood. Journal of Northwest Forestry University 2017, 32, 250–258+269. [Google Scholar] [CrossRef]
- Liu, S.; Lin, J.; Lin, Y. Surface Properties Analysis of 4 Common Decorative Wood. Jour of Fujian Forestry Sci and Tech 2013, 40, 54–56. [Google Scholar] [CrossRef]
- Guan, Y.; Liu, S.; Du, X. Research on Color Chromaticity of Wood Surface. China Forest Products Industry 2021, 58, 65–70. [Google Scholar] [CrossRef]
- Xu, L.; Wang, X.; Guan, X.; Zhu, N.; Xu, C.; Li, D. Chromaticity of Macro-structural Patterns of Wood Tangential Section. PACKAGING ENGINEERING 2020, 41, 242–249. [Google Scholar] [CrossRef]
- Ruffinatto, F.; Negro, F.; Crivellaro, A. The Macroscopic Structure of Wood. Forests 2023, 14, 644. [Google Scholar] [CrossRef]
- Yu, L.C.; Lee, L.H.; Hao, S.; Wang, J.; He, Y.; Hu, J.; Lai, K.R.; Zhang, X. Building Chinese Affective Resources in Valence-Arousal Dimensions: 15th Conference of the North American Chapter of the Association for Computational Linguistics: Human Language Technologies, NAACL HLT 2016. 2016 Conference of the North American Chapter of the Association for Computational Linguistics 2016, 540–545. [CrossRef]
- Lee, L.H.; Li, J.H.; Yu, L.C. Chinese EmoBank: Building Valence-Arousal Resources for Dimensional Sentiment Analysis. ACM Transactions on Asian and Low-Resource Language Information Processing 2022, 21. [Google Scholar] [CrossRef]
Figure 1.
Wood color distribution.
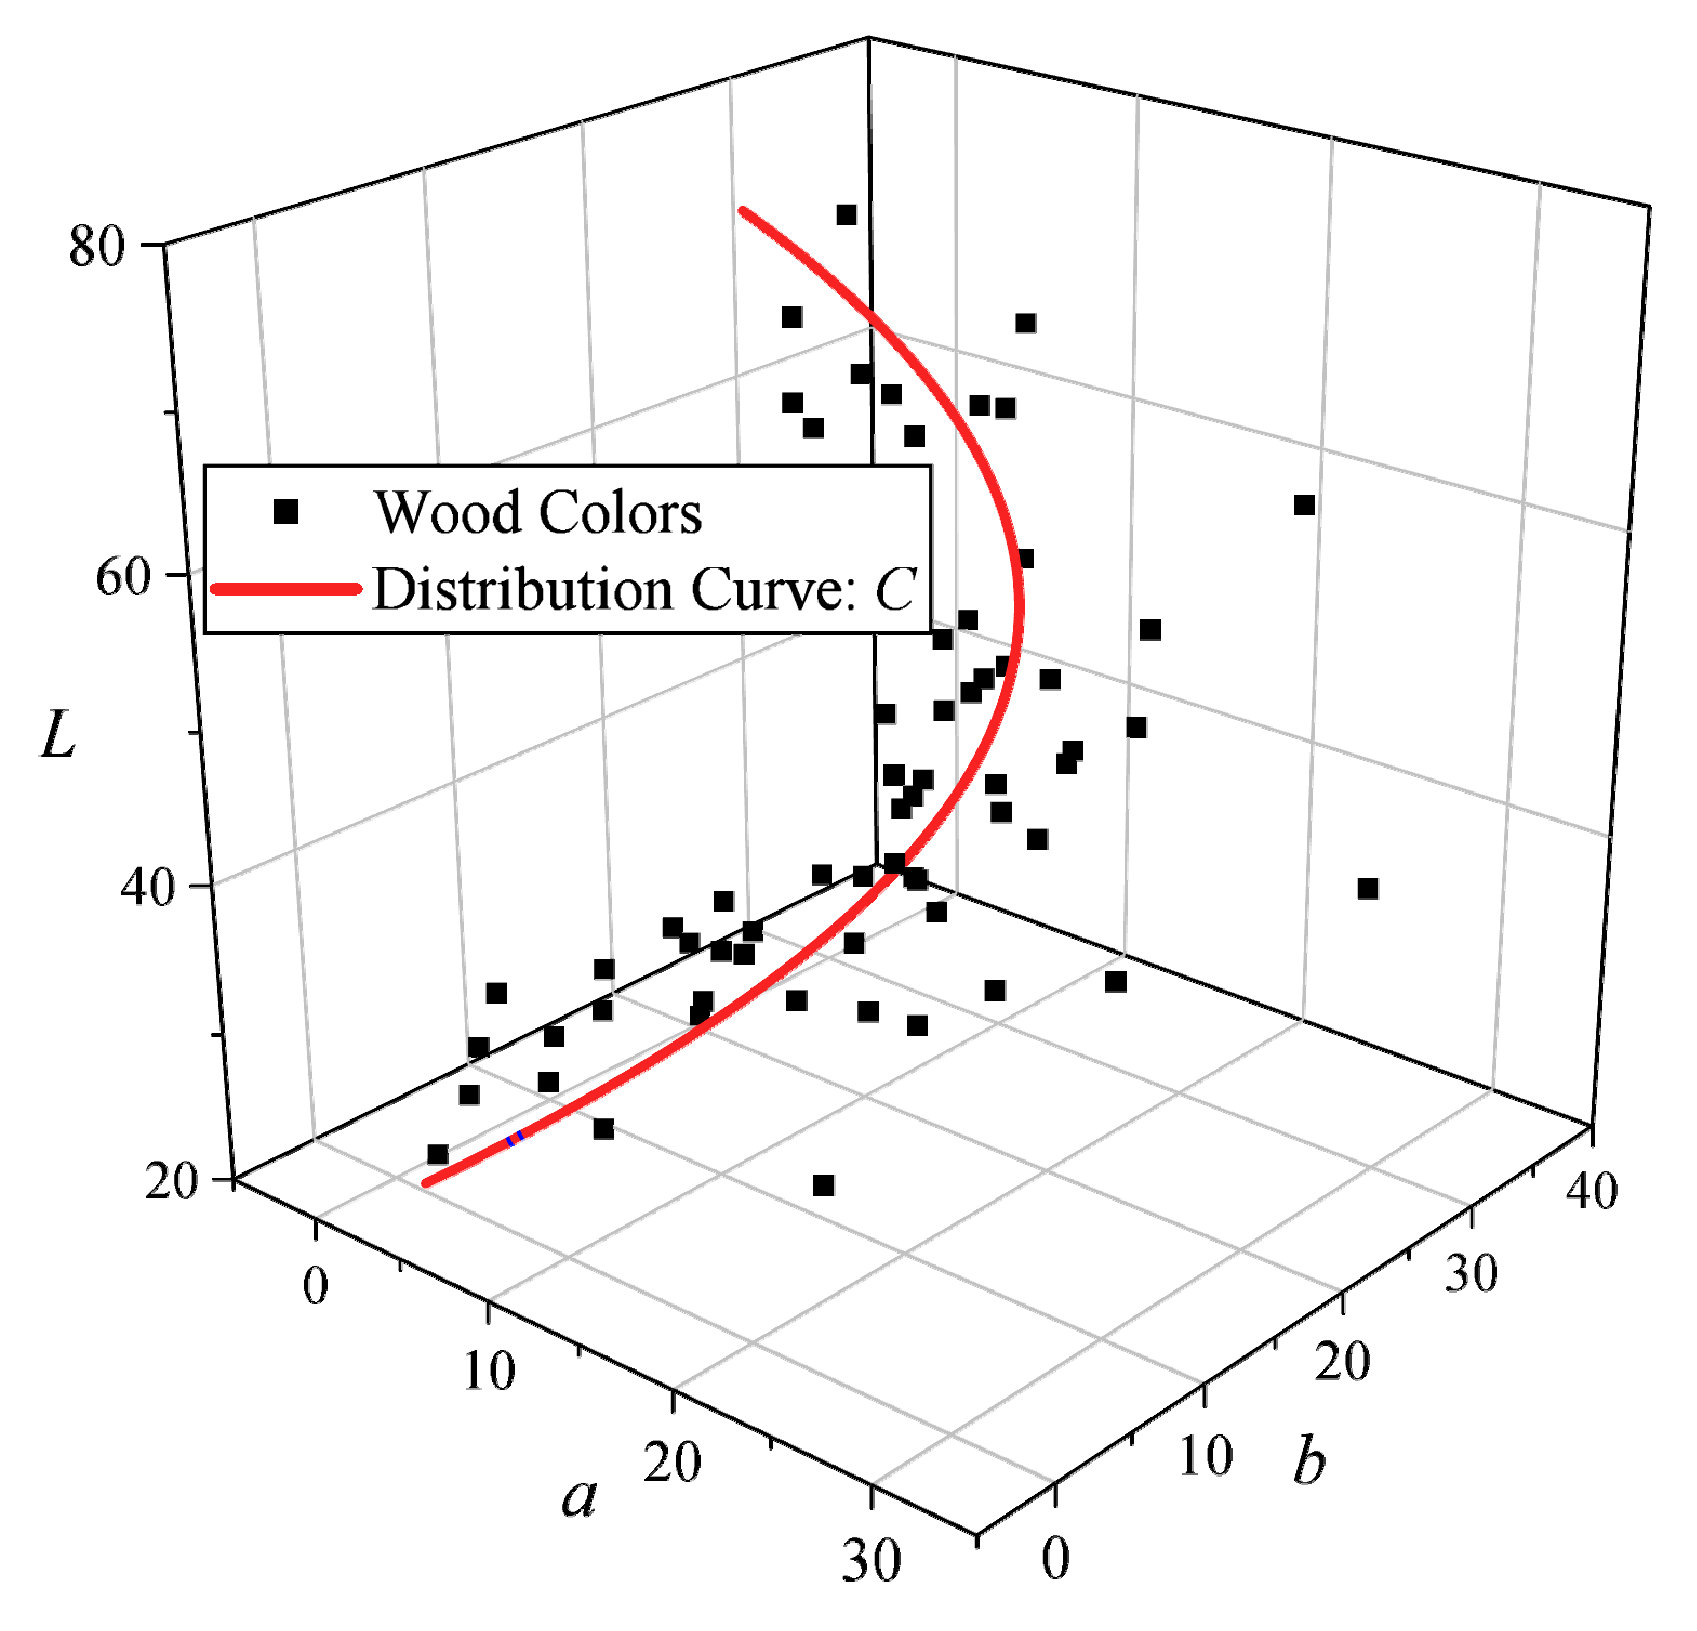
Figure 2.
Grain visual characteristic analysis: (a) Grain measurement. (b) Distribution of density characteristic parameters.
Figure 2.
Grain visual characteristic analysis: (a) Grain measurement. (b) Distribution of density characteristic parameters.
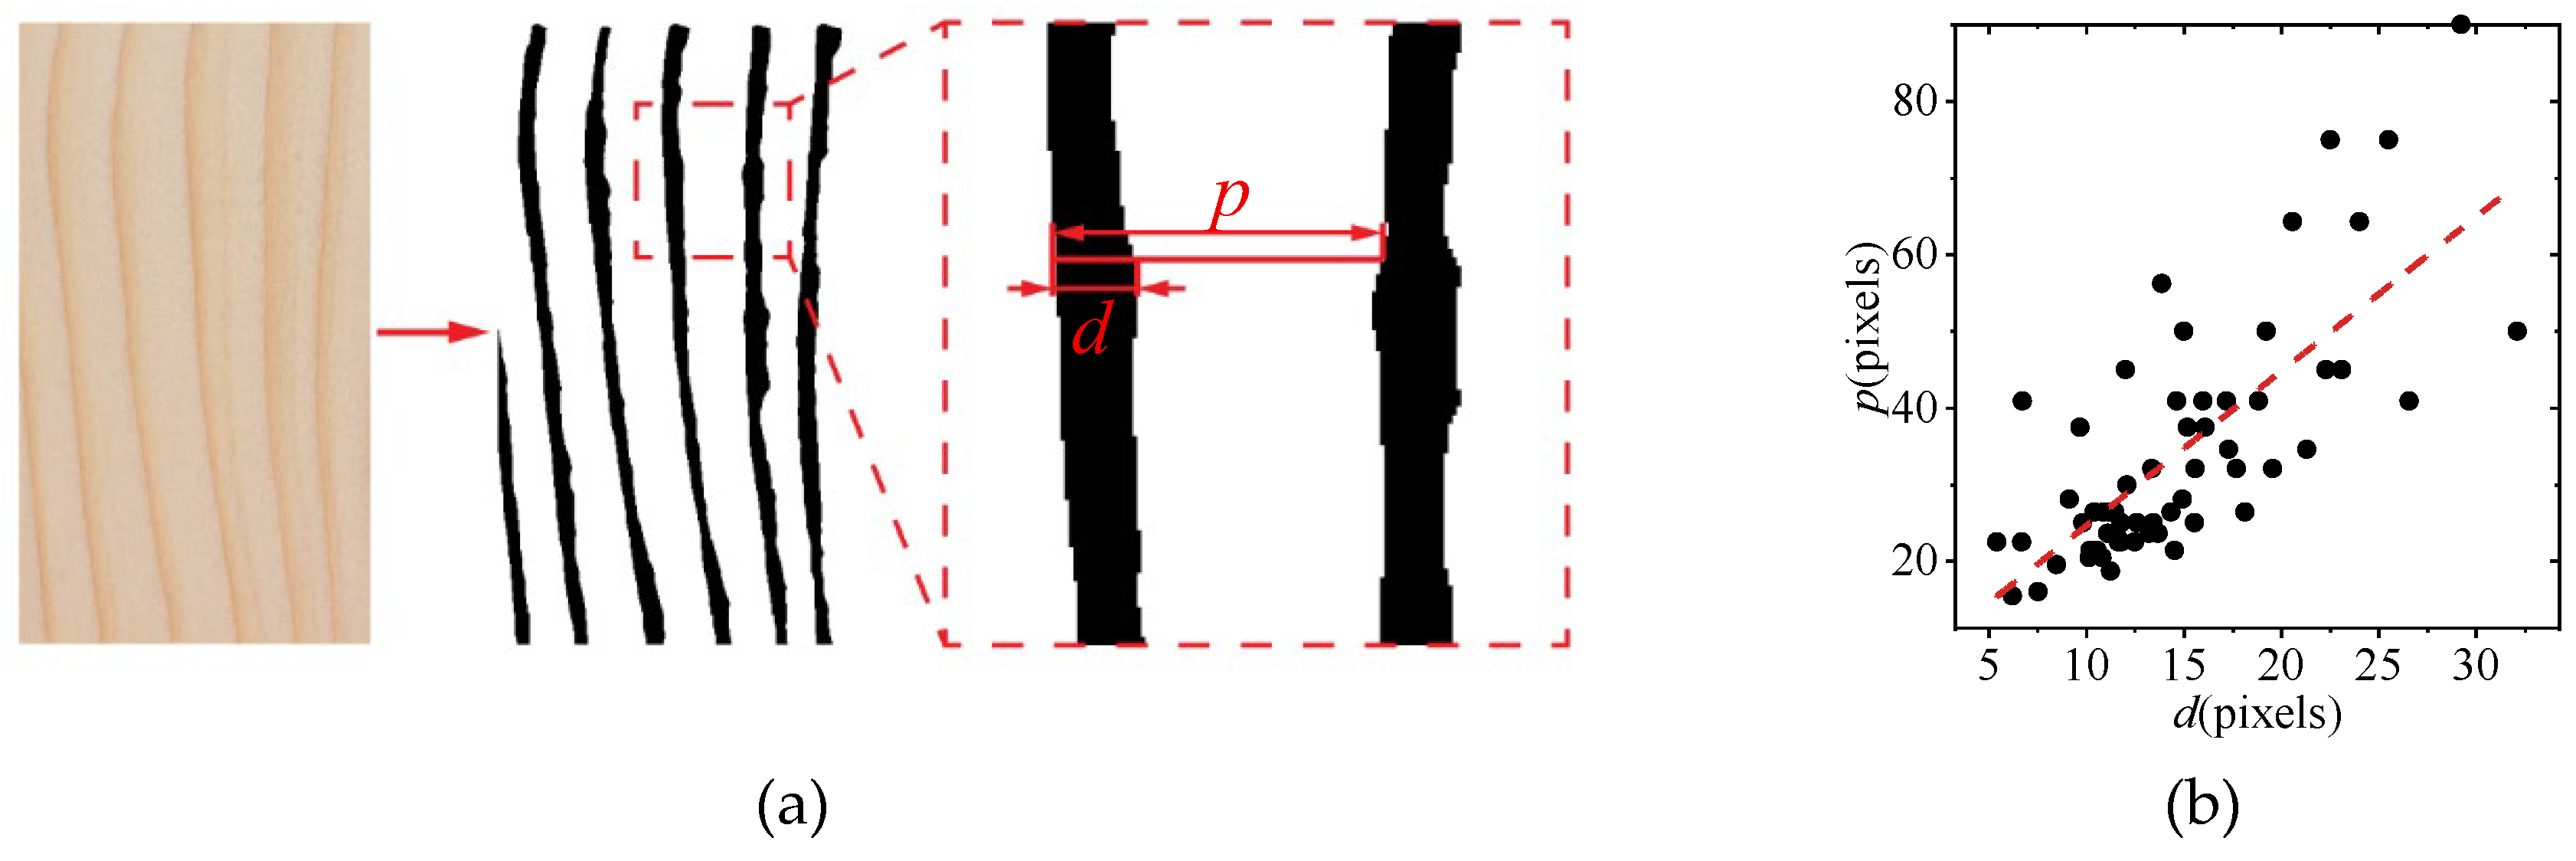
Figure 3.
Valence-arousal affective space.
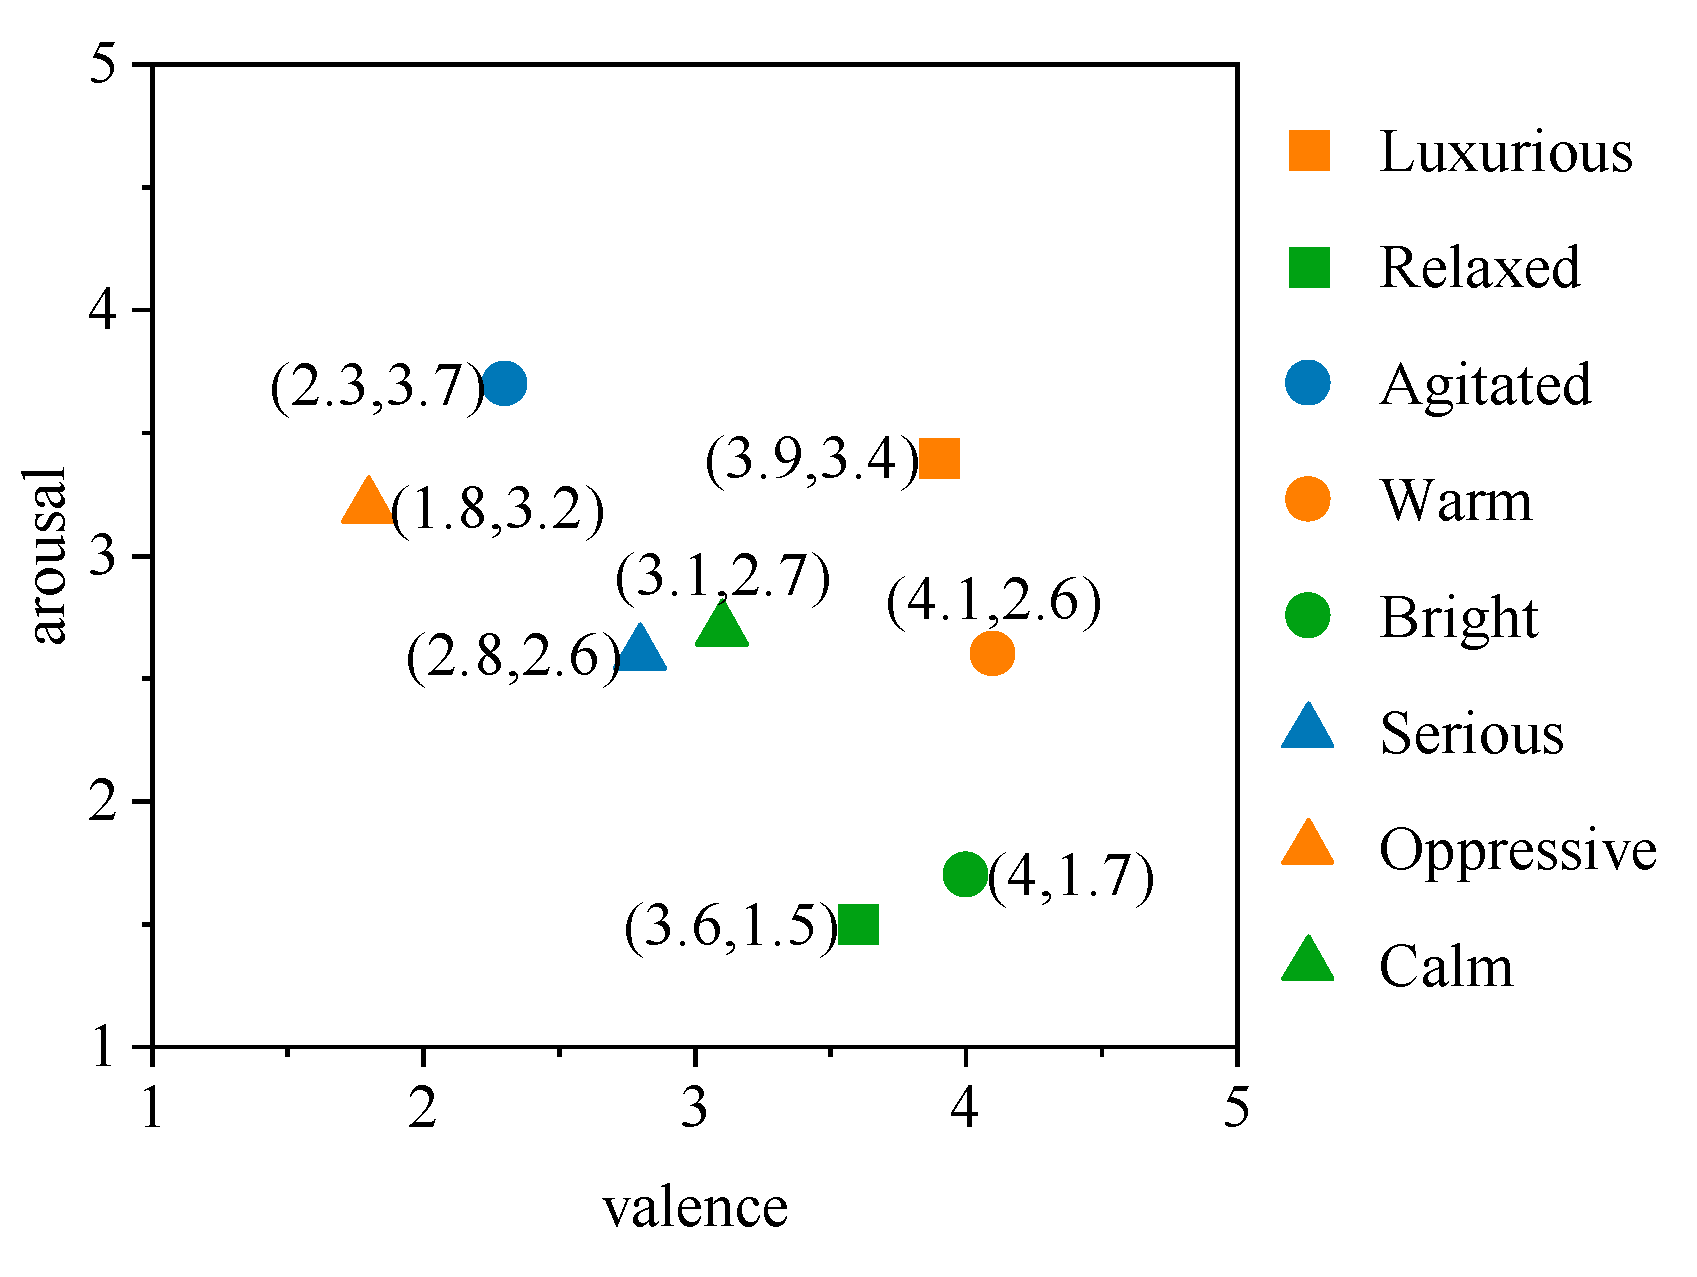
Figure 4.
Samples of the affective response experiment.
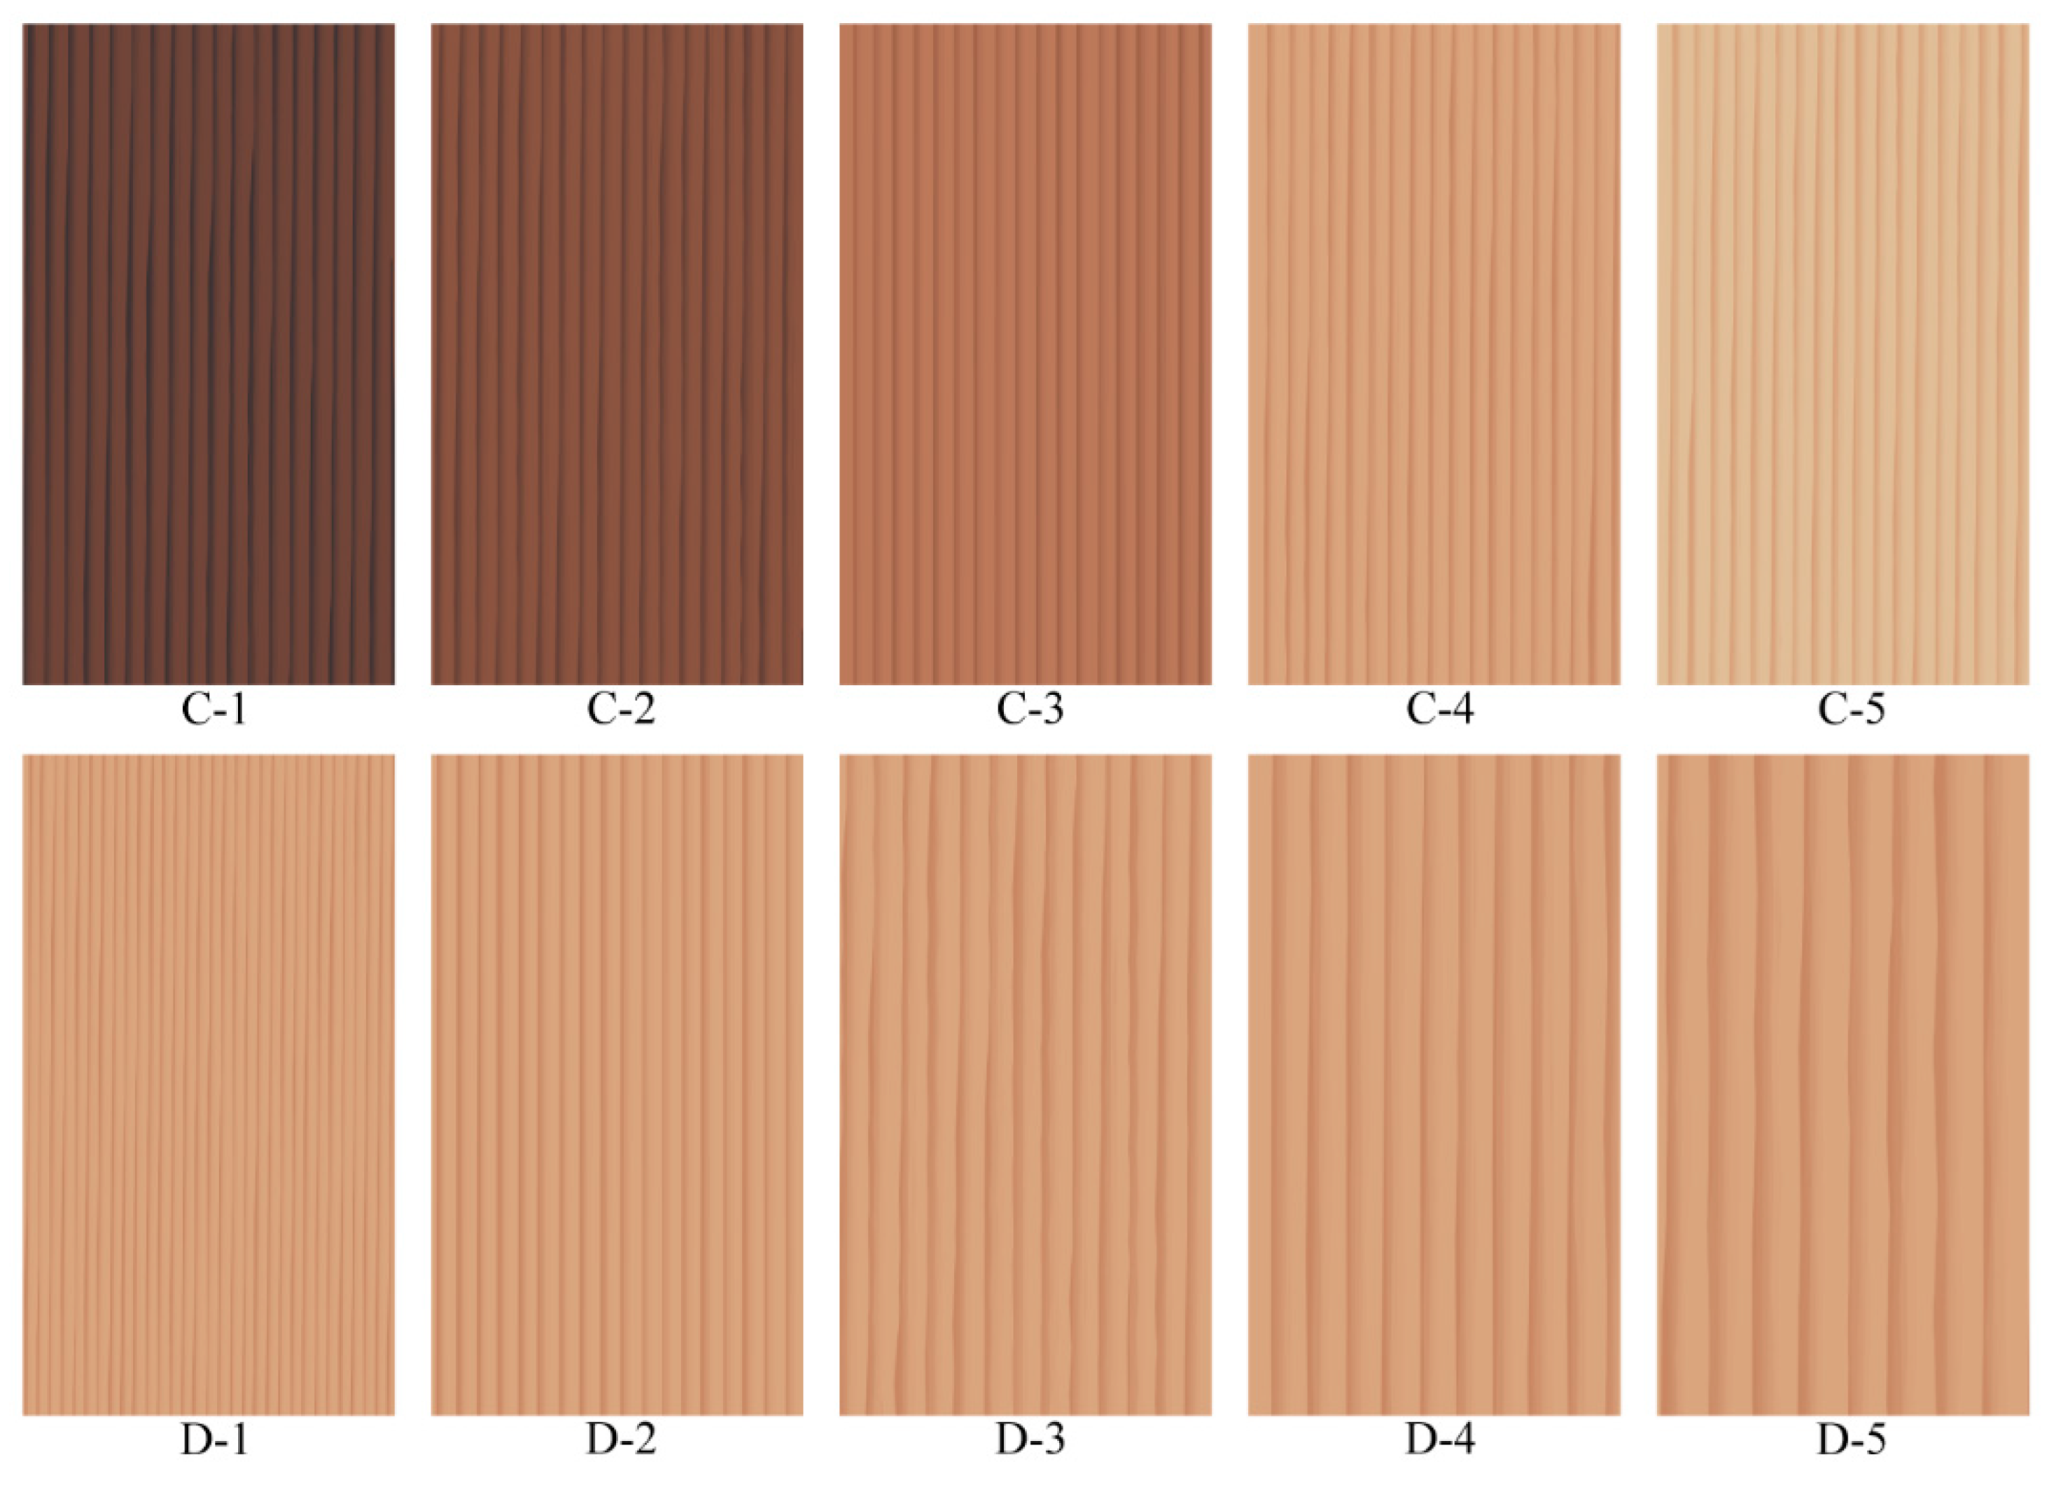
Figure 5.
Affective mean values: (a) Affective mean values of color samples. (b) Affective mean values of density samples.
Figure 5.
Affective mean values: (a) Affective mean values of color samples. (b) Affective mean values of density samples.
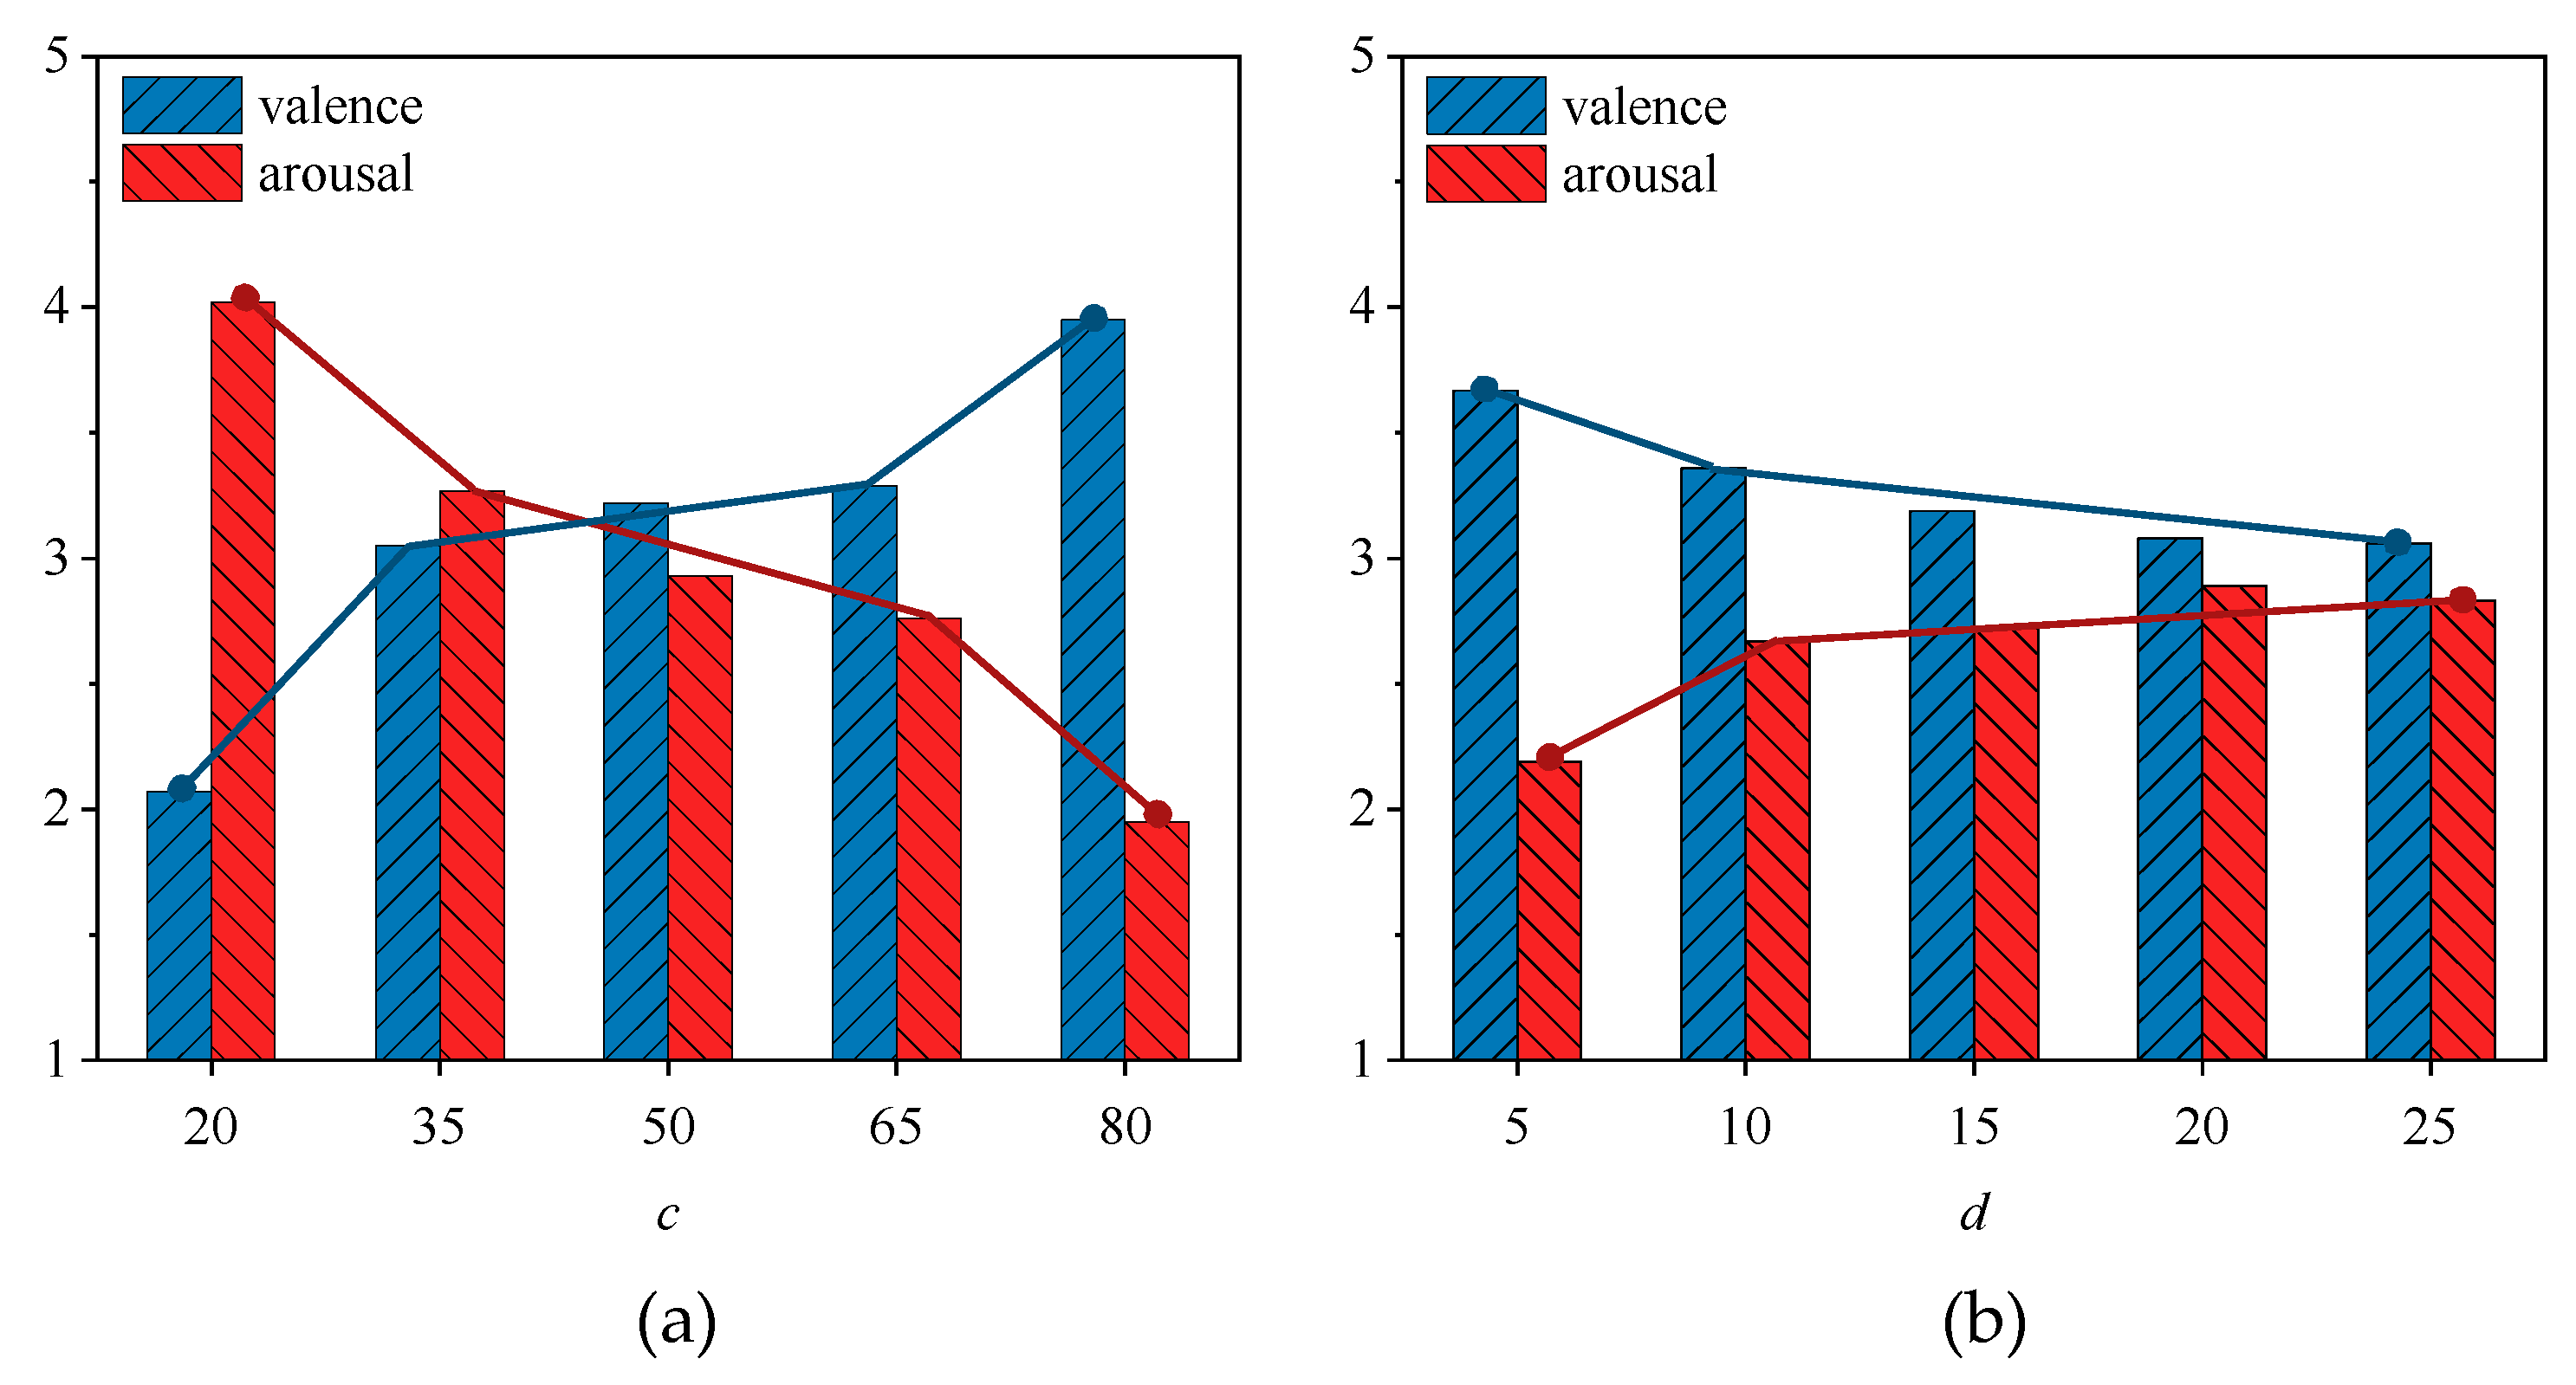
Figure 6.
The relationship between visual characteristics and affect: (a) Relationship between wood color and valence. (b) Relationship between wood color and arousal. (c) Relationship of wood color characteristics and density characteristics with valence. (d) Relationship between grain density and valence. (e) Relationship between grain density and arousal. (f) Relationship of wood color characteristics and density characteristics with arousal.
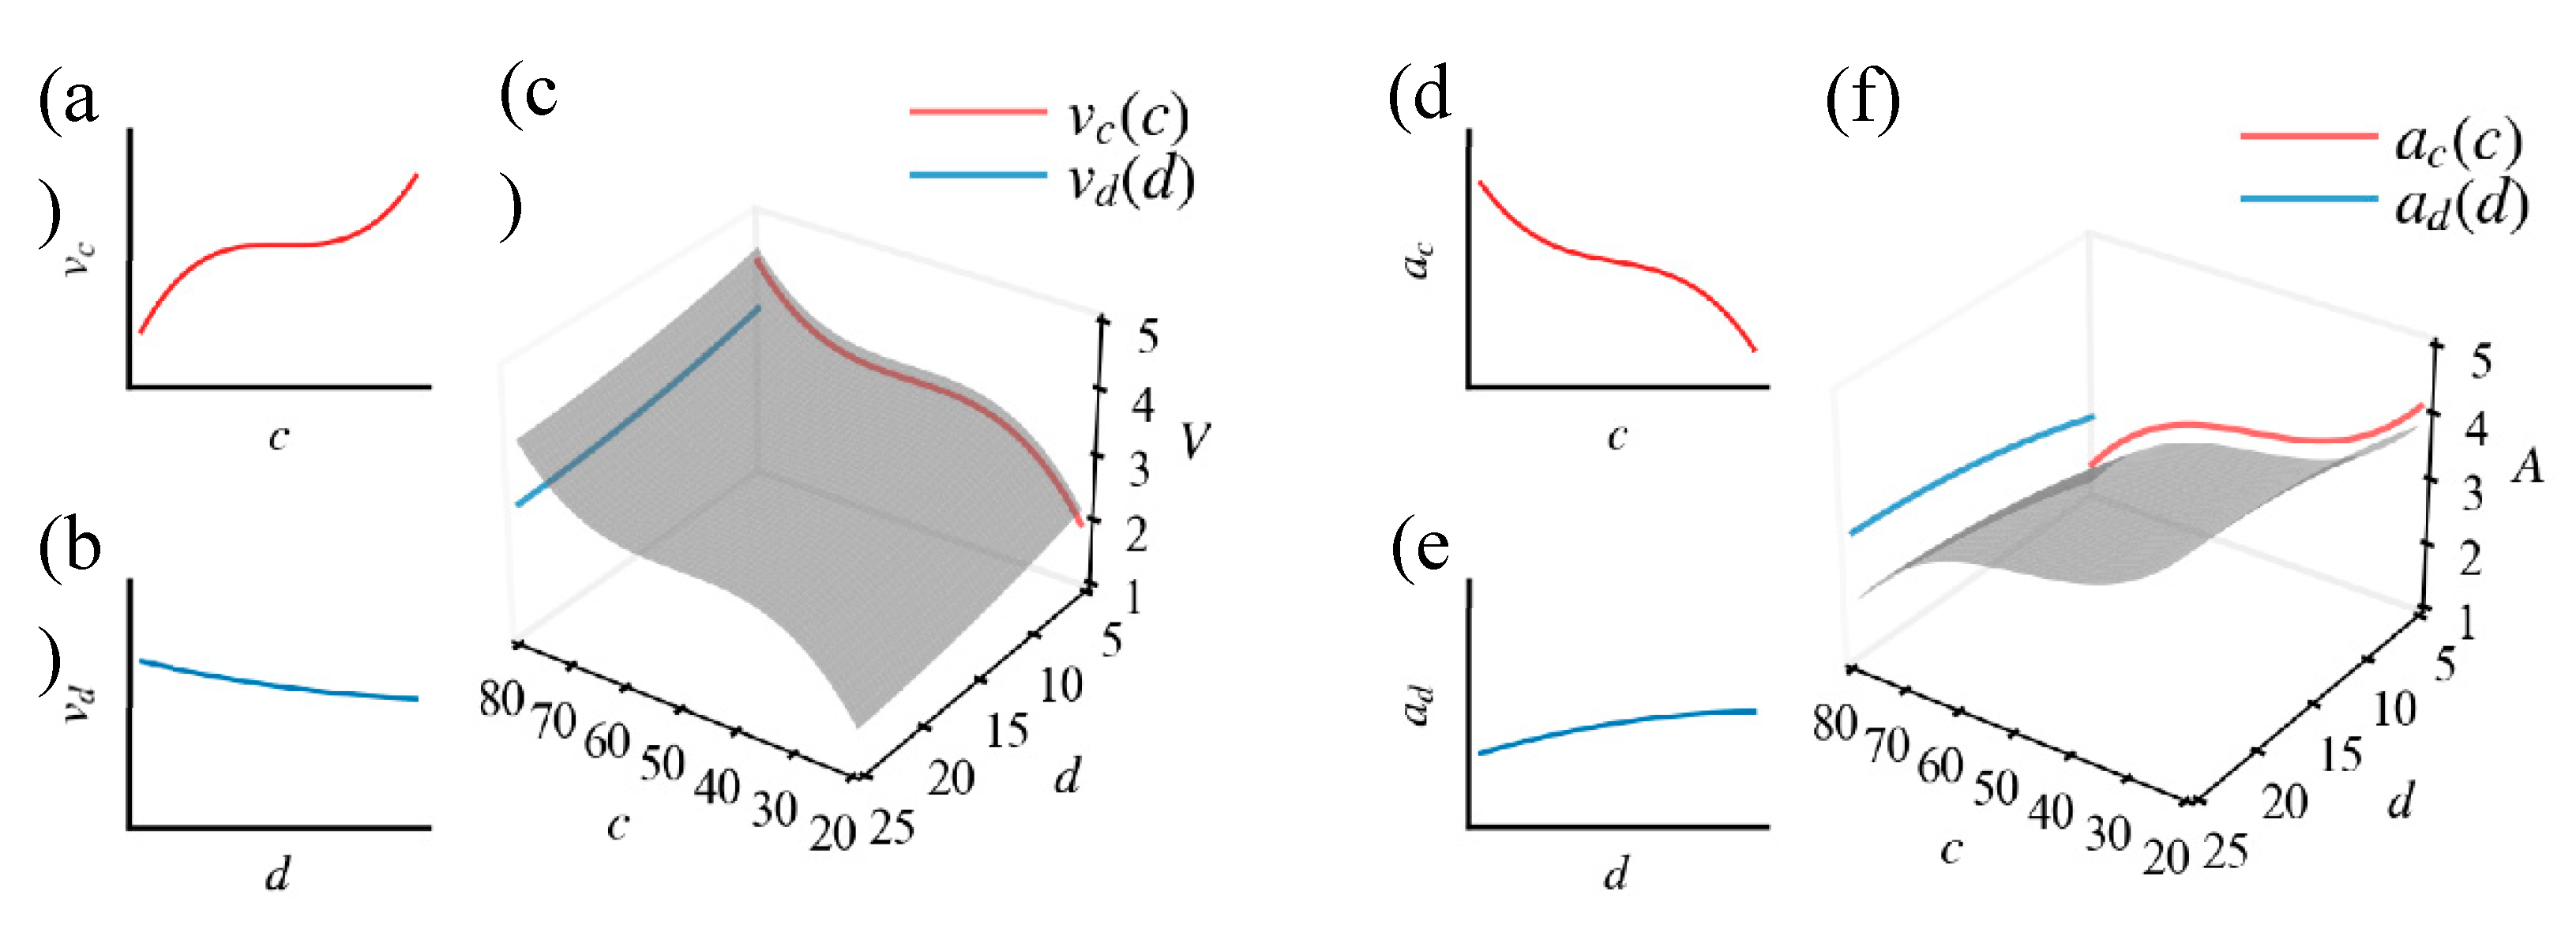
Figure 7.
Samples of eye-tracking and behavioral experiment.
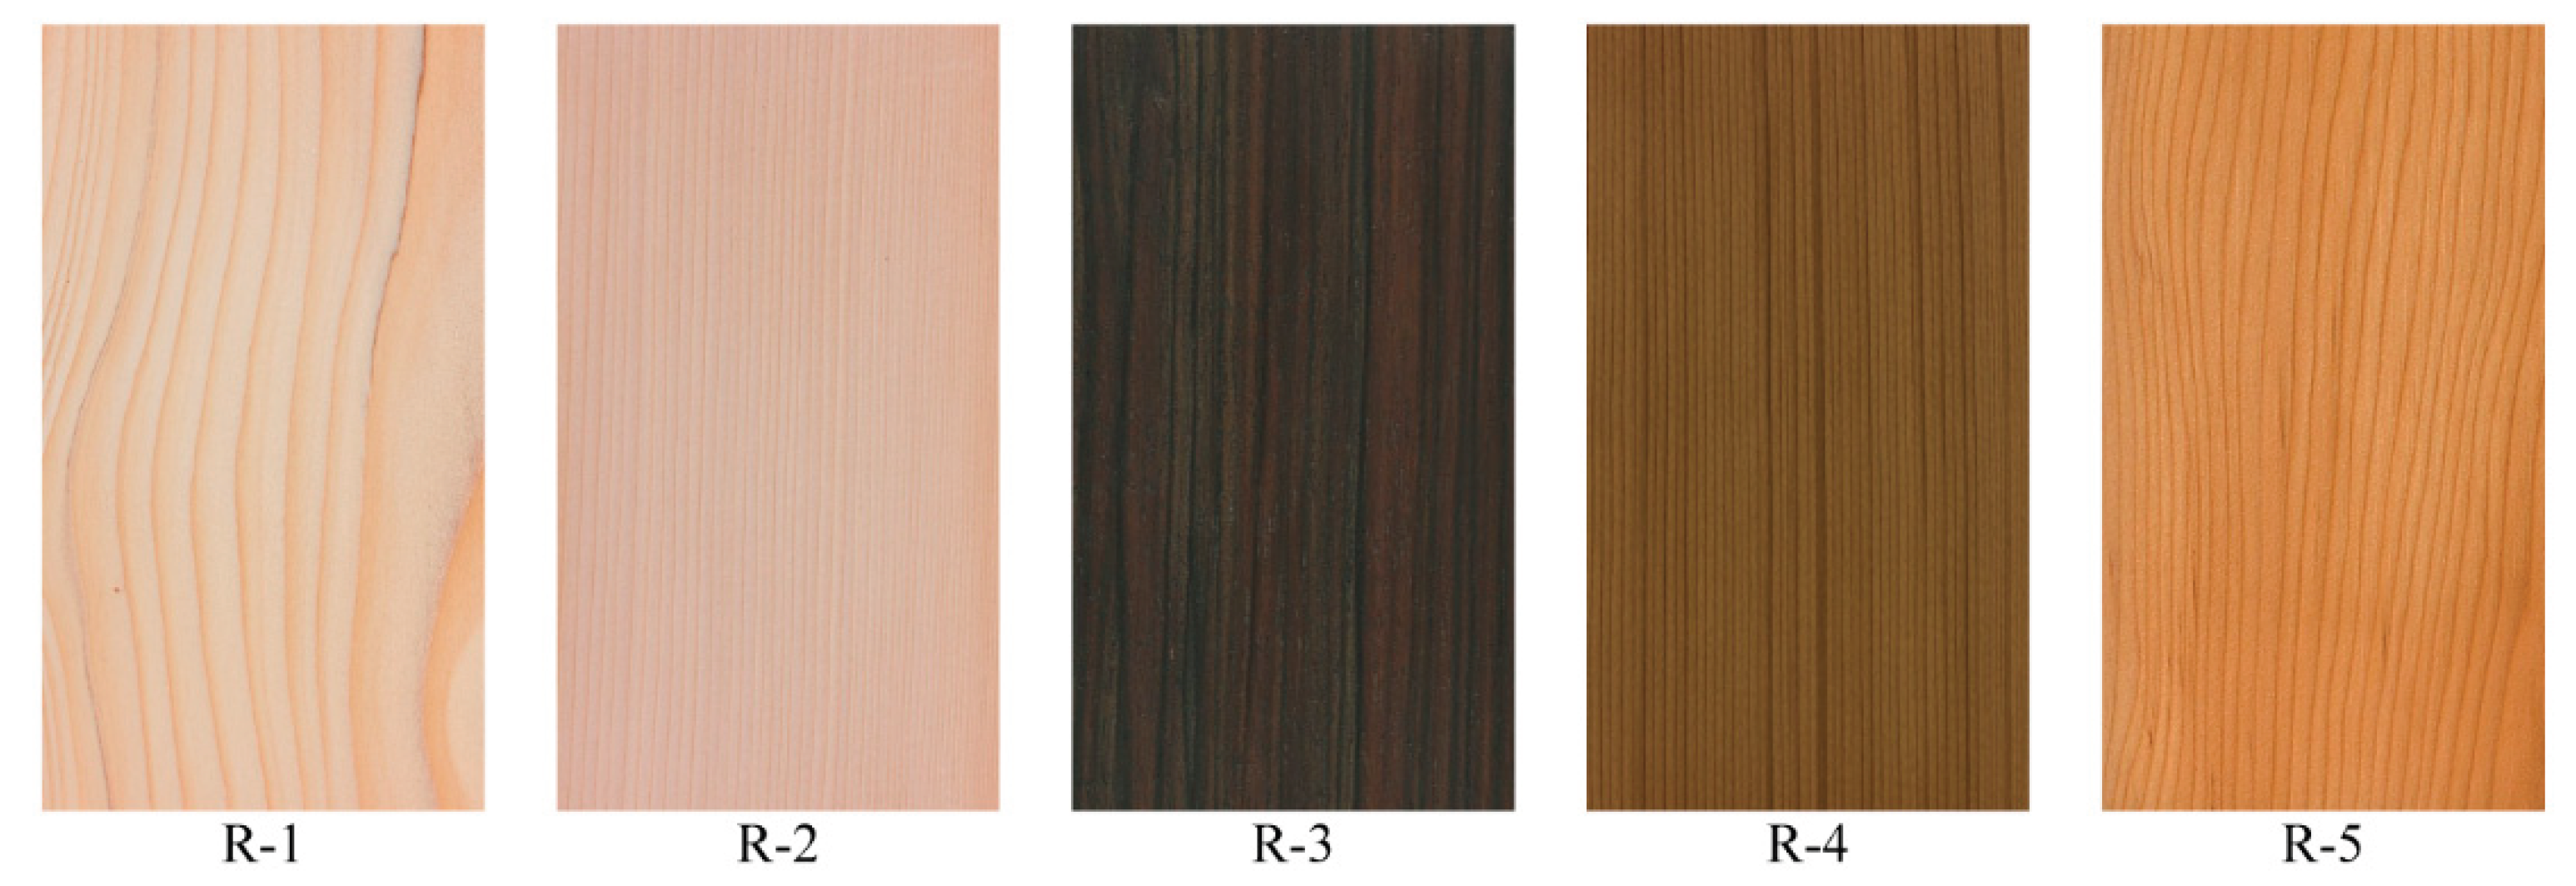
Figure 8.
A single trial of eye-tracking and behavioral experiment.
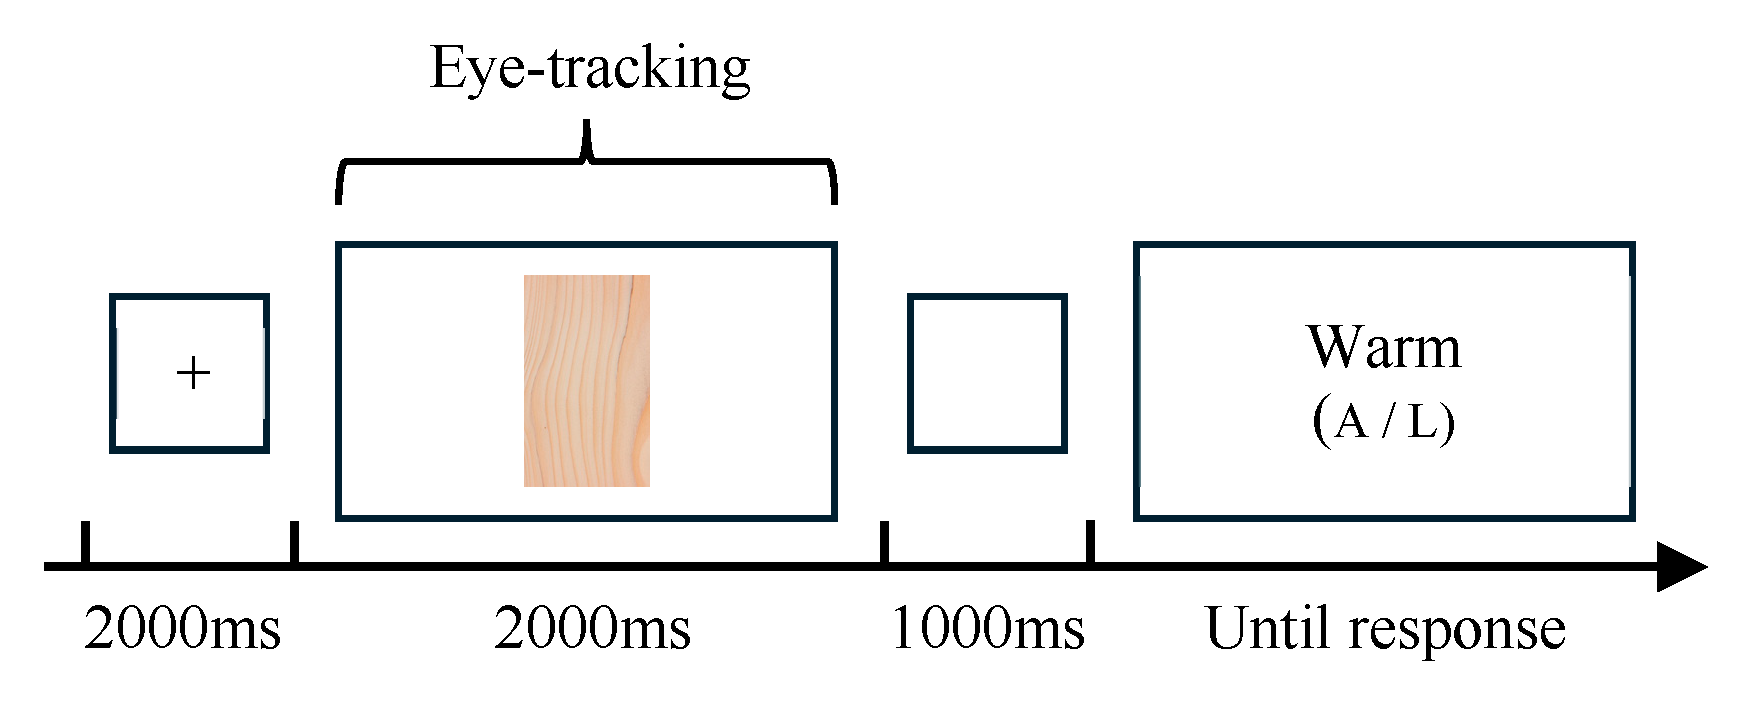
Figure 9.
Correlation parameter (r) and rmatch: (a) r between section samples and target emotions. (b) rmatch between section samples and target emotions in the validation test. (c) Comparison of normalized r and rmatch.
Figure 9.
Correlation parameter (r) and rmatch: (a) r between section samples and target emotions. (b) rmatch between section samples and target emotions in the validation test. (c) Comparison of normalized r and rmatch.
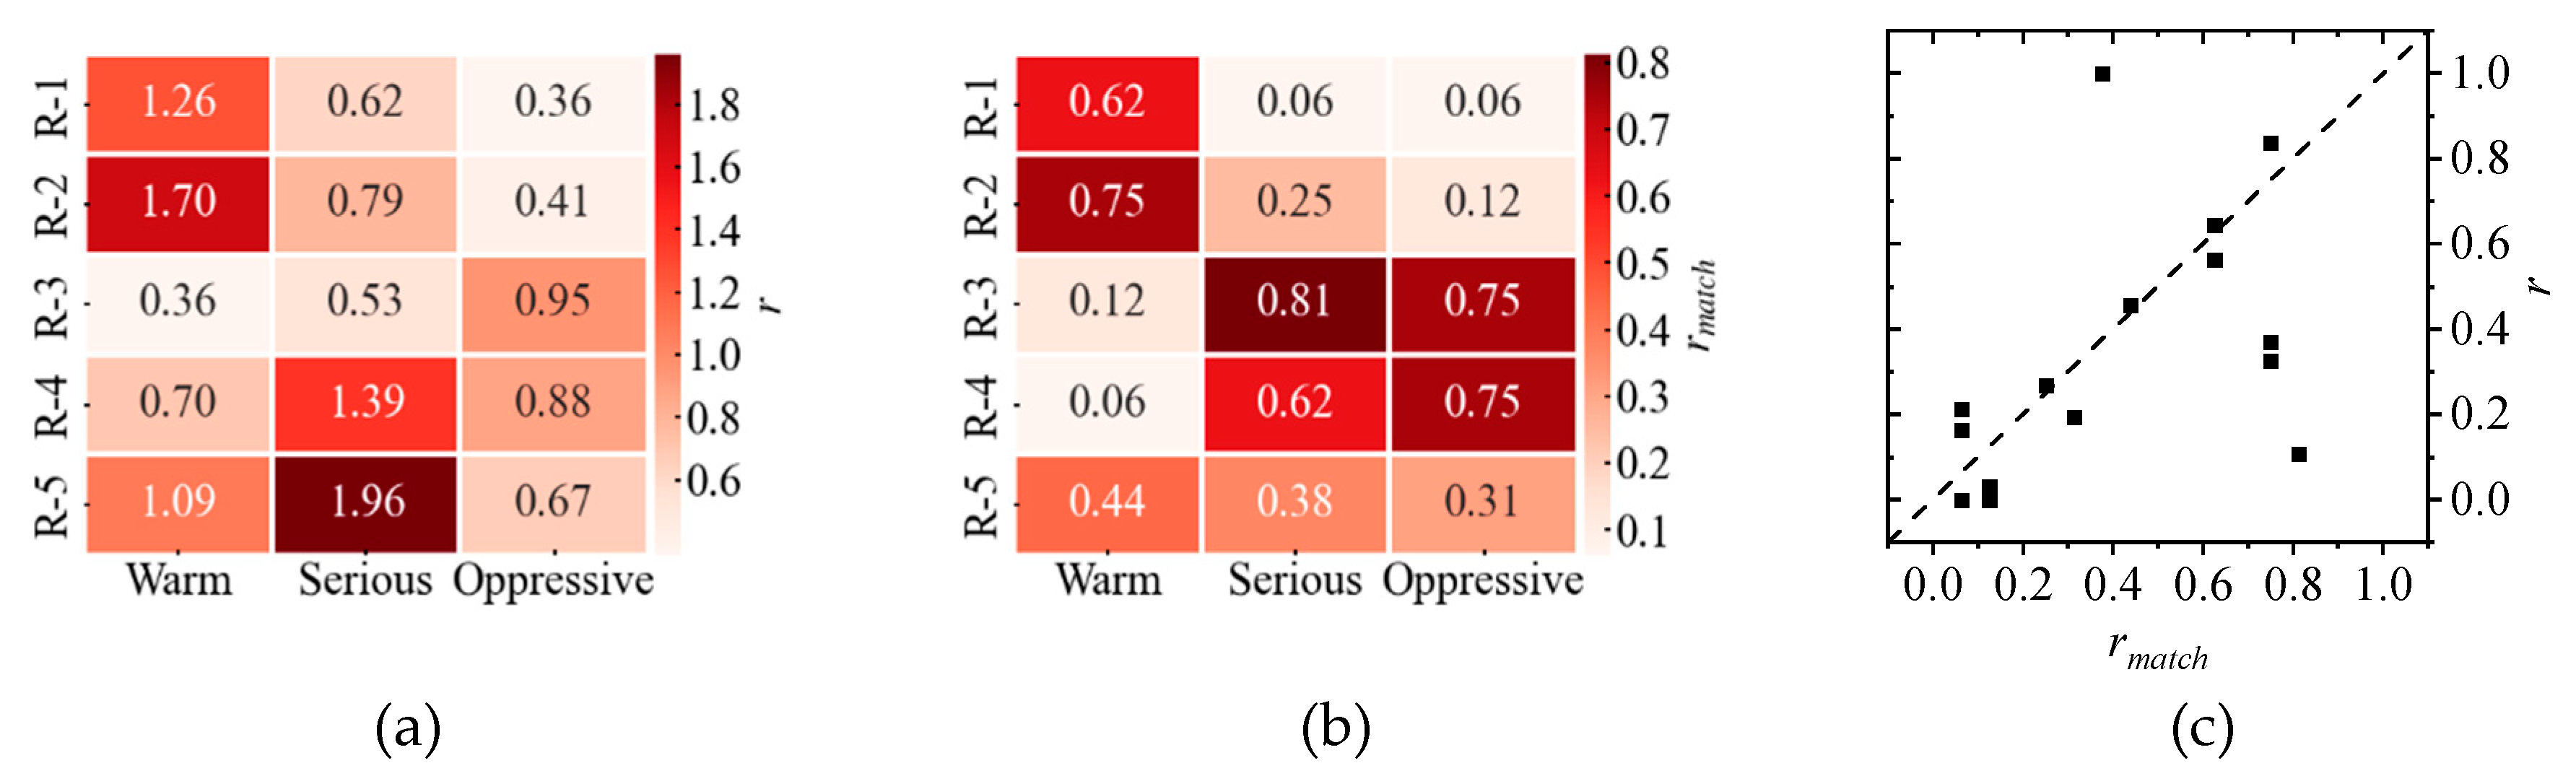
Figure 10.
Correlation between visual characteristics, affective characteristics, and eye-tracking indicators of samples (Note: * p < 0.05).
Figure 10.
Correlation between visual characteristics, affective characteristics, and eye-tracking indicators of samples (Note: * p < 0.05).
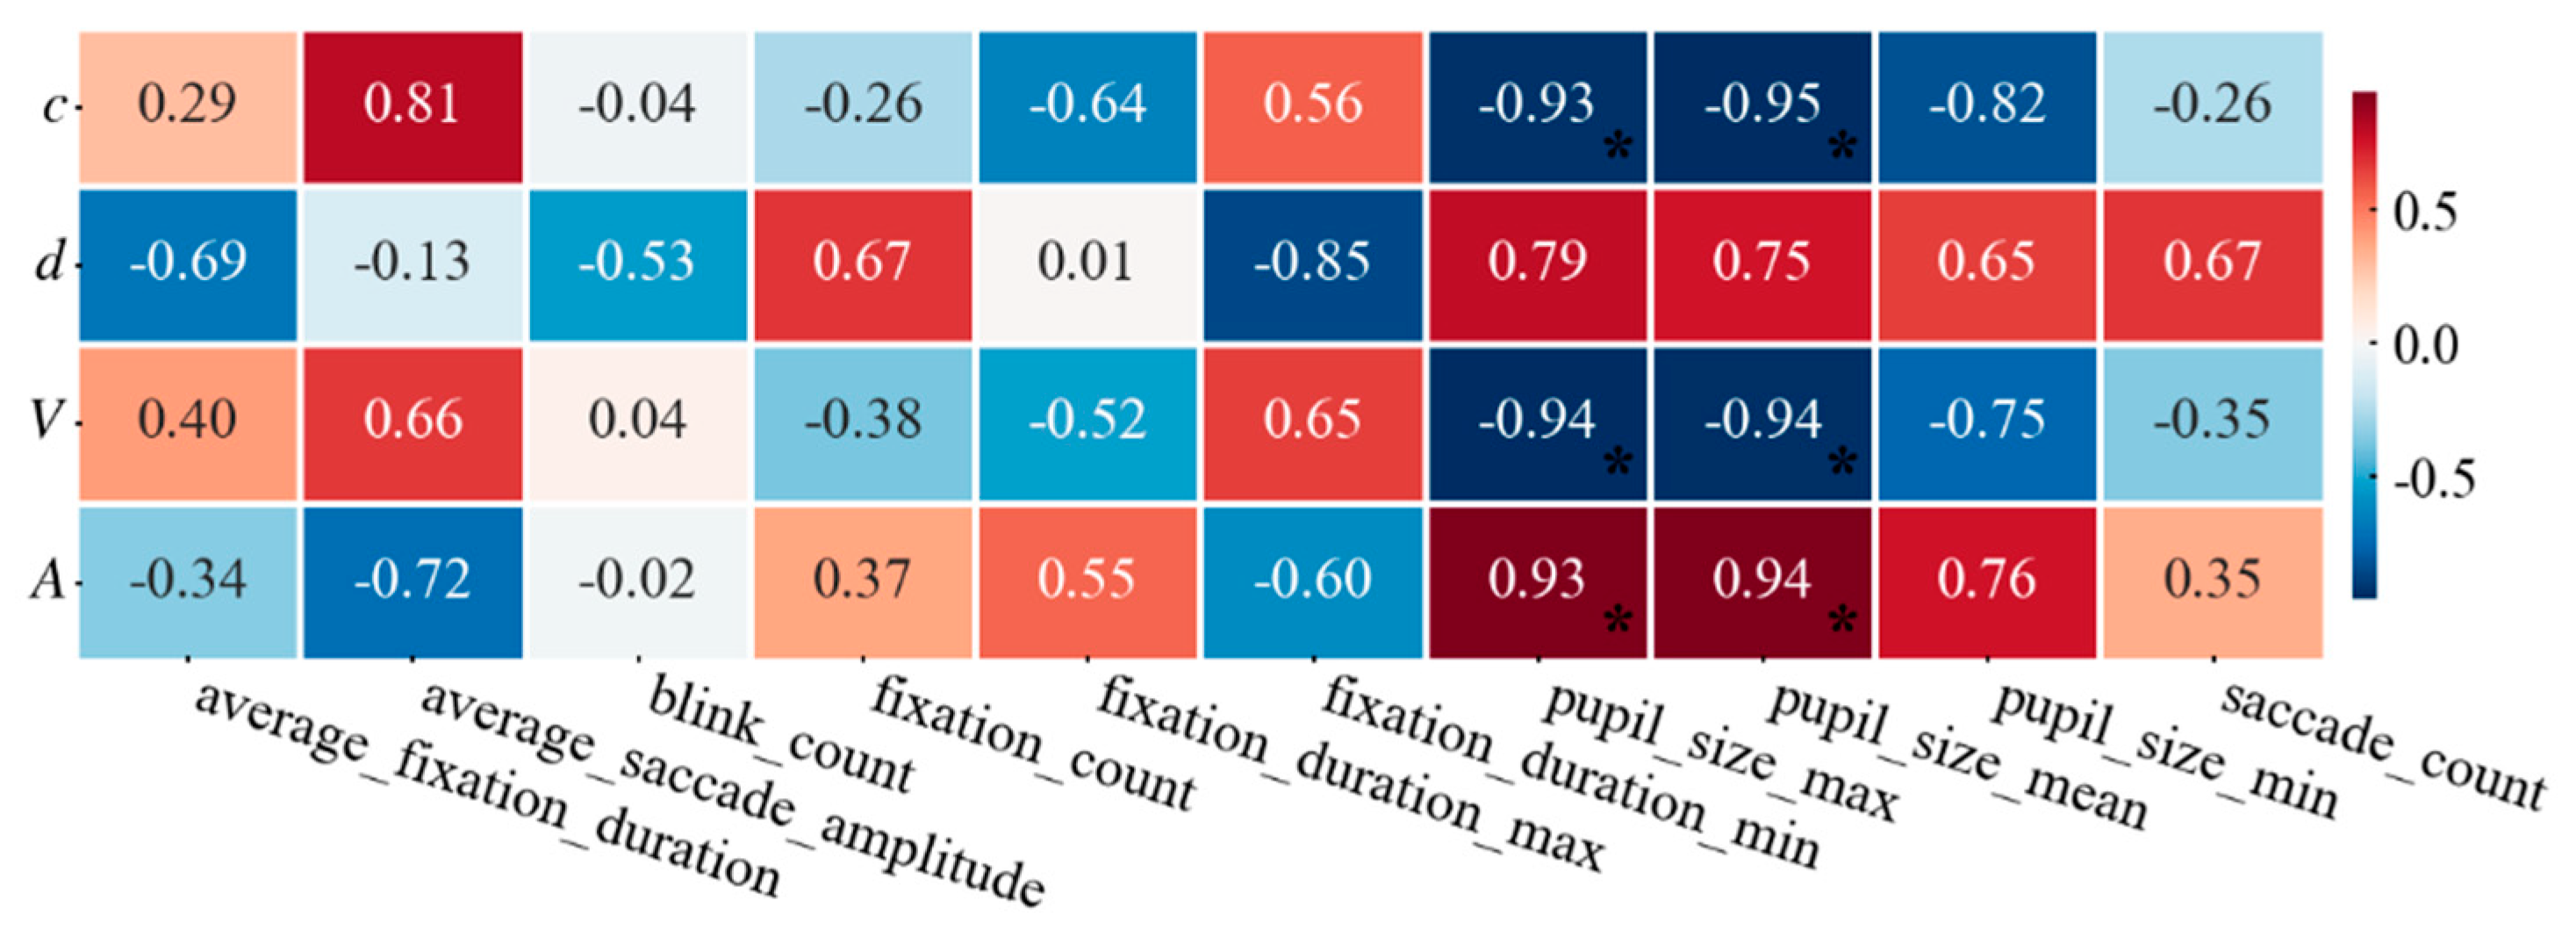

Table 1.
Visual characteristics of samples from the affective response experiment.
| Sample number | c | d | Sample number | c | d |
|---|---|---|---|---|---|
| C-1 | 20 | 10 | D-1 | 65 | 5 |
| C-2 | 35 | 10 | D-2 | 65 | 10 |
| C-3 | 50 | 10 | D-3 | 65 | 15 |
| C-4 | 65 | 10 | D-4 | 65 | 20 |
| C-5 | 80 | 10 | D-5 | 65 | 25 |
Table 2.
Affective response experimental questionnaire.
| Dimension | Question | Options |
|---|---|---|
| Valence | How pleasant do you feel after watching the above image? | [1] [2] [3] [4] [5] |
| Arousal | How relaxed do you feel after watching the above image? |
Table 3.
Visual characteristics, valence, and arousal of samples in the eye-tracking and behavioral experiment.
Table 3.
Visual characteristics, valence, and arousal of samples in the eye-tracking and behavioral experiment.
| Sample number | c | d | V | A |
|---|---|---|---|---|
| R-1 | 78.61 | 11.00 | 4.16 | 1.71 |
| R-2 | 72.53 | 6.28 | 3.87 | 1.96 |
| R-3 | 22.80 | 24.5 | 1.90 | 4.25 |
| R-4 | 29.71 | 8.40 | 3.05 | 3.13 |
| R-5 | 54.92 | 10.70 | 3.25 | 2.84 |
Table 4.
Valence and arousal of affective words in the eye-tracking and behavioral experiment.
| Target affective | v | a |
|---|---|---|
| Warm | 4.1 | 2.5 |
| Serious | 2.8 | 2.6 |
| Oppressive | 1.8 | 3.2 |
Disclaimer/Publisher’s Note: The statements, opinions and data contained in all publications are solely those of the individual author(s) and contributor(s) and not of MDPI and/or the editor(s). MDPI and/or the editor(s) disclaim responsibility for any injury to people or property resulting from any ideas, methods, instructions or products referred to in the content. |
© 2026 by the authors. Licensee MDPI, Basel, Switzerland. This article is an open access article distributed under the terms and conditions of the Creative Commons Attribution (CC BY) license.
Copyright: This open access article is published under a Creative Commons CC BY 4.0 license, which permit the free download, distribution, and reuse, provided that the author and preprint are cited in any reuse.


