
Submitted:
05 February 2026
Posted:
06 February 2026
You are already at the latest version
Preprints on COVID-19 and SARS-CoV-2
Abstract
The rapid spread of COVID-19 has resulted in more than 635 million cases worldwide, highlighting the need for efficient, noninvasive, and cost-effective diagnostic methods. Traditional diagnostic methods such as RT-PCR are effective but often invasive and slow. This systematic review, following Preferred Reporting Items for Systematic reviews and Meta-Analyses PRISMA guidelines evaluates studies using machine learning techniques on physiological data from wearable devices for COVID-19 diagnosis. We included 20 peer-reviewed articles, conference papers, and preprints published between November 2020 and January 2024, focusing on studies using physiological parameters collected through commercial wearable devices and machine learning for COVID-19 diagnosis. An analysis of the variables used and feature extraction is presented, highlighting the time-domain heart rate, and statistically due to Heart Rate Variability HRV. The most frequently used Machine Learning ML algorithms (Random Forest, Support Vector Machine, Logistic Regression, and k-Nearest Neighbor) in this context are also shown, as well as their performance analyzed by variable, algorithm, features used, and study population. The 20 included studies reported Appropriate Use Criteria area under the curve AUC values ranging from 0.770 to 0.994, indicating high diagnostic accuracy. The meta-analysis showed a high level of heterogeneity ( I 2 = 84%) across studies. This review highlights the potential of combining commercially available wearable technology withmachine learning for early and accurate detection of COVID-19, suggesting directions for future research to improve noninvasive diagnostic methods and suggest improvements in the reporting of results.
Keywords:
machine learning
; wearable devices
; COVID-19
1. Introduction
The COVID-19 global pandemic, caused by Sars-Cov-2, started in December of 2019 in Wuhan, and about 635 million cases of infected people were reported until November 2022, as well as more than 6.6 millions of deaths globally [1].
Despite the several variants of this virus respect to the first one of Wuhan, the identification of common sympthoms which characterize the disease has been possible in a great part of population. However, this did not avoid the rapid spread of the virus, because situations such as some symptoms are very similar to normal gripe, and the existence of asymptomatic people have been obstacles for the rapid identification of contagious. Likewise, the Reverse-Transcriptase Polymerase Chain Reaction RT-PCR remains a gold standard in virus detection [2], but the urgent need for less expensive and faster alternative methods to combat this pandemic has been evident [3].
That is why the search for new optimal diagnostic methods has increased, using models to predict the risk of developing COVID-19 or being admitted to hospital with covid-19, models to predict the presence of COVID-19 in patients with suspicion of infection, and models to predict the prognosis or evolution of the infection in patients with COVID-19 [4], also evidencing the prominence of the digital world, technological devices and artificial intelligence [5].
The fact that the use of technology has contributed to the continuity of daily activities is undeniable, and mainly to the contribution of new diagnostic methods with technological tools, which, unlike the methods that were already available such as PCR, blood tests, have sought to be non-invasive. Artificial intelligence has been a tool, whose exploration of its uses includes crowd policing, medical diagnosis, detection, drug reuse, between others, accelerating methods to combat COVID-19 [6]. That is why a lot of studies have been published on the prediction and diagnosis of COVID-19 using machine learning and deep learning techniques [7,8,9,10]. However, most of those studies are based on data from specific laboratory tests, blood test, Chest X-Ray and Computed Tomography. But, on the other hand, there is a fewer studies that have been based solely on implementing machine learning algorithms considering vital signs and physiological data such as temperature, heart rate, respiratory rate and blood pressure, data that is not necessarily measured with medical devices and can even be collected by smart devices such as wearables or portable devices in the home. These technological devices have also made it possible to collect information on the symptoms of patients with COVID-19 without the need to go to a medical center.
Recognizing portable devices as a good source of information related to an individual due to the sensors they possess, which, unlike other data extraction sources, these can be obtained continuously [11], the usefulness of these devices is remarkable in situations like the COVID-19 pandemic where social distancing and non-invasive diagnosis are paramount.
Although there are studies that have reviewed the feasibility of wearable devices to detect SARS-CoV-2 infection through monitoring physiological variables, there is still no complete description of the evidence on the use of machine learning algorithms and its relationship with these variables in this context. Therefore, in this systematic review, our objective is to evaluate the use and efficiency of these algorithms in research that used data collected by sensors of portable devices for the diagnosis and monitoring of COVID-19. Additionally, the specifications of the variables monitored by these smart devices will be examined, as well as the challenges and opportunities that this technology presents.
2. Method
This article was carried out following the PRISMA (Preferred Reporting Items for Systematic reviews and Meta-Analyses) statement [12] to perform a systematic review and meta-analysis of the available literature on the use of machine learning for the diagnosis and monitoring of COVID-19 using wearable devices. By conducting this process, we aimed to identify and critically evaluate the most effective machine learning algorithms used in this context, as well as to assess the overall quality and reliability of the existing literature. This comprehensive approach is intended to offer a clear overview of the current state of research and to pinpoint gaps that warrant further investigation in the future.
2.1. Elegibility Criteria
Publications that used machine learning algorithms for the prediction, diagnosis and monitoring of COVID-19 cases were considered, focusing on those that used physiological variables or data collected through wearable or smart devices. To ensure the robustness and credibility of the data, only peer-reviewed articles, conference papers, and preprints were considered for inclusion.
2.2. Information Sources and Search Strategy
To identify relevant studies for this systematic review, a comprehensive search was conducted between November 2020 and January 2024 using multiple academic databases, including Scopus, PubMed, Web of Science, and Google Scholar. These databases were selected based on their broad coverage of the biomedical literature, as well as their indexing of peer-reviewed journals, conference proceedings, and preprints.
In addition to the database searches, a manual review of the reference lists of included studies and relevant reviews was carried out to identify additional studies that may have been missed in the initial search. This procedure was adopted to ensure that all relevant studies were captured and to minimize the risk of selection bias.
The search strategy employed a variety of terms and keywords, such as ’machine learning’, ’wearable devices’,’COVID-19’, ’detection’, ’diagnosis’, and ’physiological data’. All these terms were combined using Boolean operators ’and/or’ to ensure a comprehensive and targeted search that captured all relevant studies.
2.3. Selection Process
For the selection process, a rigorous methodology was followed that included several stages. Initially, all academic publications such as articles, conference papers or preprints written in English on the use of Machine Learning algorithms for the diagnosis of COVID-19 were considered. To do this, the articles were selected based on their relevance, determined by the title and abstract. After that, specifically only articles that presented results on the performance of a machine learning model applied to the diagnosis or prediction of COVID-19 were included.
Following this initial selection, a more detailed evaluation of the studies was conducted. Only studies with full access to their complete content were considered, in order to allow for a thorough examination of their methods and results. Specifically, publications were included if their databases contained physiological variables of patients measured or collected using non-invasive portable or smart devices; however, the exclusive use of this type of data was not a mandatory inclusion criterion.
All articles whose main focus was image analysis were excluded. It should be noted that the retrospective nature of the studies was not an exclusion factor, which allowed a wide range of research to be included.
In addition to these criteria, a review of the bibliography of the selected studies was carried out to identify any additional relevant studies. The aim of this rigourous selection process was to ensure that only high-quality, relevant studies were included in the analysis (Figure 1).
2.4. Data Collection
The process of data extraction began by first collecting general information about each article. This included details such as the year of publication, population characteristics, and the type of wearable devices used, such as Fitbit, Apple Watch, Garmin, Oura Ring, Empatica E4, among others, which offered a variety of physiological and activity-related data, including heart rate (HR), respiratory rate (ReR), sleep patterns, step count, oxygen saturation (SpO2), and skin temperature (skin temp).
The extracted variables were mostly grouped into temporal domains (TD), frequency domains (FD), and statistical domains (SD). Time domain features included RMSSD (root mean square of successive differences), SDNN (standard deviation of all normal-to-normal RR intervals), BPM (beats per minute), Meanrr (mean between two RR intervals), Mxdmnn (difference between maximum and minimum RR intervals), pNN50 (percentage of differences exceeding 50 ms), HRnorm (normalized heart rate values), HRcsum (sum of cumulative heart rate), Auto-corr (automatic signal correlation), Centroid (centroid of signal over time), MADiff (average of absolute differences), Mean Diff (average of differences), MAD (median of absolute differences), Shan Ent (Shannon entropy based on RR intervals), Ap Ent (approximate entropy), Slope (slope of changes in signal), and Daily RHR (daily average resting heart rate).
Subsequently, for each article, the focus was on identifying the machine learning algorithms that were employed and their associated performance measures. In instances where an article employed multiple algorithms, we extracted data only from the one with the highest AUC value as it was considered the best performing algorithm.
Likewise, when an article presented results for different types of windows or different numbers of features, we extracted data from the one with the highest AUC value. Therefore, the next step was to extract the evaluation metrics of the best performing algorithm. This stage was necessary to ensure that we obtained an extensive overview of the performance of the machine learning algorithms under consideration. The metrics extracted included AUC, accuracy, precision, F1-score, sensitivity (or recall) and specificity. It is important to mention that, since some articles did not include all the considered metrics, it was possible to complete them for those that presented a confusion matrix; otherwise, it was not possible.
2.5. Statistical Analysis
In our meta-analysis, we grouped studies whose prediction models included AUC (area under the curve) metrics. Since several articles did not report the standard errors SE corresponding to their AUC, we chose to assign the average of the explicitly reported standard errors. This choice was intended to ensure the consistency of the analysis, maintaining comparability across studies and avoiding potential biases that could arise from alternative estimates, such as the use of the standard deviation of AUC values, which, being more distinct from each other, might not accurately reflect the uncertainty of individual estimates. We then generated a forest plot showing the AUC estimates along with 95% confidence intervals. This type of graph allows us to visualize the variability between studies. Finally, we evaluated heterogeneity between studies using Higgins’ test [13], where indicates low heterogeneity, moderate heterogeneity and substantial heterogeneity. All statistical analysis was developed in the R statistical program using the meta package.
2.6. Study Risk of Bias Assessment
To assess the quality of the studies included in this systematic review, the Risk of Bias Assessment Tool for Prediction Model Studies (PROBAST) [14] was used. PROBAST assesses both the risk of bias and concerns about the applicability of studies that aim to develop, validate, or update multivariate diagnostic or predictive models. This tool is structured in four domains: participant selection, predictors, results and analysis, each with signaling questions that guide the evaluation.
The participant selection domain evaluates how individuals were selected for the study and whether there is any selection bias that could affect the results. The predictors domain analyzes the variables used in the prediction models, ensuring that they are appropriate and relevant to the context of the study. The outcomes domain examines how outcomes were measured and evaluated, ensuring that measures are accurate and valid. Finally, the analysis domain evaluates the statistical and analytical methods used to develop and validate the models, ensuring that they are appropriate and robust.
3. Results
The results are presented into three main areas: initially a descriptive analysis of the data is provided, followed by a ML algorithm analysis, statistical analysis of the meta-analysis, and finally, the evaluation of risk of bias is addressed.
3.1. Descriptive Analysis
This review selected a total of 20 articles published between 2020 and 2023. Figure 2 shows the distribution of published documents by year, allowing us to visualize the evolution of the topic addressed and identify patterns in academic production. It is observed that in 2020, 3 articles were published, indicating a moderate start in scientific production on the topic. In 2021, the number of publications increased to 6, reflecting a growth in research, reaching the highest number of publications in 2022, with a total of 7 articles, being the year of greatest boom in scientific production within the analyzed period. Finally, in 2023, the number of published documents decreased again to 4, which could be related to a possible consolidation of knowledge in the area or a change in research trends.
Similarly, Figure 3 displays the most frequently used words in the abstracts of the articles.
Through our analysis of the selected articles, we were able to identify two main general approaches to the application of machine learning models in the context of COVID-19 diagnosis or prediction:
As presented in the Table 1, in total, 18 publications were identified that follow the first approach. Evidently covering the largest number of articles in this review, it suggests that this is a very active research approach that reflects the impact of the topic.
In comparison, only 2 publications were found focused on the diagnosis of the evolution of COVID-19. This large difference reveals that research attention and efforts in this area have focused primarily on case classification and early identification of the presence of the virus.
To address these issues, the studies analyzed have implemented various machine learning techniques, selected mostly based on their results, to optimize COVID-19 case classification and prediction. The Table 2 presents a summary of the most commonly used algorithms, allowing us to identify the predominant methodologies in the diagnosis and prediction of COVID-19.
In general, it can be seen that there are 4 algorithms widely used in the context analyzed. These algorithms are Random Forest, Support Vector Machine, Logistic Regression and k-nearest neighbor. All of them are precisely recognized in the field of data science and machine learning for their effectiveness and versatility in solving classification and prediction problems due to their effectiveness and ability to address a variety of classification and prediction problems.
In addition to these four main algorithms, other methods such as Artificial Neural Networks (ANN/DNN), Gradient Boosting and Long short-term memory LSTM were also frequently used. ANN/DNN, present in five studies, are capable of capturing complex patterns in data and are used for more advanced classification and prediction problems. Gradient Boosting, used in four studies, and its variant Extreme Gradient Boosting (XGBoost), in three studies, are powerful methods to improve prediction accuracy by combining multiple weak models.
Additionally, the Table 2 reveals that several articles made use of different algorithms, in order to select the model that best suits the needs of the study and has good performance.
Using the most relevant information obtained from the data collection, a comprehensive table was created to summarize the results of the extraction process. The Table 3 shows a summary description of devices utilized, population analyzed, the variables considered, and the feature extraction methods.
The studies analyzed have used a variety of physiological signals, such as heart rate, oxygen saturation (SpO2), heart rate variability (HRV), sleep patterns, and physical activity levels, captured through wearable devices and biomedical sensors. The effectiveness of the models depends not only on the algorithms used, but also on the quality and relevance of these signals in identifying patterns associated with COVID-19 infection. Table 4 summarizes the main findings in terms of the performance of the machine learning models applied to COVID-19 detection and prediction. In addition to presenting key metrics such as AUC, accuracy, sensitivity, and specificity, this table visualizes the relationship between these metrics and the physiological signals and features extracted from the data used in each study. The table also identifies which combinations of features and models have demonstrated the best performance, providing a comparative overview of different machine learning strategies.
3.2. Analysis of Biometric Feature Extraction
Since biometric features extracted from wearable devices not only provide fundamental information about physiological changes related to COVID-19, key aspects of feature extraction in temporal, statistical and spectral domains were extracted, focusing on their application to variables such as heart rate, respiratory rate, steps and sleep, and oxygen saturation.
Heart Rate
Heart rate is one of the most commonly monitored variables in studies using wearable devices for COVID-19 diagnosis and monitoring. Feature extraction domains applied to heart rate include:
Time Domain: It is crucial for heart rate analysis as allows to assess how heart rate varies over time. Features extracted in this domain include autocorrelation, centroid, mean absolute differences, median differences, and median absolute differences, all of them used in [17]. Other more common measures such as standard deviation of normal-to-normal intervals (SDNN) ([27,28]) are calculated from inter-beat intervals and according to these studies, they are only available during periods of sleep. Root mean square of successive differences (RMSSD) in heartbeat intervals ([22,27,28,32]) are also employed in several included studies to estimate vagally mediated changes, [32] estimated it from non-REM sleep only. These measures are essential for identifying anomalous patterns in heart rate variability that may be associated with COVID-19 infection. To a lesser extent there are other features extracted in the time domain, used by [27], such as the mean between two RR intervals, Meanrr. Mxdmnn, the difference between the maximum and minimum RR intervals, and the mean number of times the changes in the normal-to-normal intervals exceed 50 ms, known as pNN50. It is important to note that the study of Nataranjal et al. [32] utilized a non-linear time domain measurement, the Shannon Entropy, where is calculated using the histogram of RR intervals throughout the night. This entropy is also used by Skibinska & Burget [26], whose study also includes Approximate Entropy.
Statistical Domain: It is used to gain deeper insight into the distribution and dispersion of heart rate data. Features extracted in this domain include the most utilized measures such as mean, standard deviation, maximum, minimum, range, variance [26], Studies made by Sarwar et al. [16] and Hirten et al. [24] also calculated these features using Rest Heart Rate (RHR). On the other hand, Skibinska et al. [17] considered the use of histogram, interquartile range, median absolute deviation, root mean square, and variance as important features. Statistical measures allow for identifying subtle changes in heart rate variability that might not be apparent in the temporal domain.
Spectral Domain, including the use of the Fast Fourier Transform (FFT) [17], allows the heart rate signal to be decomposed into its frequency components. Measures obtained from this domain by [17], such as wavelet absolute mean, wavelet standard deviation, and wavelet variance, are useful for identifying periodic and non-periodic patterns in heart rate. Hijazi et al. [27] highlight the use of other frequency-domain features, their study used the high frequency of the heart rate that represents the activity in the 0.15 - 0.40 Hz range, and the low frequency of the heart rate that represents the activity in the 0.04 - 0.15 Hz range. The ratio between the low and high frequencies is also useful.
Respiratory Rate
Respiratory rate is another critical variable monitored by wearable devices in the context of COVID-19. Respiratory rate can provide information about lung function and the respiratory system’s response to infection using mainly temporal domain.
In the temporal domain, respiratory rate is usually measured as the number of breaths per minute [23,28,34]. The variation of this measure over time, especially during different phases of sleep, can be indicative of respiratory problems. Statistical features, such as the maximum and minimum of respiratory rate used by [34], help to identify episodes of abnormal breathing that could be associated with deterioration due to COVID-19. Nataranjan et al. [32] estimated Respiratory rate from deep sleep when possible and from light sleep in case deep sleep is insufficient.
Steps and Sleep
Step count and sleep patterns are important variables monitored by wearable devices as they reflect physical activity level and sleep quality, both of which are important factors for identifying COVID-19 infection, diagnosis or recovery.
Features such as total number of steps, maximum number of steps in a 5-minute interval, total sleep duration [16,26,33] are widely employed. Statistical Domain includes measures such as mean, standard deviation, maximum, minimum, and variance of the number of steps and sleep patterns [26]. These features help to identify changes in physical activity levels and sleep quality. Leitner et al. [33] included different sleep phases (deep, light, and REM sleep). These measures provide a detailed view of physical activity levels and sleep patterns, which may be affected during COVID-19 infection and recovery.
Oxygen Saturation
Oxygen saturation (SpO2) is a vital measure of respiratory function and gas exchange efficiency in the lungs, which is especially relevant for COVID-19 disease.
Oxygen saturation is typically measured by pulse oximetry, and is expressed as a percentage. Although there are many studies that make use of this characteristic [23,31,33,34], since a derived measure is not specified in any domain, it suggests that it is included only as a percentage. However, temporal SpO2 measurements could reveal episodes of hypoxemia (low blood oxygen levels) that are characteristic in severe cases of COVID-19 and therefore temporal variation in SpO2 could be crucial to identify patterns of desaturation that may require medical intervention.
In addition, to facilitate comparison between the most used signals or sources of information, the following table provides a summary of that, the references of the studies that employed them, and the number of publications that have used each signal (Table 5). Heart rate was the most commonly utilized feature, appearing in 16 studies, followed by sleep patterns and step count, which were considered in 7 and 6 studies, respectively. Other physiological parameters, such as respiratory rate, oxygen saturation, and reported symptoms, were also analyzed, though less frequently.
3.3. Meta-Analysis
Given that the reviewed studies differ in methodologies, patient populations, and devices used, the meta-analysis was conducted to quantitatively integrate the results of the included studies and obtain a pooled estimate of the impact of machine learning models for COVID-19 diagnosis. This analysis provides a more robust measure of the overall performance of these models.
The results of the meta-analysis are presented in Figure 4, which shows a forest plot with the standardized mean differences (SMDs) and their respective 95% confidence intervals (CIs).
The forest plot indicates that the SMDs of individual studies range from 0.7700 to 0.9880, suggesting that, although there are differences between studies, machine learning models have shown relatively consistent performance in detecting and predicting COVID-19. The pooled effect estimate in the common-effects model was 0.83 (95% CI: 0.81 - 0.85), while in the random-effects model it was 0.86 (95% CI: 0.81 - 0.91). These values reflect a significant difference in the effectiveness of the models, with overall positive performance in case classification.
Heterogeneity between studies was high () indicating considerable variability in the results of individual studies. This high heterogeneity could be attributed to several factors, such as differences in study design, variability in patient populations, the wearable devices used, which may differ in accuracy and in the physiological metrics captured, as well as in the different machine learning algorithms applied.
3.4. Quality Assesment
Figure 5 shows the results of the risk of bias analysis for the included studies. For practical reasons, a selection of items from the original PROBAST was made. Thus, the risk profiles for the domains of participants, predictors, outcomes, and analysis were reduced to six items considered the most relevant and user-friendly: 1.1. Were appropiate data sources used e.g., cohort, RCT, or nested case-control study data? 1.2. Were all inclusions and exclusions of participants appropiate? 2.2. Were predictor assessments made without knowledge of outcome data? 3.5. Was the outcome determined without knowledge of predictor information? 4.1. Were there a reasonable number of participants with the outcome? 4.7. Were relevant model performance measures evaluated appropiately?.
Overall, the domains analyzed show a mixed risk profile. In the participant domain, approximately 75% of the studies present a low risk; however, a significant proportion (around 20%) have an unclear risk, and an additional 5% are classified as high risk.
Regarding the predictor domain, approximately 55% of the studies present a low risk of bias, while 25% have an unclear risk and 20% are considered high risk. This distribution suggests that, although many of the predictors used in machine learning models are well-defined and appropriate, concerns remain about the clarity of their definition and application in some studies.
In the outcomes domain, approximately 60% of studies are classified as low risk, but 15% are considered uncertain risk, and 25% are considered high risk.
Finally, the analysis domain shows the greatest concern, with only 40% of studies classified as low risk. Approximately 35% are considered unclear risk, and 25% are considered high risk. This pattern indicates that, in many studies, the analysis may not have been conducted adequately or clearly, which could affect the reliability of the results obtained.
4. Discussion
In this study, various machine learning approaches and algorithms applied to the diagnosis and prediction of COVID-19 using wearable devices have been synthesized and analyzed.
The descriptive analysis provides an overview of the temporal and thematic distribution of the reviewed studies. The number of publications peaked in 2021, which can be attributed to the initial global urgency to find quick and effective solutions during the acute phase of the pandemic.
Most studies focused on the prediction of COVID-19 infections (18 out of 20), while only two studies addressed the diagnosis of disease progression. This imbalance suggests greater focus on early detection and triage of cases, possibly due to the need for immediate control measures during the pandemic. However, the relative paucity of studies on disease progression indicates an opportunity for future research in the management and prognosis of patients with this disease.
Table 4 summarizes the performance of the most effective machine learning algorithms in the analyzed studies. Compared to the Table 3, the results indicate that a high AUC is not always associated with a larger sample size, highlighting the importance of data quality over quantity. Furthermore, devices such as the Oura Ring and Garmin have proven effective even in studies with small samples, suggesting that device accuracy may play a more determining role than the volume of data collected. In addition, the Table 4 visualizes the relationship between the performance of each method and the features used, providing a clearer perspective on how different factors influence the effectiveness of the models. However, in some studies, it was difficult to precisely identify the features used or metrics obtained, as they are not always clearly or in detail specified in the reports. This lack of clarity can hinder the comparison between studies and the replicability of results.
The biometrics analysis reveals that the most common variables monitored are heart rate, respiratory rate, oxygen saturation, and step and sleep patterns. Each of these variables offers valuable information when analyzed across various feature extraction domains, allowing for a more complete understanding of the patient’s health status. Heart rate (HR) is one of the most studied variables, due to the wealth of information it provides about heart rate variability (HRV). The reviewed studies have used temporal, statistical, and spectral features to assess HRV. RMSSD and Shannon entropy have been shown to be particularly useful in detecting vagal-mediated changes and in offering deeper insight into the complexity of HRV signals. Future research should consider integrating multiple feature domains to provide a more comprehensive assessment of HRV. Furthermore, combining temporal, statistical, and spectral techniques may improve the detection of anomalous patterns in HRV, crucial for COVID-19 diagnosis and monitoring.
Respiratory rate is another critical variable monitored by wearable devices. Most studies have used the time domain to measure breaths per minute, revealing respiratory problems during different phases of sleep. The integration of statistical features could provide a more complete view of respiratory function and its variability, allowing the identification of episodes of abnormal breathing that could be indicative of impairment due to COVID-19.
On the other hand, several studies have used pulse oximetry to measure SpO2 as a percentage. Although no derived features have been specified in the reviewed studies, temporal variation in SpO2 is crucial to identify episodes of hypoxemia, characteristic of severe cases of COVID-19. Future research should develop methods for advanced SpO2 feature extraction, using both temporal and statistical analysis to provide a more complete understanding of respiratory function. Integrating SpO2 monitoring with other physiological variables could significantly improve the ability to detect and respond to critical episodes of hypoxemia.
The comparative analysis of the different devices and algorithms highlights the importance of selecting the right equipment and the most appropriate algorithm to obtain optimal results. For example, use of the Oura Ring in combination with the Random Forest demonstrated efficacy in studies with smaller sample sizes, suggesting that the accuracy of the device can compensate for a lower volume of data.
Regarding the meta-analysis carried out, it provides a comprehensive view of the performance of machine learning models. The combined estimates from the common and random effects models indicate robust and significant performance of the machine learning models. However, the high heterogeneity observed () suggests that the results of individual studies vary considerably. This variability could be attributed to differences in study designs, population characteristics, types of wearable devices used, and machine learning algorithms applied.
It should be noted that the AUC metric was selected for the meta-analysis because it was the only metric consistently reported in a sufficient number of studies. The lack of complete data on other metrics, such as the confusion matrix or specific values of TN, FP, FN, and TP, precluded the use of additional measures such as precision, sensitivity, or specificity. This limitation makes evident the need for more complete and standardized reporting in future studies.
The results of the quality assesment indicate variability in the quality of the studies, but in general, the methods and data used are adequate to support the conclusions of the meta-analysis. The risk of bias graph shows that although most studies were at low risk in the selection of participants and predictors, there were areas of concern in the measurement of outcomes and analysis of the data. The proportion of articles with high or unclear risk in these areas suggests the implementation of improvements in transparency and methodological rigor in future studies.
5. Conclusions
In pandemics such as COVID-19, it is essential to leverage technology to help stop the rapid spread of the virus. Non-contact detection methods, as they involve less involvement of infected persons and healthcare workers, are particularly useful for this purpose.
This review evidences that data and information collected from smart devices can be effectively employed to predict and diagnose COVID-19, using machine learning algorithms that have demonstrated highly satisfactory performance. These devices, such as cell phones, smart watches and other wearable devices, provide a rich source of data that can be analyzed to identify relevant patterns and signals related to the disease.
Among the machine learning algorithms evaluated, Random Forest (RF), Support Vector Machine (SVM), Logistic Regression (LR) and K-Nearest Neighbor (kNN) have been shown to be the most effective in classifying and predicting cases of COVID-19.
The meta-analysis, which has been focused on the AUC metric, has shown a robust performance of the machine learning models, although with a high heterogeneity between the studies, so it is suggested to standardize the methods and improve the homogeneity of the data to reduce variability and improve comparability between studies. However, in some studies, it has been difficult to precisely identify the features used, as they are not always clearly or in detail specified in the reports. The lack of complete data on other performance metrics in many studies also highlights the importance of more comprehensive and standardized reporting in future research.
It is hoped that this study will serve as a valuable guide for future research that continues to leverage the information provided by commonly used and easily accessible smart devices. The search for less costly, more optimal and effective methods of early diagnosis of COVID-19 is a crucial objective in the fight against the pandemic. By exploring the information generated by these devices, it is possible to move towards a more preventive and proactive approach to virus detection and control, providing both individual and collective public health benefits.
Funding
This research was funded by Virrectorado de Investigación de la Universidad Nacional San Agustin de Arequipa, grant number IBA-IB-02-2021-UNSA
Acknowledgments
Virrectorado de Investigación de la Universidad Nacional de San Agustín de Arequipa, contrato de subvención IBA-IB-02-2021-UNSA
Conflicts of Interest
The authors declare no conflict of interest.” Authors must identify and declare any personal circumstances or interest that may be perceived as inappropriately influencing the representation or interpretation of reported research results
References
- World Health Organization. Who coronavirus (covid-19) dashboard. 2022. Available online: https://covid19.who.int/.
- World Health Organization. Laboratory testing for coronavirus disease 2019 (COVID-19) in suspected human cases: Interim guidance, 2 March 2020. Technical report, World Health Organization, 2020.
- Filchakova, O.; Dossym, D.; Ilyas, A.; Kuanysheva, T.; Abdizhamil, A.; Bukasov, R. Review of COVID-19 testing and diagnostic methods. Talanta 2022, 123409. [Google Scholar] [CrossRef] [PubMed]
- Wynants, L.; Van Calster, B.; Collins, G.S.; Riley, R.D.; Heinze, G.; Schuit, E.; Bonten, M.M.; Dahly, D.L.; Damen, J.A.; Debray, T.P.; et al. Prediction models for diagnosis and prognosis of covid-19: Systematic review and critical appraisal. bmj 2020, 369. [Google Scholar] [CrossRef]
- Tayarani, M. Applications of artificial intelligence in battling against covid-19: A literature review. Chaos, Solitons & Fractals 2020. [Google Scholar]
- Ahmed, A.; Boopathy, P.; et al. Artificial intelligence for the novel corona virus (COVID-19) pandemic: Opportunities, challenges, and future directions. Int. J. E-Health Med Commun. (IJEHMC) 2021, 13, 1–21. [Google Scholar] [CrossRef]
- Zhao, Z.; Chen, A.; Hou, W.; Graham, J.M.; Li, H.; Richman, P.S.; Thode, H.C.; Singer, A.J.; Duong, T.Q. Prediction model and risk scores of ICU admission and mortality in COVID-19. PLoS ONE 2020, 15, e0236618. [Google Scholar] [CrossRef]
- Çubukçu, H.C.; Topcu, D.İ.; Bayraktar, N.; Gülşen, M.; Sarı, N.; Arslan, A.H. Detection of COVID-19 by machine learning using routine laboratory tests. Am. J. Clin. Pathol. 2022, 157, 758–766. [Google Scholar] [CrossRef] [PubMed]
- Subramanian, N.; Elharrouss, O.; Al-Maadeed, S.; Chowdhury, M. A review of deep learning-based detection methods for COVID-19. Computers in Biology and Medicine 2022, 105233. [Google Scholar] [CrossRef]
- Heidari, A.; Navimipour, N.J.; Unal, M.; Toumaj, S. The COVID-19 epidemic analysis and diagnosis using deep learning: A systematic literature review and future directions. Computers in biology and medicine 2021, 105141. [Google Scholar] [CrossRef]
- Ates, H.C.; Yetisen, A.K.; Güder, F.; Dincer, C. Wearable devices for the detection of COVID-19. Nat. Electron. 2021, 4, 13–14. [Google Scholar] [CrossRef]
- Page, M.J.; McKenzie, J.E.; Bossuyt, P.M.; Boutron, I.; Hoffmann, T.C.; Mulrow, C.D.; Shamseer, L.; Tetzlaff, J.M.; Akl, E.A.; Brennan, S.E.; et al. The PRISMA 2020 statement: An updated guideline for reporting systematic reviews. Syst. Rev. 2021, 10, 1–11. [Google Scholar] [CrossRef] [PubMed]
- Higgins, J.P.; Thompson, S.G.; Deeks, J.J.; Altman, D.G. Measuring inconsistency in meta-analyses. Bmj 2003, 327, 557–560. [Google Scholar] [CrossRef]
- Wolff, R.F.; Moons, K.G.; Riley, R.D.; Whiting, P.F.; Westwood, M.; Collins, G.S.; Reitsma, J.B.; Kleijnen, J.; Mallett, S.; Group†, P. PROBAST: A tool to assess the risk of bias and applicability of prediction model studies. Ann. Intern. Med. 2019, 170, 51–58. [Google Scholar] [CrossRef]
- Otoom, M.; Otoum, N.; Alzubaidi, M.A.; Etoom, Y.; Banihani, R. An IoT-based framework for early identification and monitoring of COVID-19 cases. Biomed. Signal Process. Control 2020, 62, 102149. [Google Scholar] [CrossRef]
- Sarwar, A.; Agu, E. Passive COVID-19 Assessment using Machine Learning on Physiological and Activity Data from Low End Wearables. In Proceedings of the 2021 IEEE International Conference on Digital Health (ICDH). IEEE, 2021, pp. 80–90.
- Skibinska, J.; Burget, R.; Channa, A.; Popescu, N.; Koucheryavy, Y. COVID-19 Diagnosis at Early Stage Based on Smartwatches and Machine Learning Techniques. IEEE Access 2021, 9, 119476–119491. [Google Scholar] [CrossRef]
- Hassantabar, S.; Stefano, N.; Ghanakota, V.; Ferrari, A.; Nicola, G.N.; Bruno, R.; Marino, I.R.; Hamidouche, K.; Jha, N.K. Coviddeep: Sars-cov-2/covid-19 test based on wearable medical sensors and efficient neural networks. IEEE Trans. Consum. Electron. 2021, 67, 244–256. [Google Scholar] [CrossRef]
- Gadaleta, M.; Radin, J.M.; Baca-Motes, K.; Ramos, E.; Kheterpal, V.; Topol, E.J.; Steinhubl, S.R.; Quer, G. Passive detection of COVID-19 with wearable sensors and explainable machine learning algorithms. NPJ Digit. Med. 2021, 4, 1–10. [Google Scholar] [CrossRef]
- Miller, D.J.; Capodilupo, J.V.; Lastella, M.; Sargent, C.; Roach, G.D.; Lee, V.H.; Capodilupo, E.R. Analyzing changes in respiratory rate to predict the risk of COVID-19 infection. PLoS ONE 2020, 15, e0243693. [Google Scholar] [CrossRef] [PubMed]
- Khaloufi, H.; Abouelmehdi, K.; Beni-Hssane, A.; Rustam, F.; Jurcut, A.D.; Lee, E.; Ashraf, I. Deep Learning Based Early Detection Framework for Preliminary Diagnosis of COVID-19 via Onboard Smartphone Sensors. Sensors 2021, 21, 6853. [Google Scholar] [CrossRef] [PubMed]
- Mason, A.E.; Hecht, F.M.; Davis, S.K.; Natale, J.L.; Hartogensis, W.; Damaso, N.; Claypool, K.T.; Dilchert, S.; Dasgupta, S.; Purawat, S.; et al. Detection of COVID-19 using multimodal data from a wearable device: results from the first TemPredict Study. Sci. Rep. 2022, 12, 1–15. [Google Scholar]
- Conroy, B.; Silva, I.; Mehraei, G.; Damiano, R.; Gross, B.; Salvati, E.; Feng, T.; Schneider, J.; Olson, N.; Rizzo, A.G.; et al. Real-time infection prediction with wearable physiological monitoring and AI to aid military workforce readiness during COVID-19. Sci. Rep. 2022, 12, 1–12. [Google Scholar] [CrossRef] [PubMed]
- Hirten, R.P.; Tomalin, L.; Danieletto, M.; Golden, E.; Zweig, M.; Kaur, S.; Helmus, D.; Biello, A.; Pyzik, R.; Bottinger, E.P.; et al. Evaluation of a machine learning approach utilizing wearable data for prediction of SARS-CoV-2 infection in healthcare workers. JAMIA Open 2022, 5, ooac041. [Google Scholar] [CrossRef]
- Jaiswal, D.; Mandana, K.; Ramakrishnan, R.K.; Murlidharan, K.; Sheshachala, M.B.; Ahmad, S.; Acharia, T.; Tiwari, L.; Pal, A.; Kanagasabapathy, B. An approach to a wrist wearable based Covid-19 prediction system to protect Health Care Professionals. In Proceedings of the 2022 44th Annual International Conference of the IEEE Engineering in Medicine & Biology Society (EMBC). IEEE, 2022, pp. 2459–2463.
- Skibinska, J.; Burget, R. Is it possible to distinguish covid-19 cases and influenza with wearable devices? analysis with machine learning. J. Adv. Inf. Technol. 2022, 13. [Google Scholar] [CrossRef]
- Hijazi, H.; Abu Talib, M.; Hasasneh, A.; Bou Nassif, A.; Ahmed, N.; Nasir, Q. Wearable devices, smartphones, and interpretable artificial intelligence in combating COVID-19. Sensors 2021, 21, 8424. [Google Scholar] [CrossRef] [PubMed]
- Risch, M.; Grossmann, K.; Aeschbacher, S.; Weideli, O.C.; Kovac, M.; Pereira, F.; Wohlwend, N.; Risch, C.; Hillmann, D.; Lung, T.; et al. Investigation of the use of a sensor bracelet for the presymptomatic detection of changes in physiological parameters related to COVID-19: An interim analysis of a prospective cohort study (COVI-GAPP). BMJ Open 2022, 12, e058274. [Google Scholar] [CrossRef]
- Abir, F.F.; Alyafei, K.; Chowdhury, M.E.; Khandakar, A.; Ahmed, R.; Hossain, M.M.; Mahmud, S.; Rahman, A.; Abbas, T.O.; Zughaier, S.M.; et al. PCovNet: A presymptomatic COVID-19 detection framework using deep learning model using wearables data. Comput. Biol. Med. 2022, 147, 105682. [Google Scholar] [CrossRef]
- Chung, H.; Ko, H.; Lee, H.; Yon, D.K.; Lee, W.H.; Kim, T.S.; Kim, K.W.; Lee, J. Development and validation of a deep learning model to diagnose COVID-19 using time-series heart rate values before the onset of symptoms. Journal of Medical Virology 2023. [Google Scholar] [CrossRef]
- Abdel-Ghani, A.; Abughazzah, Z.; Akhund, M.; Abualsaud, K.; Yaacoub, E. Efficient pandemic infection detection using wearable sensors and machine learning. In Proceedings of the 2023 International Wireless Communications and Mobile Computing (IWCMC). IEEE, 2023, pp. 1562–1567.
- Natarajan, A.; Su, H.W.; Heneghan, C. Assessment of physiological signs associated with COVID-19 measured using wearable devices. NPJ Digit. Med. 2020, 3, 156. [Google Scholar] [CrossRef]
- Leitner, J.; Behnke, A.; Chiang, P.H.; Ritter, M.; Millen, M.; Dey, S. Classification of Patient Recovery From COVID-19 Symptoms Using Consumer Wearables and Machine Learning. IEEE J. Biomed. Health Informatics 2023, 27, 1271–1282. [Google Scholar] [CrossRef]
- Kang, J.Y.; Bae, Y.S.; Chie, E.K.; Lee, S.B. Predicting Deterioration from Wearable Sensor Data in People with Mild COVID-19. Sensors 2023, 23, 9597. [Google Scholar] [CrossRef]
- Mahdavi, M.; Choubdar, H.; Zabeh, E.; Rieder, M.; Safavi-Naeini, S.; Jobbagy, Z.; Ghorbani, A.; Abedini, A.; Kiani, A.; Khanlarzadeh, V.; et al. A machine learning based exploration of COVID-19 mortality risk. PLoS ONE 2021, 16, e0252384. [Google Scholar] [CrossRef] [PubMed]
Figure 1.
PRISMA flow diagram for the systematic selection of the articles.
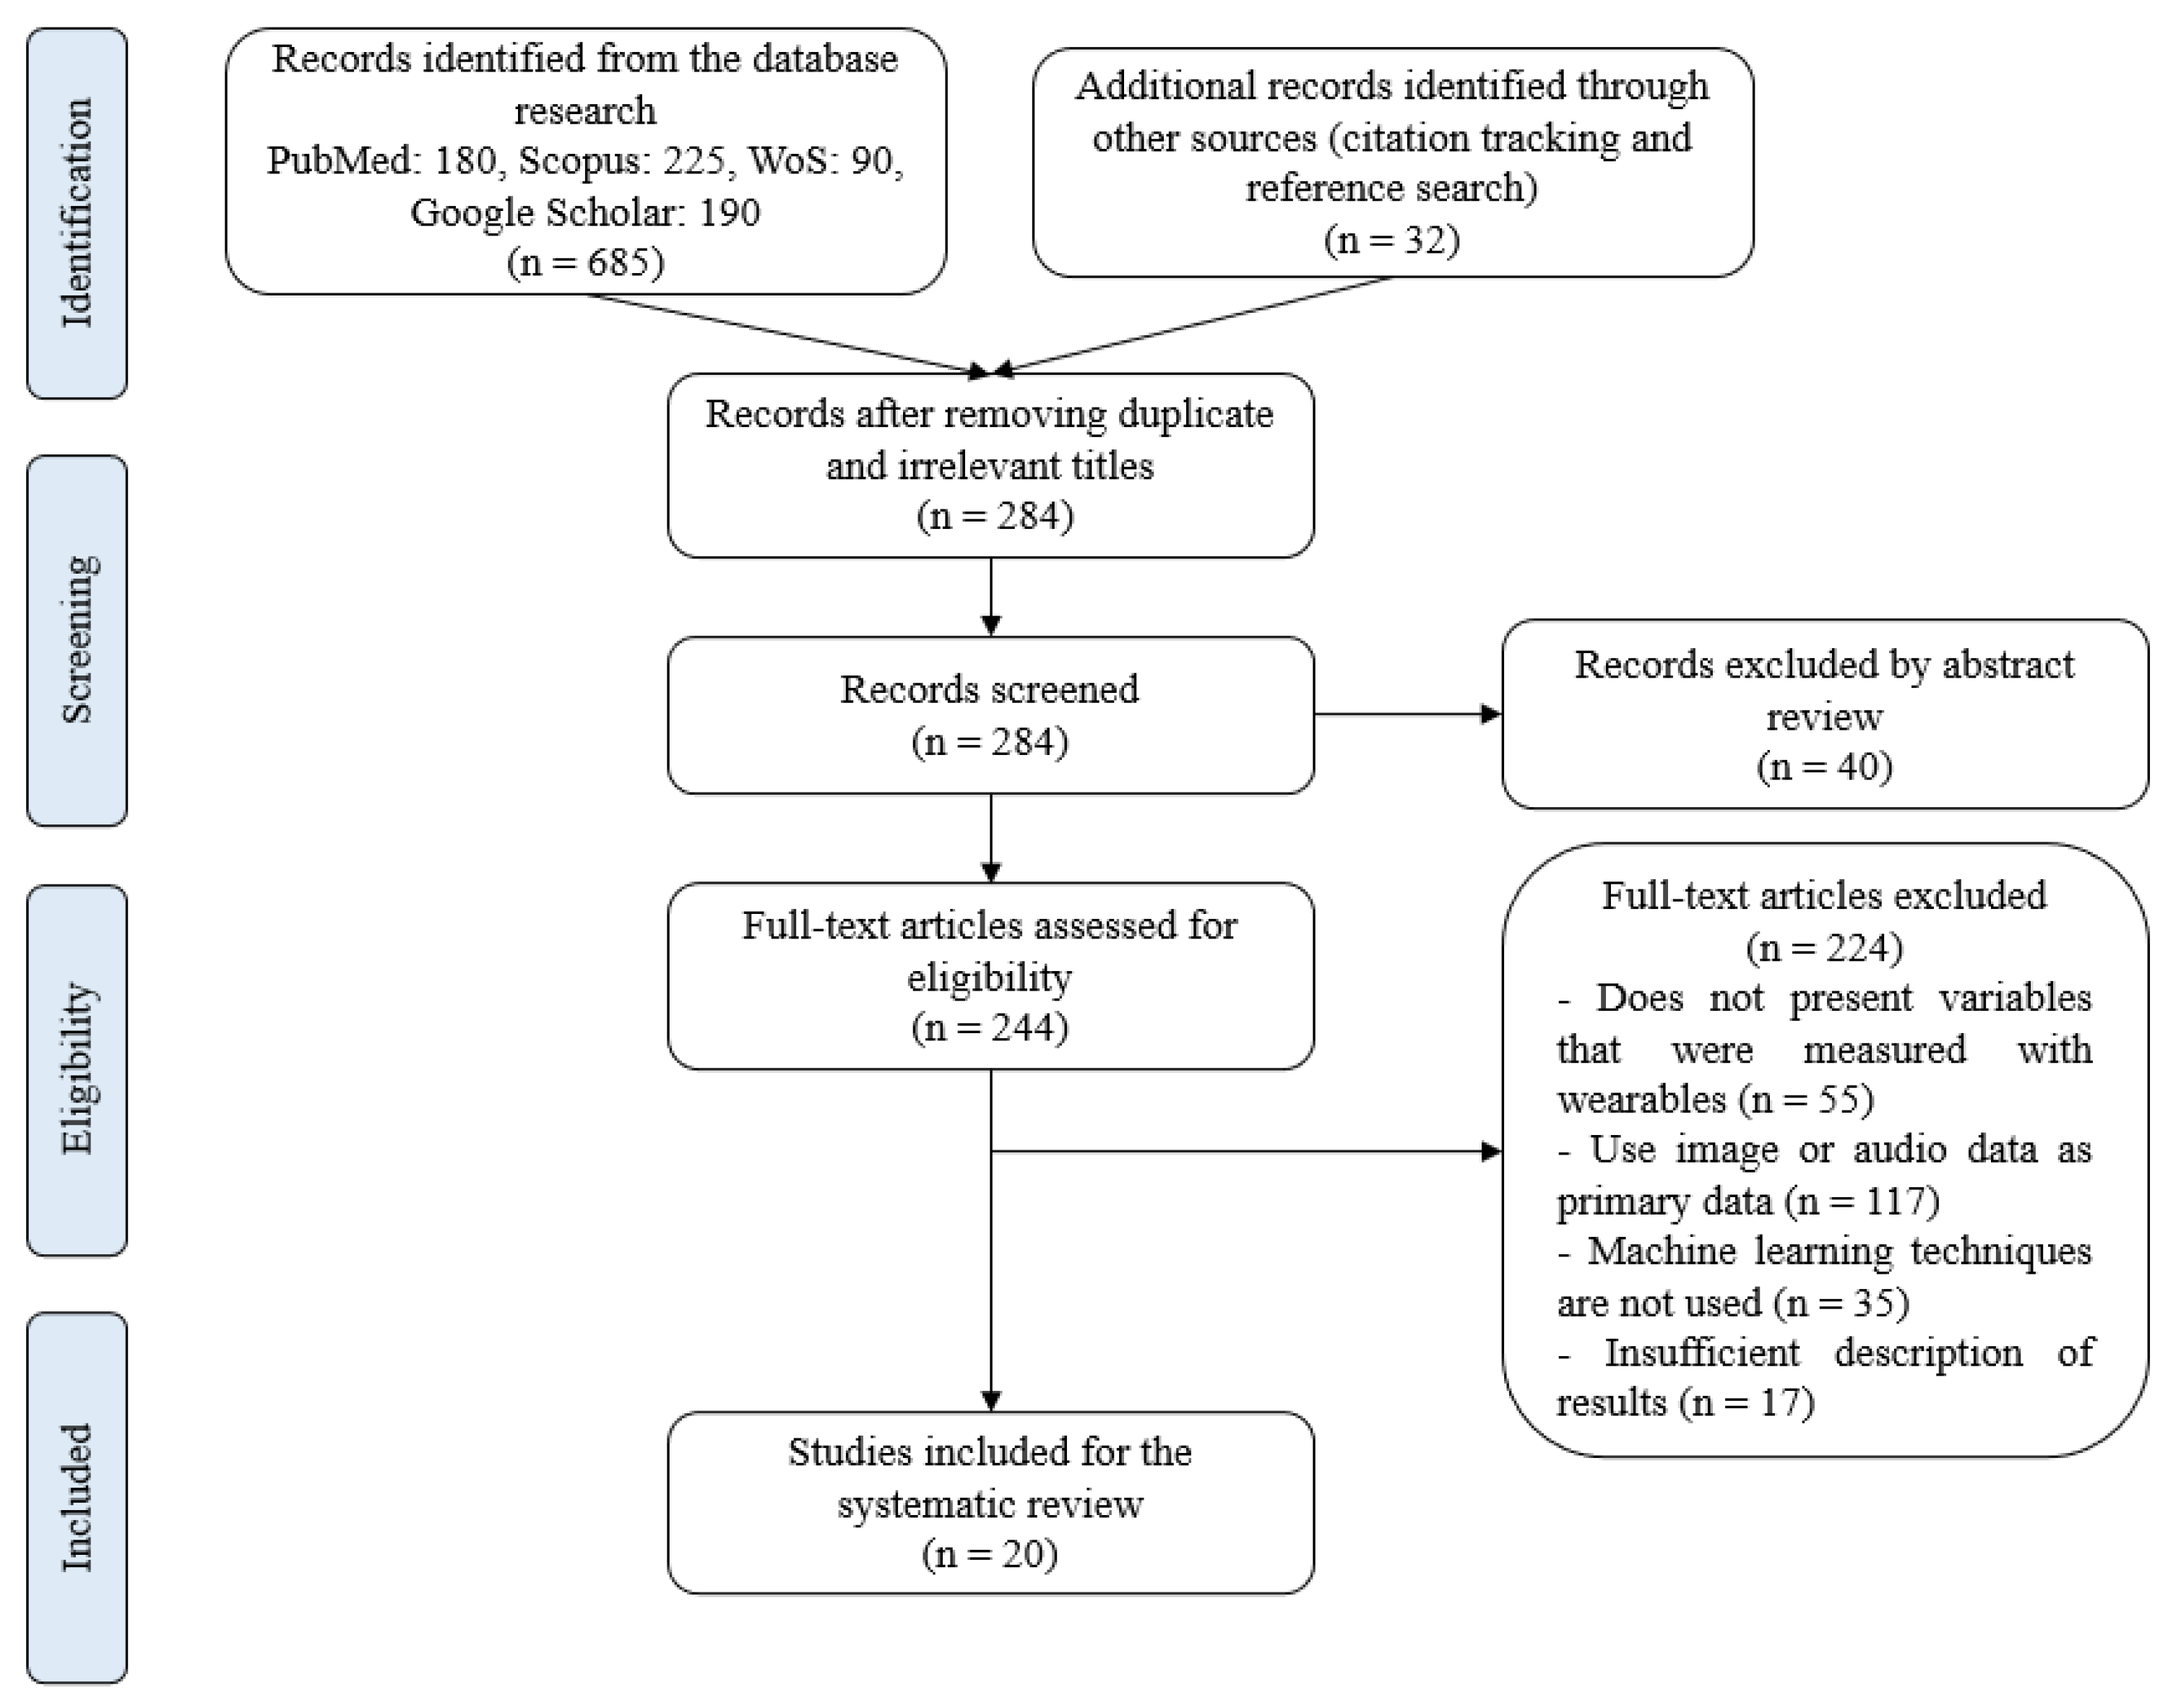
Figure 2.
Documents per year.
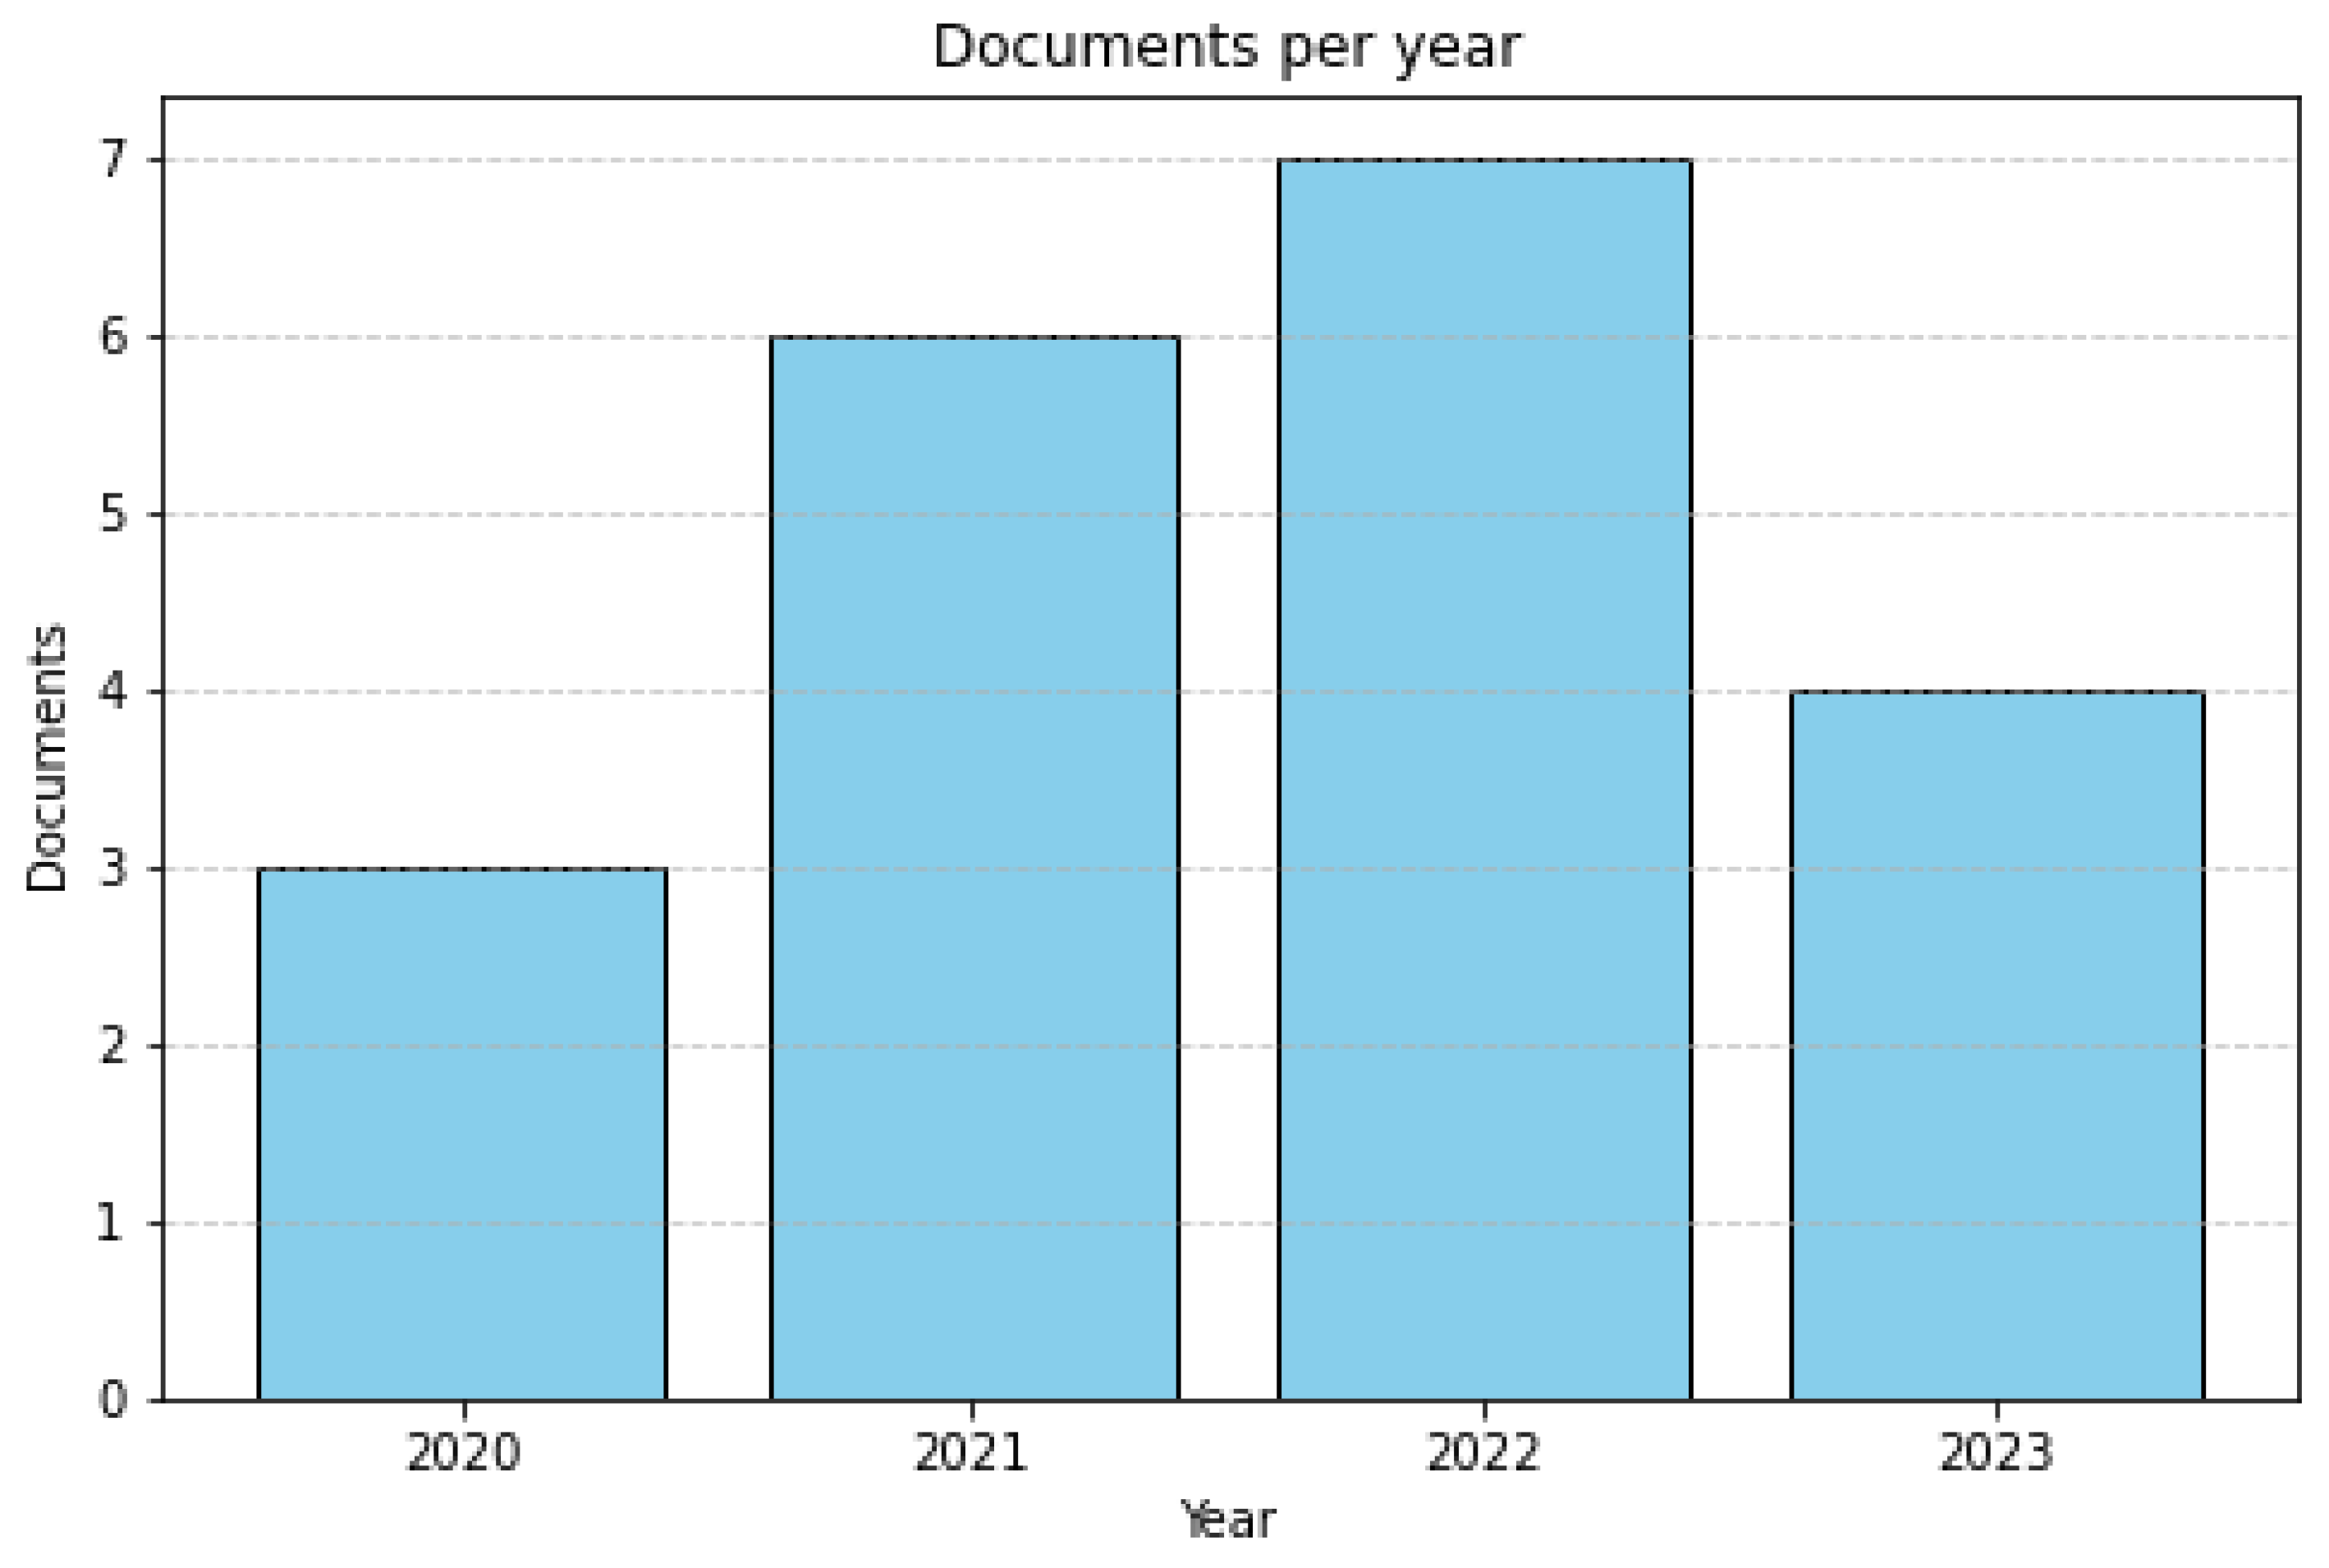
Figure 3.
Words most used in the abstract.
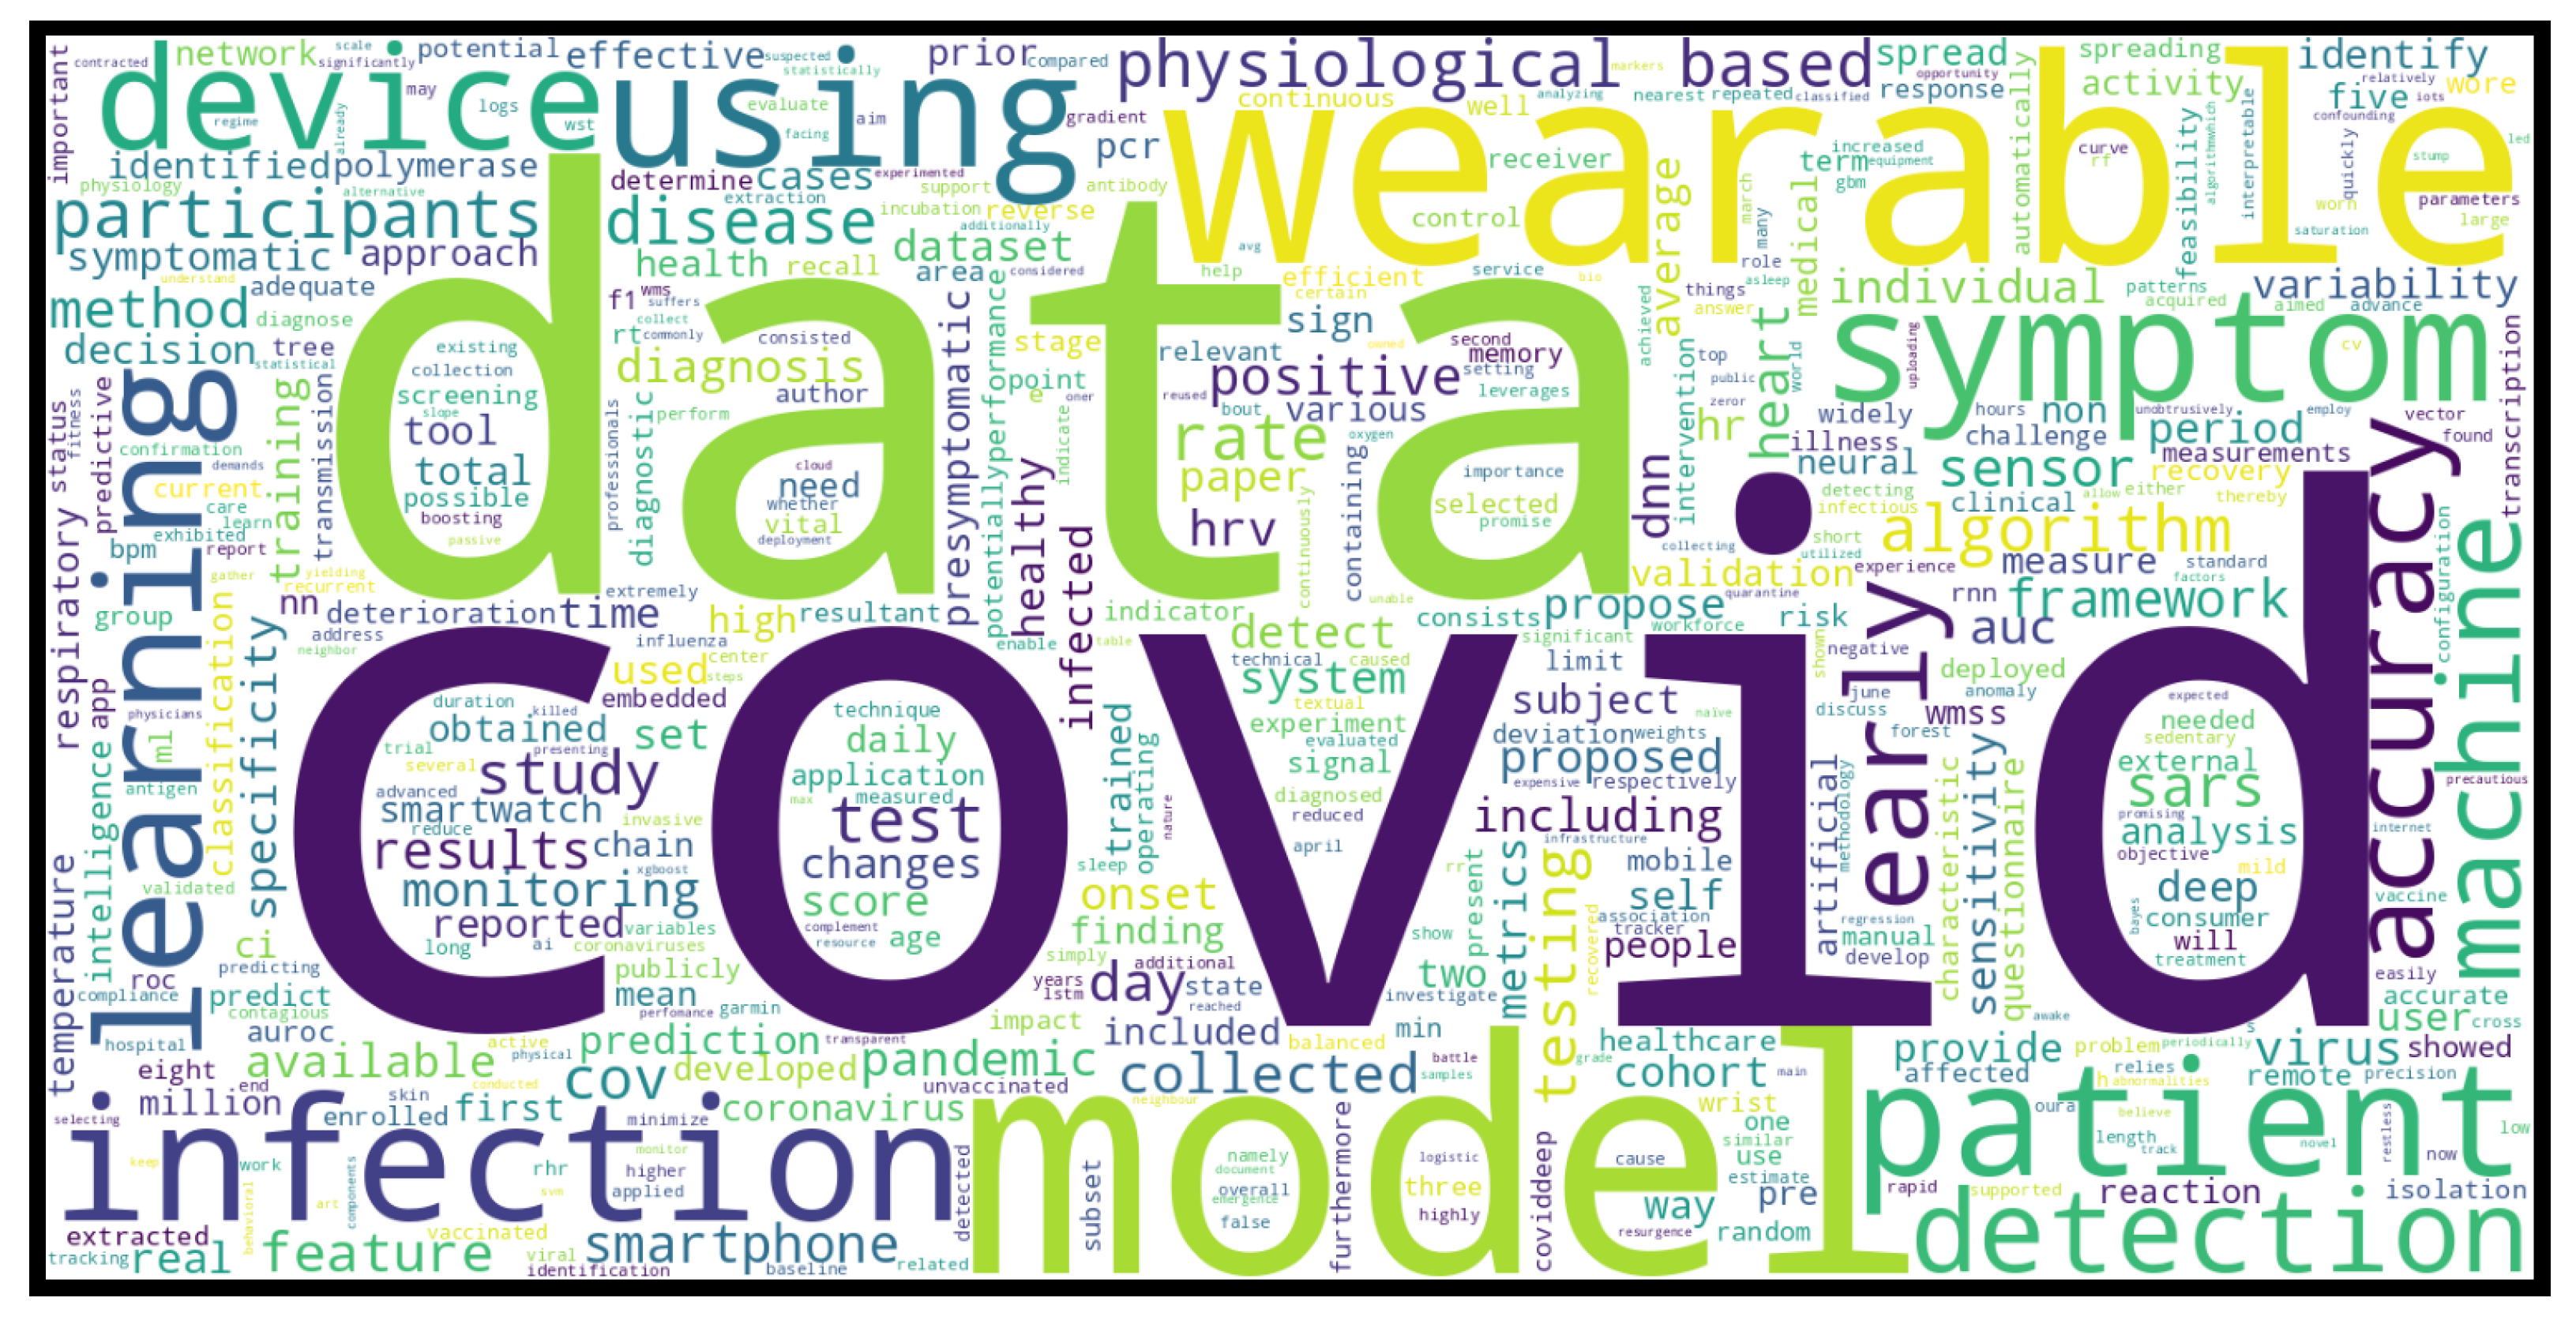
Figure 4.
Forest plot.
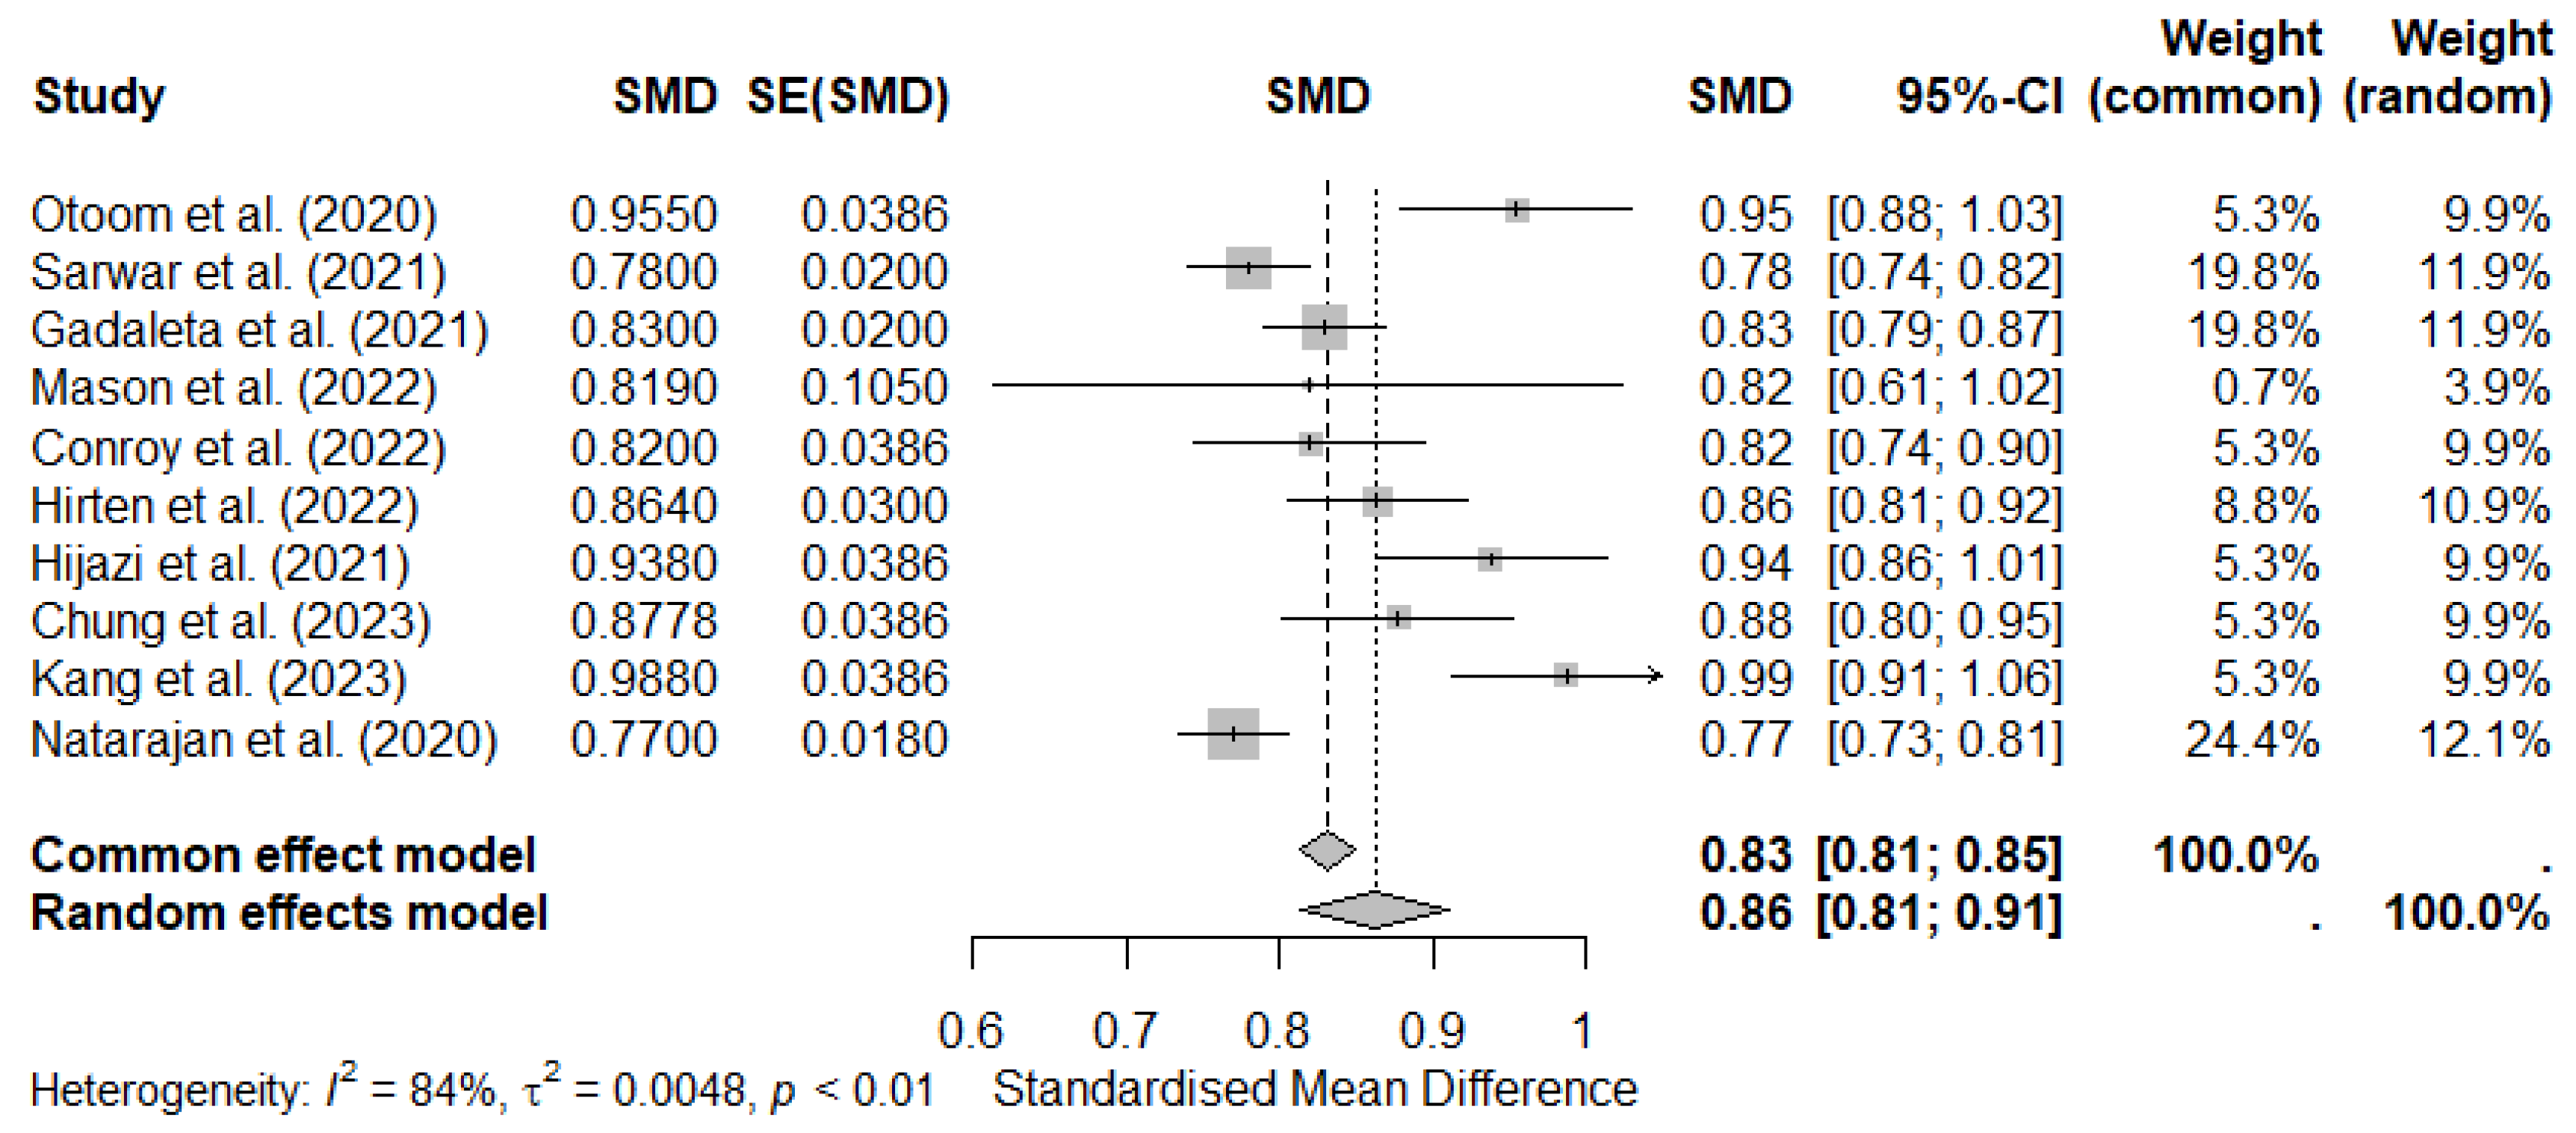
Figure 5.
PROBAST analysis.
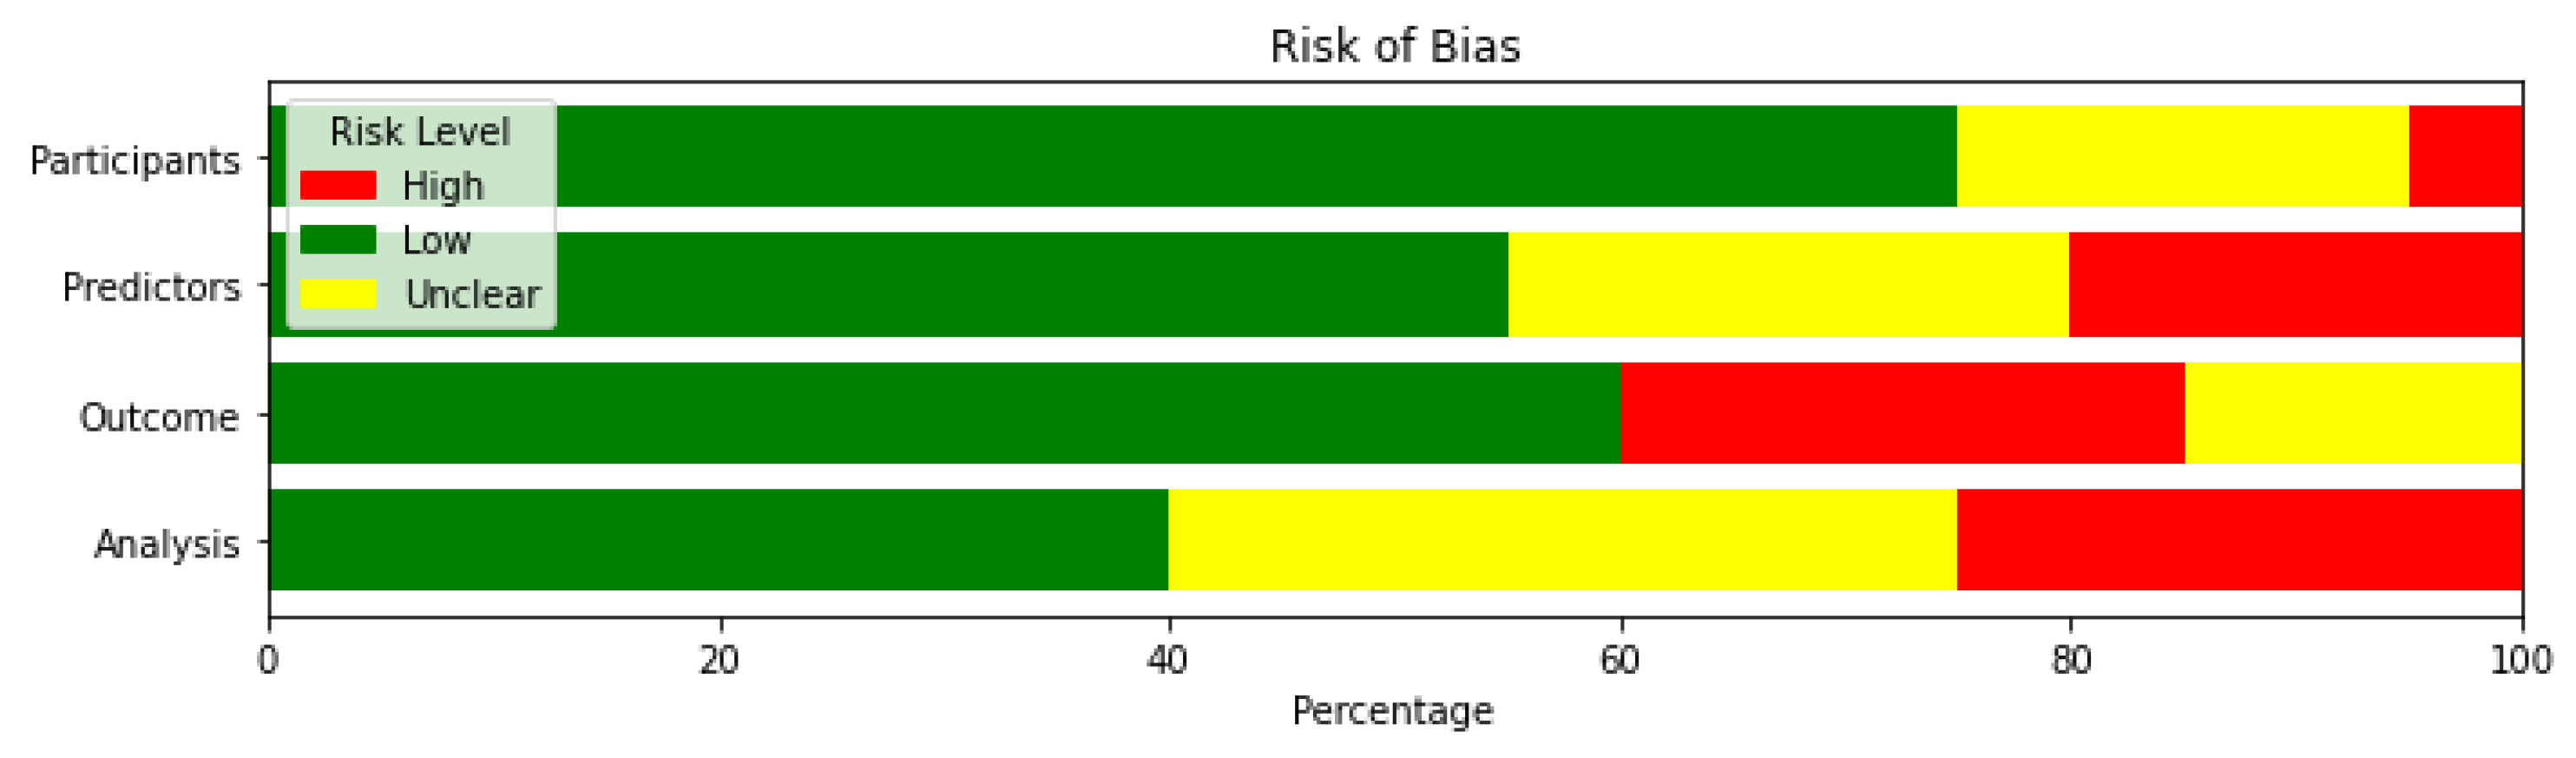

Table 1.
General approaches in the studies analyzed.
| Approach | Description | References | Number of publications |
|---|---|---|---|
| Prediction of COVID-19 Infection | Studies that focus on predicting and classifying positive and negative cases of COVID-19, between healthy and COVID-19 patients, or between patients with COVID-19 and other types of respiratory diseases. | [15,16,17,18,19,20,21,22,23,24,25,26,27,28,29,30,31,32] | 18 |
| Diagnosis of evolution of COVID-19 | Studies that focus on making some type of diagnosis of the evolution of COVID-19 such as the deterioration due to the disease or recovery situation | [33,34] | 2 |
Table 2.
Machine Learning techniques in selected studies.
| ML techniques | References | Number of publications |
|---|---|---|
| Decision Tree (DT) | [17,21,26,27] | 4 |
| Random Forest (RF) | [16,17,21,22,25,26,33,34] | 8 |
| Support Vector Machine (SVM) | [15,16,17,21,26,27,33,35] | 8 |
| Logistic Regression (LR) | [16,17,21,26,27,33] | 6 |
| K-Nearest-Neighbor (kNN) | [15,17,21,26,27,33] | 6 |
| Naive Bayes (NB) | [15,16] | 2 |
| Gradient Boosting (GB) | [16,19,20,23] | 4 |
| Extreme Gradient Boosting (XGBoost) | [17,26,34] | 3 |
| Decision Table | [15] | 1 |
| Decision Stump | [15] | 1 |
| OneR | [15] | 1 |
| ZeroR | [15] | 1 |
| Adaboost | [16] | 1 |
| LSTM | [16,28,29,33] | 4 |
| Artificial Neural Network (ANN)(NN) Deep Neural Network (DNN) | [15,18,21,30,33] | 5 |
| Rapid Analysis of Threat Exposure (RATE) | [23] | 1 |
| Light Gradient Boosting Machine (LGBM) | [34] | 1 |
| CatBoost | [34] | 1 |
| CNN-LSTM Long Short-Term Memory Network | [31] | 1 |
| CNN | [32] | 1 |
Table 3.
Study Summary and Device Description.
| Article | Population (N = N° of subjects) | Data acquisition | Variables | Feature extraction | |
|---|---|---|---|---|---|
| Wearable | Time | ||||
| Otoom et al. (2020) [15] | (N = 1476) 854 confirmed COVID-19 cases, and 622 non-confirmed cases | non-specific wearable devices | - | Symptoms, travels and contacts | - |
| Sarwar et al. (2021) [16] | (N=20) Healthy: 7 days before the onset of symptoms. Infectious: 14 days after | Fitbit Ionic, Fitbit Charge 3, Fitbit Charge 4 | - | Heart rate, steps and sleep | RHR (5 min at rest), RHR (min, max, mean, std dev, median, ...), steps (total number, max number in 5 min, …), sleep (N of samples asleep, awake, total duration,…) |
| Skibinska et al. (2021) [17] | (N = 54) 27 control and 27 COVID-19 | Fitbit, Apple Watch, Garmin Watch, Oura Ring, BioStrap, Masimo Pulse Oximeter, Empatica, Motiv Ring | - | steps per minute and heart rate per second | Temporal domain: auto-correlation, centroid, mean absolute differences, mean differences, median absolute differences... Statistical domain: histogram, inter-quartile range, mean absolute deviation, median absolute deviation, root mean square, standard deviation, variance.. Spectral domain: fast Fourier transform (FFT) mean coefficient, wavelet absolute mean, wavelet standard deviation, wavelet variance,... |
| Hassantabar et al. (2021) [18] | (N = 87) 30 healthy, 27 asymptomatic COVID-19 patients and 30 symptomatic | Empatica E4 | - | Galvanic skin response, pulse oximeter, blood pressure, and questionnaire (symptoms and illnesses). | - |
| Gadaleta et al. (2021) [19] | (N = 539) positive cases that reported at least one symptom in the 15 days preceding the test date | Fitbit | - | Activity, heart rate and sleep. Anthropometry and demography. | - |
| Miller et al. (2020) [20] | (N = 271) 271 people tested positive for COVID-19. Healthy days: data extracted from 30 to 14 days before symptom onset. Infectious days: data extracted between 2 days before symptom onset and 3 days after symptom onset | Wrist-worn strap | - | Respiratory rate, resting heart rate (RHR) and heart rate variability (HRV) | - |
| Khaloufi et al. (2021) [21] | (N = 1417) 1054 subjects tested positive for COVID-19 and 363 subjects tested negative for COVID-19 | Smartphone sensors | - | Symptoms | - |
| Mason et al. (2022) [22] | (N = 73) 73 confirmed cases | Oura Ring Gen2 | - | Dermal temperature (from the palm side of the finger base every 60 s). Heart rate, heart rate variability and respiratory rate by extracting features from a photoplethysmogram (PPG) signal sampled at 250 Hz. Temperature | HR and HRV in the form of the root mean square of the successive differences in heartbeat intervals (RMSSD). HR, HRV, RR are calculated from inter-beat intervals (IBI), which are only available during periods of sleep. |
| Conroy et al. (2022) [23] | (N = 1543) 1415 and 128 cases in the negative and positive classes for COVID-19 respectively | Garmin (Fenix 6 or Vivoactive 4), Oura ring | Average of 62 days of service per participant,during sleep periods only | Heart rate ( beats per minute), interbeat interval ( milliseconds), respiratory rate ( breaths per minute), pulse oximetry (percent), skin temperature (Celsius), and accelerometer data. Symptoms | - |
| Hirten et al. (2022) [24] | (N = 49) 49 positive cases. Each day each subject is labeled as either; COVID+ if observation was made within ± 7 days of the patients first positive COVID-19 test, otherwise it is COVID- | Apple Watch Series 4 or higher | Subjects were asked to wear the Apple Watch for at least 8 hours per day | Heart rate variability (HRV). Demographic variables | HRV-amplitude, HRV-MESOR, HRV-acrophase, daily RHR, RHR-max, RHR-min, RHR-sd, RHR-mean |
| Jaiswal et al. (2022) [25] | (N = 4) 2 positive and 2 negative cases | wrist sensing device Empática E4 | The average duration of data obtained from each participant: aprox 100 hours across 15 days. | PPG at 64 Hz, electrodermal activity (EDA) at 4 Hz, 3-axis accelerometer at 32 Hz, heart rate (HR) at 4 Hz, and temperature data at 1 Hz | features comprising of time domain, frequency domain, wavelet transformed derivatives and hurst components. |
| Skibinska & Burget (2022) [26] | (N = 58) 21 cases of COVID19, 37 cases of non-COVID-19 influenza and Pre-COVID-19 cases were obtained | Fitbit | - | sleep, number of steps, heart rate | some common statistical measurements like mean, standard deviation, maximum, minimum, range, variance, likewise time-series specific parameters: Shannon entropy, approximate entropy, slope, skew, and kurtosis |
| Hijazi et al. (2021) [27] | (N = 186) 186 infected with COVID-19 | Fitbit, Garmin y Apple | - | HRV measures, daily textual records | Time-domain and frequency-domain features |
| Risch et al. (2022) [28] | (N = 66) 66 participants tested positive for COVID-19 | Ava-bracelet | Each participant had at least 29 consecutive days of data recorded using the bracelet | RR (breaths per minute), HR (beats per minute), HRV (ms), WST (°C) and skin perfusion. | two time-dependent and one frequency-dependent measurements: SD of the normal-to-normal interval (SDNN), root mean square of successive differences (RMSSD) and HRV ratio |
| Abir et al. (2022) [29] | (N = 25) 25 people tested positive for COVID. Four stages of COVID-19 infections are identified. For evaluation, only samples within the infectious period are considered anomalous. | Fitbit | - | Heart Rate and step count | The raw HR and steps are merged to derive the RHR. |
| Leitner et al. (2023) [33] | (N = 30) 30 patients who tested positive for COVID-19. Recovery and non-recovery cases. | Garmin Vivosmart4 | study duration of up to 3 months | Lifestyle features include activity (steps, distance, floors, active time, etc.), stress (average stress, max stress, stress duration, etc.), sleep timing (duration, bed time, up time), and sleep stages (deep, light, REM, awake). Heart rate and SpO2. Symptoms | - |
| Chung et al. (2023) [30] | (N = 32) 32 participants had COVID-19 confirmed and marked with the dates of symptoms and diagnosis | Fitbit | HR values and the number of steps were measured from February 2020 to June 2020 | HR values for each participant were retrieved at 15 s intervals on average. The number of steps was averaged every minute | Normalized HR values denoted by HRnorm and cumulative HR sum denoted by HRcsum. |
| Kang et al. (2023) [34] | (N = 50) Of 50 COVID-19 patients considered, 28 showed deterioration. | Garmin and mobiCARE+Temp MT100D Seer Patch | Data were collected for a maximum of 9 days and a minimum of 2 days | body temperature and heart rate per minute, respiratory rate per minute and oxygen saturation in pulses. Symptoms | Maximum temperature, Maximum respiratory rate, minimum respiratory rate, Minimum respiratory rate, cough, abdominal discomfort, heart rate median, constipation and minimum temperature |
| Abdel-Ghani et al. (2023) [31] | Not clear | Wristband and mobile application | - | body temperature, heart rate, SpO2 levels, and coughing sounds. | - |
| Natarajan et al. (2020) [32] | (N = 1257) 1257 symptomatic individuals. The 14 days from D -21 to day D -8 were considered as negative class examples, and the 7 days from D +1 to day D +7 as positive class examples. | Fitbit | - | Respiratory rate and heart rate. Age, sex and IMC. | Shannon entropy (non-linear time domain measurement, calculated using the histogram of RR intervals throughout the night). RMSSD (time domain measurement used to estimate vagally mediated changes. Heart rate during sleep is estimated from non-REM sleep only. Respiratory rate is estimated from deep sleep when possible and from light sleep in case deep sleep is insufficient. |
Table 4.
Performance of the Most Efficient Algorithm 1.
| Evaluation Metrics | |||||||||
|---|---|---|---|---|---|---|---|---|---|
| Article | Signal/Source of infa | Featureb | Most eff alg | Acc | Prec | F1-sc | Se | Sp | AUC |
| Evaluation Metrics | |||||||||
| Otoom et al. (2020) [15] | Symptoms, travel history, contacts | - | NN | 0.9289 | - | 0.929 | - | - | 0.955 |
| Sarwar et al. (2021) [16] | HR, steps, sleep | SD (std dev, Skewness, slope, min, max) | GB | - | 0.72 | 0.70 | 0.69 | 0.74 | 0.78 |
| Article | Population (N = N° of subjects) | Data acquisition | Variables | Feature extraction | |||||
| Wearable | Time | ||||||||
| Skibinska et al. (2021) [17] | HR, steps | FD (FFT mean coefficient, kurtois, max freq, min freq, median freq, rolloff, MFCC, spect skewness, spect slope). SD (histogram, min). TD (zero crossing rate) | kNN | 0.78 | - | - | 0.77 | 0.80 | - |
| Hassantabar et al. (2021) [18] | GSR, IBI, skin temperature, SpO2, blood pressure | Questionnaire | DNN | 0.981 | - | 0.982 | - | - | - |
| Gadaleta et al. (2021) [19] | Symptoms, HR, sleep | self-reported symp. | GB | - | - | - | 0.78 | 0.72 | 0.83 |
| Miller et al. (2020) [20] | ReR, HRV | RMSSD, mean intraindividual mean, sd of intraindividual means, mean intraindividual sd, sd of intraindividual sd, coefficient of variation | GB | - | - | - | 0.365 | 0.953 | - |
| Khaloufi et al. (2021) [21] | Symptoms | - | ANN | 0.79 | 0.86 | 0.884 | 0.91 | 0.43 | - |
| Mason et al. (2022) [22] | HRV, ReR, MET, Dermal Temperature | HR mean, HRVper75, IBIper75, RRper75, METper75, Tper75, PercentSleep1Day, TSleepMean3Day, TWakeMean3Day, TWakeStddev3Day, METWakeMean3Day | RF | - | - | - | 0.90 | 0.80 | 0.819 |
| Conroy et al. (2022) [23] | HR, ReR | max, min, median, mean, sd, IQR | RATE | - | - | - | - | - | 0.82 |
| Hirten et al. (2022) [24] | HRV | HRV-amplitude, HRV-MESOR, HRV-acrophase, RHRmax, RHRmin, RHRsd, RHRmean | GB | 0.772 | - | - | 0.817 | 0.772 | 0.864 |
| Jaiswal et al. (2022) [25] | HR, PPG | TD and FD | RF | 0.8998 | - | - | 0.7862 | 0.9545 | - |
| Article | Population (N = N° of subjects) | Data acquisition | Variables | Feature extraction | |||||
| Wearable | Time | ||||||||
| Skibinska & Burget (2022) [26] | sleep, steps, HR | mean, sd, max, min, range, variance, Shannon Ent, Ap Ent, slope, skew, kurtois | SVM | 0.86 | - | - | 0.96 | 0.68 | - |
| Hijazi et al. (2021) [27] | HRV | TD and FD (BPM, meanRR, SDNN, RMSSD, pNN50, HF, LF, LF/HF) | SVM | 0.8334 | 0.91 | 0.89 | 0.88 | - | 0.938 |
| Risch et al. (2022) [28] | ReR, HR, HRV | TD | LSTM | - | 0.54 | 0.60 | 0.68 | - | - |
| Abir et al. (2022) [29] | HR, steps | RHR sequence | LSTM | - | 0.946 | - | 0.234 | - | - |
| Leitner et al. (2023) [33] | steps, sleep, HR, stress, SpO2, | sleep duration (deep, rem, total, light), RHR, rest stress duration, floors climbed, min HR, average HR, mean SPO2 | RF | 0.82 | - | 0.88 | 0.89 | 0.63 | - |
| Chung et al. (2023) [30] | HR | HRnorm, HRcsum | DL | 0.8485 | - | - | 0.8438 | 0.8525 | 0.8778 |
| Kang et al. (2023) [34] | temperature, HR, ReR, SpO2 | Average temperature, ReRmax, ReR min, HR median, HR max, min temperature | XGB | 0.967 | - | - | 0.974 | 0.962 | 0.994 |
| Abdel-Ghani et al. (2023) [31] | HR, SpO2, coughing sounds | Mel-Spectrograms | CNN-LSTM | 0.92 | 0.92 | 0.91 | 0.91 | - | - |
| Natarajan et al. (2020) [32] | ReR, RR, HR, sleep | TD (Shannon En, RMSSD) | CNN | - | - | - | - | - | 0.77 |
1 HR = heart rate; ReR = respiratory rate; SpO2 = oxygen saturation; GSR = Galvanic Skin Response; PPG = photoplethysmography; MET = metabolic equivalents; 2 TD = Temporal Domain; FD = Frequency Domain; SD = Statistical domain; RMSSD = root mean square of successive differences; SDNN = standard deviation of normal-to-normal RR intervals; BPM = beats per minute; Meanrr = mean RR interval; HF = high frequency within the range of 0.15 to 0.40 Hz; LF = low frequency within the range of 0.04 to 0.15 Hz; pNN50 = percentage of RR differences >50 ms; sd = standard deviation; IQR = inter-quartile range; HRnorm = normalized heart rate; HRVper75 = 75th percentile of HRV samples in a 30-min interval (sleep only); IBIper25 = 25th percentile of IBI samples in a 30-min interval (sleep only); RRper75 = 75th percentile of RR samples in a 30-min interval (sleep only); METper75 = 75th percentile of MET samples in a 30-min interval; Tper75 = 75th percentile of dermal temperature samples in a 30-min interval; PercentSleep1Day = Moving average of data samples classified as sleep in a 1-day window (updated every 30 min); TSleepMean3Day = Moving average of Tper75 during asleep states only, over a 3-day window (updated every 30 min); TWakeMean3Day = Moving average of Tper25 during awake state only, over a 3-day window (updated every 30 min); TWakeStddev3Day = Moving standard deviation of Tper25 during awake state over a 3-day window (updated every 30 min); METWakeMean3Day = Moving average of METper75 during awake state over a 3-day window (updated every 30 min); HRnorm = normalized HR values; HRcsum = cumulative sum of heart rate; Auto-corr = automatic correlation; MADiff = mean absolute differences; Mean Diff = mean of differences; MAD = median absolute differences; Shan Ent = Shannon entropy; Ap Ent = Approximate entropy; RHR = daily resting heart rate.
Table 5.
Signal used in the selected studies.
| Features used | References | Number of publications |
|---|---|---|
| Heart rate | [16,17,19,20,22,23,24,25,26,27,28,29,30,33,34,35] | 16 |
| Respiratory rate | [22,23,28,34,35] | 5 |
| Steps | [16,17,19,26,29,33] | 6 |
| Sleep | [16,17,19,26,29,33,34] | 7 |
| Oxygen saturation | [18,23,33,34,35] | 5 |
| Symptoms and illnesses reported | [15,18,19,21,23,33] | 6 |
| Data of the subject (age, sex, race,...) | [19,24,35] | 3 |
Disclaimer/Publisher’s Note: The statements, opinions and data contained in all publications are solely those of the individual author(s) and contributor(s) and not of MDPI and/or the editor(s). MDPI and/or the editor(s) disclaim responsibility for any injury to people or property resulting from any ideas, methods, instructions or products referred to in the content. |
© 2026 by the authors. Licensee MDPI, Basel, Switzerland. This article is an open access article distributed under the terms and conditions of the Creative Commons Attribution (CC BY) license (http://creativecommons.org/licenses/by/4.0/).
Copyright: This open access article is published under a Creative Commons CC BY 4.0 license, which permit the free download, distribution, and reuse, provided that the author and preprint are cited in any reuse.


