Submitted:
05 February 2026
Posted:
06 February 2026
You are already at the latest version
Abstract
This study proposes an adaptive spatiotemporal graph contrastive learning model to address the challenges of anomaly detection in cloud service systems under highly dynamic topologies, complex dependencies, and multi-source heterogeneous monitoring data. The model constructs a dynamic spatiotemporal dependency graph to achieve adaptive modeling of structural relationships among service nodes and incorporates temporal encoding to capture multi-scale temporal variations, thereby achieving joint spatiotemporal feature representation. It consists of three main components: adaptive graph construction, spatiotemporal feature encoding, and contrastive learning optimization, which together enhance anomaly identification in an unsupervised manner through feature aggregation and discrimination. First, a learnable adjacency matrix is generated based on the dynamic correlations among service metrics to reflect the evolution of service dependencies. Then, structural and temporal features are jointly extracted through the integration of graph convolution and recurrent neural units, forming representations that are globally consistent and locally sensitive. Finally, an InfoNCE-based contrastive loss function is introduced to strengthen the aggregation of normal samples and the separation of anomalous ones in the latent space, improving model robustness and generalization. Experiments conducted on real cloud monitoring data include multi-dimensional comparisons and sensitivity analyses covering key factors such as time window length, attention head number, node failure ratio, and anomaly sample ratio. The results show that the proposed method outperforms existing baseline models in accuracy, precision, recall, and F1-Score, maintaining high detection accuracy and stable performance in complex cloud environments and providing an efficient and robust solution for anomaly identification and intelligent operation in large-scale distributed systems.
Keywords:
adaptive spatiotemporal graph
; contrastive learning
; cloud service anomaly detection
; temporal series modeling
I. Introduction
Cloud service systems serve as an essential infrastructure that supports large-scale distributed computing, data storage, and intelligent applications. With the deep integration of cloud computing into enterprise production, financial services, smart cities, and artificial intelligence, the complexity and dynamics of system operations have increased significantly[1]. A cloud platform is typically composed of thousands of heterogeneous nodes, virtual instances, and multi-layered service components, where services maintain dense dependencies and time-varying interactions. Any local anomaly may quickly propagate along dependency chains, leading to cascading failures or even system crashes[2]. Therefore, how to achieve rapid identification and localization of anomalies in high-dimensional, multi-source, and dynamically correlated environments has become a core scientific problem in intelligent operations and reliability assurance. Traditional threshold-based or rule-driven detection methods cannot adapt to nonlinear patterns and temporal dependencies in complex scenarios, and they fail to effectively handle challenges brought by highly dynamic workloads, resource contention, and distribution shifts[3].
In cloud environments, anomaly detection is not limited to the health of individual nodes but also directly affects overall system stability and service quality. With the widespread adoption of microservice and containerized architectures, service granularity becomes finer, and invocation chains grow increasingly complex. Anomalous signals often exhibit both spatial coupling and temporal delays. System monitoring data is multi-dimensional, including CPU utilization, memory consumption, network latency, I/O rate, and log information. Strong spatiotemporal dependencies exist among these indicators. Modeling with a single dimension or static features often fails to capture hidden cross-dimensional interactions, leading to delayed or inaccurate detection results. At the same time, noise, missing values, and uneven distributions are common in the data, which further increase uncertainty in anomaly detection[4]. Under conditions of dynamic topology and non-stationary time series, how to construct spatiotemporal models with adaptive perception capability to effectively characterize inter-service correlations and anomaly propagation paths remains a key challenge.
In recent years, the introduction of graph structures has provided a new perspective for modeling complex systems. Cloud service systems naturally possess graph-topological properties, where nodes represent service instances and edges describe invocation dependencies or communication links. Graph-based modeling approaches can directly reflect structural dependencies among services and provide a foundation for anomaly propagation modeling and root-cause localization[5]. However, static graphs are limited in describing the dynamic evolution of service relationships. In real-world operations, service dependencies change with workload, deployment strategies, and network conditions, making traditional graph structures less effective over time. Moreover, temporal modeling must capture multi-scale variation patterns, as cloud service data often show both bursty and periodic characteristics. Time-series models alone tend to overlook structural constraints, while graph-only models fail to represent temporal evolution. Therefore, the integration of temporal and spatial relationships has become a necessary direction to address the complexity of cloud service anomaly detection.
Against this background, contrastive learning offers new opportunities for unsupervised feature extraction and robust representation. In cloud monitoring data, anomaly samples are scarce, and labeling costs are high. Traditional supervised learning approaches are limited by such constraints. Contrastive learning constructs positive and negative sample pairs to maximize similarity among normal states and minimize differences between potential anomalies, thus achieving self-supervised representation learning. This mechanism enhances model generalization under distribution shifts and noise interference. However, applying contrastive learning to spatiotemporal data remains challenging. The dependency structures across different time scales vary greatly, and spatial topologies evolve continuously. Defining reasonable contrastive objectives and sampling strategies on dynamic graphs is the core problem in adaptive spatiotemporal contrastive learning. By combining adaptive graph construction with spatiotemporal feature alignment mechanisms, it becomes possible to automatically learn stable feature representations of cloud services without relying on large labeled datasets, leading to more accurate anomaly identification.
The significance of this study lies in providing a new modeling perspective for the intelligent operation of cloud systems under complex spatiotemporal dependencies and high uncertainty. By introducing adaptive spatiotemporal graph structures and contrastive learning mechanisms, the proposed approach establishes a unified representation framework between global structure and local dynamics. It enables efficient anomaly pattern capture and automatic modeling of evolutionary behaviors. This work contributes to improving the reliability and interpretability of cloud services and provides theoretical support for anomaly perception, performance prediction, and resource scheduling in distributed systems. More broadly, it promotes the integration of spatiotemporal graph modeling, contrastive learning, and adaptive feature representation in complex systems. The proposed framework offers a scalable solution for anomaly detection in large-scale heterogeneous data environments and holds significant scientific and practical value for achieving high availability and autonomy in cloud platforms.
II. Related Work
Existing studies on cloud service anomaly detection can be broadly divided into three categories: statistical analysis, machine learning, and deep learning methods. Early statistical approaches often relied on threshold judgments and distributional assumptions. They identified abnormal points by modeling the mean, variance, or probability distribution of system indicators. However, the non-stationary and highly dynamic nature of cloud environments makes fixed thresholds difficult to adapt to changing system states, leading to frequent false alarms and missed detections. Some improved methods introduced sliding windows or dynamic threshold mechanisms to mitigate temporal fluctuations, but these still depended on manually defined rules and had limited ability to model complex dependencies. As system scale expands and indicator dimensions increase, traditional statistical methods struggle to capture nonlinear dependencies and cross-service correlations among multiple variables, restricting their applicability in large-scale cloud environments[6].
The introduction of machine learning methods has significantly improved the automation of anomaly detection. Common approaches include clustering, principal component analysis, support vector machines, isolation forests, and Gaussian mixture models. These methods learn normal behavior patterns from historical data and detect samples that deviate from the learned distribution in feature space. Compared with rule-based approaches, machine learning techniques offer stronger capabilities for capturing complex patterns and high-dimensional feature relationships. However, cloud platform data are often multi-source and heterogeneous. Services are interdependent in both space and time, violating the assumption of independent and identically distributed data. As a result, traditional machine learning models show limited generalization and robustness. Moreover, such methods usually assume data stationarity, while cloud services undergo dynamic scheduling, resource migration, and load balancing, which continuously alter operational states and hinder stable detection performance[7].
With the development of deep learning, neural network-based anomaly detection has become a dominant direction. Recurrent neural networks, convolutional neural networks, and autoencoders have been widely applied to model time-series and multidimensional monitoring data, learning high-level feature representations. Temporal models can capture long-term dependencies, convolutional structures extract local patterns, and autoencoders perform unsupervised detection through reconstruction errors. Recent studies further introduce attention mechanisms and spatiotemporal fusion structures to better model dependencies across indicators and services. However, most deep models still rely on fixed structural assumptions and lack adaptive capability to cope with dynamic changes in cloud service topologies. This limitation makes them less effective when service relationships or communication topologies change frequently. In addition, deep learning models depend heavily on labeled data, while labeled anomalies in cloud services are extremely scarce. This data scarcity creates a major bottleneck for supervised training in real-world scenarios.
Building upon this, the integration of graph neural networks and contrastive learning has opened new directions for cloud service anomaly detection. Graph neural networks capture structural dependencies and information propagation among services through node-edge interactions, providing structured support for anomaly propagation modeling and root-cause localization. However, most graph-based studies assume static topologies, which cannot effectively describe the time-varying nature of service dependencies. On the other hand, contrastive learning, as a self-supervised mechanism, learns robust feature representations by enforcing similarity constraints among samples without relying on labeled data. In dynamic spatiotemporal environments, however, the relationships between positive and negative samples change with time and topology evolution, making it difficult to maintain consistent contrastive objectives. Therefore, achieving spatiotemporal adaptive contrastive learning on dynamic service graphs-while preserving global structural consistency and capturing local evolutionary features-has become a key research problem. The adaptive spatiotemporal graph contrastive learning framework is proposed to address this challenge by integrating graph structural modeling, temporal dynamics capture, and self-supervised feature learning, aiming to achieve efficient, robust, and scalable anomaly detection for complex cloud service systems.
III. Proposed Framework
A. General Introduction
This study proposes a cloud service anomaly detection framework based on adaptive spatiotemporal graph contrastive learning, aiming to automatically extract robust structured features from high-dimensional, multi-source, and time-varying cloud system monitoring data and achieve efficient identification of anomaly patterns. The overall model structure consists of three parts: an adaptive spatiotemporal graph construction module, a spatiotemporal feature encoding module, and a contrastive learning optimization module. First, a time-varying graph structure is dynamically constructed using the correlation between monitoring indicators to capture the dependency evolution between service nodes. Second, deep feature representations of service nodes in the spatiotemporal dimension are extracted by fusing time series and graph convolution mechanisms. Finally, aggregation and separation within the feature space are achieved through a self-supervised contrastive loss function, thereby learning discriminative representations of abnormal and normal states under unlabeled conditions. The overall model can be formalized as an end-to-end trainable function:
where represents the node feature matrix at time t, represents the adaptive adjacency matrix, is the corresponding spatiotemporal embedding representation, and is the model parameter set. This framework jointly optimizes spatial structure and temporal dynamic features under a unified comparison objective, achieving unsupervised learning in the anomaly detection process. Its overall model architecture is shown in Figure 1.
B. Adaptive Spatiotemporal Graph Construction
In cloud service systems, the dependencies between service nodes change dynamically over time, thus requiring the construction of an adjacency matrix that reflects these time-varying characteristics. First, based on the multidimensional feature similarity between nodes, an initial correlation matrix is calculated:
Here, represents the observation vector of node i at time t. To obtain a sparse and adaptive graph structure, a learnable weight matrix is introduced, and the dynamic adjacency matrix is obtained through the Softmax function:
This adaptive graph structure not only captures the correlation strength between different services but also adjusts the connection patterns over time to characterize the evolutionary features of system dependencies. Based on this, the joint propagation of spatiotemporal information can be achieved through graph convolution operations, with the update form as follows:
where is the representation of the l-th layer node, is the corresponding learnable parameter matrix, and is the activation function.
C. Spatiotemporal Feature Encoding and Contrastive Learning Mechanism
To further capture the dynamic changes in service state, the model introduces a gated recurrent unit (GRU) in the time dimension for feature sequence modeling. Its state update equation is:
Here, and are the update gate and reset gate, respectively, and is the learnable parameter. By alternately stacking graph convolutions and recurrent units, the model can simultaneously capture structural dependencies and temporal evolution features, thus obtaining a fused spatiotemporal representation:
In the feature space learning stage, to enhance robustness and discriminativeness, a spatiotemporal contrastive learning objective based on InfoNCE is introduced. Let positive sample pairs be embeddings of the same service in different time windows, and negative sample pairs are representations of other service nodes. Then, the contrastive loss function is defined as:
Here, represents cosine similarity, and is the temperature coefficient. By minimizing this loss, the model enhances the aggregation characteristics among normal samples in the latent space and explicitly separates the embedding distribution of abnormal samples, providing a robust spatiotemporal feature foundation for subsequent anomaly detection.
IV. Experimental Analysis
A. Dataset
This study used the publicly available Azure 2020 Cloud Service Dataset as the primary data source. The dataset was collected by a large cloud platform and includes operational monitoring information from different geographic regions and multiple service layers. It contains multidimensional indicators such as CPU utilization, memory usage, disk I/O, network bandwidth, invocation latency, and request throughput. The data sampling frequency is one record per minute, and the total recording period exceeds three months. In total, the dataset includes approximately 120 million monitoring logs, providing a comprehensive reflection of the operational dynamics of cloud services in real-world environments. Its multidimensional nature and high temporal density offer strong support for spatiotemporal feature extraction.
To better evaluate the applicability of the model in complex systems, this study selected 50 representative service nodes from the dataset for analysis. These nodes cover core modules such as computing, storage, and networking. Each node contains multiple performance indicators with corresponding timestamp sequences. Some samples are also annotated with anomaly event types, including resource overload, communication interruption, and latency anomalies. Through joint analysis of these nodes, the model can learn service dependencies and anomaly propagation patterns, providing a realistic foundation for subsequent spatiotemporal graph modeling and contrastive learning.
During data preprocessing, standardization and missing value imputation were performed to ensure feature comparability and temporal continuity. All time series were segmented using a sliding window mechanism and processed with normalization and differencing to reduce trend effects. In addition, to facilitate graph structure construction, adjacency matrices were dynamically generated based on inter-node indicator correlations to reflect time-varying dependencies among services. The dataset's multi-source heterogeneity and high dynamism make it an ideal benchmark for evaluating the effectiveness and robustness of the adaptive spatiotemporal graph contrastive learning model in cloud service anomaly detection.
B. Experimental Results
This paper first conducts a comparative experiment, and the experimental results are shown in Table 1.
Overall, the comparative experiments shown in Table 1 clearly demonstrate the significant advantages of the proposed adaptive spatiotemporal graph contrastive learning model in cloud service anomaly detection tasks. Compared with traditional sequence modeling methods such as LSTM and BiLSTM, the proposed model achieves substantial improvements in both accuracy and recall. This indicates that time-series-based one-dimensional modeling alone can no longer fully capture the complex multidimensional dependencies in cloud environments. By introducing a spatiotemporal graph structure, the model can identify correlations among service nodes while tracking temporal dynamics, effectively alleviating the performance degradation caused by distribution shifts and workload fluctuations.
From the perspective of spatial dependency modeling, graph-based methods such as GNN and GAT can capture certain topological information but remain limited by the assumption of static graphs. They cannot effectively represent the dynamic evolution of service dependencies. In contrast, the proposed model adopts a dynamic updating mechanism for adaptive adjacency matrices, enabling the graph structure to self-adjust over time. This allows the model to maintain robustness in multi-service interaction and resource competition scenarios. In the experimental results, the model achieves a recall rate of 0.951, indicating stronger sensitivity and generalization in identifying anomalous samples and effectively reducing missed detections in complex cloud environments.
In addition, compared with general deep representation models such as Transformer and BERT, the proposed adaptive spatiotemporal graph contrastive learning method achieves a balance between global dependency modeling and feature consistency. Although Transformer-based models have strong capabilities in capturing temporal dependencies, they lack structural adaptability in highly dynamic topologies. The proposed design enhances the aggregation of normal states and the separability of abnormal states through spatiotemporal contrastive constraints and unsupervised representation optimization. As a result, the model achieves the highest F1-Score of 0.953. These results verify the effectiveness and stability of the fusion mechanism combining spatiotemporal graph structures and contrastive learning in cloud service anomaly detection tasks.
This paper further presents an experiment on the sensitivity of the number of attention heads to the F1-Score, aiming to explore how variations in the multi-head attention configuration influence the model's overall representational ability and detection stability. By adjusting the number of attention heads within the temporal–spatial feature fusion module, the experiment investigates the relationship between attention diversity and the model's capacity to capture critical dependencies across service nodes. The purpose of this analysis is to evaluate the robustness and adaptability of the proposed framework when balancing feature expressiveness and structural consistency under different attention configurations, as shown in Figure 2.
The experimental results show that the number of attention heads has a significant impact on the overall performance of the model. When the number of heads is small, such as one or two, the model's F1-Score is relatively low. The main reason is that the feature subspace of the multi-head attention mechanism is insufficient at this stage, making it difficult to capture the global dependency structure among cloud service monitoring indicators. Since cloud systems contain complex nonlinear coupling relationships between service nodes, a small number of attention heads limits the model's representational capacity during feature aggregation. This leads to overly concentrated feature information, causing information loss and reduced discriminative ability.
When the number of attention heads increases to a moderate level, such as four to six, the model performance improves significantly, and the F1-Score reaches its peak value of 0.953. This indicates that under this configuration, the multi-head attention mechanism achieves a better balance between feature decomposition and cross-dimensional information aggregation. It effectively captures spatiotemporal dependencies and enhances the model's expressive flexibility. At this stage, the model can capture both local abnormal fluctuation patterns and global correlations among nodes, improving the precision and recall of anomaly detection.
However, when the number of attention heads continues to increase, such as eight or ten, the model's performance slightly declines. This phenomenon suggests that too many attention heads may introduce feature redundancy and computational noise, leading to overly dispersed representations during information fusion and disrupting the inherent spatiotemporal consistency. In addition, redundant attention heads increase the parameter complexity of the model and cause a dilution effect in feature distribution, which weakens the separability of anomalous samples and reduces detection stability.
Overall, the experimental results indicate that setting an appropriate number of attention heads is crucial for maintaining model stability and generalization performance. In this framework, a moderate number of attention heads achieves a balance between sufficient feature representation and structural constraint. This allows the model to adaptively capture spatiotemporal dependencies among service nodes in dynamic cloud environments and maintain high detection accuracy and robustness under complex workload fluctuations. These findings further verify the effectiveness of the adaptive spatiotemporal graph contrastive learning mechanism in multi-scale feature modeling and anomaly pattern representation.
This paper also presents the effect of the temporal window size on the experimental results, as shown in Figure 3.
From the overall trend, it can be observed that the length of the time window has a clear influence on model performance. Smaller time windows, such as 4 or 8, can quickly capture short-term dynamic features, but their limited coverage makes it difficult for the model to integrate long-term dependencies effectively. As a result, the overall detection performance remains low. In this case, the model responds sensitively to local fluctuations but cannot model long-term trends, which leads to misjudgments in complex cloud environments. As the time window increases, the model gradually captures the evolution of abnormal behaviors over longer time spans and identifies potential temporal dependencies. Accordingly, accuracy and recall show a continuous upward trend.
When the time window increases to a moderate range, such as 12 to 16, the model achieves its best performance, with all four metrics reaching peak values. This result indicates that within this range, the model maintains a balance between short-term local fluctuations and long-term trend patterns. It can capture transient anomalies while understanding stable evolution under temporal dependencies. The improvement in both F1-Score and Recall is particularly evident, showing that the model achieves a good balance between the completeness and precision of anomaly detection. This characteristic aligns with the multi-scale dynamics of real-world cloud service systems, where anomalies may result from both short-term load bursts and long-term state drifts.
However, when the time window further expands to larger values, such as 20 or 24, the model performance slightly decreases. Excessively long time windows may introduce too much historical information, causing redundant or outdated dependencies in feature representations. This dilutes the critical features of the current state. Longer sequences also increase input noise and computational complexity, making it difficult for the model to distinguish between short-term anomalies and background changes. This phenomenon indicates that an overly long time window reduces the model's temporal sensitivity and weakens its ability to respond quickly in highly dynamic environments.
Overall, the analysis shows that selecting an appropriate time window length is crucial for cloud service anomaly detection. A moderate-length window provides the best balance of spatiotemporal features, enabling the adaptive spatiotemporal graph structure to more efficiently capture service dependencies and temporal evolution patterns. These experimental results further verify the adaptive advantages of the proposed model in multi-scale temporal modeling. They also provide theoretical support for introducing dynamic window optimization and self-adjustment mechanisms, offering practical guidance for performance transfer and deployment across different cloud system scenarios.
This paper also presents an experiment on the sensitivity of the node failure ratio to the F1-Score, and the experimental results are shown in Figure 4.
The experimental results show that as the node failure ratio increases, the model performance in all metrics gradually declines. This indicates that node availability has a direct impact on anomaly detection performance. When the node failure ratio is low, between 0% and 5%, the model still maintains high accuracy and recall. This demonstrates that the adaptive spatiotemporal graph structure has a certain level of robustness and can preserve the continuity of feature propagation even when some nodes fail. The stability observed at this stage reflects the model's effectiveness in capturing redundant structural information and adaptively adjusting the graph topology.
When the node failure ratio increases to a moderate level, between 10% and 15%, the model performance begins to drop more noticeably, particularly in F1-Score and Precision. The main reason is that the failure of several key nodes weakens the connectivity of the service dependency graph, which obstructs information transmission paths. This reduces the model's feature aggregation capability during graph convolution and temporal modeling. At the same time, the loss of node features disrupts the integrity of spatiotemporal dependencies, resulting in less effective feature representations in anomalous regions. This shows that at higher failure rates, the model becomes more sensitive to topological disturbances. The balance of feature propagation is broken, which leads to a significant decline in anomaly detection effectiveness.
When the node failure ratio exceeds 20%, the downward trend becomes more severe, and the F1-Score reaches its lowest point. At this stage, the system's graph structure is severely degraded. Spatiotemporal contrastive learning can no longer maintain effective feature alignment or semantic aggregation. The model's representation space drifts, and the boundary between anomalous and normal samples becomes blurred. These results confirm that the proposed adaptive mechanism can maintain stable performance within a limited failure range but remains constrained by topological fragmentation and information loss under large-scale node failures. Therefore, future work may incorporate graph repair or redundancy-aware modules to enhance the model's self-healing ability and spatiotemporal robustness under extreme distribution disturbances.
This paper also presents the impact of the proportion of outlier samples on the experimental results, and the experimental results are shown in Figure 5.
The experimental results show that the increase in the proportion of anomalous samples has a significant impact on model performance. All evaluation metrics show a continuous decline as the anomaly ratio increases. When the anomaly ratio is low, between 1% and 3%, the model maintains high accuracy, precision, and recall. This indicates that the proposed adaptive spatiotemporal graph contrastive learning model demonstrates good stability under small distribution perturbations. At this stage, the model can effectively learn the spatiotemporal dependency features of normal samples. Through self-supervised contrastive constraints, it can clearly distinguish between normal and abnormal behaviors, reflecting strong discriminative ability in low-noise environments.
As the anomaly ratio increases to a moderate level, between 5% and 10%, the model performance begins to decline noticeably, especially in F1-Score and Recall. This suggests that as the proportion of anomalous data grows, the structure of the feature space becomes disturbed, and the boundary between normal and abnormal samples becomes less distinct. The excessive presence of anomalous samples weakens the compactness of normal patterns, causing an imbalance in positive and negative sample pairs during contrastive learning and reducing the consistency of feature aggregation. Nevertheless, the model still maintains a relatively high level of precision, which shows that it retains a certain degree of resistance to interference through effective spatiotemporal feature fusion and structural adaptation.
When the anomaly ratio further increases beyond 15%, the overall model performance declines rapidly. Both accuracy and F1-Score drop sharply. At this point, anomalous data dominate the distribution, and the semantic features of normal samples are heavily diluted. This damages the topological consistency of the spatiotemporal graph structure and introduces noise into the information propagation paths. The model's performance degradation under this extreme imbalance indicates that, although the adaptive spatiotemporal mechanism can dynamically adjust dependency relationships, feature drift still occurs when anomalies dominate the distribution. The non-stationary distribution of anomalous samples may also disrupt the positive and negative sampling strategies in contrastive learning, significantly reducing the separability of the embedding space.
Overall, the experimental results demonstrate that the anomaly ratio plays a critical role in determining the robustness of cloud service anomaly detection models. A moderate proportion of anomalous samples can enhance the model's ability to learn anomaly patterns, while an excessively high ratio undermines the stability of the feature space. The proposed adaptive spatiotemporal graph contrastive learning mechanism can self-regulate within a certain range of anomaly ratios, maintaining good performance by strengthening spatiotemporal consistency in feature aggregation. These findings verify the model's practicality in handling complex distribution shifts and high-noise conditions and provide a theoretical foundation for future optimization strategies under imbalanced data scenarios.
V. Conclusions
This study addresses the challenges of high dynamism, strong coupling, and uncertainty in anomaly detection for cloud service systems by proposing an adaptive spatiotemporal graph contrastive learning framework. The method dynamically constructs time-varying dependency graphs to effectively capture the evolving topological relationships among service nodes. It further integrates a spatiotemporal joint encoding mechanism to achieve multi-scale feature fusion and representation. Compared with traditional static graph models or single time-series approaches, the proposed framework maintains both global consistency and local sensitivity across structural and temporal dimensions. This significantly improves detection accuracy and stability under complex operational conditions. Experimental results show that the proposed method outperforms existing models across multiple key metrics, confirming its robustness and generalization ability in high-dimensional and heterogeneous cloud data environments.
The findings also highlight the potential value of combining spatiotemporal structural modeling with self-supervised representation learning in intelligent cloud operations. By introducing a contrastive learning mechanism, the model can learn the normal behavioral distribution of service systems without supervision, enabling automatic differentiation and adaptive recognition of anomalies. This mechanism not only reduces the cost of manual labeling but also provides a new perspective for the efficient utilization of high-dimensional monitoring data. The proposed framework integrates resource metrics, invocation chain context, and system log information under multi-source input conditions, offering theoretical support for anomaly propagation analysis and root-cause localization in complex service architectures. This dynamic learning approach, combining graph structures and time-series modeling, extends the application boundaries of anomaly detection in intelligent operation, resource scheduling, and reliability management.
From a system perspective, the proposed method exhibits strong scalability and general applicability across various distributed computing scenarios. Its core concept lies in modeling system state changes through adaptive spatiotemporal graphs, allowing the model to dynamically respond to node failures, network delays, and workload fluctuations. Unlike traditional methods that depend on fixed topologies or static features, this research achieves a shift from local anomaly detection to global anomaly pattern recognition through structure-aware graph modeling and temporal adaptation mechanisms. This feature provides a theoretical foundation for autonomous monitoring and intelligent decision-making in future cloud platforms and establishes a model-level technical framework for building reliable and self-learning operation systems.
Future research can be extended in several directions. One direction is to explore federated or distributed contrastive learning strategies based on adaptive spatiotemporal graphs to address data isolation problems across data centers or multi-tenant environments. Another is to integrate generative modeling and causal inference mechanisms to construct interpretable models of anomaly evolution, thereby revealing the formation paths and underlying patterns of service failures. In addition, incorporating large-scale pretraining and reinforcement learning-based dynamic optimization methods may further enhance model adaptability in real-time monitoring and multi-objective optimization scenarios. Overall, this study not only provides a new paradigm for anomaly detection in cloud service systems but also points to promising directions for the future development of intelligent operations and self-learning systems.
References
- Zheng, Y; Koh, H Y; Jin, M; et al. Correlation-aware spatial–temporal graph learning for multivariate time-series anomaly detection[J]. IEEE transactions on neural networks and learning systems 2023, 35(9), 11802–11816. [Google Scholar] [CrossRef] [PubMed]
- Ding, C; Sun, S; Zhao, J. MST-GAT: A multimodal spatial–temporal graph attention network for time series anomaly detection[J]. Information Fusion 2023, 89, 527–536. [Google Scholar] [CrossRef]
- Chen, B. FlashServe: Cost-Efficient Serverless Inference Scheduling for Large Language Models via Tiered Memory Management and Predictive Autoscaling. 2025. [Google Scholar]
- Zhang, Z; Zhu, Z; Xu, C; et al. Towards accurate anomaly detection for cloud system via graph-enhanced contrastive learning[J]. Complex & Intelligent Systems 2025, 11(1), 23. [Google Scholar]
- Yang, J.; Chen, J.; Huang, Z.; Xu, C.; Zhang, C.; Li, S. Cost-TrustFL: Cost-Aware Hierarchical Federated Learning with Lightweight Reputation Evaluation across Multi-Cloud. arXiv arXiv:2512.20218, 2025.
- He, S; He, W; Du, M; et al. GDCMAD: Graph-based dual-contrastive representation learning for multivariate time series anomaly detection[J]. Information Sciences 2025, 122790. [Google Scholar] [CrossRef]
- Govindarajan, V; Muzamal, J H. Advanced cloud intrusion detection framework using graph based features transformers and contrastive learning[J]. Scientific Reports 2025, 15(1), 20511. [Google Scholar] [CrossRef] [PubMed]
- Liu, H.; Kang, Y.; Liu, Y. Privacy-Preserving and Communication-Efficient Federated Learning for Cloud-Scale Distributed Intelligence. In Proceedings of the 2025 6th International Conference on Machine Learning and Computer Application (ICMLCA), 2025; pp. 830–834. [Google Scholar]
- Lyu, N.; Chen, F.; Zhang, C.; Shao, C.; Jiang, J. Deep Temporal Convolutional Neural Networks with Attention Mechanisms for Resource Contention Classification in Cloud Computing". 2025. [Google Scholar] [CrossRef]
- Zhao, M; Peng, H; Li, L; et al. Graph attention network and informer for multivariate time series anomaly detection[J]. Sensors 2024, 24(5), 1522. [Google Scholar] [CrossRef] [PubMed]
- Chen, H; Chen, P; Wang, B; et al. Graph neural network based robust anomaly detection at service level in SDN driven microservice system[J]. Computer Networks 2024, 239, 110135. [Google Scholar] [CrossRef]
- Liu, F. Intelligent Cloud Service Anomaly Monitoring via Uncertainty Estimation and Causal Graph Inference; 2024. [Google Scholar]
- Qiu, Z. A Multi-Scale Deep Learning and Uncertainty Estimation Framework for Comprehensive Anomaly Detection in Cloud Environments; 2023. [Google Scholar]
Figure 1.
Overall model architecture.
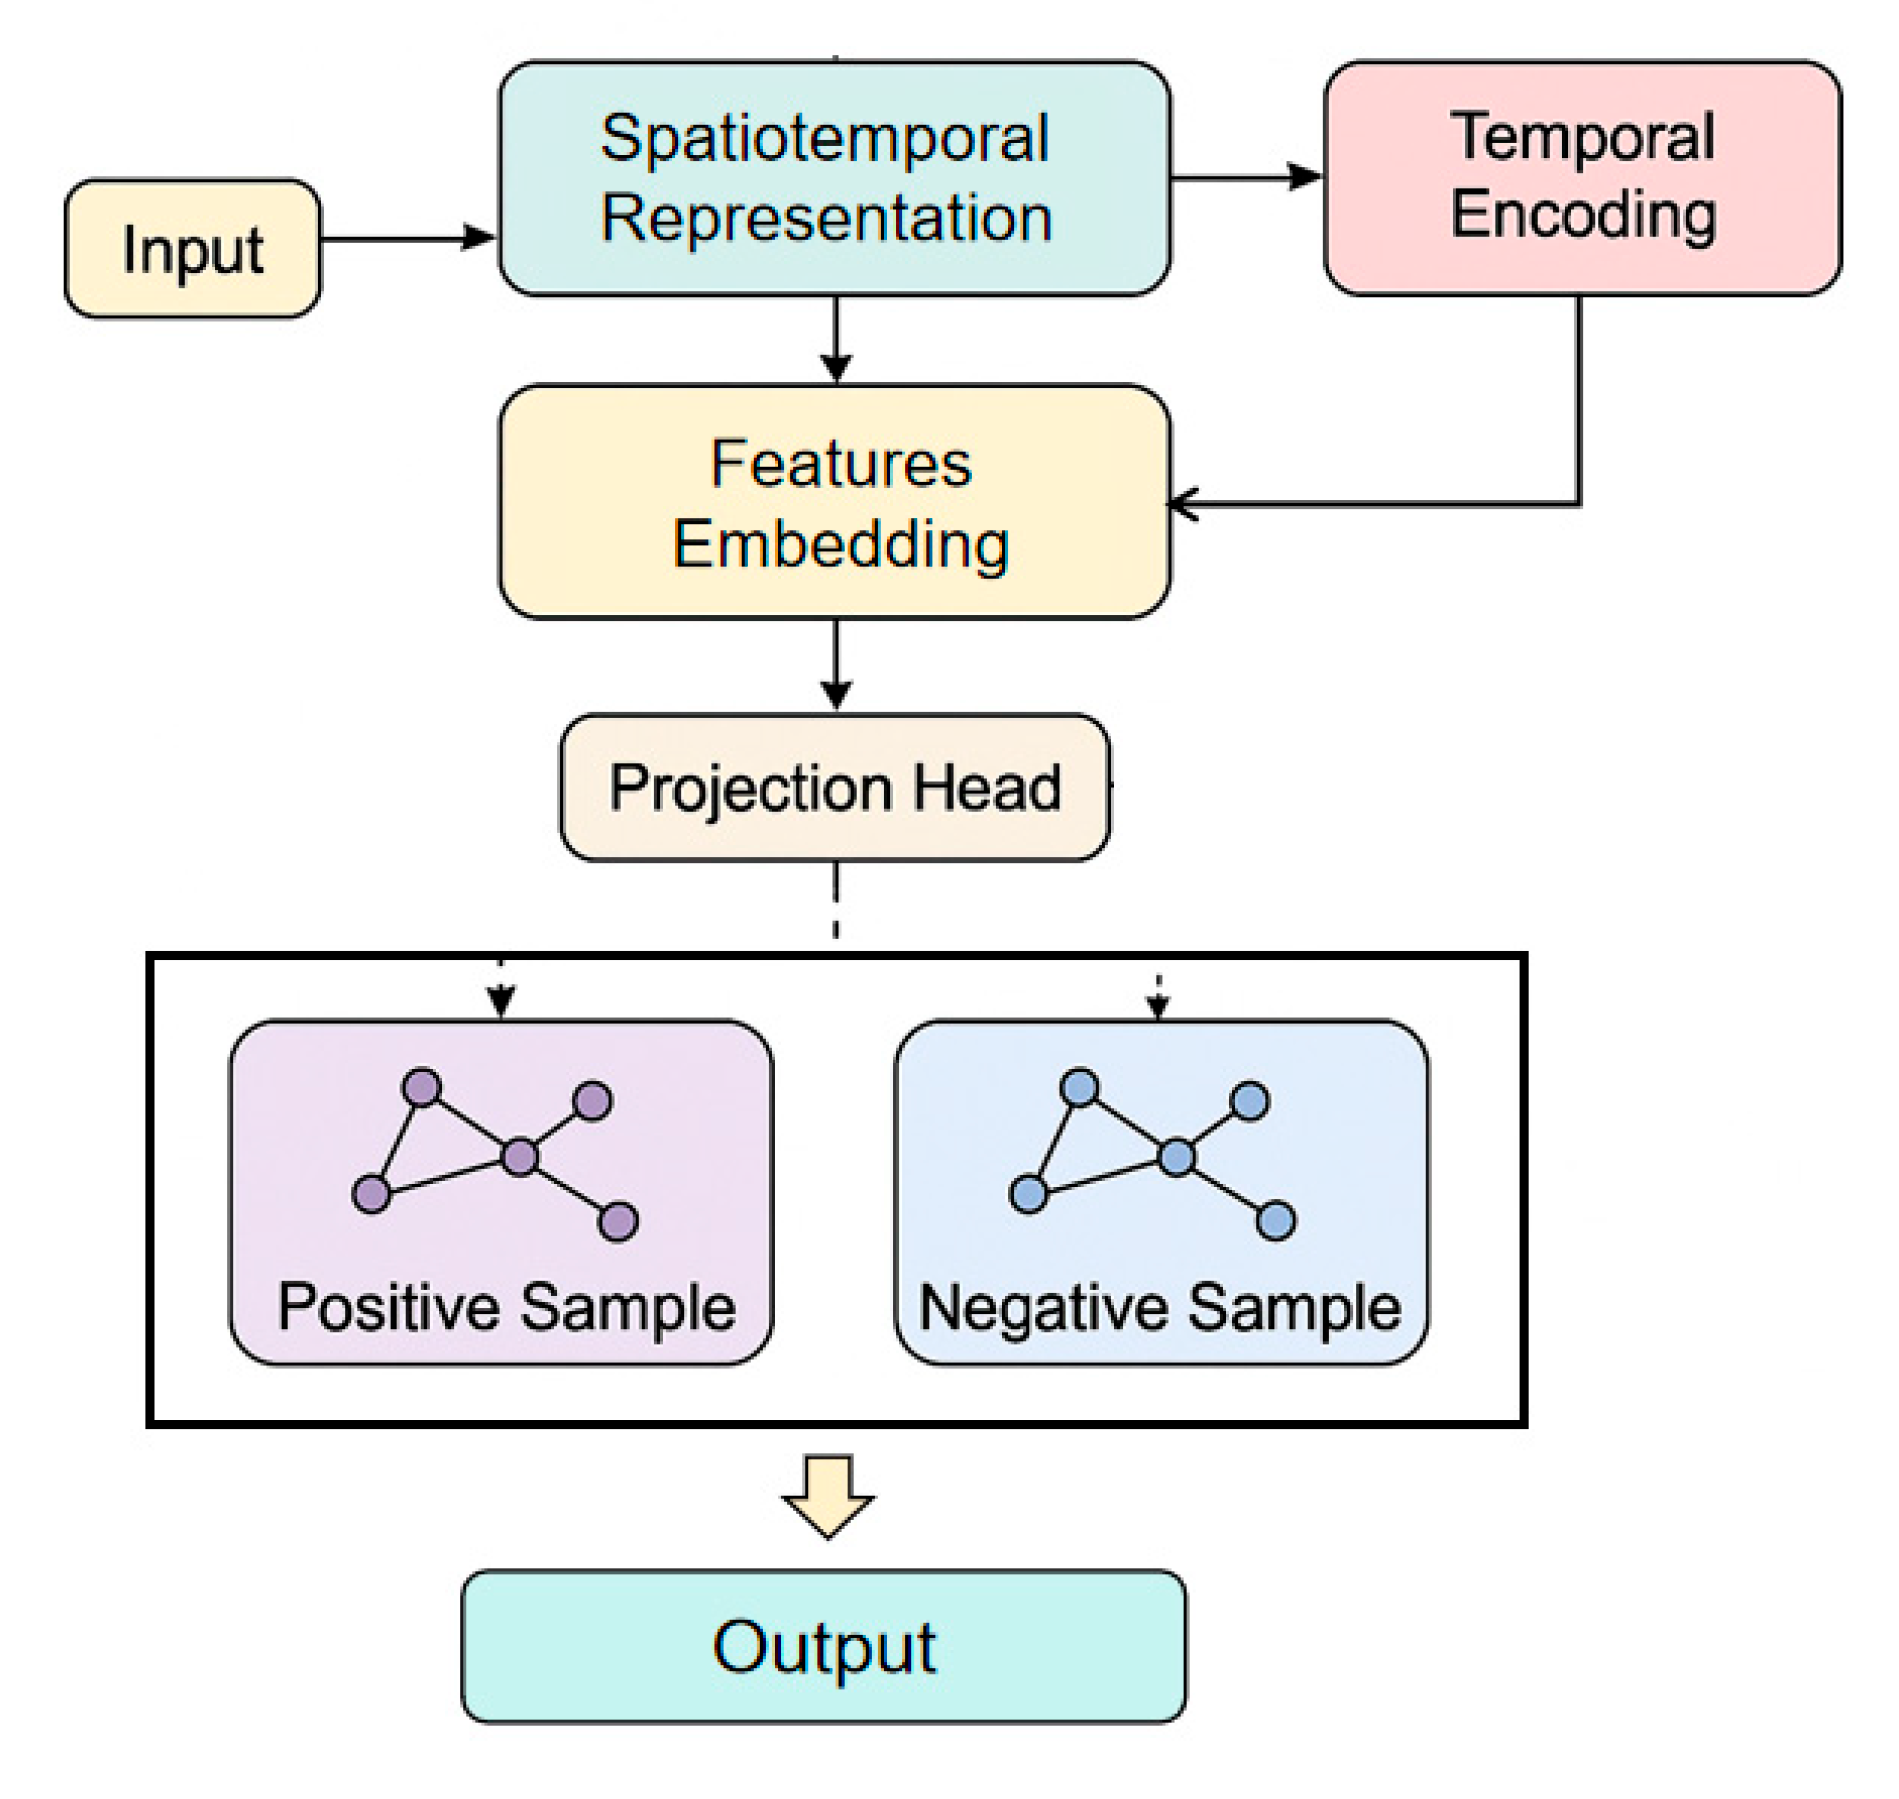
Figure 2.
Sensitivity experiment of attention heads to F1-Score.
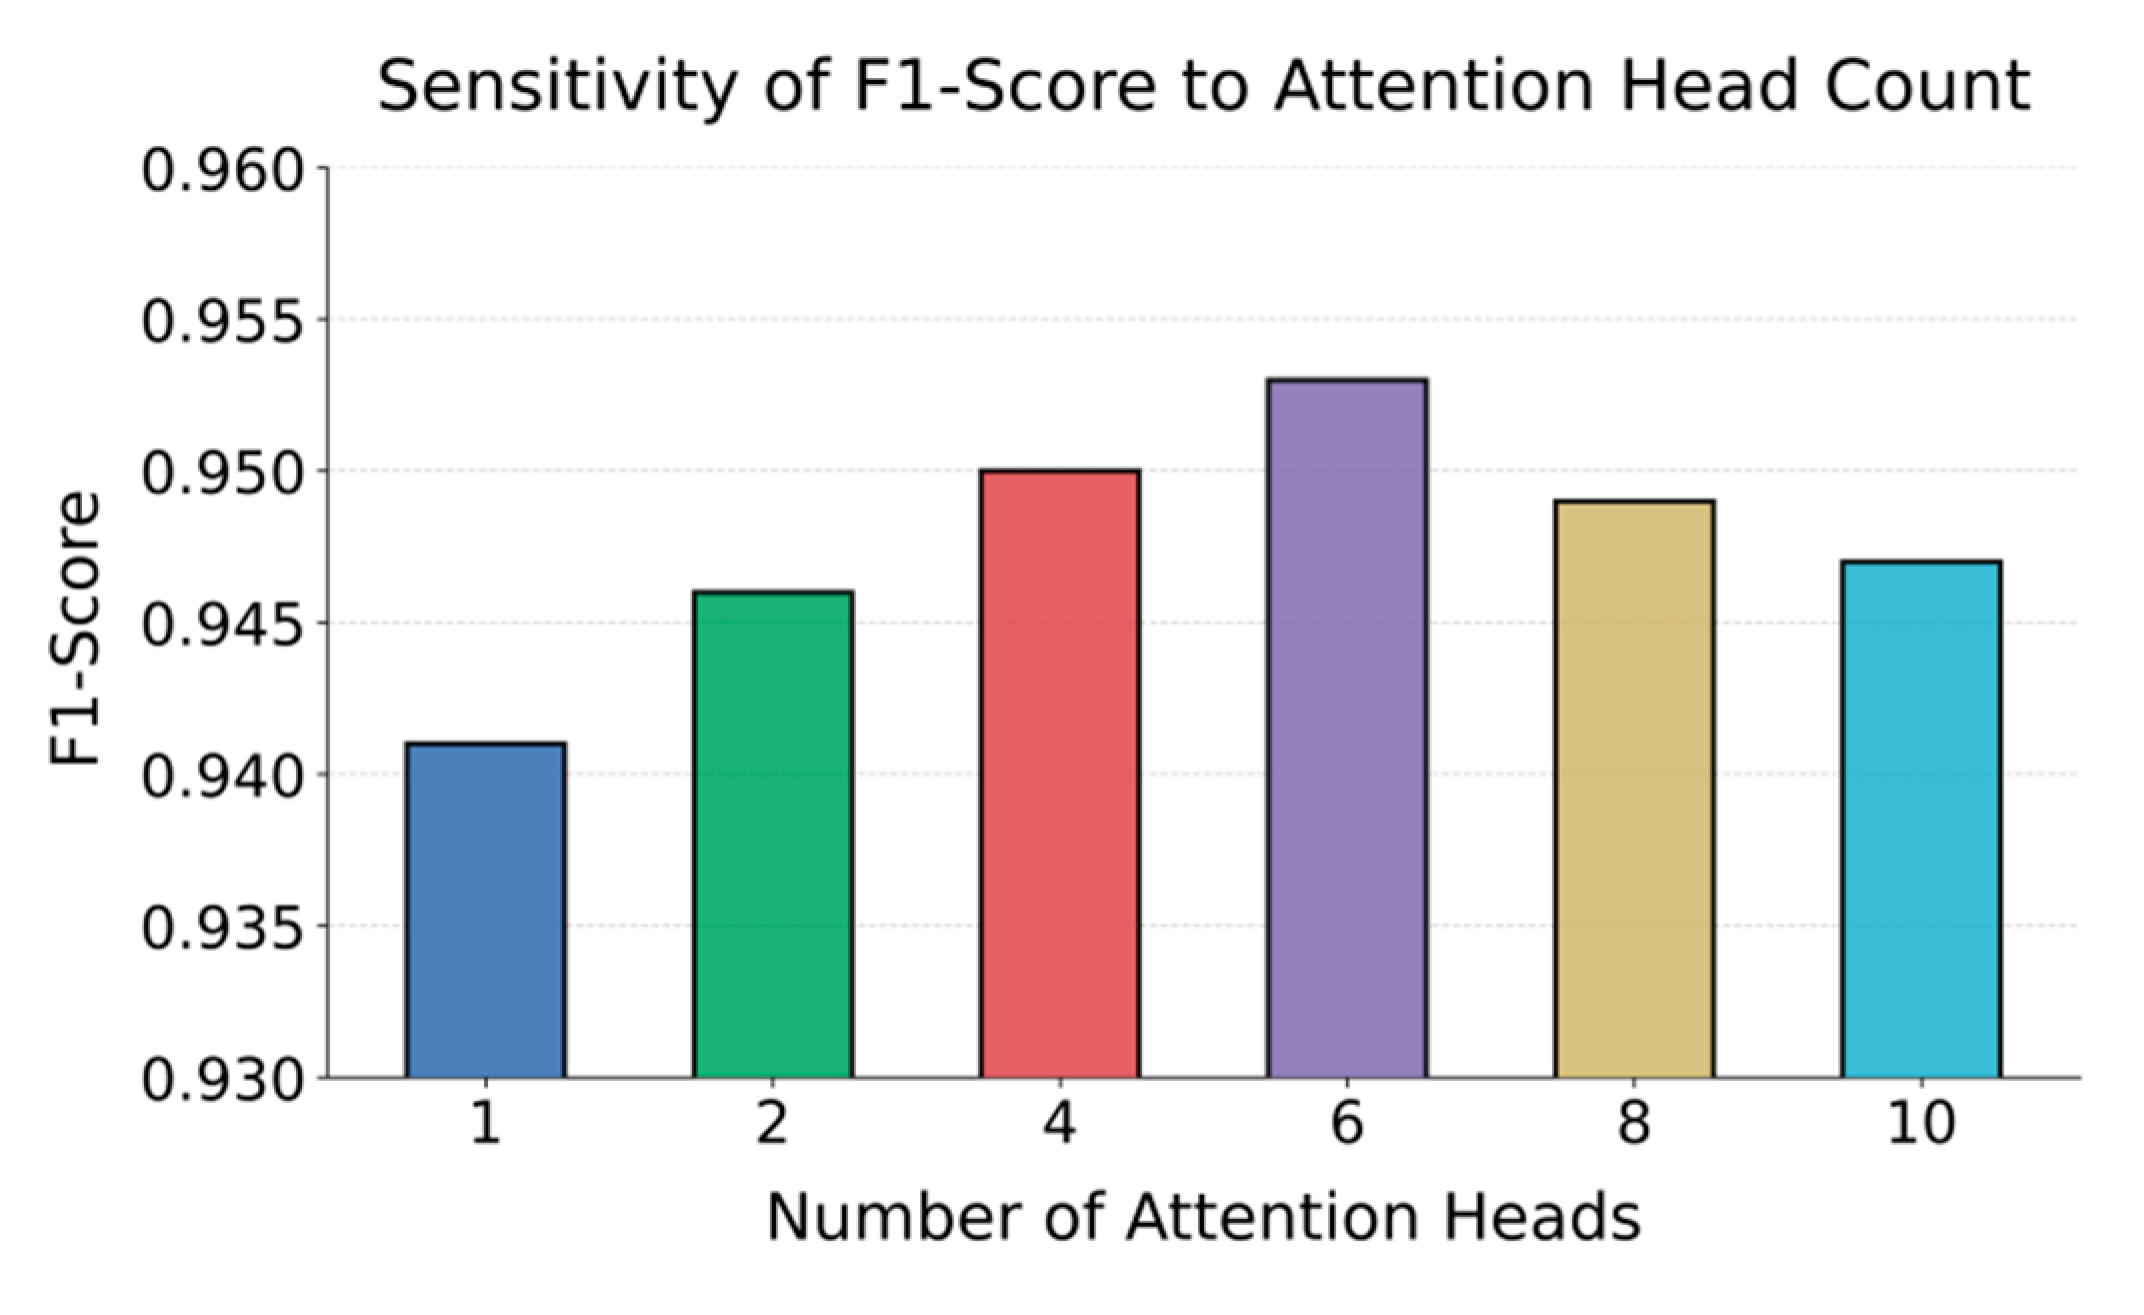
Figure 3.
The effect of temporal window size on experimental results.
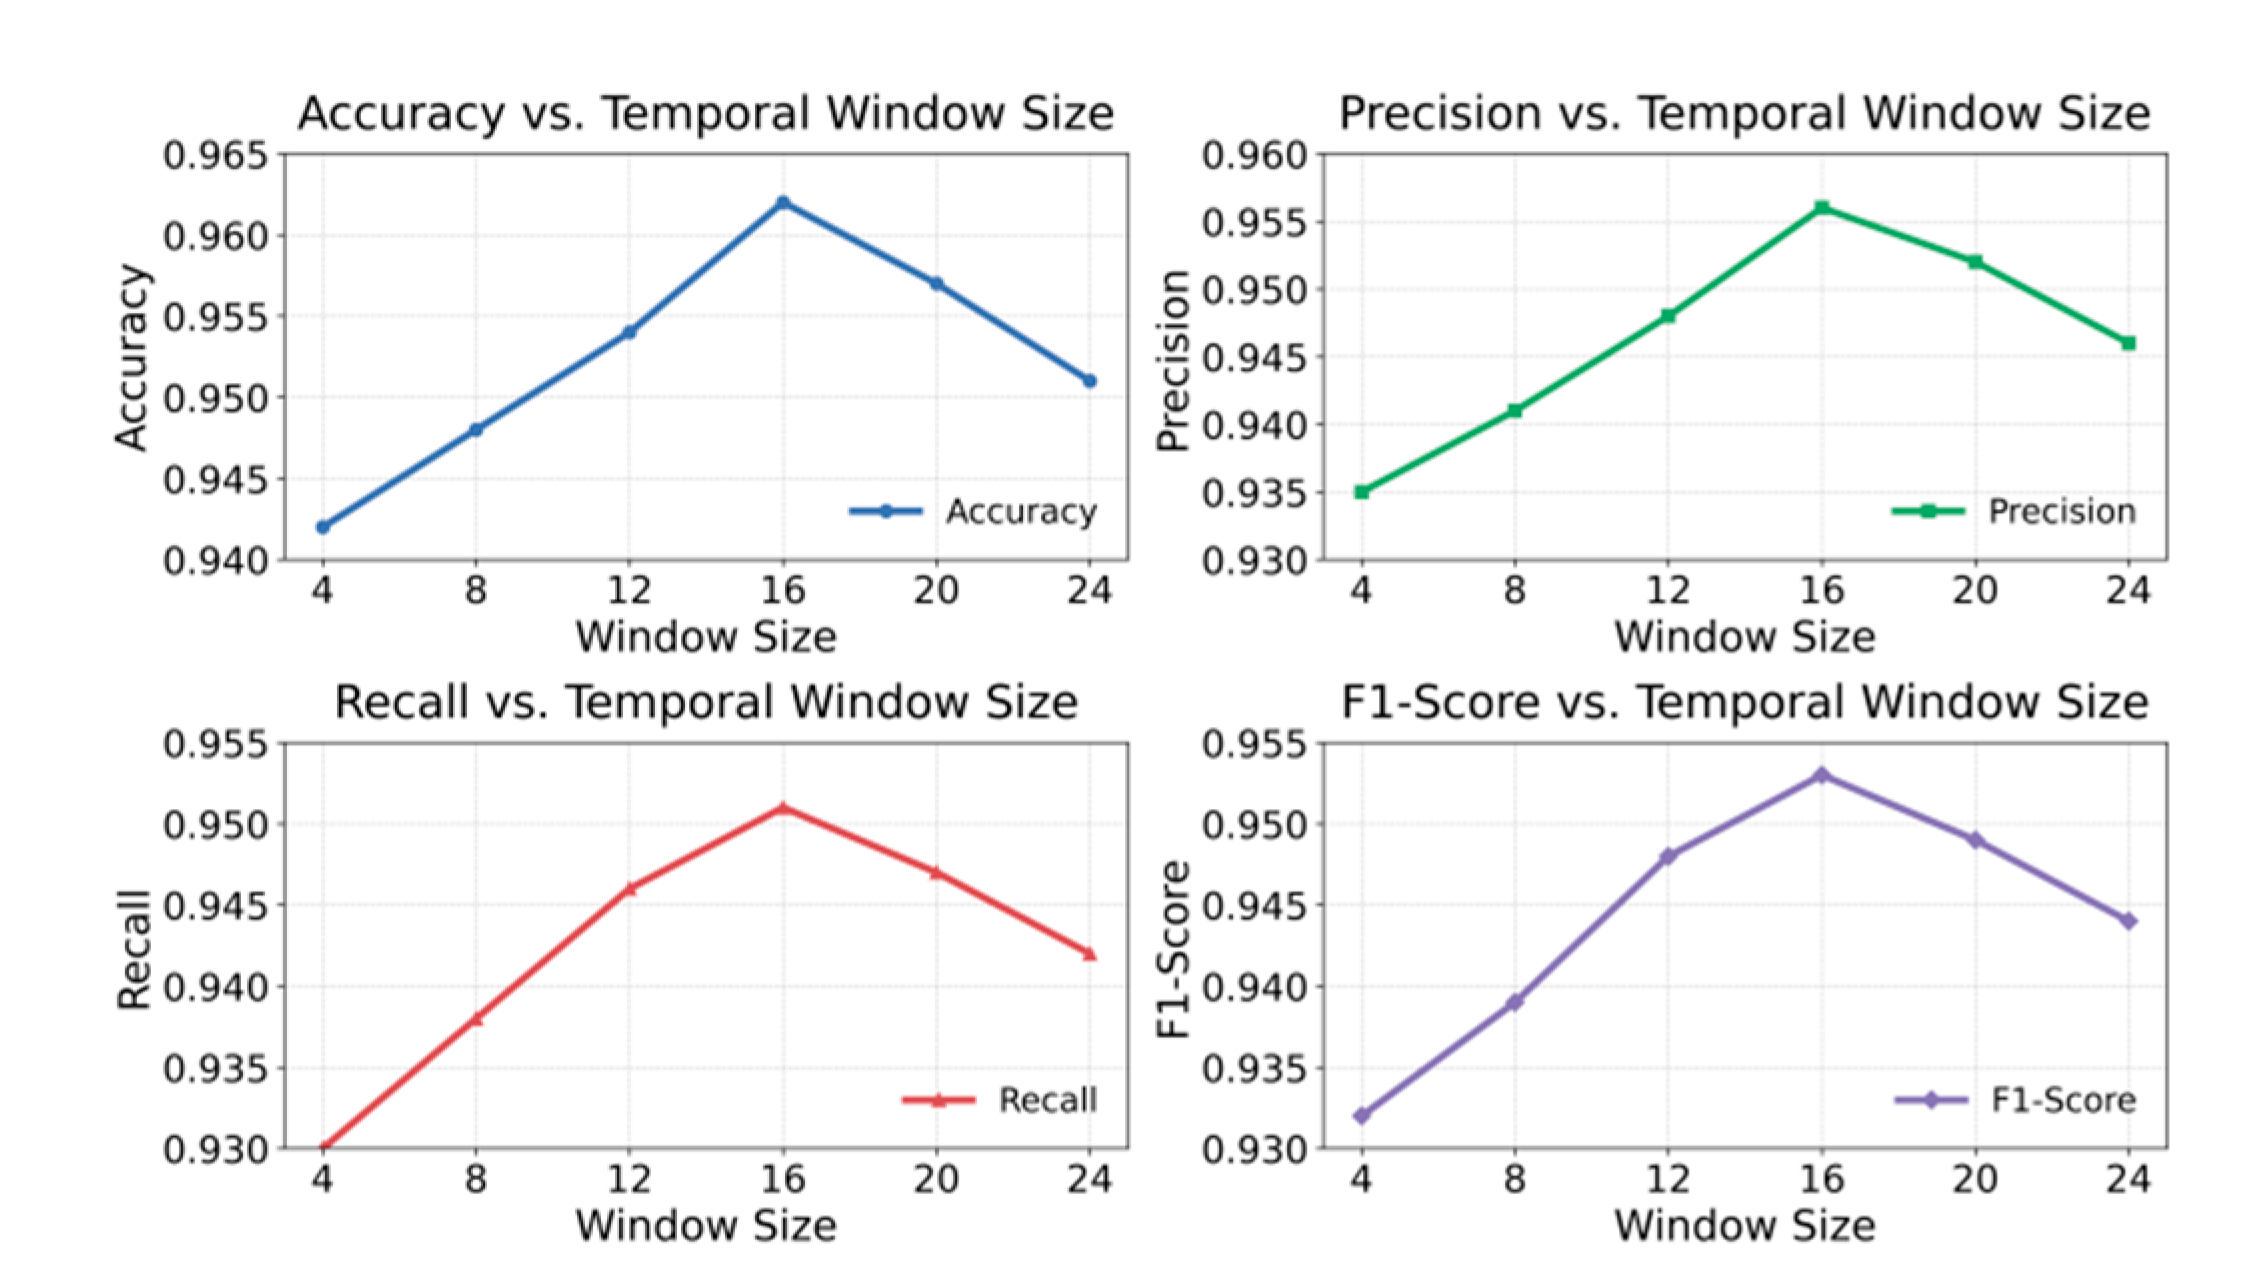
Figure 4.
Sensitivity experiment of node failure ratio to F1-score.
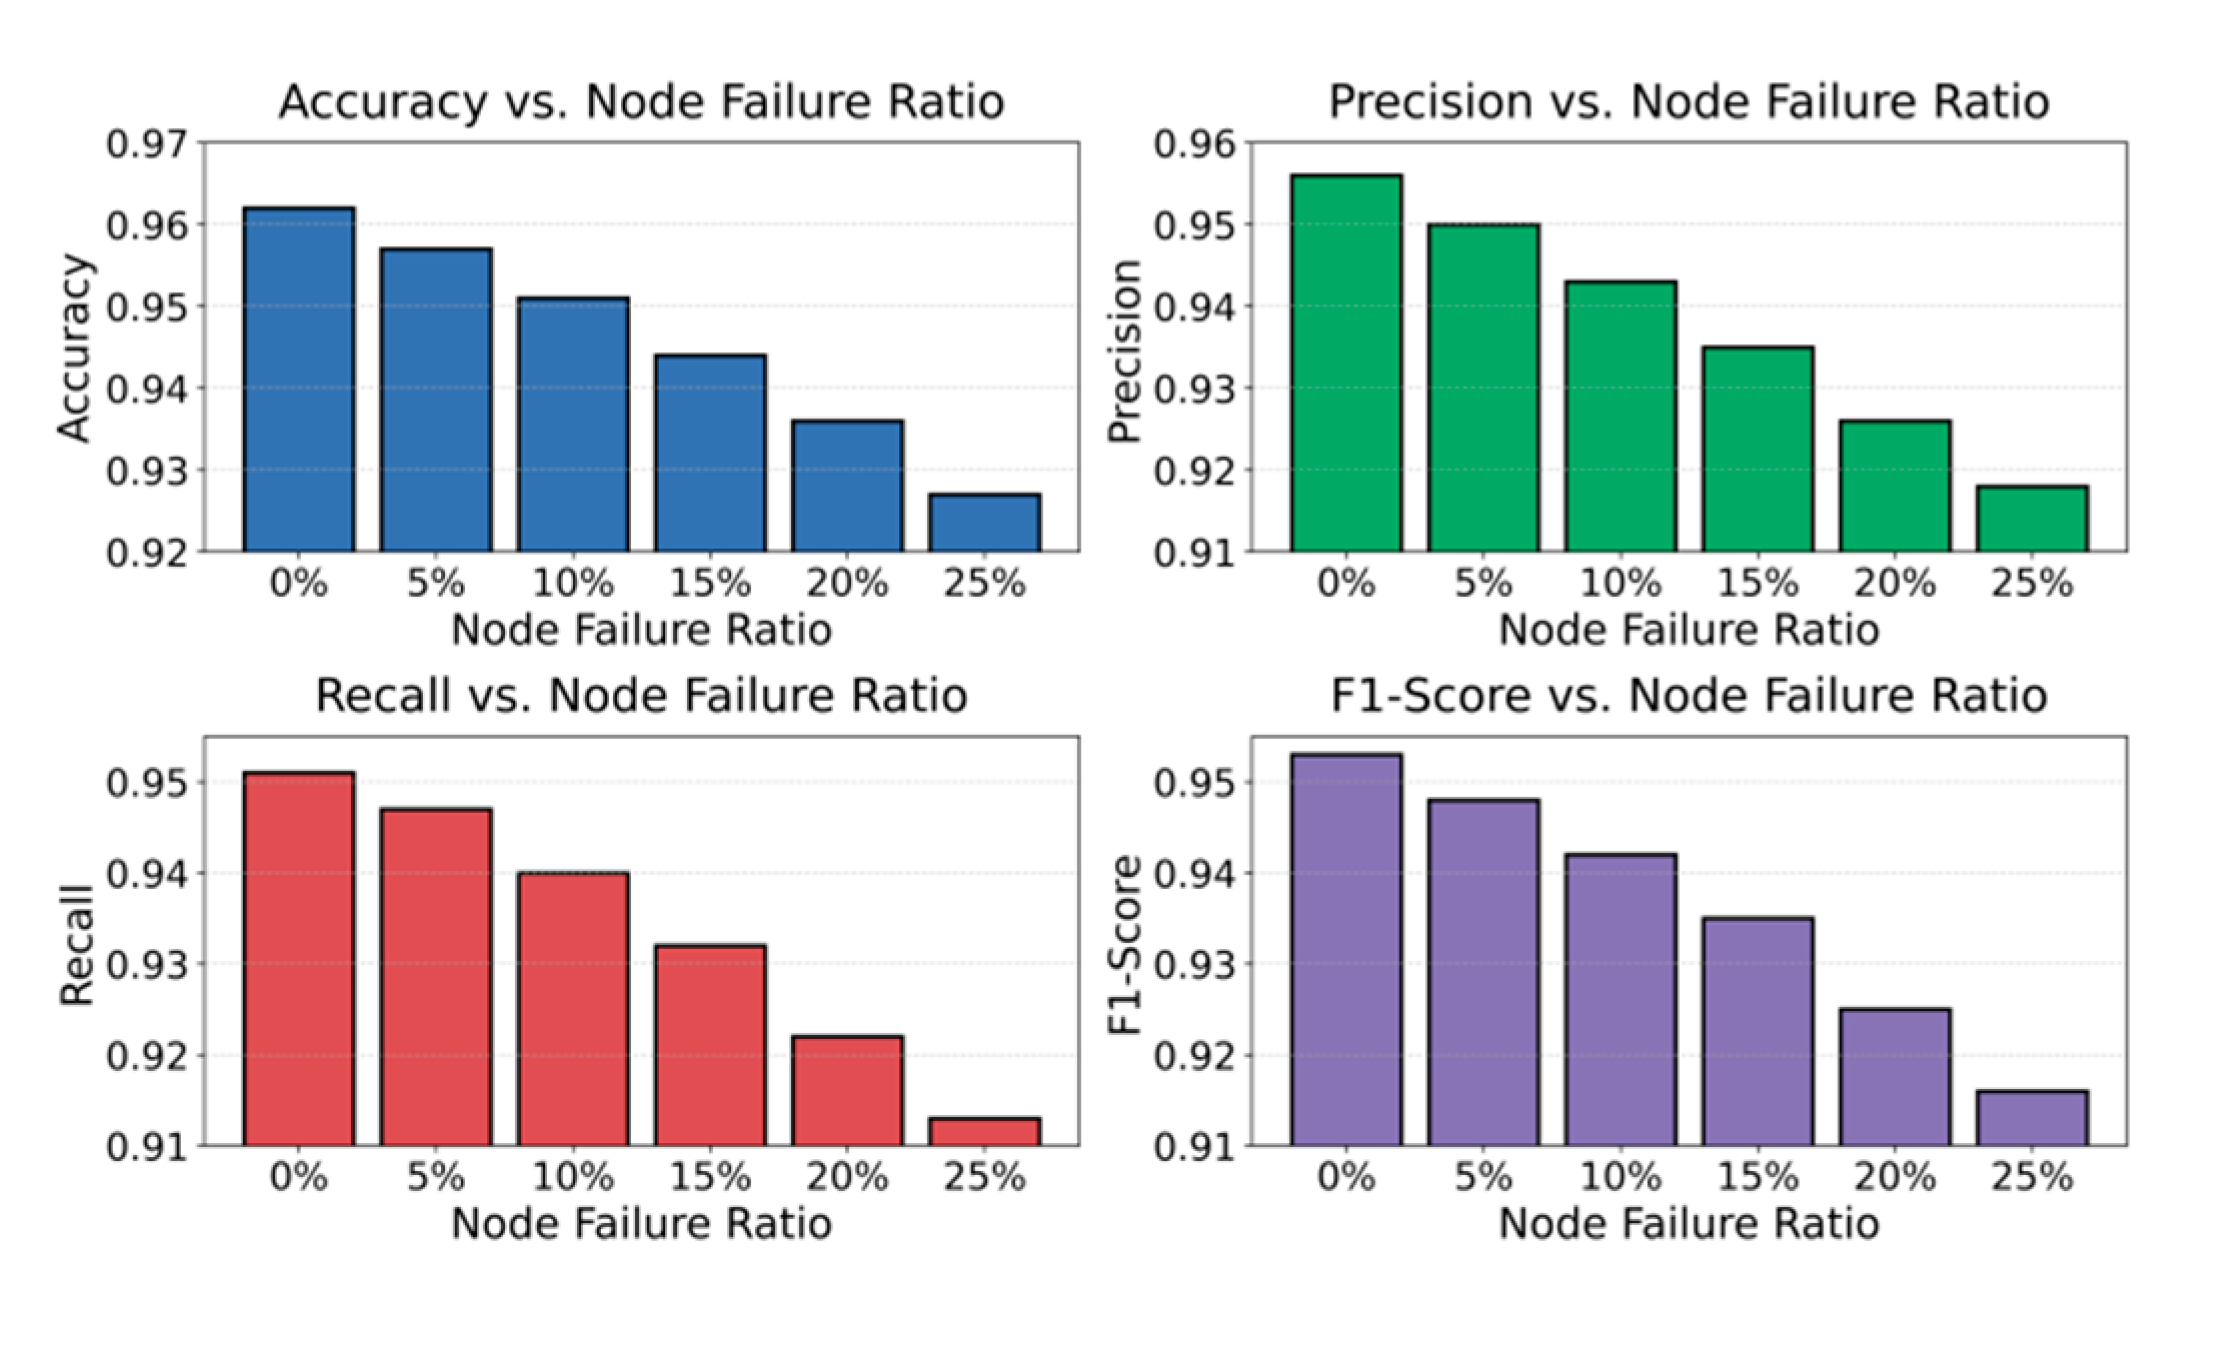
Figure 5.
The impact of the proportion of outlier samples on experimental results.
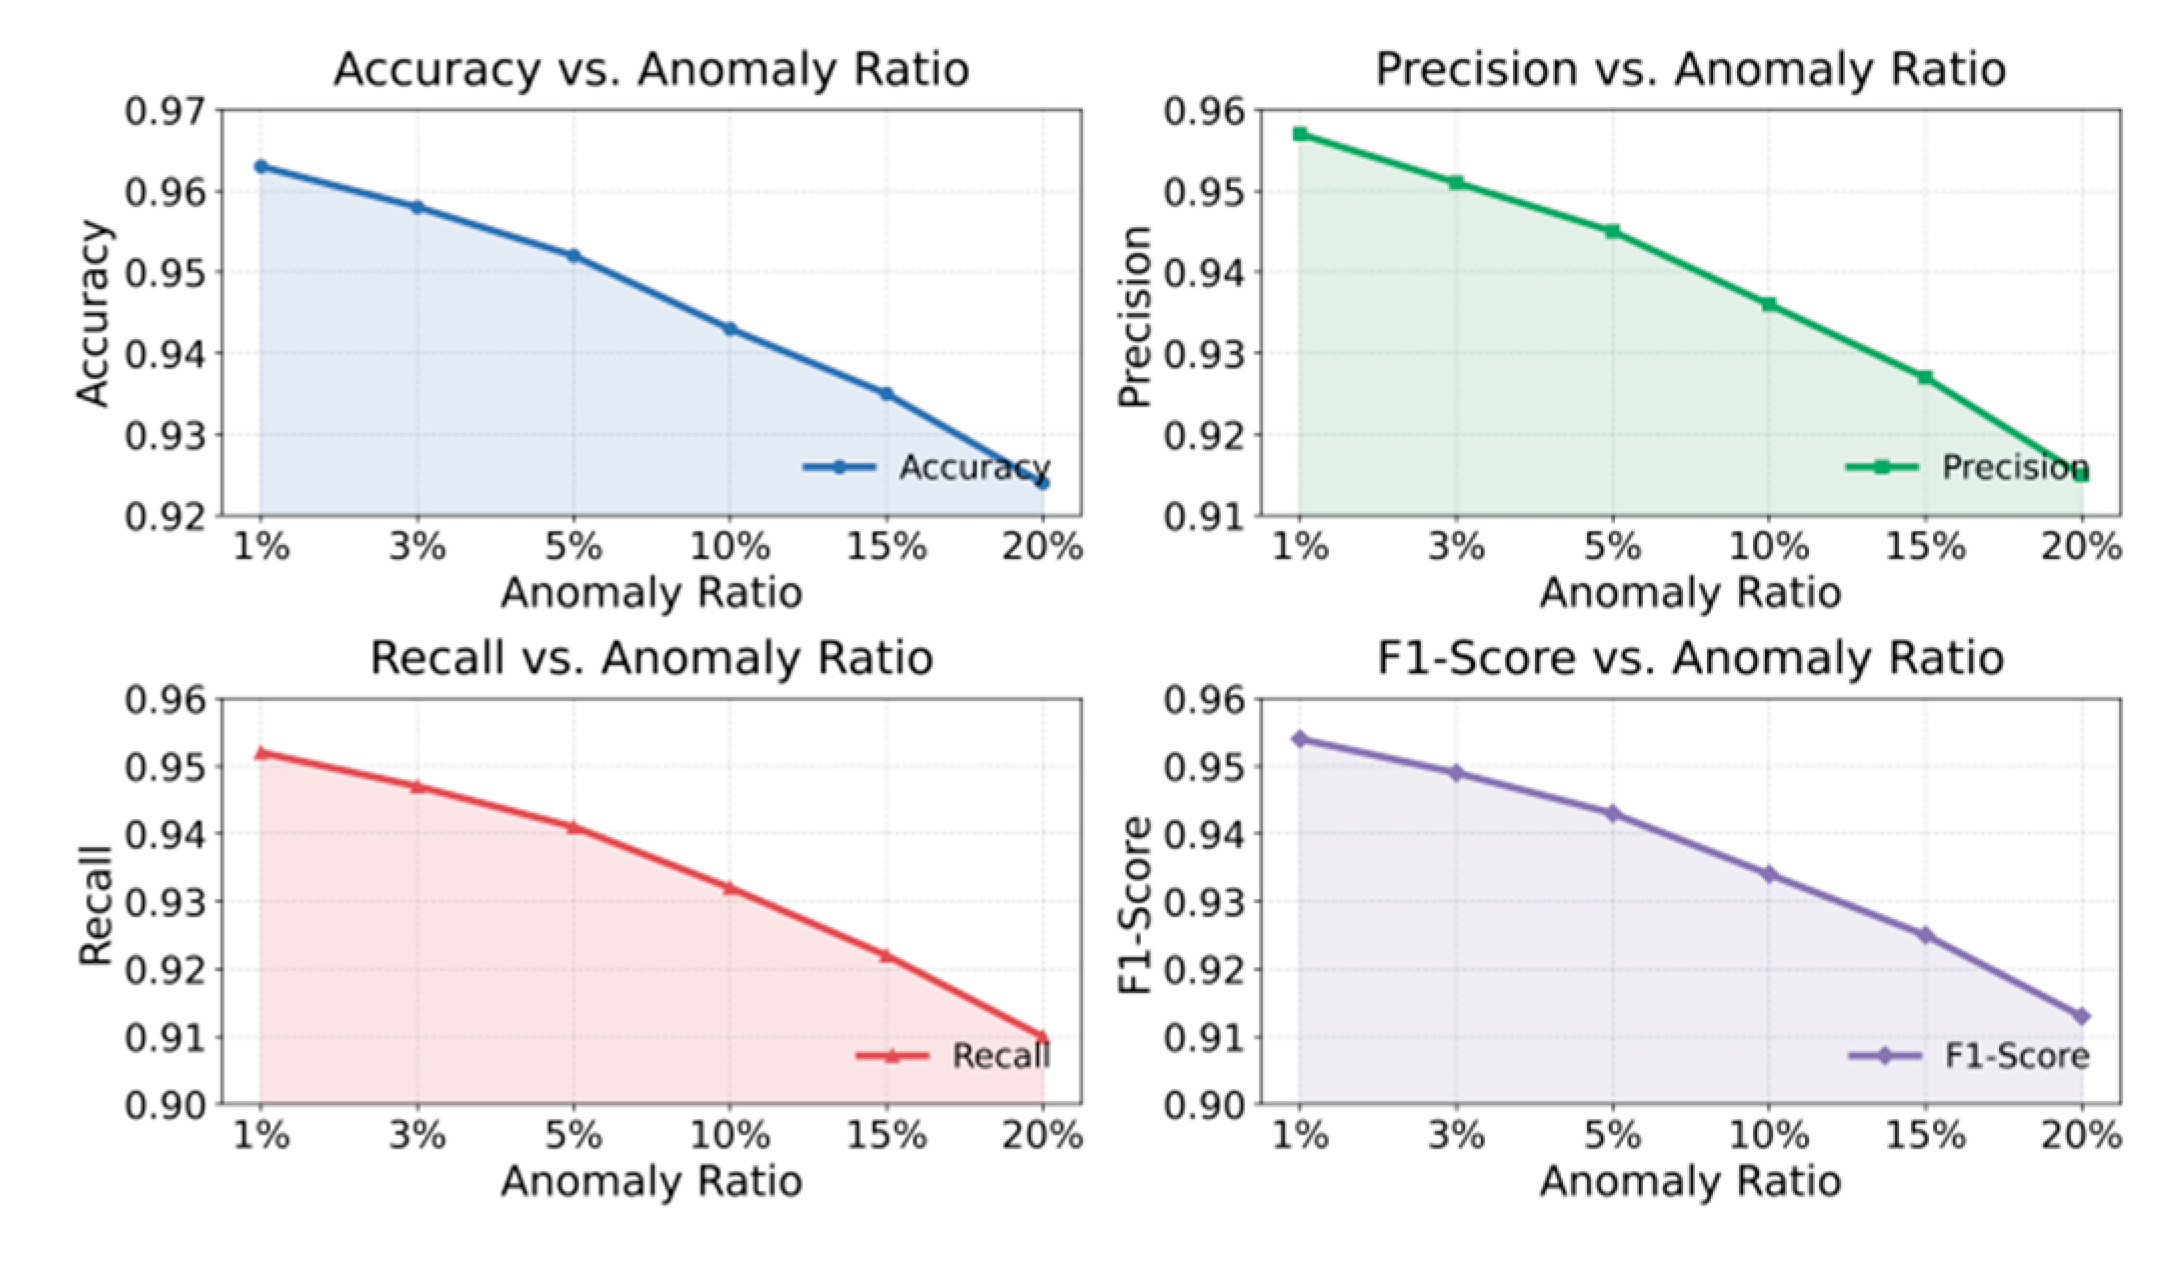

Table 1.
Comparative experimental results.
| Method | Acc | Precision | Recall | F1-Score |
| LSTM[8] | 0.914 | 0.905 | 0.892 | 0.898 |
| BILSTM[9] | 0.923 | 0.916 | 0.903 | 0.909 |
| GAT[10] | 0.931 | 0.925 | 0.914 | 0.919 |
| GNN[11] | 0.936 | 0.930 | 0.921 | 0.925 |
| Transformer[12] | 0.944 | 0.939 | 0.928 | 0.933 |
| BERT[13] | 0.948 | 0.942 | 0.934 | 0.938 |
| Ours | 0.962 | 0.956 | 0.951 | 0.953 |
Disclaimer/Publisher’s Note: The statements, opinions and data contained in all publications are solely those of the individual author(s) and contributor(s) and not of MDPI and/or the editor(s). MDPI and/or the editor(s) disclaim responsibility for any injury to people or property resulting from any ideas, methods, instructions or products referred to in the content. |
© 2026 by the authors. Licensee MDPI, Basel, Switzerland. This article is an open access article distributed under the terms and conditions of the Creative Commons Attribution (CC BY) license (http://creativecommons.org/licenses/by/4.0/).
Copyright: This open access article is published under a Creative Commons CC BY 4.0 license, which permit the free download, distribution, and reuse, provided that the author and preprint are cited in any reuse.


