
Submitted:
05 February 2026
Posted:
06 February 2026
You are already at the latest version
Abstract
Water is a vital resource for the universe's survival of both flora and fauna, broadly referred to as an elixir of life. However, high population growth, encroachment of catchment areas, and climate change have rendered water resources scarce, leading to reliance on alternative groundwater sources to supplement the less freshwater sources for domestic, agricultural, and industrial use. Groundwater is considered a reliable source of uncontaminated water for various uses in rural and urban settings, especially for drinking. However, the uncertain potability of groundwater sources such as springs and boreholes remains a great concern, particularly when used untreated for human consumption, posing serious human health threats. This study assessed the physico-chemical quality using selected groundwater parameters from a natural spring (Mwonyo) at Nkubu, Nkuene ward, Meru County, Kenya, to determine its suitability for human consumption. A systematic sampling design was employed and a total of four water samples were collected in triplets of 500 ml water bottles and analyzed in the laboratory following standard analytical procedures using specific meters and Atomic Absorption Spectrophotometer (AAS). Examined parameters included; color, taste, electrical conductivity, dissolved oxygen, pH, temperature, and turbidity, as well as concentrations of phosphate, fluoride, ammonia, nitrite, and nitrate ions. The results were compared with the maximum contamination levels (MCLs) by the Kenya Bureau of Standards (KEBs) and World Health Organization (WHO) guidelines for drinking water quality to determine the suitability of the sampled water for drinking purposes. The study findings showed that the sampled water exceeded permissible limits for several physico-chemical parameters, including low pH (6.36), high electrical conductivity (2380 μS/cm), turbidity (16.30 NTU), and elevated concentrations of phosphate (0.12 mg/L), ammonia (0.86 mg/L), and fluoride (122.8 mg/L), indicating potential contamination originating from natural and anthropogenic sources. The study recommends further investigation and appropriate water treatment interventions to ensure public safety. While some other parameters were within the permissible levels e.g., temperature (28.3°C), dissolved oxygen (4.2 mg/L), and nitrates (0.57 mg/L), the overall water quality was deemed unsuitable for drinking without undergoing treatment. These parameters might be influenced by the geological makeup of the region and seasonality. This study thus recommends further investigation and appropriate water treatment interventions to ensure human health safety.
Keywords:
groundwater
; maximum contamination level
; natural spring water
; physicochemical parameters
; KEBS
; WHO
; AAS
Introduction
Water is an indispensable resource for the existence of all life on earth (Gorde & Jadhav, 2013; Gaafar et al., 2020). Studies show that about 97% of global water is saline, while 3% is freshwater. Out of the 3% of freshwater, only 0.01% is available for human use, and 99% of this freshwater is groundwater (Qureshi et al., 2021). In recent decades, high demand for freshwater supply has been experienced due to accelerated domestic, agricultural, and industrial needs (Yisa & Jimoh, 2010; Dohare et al., 2014; Antonellini, & Davies, 2015). Current estimates suggest that there could be a 40% gap between water supply and demand if no sustainable management strategies are implemented by 2030 (World Water Assessment Programme, 2019). However, due to conflicting needs and high demand as well as increasingly strained surface water by population growth, industrial expansion, and climate change, groundwater has emerged as a vital alternative to meet these growing demands and has been tapped as an opportunity to supplement water needs due to its widespread availability and occurrence (Yisa et al., 2012; Qureshi et al., 2021). It is also becoming a critical resource as surface water availability becomes less reliable due to climate change impacts (World Bank, 20220, UN-Water, 2022). Groundwater can serve multiple purposes such as irrigation, domestic and industrial use, as well as human consumption, and is mostly considered one of the purest water forms, particularly in rural and semi-rural areas globally (Singhal et al., 2010; Kanoti et al., 2019). According to a United Nations World Water Development Report, groundwater now provides around 50% of the global domestic water supply and supports 25% of irrigation water needs (World Bank, 20220, UN-Water, 2022).
In many regions globally, people rely highly on groundwater as a primary source of water for human consumption (Engelenburg et al., 2020). For instance, two-thirds of the drinking water in Netherlands is sourced from groundwater (Van der Wielen et al., 2009; DWES, 2021). This preference for groundwater is supported by the fact that groundwater has natural protection provided by the overlying soil and unsaturated zones that act as filters hence less vulnerable to immediate contamination (Muraguri, 2016). Despite the filtering capacity of the vadose zone, contaminants can eventually reach groundwater resources (Šimůnek et al., 2015). Over the years, both human activities and natural processes have resulted in the contamination of groundwater over time (Napacho & Manyele, 2010; Dohare et al., 2014; Szymkiewicz et al., 2018; El-Aassaret al., 2023). These sources of groundwater contamination include volcanism and dissolution of harmful elements including hazardous wastes, fertilizers, and heavy metals from natural and anthropogenic processes such as mining, agriculture, and industrial activities (Venkatramanan et al., 2016; Adimalla et al., 2017).
The interaction of groundwater with geological materials shapes its chemical composition, resulting in dissolution of various organic and inorganic constituents such as calcium, sodium, bicarbonate and sulfate, chloride, and nitrate ions among others (Gorde & Jadhav, 2013, 2020, 2021). Additionally, the quality of groundwater is further influenced by factors such as rock weathering, atmospheric precipitation, crystallization, and evaporation, among others (Gibbs, 2021; Selek & Yetis, 2017, 2022). The presence of these organic and inorganic constituents at high concentrations in drinking water can cause possible health risks while low concentrations of certain ions may render water unsuitable for specific uses (Brindha & Elango, 2011, 2020).
Water quality assessment is essential to determine whether groundwater from a particular source is suitable for its intended use (Gorde & Jadhav, 2013, 2020, 2021). According to the World Health Organization (WHO), 80% of global diseases are linked to contaminated water (WHO, 2021). More than half of the world’s population depends on groundwater for survival (Yisa et al., 2012). The presence of many pollutants coupled with high dependency on groundwater calls for the need for regular monitoring to prevent adverse health effects (Sinha & Srivastava, 2022; Meride & Ayenew, 2016; 2020). The uncertain potability of groundwater sources such as natural springs and boreholes remains a significant health concern for consumers. In many cases, water from these underground sources is normally consumed raw and untreated by humans without undergoing treatment, thus risking their health through increased exposure to contaminants.
Mt. Kenya is a significant water catchment area in Kenya, covering an area of 199,550 ha; it has various natural spring sources used for domestic and agricultural purposes. Natural spring water is considered safe groundwater and is widely used in many regions globally including Meru County of Mt. Kenya East region. The natural spring water in these areas, locally known as ‘Mwonyo,’ oozes from underground rocks to the surface, mixing with the stream water and flowing downstream. The water is used locally as a softener in cooking cereals and medication for stomach ulcers by the increasing population in Meru County. It is even used by commuting people from various parts of the country (Maina, 2022). Previous studies on groundwater quality in the Mt Kenya region have identified high ion concentrations in groundwater, mainly associated with nearby human activities (Mosiara, 2022). Despite this, increasing water consumption driven by the increasing population remains a concern, particularly given the lack of solid data and knowledge of groundwater quality (World Bank, 2012). Groundwater, widely regarded as an ideal water source for human consumption in developing countries, can become unsafe for drinking due to chemical and physical impurities (Rout & Sharma, 2011; Gautam et al., 2015). The quality of groundwater largely depends on its chemical constituents and their concentration, which are mostly acquired from an area’s geological makeup (Al-Sudani, 2019; Deutsch & Siege, 2020; Wantoputri et al., 2024). However, human activities, such as industrial and municipal solid waste, have emerged as one of the leading causes of pollution for both surface and groundwater (Ombaka et al., 2013; Mbura, 2018).
In a neighboring County (Tharaka Nithi), groundwater in some areas has been found to contain pollutants exceeding Maximum Contamination Levels (MCLs) (Mbura, 2018), often due to industrial waste percolation and the interaction of rainwater with waste materials (Napacho & Manyele, 2010; Dohare et al., 2014). As groundwater moves along a flow path, the chemical composition is altered through interaction with the geological environment and the underground rocks through rock-water interaction, causing the dissolution of primary minerals and fracture-filling materials in crystalline rocks (Steefel & Capellen, 1990; Bhadja & Vaghela, 2013). This rock dissolution increases the concentration of ions in chemical ions in water. Water for consumption by the public must be below MCLs for standards set for the parameters (Allan, 2006), and the concentration levels should be permissible according to WHO 2008. Despite the critical role of groundwater in Meru County, there is a paucity of studies on the chemical composition of natural spring waters. This knowledge gap poses serious health risks to groundwater consumers. The Meru County integrated management plan (2023-2027), highlights the uncertainty of groundwater quality as a challenge due to increased farming activities and urbanization. Moreover, it also highlights the exploitation of underground water in all the springs and swamps in the county as one of the opportunities that need to be tapped. However, the quality of such waters has mostly deteriorated mainly from horticulture. Existing sustainable management strategies include lack of monitoring of water quality, and unregulated wastewater and effluents from farms and urban settlements, among others. The present study, therefore, aimed to determine the concentration of the selected physical and chemical parameters of natural spring water (Mwonyo) in Meru County and compare the findings with the Kenya Bureau of Statistics (KEBS) and World Health Organization (WHO) standards to assess suitability and recommend the quality of the water for various intended uses.
Materials and Methods
Description of the Study Area
The study was conducted in the Mt. Kenya East region, specifically Nkuene ward in Meru County, Kenya. The coordinates of the study area are (Easting-343441, Northing -999748, altitude -1921m; Easting -343506, Northing-999768, Altitude-1919 m; Easting-343506, Northing-999767, altitude-1921 m; Easting-351474 and Northing-9990503, Altitude-1470 m). Meru County is located approximately 225 km northeast of Kenya’s Capital City, Nairobi, and spans the equator lying 0º6′ North and 0º1′ South and between latitudes 37º West and 38º East. It borders Isiolo County to the North, Nyeri County to the Southwest, Tharaka Nithi County to the Southeast, and Laikipia to the West. The area is mostly characterized by small-scale agricultural activities. The drainage pattern in the county is characterized by rivers and streams originating from catchment areas such as Mt. Kenya and Nyambene ranges in the North of the county. The rivers form the main source of water for both domestic and agricultural use. The distribution of rainfall ranges from 300 mm per annum in the lower midlands in the North to 2500 mm per annum in the South East. Other areas receive on average 1250 mm of rainfall annually. There are two seasons with the long rains occurring from mid-March to May and short rains from October to December. Temperatures range from a low of 8ºC to a high of 32ºC during the cold and hot seasons, respectively.
The County has a total population of 1,545,714 with an estimated growth rate of 2.1 percent per annum (Kenya National Bureau of Statistics, 2019). The population is expected to rise to 1,819,966 by 2027. The increasing population will be a strain on available resources such as land, water, and natural resources. Owing to its geographical positioning in the Eastern Highlands at an elevation of approximately 5,300 feet, Agriculture is the dominant economic activity of the county supported by the rich volcanic soils, Additional economic activities practiced within the county include Horticulture and Floriculture farming as well as livestock keeping characterized by dairy and beef farming, goat, sheep, chicken, and pig farming. A more recent upcoming economic activity in the county has been in the mining industry occasioned by the growing extraction of building materials including gravel, sand harvesting, and quarrying.
Field Sampling and Laboratory Analysis
The study applied a systematic sampling design to collect water samples from the natural spring within the study area. This was followed by laboratory analysis to determine the physical and chemical parameters of natural spring water. The sampling points were systematically selected within the study area. The water samples were collected on the same day during morning hours to avoid potential interference by wild animals and humans.
Samples were taken in triplets using 500 ml water bottles. The bottles were rinsed thrice with distilled water before sample collection. A composite sampling design was employed where the triplicate samples were mixed to form a homogeneous sample that was in turn sealed airtight and taken to the laboratory for element analysis using an elemental analyzer. Onsite measurements of physical parameters such as pH, color, taste, odor and temperature, electrical conductivity (EC), and total dissolved solids (TDS) were carried out using their respective portable apparatus (pH meter, visual color comparators, sensory test, mercury thermometer, EC meter, and TDS meter).
Other parameters such as Turbidity, Dissolved Oxygen, Nitrate, Nitrate, Ammonia, Phosphate, Fluoride, and Chloride ions, were analyzed in the laboratory using respective parameters and standard procedures. Specific sample preparation for the chemical parameters was conducted before analysis. In Nitrite sample preparation, 100 ml of sample was added to a 100 ml volumetric flask, where 2 ml of complexing reagent was added and left to sit for 20 minutes, and a reading was made at a wavelength of 540 nm. For ammonia, 50 ml of sample was pipetted into 50 ml of the volumetric flask, where 2 ml of Nessler’s reagent was added and left to sit for 10 minutes, and a reading was made at a wavelength of 410 nm. For Fluoride, 20 ml of sample was added to 20 ml of Total Ionic Strength adjustment buffer (TISAB), with the standard being prepared using C1V1=C2V2 with 1000 ppm of Fluoride ions in water. From the 20 ml of standard solution, 0.5 ml, 1.0, spiked 1.5, 2.0, and 2.5 ppm were taken, and 20 ml of TISAB was added to each. The solution was calibrated using a standard where spiked 1.5 ml was within 96-110% of the 1.5 ml and reading taken. The chemical parameters (nitrates, chloride, ammonia, and phosphates) were analyzed using a UV spectrophotometer. Nitrate absorbance was measured at a wavelength range of 220-820 nm, while that of phosphate was observed at a wavelength of 880 nm. A total of 15 physical and chemical parameters were analyzed and the results were compared with the Kenya Bureau of Standards (KEBS) and World Health Organization (WHO) guidelines to determine the suitability of the water for drinking purposes.
Results and Discussion
The Physicochemical parameters of groundwater from a natural spring in Nkubu, Kenya, and their comparison with standard values for suitability for human consumption are summarized in Table 1 below.
Physical Parameters
Temperature is a paramount parameter, especially in determining the pH of drinking water. The recorded temperature of 28.3 °C falls within the permissible range (28-32 °C), indicating that the water temperature is suitable for human consumption. Even though KEBS and WHO do not provide standard temperature values for drinking water, it is ideal that drinking water should be cool. A temperature of 28.3 degrees Celsius is genuine for drinking water. The water was clear in color, odorless, and had an effervescent smell. Studies show that minute quantities of metallic ions, humus, peat, and industrial waste in water result in observable color (Khopkar, 2006; Bhadja & Vaghela, 2013). KEBS and WHO provide that drinking water should be clear and free from any color, be odorless, and have a pleasant taste, and was within the permissible level when compared to the KEBs and WHO values indicating the water had no sensory or visual issue that could render it unsuitable for drinking. This shows that the water is acceptable for drinking in terms of color and smell. Taste and odor in water can originate from natural inorganic, organic contaminants and biological sources, and their presence in water indicates the presence of potentially harmful contaminants (WHO, 2008). However, the Effervescence taste of the drinking water might have been caused by mineral composition such as magnesium and calcium (Honig et al., 2020). Nevertheless, effervescence is not a standard measure of water quality.
Chemical Parameters
pH
The pH of water is the measure of acid and base equilibrium. At a given temperature, the intensity of a solution’s acidic or basic character is indicated by pH or hydrogen ion activity (Muraguri, 2016). It is controlled by carbonate, bicarbonate, and carbon dioxide concentrations in natural waters (ÖZGÜR et al.,2012). The pH levels in water can be affected by either physical, chemical, or microbiological characteristics of water (Bratovcic & Petrinic, 2020). pH scales range from 0-14, with 0-7 being acidic and 7-14 being alkaline, while 7 is neutral. KEBs and WHO recommend drinking water pH between 6.5 to 8.5. A determined pH value of 6.36 was slightly below the recommended standards for drinking water, suggesting that the water is slightly acidic.
Turbidity
Turbidity is defined as the suspension of particles in water that interfere with the passage of light. It is caused by suspended and colloidal matter from organic and inorganic contents (Khopkar, 2006; Bhadja & Vaghela, 2013). A determined value of 16.30 NTU is significantly above the WHO and KEBS recommended value of 5 NTU for drinking water. This highlights a significant concentration of contaminants and suspended particles that could harbor harmful pathogens raising health concerns if the water is to be used for consumption purposes.
Total Dissolved Solids (TDS)
Total dissolved solids (TDS) are the difference between the total solids and suspended solids in water. A Total Dissolved Solids test provides a qualitative measure of ions in drinking water. These ions comprise inorganic salts of calcium, sodium, magnesium, chloride, bicarbonates, and sulfates (WHO,2008). WHO recommends a TDS value below 1000 mg/L, while KEBS recommends a maximum of 1200 mg/L. From the conductivity measurement, a total dissolved solid concentration of 3528 mg/L is extremely higher than the allowable values by both WHO and KEBS, indicating the unsafety of the water for drinking and possible health risks. According Meride & Ayenew (2016), water with high TDS concentration may cause constipation in humans.
Dissolved Oxygen (DO)
Dissolved oxygen is a measure of healthy water, especially in aquatic ecosystems, as it provides for the survival of organisms. This is affected by water temperature as colder waters absorb more oxygen than warmer waters (Khopkar, 2006). There is no specific allowable value for dissolved oxygen in drinking water; therefore, a concentration of 4.2 mg/L was considered safe. A concentration of below five mg/L can indicate low survival for aquatic macroinvertebrates (Khopkar, 2006; Rout & Sharma, 2011).
Electrical Conductivity (EC)
Water’s conductivity is defined as water’s capacity to carry an electrical current. It is mainly affected by types of ions, ion mobility, valence, relative concentration, and water temperature (Muthukumaravel, 2010). An increase in concentration of Electrical conductivity may indicate the presence of pollutants and possible salts in water (Sujatha et al., 2012). Electrical conductivity in water is a vital parameter that indicates ion concentration. KEBs provide for a maximum electrical conductivity of 1500 μS/cm. From the analysis, an EC of 2380 μS/cm in the waters shows an extremely high concentration, indicating the possibility of high mineral content in the natural spring water.
Ammonia (NH4-)
A higher concentration of Ammonia in drinking water is undesirable as it is associated with several effects, which include nitrification, which accelerates nitrite levels in water (Wilczak et al.,1996; Nduka et al.,2008), adverse impacts on taste and Odor (Bouwer & Crowe, 1988), and increases in heterotrophic bacteria, including opportunistic pathogens (Wilczak et al.,1996; Murhekar, 2011). Additionally, ammonia pollutants contribute to the rapid deterioration of construction materials (Taneva, 2012). KEBs recommend a maximum concentration of 0.5mg/L for Ammonia, while WHO recommends a concentration of 1.5mg/L in drinking water. From the analysis, a concentration of 0.86mg/L (Figure 1) is slightly higher than the allowable value (by KEBS), indicating potential contamination of the natural spring water.
Chloride (CL-)
Chloride occurs naturally in all types of water. Chloride occurs in the environment as sodium chloride (NaCl), potassium chloride (KCl), and calcium chloride (CaCl2). Chloride in groundwater originates from deep aquifers. Studies show that a high chloride concentration indicates pollution, mainly due to organic waste of animals or industrial origin (Sujatha et al., 2012). Most water sources contain chloride ions, which come from agricultural and industrial activities, and chloride stones (Muthukumaravel, 2010). High chloride concentrations of over 250 mg/L are known to result in detectable taste in drinking water (WHO, 2008). WHO and KEBs recommend a maximum concentration of 250 mg/L for drinking water. A determined value of 14.3mg/L is within the acceptable range, thus indicating the safety of the water for drinking.
Nitrate (NO3-) and Nitrite (NO2-)
Nitrates and nitrites are naturally occurring inorganic ions involved in the nitrogen cycle. Microbial activity in soil or water breaks down organic nitrogen in waste, converting it into ammonia, which is then oxidized into nitrite and nitrate. Nitrate is present in water in its oxidizing form of N2 compound. Its primary sources are factories, domestic and industrial discharge, and matters of animals (Lockhart et al., 2013). Due to the oxidizing nature of nitrite, it is easily oxidized into nitrate, primarily found in groundwater. High concentrations of nitrates in drinking water cause blue baby syndrome in infants (WHO, 2011), methemoglobinemia, and higher levels of livestock poisoning (Tredoux et al., 2005). Nitrate groundwater contamination is a global problem mainly due to agricultural activities and has been recognized as a global environmental issue affecting both economic and human health (DEFRA, 2002). In addition, nitrate-containing compounds in water are soluble and actively move with groundwater. Both KEBs and WHO recommend a maximum concentration of 50 mg/L. A determined value of 0.57 ml/l (Figure 2) falls under the acceptable range, indicating the low nitrate concentration in the water. The low concentration may result from a lack of influence from agricultural activities on the groundwater, such as nitrogen fertilizers, as fertilizers are associated with high nitrate concentration levels in groundwater (Mbura, 2018). KEBs and WHO provide a maximum nitrite concentration of 0.1mg/L. A determined value of 2.32 mg/L indicates a significantly higher value, which indicates possible contamination of the natural spring water.
Fluoride(F-)
Fluoride naturally occurs as fluorspar (fluorite), rock phosphate, graphite, or phosphorite crystals (Sujatha et al., 2012). A fluoride concentration of at least 0.6 mg/L is vital in the human body as it is critical in forming strong bones and teeth. However, a high fluoride concentration above 1.5 mg/L results in acute dental fluorosis, which results in the coloration of teeth from yellow to brown. In addition, long-term water consumption with high fluoride concentration causes skeletal fluorosis, a condition characterized by bones being weak and bending.
Fluoride concentration in groundwater is influenced by the climate of the area and the presence of accessory minerals in the rock minerals assemblage through which the groundwater is circulating (Brindha & Elango, 2011; Rout & Sharma, 2011; Boschetti et al., 2014). A natural source of fluoride is the weathering of fluoride-bearing minerals, upon which water infiltrates, reaching groundwater. Volcanic ash has a high concentration of fluoride, which is easily soluble in water. High fluoride concentrations have been recognized as a health threat in more than 25 states worldwide (Brindha & Elango, 2011). Both KEBs and WHO recommend a maximum concentration of 1.5 mg/L for fluoride in drinking water. A determined value of 122.8 mg/L (Figure 3) indicates an extremely high concentration, which could lead to serious health risks, such as dental and skeletal fluorosis.
Phosphates
Phosphate is a key indicator of water contamination when found in significant amounts. Groundwater contains minimum phosphate levels due to the low solubility of phosphate minerals and the ability of soil to retain phosphate (McDowell et al., 2015). PO4 3- particularly Ca3(PO4)2 are essential for strong bones and teeth. According to WHO 2008, drinking water should have a maximum phosphate concentration of 0.1mg/L. A phosphate concentration of 0.12 ml/L in the water sample, as indicated by the linear graph (Figure 4), shows that the water falls under the permissible levels and may be considered fit for drinking.
Conclusions and Recommendation
Water remains a vital natural resource directly associated with human health and well-being. This study analyzed the physical and chemical parameters of groundwater from a natural spring in Nkubu, Meru County, Kenya. The analysis revealed that several key physiochemical parameters exceeded the acceptable limits established by the Kenya Bureau of Standards (KEBs) and the World Health Organization (WHO) for safe drinking water. The high levels of total dissolved solids (TDS), turbidity, and electrical conductivity reported in this study indicate significant concentrations of dissolved inorganic salts, which may pose health risks. Moreover, elevated ammonia and nitrite levels suggest possible contamination, potentially from wastewater sources and agricultural runoff which is prevalent in the county. Additionally, the slightly acidic pH indicates that the water may require treatment to neutralize its acidity, while the extremely high fluoride levels represent a critical health concern, particularly concerning dental and skeletal fluorosis. Given these findings, direct consumption of untreated groundwater from the natural spring in Nkubu could pose considerable health risks. To make this water suitable for human consumption, there is a need to treat it before drinking by reducing the fluoride concentration to safe levels, alongside treatment for TDS, turbidity, and other contaminants. Neutralization measures need also to be employed to correct the pH. Further investigation is necessary to investigate other parameters not included in this study as well as seasonality effects on the physicochemical concentration of the natural spring water and possible sources of contamination. There is a need for a multi-sectoral approach to managing the natural spring water, which will ensure adequate public participation to help prevent water pollution from anthropogenic activities in the future. Moreover, the county government should invest in tapping the natural spring water (money) upon adjustment of the highly concentrated parameters for eco-labeling, packaging, and commercialization for public benefit in Meru County.
Author Contributions
Conceptualization, K.M., and P.G.; methodology, K.M., and A.M.; software, K.M.; validation, K.M.; formal analysis, K.M.; investigation, K.M.; data curation, K.M., and A.M.; writing—original draft preparation, K.M., and A.M.; writing—review and editing, P.G, J.R., J.M., and A.M.; visualization, K.M. and A.M.; supervision, P.G., and J.R. All authors have read and agreed to the published version of the manuscript.
Data Availability Statement
The data that support the findings of this study are available from the corresponding author, K.M, upon reasonable request.
Acknowledgments
The authors wish to acknowledge all the team that supported this research especially in data.
Conflicts of Interest
The authors declare no conflicts of interest.
References
- Adimalla, N., & Venkatayogi, S. J. E. E. S. (2017). Mechanism of fluoride enrichment in groundwater of hard rock aquifers in Medak, Telangana State, South India. Environmental Earth Sciences, 76, 1-10.
- Al-Sudani, H. I. Z. (2019). A review on groundwater pollution. International Journal of Recent Engineering Science (IJRES), 6(5), 14-22.
- Antonellini, M., Gan, T. Y., & Davies, E. G. R. (2015). Impact of Population Growth and Climate Change on the Freshwater Resources of Lamu Island, Kenya. Water, 7(3), 1264-1290. [CrossRef]
- Bhadja, P., & Vaghela, A. (2013). Assessment of physico-chemical parameters and water quality index of reservoir water. International Journal of Plant, Animal and Environmental Sciences, 3(3), 89-95.
- Boschetti, T., Falasca, A., Bucci, A., De Felice, V., Naclerio, G., & Celico, F. (2014). Influence of soil on groundwater geochemistry in a carbonate aquifer, southern Italy. International Journal of Speleology, 43(1), 8.
- Bouwer, E. J., & Crowe, P. B. (1988). Biological processes in drinking water treatment. Journal-American Water Works Association, 80(9), 82-93.
- Bratovcic, A., & Petrinic, I. (2020). Quality assessment and health safety of natural spring water. Technologica Acta: Scientific/professional journal of chemistry and technology, 13(1), 33-40.
- Brindha, K., & Elango, L. (2011). Fluoride in groundwater: causes, implications and mitigation measures. Fluoride properties, applications, and environmental management, 1, 111-136.
- Brindha, K., & Elango, L. (2020). Hydrochemical assessment of groundwater quality and its suitability for drinking and irrigation: A review. Environmental Earth Sciences, 79(10), 339. [CrossRef]
- Department for Environment, Food and Rural Affairs (DEFRA), (2002). Climate Change Impact and Adaptation Research Programme. Project Summaries Report, London. pp. 1987- 2002.
- Deutsch, W. J., & Siegel, R. (2020). Groundwater geochemistry: fundamentals and applications to contamination. CRC press.
- Dohare, D., Deshpande, S., & Kotiya, A. (2014). Analysis of groundwater quality parameters: a Review. Research Journal of Engineering Sciences ISSN, 2278, 9472.
- DWES (2021). Sustainability characteristics of drinking water supply in the Netherlands. Drinking Water Engineering and Science, 14, 1–12. [CrossRef]
- El-Aassar, A. H., Hagagg, K., Hussien, R., Oterkus, S., & Oterkus, E. (2023). Integration of groundwater vulnerability with contaminants transport modeling in unsaturated zone, case study El-Sharqia, Egypt. Environmental Monitoring and Assessment, 195(6), 722.
- Engelenburg, H., Baggelaar, P., & Wolters, H. A. (2020). Development of the normalized annual drinking water volume supplied by Vitens (drinking water supplier), the Netherlands, 2003–2019. Unpublished report.
- Gaafar, M., Mahmoud, S. H., Gan, T. Y., & Davies, E. G. R. (2020). A practical GIS-based hazard assessment framework for water quality in stormwater systems. Journal of Cleaner Production, 245, 118843.
- Gautam, S. K., Maharana, C., Sharma, D., Singh, A. K., Tripathi, J. K., & Singh, S. K. (2015). Evaluation of groundwater quality in the Chotanagpur plateau region of the Subarnarekha river basin, Jharkhand State, India. Sustainability of Water Quality and Ecology, 6, 57-74.
- Gibbs, R. J. (2021). Chemical characteristics of natural waters: A historical perspective. Journal of Hydrology, 603, 127124. [CrossRef]
- Gichuki, J.G & Gichumbi J.M (2012).Physio-chemical analysis of groundwater from Kihara Division, Kiambu County, Kenya. Journal of Chemical, Biological, and Physical Sciences.
- Gorde, A. R., & Jadhav, S. S. (2020). Hydrogeochemical characterization of groundwater and its suitability for drinking and agricultural use in the Mumbai Metropolitan Region, India. Environmental Monitoring and Assessment, 192(12), 789. [CrossRef]
- Gorde, A. R., & Jadhav, S. S. (2021). Hydrogeochemical assessment of groundwater quality and its suitability for drinking and agricultural use: A case study in Maharashtra, India. Environmental Monitoring and Assessment, 193(11), 709. [CrossRef]
- Gorde, S. P., & Jadhav, M. V. (2013). Assessment of water quality parameters: a review. Journal of Engineering Research and Applications 3(6), 2029-2035.
- Honig, V., Procházka, P., Obergruber, M., & Roubík, H. (2020). Nutrient effect on the taste of mineral waters: Evidence from Europe. Foods, 9(12), 1875.
- Hounslow, Arthur W. (1995).Water Quality Data Analysis and Interpretation.
- Kanoti, J. R., Olago, D., Opiyo, N., Nyamai, C., Dulo, S., & Richard, A. (2019). Microbial and physical-chemical indicators of groundwater contamination in Kenya: a case study of Kisumu aquifer system, Kenya.
- Kavitha, R., & Elangovan, K. (2010). Groundwater quality characteristics at Erode district, Tamilnadu India. International Journal of Environmental Sciences, 1(2), 163-175.
- Kenya National Bureau of Statistics (KNBS). (2019). Economic survey 2019. KNBS. https://www.knbs.or.ke/download/economic-survey-2019/.
- Khopkar, S.M. (2006). Environmental Pollution, Monitoring and Control, New Age International Publishers (P) Ltd., New Delhi.
- Lockhart, K. M., King, A. M., & Harter, T. (2013). Identifying sources of groundwater nitrate contamination in a large alluvial groundwater basin with highly diversified intensive agricultural production. Journal of contaminant hydrology, 151, 140-154.
- Maina, I. K. (2023). Characterization and uses of natural spring water in the Mt. Kenya region: A focus on the Meru County area. Journal of Water Supply: Research and Technology—AQUA, 72(4), 1349-1361. [CrossRef]
- Maina, J. (2022). ‘Soda water’ Meru villagers scoop for body nourishment. Retrieved 28 April 2022, from https://www.standardmedia.co.ke/eastern/article/2001338668/soda-water-meru-villagers-scoop-for-body-nourishment.
- Mbura, K. S. (2018). Assessment of selected physico-chemical parameters of groundwater in Tharaka Nithi County, Kenya. Masters Degree Thesis. Kenyatta University, Kenya.
- McDowell, R. W., Cox, N., Daughney, C. J., Wheeler, D., & Moreau, M. (2015). A national assessment of the potential linkage between soil, and surface and groundwater concentrations of phosphorus. JAWRA Journal of the American Water Resources Association, 51(4), 992-1002.
- Meride, A., & Ayenew, T. (2020). Groundwater quality assessment and its impact on health: Case study from the Rift Valley Aquifer System, Ethiopia. Science of The Total Environment, 710, 136350. [CrossRef]
- Meride, Y., & Ayenew, B. (2016). Drinking water quality assessment and its effects on residents health in Wondo genet campus, Ethiopia. Environmental Systems Research, 5(1), 1-7.
- Mosiara, S. (2022). Hydrogeochemical analysis and modeling of groundwater in Kenya. a critical literature review. Journal of Chemistry, 1(1), 23-33.
- Muraguri, P. M. (2016). Assessment of Groundwater Quality in Nairobi County, Kenya (Doctoral dissertation, Environmental Legislation and Management, JKUAT).
- Murhekar Gopalkrushna, H. (2011). Assessment of physico-chemical status of groundwater samples in Akot city. Research Journal of Chemical Sciences, 1(4), 117-124.
- Muthukumaravel, K. (2010). Evaluation of groundwater quality in Perambalur. Indian Journal of Environmental Sciences, 14(1), 47-49.
- Napacho, Z. A., & Manyele, S. V. (2010). Quality assessment of drinking water in Temeke District (part II): Characterization of chemical parameters. African journal of environmental science and technology, 4(11), 775-789.
- Nduka, J. K., Orisakwe, O. E., & Ezenweke, L. O. (2008). Some physicochemical parameters of potable water supply in Warri, Niger Delta area of Nigeria. Scientific Research and Essay, 3(11), 547-551.
- Ombaka. O., Gichumbi.J &Kibara. D. (2013). Evaluation of groundwater and tap water quality in villages surrounding Chuka town: Kenya, Journal of Chemical, Biological and Physical sciences.
- ÖZGÜR, M. E., AKBULUT, A., & Demirsoy, A. (2012). Some quality parameters of surface water of Karasu river in upper part of Euphrates Basin, Turkey. Carpathian Journal of Earth and Environmental Sciences, 7(3),183-192.
- Qureshi, S. S., Channa, A., Memon, S. A., Khan, Q., Jamali, G. A., Panhwar, A., & Saleh, T. A. (2021). Assessment of physicochemical characteristics in groundwater quality parameters. Environmental Technology & Innovation, 24, 101877.
- Ramteke, D. S., & Moghe, C. A. (1988). Manual on water and wastewater analysis. National Environmental Engineering Research Institute (NEERI), Nagpur.
- Randev, N., & Puri, S. (2016). Seasonal variation of groundwater quality in vicinity of Buddha Nallah Stream in Punjab, India. Asian Academic Research Journal of Multidisciplinary (AARJMD), 3(5), 84-90.
- Rout, C., & Sharma, A. (2011). Assessment of drinking water quality: A case study of Ambala cantonment area, Haryana, India. International Journal of Environmental Sciences, 2(2), 933-945.
- Selek, A., & Yetis, U. (2022). An integrated approach to assessing groundwater quality and sustainability in coastal aquifers. Water Resources Research, 58(6), e2021WR031678. [CrossRef]
- Selek, Z., & Yetis, A. D. (2017). Assessment of nitrate contamination in a transnational groundwater basin: a case study in the Ceylanpinar Plain, Turkey. Environmental Earth Sciences, 76, 1-11.
- Šimůnek, J. (2015). Estimating groundwater recharge using HYDRUS-1D. Engineering Geology and Hydrogeology, 29, 25-36.
- Singh, V., & Khare, M. C. (2008). Groundwater Quality evaluation for Irrigation purpose in some areas of Bhind, Madhya Pradesh (INDIA). Journal of Environmental Research And Development, 2(3), 347-356.
- Singhal, B. B. S., Gupta, R. P., Singhal, B. B. S., & Gupta, R. P. (2010). Groundwater contamination. Applied Hydrogeology of Fractured Rocks: Second Edition, 221-236.0.
- Sinha, R., & Srivastava, R. (2022). Assessment of groundwater quality and its impact on human health: A case study from the Gangetic Plain, India. Journal of Environmental Management, 311, 114740. [CrossRef]
- Steefel, C. I., Van Capellen, P., Nagy, K. L., & Lasaga, A. C. (1990). Modeling water-rock interaction in the surficial environment: The role of precursors, nucleation, and Ostwald ripening. Chemical Geology, 84(1-4), 322-325.
- Szymkiewicz, A., Gumuła-Kawęcka, A., Potrykus, D., Jaworska-Szulc, B., Pruszkowska-Caceres, M., & Gorczewska-Langner, W. (2018). Estimation of conservative contaminant travel time through vadose zone based on transient and steady flow approaches. Water, 10(10), 1417.
- Taneva, N. (2012). Removal of ammonium and phosphates from aqueous solutions by activated and modified Bulgarian clinoptilolite. Journal of Chemical Engineering and Materials Science, 3(5), 79–85.
- Tredoux, G., Engelbrecht, J.F.P. and Talma, A.S. (2005). Groundwater nitrate in arid and semi-arid parts of southern Africa. In: Vogel, H. and Chilume, C. (Eds), Environmental Geology in Semi-arid Environments, DGS, Lobatse, Botswana, pp. 121-133.
- UN-Water, (2022). UN World Water Development Report: Groundwater—Making the Invisible Visible.
- Van der Wielen, P. W., Voost, S., & van der Kooij, D. (2009). Ammonia-oxidizing bacteria and archaea in groundwater treatment and drinking water distribution systems. Applied and Environmental Microbiology, 75(14), 4687-4695.
- Venkatramanan, S., Chung, S. Y., Ramkumar, T., Rajesh, R., & Gnanachandrasamy, G. (2016). Assessment of groundwater quality using GIS and CCME WQI techniques: a case study of Thiruthuraipoondi city in Cauvery deltaic region, Tamil Nadu, India. Desalination and Water Treatment, 57(26), 12058-12073.
- Wantoputri, N. I., Nugroho, A. R., & Munawaroh, S. (2024). Analysis of Nitrogen Concentration (Nitrate, Nitrite, Ammonia) in Groundwater in Ngaglik SubDistrict, Sleman Regency, Yogyakarta Province. Open Soil Science and Environment, 3(1), 1-8.
- WHO. (2008). World Health Organization. Guidelines for drinking-water quality. Geneva, 1(3): 306-492.
- WHO. (2011). Guidelines for drinking water quality, 4th Edition. Geneva: World Health Organization.
- WHO. (2021). Global Status Report on Water Sanitation and Hygiene 2021. WHO. https://www.who.int/publications/i/item/9789240060429.
- Wilczak, A., Jacangelo, J. G., Marcinko, J. P., Odell, L. H., & Kirmeyer, G. J. (1996). Occurrence of nitrification in chloraminated distribution systems. Journal-American Water Works Association, 88(7), 74-85.
- World Water Assessment Programme (2019). The United Nations World Water Development Report 2019: Leaving No One Behind. Paris, UNESCO. Available at: https://en.unesco.org/themes/water-security/wwap/wwdr/2019.
- Yisa, J., & Tijani, J. O. (2010). Analytical studies on water quality index of river Landzu.American Journal of Applied Sciences VL—7—10.3844/ajassp.2010.453.458.
- Yisa, J., Tijani, J. O., & Oyibo, O. M. (2012). Underground water assessment using water quality index. Leonardo Journal of Sciences VL—21.
Figure 1.
Determined concentration of chemical parameters against Kenya Bureau of Standards (KEBs) permissible standards for drinking water.
Figure 1.
Determined concentration of chemical parameters against Kenya Bureau of Standards (KEBs) permissible standards for drinking water.
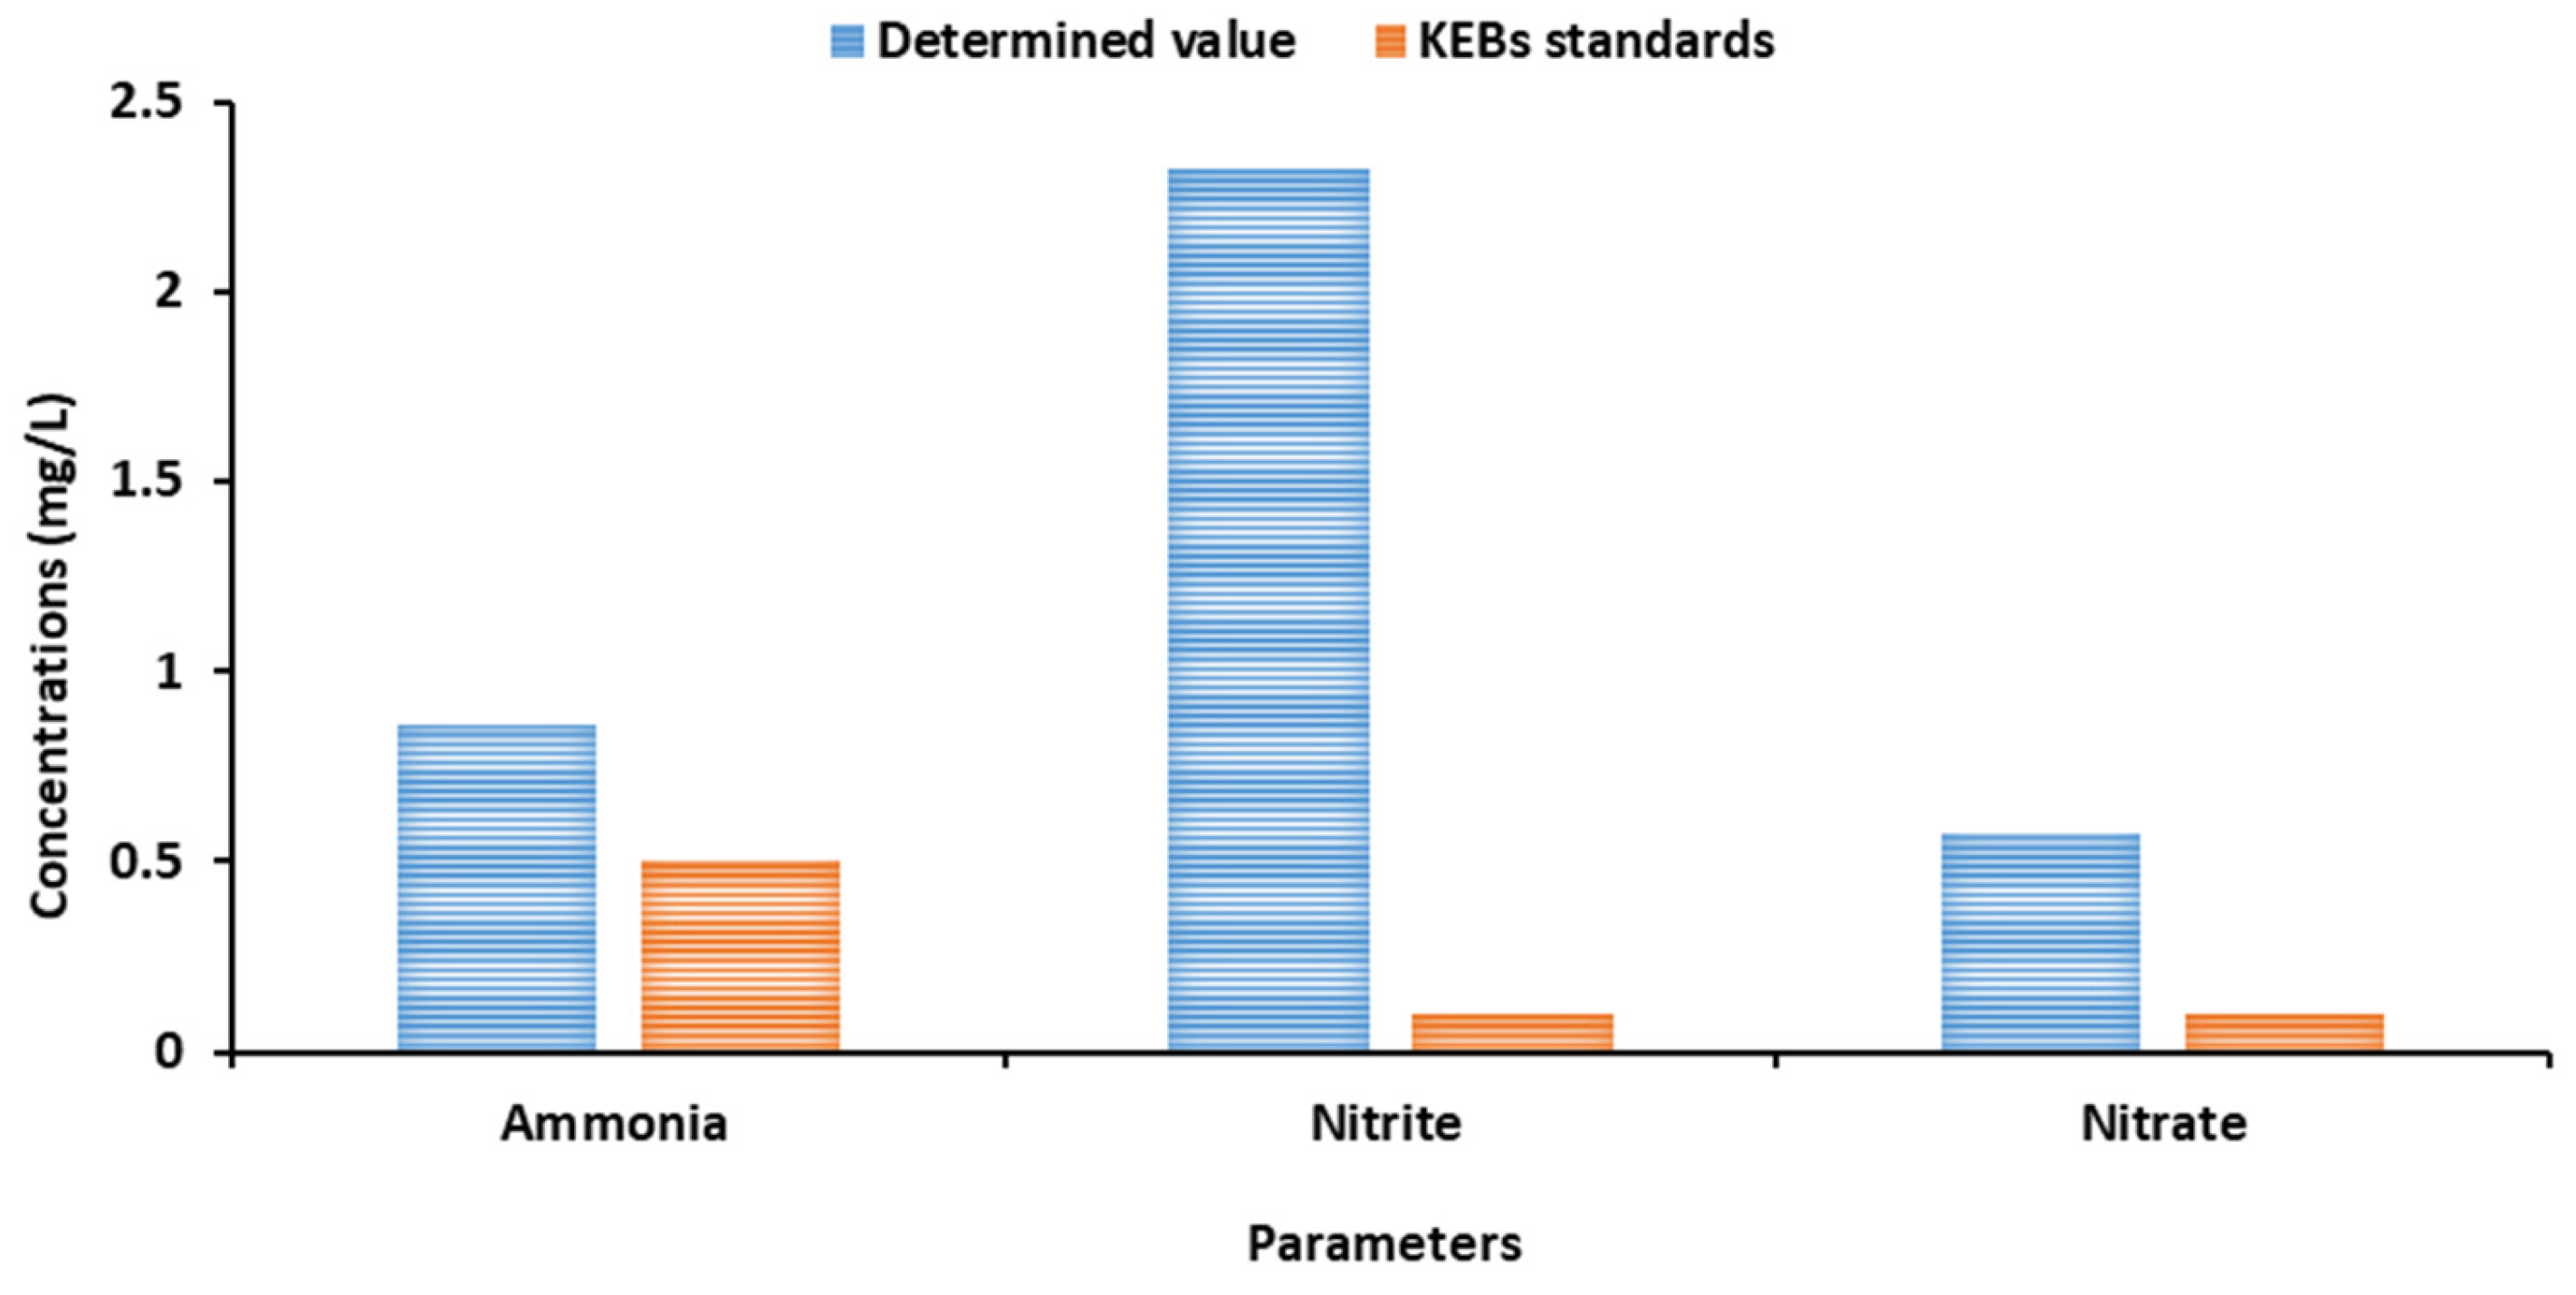
Figure 2.
Graph of absorbance against concentration of Nitrates in Samples.
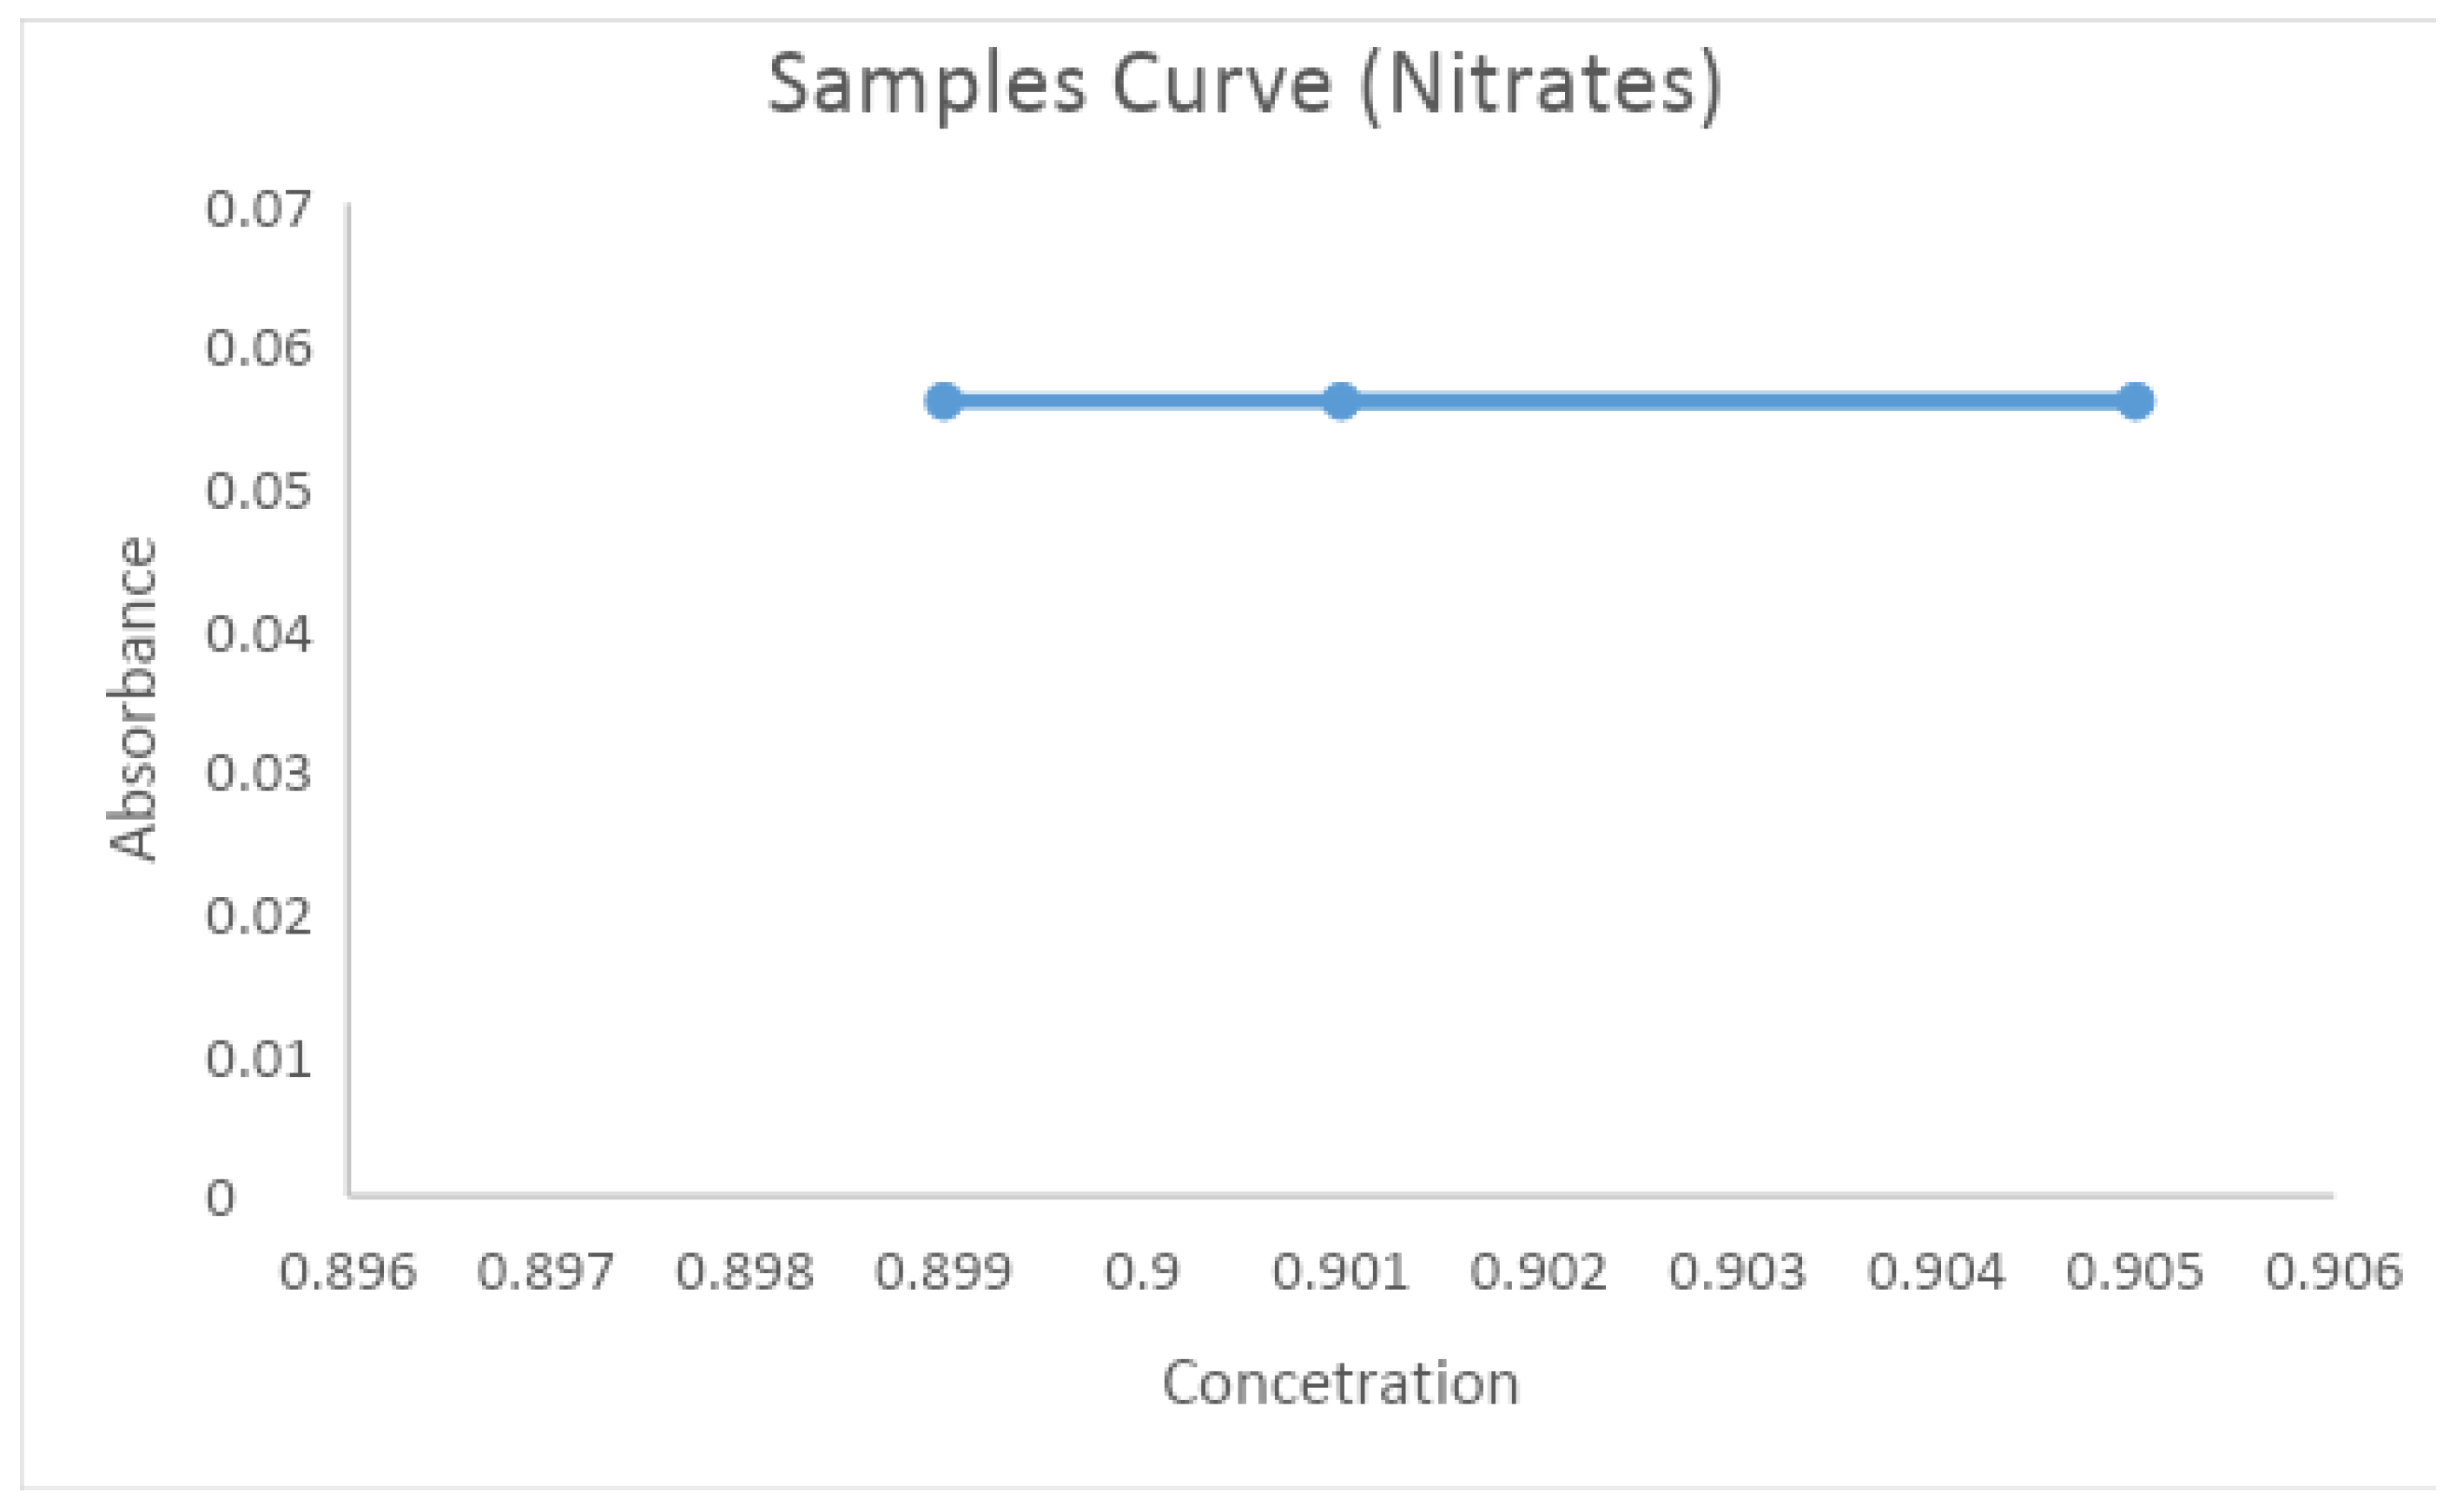
Figure 3.
Determined Fluoride concentration versus Kenya Bureau of Standards (KEBs)permissible standards for drinking water.
Figure 3.
Determined Fluoride concentration versus Kenya Bureau of Standards (KEBs)permissible standards for drinking water.
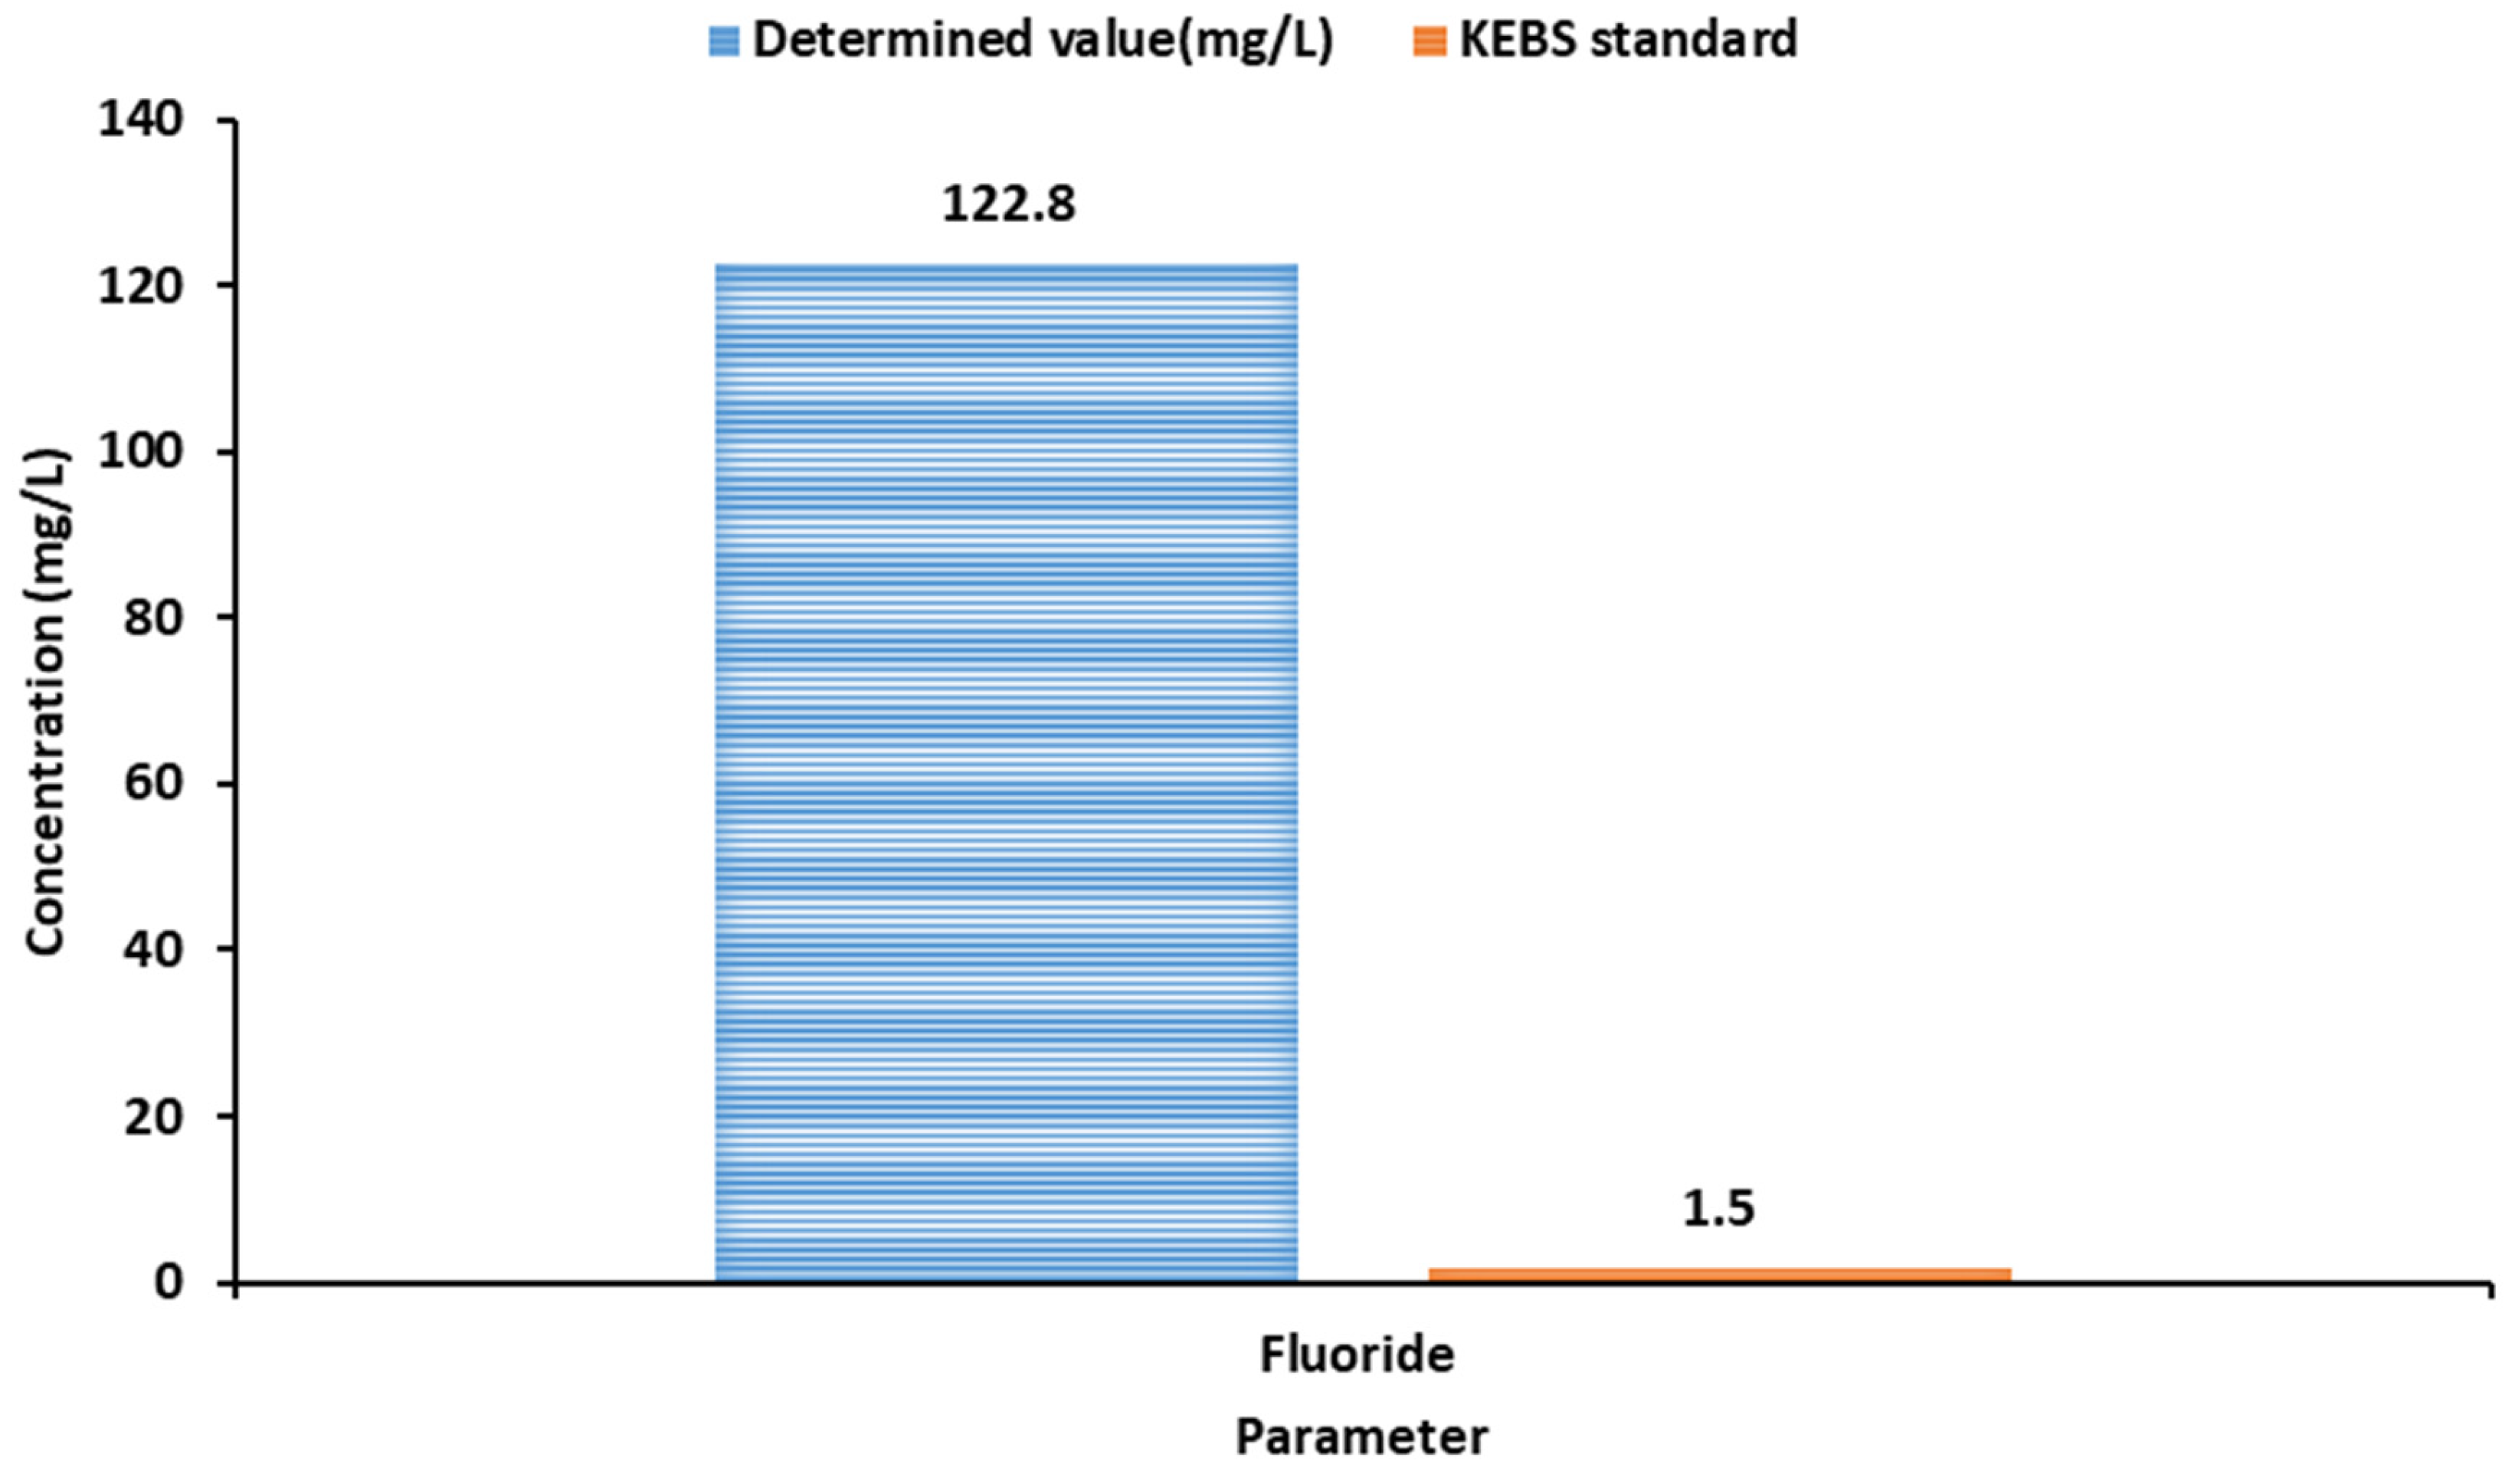
Figure 4.
Graph showing Absorbance against Concentration of Phosphates in Samples.


Table 1.
Physicochemical parameters of groundwater from a natural spring in Nkubu, Kenya, and their comparison with standard values for suitability for human consumption.
Table 1.
Physicochemical parameters of groundwater from a natural spring in Nkubu, Kenya, and their comparison with standard values for suitability for human consumption.
| Parameter | Unit | Determined value | Allowable values | Comments | |
| KEBs value | WHO value | ||||
| Physical | |||||
| Temperature | (°C) | 28.3 | 28–32 | Within permissible level | |
| Color | - | Clear | Clear | No visible color | Within permissible level |
| Odor | - | Odorless | Odorless | Odorless | Within permissible level |
| Taste | - | Effervescent | Pleasant | Pleasant | Within permissible level |
| Chemical | |||||
| pH | pH | 6.36 | 6.5- 8.5 | 6.5- 8.5 | Slightly below the permissible level (acidic) |
| Turbidity | NTU | 16.30 | 5 | 5 | Extremely high turbidity |
| Electrical conductivity | μS/cm | 2380 | 1500 | - | Extremely high conductivity |
| Total dissolved solids | mg/L | 3528 | 1500 | 1000 | Extremely high levels detected |
| Dissolved oxygen | mg/L | 4.2 | - | - | High DO detected |
| Ammonia(NH4+ ) | mg/L | 0.86 | 0.5 | 1.5 | Slightly higher |
| Chloride (Cl- ) | mg/L | 14.3 | 250 | 200-300 | Within permissible level |
| Nitrite (NO2-) | mg/L | 2.32 | 0.1 | 3 | Slightly higher |
| Nitrate (NO3-) | mg/L | 0.57 | 10 | 50 | Within permissible level |
| Phosphate (PO43−) | mg/L | 0.12 | - | - | Low concentration |
| Fluoride (F-) | mg/L | 122.8 | 1.5 | 1.5 | Extremely high levels detected |
Disclaimer/Publisher’s Note: The statements, opinions and data contained in all publications are solely those of the individual author(s) and contributor(s) and not of MDPI and/or the editor(s). MDPI and/or the editor(s) disclaim responsibility for any injury to people or property resulting from any ideas, methods, instructions or products referred to in the content. |
© 2026 by the authors. Licensee MDPI, Basel, Switzerland. This article is an open access article distributed under the terms and conditions of the Creative Commons Attribution (CC BY) license (http://creativecommons.org/licenses/by/4.0/).
Copyright: This open access article is published under a Creative Commons CC BY 4.0 license, which permit the free download, distribution, and reuse, provided that the author and preprint are cited in any reuse.


