
Submitted:
05 February 2026
Posted:
06 February 2026
You are already at the latest version
Preprints on COVID-19 and SARS-CoV-2
Abstract
Introduction: Following the end of the COVID-19 pandemic, excess mortality rates declined in many countries. However, Japan’s excess mortality rate remained elevated even in 2024. Most countries have stopped administering booster vaccines on a large scale; however, Japan continues to recommend COVID-19 vaccination for elderly individuals, and its booster vaccination per capita rate is the highest in the world. This study attempted to identify the variables related to excess mortality rates during and after the pandemic.Methods: The age-adjusted numbers of deaths and excess mortality rates were calculated for Japan's 47 prefectures from 2020 to 2024. Scatter plots were generated to visualize the relationship between the excess mortality rates and doses of COVID-19 booster vaccine administered. The regression model was subsequently conducted to examine variables associated with excess mortality rates during and after the pandemic across Japan's 47 prefectures.Results: In Japan, age-adjusted excess mortality was not observed in 2020 and 2021; however, it increased to 5.9% in 2022 and 4.9% in 2023. This increase continued even in 2024, when the pandemic ended, reaching 5.7%. During the pandemic period from January to September 2022, when vaccine doses were limited to four, the age-adjusted excess mortality rate showed a negative correlation with the number of vaccine doses (r=-0.36, p=0.013). From June 2023 to September 2024, however, after the pandemic ended and doses 5 to 7 were added, a positive correlation emerged (r=0.55, p=0.000064). A multiple regression analysis showed that excess mortality rates after the pandemic was more strongly associated with the number of booster vaccine doses than with the number of COVID-19 infections and population density of the 47 prefectures. Conclusions: The findings of the present study strongly call attention to the negative aspects of frequent COVID-19 vaccination.
Keywords:
excess mortality
; COVID-19 pandemic
; mRNA vaccine
; Japan
Introduction
In Western countries, excess mortalities due to all-causes have been observed since the start of the COVID-19 pandemic in 2020 [1]. The World Health Organization (WHO) declared the end of the COVID-19 state of emergency in May 2023 and most countries stopped administering COVID-19 booster vaccines on a large scale [2]. The highest number of excess deaths occurred from 2020 to 2022, with modest or no excess deaths estimated for 2023 [3]. The situation in Japan differs from that in Western countries. In 2020, when the COVID-19 pandemic began, 3,466 deaths were attributed to COVID-19 infections, accounting for only 0.25% of the total number of all-cause deaths. Following the spread of the Omicron variant, the number of COVID-19-related deaths increased to 47,638 in 2022; however, this still represented only 3.0% of the total number of deaths [4].
In Japan, COVID-19 vaccination for elderly individuals began in April 2021, later than in Western countries. However, the vaccine has since been widely administered, with the total number of vaccinations including the first to seventh vaccinations, reaching 436,193,341 as of March 31, 2024. The vaccination rates for people aged 65 years and over is particularly high (first vaccination: 93.1%, second vaccination: 92.8%, third vaccination: 91.9%, fourth vaccination: 84.8%, fifth vaccination: 73.9%, sixth vaccination: 58.8%, seventh vaccination: 43.8%). Over 99% of the vaccines administered were messenger ribonucleic acid (mRNA) vaccines. Notably, Japan has the highest per capita rate of mRNA vaccine in the world [5].
When comparing the total number of deaths between 2020 and 2024 with the average number of deaths from 2017 to 2019 before the COVID-19 epidemic, crude excess deaths were observed as follows: 11,310 (0.8%) in 2020; 78,471 (5.8%) in 2021; 207,623 (15.3%) in 2022; 214,598 (15.8%) in 2023; and 243,960 (17.9%) in 2024[4]. As Japan is one of most rapidly aging nations in the world, some excess deaths may be attributed to aging. Aligning the age structure makes it possible to compare mortality rates without being affected by aging; therefore, the age-adjusted excess mortality rates were calculated.
Since excess mortality occurred in conjunction with the start of COVID-19 vaccination, from a pharmacovigilance perspective, the excess mortality should be considered as a safety signal. Although a safety signal does not necessarily indicate a causal relationship between vaccination and excess mortality, further investigation is warranted. In Japan, all-cause excess mortality rates varied widely across prefectures. The differences among 47 prefectures in the rates of COVID-19 vaccination facilitate investigation into the relationship between excess mortality rates and vaccine coverage. The present study attempted to identify the variables related to differences in excess mortality rates across prefectures during and after the pandemic.
Materials and Methods
Mortality rates were assessed using age-adjusted mortality rates (AMRs) to eliminate the effects of aging. For age-adjustment, the Ministry of Health, Labour and Welfare in Japan uses direct standardization based on smoothed standard population data from 2015, and the same approach was employed in the present study [6]. The formulas for the calculations are as follows:
age-adjusted number of deaths = Σ (di/pi × psi)
AMR per 100,000 people = [Σ (di/pi × psi)] / Σ psi × 100,000
where i=age group, di=number of deaths in that age group, pi=number in that age group in the observed population, and psi=number in that age group in the standard population.
To calculate excess mortality rates for each prefecture, the average age-adjusted number of deaths and mortality rates for the same month from 2017 to 2019 before the pandemic were used as the baseline values. The rate ratio (RR) was calculated by dividing the AMR from 2021 to 2024 by the baseline value of AMR. Excess or deficit mortality was defined using the following formula: RR = AMR for each period / mean AMR of the same months in 2017 to 2019. Excess or deficit mortality = RR-1 × 100 (%). Relative risks and their 95% confidence intervals (CIs) were calculated to evaluate significance.
Next, scatter plots with regression lines for 47 prefectures were generated to visualize the correlations between excess mortality rates and dose of vaccinations. Significance test for the correlation coefficient was used to estimate the correlation between excess mortality rates and dose of vaccinations. After testing for normal distribution using the Shapiro–Wilk normality test, a significance test for the correlation coefficient was performed using Pearson's method and Spearman's method.
As potential causes of excess mortality, COVID-19 infection and disparities in healthcare standards between urban areas and rural areas were often speculated. Therefore, the variables related to excess mortality rates during and after pandemic period were examined using the regression model, controlling for confounding factors including the dose of booster vaccine, number of COVID-19 infections, and population density of each prefecture. Since age-adjusted excess mortality rate was used, the aging rate was not included as an explanatory variable. Assessment of multicollinearity using a correlation matrix and variance inflation factors (VIFs) did not show any evidence of multicollinearity. Considering the possible presence of heteroscedasticity, White's heteroscedasticity-consistent standard errors (typeHC3) were calculated, and p-values and confidence intervals were adjusted.
Because the WHO declared that the pandemic was over in May 2023, the post-pandemic period in the present study was set from June 1, 2023 to September 31, 2024. Values of p < 0.05 were considered statistically significant. All analyses were performed using R Statistical Software, version 4.3.1 (2023) (The R Foundation for Statistical Computing, Vienna, Austria).
The data analyzed in the present study were obtained from several different official websites. The number of deaths by overall and individual causes in Japan as a whole and each prefecture were obtained from the Ministry of Health, Labour and Welfare’s vital statics [4]. Population estimates by age group required for the age-adjusted analysis were obtained from the national statics of the population estimates [7]. The number of COVID-19 infections in each prefecture was obtained from the Ministry of Health, Labour and Welfare’ s website [8]. Since May 9, 2023, the estimated number of COVID-19 infections in each prefecture was obtained from the Department of Medical Genome Sciences, Research Institute for Frontier Medicine, Sapporo Medical University School of Medicine website [9]. The number of vaccine doses in each prefecture was also obtained from the Sapporo Medical University School website [10]. The population density of each prefecture was obtained from the National Institute of Population and Social Security Research website [11].
Since this descriptive study was based on public-use datasets, it was exempt from Institutional Review Board review and approval, and no informed consent was required.
Results
Table 1 shows the crude and age-adjusted numbers of deaths as well as numbers and rates of excess death from 2020 to 2024. In 2020, the first year of the pandemic before the start of COVID-19 vaccination, there was a decrease in the excess mortality rate of -3.0% compared to the pre-pandemic period. The number (rate) of age-adjusted excess deaths was -6,843 (-0.5%) in 2021. Subsequently, it increased to 74,446 (5.9%) in 2022, 61,831 (4.9%) in 2023, and 72,081 (5.7%) in 2024.
In Japan, COVID-19 vaccination started in April 2021, and seven doses had been administered by September 2024. The present study was divided into four periods based on the number of vaccine doses administered, and the excess mortality rates for all 47 prefectures during each period were calculated. The first period was from April to December 2021, when the first and second doses were administered and before the administration of the third dose began. The second period covered January to September 2022, when the third and fourth doses were administered and before the administration of the fifth dose began. The third period covered October 2022 to May 2023, when the fifth dose was administered and before the sixth dose was initiated. The fourth period began after the pandemic was declared over, spanning from June 2023 to September 2024, during which the sixth and seventh vaccine doses were administered.
The age-adjusted number of deaths per 100,000 population for the 47 prefectures are shown for each period in Table 2. During the first period, Nagano Prefecture had the lowest number at 682.1 persons, while Aomori Prefecture had the highest number at 838.4 persons. In the fourth period as well, Aomori Prefecture had the highest number at 1,622.9 persons. Table 3 shows the excess mortality rates for all 47 prefectures across the four periods. During the first period, Japan's excess mortality rate was 0.0%, but 14 prefectures showed negative excess mortality rates. In the second period, Japan's excess mortality rate increased to 4.2%, and no prefectures showed negative excess mortality rate. In the third period, Japan's excess mortality rate increased to 5.3%, reaching 10% in five prefectures. Even in the fourth period after the pandemic ended, Japan's excess mortality rate remained high at 5.0%.
Table 4 shows the changes in the crude number of deaths due to individual causes. Compared to 2020, the total number of deaths in 2024 increased by 232,650 (17%). Among individual diseases, senility, aspiration pneumonia, and ill-defined/unspecified causes of mortality showed significant increases of 56%, 49%, and 50%, respectively. These three diseases accounted for 47% of the overall increase in total deaths. Septicemia and interstitial pneumonia showed modest increases (20% and 27%, respectively). By contrast, malignant neoplasms, myocardial infarction, other ischemic disease, intracerebral hemorrhage, and cerebral infarction showed either minimal increase or no increase.
The three diseases showing significant increases were primarily seen in elderly individuals; therefore, to eliminate the influence of aging, the age-adjusted mortality rates were compared for each disease between 2020 and the period from 2021 to 2024 (Figure 1). In 2024, mortality rates for senility, aspiration pneumonia, and ill-defined/unspecified causes of mortality showed significant increases of 42%, 36% and 43%, respectively.
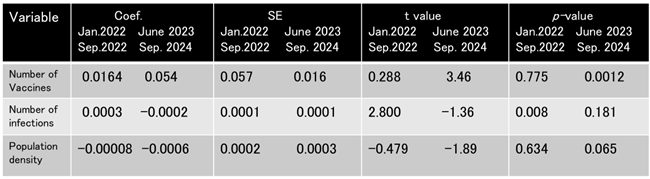
Scatter plots were generated to visualize the relationship between the age-adjusted excess mortality rates and number of COVID-19 infections. During the second period, there was a positive correlation between the excess mortality rates and number of COVID-19 infections (Figure 2A, γ=0.49, p=0.001). However, during the fourth period, the positive relationship between the two disappeared (Figure 2B, γ=-0.18, p=0.22). Multiple regression analysis was used to clarify the variables associated with this change. Adjusted for confounding variables, excess mortality rates had no correlation with number of COVID-19 infections during the fourth period (Table 5).
Scatter plots were also generated to visualize the relationship between the age-adjusted excess mortality rates and number of booster vaccine doses. During the second period, there was a negative correlation between the excess mortality rates and the number of the third and fourth vaccine doses (Figure 3A, r=-0.36, p=0.013). During the fourth period, Japan's overall age-adjusted excess mortality rate was 5.0%, with excess mortality rates across the 47 prefectures ranging from 2.3% to 10.3%. The number of booster vaccines administered per 100 people in each prefecture ranged from 140 to 261. A positive correlation was observed between excess mortality rates and the number of the third to seventh vaccine doses in 46 prefectures (Figure 3B, r=0.55, p=0.000064). Prefectures with higher vaccination rates showed higher excess mortality. Okinawa Prefecture was treated as an outlier because it showed trends significantly different from the other 46 prefectures.
The regression model was conducted to identify age-adjusted excess mortality as the dependent variable, using vaccine coverage, the number of COVID-19 infections, and population density in each prefecture during the corresponding period as explanatory variables. Among these, only the number of booster vaccine doses was found to be a significant factor contributing to excess deaths (Table 5). These findings suggest that excess mortality after the COVID-19 pandemic was related to the number of booster vaccine doses rather than COVID-19 infections.
Discussion
A review of 29 European countries showed 1,642,586 excess deaths over the four-year period from 2020 to 2023, with excess deaths primarily concentrated in 2020 to 2022. A total of 521,642 excess deaths (excess mortality rate: 10.0%) were observed in 2020; 568,186 (11.2%) in 2021; and 443,883 (8.6%) in 2022; however, the total decreased to 108,629 (2.1%) in 2023 [3]. Excess deaths in the United States (US) also peaked at 1,008,369 in 2020 and 1,098,808 in 2021, and showed a downward trend to 820,396 in 2022 and 705,331 in 2023. Although the number of deaths in 2023 decreased compared to the numbers in 2020–2022, excess mortality was still apparent compared to pre-pandemic levels [12]. Thus, excess mortality in Europe and the US peaked in 2020 and 2021 during the early stages of the pandemic, and showed a declining trend by 2023.
Unlike Europe and the US, Japan saw a decrease in the number of age-adjusted deaths in 2020 compared to pre-pandemic levels. According to the report by Devanathan et al., excess mortality in Japan was negative in 2020 (-1.67%), became positive in 2021 (2.19%) and peaked in 2022 (7.55%). Excess mortality showed a slight downward trend to 5.76% in 2023 [13].
Our research has extended their observation until the end of December 2024. Age-adjusted excess mortality in Japan was not observed in 2020 and 2021, but it increased to 5.9% in 2022 and 4.9% 2023. This increase continued even in 2024, when the pandemic ended, reaching 5.7%. Because the excess mortality began in 2021, coinciding with the start of vaccinations, it cannot be explained by population aging alone, as no such increase was seen in 2020 when the pandemic began. Furthermore, the fact that excess mortality persists even after adjusting for age indicates the involvement of variables other than aging.
An analysis of the relationship between the number of COVID-19 infections and the number of vaccine doses administered in each prefecture showed that vaccination led to a decrease in COVID-19 infections up to the fourth dose. However, after the start of the fifth dose, such relationship has disappeared (data not shown).
Experiments in mice have demonstrated that administering the COVID-19 vaccine five or more times suppresses the immune response against the Omicron variant, leading to immune tolerance. Not only was the production of neutralizing antibodies against the Omicron variant suppressed, but activation of CD4-positive and CD8-positive cells was also inhibited, resulting in reduced cellular immune function [14]. In humans, repeated administration of mRNA vaccines has been shown to increase blood IgG4 levels, representing a possible immune tolerance mechanism to the spike protein that could promote unopposed SARS-CoV-2 infection and replication through suppression of natural antiviral responses [15]. In Japan, consecutive measurements of COVID-19-specific cellular immunity in dialysis patients showed the suppression of cellular immunity after administration of the fifth dose [16]. Our observation that the frequency of COVID-19 infections actually increased after the fifth dose is consistent with the results of these reports.
We also conducted an analysis of the relationship between excess mortality rates and the number of vaccinations during the fourth period. Because of not only deaths occurring immediately after vaccination but also deaths occurring after a period following vaccination, the total number of booster vaccines administered between 3 and 7 rounds was used. During the second period, when the third and fourth vaccine doses were administered, a negative correlation was observed between the number of vaccine doses and excess mortality rates . However, in the fourth period, the correlation shifted to a positive one. In other words, increased vaccinations lead to increased excess mortality rates. In the multiple regression analysis, only the number of vaccine doses administered showed a significant correlation with excess mortality rates, while there was no association with the number of COVID-19 infections or population density of 46 prefectures.
Figure 4 shows the number of booster doses administered in each country based on Our World in Data, with the listed date indicating the last update [2]. While increases in vaccination numbers were not seen in other countries since the autumn of 2022, Japan has continued administering booster vaccines to its elderly population, with the total number of vaccines administered far exceeding those of other countries. The findings of our study, combined with Japan's booster vaccination rate, may explain the continued excess mortality observed in Japan even after the end of pandemic.
Few reports have addressed the causes of excess mortality following the pandemic. In the United Kingdom (UK), all-cause excess mortality was 11.3% in 2020 but declined to 4.2% in the post-pandemic period (January 1, 2023 to December 29, 2023) [3]. Among cause-specific excess mortality, the highest rate in 2023 was for influenza pneumonia (52%), followed by chronic lower respiratory disease (22%), dementia and Alzheimer's disease (8%), cerebrovascular diseases (5%) [17].
Hong Kong has also reported cause-specific excess mortality during the post-pandemic period (January 1, 2023 to June 1, 2024). All-cause excess mortality in Hong Kong during the Omicron wave (January 1, 2022 to December 31, 2022) was 19.9%, but it decreased to 6.0% in the post-pandemic period. During this period, the highest cause-specific excess mortality was observed for pneumonia (16.5%), followed by cerebrovascular disease (8.1%) and heart disease (2.7%). Dementia showed a significant decrease of -35.0% [18].
Unlike reports from other countries, the significantly increased cause-specific excess mortality in Japan following the pandemic was attributable to senility, aspiration pneumonia, and ill-defined/unspecified causes. Conversely, cardiac diseases such as ischemic heart disease and cerebrovascular disorders showed either no or only a slight increase. Regarding senility and ill-defined/unspecified causes, there are no comprehensive reports on autopsy findings, and it remains unclear what actually caused these deaths
The proportion of deaths attributed to senility in Japan is exceptionally high at 12.1%, compared to 1.7% in the UK and less than 1% in the US and Germany [19]. By contrast, dementia and Alzheimer's disease, was the main cause of death in the UK in 2022, accounting for 8% of all deaths [17].
Germany has reported findings examining the correlation between excess mortality and vaccination rates across 16 states, dividing the pandemic into three periods: April 2020 to March 2021, April 2021 to March 2022, and April 2022 to March 2023. During the period from April 2021 to March 2022, when vaccinations began, the number of deaths attributed to COVID-19 infections (78,185) was 3.5 times higher than the excess deaths (22,405). During this period, excess deaths showed a strong positive correlation with the number of COVID-19 infections, while exhibiting a strong negative correlation with vaccination rates (γ=-0.78, p<0.001). However, from April 2022 to March 2023, excess deaths (78,493) significantly exceeded COVID-19 infection deaths (38,062), showing a strong positive correlation with vaccination rates (γ=0.65, p=0.006) [20]. Germany's booster vaccination rate by the end of March 2023 was 77 per 100 people, only half that of Japan's 140 per 100 people during the same period [2]. Nevertheless, similar to Japan, a positive correlation was observed between excess mortality rates and the number of vaccine doses administered. Furthermore, while only 1.4% of Germany's total population has received five or more COVID-19 vaccine doses [21], the five-dose vaccination rate among Japanese seniors aged 65 years and older reached 73.9% [5]. In Germany, excess mortality, which peaked at 60,991 in 2022, declined to 12,382 in 2023 and further declined to -31,799 in 2024 [22]. In Japan, no reduction in excess deaths has been observed even in 2023 and 2024, which may reflect the difference in the number of booster vaccines administered between the two countries.
In Japan, despite a decline in COVID-19-related deaths after the pandemic ended, no overall decrease in total deaths was observed. Results from multiple regression analysis suggest that excess mortality rates during this period was associated not with COVID-19 infections, but with booster vaccinations. However, the present study merely suggests a correlation between excess mortality rates and the number of booster doses administered; it does not establish causation. The possibility of ecological fallacy must be considered [23]. Findings from animal studies and human investigations suggesting that receiving five or more COVID-19 vaccine doses may induce immune tolerance provide an important clue when considering a potential causal relationship between vaccination and excess mortality.
The most valuable data for examining causality would be autopsy findings from excess deaths. However, the lack of comprehensive autopsy reports for deaths attributed to senility or ill-defined/unspecified causes, which constitute a large proportion of excess deaths, is a significant drawback. To clarify the causal relationship between vaccination and excess mortality, it is essential to increase the autopsy rates for patients who die following vaccination.
Conclusion
In many countries that did not administer COVID-19 booster vaccinations after the latter half of 2022, excess mortality rates declined following the official end of the pandemic in May 2023. However, in Japan, where booster vaccinations continued, excess mortality persisted even into 2024. A consecutive analysis of variables related to excess mortality revealed that after five or more vaccinations, the previously negative correlation between the number of vaccine doses and excess mortality rates shifted to a positive correlation. In other words, receiving frequent vaccinations caused an increase in excess deaths. As of December 2025, Japan continues to recommend COVID-19 vaccination for elderly individuals. Given the findings of the present study, caution is strongly warranted regarding the negative aspects of frequent COVID-19 vaccination.
References
- Msemburi W, Karlinsky A, Knutson V, et al. The WHO estimates of excess mortality associated with the COVID-19 pandemic. Nature. 2022;613(7942):130–7. Published online December 14, 2022. [CrossRef]
- Explore the global data on COVID-19 Vaccinations [Internet]. Our World in Data. [cited 2025 December 5]. Available from: https://ourworldindata.org.
- Pizzato M, Gerli AG, La Vecchia C, et al. Impact of COVID-19 on total excess mortality and geographic disparities in Europe, 2020–2023: a spatio-temporal analysis. Lancet Regional Health – Europe.2024;44:100996. Published online July 3, 2024. [CrossRef]
- Vital Statics [Internet]. Ministry of Health, Labour and Welfare [cited 2025 December 5]. Available from: https://e-stat.go.jp Japanese.
- Number of COVID-19 vaccine doses [Internet]. Ministry of Health, Labour and Welfare [cited 2025 December 5]. Available from: https://mhlw.go.jp Japanese.
- The standard population for age-adjusted mortality rates [Internet]. Ministry of Health, Labour and Welfare [cited 2025 December 5]. Available from: https://www.mhlw.go.jp/toukei/saikin/hw/jinko/kakutei20/dl/14_nencho.pdf Japanese.
- The national statics of the population estimates [Internet]. Ministry of Internal Affairs and Communications [cited 2025 December 5]. Available from: https://www.stat.go.jp/data/jinsui/2.html#monthly Japanese.
- Number of newly confirmed COVID-19 cases [Internet]. Ministry of Health, Labour and Welfare [cited 2025 December 5]. Available from: https://mhlw.go.jp Japanese.
- Estimated number of COVID-19 cases per population by prefecture [Internet]. Division of Medical Genome Sciences, Department of Genomic and Preventive Medicine, Sapporo Medical University School of Medicine [cited 2025 December 5]. Available from: https://web.sapmed.ac.jp/canmol/coronavirus/index_e.html Japanese.
- COVID-19 vaccination rate in each prefecture [Internet]. Division of Medical Genome Sciences, Department of Genomic and Preventive Medicine, Sapporo Medical University School of Medicine [cited 2025 December 5]. Available from: https:// web.sapmed.ac.jp/coronavirus / vaccine Japanese.
- Demographic data set [Internet]. National Institute of Population and Social Security Research [cited 2025 December 5]. Available from: https://www.ipss.go.jp/tohkei /Popular/P_Detail2022 Japanese.
- Bor J, Raquib RV, Wrigley-Field E, et al. Excess US deaths before, during, and after the COVID-19 pandemic. JAMA Health Forum. 2025; 6(5): e251118. Published online May 23, 2025. [CrossRef]
- Devanathan G, Chua PLC, Nomura S, et al. Excess mortality during and after the COVID-19 emergency in Japan: a two-stage interrupted time-series design. BMJ Public Health. 2025;3(1): e002357. Published online April5,2025. 3. [CrossRef]
- Gao FX, Wu RX, Shen MY, et al. Extended SARS-CoV-2 RBD booster vaccination induces humoral and cellular immune tolerance in mice. iScienc.2022;25(12):105479. Published online December 22, 2022. [CrossRef]
- Uversky VN, Redwan EM, Makis W, et al. IgG4 antibodies induced by repeated vaccination may generate immune tolerance to the SARS-CoV-2 spike protein. Vaccines (Basel).2023; 11(5):991. Published online May 17, 2023. [CrossRef]
- Tani Y, Takita M, Wakui M, et al. Five doses of the mRNA vaccination potentially suppress ancestral-strain stimulated SARS- CoV2-specific cellular immunity: a cohort study from the Fukushima vaccination community survey, Japan. Front. Immunol.2023;14:1240425. Published online August 16, 2023. [CrossRef]
- Excess mortality in England [Internet]. GOV. UK [cited 2025 December 20]. Available from: https //www.go.uk,statistics.ex.
- Li K, Wei Y, Hung CT, et al. Post pandemic excess mortality of COVID-19 in Hong Kong: a retrospective study. The Lancet Regional Health - Western Pacific.2025;58:101554. Published online April 23, 2025. [CrossRef]
- Hayashi R, Imanaga T, Marui E, et al. Senility deaths in aged societies: The case of Japan. Glob Health Med. 2024;6(1):40-48. Published online February 29,2024. [CrossRef]
- Kuhbandner C, Reitzner M. Regional patterns of excess mortality in Germany during the COVID-19 pandemic: a state-level analysis. R. Soc. Open Sci.2025;12(11):250790. Published online November 12, 2025. [CrossRef]
- COVID-19 vaccination dashboard [Internet]. Robert Koch Institute. [cited 2025 December 5]. Available from: https://impfdashbord.de.
- Rockenfeller R, Günther M. Cohort-resolved excess mortality in Germany (2000-2024): Patterns and implications for the SARS-CoV-2 era. PLoS One.2025;20(10): e0334884.Published online October 27, 2025. [CrossRef]
- Piantadosi S, Byar DP, Green SB.The ecological fallacy. Am J Epidemiol.1988;127(5):893-904. [CrossRef]
Figure 1.
Percent changes in each cause of death from 2021 to 2024 relative to the number of deaths in 2020.
Figure 1.
Percent changes in each cause of death from 2021 to 2024 relative to the number of deaths in 2020.
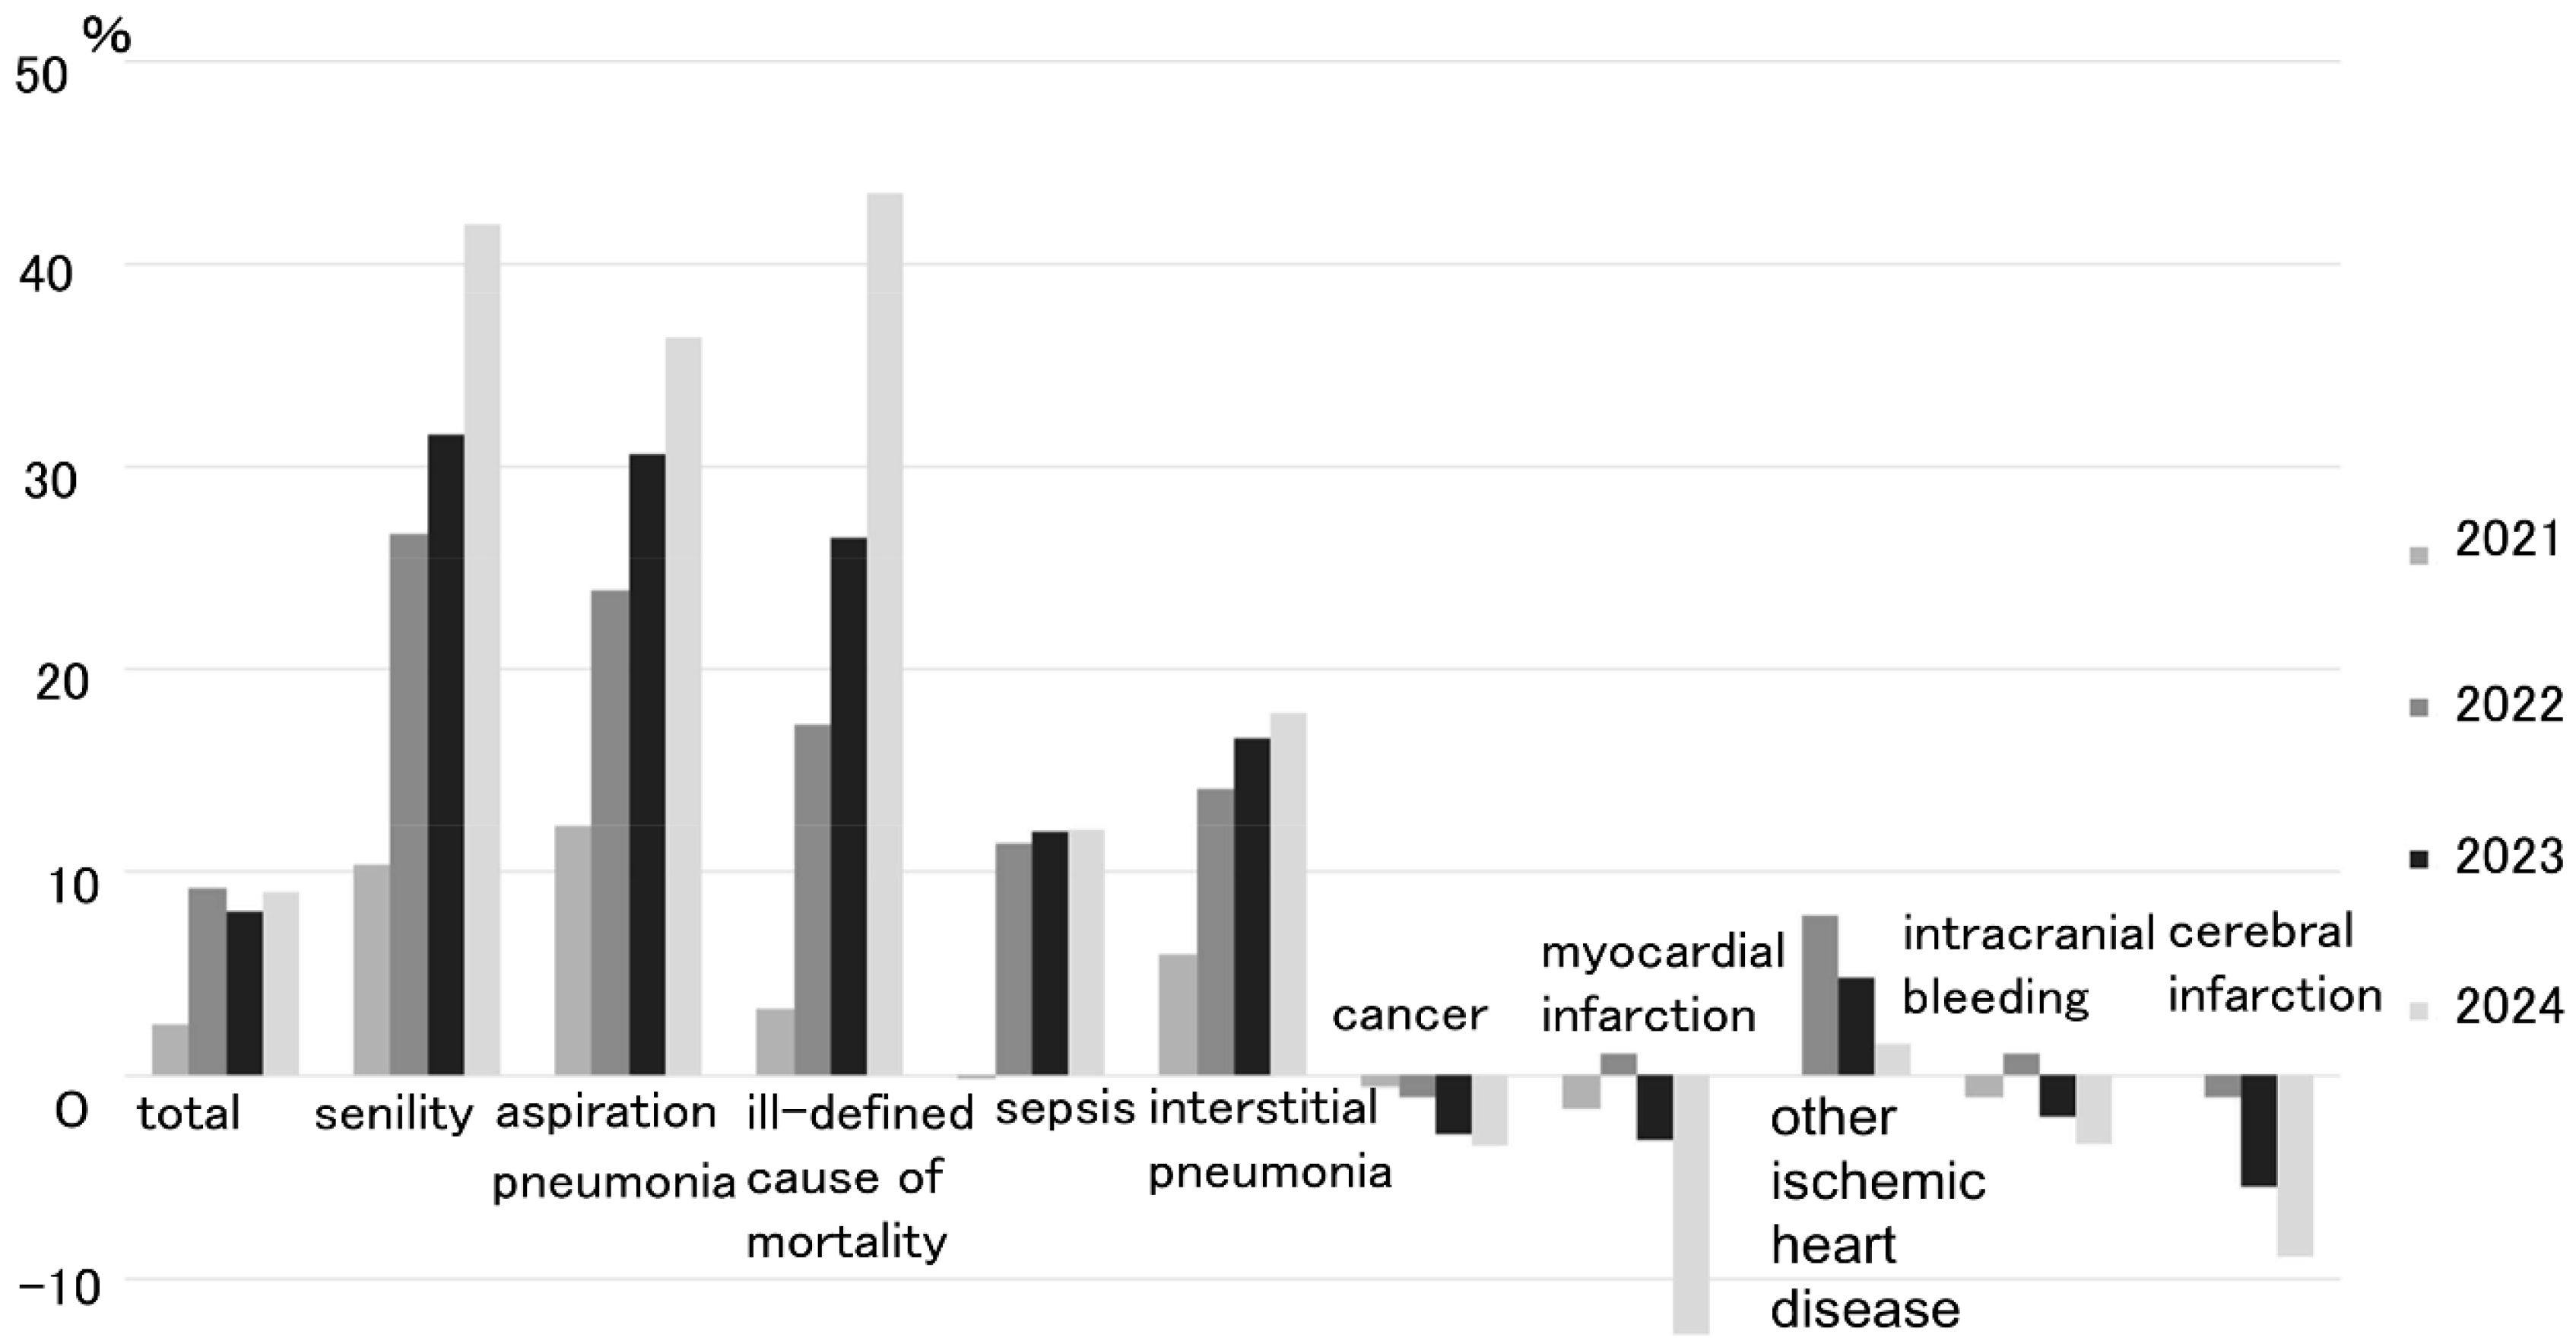
Figure 2.
The relationship between the age-adjusted excess mortality and number of COVID-19 infections. A) There is a positive correlation between the excess mortality and number of COVID-19 infections during January to September 2022 (γ=0.49, p=0.001). B) The positive relationship disappeared during June 2023 to December 2024.
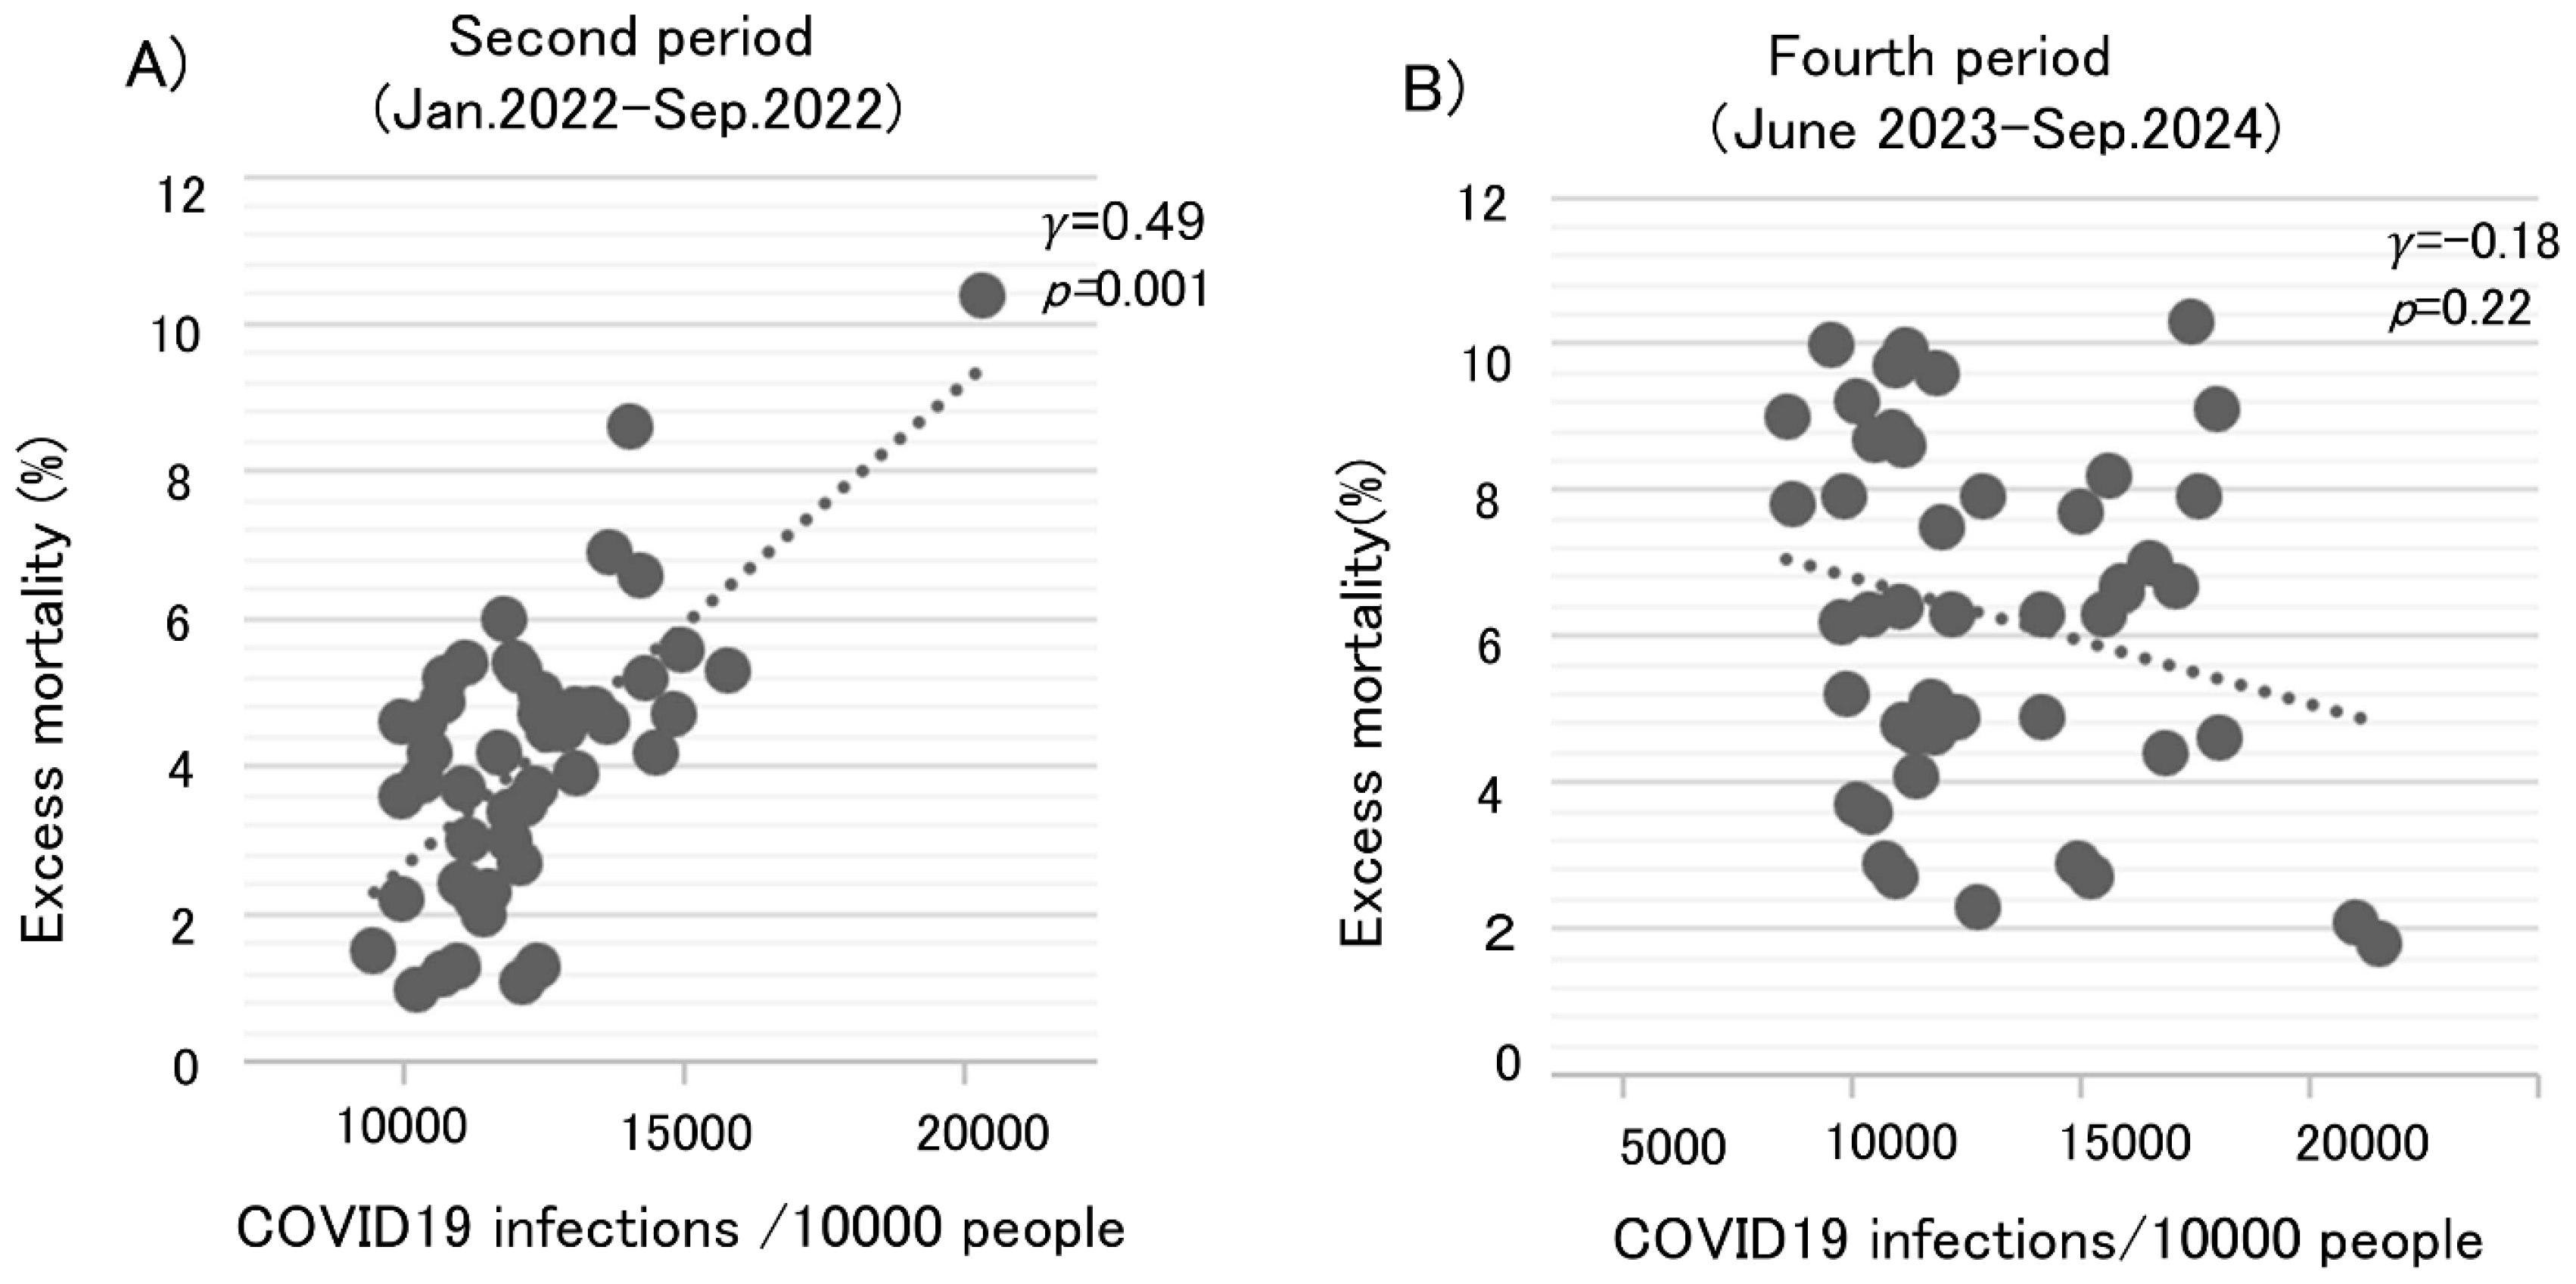
Figure 3.
Age-adjusted excess mortality rates and vaccination rates. A) There is a negative correlation between the excess mortality rates and vaccine doses administered during January 2022 to September 2022 (γ=-0.36, p=0.013). B) There is a positive correlation between the excess mortality rate and vaccine doses administered during June 2023 to December 2024 (γ=0.55, p=0.000064).
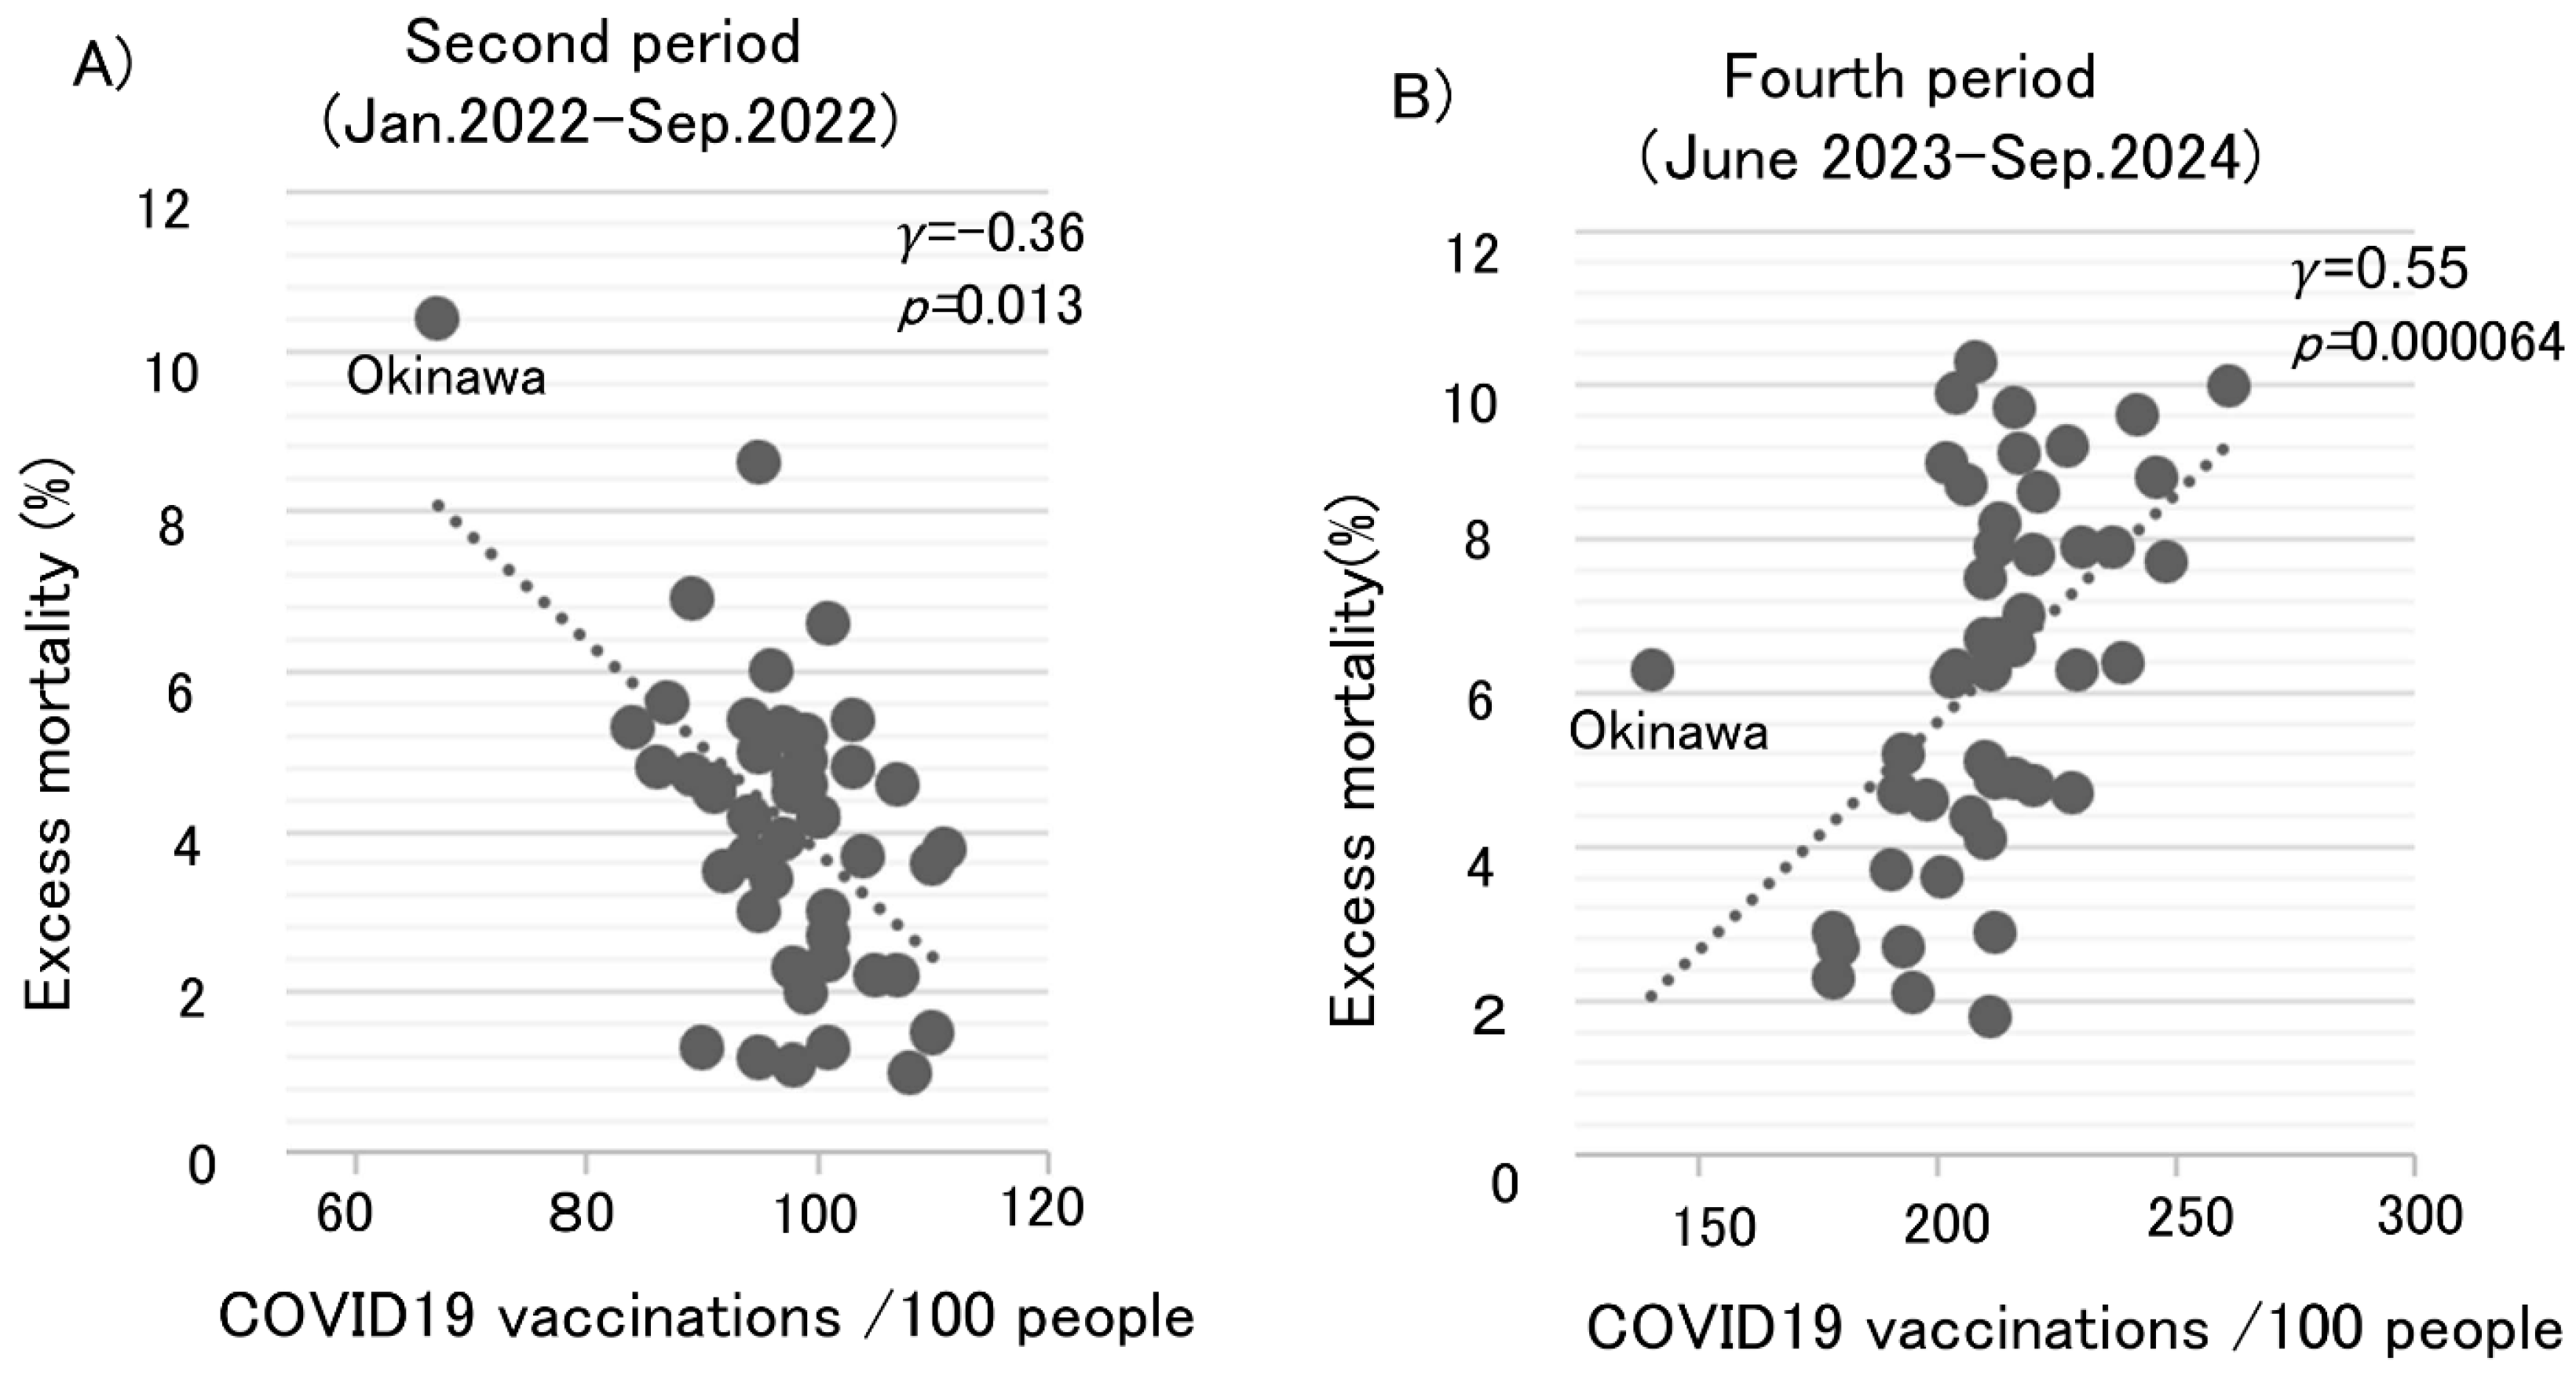
Figure 4.
Number of COVID-19 booster doses administered in each country based on Our World in Data. The booster vaccination rate is expressed as the number of doses administered per 100 people. The dates shown in the figure represent the dates when the data were last updated.
Figure 4.
Number of COVID-19 booster doses administered in each country based on Our World in Data. The booster vaccination rate is expressed as the number of doses administered per 100 people. The dates shown in the figure represent the dates when the data were last updated.
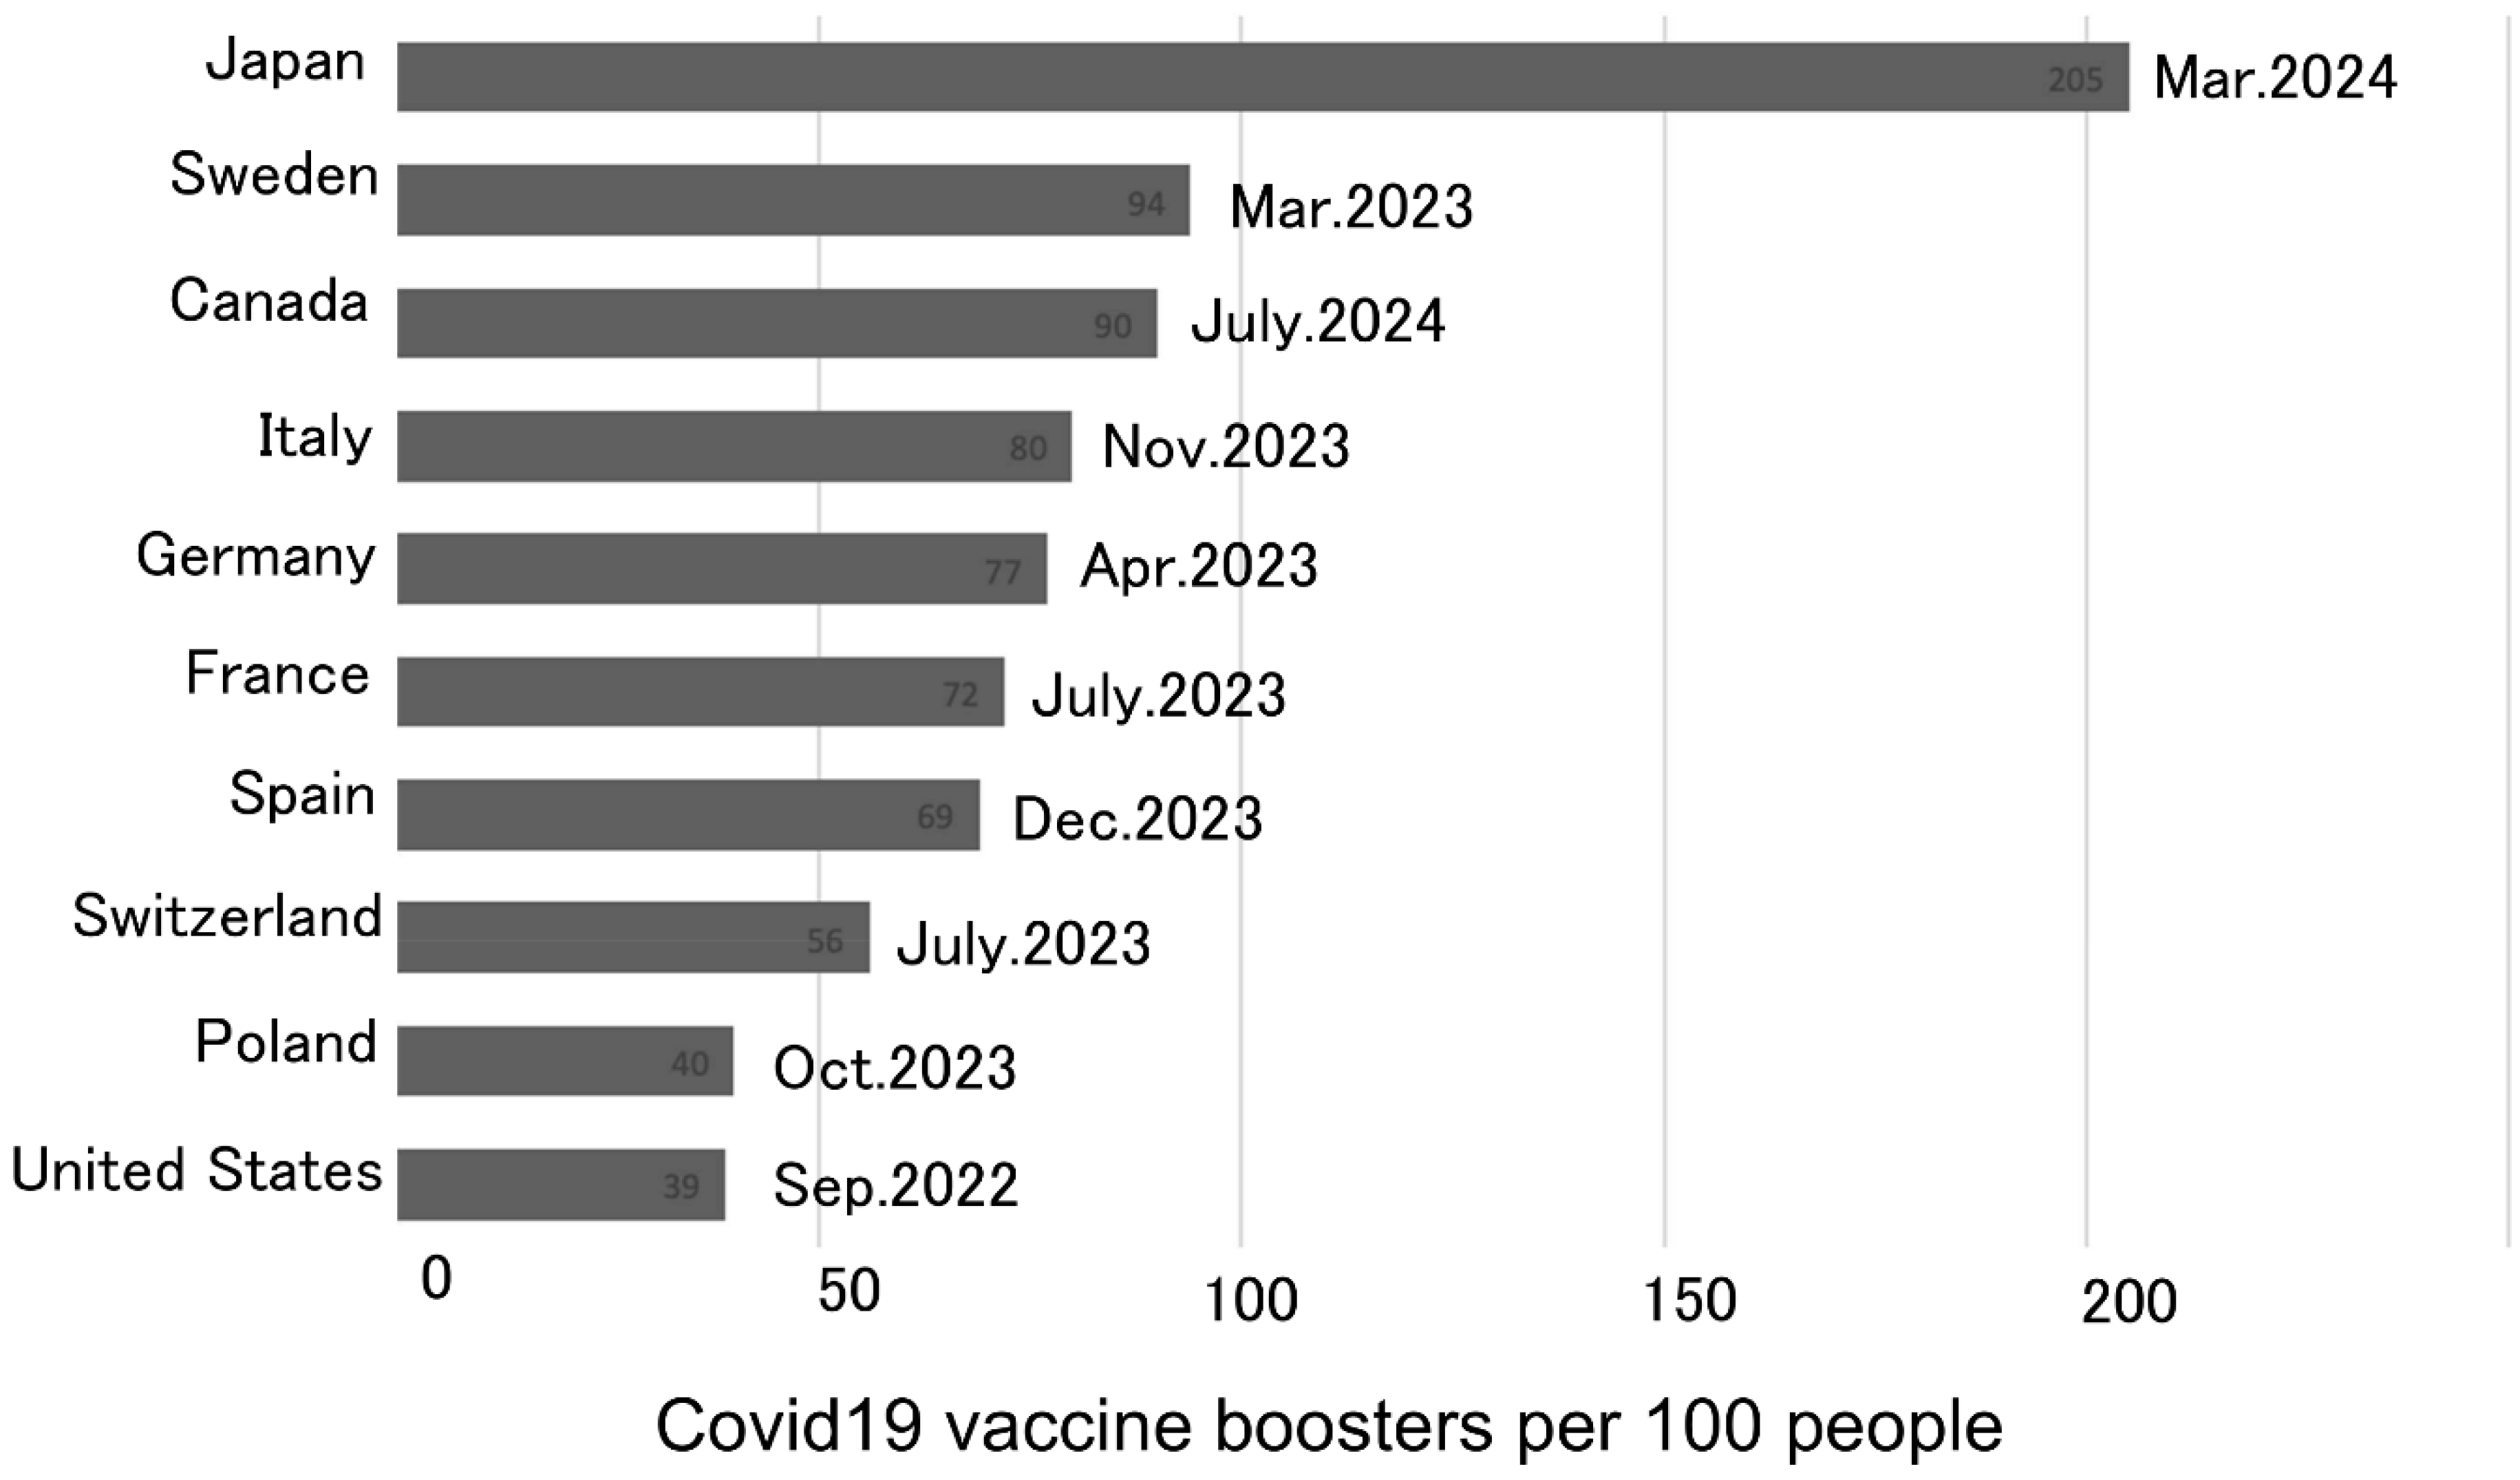

Table 1.
Crude and age-adjusted number of all-cause deaths, excess deaths and excess mortality rates from 2020 to 2024.
Table 1.
Crude and age-adjusted number of all-cause deaths, excess deaths and excess mortality rates from 2020 to 2024.
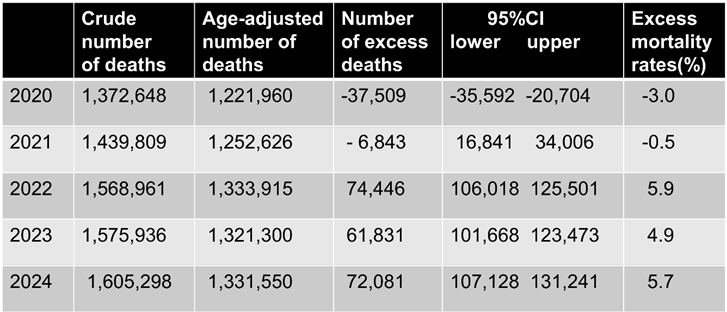 |
Table 2.
Age-adjusted number of deaths per 100,000 population for the 47 prefectures.
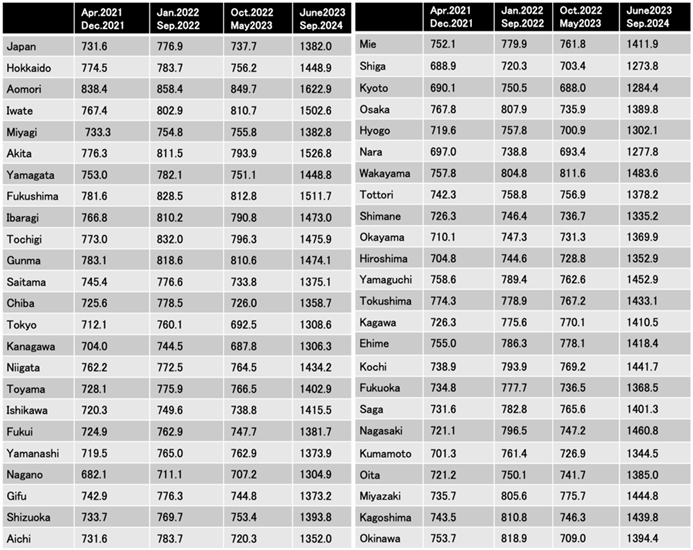 |
Table 3.
Excess mortality rates for the 47 prefectures.
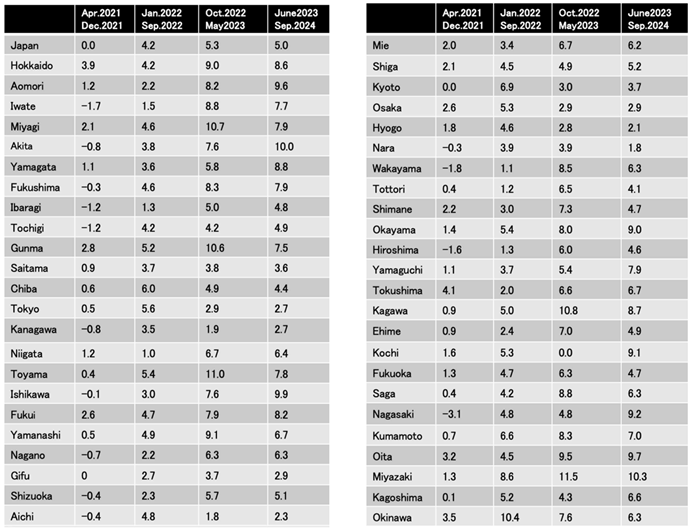 |
Table 4.
Changes in the crude number of deaths due to individual causes from 2020 to 2024.
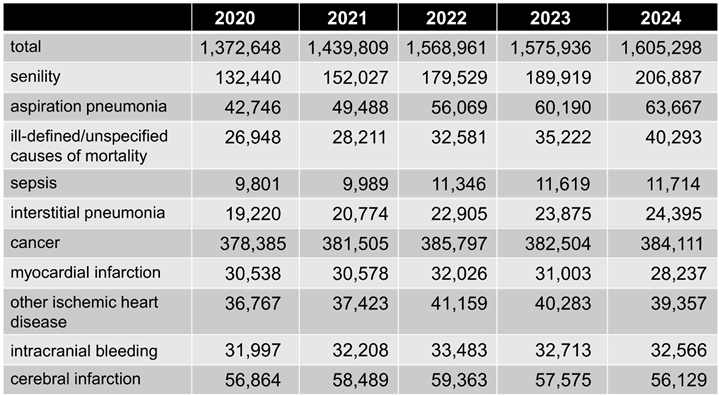 |
Table 5.
Variables contributing to age-adjusted excess mortality during Jan.2022 to Sep.2022 and during June 2023 to Sep. 2024 (Coef.:coefficient, SE: standard error).
Table 5.
Variables contributing to age-adjusted excess mortality during Jan.2022 to Sep.2022 and during June 2023 to Sep. 2024 (Coef.:coefficient, SE: standard error).
 |
Disclaimer/Publisher’s Note: The statements, opinions and data contained in all publications are solely those of the individual author(s) and contributor(s) and not of MDPI and/or the editor(s). MDPI and/or the editor(s) disclaim responsibility for any injury to people or property resulting from any ideas, methods, instructions or products referred to in the content. |
© 2026 by the authors. Licensee MDPI, Basel, Switzerland. This article is an open access article distributed under the terms and conditions of the Creative Commons Attribution (CC BY) license (http://creativecommons.org/licenses/by/4.0/).
Copyright: This open access article is published under a Creative Commons CC BY 4.0 license, which permit the free download, distribution, and reuse, provided that the author and preprint are cited in any reuse.


