
Submitted:
05 February 2026
Posted:
06 February 2026
You are already at the latest version
Abstract
In Japan, low-speed mobility devices (LMDs), such as electric wheelchairs and mobility scooters, are increasingly used to support mobility for older adults and individuals with mobility difficulties. However, during outdoor travel, environmental factors including uneven road surfaces, crowded pedestrian spaces, and narrow sidewalks can impose psychological stress on users and hinder continued LMD use. Identifying locations where stress is likely to occur is therefore important for improving travel comfort and safety. This study proposes a method for identifying stress locations based on environmental data during LMD travel by introducing a Composite Stress Score (CSS) that integrates multiple LMD-specific stress factors. Post-ride questionnaires identified three primary stress factors: poor road surface/vibrations, encounters with others, and narrow sidewalks. These factors were quantified using vertical acceleration, encounter counts derived from onboard video recordings, and sidewalk width, respectively, and stress levels were estimated for 100-m route segments. The relationship between CSS-based stress estimation and physiological stress responses was evaluated using heart rate variability (HRV) indexes. The results show that combining multiple environmental stress factors yields stronger associations with physiological stress responses, and segments classified as high-stress exhibited significantly lower SDNN values. These findings demonstrate the potential of the proposed method to identify stress locations during LMD travel using environmental data.
Keywords:
low-speed mobility devices
; electrict wheelchair
; stress location
; heart rate variability
1. Introduction
1.1. Background
In Japan, the use of low-speed mobility devices (LMDs), such as electric wheelchairs and mobility scooters, has been gaining attention as a measure to ensure transportation options for older adults and individuals with mobility difficulties. LMDs are defined as single-occupant electric vehicles that operate at low speeds. Under the Japanese Road Traffic Act, LMDs with a maximum speed of 6 km/h or less are treated as “pedestrians,” allowing their operation on sidewalks without the need for a driver’s license [1].LMDs are relatively easy to operate and enable mobility with a low physical burden on users. As an effective means of supporting short-distance travel, the number of LMD users, including older adults, has been increasing in recent years [2].
Despite their practicality, the outdoor use of LMDs may impose psychological burdens (i.e., stress) on users due to various environmental factors, such as traffic conditions and sidewalk characteristics. For example, Torkia et al. reported that uneven surfaces, steps, curbs, and other irregularities on sidewalks and roadways, as well as navigating through crowds, make driving electric wheelchairs difficult [3]. Stress caused by such factors can reduce travel comfort and may hinder the continued use of LMDs [4]. One effective approach to mitigating travel-related stress is to identify and avoid locations where stress is likely to occur (hereafter referred to as stress locations). When multiple routes to a destination are available, providing information on stress locations enables users to compare routes and select those that involve lower levels of stress. Even when only a single route to a destination is available, identifying stress locations allows users to prepare appropriate coping strategies in advance. Therefore, the development of methods for identifying stress locations is important.
1.2. Research on Identifying Stress Locations
To date, several studies have investigated the identification of stress locations during outdoor mobility, such as walking or cycling [5,6,7,8].These studies primarily employ physiological-based methods to evaluate stress. Physiological-based methods objectively and continuously evaluate stress by analyzing physiological signals such as heart rate (HR), heart rate variability (HRV), electrodermal activity (EDA), and skin temperature (ST) [9]. By associating stress evaluated using physiological indices with location information obtained from global positioning systems (GPS), stress locations can be identified. For example, Kyriakou et al. [5] proposed a stress detection method based on EDA and ST acquired using wearable sensors and applied spatial hotspot analysis. Their results demonstrated that the identified stress locations showed a high correlation with subjective evaluations and observations derived from video recordings. Kim et al. [6] investigated the use of EDA, HR, and gait patterns to capture environmental stress experienced by pedestrians in real-life settings. Using spatial analysis and machine learning models, they demonstrated that location-based collective pedestrian stress could be predicted with an accuracy of approximately 80%. LaJeunesse et al. [7] examined pedestrian stress using EDA, HR, and GPS data recorded over all walking trips for one week, and found that pedestrian stress was more strongly associated with surrounding roadway characteristics and land-use contexts than with specific crossing locations. Furthermore, Dash et al. [8] presented a method for measuring pedestrian stress using HRV to identify high-stress locations. Their results indicated that elevated stress was associated with pedestrian–scooter interactions, high foot-traffic areas, and poor visibility at crossing. These studies demonstrate the potential of physiological-based methods for identifying stress locations. However, several limitations arise when applying such methods. First, movement during outdoor mobility likely to introduce motion artifacts into physiological signals, which may degrade the accuracy and reliability of stress evaluation [9,10]. Second, reliable physiological measurement typically requires continuous wear with stable skin contact, which imposes significant physical and psychological burdens on users [11,12]. Consequently, measuring physiological signals in real-world environments and over long-term monitoring periods remains challenging. Due to these limitations, identifying stress locations solely based on physiological indicators remains challenging.
To address these challenges, stress estimation approaches based on environmental data have been proposed [13,14,15,16]. These approaches estimate an individual’s stress level through the quantitative assessment of stress-related factors. For example, Li et al. [13] proposed a deep learning system, CyclistAI, that estimates cycling stress using acceleration data and noise levels obtained from smartphone sensors. Their evaluation under various environmental conditions demonstrated that CyclistAI achieved an accuracy exceeding 84%. In addition, Mekuria et al. [15] developed the Level of Traffic Stress (LTS) scale to quantify cyclists’ stress levels based on roadway characteristics such as traffic speed, traffic volume, and the number of lanes. By identifying road segments where cyclists are likely to experience high stress levels, the LTS scale enables the evaluation of cycling infrastructure and the prioritization of infrastructure improvements [17]. Building on this concept, Lin et al. [16] proposed AutoLTS, a deep learning framework that automatically evaluates cycling stress based on LTS using street-view images. AutoLTS estimates the LTS level of each road segment from visual features of the road environment and enables city-scale stress assessment by leveraging publicly available imagery, such as Google Street View. These findings suggest that environment-based approaches offer an effective means of complementing physiological-based methods by mitigating motion-induced accuracy degradation and facilitating large-scale identification of stress locations during outdoor mobility.
1.3. Issues
Because environmental-data-based stress estimation methods infer stress from quantitative assessments of stress-related factors rather than directly measuring users’ perceived stress, the estimated stress may deviate from the stress actually experienced. In particular, using factors only weakly related to stress can degrade estimation accuracy. Therefore, achieving accurate stress estimation requires the appropriate selection and quantitative assessment of stress-related factors.
However, stress-related factors vary depending on the mode of transportation. Previous studies have reported that factors identified as stress factors for one transportation mode may not induce stress in other modes [18]. For example, vibrations transmitted from the road surface constitute a significant stress factor for electric wheelchair users [19], whereas they have a relatively minor impact on pedestrians and are not generally regarded as a stress factor. Furthermore, prior research has shown that even under identical environmental conditions, stress responses vary according to the mode of transportation [20,21]. Accordingly, stress location identification methods based on environmental data that are developed for one transportation mode cannot be applied directly to other modes, as this may result in inaccurate identification of stress locations. To more accurately identify stress locations using environmental data, it is essential to identify and utilize stress factors that are specific to the target transportation mode.
Most existing studies that estimate stress and identify stress locations using environmental data have focused primarily on walking and cycling [13,14,15,16]. However, to the best of our knowledge, the identification of stress locations during LMD travel using environmental data has not been sufficiently explored, and no established methodology currently exists.
1.4. Purpose and Proposal
Based on the issues discussed above, this study aims to develop a method for identifying stress locations during LMD travel. To achieve this goal, we propose a stress location identification method based on environmental data that considers stress factors specific to LMD travel. The proposed method consists of the following steps:
- Since the stress factors specific to LMD travel remain unclear, questionnaire responses completed by users after actual LMD travel are analyzed to extract subjectively perceived stress factors.
- To enable location-specific stress evaluation, the travel route is divided into fixed-length segments.
- For each segment, the identified stress factors are quantitatively evaluated using the corresponding environmental data.
- To capture the combined effects of multiple stress factors acting simultaneously, the quantified stress factors are integrated into a composite index, referred to as the Composite Stress Score (CSS). The CSS is calculated for each segment, and segments are classified into three stress levels—low, medium, and high—thereby enabling the identification of stress-prone segments.
To validate whether the proposed method can capture stress and identify stress locations during LMD travel, correlation analysis is performed between stress estimation results based on the CSS and physiological stress responses derived from heart rate variability (HRV) indices. In addition, physiological stress responses are compared between segments identified as high-stress and low-stress segments.
The remainder of this paper is organized as follows. Section II describes the methodology, including stress factor identification, route segmentation, stress factor quantification using environmental data, calculation of the CSS, and evaluation of the proposed method. Section III presents experimental design and procedures. Section IV reports the experimental results. Section V discusses the findings, and Section VI concludes the paper.
2. Methodology
2.1. Identification of Stress Factors During LMD Travel
To identify subjective stress factors during LMD travel, this study analyzes questionnaire responses collected from users after they completed actual LMD trips. The questionnaire comprises three types of questions. First, respondents are asked to provide free-form descriptions of specific locations where they experienced discomfort. Example prompts, such as “around bridges,” are included to encourage detailed responses. This question aims to capture the spatial context and locational features associated with stress occurrences. Second, a multiple-choice question is presented to identify the causes of discomfort. Respondents may select multiple stress factors from a list of eight environmental factors considered potential stressors during LMD travel: pedestrians, bicycles, noise, temperature and humidity, wind, unfamiliar routes, road surface conditions/vibrations, and brightness. An open-ended “Other” option is also provided to allow respondents to describe additional factors not included in the list. Third, a free-response item asks respondents to explain why the selected factors caused discomfort, thereby providing supplementary information about the specific circumstances and context of the stress experience.
Stress factors are extracted from the survey responses using the following procedure. First, responses to the multiple-choice question on causes of discomfort are aggregated to compute the frequency of each selected stress factor. If unique factors are provided under the “Other” category, they are reviewed and added as new candidate stress factors. Next, the free-form responses regarding discomfort locations and reasons for discomfort are analyzed. Keywords, frequently used expressions, and common semantic themes are extracted and categorized by the researchers based on their semantic similarity. If an extracted element matches an existing stress factor category, it is assigned accordingly. If no suitable category is found, a new stress factor category is created. For example, descriptions such as “large bumps were frightening” or “vibrations made me feel off balance” reflect a common theme of anxiety caused by road surface conditions and are classified under the category Road surface conditions/vibrations. In contrast, responses such as “felt scared crossing a narrow bridge” or “felt uneasy on narrow paths” do not align with any predefined category and are grouped into a newly created category, Narrow sidewalks. Finally, the frequency of responses for all identified stress factor categories—both predefined and newly added—is calculated. This process enables the identification of stress factors encountered during LMD travel, along with their frequency of occurrence in user reports.
2.2. Route Segmentation for Identifying Stress Locations
Route segmentation is performed to associate estimated stress levels with specific locations along the route. The route is segmented using the QChainage plugin in QGIS [22], which generates segment boundary points at fixed intervals, thereby creating equal-length segments. Each boundary point is assigned a timestamp as well as latitude and longitude information. As illustrated in Figure 1 (a), boundary points (red dots) are sequentially placed along the route, and the area between two adjacent boundary points is treated as a single analysis segment.
In this study, the segment length is set to 100 m to enable the calculation and comparison of HRV indices for each segment during method validation. Previous studies have reported that at least 60 s of HRV data are required to ensure the reliability of HRV indices [23,24]. Assuming a maximum LMD speed of 6 km/h, a segment length of 100 m ensures that more than 60 s of HRV data can be obtained within each segment. Therefore, a segment length of 100 m is adopted for stress location identification.
2.3. Quantification of Stress Factors Using Environmental Data
To quantify stress factors during LMD travel, environmental data corresponding to potential stress factors are collected. These data include the presence of pedestrians and bicycles, noise levels, temperature and humidity, wind conditions, road surface conditions and vibrations, as well as sidewalk-related information. Details of the data acquisition methods are described in Section 3.4.
In this study, stress factors used for stress estimation are limited to those reported by at least 25% of the participants. Because stress perception varies across individuals, stress estimation based on environmental data focuses on stress factors shared by multiple users to improve general applicability. Accordingly, a reporting threshold of 25% is adopted to reduce the influence of infrequently reported factors while avoiding overly restrictive selection.
Stress factors are quantified on a segment-by-segment basis by synchronizing environmental data with GPS data using a common timestamp. The quantification procedure consists of three steps: (1) temporal synchronization of environmental and GPS data, (2) determination of entry and exit times for each segment, and (3) extraction and aggregation of environmental data within the corresponding time interval to compute representative values for each segment.
The entry and exit times of each segment are determined by matching the segment boundary points defined through route segmentation with the GPS trajectory. As illustrated in Figure 1(b), geodesic distances are calculated between all GPS observation points and all segment boundary points. For each boundary point, the GPS observation point with the minimum distance is identified and defined as the match point. The timestamp associated with the match point is regarded as the time at which the boundary point is passed and is used as the entry or exit time of the corresponding segment.
The quantified values of each stress factor for each segment are classified into three levels (Levels 1–3) to represent stress factor intensity. For stress factors with established evaluation criteria or predefined threshold values, level classification is performed based on those criteria. For factors without widely accepted thresholds, a quantile-based classification method is applied [25]. This method is robust to differences in data distribution and less sensitive to outliers, enabling segment-level data to be divided into three levels based on relative magnitude. As a result, stress factor intensities can be consistently compared across segments, even when absolute scales differ among stress factors.
2.4. Composite Stress Score Calculation
To integrate the effects of multiple stress factors, the CSS is calculated for each segment based on the classified scores of the quantified stress factors. The CSS for segment , denoted as , is defined as the sum of the classification scores of all stress factors, as given in (1).
where denotes the classification score of stress factor in segment , and is the number of stress factors. Since each classification score ranges from 1 to 3, the CSS takes values between 1 and . Based on the CSS, each segment is classified into three stress levels: Low, Moderate, and High. The CSS range (1–) is equally divided into three intervals, and the stress level of segment is defined as (2)
For example, when the composite score is calculated based on two stress factors (), segments with a score of 2 or less are classified as Low, those with scores of 3–4 as Moderate, and those with scores of 5–6 as High. By integrating the effects of multiple stress factors into a single composite score, this method enables quantitative evaluation of segment-level stress intensity along the travel route.
2.5. Evaluation of the Proposed Method
To evaluate the effectiveness of the proposed method for identifying stress locations during LMD travel based on environmental data, physiological stress responses are assessed using HRV indices. This section describes the HRV indices employed in this study and the validation procedure.
2.5.1. HRV Indices Used in This Study
HRV represents fluctuations in consecutive interbeat intervals (RR intervals, RRI) and is a physiological indicator that reflects the activity of the autonomic nervous system (ANS). HRV indices are widely used as reliable objective measures for stress evaluation [26,27]. Previous studies have reported that stress induces activation of the sympathetic nervous system (SNS), leading to reduced HRV [28].
HRV analysis can be conducted using time-domain, frequency-domain, and nonlinear methods [29]. Among these, time-domain analysis quantifies the magnitude of HRV fluctuations and has been shown to provide reliable indices even with relatively short recording durations [23,30]. Time-domain HRV indices are also reported to be less sensitive to motion artifacts than frequency-domain indices [31]. Furthermore, the effectiveness of time-domain HRV indices derived from ultra-short-term recordings (30–120 s) has been demonstrated for stress evaluation during walking [32].
Representative time-domain HRV indices include the standard deviation of normal-to-normal intervals (SDNN), the root mean square of successive differences (RMSSD), and the percentage of successive RR interval differences greater than 50 ms (pNN50). SDNN reflects both sympathetic and parasympathetic activity, whereas RMSSD and pNN50 primarily reflect parasympathetic activity [29]. These indices are commonly used to assess stress, with lower values indicating higher stress levels [33]. In this study, SDNN, RMSSD, and pNN50 are adopted as physiological indicators for stress evaluation.
2.5.2. Validation Procedure
The validity of the proposed method is evaluated using HRV indices through the following procedure. First, subjectively perceived stress factors extracted from post-travel questionnaires are quantified using corresponding environmental data, and the relationship between the resulting composite stress score and HRV indices is examined using Spearman’s rank correlation analysis. This analysis assesses the extent to which the stress factor based on environmental data reflects physiological stress responses. Next, route segments are classified into low-stress and high-stress groups based on the CSS. HRV indices—SDNN, RMSSD, and pNN50—are then compared between the two groups. It is hypothesized that HRV values are significantly lower in high-stress segments than in low-stress segments, reflecting increased physiological stress. Prior to between-group comparisons, normality is assessed using the Shapiro–Wilk test. If normality is satisfied, repeated-measures analysis of variance (ANOVA) is applied; otherwise, the Friedman test is used. For post hoc analysis, paired t-tests with Bonferroni correction are conducted when normality is satisfied, while the Wilcoxon signed-rank test is used when normality is not satisfied. The significance level is set to .
3.. Experiments
To evaluate the effectiveness of the proposed method, experiments were conducted using environmental data and HRV data collected during actual LMD travel. Based on real-world environmental data and HRV data recorded while participants operated an LMD, this study examines the identification of stress factors during travel and evaluates whether the proposed method can identify stress locations. In this study, an electric wheelchair is used as a representative example of an LMD.
3.1. Participants
A total of 37 healthy adults (15 females and 22 males) aged between 19 and 32 years participated in the experiment. The participants were from nine different countries, with a mean age of 23.3 years (SD = 3.8). All participants completed the experiment following the same experimental protocol and travel route. Regardless of prior experience with LMDs, all participants received training on the basic operation of the electric wheelchair before the experiment. Only participants who were judged to be able to operate the wheelchair safely were allowed to participate.
3.2. Experimental Setup
In this study, participants operated an electric wheelchair and traveled along a predefined route. The electric wheelchair used in the experiment was the WHILL Model CR (WHILL Inc., Japan), which has a maximum speed of 6 km/h, a cruising range of 18 km, and a maximum climbing capability of 10°. The wheelchair allows speed control and steering via a joystick and is equipped with a safety function that automatically limits speed on steep slopes.
This study was approved by the Ethics Committee of Shibaura Institute of Technology (Approval No. 23-048). During the experiment, an experimenter followed each participant from behind to ensure safety and provide assistance when necessary. The experiments were conducted between July and December and were divided into four daily time slots: 9:00–10:30, 10:45–12:15, 13:30–15:00, and 15:15–16:45.
3.3. Route Selection
The travel route used in this experiment is shown in Figure 2 The route was set along sidewalks in the Toyosu area of Koto Ward, Tokyo, Japan, forming a clockwise loop of approximately 2.7 km with the Toyosu Campus of Shibaura Institute of Technology as the starting point. The route was selected to include a variety of urban sidewalk environments that LMD users may encounter, such as residential areas, bridge sections, narrow sidewalk segments, and crowded pedestrian areas, thereby enabling the evaluation of stress locations under diverse urban conditions. For safety considerations during the experiment, intersections including crosswalks were excluded from the travel route.
3.4. Data Collection
During the experiment, multimodal data were simultaneously collected to identify stress locations during LMD travel. All sensors were mounted on the electric wheelchair, enabling synchronized data acquisition during the trip (Figure 3)
The collected data consisted of environmental data, positional data, physiological data, and post-travel questionnaires. Environmental and positional data were used to identify stress locations, while physiological data were collected to validate the stress estimation results. Post-travel questionnaires were conducted to capture stress factors experienced during travel.
3.4.1. Environmental Data
Noise levels were recorded at 0.5 Hz using a sound level meter (SL-42023SD, Sato Sho-Ji Corp., Japan), with a measurement range of 30–130 dB. Temperature, humidity, wind speed, and illuminance were measured at 0.5 Hz using a multifunction environmental meter (EMC-9400SD, Sato Sho-Ji Corp., Tokyo, Japan). The measurement ranges were 0–50 °C for temperature, 0–95% RH for humidity, 0.4–25.0 m/s for wind speed, and 0–20,000 lux for illuminance. All sensors were connected via cables to the main unit, and the recorded data were stored on an SD card.
To evaluate vibrations during LMD travel, three-axis acceleration data were recorded at 100 Hz using a smartphone rigidly mounted on the electric wheelchair. Although auxiliary acceleration measurements were also obtained using an Arduino microcontroller with a GY-521 (MPU-6050) sensor at 2 Hz, only the smartphone-based acceleration data were used for vibration analysis due to its higher sampling frequency. The orientation of the acceleration axes is shown in Figure 3.
To capture road surface conditions and changes in the surrounding environment, forward-facing video was recorded using a GoPro Hero11 Black. Timestamped video was simultaneously recorded using Open Broadcaster Software (OBS) to enable synchronization with other sensor data. In addition, spatial information related to sidewalks was collected using Google Maps and OpenStreetMap (OSM), including sidewalk width, road classification, and surface type.
3.4.2. GPS Data
GPS data were collected at 1 Hz using the smartphone’s built-in GPS via the Sensor Logger application. The recorded data included latitude, longitude, altitude, speed, and positioning accuracy.
3.4.3. Physiological Data
HRV can be measured using electrocardiography (ECG) or photoplethysmography (PPG); however, PPG is susceptible to motion-induced noise, and its signal quality has been reported to degrade during movement, particularly when using mobility devices [32]. Therefore, ECG was adopted in this study to ensure signal stability. HRV was measured using a wearable ECG sensor (myBeat WHS-1, Union Tool Co., Tokyo, Japan), which recorded ECG signals at a sampling frequency of 1000 Hz. The acquired signals were processed and stored as time-series data of RRI. As shown in Figure 3., the sensor was attached to the participant’s chest using disposable electrode pads.
3.4.4. Survey
In the experiment, three questionnaire surveys were conducted. The pre-experiment questionnaire collected demographic information and self-reported health conditions. After a rest period, participants completed a questionnaire using the Self-Assessment Manikin (SAM) scale [34] to assess perceived comfort and arousal. In addition, the post-experiment questionnaire included the SAM scale as well as items evaluating riding comfort, perceived discomfort factors (e.g., vibrations and slopes), and qualitative feedback on specific locations where stress or pleasant experiences were encountered during travel
3.4. Procedures
The experiment was conducted as follows. After receiving an explanation of the study, written informed consent was obtained from each participant. Participants then completed the pre-experiment questionnaire, after which they attached the ECG sensor in a private room and rested for 2 minutes to record baseline HRV data. Next, participants received instructions on operating the electric wheelchair and were given time to practice. They then navigated the designated route using the electric wheelchair, with freedom to adjust speed and maneuvering. If a participant forgot the route, they were instructed to refer to a provided A4-sized map or consult the experimenter accompanying them from behind. After completing the route, participants completed the post-experiment questionnaire, the ECG sensor was removed, and the experiment concluded.
3.5. Data Processing
3.5.1. Evironmental Data Processing
To achieve temporal synchronization with the GPS data, the timestamps of the environmental data (temperature, humidity, wind speed, illuminance, and sound pressure level) were converted to Japan Standard Time (JST). The validity of each dataset was then examined, and samples containing anomalous values were excluded from the analysis.
Vibration was evaluated using acceleration data. Tri-axial acceleration data acquired using a smartphone were preprocessed as follows. First, UNIX timestamps were converted to JST to ensure temporal synchronization with other sensor data. Next, a band-pass filter with a passband of 0.5–45 Hz was applied to remove low-frequency drift and high-frequency noise components. Subsequently, the mean acceleration of each axis (X, Y, and Z) was calculated during periods when the electric wheelchair was stationary and subtracted from the acceleration data recorded during motion to perform offset correction. Using the corrected data, the root mean square (RMS) of the vertical acceleration was calculated at 1-s intervals [35].
Forward-facing video captured by a camera mounted on the electric wheelchair was processed to detect pedestrians and cyclists encountered during LMD travel and to count their numbers. Pedestrian and cyclist detection was performed using a pretrained YOLOv11m model provided by the Ultralytics Python library [36]. YOLOv11m was selected for this study because it provides a balance between high detection accuracy and inference speed suitable for real-time processing compared with earlier YOLO models [37]. When estimating traffic volume, pedestrians and cyclists were not distinguished. Instead, they were both aggregated into the “person” class defined in the pretrained model. To ensure the reliability of the detection results used in the analysis, only detections with a confidence score of 0.80 or higher were considered. Furthermore, to prevent duplicate counting of the same individual and to accurately quantify encounter events, each detected person was assigned a unique ID and tracked across frames. This approach enabled accurate counting of the number of unique individuals encountered at least once during travel. Since this study focused solely on quantifying the frequency of encounters with pedestrians and cyclists, the distance between the LMD user and detected individuals and their apparent size in the video frames were not considered.
3.5.2. GPS Data Processing
GPS data were preprocessed to ensure temporal consistency and data completeness. First, timestamp was converted to the local time zone to align with other sensor data. Samples with missing latitude or longitude values were removed, and the remaining data were sorted chronologically. To obtain a uniform temporal resolution and facilitate synchronization with environmental data, the GPS trajectory was resampled at 1 Hz and interpolated the missing point using geodesic interpolation [38].
3.5.3. HRV Data Preprocessing and Indice Computation
During LMD travel, motion artifacts caused by body movement and vibration may contaminate physiological signals. Therefore, prior to HRV analysis, outliers in the RR interval (RRI) series induced by motion-related noise were removed. First, RRIs shorter than 500 ms or longer than 1500 ms were excluded. Next, based on previous studies [39], two HRV filtering methods were applied. A Hampel filter was employed to identify outliers using the median absolute deviation (MAD). The standard deviation was estimated as σ ≈ 1.4826 × MAD, and RRIs with deviations exceeding 3σ from the mean were classified as outliers. In addition, a quotient filter was applied to detect abrupt RRI changes; RRIs exhibiting changes greater than 10% compared with the mean of the preceding and following RRIs were also identified as outliers. After filtering, the RRI time series was interpolated using cubic spline interpolation to preserve temporal continuity. Participants for whom more than 5% of the total RRI data were excluded were removed from further analysis due to insufficient data quality.
Figure 4 shows an example of the RRI preprocessing results. The raw RRI time series (yellow) exhibits abrupt fluctuations and outliers, which are presumed to be caused by vibration and body movement during LMD operation. In contrast, the preprocessed RRI time series (green) effectively removes these noise components while preserving the overall variability trend. Comparison with the simultaneously recorded body vibration signal (gray) indicates that motion artifacts occur more frequently during periods of higher vibration. In this example, 2.66% of the RRIs were removed, confirming that excessive data rejection was avoided.
Using the preprocessed RRI data, SDNN, RMSSD, and pNN50 were calculated for each segment according to (3)–(5):
Here, denotes the RR interval measured in milliseconds, and represents the mean RR interval. After computing these indices, z-score normalization was applied to each HRV metric to account for inter-individual differences in physiological baseline values and to enable comparison across participants.
4. Results
4.1. Stress Factors Identified by Post-Ride Survey
Following the procedure described in Section 2.1, the results of the post-ride questionnaire were analyzed to identify stress factors perceived during LMD travel. Figure 5 presents the identified stress factors and the percentage of participants who reported each factor. The most frequently reported stress factor was poor road surface/vibrations, reported by 76% of the participants. This was followed by encounters with cyclists and pedestrians, each reported by 50% of the participants. Narrow sidewalks were reported by 38% of the participants. Physical obstacles were reported by 18% of the participants, while temperature/humidity and vehicle control were reported by 15%. Brightness and downhill/slope were each reported by 12% of the participants. Wind, unfamiliar routes, and cars nearby were each reported by 9%. Device speed and entrance and exit areas were reported by 6%, and poor visibility was reported by only 3% of the participants.
To account for inter-individual differences and to focus on stress factors commonly reported across participants, only factors reported by at least 25% of the participants were selected for stress estimation and stress location identification in this study. Four stress factors met this criterion: poor road surface/vibrations, cyclists, pedestrians, and narrow sidewalks. Because cyclists and pedestrians both result from sharing travel space with other road users, these two factors were integrated into a single factor, referred to as encounters with others. In the subsequent analysis, environmental data corresponding to these stress factors were quantified and used to identify stress locations.
4.2. Relationship Between CSS and HRV Indexes
As described in Section 4.1, the stress factors identified during LMD travel were poor road surface/vibrations, encounters with others, and narrow sidewalks. In this study, each stress factor was quantified using corresponding environmental data. Specifically, poor road surface/vibrations were quantified using the root mean square (RMS) of the vertical acceleration, encounters with others were quantified using the number of pedestrians and cyclists detected and counted from onboard video recordings during travel, and narrow sidewalks were quantified using sidewalk width.
To evaluate the relationship between the CSS derived from these quantified stress factors and physiological stress responses, Spearman’s rank correlation analysis was conducted between the CSS and each HRV index (RMSSD, SDNN, and pNN50). CSS values were calculated for each route segment using both individual stress factors and combinations of multiple stress factors, following the method described in Section 2.4. Table 1 summarizes the correlation analysis results between the CSS and the HRV indexes for CSS values derived from single environmental factors and from combinations of multiple environmental factors.
As shown in Table 1, among the CSS values based on a single environmental factor (CSS (1)–(3)), only the CSS based on poor road surface/vibrations showed a significant negative correlation with SDNN (ρ = −0.487, p < 0.05). No significant correlations were observed with RMSSD or pNN50. In addition, CSS values based on the number of encounters with others and sidewalk width showed no significant correlations with any HRV index.
In contrast, CSS values calculated by combining multiple environmental factors showed stronger associations with HRV indexes. For the two-factor combinations (CSS (4)–(6)), each combination exhibited a significant negative correlation with at least one HRV index. The CSS combining poor road surface/vibrations and the number of encounters with others showed significant negative correlations with RMSSD (ρ = −0.433, p < 0.05) and SDNN (ρ = −0.595, p < 0.01). The CSS combining poor road surface/vibrations and sidewalk width showed a significant negative correlation with SDNN (ρ = −0.480, p < 0.05). The CSS combining the number of encounters with others and sidewalk width showed significant negative correlations with RMSSD (ρ = −0.508, p < 0.05) and pNN50 (ρ = −0.451, p < 0.05).
Furthermore, CSS (7), which integrated all three environmental factors, showed significant negative correlations with all HRV indexes: RMSSD (ρ = −0.525, p < 0.05), SDNN (ρ = −0.627, p < 0.01), and pNN50 (ρ = −0.449, p < 0.05). Among all CSS configurations examined in this study, this three-factor CSS exhibited the strongest overall association with physiological stress responses.
4.3. Comparison of HRV Indices Between Low- and High-Stress Segments
Next, to validate the proposed CSS-based stress location identification method, route segments were classified into three stress levels (low, moderate, and high) based on the CSS calculated from the three stress factors: poor road surface/vibrations, encounters with others, and narrow sidewalks. Figure 6 shows a map visualizing the stress level of each segment, together with representative street scenes for low-stress and high-stress segments. Four segments (Segments 6, 10, 11, and 13) were classified as high-stress segments. Video inspection revealed common environmental characteristics in these segments, including brick-paved road surfaces, narrow sidewalks or reduced effective walking space due to poles and other roadside installations, and frequent encounters with pedestrians and cyclists. In contrast, Segment 20 was classified as a low-stress segment. This segment featured a smooth concrete road surface, sufficient sidewalk width, and relatively few encounters with other road users. These characteristics are consistent with the lower CSS values and reduced physiological stress responses observed in this segment.
To validate the stress locations identified based on the calculated CSS, differences in physiological stress responses were compared between segments classified as high-stress and low-stress based on the CSS. Specifically, HRV indexes were compared between the low-stress segment (Segment 20) and the high-stress segments (Segments 6, 10, 11, and 13). Figure 7 resents box plots of the HRV indexes (SDNN, RMSSD, and pNN50) for the low-stress and high-stress segments.
The results show that SDNN was significantly lower in the high-stress segments, particularly Segments 6 and 10, compared with the low-stress segment (Segment 20). These findings indicate that some segments classified as high-stress by the proposed method also exhibited elevated physiological stress responses, thereby supporting the validity of the CSS-based stress location identification approach.
5. Discussion
5.1. Stress Factors During LMD Travel
This study aimed to identify stress-prone locations during LMD travel by quantifying stress factors derived from subjective evaluations using environmental data and integrating them into a single index(CSS). Analysis of subjectively perceived stress factors revealed three factors commonly reported by many participants: poor road surface/vibrations, encounters with others, and narrow sidewalks. Among these factors, poor road surface/vibrations were reported most frequently. The high reporting frequency of poor road surface/vibrations is consistent with findings from previous studies indicating that vibration significantly affects the comfort of electric wheelchair users [19]. This result suggests that vibration is a primary stressor during LMD travel and should be considered a key factor when evaluating the travel environment for LMD users.
5.2. Evaluation of the Composite Stress Score
This study evaluated the effectiveness of the proposed CSS by examining its relationship with physiological stress responses during LMD travel. The results indicate that, when stress was estimated based on a single environmental factor, only the CSS derived from poor road surface/vibrations showed a significant association with SDNN, whereas the CSS derived from encounters with others or sidewalk width showed no significant associations with any HRV index when evaluated independently (Table 1). These findings suggest that vibration has a relatively strong influence on physiological stress responses during LMD travel, while encounters with others and sidewalk width alone may not sufficiently reflect physiological stress.
In contrast, CSS derived by combining multiple environmental stress factors showed stronger associations with physiological stress responses. When two stress factors were combined, all CSS configurations exhibited significant negative correlations with at least one HRV index. In particular, CSS combining poor road surface/vibrations with other stress factors showed stronger associations with SDNN than CSS based on vibration alone, indicating that the impact of vibration becomes more pronounced when it co-occurs with other stress factors. Furthermore, CSS combining encounters with others and sidewalk width showed significant correlations with RMSSD and pNN50, suggesting that encounters with other road users under spatially constrained environments may also contribute to physiological stress.
Among all configurations examined, CSS integrating all three stress factors showed significant negative correlations with all HRV indexes. This result indicates that stress during LMD travel does not arise from a single environmental factor but rather from the combined effects of vibration, spatial constraints, and encounters with other road users. Overall, these findings demonstrate that the proposed CSS, derived by integrating multiple environmental stress factors, has the potential to more comprehensively reflect physiological stress responses during LMD travel.
Furthermore, as shown in Figure 7, comparisons between low-stress and high-stress segments revealed significantly lower SDNN values in some high-stress segments (Segments 6 and 10) compared with the low-stress segment (Segment 20). Because SDNN reflects both sympathetic and parasympathetic nervous system activity, a reduction in SDNN is generally associated with increased stress and autonomic imbalance. These results provide additional physiological support for the stress locations identified by the proposed CSS, indicating that some segments classified as high-stress also exhibit elevated physiological stress responses.
5.3. Limitations and Future Work
This study has several limitations that should be addressed in future work. First, although three HRV indexes (SDNN, RMSSD, and pNN50) were examined, their associations with CSS were not uniform. SDNN showed relatively consistent relationships with vibration-related CSS values, whereas RMSSD and pNN50 did not consistently show significant associations when stress factors were evaluated individually. This difference likely reflects the physiological characteristics of the HRV indexes: SDNN represents overall autonomic nervous system activity, whereas RMSSD and pNN50 primarily reflect short-term parasympathetic activity. In addition, because HRV alone was used to validate the proposed CSS-based method, the evaluation of physiological stress responses may be limited. Therefore, future studies should further validate the proposed method by incorporating additional physiological indicators, such as EDA, in addition to HRV-based measures.
Second, the experiment was conducted in a limited urban environment along a specific route in the Toyosu area of Tokyo. For safety and ethical reasons, routes involving road crossings were excluded, which may have limited the inclusion of travel scenarios associated with higher stress levels. In addition, stress factors were extracted based on participant reports specific to this area, and stress factors unique to other regions may not have been captured. These limitations may affect the generalizability of the results. Future work should therefore collect data in diverse urban environments to further validate the proposed method.
Third, the participants were limited to healthy young adults aged 19–32 years and did not include older adults or actual LMD users, who are the primary intended users of such devices. Previous studies have reported age-related differences in stress perception and physiological stress responses [40,41]. Future studies should include elderly participants, actual LMD users, and individuals with mobility impairments to examine differences in stress responses across user groups.
Fourth, stress locations were identified using fixed segment lengths of 100 m. Using shorter segment lengths may enable more precise localization of stress factors and facilitate clearer interpretation of the environmental factors influencing stress. Future work should investigate the effectiveness of the proposed method using different segment lengths.
Finally, although HRV was used to validate the proposed CSS-based method, the results varied across HRV indexes. Future studies should incorporate additional physiological measures, such as EDA, to enable multi-dimensional assessment of stress responses during LMD travel.
6. Conclusions
This study proposed a method based on environmental data for identifying stress locations during LMD travel by considering stress factors specific to LMD use. Following the proposed framework, stress factors perceived during LMD travel were first extracted through a post-ride questionnaire. As a result, three primary stress factors were identified: poor road surface/vibrations, encounters with others, and narrow sidewalks. These factors were quantitatively evaluated using corresponding environmental data, namely vertical acceleration, the number of encounters with others derived from onboard video recordings, and sidewalk width.
Based on these quantified stress factors, a composite stress index was calculated for route segments using both single factors and combinations of multiple factors, and the segments were classified into different stress levels. To validate the proposed method, correlation analysis and segment-level comparisons were conducted between stress estimation results and physiological stress responses derived from HRV indexes. The results showed that physiological stress responses during LMD travel were more effectively captured when multiple environmental stress factors were combined than when individual factors were considered alone. In addition, comparisons between high-stress and low-stress segments revealed significantly lower SDNN values in some high-stress segments, suggesting increased physiological stress responses in segments identified as high-stress by the proposed method.
Overall, these findings indicate that integrating multiple environmental stress factors has the potential to identify stress locations during LMD travel. The proposed method may support the evaluation and design of pedestrian environments that are safer and more comfortable for LMD users.
Author Contributions
Conceptualization, N.J., Y.N. and M.S.; methodology, N.J. and M.S.; software, N.J.; validation, N.J.; formal analysis, N.J., Y.N. and M.S.; writing—original draft preparation, N.J. and Y.N.; writing—review and editing, M.S.; supervision, M.S. All authors have read and agreed to the published version of the manuscript.
Institutional Review Board Statement
The study was conducted in accordance with the Declaration of Helsinki, and the protocol was approved by the Ethics Committee of Shibaura Institute of Technology (identification code is 23-048 and date of approval is 29 February 2024).
Informed Consent Statement
All subjects gave their informed consent for inclusion before they participated in the study.
Data Availability Statement
The data used in this study are restricted. This is because we did not obtain consent from the participants to make the data available to the public.
Conflicts of Interest
The authors declare no conflict of interest.
References
- Traffic Rules for Specified Small Motorized Bicycles. Available online: https://www.npa.go.jp/english/bureau/traffic/document/Traffic_Rules_for_Specified_Small_Motorized_Bicycles.pdf.
- How Electric Mobility Scooters Are Transforming Short-Distance Travel for Seniors in Aging Cities. Available online: https://www.intcowheelchair.com/news/how-electric-mobility-scooters-are-transforming-short-distance-travel-for-seniors-in-aging-cities (accessed on 15 January 2026).
- Torkia, C.; Reid, D.; Korner-Bitensky, N.; Kairy, D.; Rushton, P.W.; Demers, L.; Archambault, P.S. Power Wheelchair Driving Challenges in the Community: A Users’ Perspective. Disabil. Rehabil. Assist. Technol. 2015, 10, 211–215. [Google Scholar] [CrossRef]
- Lim, T.; Thompson, J.; Pearson, L.; Caldwell Odgers, J.; Beck, B. Effects of Within-Trip Subjective Experiences on Travel Satisfaction and Travel Mode Choice: A Conceptual Framework. Transp. Res. Part F Traffic Psychol. Behav. 2024, 104, 201–216. [Google Scholar] [CrossRef]
- Kyriakou, K.; Resch, B.; Sagl, G.; Petutschnig, A.; Werner, C.; Niederseer, D.; Liedlgruber, M.; Wilhelm, F.; Osborne, T.; Pykett, J. Detecting Moments of Stress from Measurements of Wearable Physiological Sensors. Sensors (Basel) 2019, 19, 3805. [Google Scholar] [CrossRef]
- Kim, J.; Nirjhar, E.H.; Lee, H.; Chaspari, T.; Lee, C.; Ham, Y.; Winslow, J.F.; Ahn, C.R. Location-Based Collective Distress Using Large-Scale Biosignals in Real Life for Walkable Built Environments. Sci. Rep. 2023, 13, 5940. [Google Scholar] [CrossRef]
- LaJeunesse, S.; Ryus, P.; Kumfer, W.; Kothuri, S.; Nordback, K. Measuring Pedestrian Level of Stress in Urban Environments: Naturalistic Walking Pilot Study. Transp. Res. Rec. 2021, 2675, 109–119. [Google Scholar] [CrossRef]
- Dash, I.; Muscatello, R.A.; Abkowitz, M.D.; Mostoller, E.R.; Sewell, M. Measuring Pedestrian Stress Response (MPSR) Using Wearable Technologies. J. Transp. Technol. 2024, 14, 224–235. [Google Scholar] [CrossRef]
- Bigazzi, A.; Ausri, F.; Peddie, L.; Fitch, D.; Puterman, E. Physiological Markers of Traffic-Related Stress during Active Travel. Transp. Res. Part F Traffic Psychol. Behav. 2022, 84, 223–238. [Google Scholar] [CrossRef]
- Van Der Donckt, J.; Vandenbussche, N.; Van Der Donckt, J.; Chen, S.; Stojchevska, M.; De Brouwer, M.; Steenwinckel, B.; Paemeleire, K.; Ongenae, F.; Van Hoecke, S. Mitigating Data Quality Challenges in Ambulatory Wrist-Worn Wearable Monitoring through Analytical and Practical Approaches. Sci. Rep. 2024, 14, 17545. [Google Scholar] [CrossRef] [PubMed]
- Hickey, B.A.; Chalmers, T.; Newton, P.; Lin, C.-T.; Sibbritt, D.; McLachlan, C.S.; Clifton-Bligh, R.; Morley, J.; Lal, S. Smart Devices and Wearable Technologies to Detect and Monitor Mental Health Conditions and Stress: A Systematic Review. Sensors (Basel) 2021, 21, 3461. [Google Scholar] [CrossRef]
- Pinge, A.; Gad, V.; Jaisighani, D.; Ghosh, S.; Sen, S. Detection and Monitoring of Stress Using Wearables: A Systematic Review. Front. Comput. Sci. 2024, 6, 1478851. [Google Scholar] [CrossRef]
- Li, M.; Deb, S.; LeDantec, C.; Wang, C.; Singh, A. Assessing Cyclist’s Stress on A Large-Scale: A Practical Smartphone-Based Data-Driven Approach. Available online: http://rosap.ntl.bts.gov/view/dot/78275 (accessed on 27 December 2025).
- Torku, A.; Chan, A.P.C.; Yung, E.H.K.; Seo, J. Detecting Stressful Older Adults-Environment Interactions to Improve Neighbourhood Mobility: A Multimodal Physiological Sensing, Machine Learning, and Risk Hotspot Analysis-Based Approach. Building and Environment 2022, 224, 109533. [Google Scholar] [CrossRef]
- Mekuria, M.C.; Furth, P.G.; Nixon, H. Low-Stress Bicycling and Network Connectivity; 2012. [Google Scholar]
- Lin, B.; Saxe, S.; Chan, T.C.Y. AutoLTS: Automating Cycling Stress Assessment via Contrastive Learning and Spatial Post-Processing. arXiv [cs.CV 2023. [Google Scholar] [CrossRef]
- Huertas, J.A.; Palacio, A.; Botero, M.; Carvajal, G.A.; van Laake, T.; Higuera-Mendieta, D.; Cabrales, S.A.; Guzman, L.A.; Sarmiento, O.L.; Medaglia, A.L. Level of Traffic Stress-Based Classification: A Clustering Approach for Bogotá, Colombia. Transp. Res. D Transp. Environ. 2020, 85, 102420. [Google Scholar] [CrossRef]
- Legrain, A.; Eluru, N.; El-Geneidy, A.M. Am Stressed, Must Travel: The Relationship between Mode Choice and Commuting Stress. Transp. Res. Part F Traffic Psychol. Behav. 2015, 34, 141–151. [Google Scholar] [CrossRef]
- Mohamed, E.; Sirlantzis, K.; Howells, G.; Dib, J. Investigation of Vibration and User Comfort for Powered Wheelchairs. IEEE Sens. Lett. 2022, 6, 1–4. [Google Scholar] [CrossRef]
- Gwak, J.; Yoshitake, H.; Shino, M. Effects of Visual Factors during Automated Driving of Mobility Scooters on User Comfort: An Exploratory Simulator Study. Transp. Res. Part F Traffic Psychol. Behav. 2021, 81, 608–621. [Google Scholar] [CrossRef]
- Su, S.; Stark, J.; Fidler, M.; Hössinger, R.; Susilo, Y.O. Exploring Physiological Stress of Travelling by Bicycle and E-Scooter in Bicycle Lane: A Comparison Study through Virtual Reality. Travel Behav. Soc. 2025, 41, 101107. [Google Scholar] [CrossRef]
- Macho, W. QChainage - This Plugin Takes Line Features and Creates a New Layer of Points in Provided Distances on Top of This Lines. Optionally You Can Set the. Available online: https://plugins.qgis.org/plugins/qchainage/ (accessed on 8 December 2025).
- Shaffer, F.; Meehan, Z.M.; Zerr, C.L. A Critical Review of Ultra-Short-Term Heart Rate Variability Norms Research. Front. Neurosci. 2020, 14, 594880. [Google Scholar] [CrossRef] [PubMed]
- Gu, Z.; Zarubin, V.; Martsberger, C. The Effectiveness of Time Domain and Nonlinear Heart Rate Variability Metrics in Ultra-Short Time Series. Physiol. Rep. 2023, 11, e15863. [Google Scholar] [CrossRef] [PubMed]
- Hennig, C.; Viroli, C. Quantile-Based Classifiers. arXiv [stat.ME] 2013. [Google Scholar] [CrossRef]
- Kim, H.-G.; Cheon, E.-J.; Bai, D.-S.; Lee, Y.H.; Koo, B.-H. Stress and Heart Rate Variability: A Meta-Analysis and Review of the Literature. Psychiatry Investig. 2018, 15, 235–245. [Google Scholar] [CrossRef] [PubMed]
- Immanuel, S.; Teferra, M.N.; Baumert, M.; Bidargaddi, N. Heart Rate Variability for Evaluating Psychological Stress Changes in Healthy Adults: A Scoping Review. Neuropsychobiology 2023, 82, 187–202. [Google Scholar] [CrossRef]
- Byun, S.; Kim, A.Y.; Shin, M.-S.; Jeon, H.J.; Cho, C.-H. Automated Classification of Stress and Relaxation Responses in Major Depressive Disorder, Panic Disorder, and Healthy Participants via Heart Rate Variability. Front. Psychiatry 2024, 15, 1500310. [Google Scholar] [CrossRef] [PubMed]
- Shaffer, F.; Ginsberg, J.P. An Overview of Heart Rate Variability Metrics and Norms. Front Public Health 2017, 5, 258. [Google Scholar] [CrossRef]
- Castaldo, R.; Montesinos, L.; Melillo, P.; James, C.; Pecchia, L. Ultra-Short Term HRV Features as Surrogates of Short Term HRV: A Case Study on Mental Stress Detection in Real Life. BMC Med. Inform. Decis. Mak. 2019, 19, 12. [Google Scholar] [CrossRef]
- Sheridan, D.C.; Dehart, R.; Lin, A.; Sabbaj, M.; Baker, S.D. Heart Rate Variability Analysis: How Much Artifact Can We Remove? Psychiatry Investig. 2020, 17, 960–965. [Google Scholar] [CrossRef]
- Ma, S.; Zhang, W.; Noland, R.B.; Andrews, C.J.; Younes, H.; Von Hagen, L.A. Assessing Pedestrian Stress with Biometric Sensing and Survey Responses. Transp. Res. Part F Traffic Psychol. Behav. 2025, 115, 103347. [Google Scholar] [CrossRef]
- Castaldo, R.; Melillo, P.; Bracale, U.; Caserta, M.; Triassi, M.; Pecchia, L. Acute Mental Stress Assessment via Short Term HRV Analysis in Healthy Adults: A Systematic Review with Meta-Analysis. Biomed. Signal Process. Control 2015, 18, 370–377. [Google Scholar] [CrossRef]
- Bradley, M.M.; Lang, P.J. Measuring Emotion: The Self-Assessment Manikin and the Semantic Differential. J. Behav. Ther. Exp. Psychiatry 1994, 25, 49–59. [Google Scholar] [CrossRef]
- Nuñez, J.Y.M.; Teixeira, I.P.; da Silva, A.N.R.; Zeile, P.; Dekoninck, L.; Botteldooren, D. The Influence of Noise, Vibration, Cycle Paths, and Period of Day on Stress Experienced by Cyclists. Sustainability 2018, 10, 2379. [Google Scholar] [CrossRef]
- Ultralytics Ultralytics YOLO (v11) – documentation. Available online: https://docs.ultralytics.com/ (accessed on 6 September 2025).
- Ultralytics Ultralytics YOLO11. Available online: https://docs.ultralytics.com/models/yolo11/ (accessed on 15 December 2025).
- Zhu, X.; Thompson, K.C.; Martínez, T.J. Geodesic Interpolation for Reaction Pathways. J. Chem. Phys. 2019, 150, 164103. [Google Scholar] [CrossRef] [PubMed]
- Sumi, Y.; Nakayama, C.; Kadotani, H.; Matsuo, M.; Ozeki, Y.; Kinoshita, T.; Goto, Y.; Kano, M.; Yamakawa, T.; Hasegawa-Ohira, M.; et al. Resting Heart Rate Variability Is Associated with Subsequent Orthostatic Hypotension: Comparison between Healthy Older People and Patients with Rapid Eye Movement Sleep Behavior Disorder. Front. Neurol. 2020, 11, 567984. [Google Scholar] [CrossRef] [PubMed]
- Zhao, Y.; Yamamoto, T. Review of Studies on Older Drivers’ Behavior and Stress-Methods, Results, and Outlook. Sensors (Basel) 2021, 21, 3503. [Google Scholar] [CrossRef] [PubMed]
- Zhao, Y.; Yamamoto, T.; Kanamori, R. Study of Older Male Drivers’ Driving Stress Compared with That of Young Male Drivers. J. Traffic Transp. Eng. (Engl. Ed.) 2020, 7, 467–481. [Google Scholar] [CrossRef]
Figure 1.
(a) Boundry points (red dots) are placed at 100 m intervals along the route, and the segments between adjacent points are used as analysis units. (b) GPS trajectory and boundry points used to determine segment entry and exit times. The matched point (black) represents the GPS data point with the shortest geodesic distance to the predefined point (red).
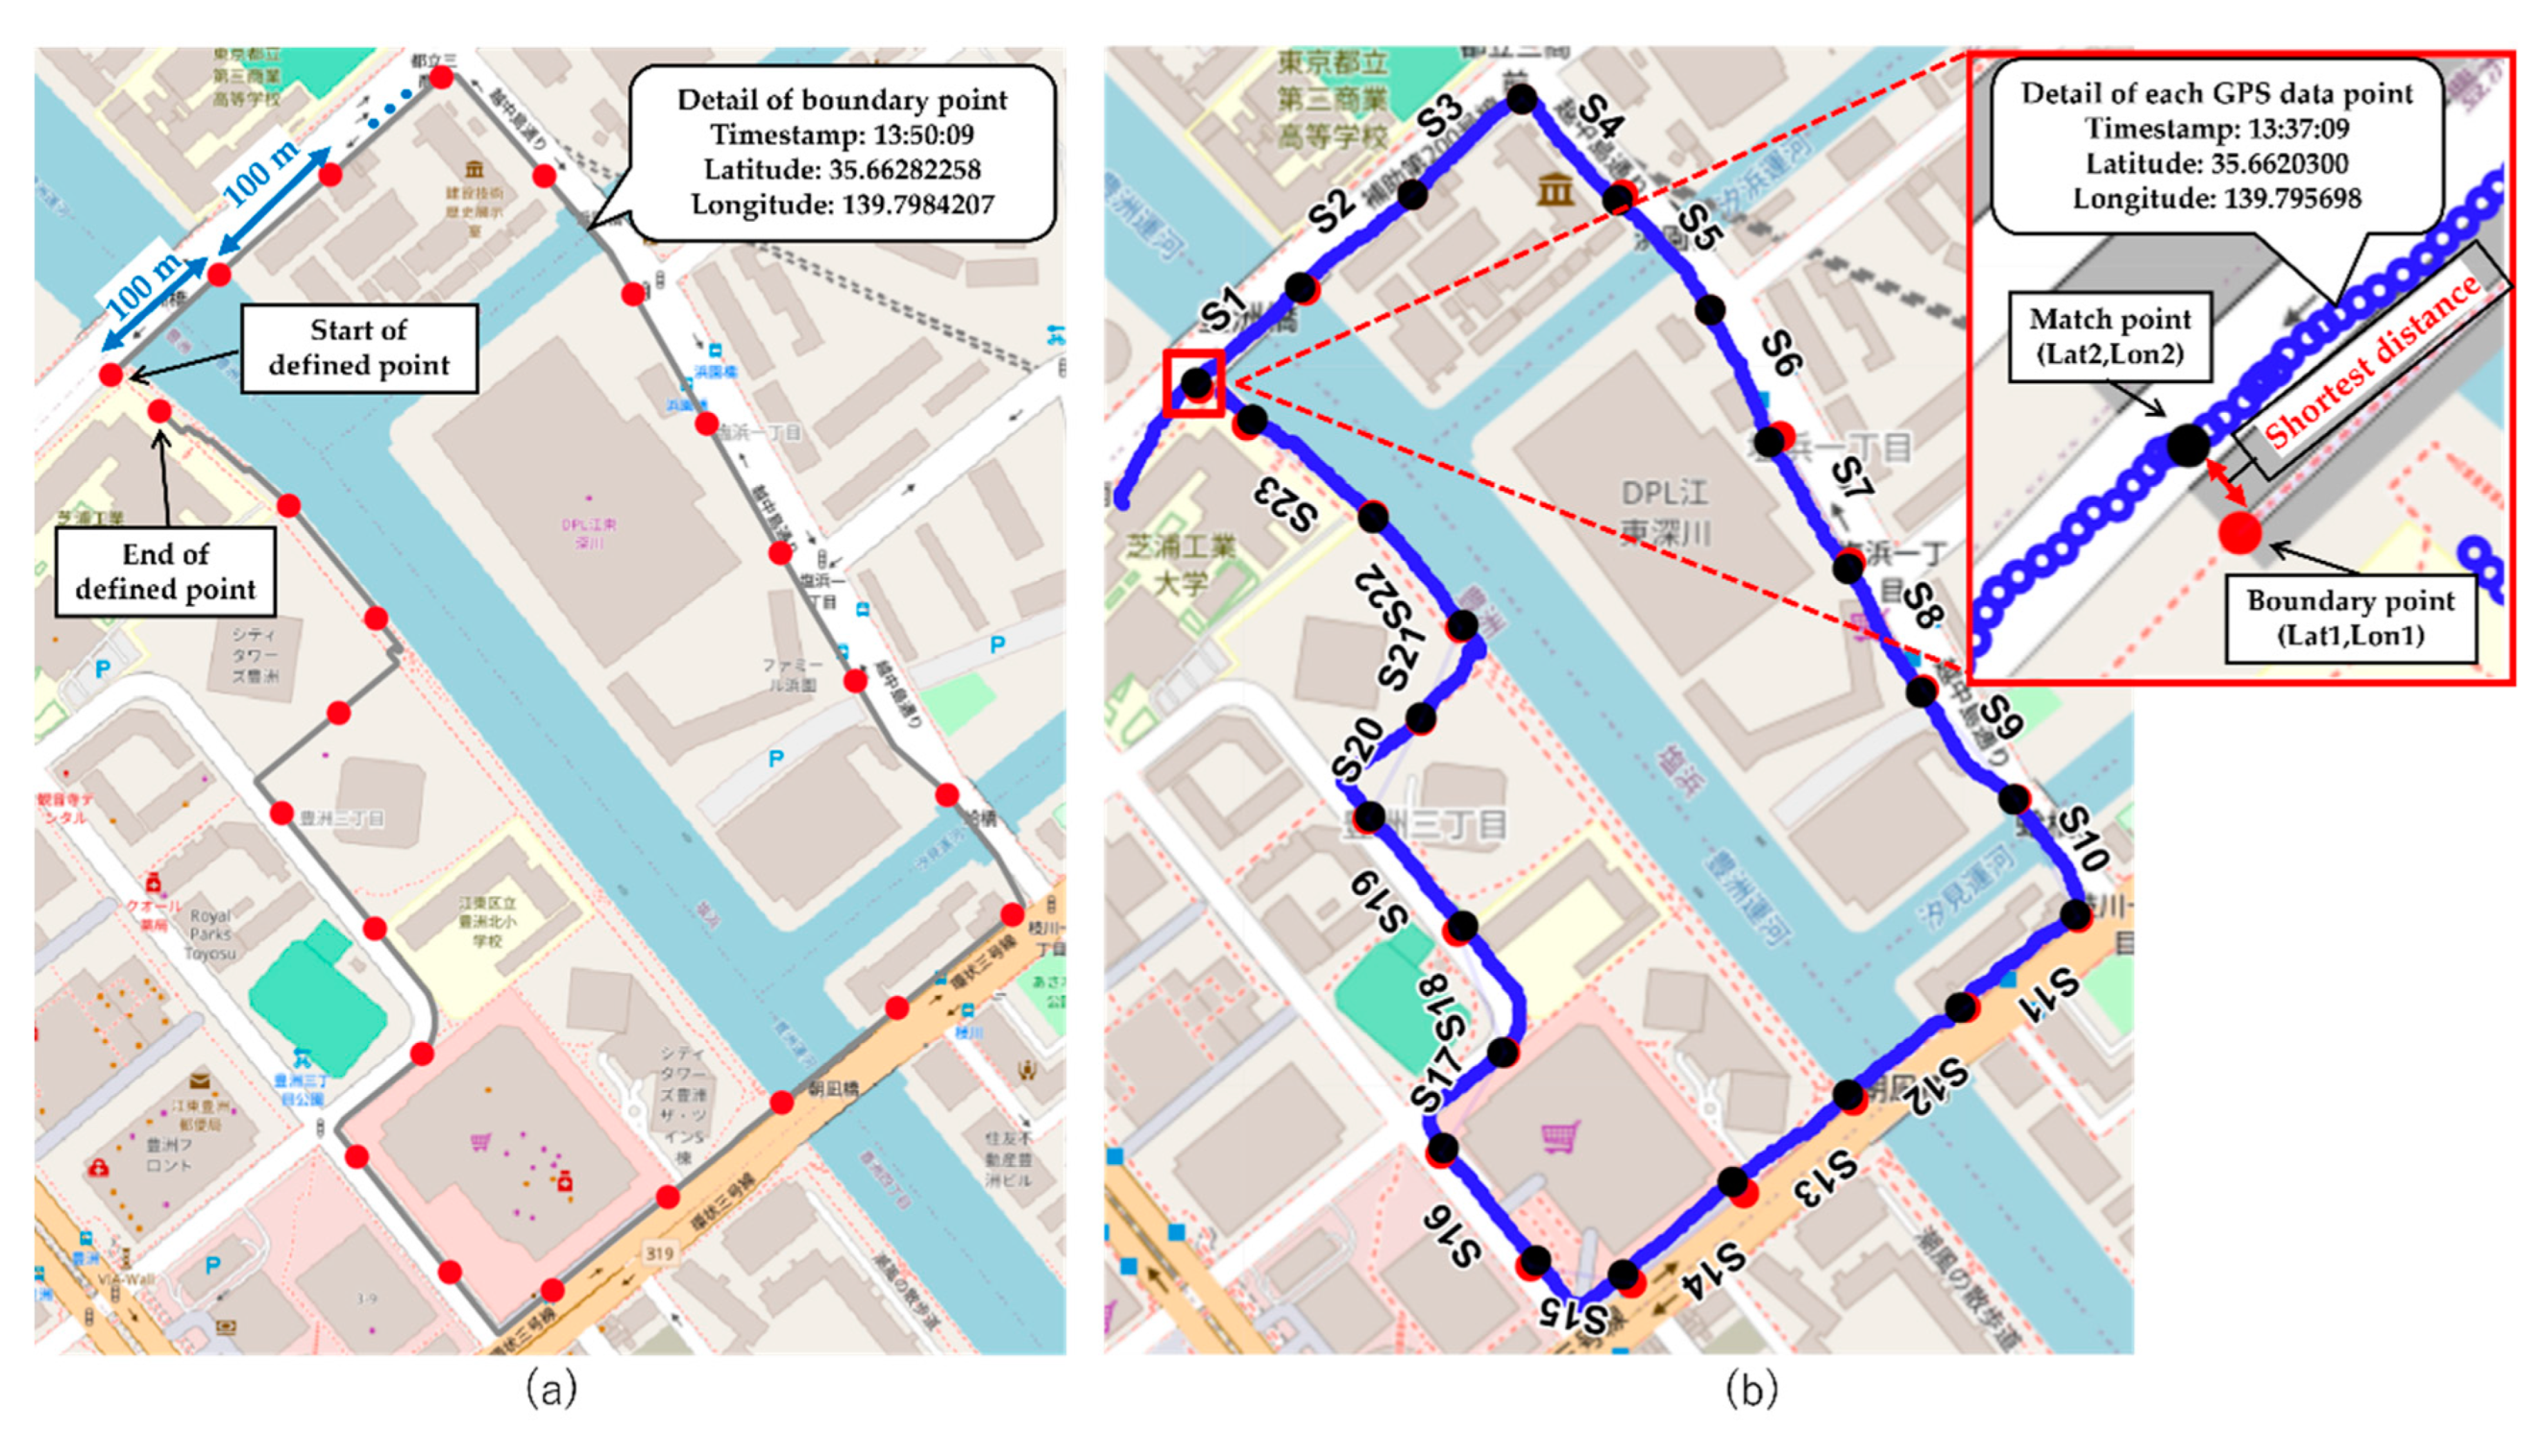
Figure 2.
Experimental route map and example photographs of the experiment scene. Participants completed a clockwise loop starting from the Toyosu Campus of Shibaura Institute of Technology.
Figure 2.
Experimental route map and example photographs of the experiment scene. Participants completed a clockwise loop starting from the Toyosu Campus of Shibaura Institute of Technology.
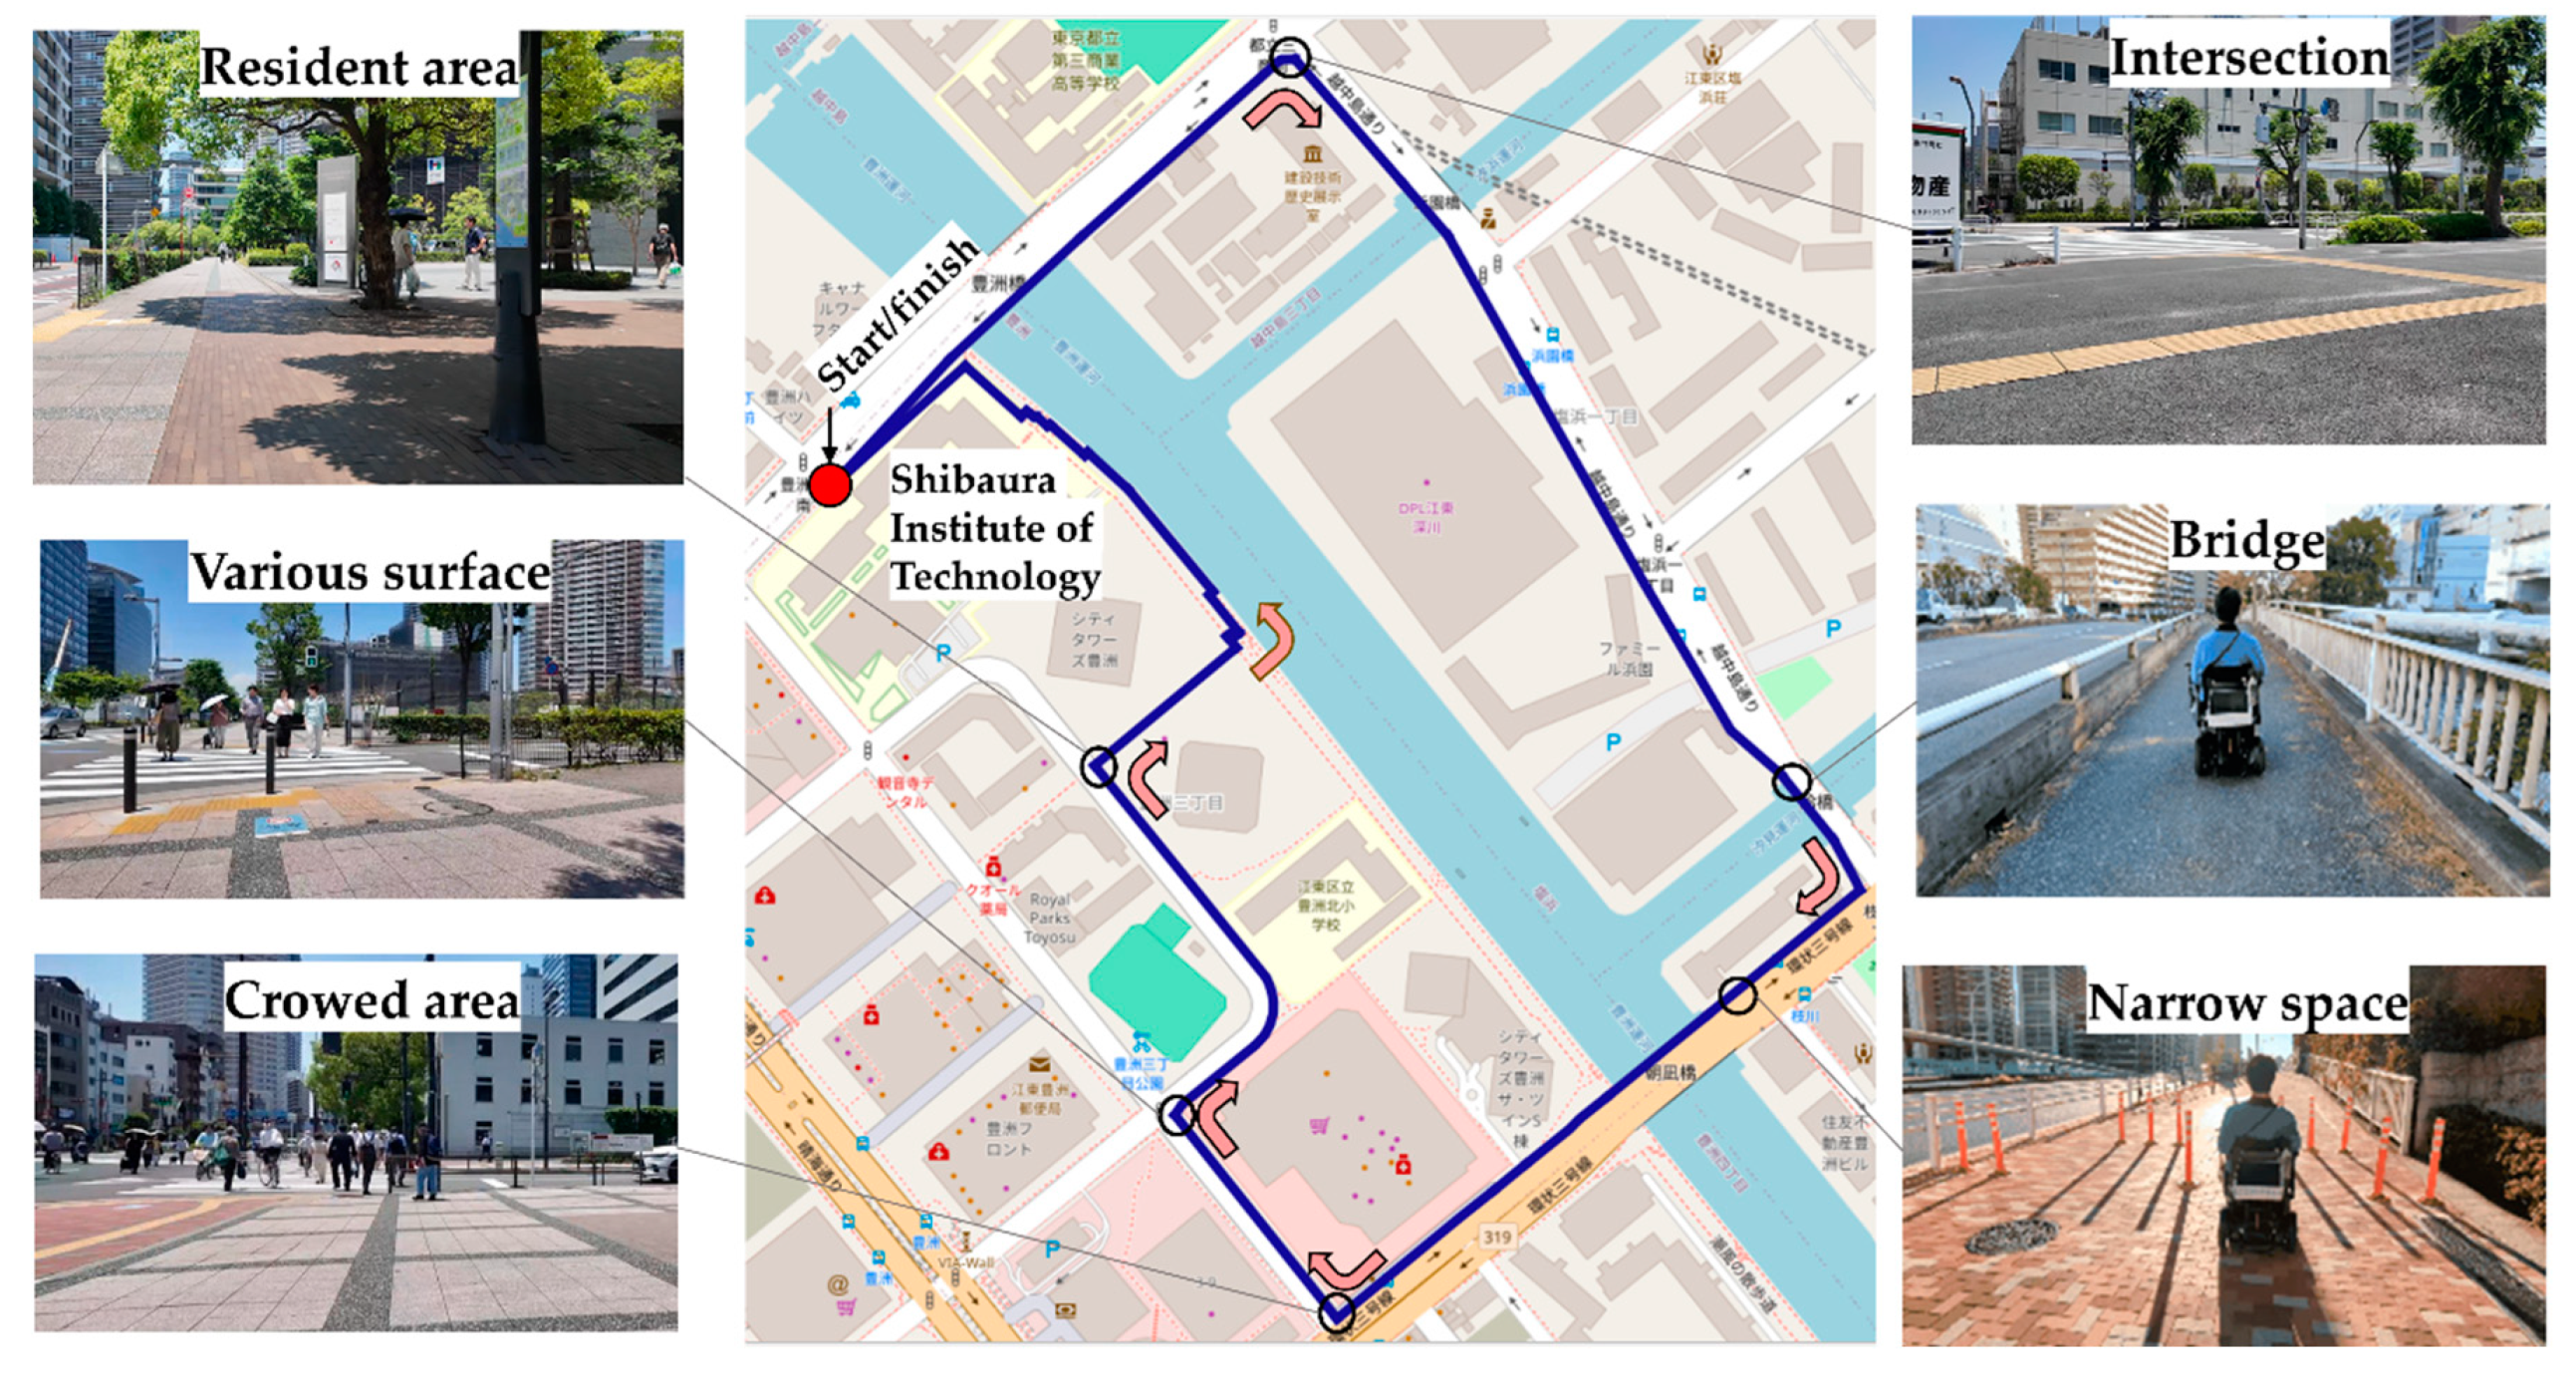
Figure 3.
Sensor configuration on the electric wheelchair (WHILL Model CR) and placement of the wearable ECG sensor (myBeat WHS-1) on the participant’s chest.
Figure 3.
Sensor configuration on the electric wheelchair (WHILL Model CR) and placement of the wearable ECG sensor (myBeat WHS-1) on the participant’s chest.
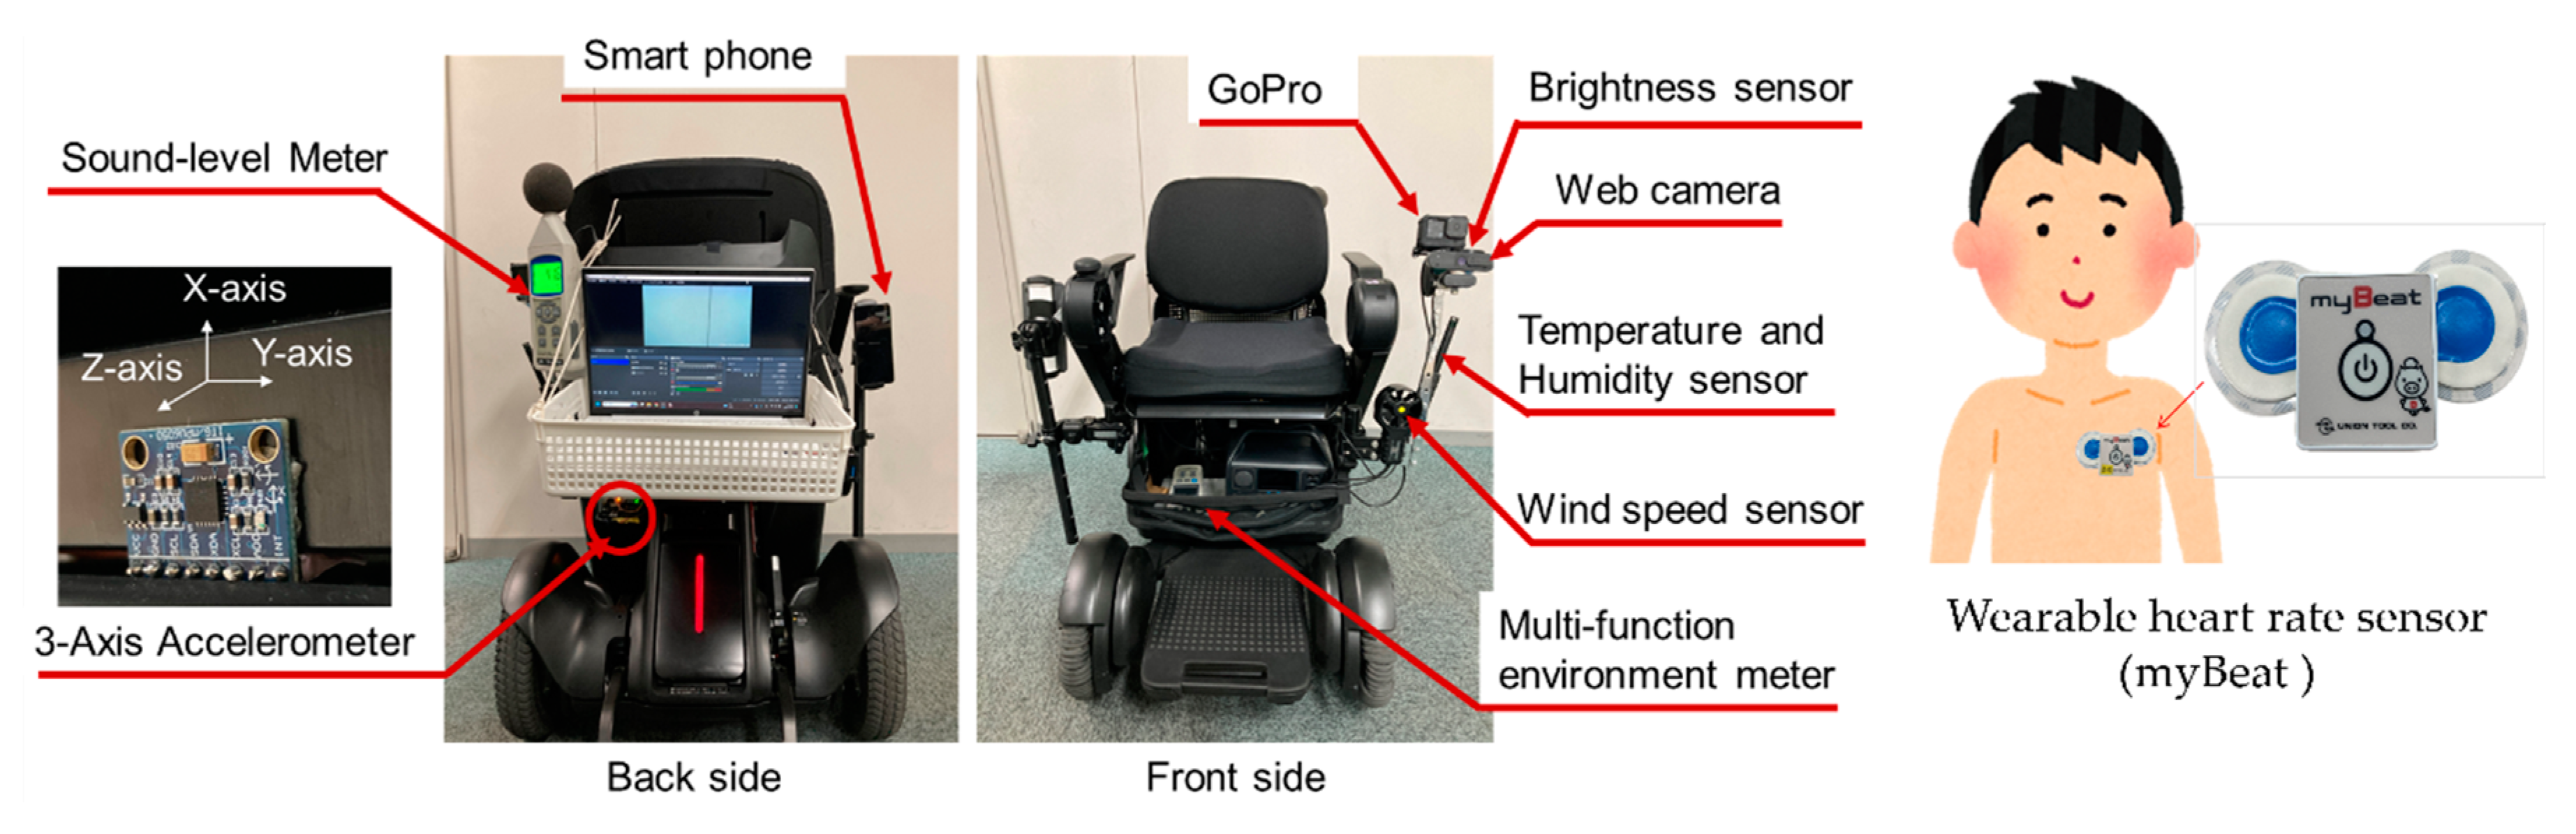
Figure 4.
Example of the RRI preprocessing results. Raw RRIs (yellow) and cleaned RRIs after filtering (green) are shown together with the body vibration signal (gray). Blue and red dashed lines indicate the resting and LMD riding periods, respectively. In this example, 2.66% of RRIs were removed.
Figure 4.
Example of the RRI preprocessing results. Raw RRIs (yellow) and cleaned RRIs after filtering (green) are shown together with the body vibration signal (gray). Blue and red dashed lines indicate the resting and LMD riding periods, respectively. In this example, 2.66% of RRIs were removed.
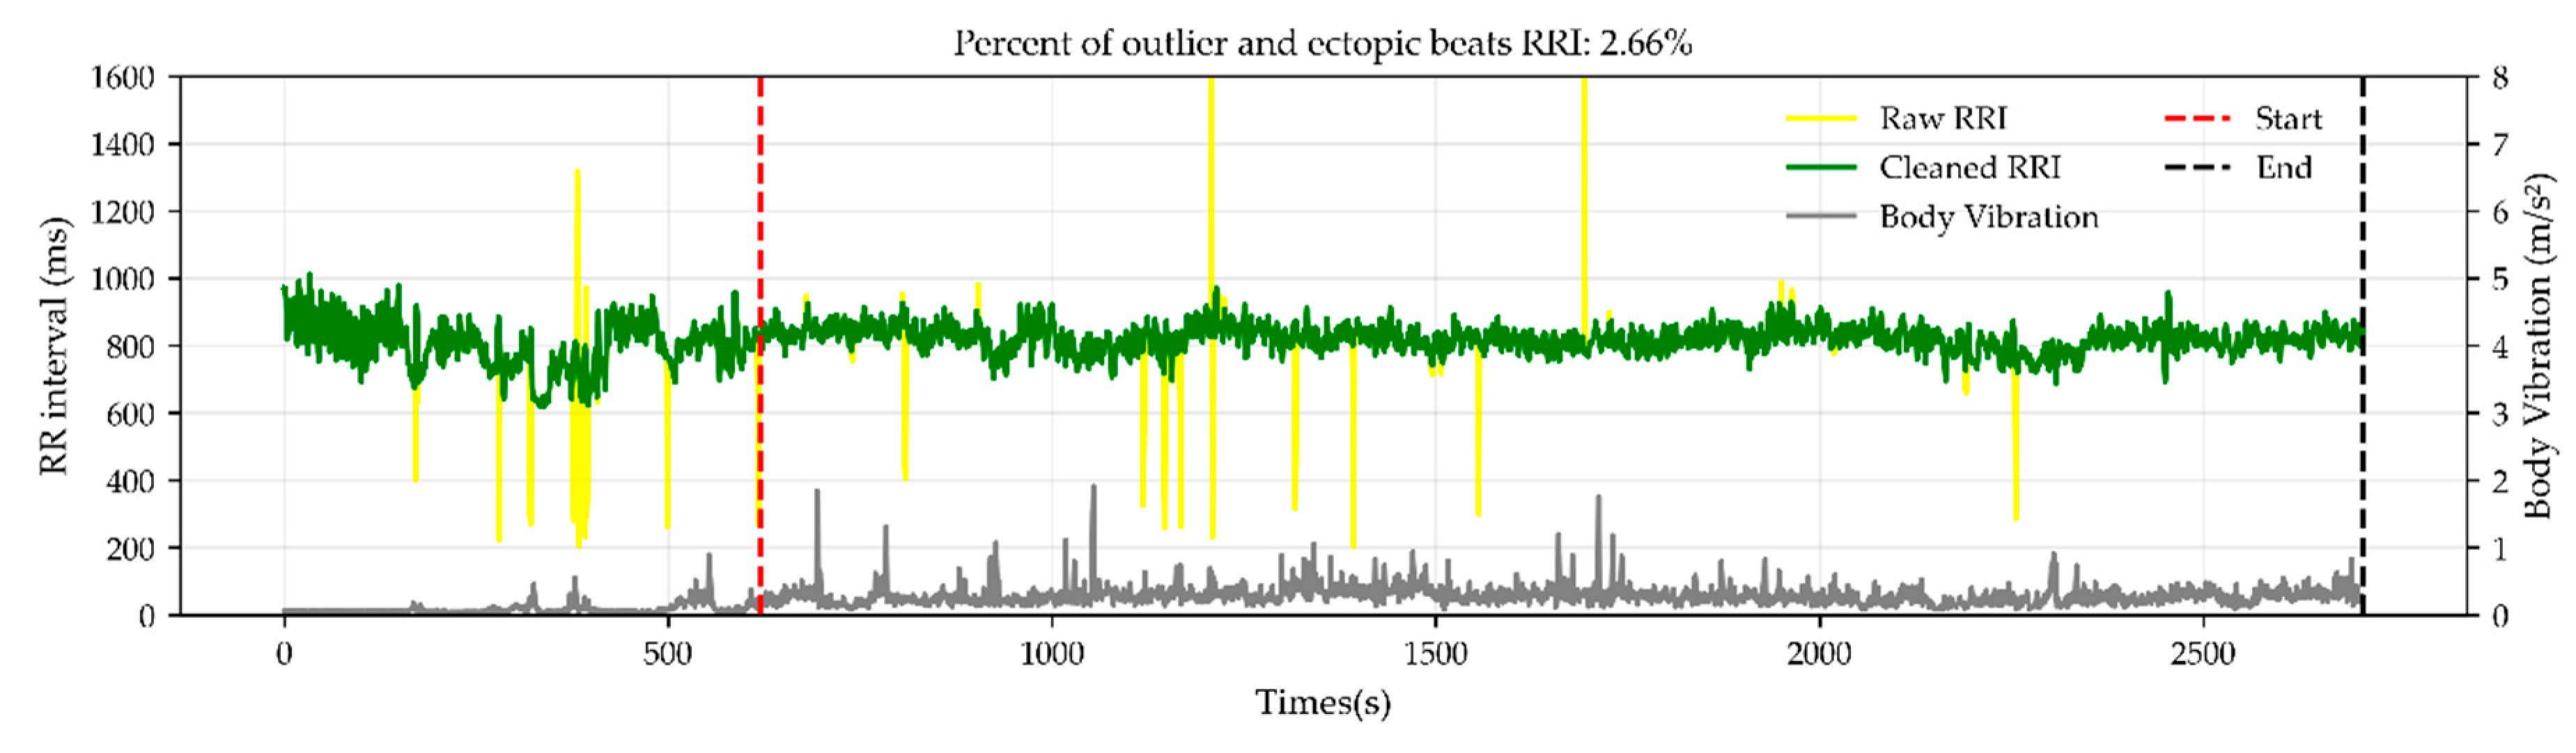
Figure 5.
Stress factors identified from the post-ride questionnaire and the percentage of participants reporting each factor.
Figure 5.
Stress factors identified from the post-ride questionnaire and the percentage of participants reporting each factor.
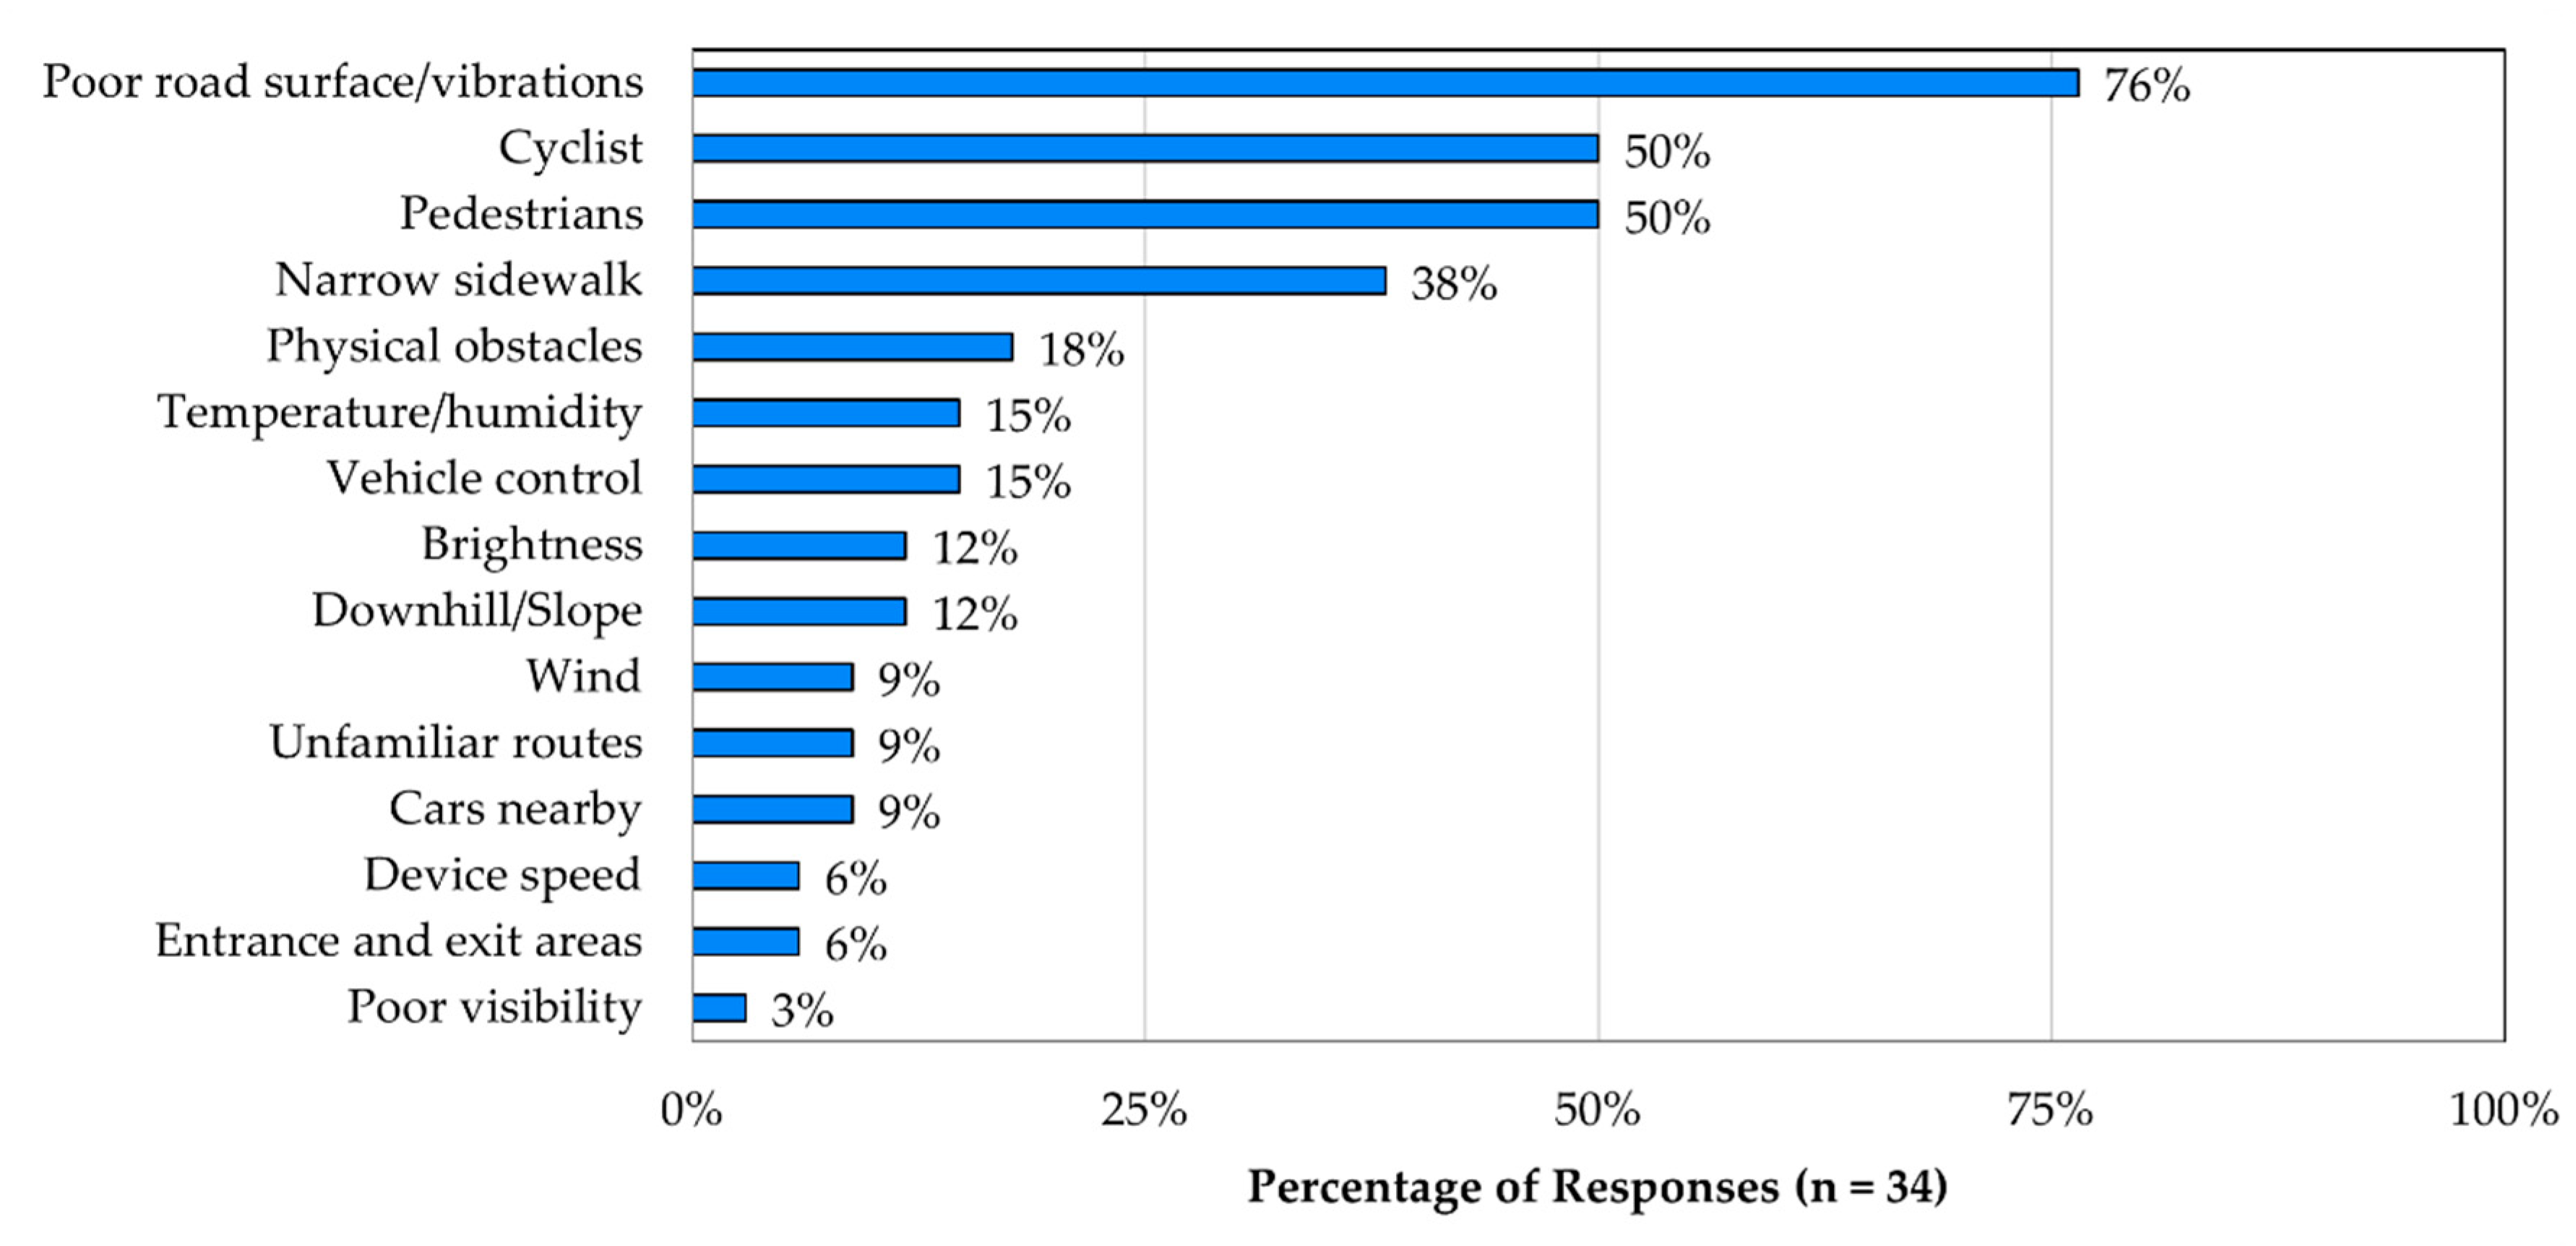
Figure 6.
Map of stress locations divided into segment units classified by the CSS. Colors indicate stress levels along the route, and example photos illustrate typical streetscape conditions corresponding to each CSS category.
Figure 6.
Map of stress locations divided into segment units classified by the CSS. Colors indicate stress levels along the route, and example photos illustrate typical streetscape conditions corresponding to each CSS category.
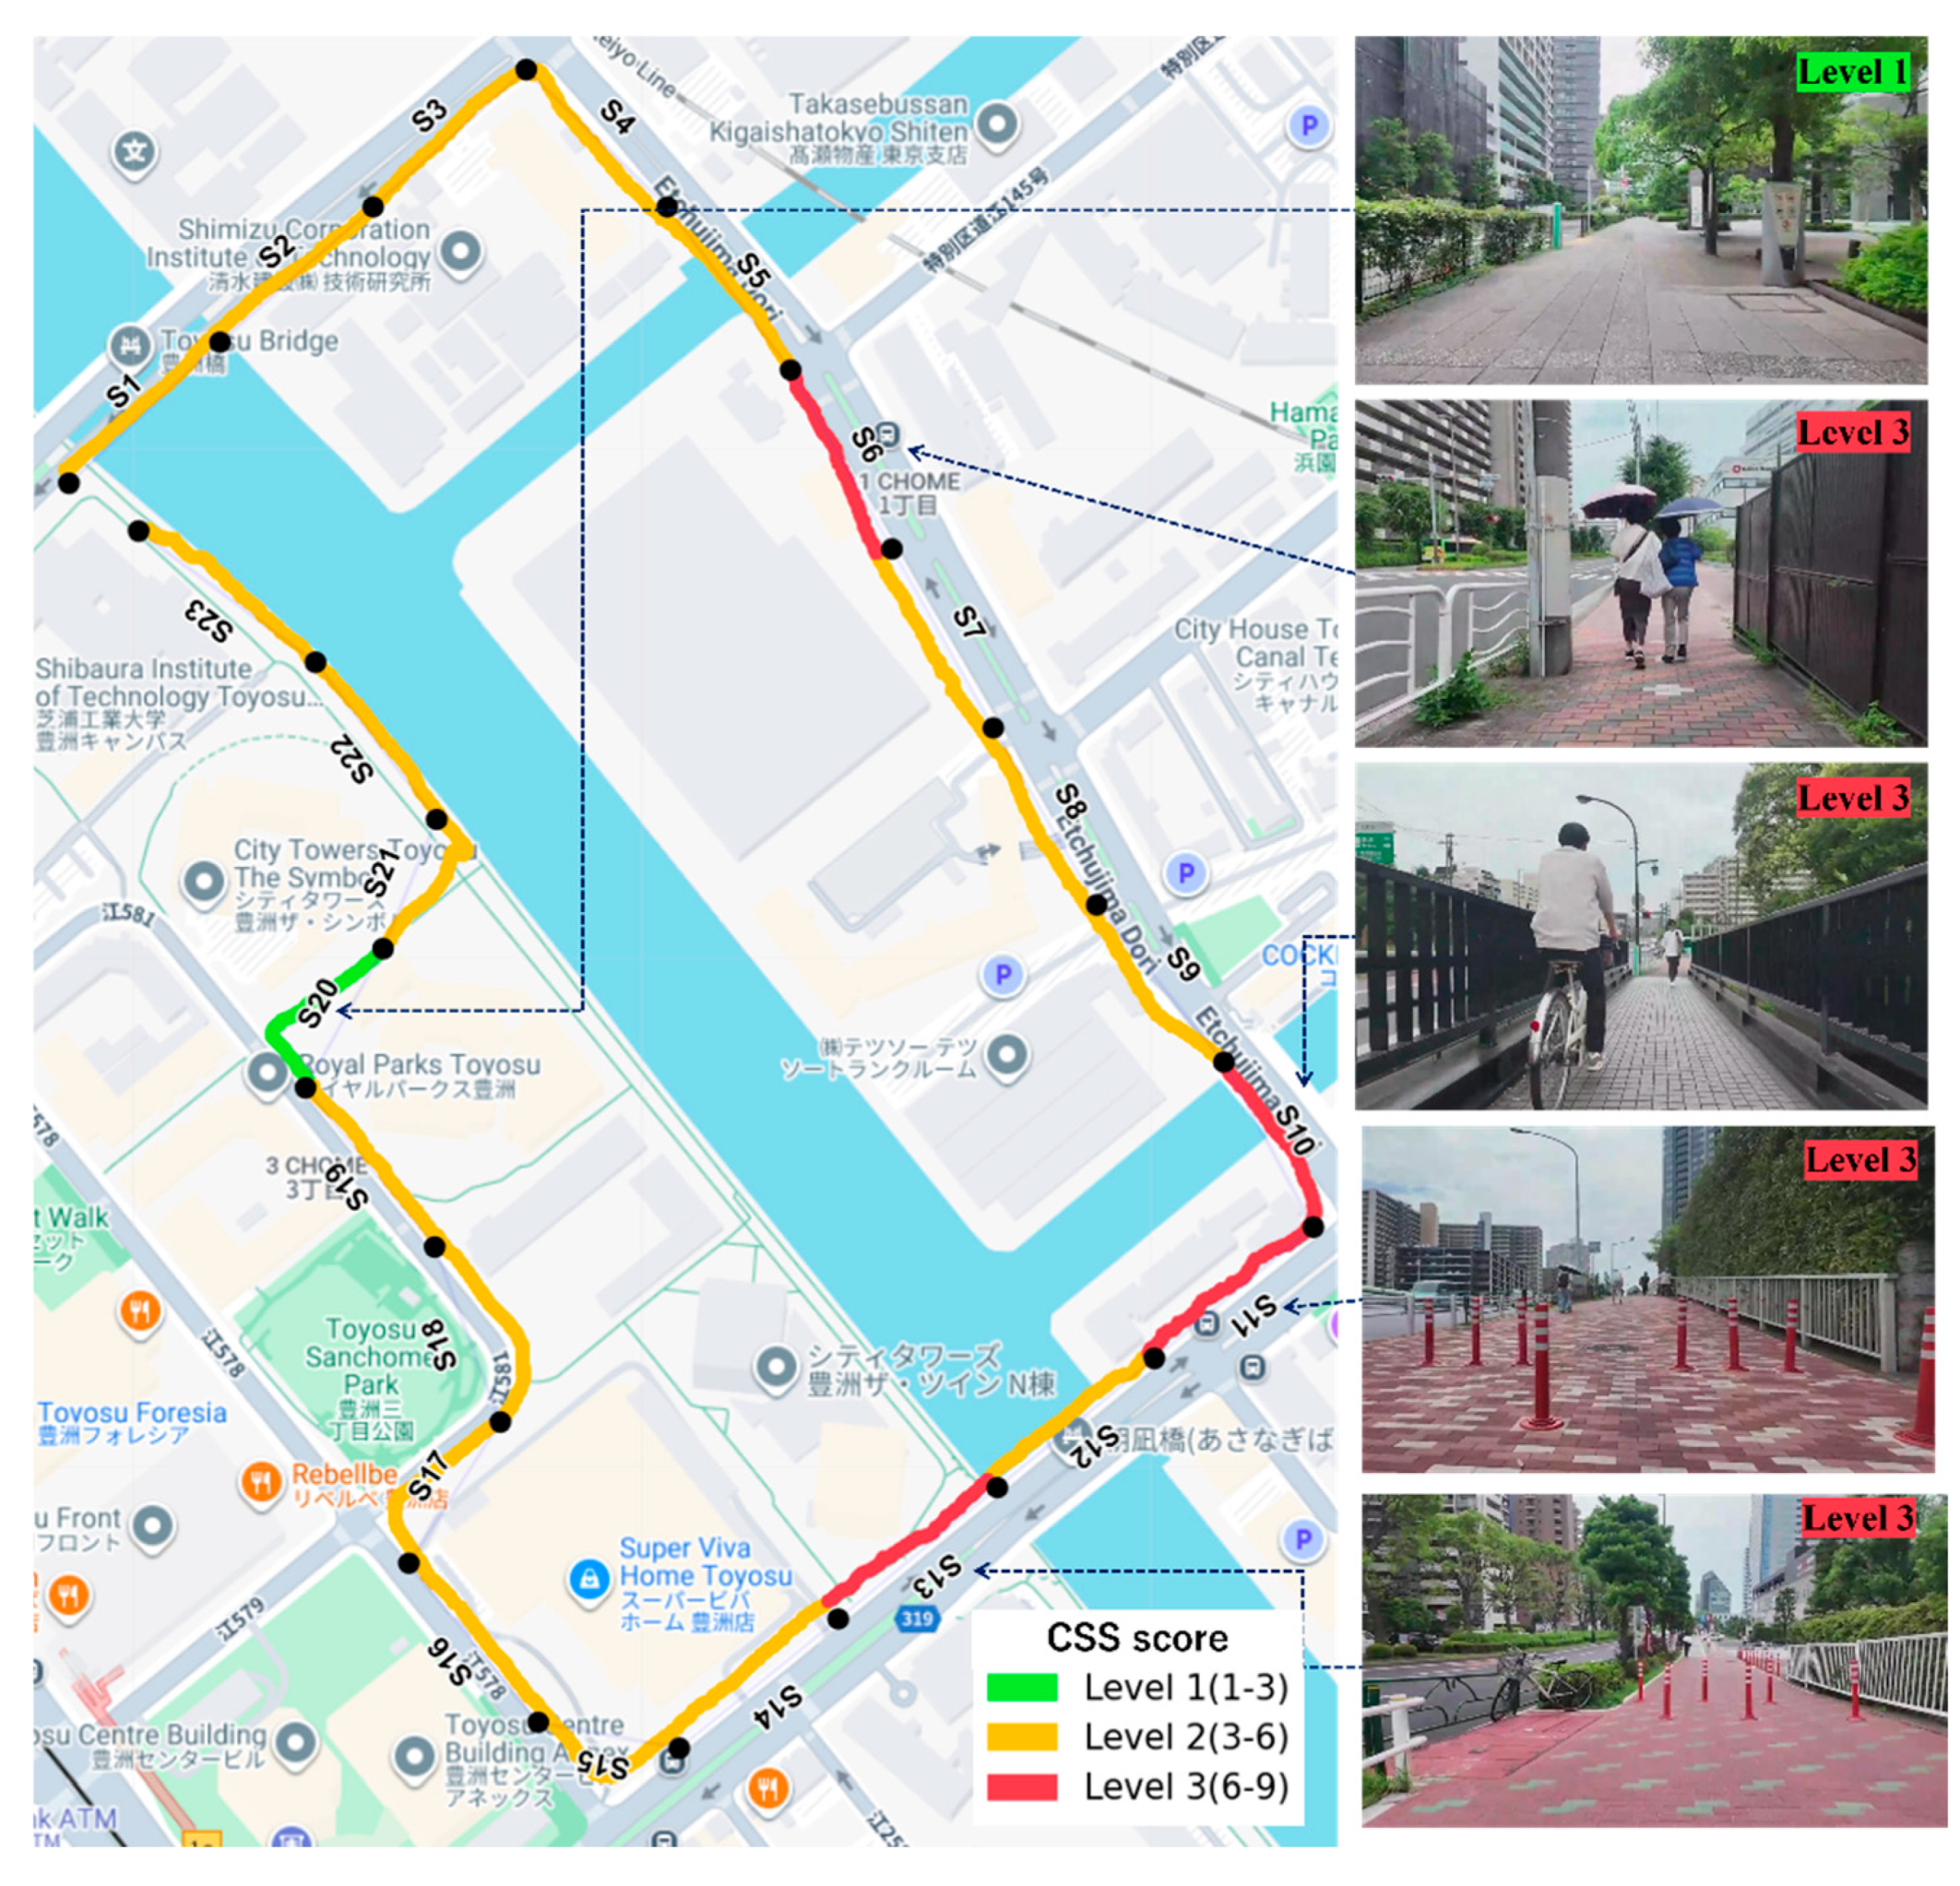
Figure 7.
Comparison of HRV indices (SDNN, RMSSD, and pNN50) between low-stress and high-stress segments.
Figure 7.
Comparison of HRV indices (SDNN, RMSSD, and pNN50) between low-stress and high-stress segments.
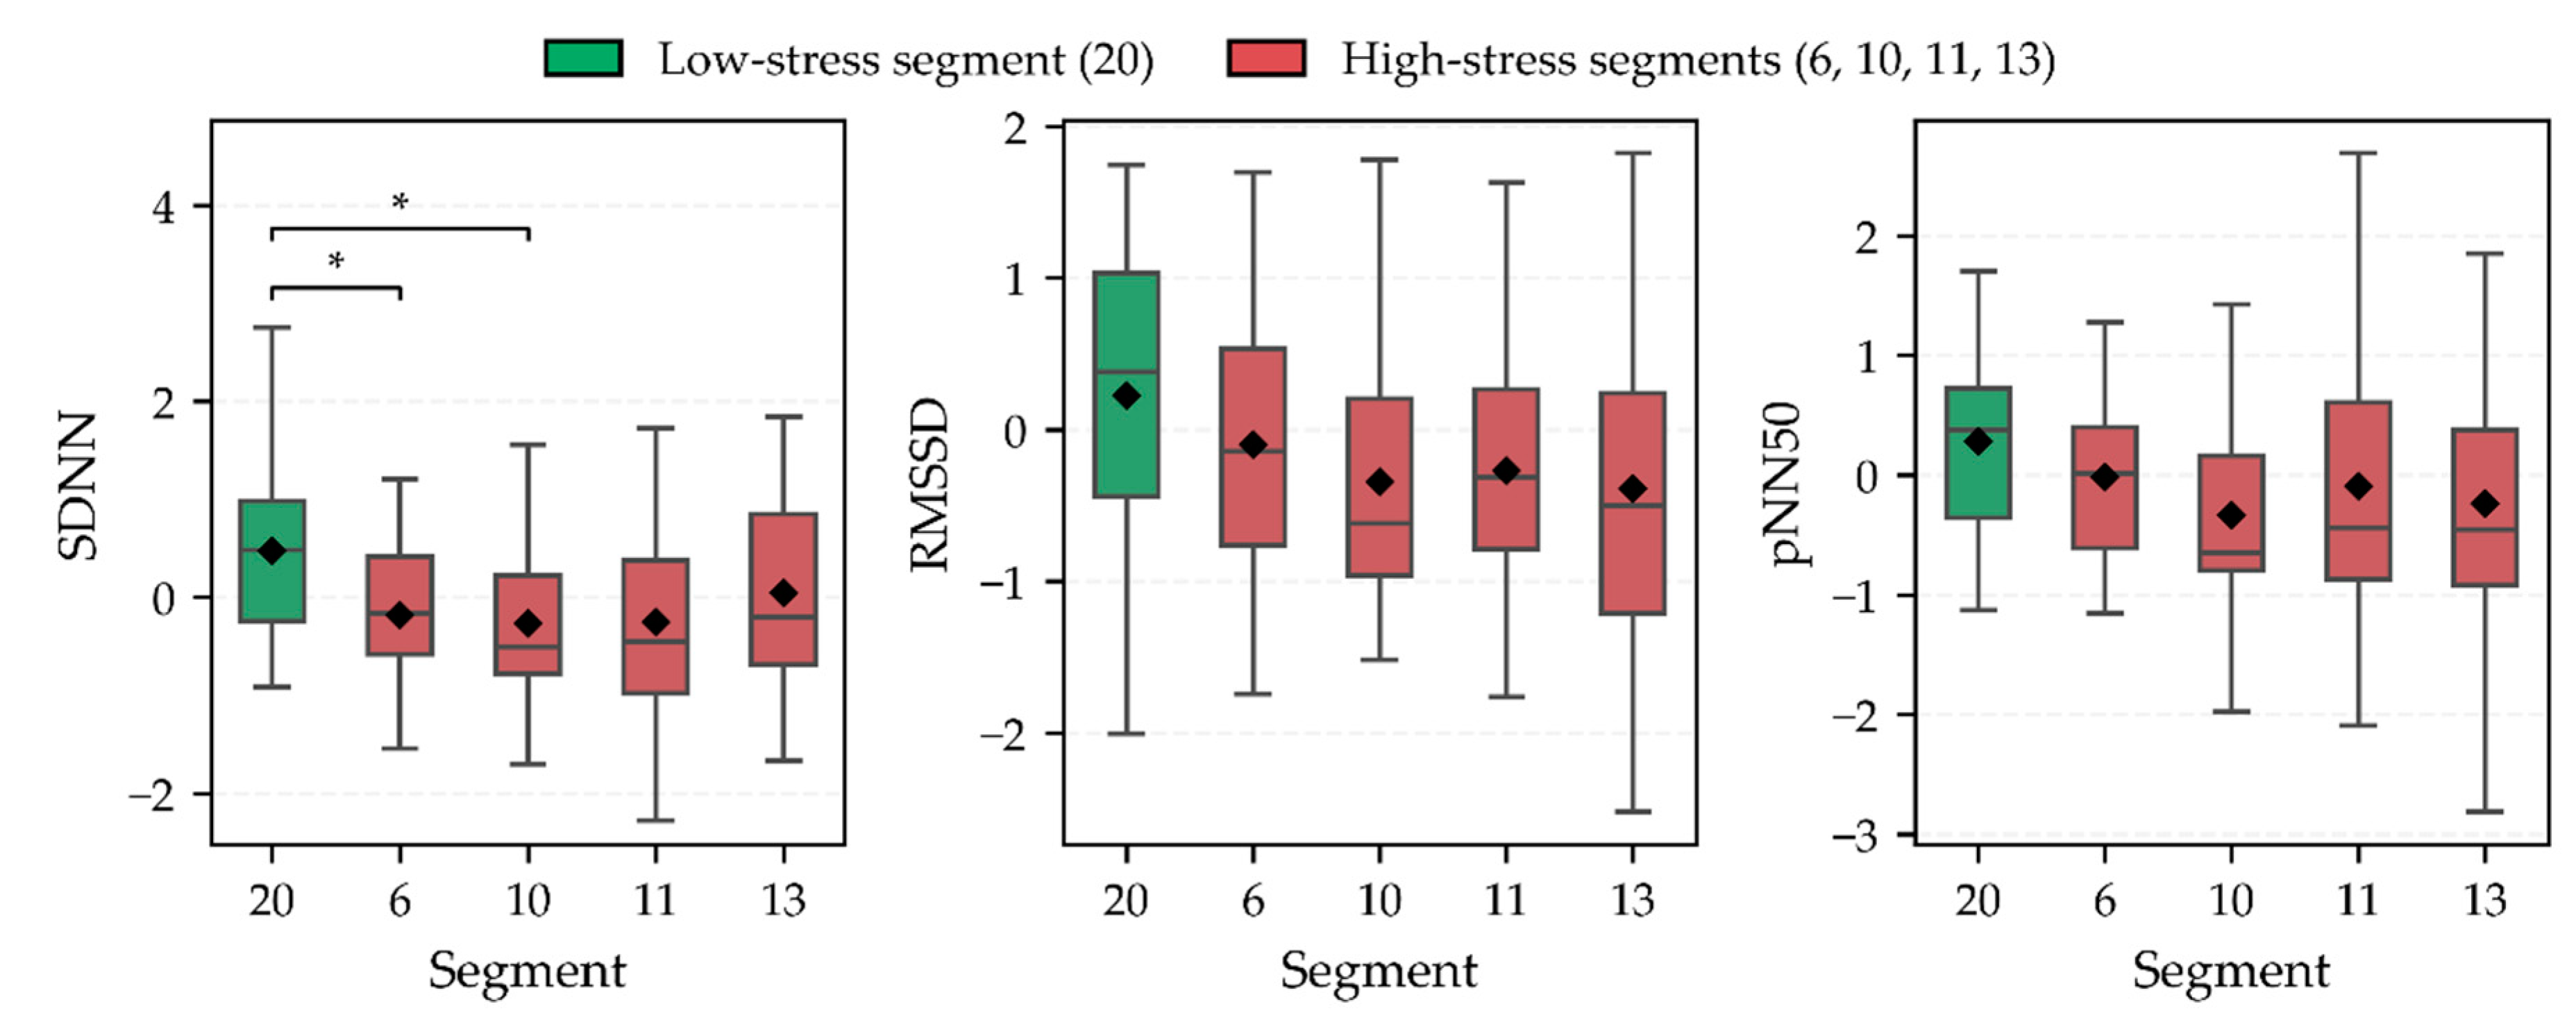

Table 1.
Spearman’s rank correlation coefficients between CSS and HRV indices.
| Composite stress score (CSS) | Spearman’s rank correlation coefficients (ρ) | ||
| RMSSD | SDNN | pNN50 | |
| (1) Poor road surface/vibrations | -0.149 | -0.487* | -0.102 |
| (2) Number of encounters with others | -0.385 | -0.291 | -0.306 |
| (3) Sidewalk width | -0.385 | -0.185 | -0.385 |
| (4) Poor road surface/vibrations + Number of encounters with others | -0.433* | -0.595** | -0.346 |
| (5) Poor road surface/vibrations + Sidewalk width | -0.306 | -0.480* | -0.261 |
| (6) Number of encounters with others + Sidewalk width | -0.508* | -0.345 | -0.451* |
| (7) Poor road surface/vibrations + Number of encounters with others + Sidewalk width | -0.525* | -0.627** | -0.449* |
** p< 0.01 level, and * p< 0.05 level.
Disclaimer/Publisher’s Note: The statements, opinions and data contained in all publications are solely those of the individual author(s) and contributor(s) and not of MDPI and/or the editor(s). MDPI and/or the editor(s) disclaim responsibility for any injury to people or property resulting from any ideas, methods, instructions or products referred to in the content. |
© 2026 by the authors. Licensee MDPI, Basel, Switzerland. This article is an open access article distributed under the terms and conditions of the Creative Commons Attribution (CC BY) license.
Copyright: This open access article is published under a Creative Commons CC BY 4.0 license, which permit the free download, distribution, and reuse, provided that the author and preprint are cited in any reuse.


