
Submitted:
05 February 2026
Posted:
05 February 2026
You are already at the latest version
Abstract
Agriculture has to be drastically assisted by the new promising technological advancements to alleviate the extremes in water demand and/or water waste. In this regard, this work showcases how soil moisture instruments can be combined with low-end microcontrollers, energy efficient communication protocols, single board computers, flow and pressure sensors, and in-purpose actuators to form a synergistic platform able to generate and study a diverse set of realistic irrigation scenarios, thus paving the way for the creation of intelligent models intercepting water misuse events and/or irrigation failures. Two drip irrigation points were setup, each having a TEROS 12 and a TEROS 10 instrument placed at different depths, while a prototype water flow/pressure control and report system was developed. All modules were sending data in real-time, via LoRa, to a central node implemented using a Raspberry Pi, for further processing and for making them widely available via common network infrastructures, also provisioning for remote scenario invocation. The exact steps being necessary, for the specific hardware and software components to be combined into a functioning whole, are clearly explained, thus allowing other teams of researchers and/or university educators worldwide to be inspired and benefited from platform replication.
Keywords:
precision irrigation
; sustainable irrigation strategies
; water conservation
; machine learning
; edge intelligence
; embedded systems
; LoRa
; TEROS 10
; TEROS 12
1. Introduction
By 2050, our planet will be home to more than 9 billion people [1,2,3]. The majority of them will live in large urban centers [4]. By 2030, the demand for water will exceed the available quantity by 40% [5]. Furthermore, there is a need to have food available for this larger and richer population [6]. That means, food production would have to increase by 70% in practice [7,8]. By 2050, farmers will need to double food production while using half the water they use today [9]. For this to become a reality, limited water resources must be used sustainably [10,11,12] and this poses a difficult challenge as the agricultural sector is the main water consumer on Earth requiring nearly 70% of the freshwater [1].
The way the farmers use water resources can decide whether their crops thrive or struggle. In 21st century it is not effective to rely on traditional irrigation methods because these often waste water, consume more time and do not deliver always the best results. Technological innovations in agriculture are being developed worldwide regarding the need for rational water management [13,14], aiming to alleviate concerns and ensuring that agricultural practices can become smarter, more precise, and thus a sustainable driver of growth for the economy. Among the pillars of this effort is the Internet of Things (IoT), an emerging technology reshaping the way we interact with the environment. IoT includes inter-connected devices hosting sensors, radio modules, and actuators forming a functioning whole that gathers, interchanges and responds to information [15]. IoT also becomes smarter to its decisions assisted by the rapid progress in the area of Artificial Intelligence (AI) and the appealing affordability of the related equipment, thus multiplying the benefits for irrigation improvement [16]. As the AI invaded rapidly in almost all areas of science, it provisions for raising awareness of water scarcity, for preventing water overuse, and for accelerating the adoption of sustainable water practices, to save water, to reduce cost and to optimize crop growth simultaneously [17]. Smart irrigation is the future of farming [18,19] and is expected to bring revolutionary changes in water conservation and sustainable agriculture.
Delving deeper into the subject, implementation of efficient irrigation systems such as drip irrigation or subsurface irrigation could save up to 25%-50% of water compared to surface irrigation [20]. In particular, drip irrigation is a very efficient technique that delivers water slowly and close to the plant roots via pipes, tubes and emitters, drastically reducing water loss from evaporation and runoff. Furthermore, this method keeps foliage dry, avoids to water the neighboring weed growth, prevents diseases, and provides optimal moisture for healthier, higher-yielding plants. Mainly in linear crops and tree crops, drip irrigation can save big amounts of water [21]. At the same time, energy is saved since drip irrigation can operate with low pressure levels, i.e., starting from 1 atm to 2 atm [22]. The fact the feed pressure remains constant ensures that the irrigation device will deliver the correct volume of water to the crops being grown.
Rajak et al. [23] compared several types of sensors as IoT-enabled devices and their applicability for analysis, decision making, and further required actions on farms. Millan et al. [24] evaluated the performance of six moisture sensors (among them TEROS 10 and 11) and provided calibration equations for a typical sandy soil used for strawberry production. TEROS 10 behaved similarly under both factory equation and the corrected equation settings, for low soil moisture regime. Pereira et al. [25] assessed the performance of a smart IoT-enabled drip irrigation system which was designed by connecting an ESP32 microcontroller with four sensors measuring soil moisture, temperature, air humidity and water flow respectively and interacting with Blynk application which is used to get irrigation data, water the plants and turn on and off the automatic watering feature. By using the Blynk dashboard the automatic function and the manual opening of a solenoid valve was tested and the performance of the whole system was considered successful.
Correa-Quiroz et al. [26] proposed an ESP32-based IoT system for intelligent drip irrigation and climate monitoring system for greenhouses. They used predefined moisture thresholds to activate or deactivate the drip irrigation system based on the data. These data were collected by various sensors, such as DHT11 sensors for temperature and humidity, GUVA-S12SD for UV radiation, capacitive soil moisture sensors and HC-SR04 for water level measurement, were transmitted by the ESP32 node to the cloud via Wi-Fi and the information was presented in real-time. Experimental results showed a 35% reduction in water consumption compared to traditional systems. Similarly, an STM32 microcontroller integrated with a LoRa module along with sensor, charger, solar panel and battery has been used by Inayah et al. [27] in their research on irrigation scheduling for increasing the productivity of drip-irrigated Cilembu sweet potato. Their method lead to a 45% increase of productivity and to 65% water saving, compared to conventional sprinkler systems. As authors state, a complete irrigation system is provided (including sensing and acting components), which is also fluently evaluated in the field, something that is not always happening with innovative research works.
Rajasekaran et al. [28] developed a LoRa based smart irrigation system by using a low-cost soil moisture sensor, LDR sensor, temperature sensor, 3 phase voltage sensor, water flow sensor and current sensor. The whole IoT system was complemented by a Neural Network (NN) for irrigation decisions and by a fuzzy logic system. Researchers in [29] proposed a LoRa based (LoRaWAN, in particular) internet of things smart irrigation control solution with hybrid classifier (CNN-SVM) convolutional neural support vector machines scheme. The tracked soil measurements are delivered to the IoT cloud server for storage and analysis with machine learning algorithms thereon to take up the irrigation plan to be applied, potentially bypassing weekly irrigation demands, in conformity to soil states and climatic. Recently, the authors in [30] developed an AI-supported irrigation system (utilizing Long Short-Term Memory (LSTM) neural network structures and Arduino MEGA microcontroller nodes) that continuously monitors air and soil moisture levels, ensuring optimal irrigation conditions and instant adaptation to seasonal variations. Gaitan et al. [16] present a system that utilizes ESP32 nodes, collects critical parameters (e.g., temperature, humidity, and soil moisture), provides detailed information and advanced analytics for each device and area monitored, and via OpenAI models generates predictive recommendations. The data transmission is performed wirelessly via WebSocket to a central database.
Apart from the AI benefits, regarding communication technologies concerns, LoRa appears as the best alternative to Wi-Fi due to its capability for extended coverage, low power consumption and its operation in the not-needing-license Industrial, Scientific, and Medical (ISM) bands. Consequently, although Wi-Fi is the most frequently cited technology in scientific publications on IoT based irrigation systems, LoRa follows, since the researchers are trying to overcome the limitations of Wi-Fi concerning, e.g., its high power consumption, and/or its limited transmission range, as pointed out by Abdelmoneim et al., 2025, [17]. In the wider context, several research works concentrate mostly on methodology and innovation priorities, and thus provide proof-of-concept level only implementation quality. Consequently, posing fluent requirements for long-term operation under the harsh agri-field conditions is often overlooked and left for future investigation [31]. This fact may signify connections that are prone to rust or disassemble (e.g., breadboards), no provision for efficient low energy/sleep mode operation, box enclosures that degrade rapidly (e.g., by solar radiation or by humidity factors), and limited radio coverage. Similarly, interference problems and lack of encryption may further degrade sensor data delivery quality and pose cybersecurity concerns [32].
Data required for either advanced AI model training or for more conventional hydrological formula processing should be of good satisfactory quality and diverse enough, at the same time. Unfortunately, the quality and the quantity of the data provided in real conditions, by the currently used agricultural platforms, is subjected to various intrinsic or exogenous factors (such as power losses, interference, climate extremes, instrument reinstallation changes and or failures, etc.), resulting in deteriorated model performance and even to wrong irrigation decisions [33]. Therefore, providing a diverse set of controllable monitoring conditions assists greatly in revealing accurate relationships between data patterns and causal phenomena, often exploiting, detecting and/or anticipating data anomalies.
Under this dynamic, this study focuses on how cost effective and widely available hardware and software tools can be used to improve irrigation methods and to preserve water. More specifically, it contributes by:
- Proposing comprehensive methods defining the manner that soil moisture instruments can be combined with low-end microcontrollers, energy efficient communication protocols, single board computers, flow and pressure sensors, and in-purpose actuators to emulate a diverse set of realistic user-defined irrigation event and malfunction scenarios.
- The elements and the methods being utilized are forming a cost-effective ecosystem able, apart from typical automatic irrigation actions, to monitor and to collect a wide set of multimodal irrigation-sensitive data, related with and reflecting the impact of the aforementioned events being emulated.
- Shedding light on several realistic design, implementation, installation and maintenance challenges being tackled, which are often omitted from description in the area. Specific provision has been taken in order to define all the necessary integration steps toward a functioning whole and to provide fluent guidance so that other teams of researchers and/or university students and educators to be inspired and/or benefited from flawless platform replication.
- Proposing a roadmap indicating directions that these data can be used to develop techniques for early detecting water misuse cases and/or potential irrigation failures and, last but not least, for invoking optimal precision irrigation actions, thus paving the way for a more rational use of freshwater.
2. Materials and Methods
2.1. Testbed Deployment Specifications
The proposed equipment deployment strategy in the agricultural field to support the irrigation scenario emulation and monitoring process is depicted in detail in Figure 1.
According to this description, two irrigation points (i.e., dugouts), namely A and B, were setup, each having a TEROS 12 and a TEROS 10 instrument placed at different depths, while a prototype water flow/pressure report and control system was developed. The locations of interest A and B, were drip irrigated via pipes forming two rectangulars, each embracing areas A and B, respectively. The two pairs of TEROS 12 and TEROS 10 sensors were connected via cables with a specifically designed data aggregation and delivery node unit, placed nearby, according to the specifications described in our previous work [31]. It should be mentioned that the bottom part of the box enclosure of the main node was hosting an SHTC3 digital air humidity and temperature sensor, providing complementary reference data against the bellow ground measurements.
To apply irrigation decisions into actions and to emulate/identify irrigation anomalies (such as broken pipes, low water pressure, clogged emitters), in conjunction with the soil moisture data of points A and B, the water amount flowing into the pipe system had to be adjusted and thus a custom valve system had to be introduced. Furthermore, to accurately capture and study the behavior of the proposed experimental irrigation arrangement presupposed additionally metering the total water flow and the pressure inside the piping system. All these requirements signified designing and implementing of a second node, placed near the main water supply, in the agri-field. This second node was following the design and implementation principles of the node collecting the data from positions A and B.
More specifically, provision was taken for three automatic servo assisted valves: one for regulating the main water supply (Valve M, in Figure 1), a second, next to it for emulating pipe leak events (Valve L, in Figure 1), and a third one to emulate drip irrigation emitter stenosis events (Valve S, in Figure 1), placed right before points A and B. The latter servo-controlled stenosis valve (Valve S, in Figure 1) was utilized for isolating locations A and B from the rest of the drip irrigation system, in order to emulate the case were some of the emitters were malfunctioning providing less than necessary water to the plants. Indeed, in real systems, clogged drip irrigation emitters constitute a frequent problem (usually due to mineral deposits, algae, bacteria, or dirt) that may lead to uneven plant watering and to inadequate plant growth.
It should be noted that the entire pipe system had an extra branch with irrigation emitters, as shown in Figure 1, delivering water to a neighboring area, yet not close enough to points A and B, to not interfere with the moisture levels therein. This arrangement was necessary to create a total water flow that would be high enough to fell within the measuring range of the typical flow sensor (YF-S201, ½ inch model) connected to the main water supply point (i.e., above 1 L/min). This sensor was generating pulses whose frequency was proportional to the amount of water passing through it. The liquid pressure sensor (i.e., an YD6080 model, made by YD WZYDDZ, Wenzhou, China) was able for measurements from 0 bar to 12 bar. This element was installed in-series with the flow sensor to monitor the pressure of the water supplying the irrigation pipes and generated analog voltage signal proportional to the pressure of water inside them.
The two participating nodes were sending data in real-time, via LoRa, to a sink/gateway node implemented using a Raspberry Pi (RPi), for further processing, storage, and for making them widely available via a common network infrastructure and, last but not least, for remotely scheduling the irrigation event emulation scenarios. The overall network infrastructure required to support the irrigation event emulation and monitoring process from the cloud site is depicted in Figure 2.
After briefly presenting the specification of functions to have a fluently working irrigation event emulation and monitoring platform, the following subsections provide analytic information on the steps required to integrate it.
2.2. The Key Measuring Components
One of the key measuring components is the TEROS 12 instrument. This device is a capacitance-based soil moisture sensor produced by Meter Group. According to its manual [34], TEROS12 sensor measures volumetric water in a range from 0 to 0.70 m3 m−3, the accuracy is reported to be ±3% in mineral soils that have solution electrical conductivity EC < 8 dS/m with standard factory calibration, operate at temperatures ranging from −40 to 60 °C with a resolution of 0.1 °C and the measurement accuracy is ±1 °C. The sensor consists of three stainless steel needles 5.5 cm long, an epoxy body and a ferrite core. The operation frequency is 70 MHz and it also measures soil temperature through a thermistor in the center needle. The measurements of the TEROS 12 are provided via a digital interface supporting either the simpler serial (DDI) data format or the more complex SDI-12 data protocol. The device is compatible with 3.3 V logic and it is also 5 V tolerant, while a voltage of 4 to 15 V DC should be supplied to function properly. The power consumption of TEROS 12 ranges from 3.0 mA to 16.0 mA, with a typical value close to 3.6 mA. The sensor output raw values are transformed to VWC (Volumetric Water Content) and to apparent dielectric permittivity by the following calibration equations provided by the manufacturer:
θ (m3 m−3) = 3.879 ∙ 10−4 ∙ RAW − 0.6956
εa = (2.887 ∙ 10−9 ∙ RAW3 − 2.080 ∙ 10−5 ∙ RAW2 + 5.276 ∙ 10−2 ∙ RAW − 43.39)2
The other of the key measuring components is the TEROS 10 capacitance-based instrument [35]. This sensor is the precedent model of TEROS 12 from the manufacturer Meter Group and estimates VWC indirectly by using an electromagnetic field to measure apparent dielectric permittivity. The two stainless steel needles of TEROS 10 are 5.5 and 5.1 cm long, respectively, and they effortlessly incorporate into any type of soil. The apparent dielectric permittivity (ea) of the surrounding medium is measured by the TEROS 10 sensor using an electromagnetic field. A 70 MHz oscillating wave is supplied by the sensor to the sensor needles, which charge in accordance with the material’s dielectric. The dielectric and VWC of the substrate are proportional to the charge time. Based on the substrate dielectric permittivity, the TEROS 10 microcontroller calculates the charge time and outputs a raw result. The raw values are the transformed to VWC by the following generic calibration equation provided by the manufacturer specific to mineral soils
θ (cm3/cm3) = 4.824 × 10⁻¹⁰ × mV3 − 2.278 × 10⁻⁶ × mV2 + 3.898 × 10⁻³ × mV − 2.154
The raw values are also used to determine apparent dielectric permittivity using the following factory calibrated equation
ε = 1.054 × 10⁻¹ × e2.827 × 0.001 × mV
According to its manual [35] TEROS 10 sensor measures volumetric water in a range from 0 to 0.64 m3 m−3, the accuracy is reported to be ±0.03 m3/m3 in mineral soils that have solution electrical conductivity EC < 8 dS/m meanwhile it is ±0.05 m3/m3 in soilless media that have a solution EC <8 dS/m with standard factory calibration and its operating temperature range is from −40 to 60 °C. TEROS 10’s analog output signal has a voltage range of roughly 1000 to 2500 mV. This device has a nominal power consumption of about 12.0 mA and requires DC voltage between 3.0 V and 15.0 V to function correctly. The sensor is a low cost device, easy to use, and compatible with the majority of data logging systems.
It should be noted that, these are widely-used instruments and thus, apart from the equations provided by the manufacturer, several researchers [36,37] recommend improved calibration equations specific to soil type or to other porous materials and for various salinity levels, for both sensors of the TEROS family.
2.3. Equipment Deployment Details
The irrigation emulation experiments took place at the campus of the university. Monitoring the environment is crucial to ensure that the procedure was operating as intended. Open field experiments are of great interest as they simulate real environmental conditions, the experimental system was tested in all weather changes. Two small trenches were dug at a distance of two meters from each other and a TEROS 12 unit was placed horizontally at a depth of 8 cm meanwhile a TEROS 10 unit at a depth of 16 cm in each dugout/hole. The devices were covered meticulously by soil. Great emphasis was given to the proper installation of all the sensors in order to avoid air gaps. Around the sensors-soil contact area, a slightly and carefully compaction took place. The overall preparation stages are given in Figure 3a through 3c. The soil surrounding the places where the instruments were installed was nearly of the same type. By this way, two irrigation points, namely A and B were created, allowing the periodic collection of real-time soil moisture data, in a manner that will become more apparent via the following description.
Figure 4a through 4c depict the actual deployment of the irrigation event emulation equipment in the agricultural field, close to the holes A and B, hosting the soil sensors. In greater detail, Figure 4a depicts the node intercepting the total water flow and pressure and controlling the three irrigation valves (with its front protection cover intentionally open). Figure 4b illustrates the irrigation junction separating the irrigation emitters in different groups and the valve emulating emitter stenosis per holes A and B. Figure 4c shows the irrigation pipes per holes A and B and the pairing soil data harvesting sensor node.
The in-situ sensor data collection unit could intercept the signals from two digital soil moisture instruments (i.e., the TEROS 12 units), via the DDI protocol method, and two analog soil moisture instruments (i.e., the TEROS 10 units), via the built-in ADC module. A dedicated bi-directional multiplexer was utilized for data collection and power cycling the four instruments, in the sequence: TEROS 12 A, TEROS 12 B, TEROS 10 A, TEROS 10 B. The whole measurements were collected and transmitted via LoRa in less than one second time, while after this activity period the unit was automatically set to sleep mode for almost 5 min before waking up again. The whole system was powered by an 18650 battery of 2500mAh capacity, placed under the soil for avoiding temperature extremes and improving longevity. An auxiliary 0.5W solar panel was also included in the aforementioned unit, to practically eliminate the need for manual periodic battery charging. The main data collection and delivery system was hosted inside an IP65 box placed 1m above the surface of the ground and equipped with a 5dBm omnidirectional LoRa antenna for fluent data transmission. The node had the SHTC3 atmospheric humidity and temperature sensor, fixed inside a dedicated small 3D printed protecting enclosure, at its bottom part.
The rectangular pipe formations embracing areas A and B, respectively, had four drip irrigation emitters each. Each emitter was rated of 6lt/h, approximately. The pipe system was dimensioned to have another 24 emitters for delivering water to the neighboring area described above, thus resulting into easily measurable aggregate flow range. As already mentioned, a servo-controlled stenosis valve was separating the emitters of holes A and B from the rest of the emitters. It is also worth noting that, in the area the experiments were performed, the water supply pressure was exhibiting strong pressure variation and a pressure limiting valve was installed to avoid values exceeding the 4 bar limit and thus alleviating the potentially damaging water hammering effect.
It is worth noting that, referring to the in-situ installation, the automatic servo-assisted irrigation actuators utilized cheap fluid valves made of plastic that were modified to progressively open and close via dedicated angle servomotors. This adaptation of the servomotors required to 3D design and print custom parts, namely a plastic frame embracing the initial valve and hosting the servo (Figure 5a). Laboratory experiments, performed with brand new valves, proved that a typical servo could produce enough torque to rotate the valve directly coupling the servomotor output to the valve handle (Figure 5b).
Consequently, the first 0-90 degrees rotational movement range of the servomotor were translated to 0-90 degrees movement of the actuation axis of the plastic valve. The prototype components were initially printed in polylactic acid (PLA), selected for its ease and its fast speed of printing. These initial arrangements had to be reconsidered, as it will be explained in Section 3.2.
The second node controlling the valves and providing the aggregate flow and pressure data was hosted inside an IP65 box as well, exactly as the node capturing the soil moisture data, but it was equipped with stronger batteries and electronic circuits to efficiently drive the servomotors of the valves, one by one, whenever necessary. Consequently, this node included a step-up DC-DC voltage converter to generate 6V from the (now two) 18650 batteries, plus a microcontroller activated electronic switch to provide power to the servomotors only when it was absolutely necessary, i.e., for altering the corresponding valve position. This node, except from reporting flow and pressure data every 1min, was able to accept valve open and close commands to a certain aperture level, utilizing a LoRa link with the Raspberry Pi assisted sink/gateway central node.
In turn, the data transmitted by the aforementioned nodes were received by a sink node placed 200m away, approximately, from the location of irrigation points A and B, inside the university premises. Two farm buildings intervened between the source and the sink nodes. The sink/gateway node was following a simple architecture equipped with a LoRa receiver module connected to a Raspberry Pi unit (via its USB and hardware serial connection). An omnidirectional LoRa antenna completed the sink/gateway equipment set. As for the sensor/actuator node, this antenna had 50 Ω output resistance, was vertically polarized, was suitable for the 868/915 MHz bands, and it was accompanied by a 3m coaxial cable, for flexible installation options. Further improvements toward tolerant operation to occasional power and cloud connectivity losses, suggested the gateway node to be equipped with a tailored for Raspberry Pi Uninterruptible Power Supply (UPS) unit and a dedicated accurate hardware real time clock (RTC) unit. Figure 6a illustrates details of the components comprising the gateway node, while Figure 6b depicts its final installation position inside the farm systems laboratory premises of our university.
2.4. Software Component and Interconnection Analysis
The software on sensing and sensing/actuating nodes was developed using the Arduino IDE environment (software version 1.8.16). The data provided by these two nodes to the sink/gateway contained, apart from a sensor node identifier, a modulo-256 serial number information stamp for interception of potential packet losses, and they were encrypted using the lightweight crypt and speck libraries, which are compatible with the Arduino programming environment.
The sink/gateway node unit, connected via a conventional Wi-Fi Access Point to the university network, was responsible for additional processing and storage of incoming data, as well as for making them available worldwide via common Web and VPN (Virtual Private Network) services, as described in [31]. The aforementioned transparent VPN functionality was supported by the Remote. It [38] environment, thus allowing the utilization of a large set of common useful network (and Web) services (e.g., from basic SSH console configuration environment to graphical solutions like the RealVNC one). Apart from the soil moisture values, were reported the soil temperature (grace to the TEROS 12 sensing capabilities), the node internal temperature and battery voltage, the air humidity and temperature at 1m above ground, and last but not least, the total water flow and pressure of the irrigation system. Python (versions 2.7 and 3) and Linux scripts (Bash shell) were utilized for the software development on the sink/gateway unit. On packet data reception, sensor node-specific information was supplemented by the operating system timestamp, in Unix operating system time format (epoch), and by the corresponding received signal strength indicator (RSSI) values, as intercepted and calculated by the sink/gateway node. The nodes provided mainly unprocessed (raw) data requiring further processing (e.g., the application of manufacturer calibration equations) to generate useful to scientists/farmers information. The latter task was performed upon the Raspberry Pi via scripts implemented as explained in [31]. Furthermore, as the updated topology hosts acting elements as well, the central node had the additional role of intercepting irrigation commands and scenarios from the remote users, invoking their execution, and keeping locally the corresponding activity log files. The sensor/actuator node handling the valves was following the directions from the central node, interpreting them in the desired target aperture/closure actions (either partial or complete ones) for the three angle-servo motors controlling them.
To complement this user-end functionality, a smart phone/tablet specific application was written, using the MIT App Inventor environment [39]. MIT App Inventor is a block-based programming development platform that provides an easy environment for fast yet efficient application development. This application via TCP/IP sockets was communicating with the RPi unit of the sink/gateway node to schedule irrigation events and/or to invoke the storage of the corresponding data and, last but not least, to monitor in real time the status of the irrigation process.
3. Results and Evaluation
In order to further communicate the potential of the proposed platform, integrating the hardware and software arrangements being described, characteristic results are presented and analyzed, from both irrigation-specific point of view and technical-specific point of view.
3.1. Irrigation-Specific Aspects
The utilization of a microcontroller harvesting data from liquid pressure and flow sensors was allowing for real-time monitoring of several intrinsic irrigation process features. In this regard, Figure 7a illustrates the capturing of a high-pressure shockwave following a sudden (manual) open of the main supply valve, at the absence of pressure regulator in the piping circuit. The inspection and the extraction of results were facilitated by the Serial Monitor and Serial Plotter (depicted herein) components of the Arduino IDE environment. The plotting interval of consecutive values was set to 5ms. The pressure evolution (blue curve), although it has a steady state level value close to 4.5 bar, is exhibiting oscillations, peaking at 6 bar, that weaken over time. Going further, Figure 7b represents the water flow values inside the drip irrigation system as a function of the pressure inside the piping. This relationship can be described with a satisfactory matching using linear terms, for the area of pressure values dominating the irrigation process, i.e., between 2.5 bar and 4.5 bar. This phenomenon might become more complicated over time by the presence of mineral buildup on the emitters and/or dirt.
Figure 8 shows the time evolution (in hours) of soil moisture profiles during simultaneous irrigation events at two experimental installations (Holes A and B) in a sandy loam soil. Measurements were obtained using TEROS 12 and TEROS 10 sensors installed at depths of 8 cm and 16 cm, respectively. The time series cover the period starting from July 29 to August 11, 2025 and include four irrigation events followed by drying periods between successive applications. Irrigation was started when soil moisture decreased to approximately 19%, which was defined as the lower irrigation threshold. For each irrigation event, 30 lt of water was applied. Irrigation was terminated when soil moisture approached near-saturation conditions, corresponding to θ values of approximately 35%. This resulted in sharp increases in soil moisture immediately after water application. After each irrigation event, soil moisture gradually decreased due to the combined effects of drainage, evaporation, and soil water redistribution. The repeated wetting–drying cycles showed consistent behavior throughout the monitoring period, indicating a stable irrigation management scenario pattern to be used for big data collection.
The irrigation platform allowed for the generation of event of different time duration, i.e., lasting either for optimal one or being shorter/longer than this value. The water flow rate could be adjusted as well, for each of the three key role valves, namely the M, L, and L ones, thus generating a large set of irrigation conditions to be gathered. Figure 9 illustrates the total water flow (i.e., passing the whole system) recordings, in real time, during a specific irrigation event. The duration of this event is close to 75 min and the flow was close to 53 ml/s for that period. The nearly 50% flow peak in the beginning of this event is attributed to the presence of the preexisting air inside the piping system, that was rapidly pushed out (via the emitters) by the incoming water following it. The water pressure initially was close to 0 bar, it raised and varied (slightly) around 3 bar during the irrigation event, and it returned close to 0 bar after this event had finished.
It should be noted that for the drip irrigation emitter setup being followed, i.e., having 4 emitters per each dugout (2 dugouts in total) and also a branch with 24 additional emitters. These arrangements make a 4/32 amount of total water to be directed to each dugout. Given that the total flow (with valve M and S completely opened and valve L closed) was between 53-54 ml/s during the majority of our experiments, by doing the necessary calculations, results in a flow value per emitter close to 6 lt/h, which is its factory default. Furthermore, for the aforementioned irrigation event which is illustrated in Figure 8, the 30 lt water amount per hole is absolutely justified. Finally, with the valve S (i.e., for clogged emitters) completely closed, the total flow dropped to a level around 40 ml/s, with is also justified, as it expresses the 24/32 portion of the value with valve S opened (i.e., the 53-54 ml/s level).
As already mentioned, the proposed agri-field equipment deployment strategy also intercepts and collects complementary (to soil moisture) data, like the air humidity and temperature close to the neighboring holes A and B (via the SHTC3 sensor module), and the temperatures inside the soil at the depth of 8 cm (via the TEROS 12 thermistor). These data can contribute to more accurate irrigation decisions, acting as additional input for either conventional or machine-learning based irrigation models. These parameter variation during a two-day (48 h) period is depicted in Figure 10. It is interesting to mention the complementarity between air humidity and temperature time evolution, the less intense variation and the delayed response of temperatures below ground compared with the one of the air, and, last but not least, the good match of the soil temperatures between dugouts A and B, indicating that both holes were prepared quite meticulously as they have the TEROS instruments at the same depth each.
3.2. Technical Efficiency Aspects
The experiences gained during the operation of the platform provided valuable feedback indicating the necessity of applying corrective actions.
To be more specific, after the first two months in very hot and sunny outdoor weather conditions, the custom servo-assisted valves had to be modified. Indeed, although initial laboratory experiments proved that a typical servo could produce enough torque to rotate the valve directly coupling the servomotor output to the valve handle, the long term exposure of the plastic valve to the extreme outdoor temperatures indicated that more torque was required to turn it freely (especially at its first opening change), and thus a custom planetary gear system should be added to fix this issue. This upgraded system (Figure 11a) included a sun gear, two planetary gears, and an internal ring gear hosting them, having a stand in the middle to hold the sun gear in place. In the final assembly, the two planetary gears were kept in place via a metallic rod fixed at the top of the main body’s structure (Figure 11b). These arrangements made the 0-180 degrees typical rotational movement range of the servomotor to be translated to 0-80 degrees movement of the actuation axis of the plastic valve, thus proving enough aperture to water supply the irrigation system and more than doubling the peak torque applied to the valve axis. Furthermore, concerning the 3D filament selection, the extended exposure of the PLA components to direct sunlight led to thermal deformation due to the material’s low glass transition temperature. To address this, the identical CAD file was reprinted using acrylonitrile butadiene styrene (ABS), under identical slicing profiles and printer settings (Figure 10b). Although ABS presents a less environmentally friendly option, it provides enhanced thermal resistance and mechanical robustness, ensuring operational reliability under outdoor environmental conditions [40].
The aforementioned ameliorations were easy to apply and maintained cost-effectiveness. Nevertheless, they were not the only ones being necessary. Indeed, the timing of the periodic power cycling required for reading the values from the four instruments had to be improved by slightly increasing the delay while acquiring data from the TEROS 12 units of holes A and B, in order the reading of the incoming data from each of them to be completed without losing the tailing values. Furthermore, interference was also recorded between the LoRa radios and the terrestrial corrective data of a neighboring GNSS-RTK system, utilized for providing guidance to a robotic vehicle in the university campus. The problem was solved by altering the frequency of the RTK system. Furthermore, the transmit power of the nodes was adjusted so as to allow for reception quality close to -100 dBm, thus leaving a -30 dBm sensitivity safety margin before loss of signal.
The consumption of the sensor node was meticulously adjusted and measured in our previous work (Loukatos et al., 2024), using a custom real time measuring circuicity of very fine time granularity (i.e., at 20 sps), based on the ADS1115 16-bit precision ADC module. Via this method the amperage drain during sleep mode was close to 250 μA, while at idling it was close to 8 mA (with the LoRa radio and the unnecessary modules disabled). The hosted soil instruments caused an additional amperage drain, via the multiplexer and the powering circuit of the hosting board, i.e., between 8 mA and 12 mA, approximately, according to their type. The sensor and the node health status data transmission (nearly 60 B) every 5 min required another 90 mA for a 100 ms period, approximately. The LoRa transmitter was set to the moderate power settings (i.e., to with the coding rate set to 4/5, the bandwidth set to 128 kHz, the spreading factor set to 7, and the transmit power set to 14 dBm). Values in mW can be easily calculated using the above current consumption data, given that the battery voltage was close to 4.1 V, during sensor node operation, grace to the small solar panel attached to it.
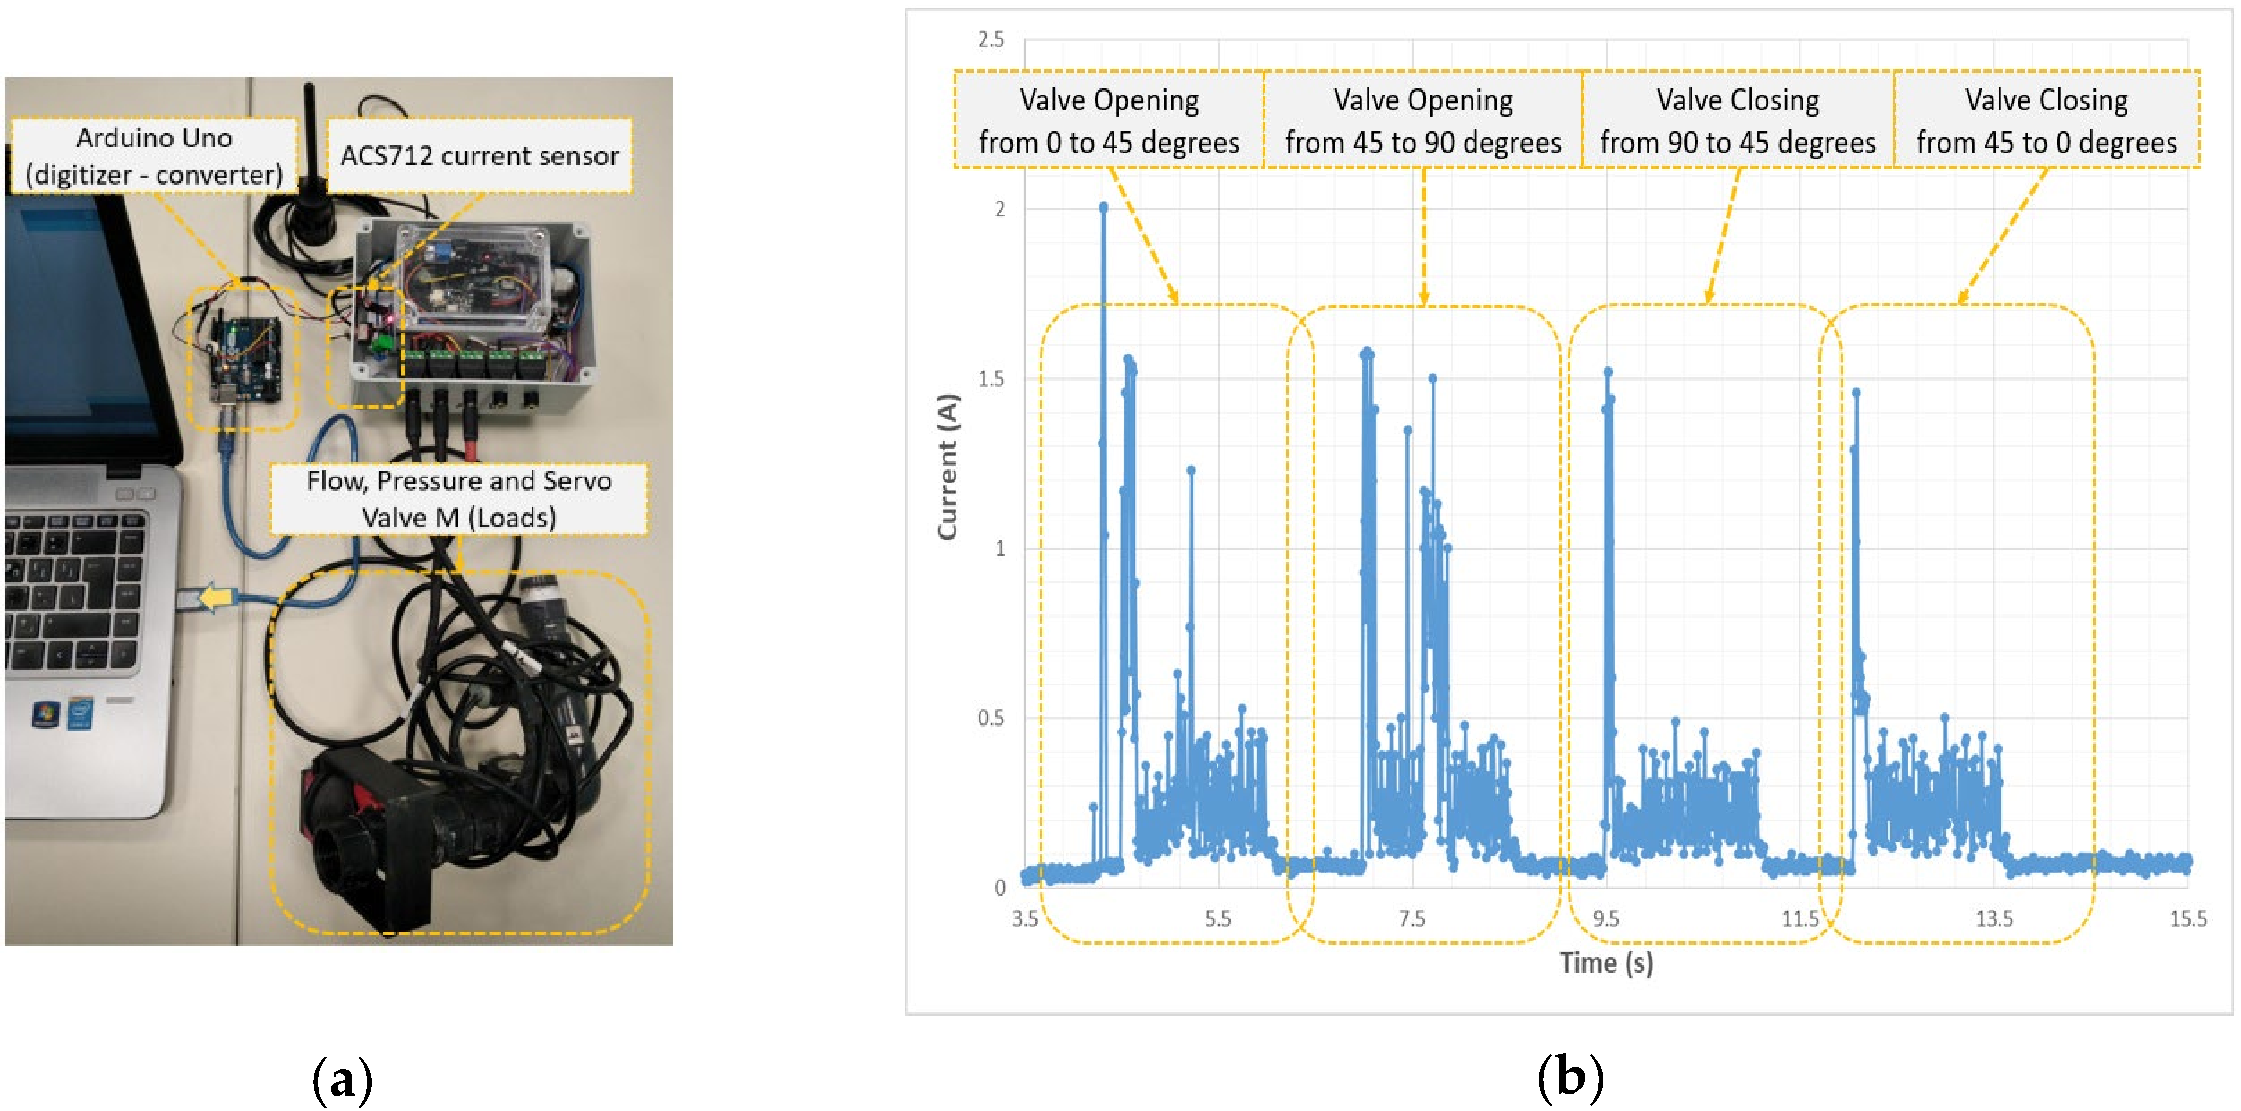
The amperage consumption of the sensor-actuator node controlling the valves and reporting the flow and pressure data, is more interesting to study herein, as this node was exhibiting a drastically changing amperage consumption profile due to the need for feeding the servomotors moving the valves. For this reason the amperage consumption measurements were extracted using an ACS712 Hall based sensor unit, connected to an Arduino Uno microcontroller to handle the corresponding digitization and data conversion tasks (Figure 12a). This setup provided recordings varying from 10 mA (with the node idling without sensors or servos) to nearly 2 A (with the sensors connected and the servo motors to rotate the corresponding plastic valves, the one after the other). Such an amperage recording case is shown in Figure 12b, where consecutive average consumption values are plotted every 10 ms, for the sensor-actuator node.
The sink/gateway node, as already mentioned, had a permanent power supply and its amperage consumption was almost constant, i.e., close to the 250 mA level, exhibiting only sporadic additional raises by almost 90 mA for a 40 ms period, approximately, whenever irrigation commands had to be passed to the sensor-actuator node.
4. Discussion and Future Perspectives
The automatic irrigation scenario invocation and monitoring platform being presented provides a very accurate way to identify the effect of even negligible changes in soil environment parameters, e.g., like stepping nearby the irrigation points or the appearance of new plants therein. This further shifts the standards for accurate experiment setup preparation or for verifying the irrigation formulas for certain soil types.
At this point, it is interesting to mention that a large number of emulated irrigation events should be necessary for efficient neural network model training, e.g., for identifying irrigation emitter stenosis or over irrigation. These events should belong to different classes, but should not be identical, to avoid model overfitting to the data used for its training. Thankfully experiments being performed verify that nature creates enough variability itself as the soil composition at points A and B can never be identical, neither their compaction degree nor the depth at which the corresponding TEROS instruments have been placed. Nearby trees and buildings introduce additional diversification of values being recorded as well as the temporal differences in the water supply pressure. This nature-derived variability can be augmented by allowing small changes per emulating event category, in factors like the aperture of the valves or the duration of the irrigation action, letting the critical parameter (i.e., the angle or the duration) to obey to statistically defined uncertainties (i.e., to follow specific statistical distribution laws) as implemented for network traffic generation events in the past [41].
The work being presented, provides many details on how a cost effective but efficient irrigation event emulation and monitoring system can be designed and implemented. Experiences gained with this platform, contributes to the understanding of the need for the development of multilevel mechanisms (in terms of time) orchestrating the irrigation process, able to:
- Allow the execution of user-defined condition irrigation scenarios (i.e., corresponding to cases like normal, leak, blown valve, low water supply, emitter stenosis, over irrigation);
- Schedule watering events of specific/optimal duration according to season and to environmental conditions and cultivation (based on a-priori underlying model calculations);
- Perform watering events according to the feedback provided by the soil moisture instruments;
- Intercept immediately (i.e., in a few minutes) urging situations (like blown emitters or valves), inform about them and automatically handle them properly, i.e., by cutting the water supply;
- Identify and inform about less intense problems (i.e., to locally clogged emitters or to small pipe system leaks), whenever they occur (i.e., in 30-100 minutes);
- Provide manual fluent manual overdrive options, as automatic systems can always fail.
Apparently, several points require further investigation as: standardizing the format of the data being recorded and of the irrigation scenarios to be followed, increasing the easiness of defining and executing irrigation events via visual tools, further facilitating the processes of collecting/characterizing the corresponding data and of training the neural network models. Long term data collection under different seasons/environmental conditions should be necessary to efficiently train the system for identifying the irrigation process quality and potential malfunctions, without excluding synergies with analytical hydrological formulas and methods for improved results.
5. Conclusions
The work being presented sheds light on the methods that soil moisture instruments can be combined with low-end microcontrollers, energy efficient communication protocols, single board computers, flow and pressure sensors, and in-purpose actuators to emulate and to monitor a diverse set of realistic user-defined (and potentially not optimal) irrigation event scenarios. The result was an ecosystem able to generate and to collect multi-modal irrigation-sensitive data, whose physiology and performance was communicated via in-situ experimental testing. A roadmap for exploitation paradigm was also proposed, so as these data to be used for the early detection of water misuse cases and of potential irrigation failures, and for optimal precision irrigation actions, meeting the modern sustainable growth orientation.
Author Contributions
Conceptualization, D.L.; methodology, D.L., A.F., P.L. and G.K.; software, D.L.; prototyping, D.L.; validation, D.L., A.F., P.L. and G.K.; formal analysis, D.L., A.F., P.L., L.M. and G.K.; investigation, D.L.; data curation D.L. and A.F.; writing—original draft preparation, D.L., A.F. and P.L.; writing—review and editing, D.L., P.L., L.M., G.K. and K.G.A.; visualization, D.L., A.F. and P.L.; supervision, K.G.A; project administration, D.L. and G.K. All authors have read and agreed to the published version of the manuscript.
Funding
This research received no external funding.
Data Availability Statement
The data presented in this study are available upon request from the corresponding author.
Conflicts of Interest
The authors declare no conflicts of interest.
References
- FAO. The State of the World’s Land and Water Resources for Food and Agriculture: Managing Systems at Risk; FAO: Rome, Italy, 2018.
- Department of Economic. (2024). World Population Prospects 2024: Summary of Results. Stylus Publishing, LLC.
- Godfray, H. C. J. The debate over sustainable intensification. Food security, 2015, 7(2), 199-208.
- Boretti, A.; Rosa, L. Reassessing the projections of the world water development report. NPJ Clean Water, 2019, 2(1), 15.
- De Fraiture, C.; Wichelns, D. Satisfying future water demands for agriculture. Agricultural water management, 2010, 97(4), 502-511.
- Islam, S. M. F., & Karim, Z. (2019). World’s demand for food and water: The consequences of climate change. In Desalination-challenges and opportunities. IntechOpen.
- McKenzie, F. C.; Williams, J. Sustainable food production: constraints, challenges and choices by 2050. Food Security, 2015, 7(2), 221-233.
- Hubert, B.; Rosegrant, M.; Van Boekel, M. A.; Ortiz, R. The future of food: scenarios for 2050. Crop Science, 2010, 50, S-33.
- Wichelns, D.; Drechsel, P.; Qadir, M. Wastewater: economic asset in an urbanizing world. In Wastewater: Economic asset in an urbanizing world, 2015, pp. 3-14. Dordrecht: Springer Netherlands.
- Loucks, D. P. Managing water as a critical component of a changing world. Water Resources Management, 2017, 31(10), 2905-2916.
- Alamanos, A. Water resources planning under climate and economic changes in Skiathos island, Aegean. AQUA—Water Infrastructure, Ecosystems and Society, 2021, 70(7), 1085-1093.
- Makanda, K.; Nzama, S.; Kanyerere, T. Assessing the role of water resources protection practice for sustainable water resources management: A review. Water, 2022, 14(19), 3153.
- Kosolapova, N. A.; Matveeva, L. G.; Nikitaeva, A. Y.; Molapisi, L. The rational use of water resources in the strategy of industry 4.0. Water resources management, 2021, 35(9), 3023-3041.
- Kumar, P.; Choudhury, D. Innovative Technologies for Effective Water Resources Management. Water Crises and Sustainable Management in the Global South, 2024, 555-594.
- Farooq, M.S.; Riaz, S.; Abid, A.; Umer, T.; Zikria, Y.B. Role of IoT Technology in Agriculture: A Systematic Literature Review. Electronics 2020, 9, 319. [CrossRef]
- Gaitan, N.C.; Batinas, B.I.; Ursu, C.; Crainiciuc, F.N. Integrating Artificial Intelligence into an Automated Irrigation System. Sensors 2025, 25, 1199. [CrossRef]
- Abdelmoneim, A. A., Kimaita, H. N., Al Kalaany, C. M., Derardja, B., Dragonetti, G., & Khadra, R. (2025). IoT sensing for advanced irrigation management: A systematic review of trends, challenges, and future prospects. Sensors (Basel, Switzerland), 25(7), 2291.
- Ali, A.; Hussain, T.; Zahid, A. (2025). Smart irrigation technologies and prospects for enhancing water use efficiency for sustainable agriculture. AgriEngineering, 7(4), 106.
- Qian, M.; Qian, C.; Xu, G.; Tian, P.; Yu, W. Smart irrigation systems from cyber–physical perspective: State of art and future directions. Future Internet, 2024, 16(7), 234. [CrossRef]
- Sinobas, L.R.; Rodríguez, M.G.; Lee, T.S. A review of subsurface drip irrigation and its management. Water quality, soil and managing irrigation of crops, 2012, 171-194.
- Paris, P.; Di Matteo, G.; Tarchi, M.; Tosi, L.; Spaccino, L.; Lauteri, M. Precision subsurface drip irrigation increases yield while sustaining water-use efficiency in Mediterranean poplar bioenergy plantations. Forest Ecology and Management, 2018. 409, 749-756.
- Bush, A.; Elamin, A.M.; Ali, A.B.; Hong, L. Effect of different operating pressures on the hydraulic performance of drip irrigation system in Khartoum State conditions. J Environ Agric Sci, 2016, 6, 64-8.
- Rajak, P.; Ganguly, A.; Adhikary, S.; Bhattacharya, S. Internet of Things and smart sensors in agriculture: Scopes and challenges. Journal of Agriculture and Food Research, 2023, 14, 100776.
- Millán, S.; Montesinos, C.; Campillo, C. Evaluation of different commercial sensors for the development of their automatic irrigation system. Sensors, 2024, 24(23), 7468.
- Pereira, G.P.; Chaari, M.Z.; Daroge, F. IoT-enabled smart drip irrigation system using ESP32. IoT, 2023, 4(3), 221-243.
- Correa-Quiroz, J.J.; Toribio-Barrueto, M.A.; Castro-Vargas, C. IoT system with ESP32 for smart drip irrigation and climate monitoring in greenhouses. Emerg. Sci. J, 2025, 9(3), 1133-1157.
- Inayah, I.; Agustirandi, B.; Budiman, M.; Djamal, M.; Faizal, A. Experimental design: Implementation of IoT-based drip irrigation to enhance the productivity of Cilembu sweet potato (Ipomoea batatas) cultivation. Results in Engineering, 2025, 25, 103600.
- Rajasekaran, C.; Gokul, L.; Gowsalya, D.; Manimaran, R. Lora based smart irrigation system. International journal of health sciences, 2022, 6(S5), 5996-6010.
- Pius Agbulu, G.; Joselin Retna Kumar, G. (2024). A LoRa-based internet of things smart irrigation control solution with hybrid classifier CNN-SVM. Wireless Personal Communications, 137(1), 523-539.
- Ercan Oğuztürk, G.; Murat, C.; Yurtseven, M.; Oğuztürk, T. The Effects of AI-Supported Autonomous Irrigation Systems on Water Efficiency and Plant Quality: A Case Study of Geranium psilostemon Ledeb. Plants 2025, 14, 770. [CrossRef]
- Loukatos, D.; Fragkos, A.; Kargas, G.; Arvanitis, K.G. Implementation and Evaluation of a Low-Cost Measurement Platform over LoRa and Applicability for Soil Monitoring. Future Internet 2024, 16, 443. [CrossRef]
- Miller, T.; Mikiciuk, G.; Durlik, I.; Mikiciuk, M.; Łobodzińska, A.; Śnieg, M. The IoT and AI in Agriculture: The Time Is Now—A Systematic Review of Smart Sensing Technologies. Sensors 2025, 25, 3583. [CrossRef]
- Amanatidis, P.; Lyratzis, E.; Angelopoulos, V.; Kouloumpris, E.; Skaperdas, E.; Bassiliades, N.; Vlahavas, I.; Maris, F.; Emmanouloudis, D.; Karampatzakis, D. Intelligent Water Management Through Edge-Enabled IoT, AI, and Big Data Technologies. IoT 2026, 7, 5. [CrossRef]
- TEROS 12 METER instrument description, 2025. Available online: https://www.labcell.com/media/140632/teros12%20manual.pdf (accessed on 10 December 2025).
- TEROS 10 METER instrument description, 2025. Available online: https://www.misure.net/sites/default/files/pdf/20788_TEROS10_Manual_Web.pdf (accessed on 10 December 2025).
- Fragkos, A.; Loukatos, D.; Kargas, G.; Arvanitis, K. G. Performance Evaluation of TEROS 10 Sensor in Diverse Substrates and Soils of Different Electrical Conductivity Using Low-Cost Microcontroller Settings. Land, 2025, 14(2), 242.
- Cominelli, S.; Rivera, L.D.; Brown, W.G.; Ochsner, T.E.; Patrignani, A. Calibration of TEROS 10 and TEROS 12 electromagnetic soil moisture sensors. Soil Sci. Soc. Am. J. 2024, 88, 2104–2122. [CrossRef]
- Remote.It. Instant, Secure, and Code-Based Networking Solutions for Seamless Network Connectivity. Available online: https://www.remote.it/ (accessed on 10 December 2025).
- App Inventor. The MIT App Inventor Programming Environment. 2025. Available online: http://appinventor.mit.edu/explore/ (accessed on 10 December 2025).
- Głowacki, M.; Mazurkiewicz, A.; Słomion, M.; Skórczewska, K. Resistance of 3D-Printed Components, Test Specimens and Products to Work under Environmental Conditions—Review. Materials 2022, 15, 6162. [CrossRef]
- Loukatos, D.; Sarakis, L.; Kontovasilis, K.; Skianis, C.; Kormentzas, G. Tools and Practices for Measurement-Based Network Performance Evaluation. In Proceedings of the 2007 IEEE 18th International Symposium on Personal, Indoor and Mobile Radio Communications, Athens, Greece, 3–7 September 2007; IEEE: New York, NY, USA, 2007; pp. 1–5. [CrossRef]
Figure 1.
Detailed deployment plan of the irrigation event emulation and monitoring equipment in the agricultural field.
Figure 1.
Detailed deployment plan of the irrigation event emulation and monitoring equipment in the agricultural field.
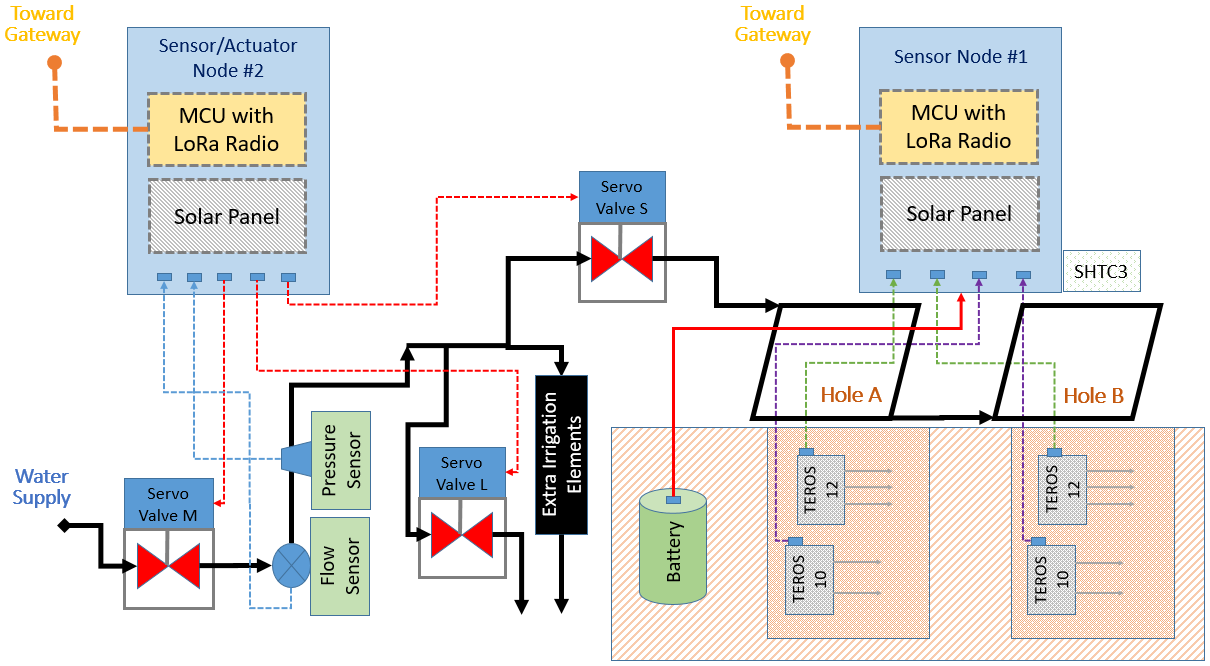
Figure 2.
The overall network infrastructure to support the irrigation event emulation and monitoring process.
Figure 2.
The overall network infrastructure to support the irrigation event emulation and monitoring process.
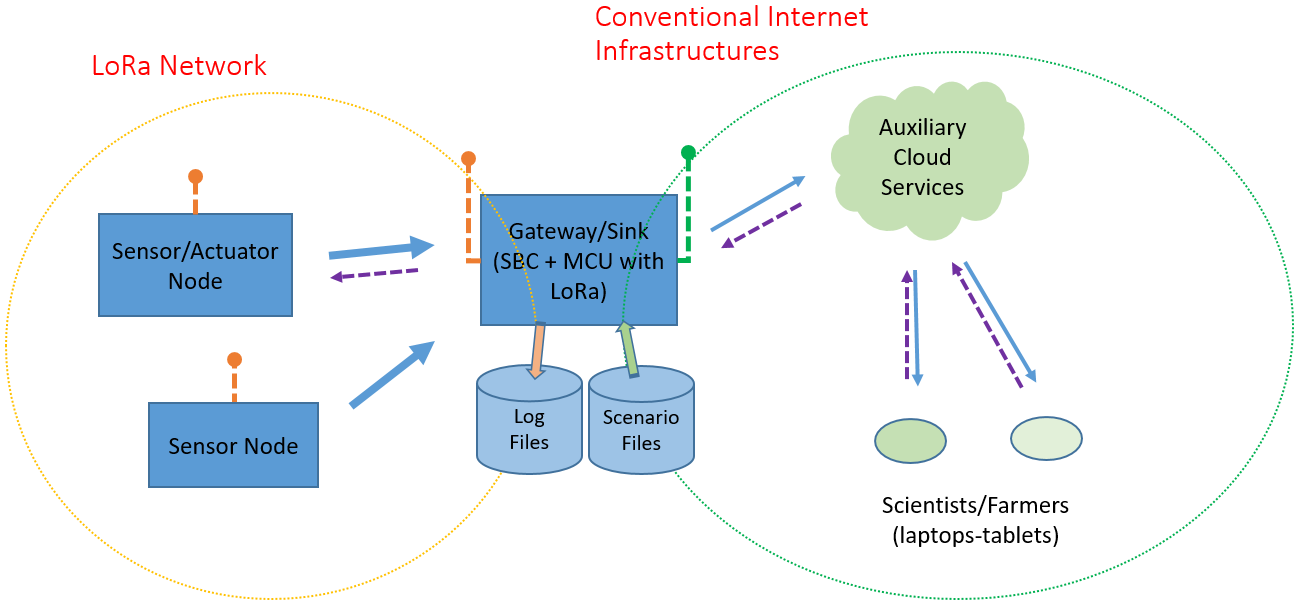
Figure 3.
Installing sensing equipment inside the irrigation holes: (a) placing a TEROS 10 instrument at 16 cm below ground level; (b) placing a TEROS 12 instrument at 8 cm below ground level; (c) filling the dugout completely with soil and compacting it.
Figure 3.
Installing sensing equipment inside the irrigation holes: (a) placing a TEROS 10 instrument at 16 cm below ground level; (b) placing a TEROS 12 instrument at 8 cm below ground level; (c) filling the dugout completely with soil and compacting it.
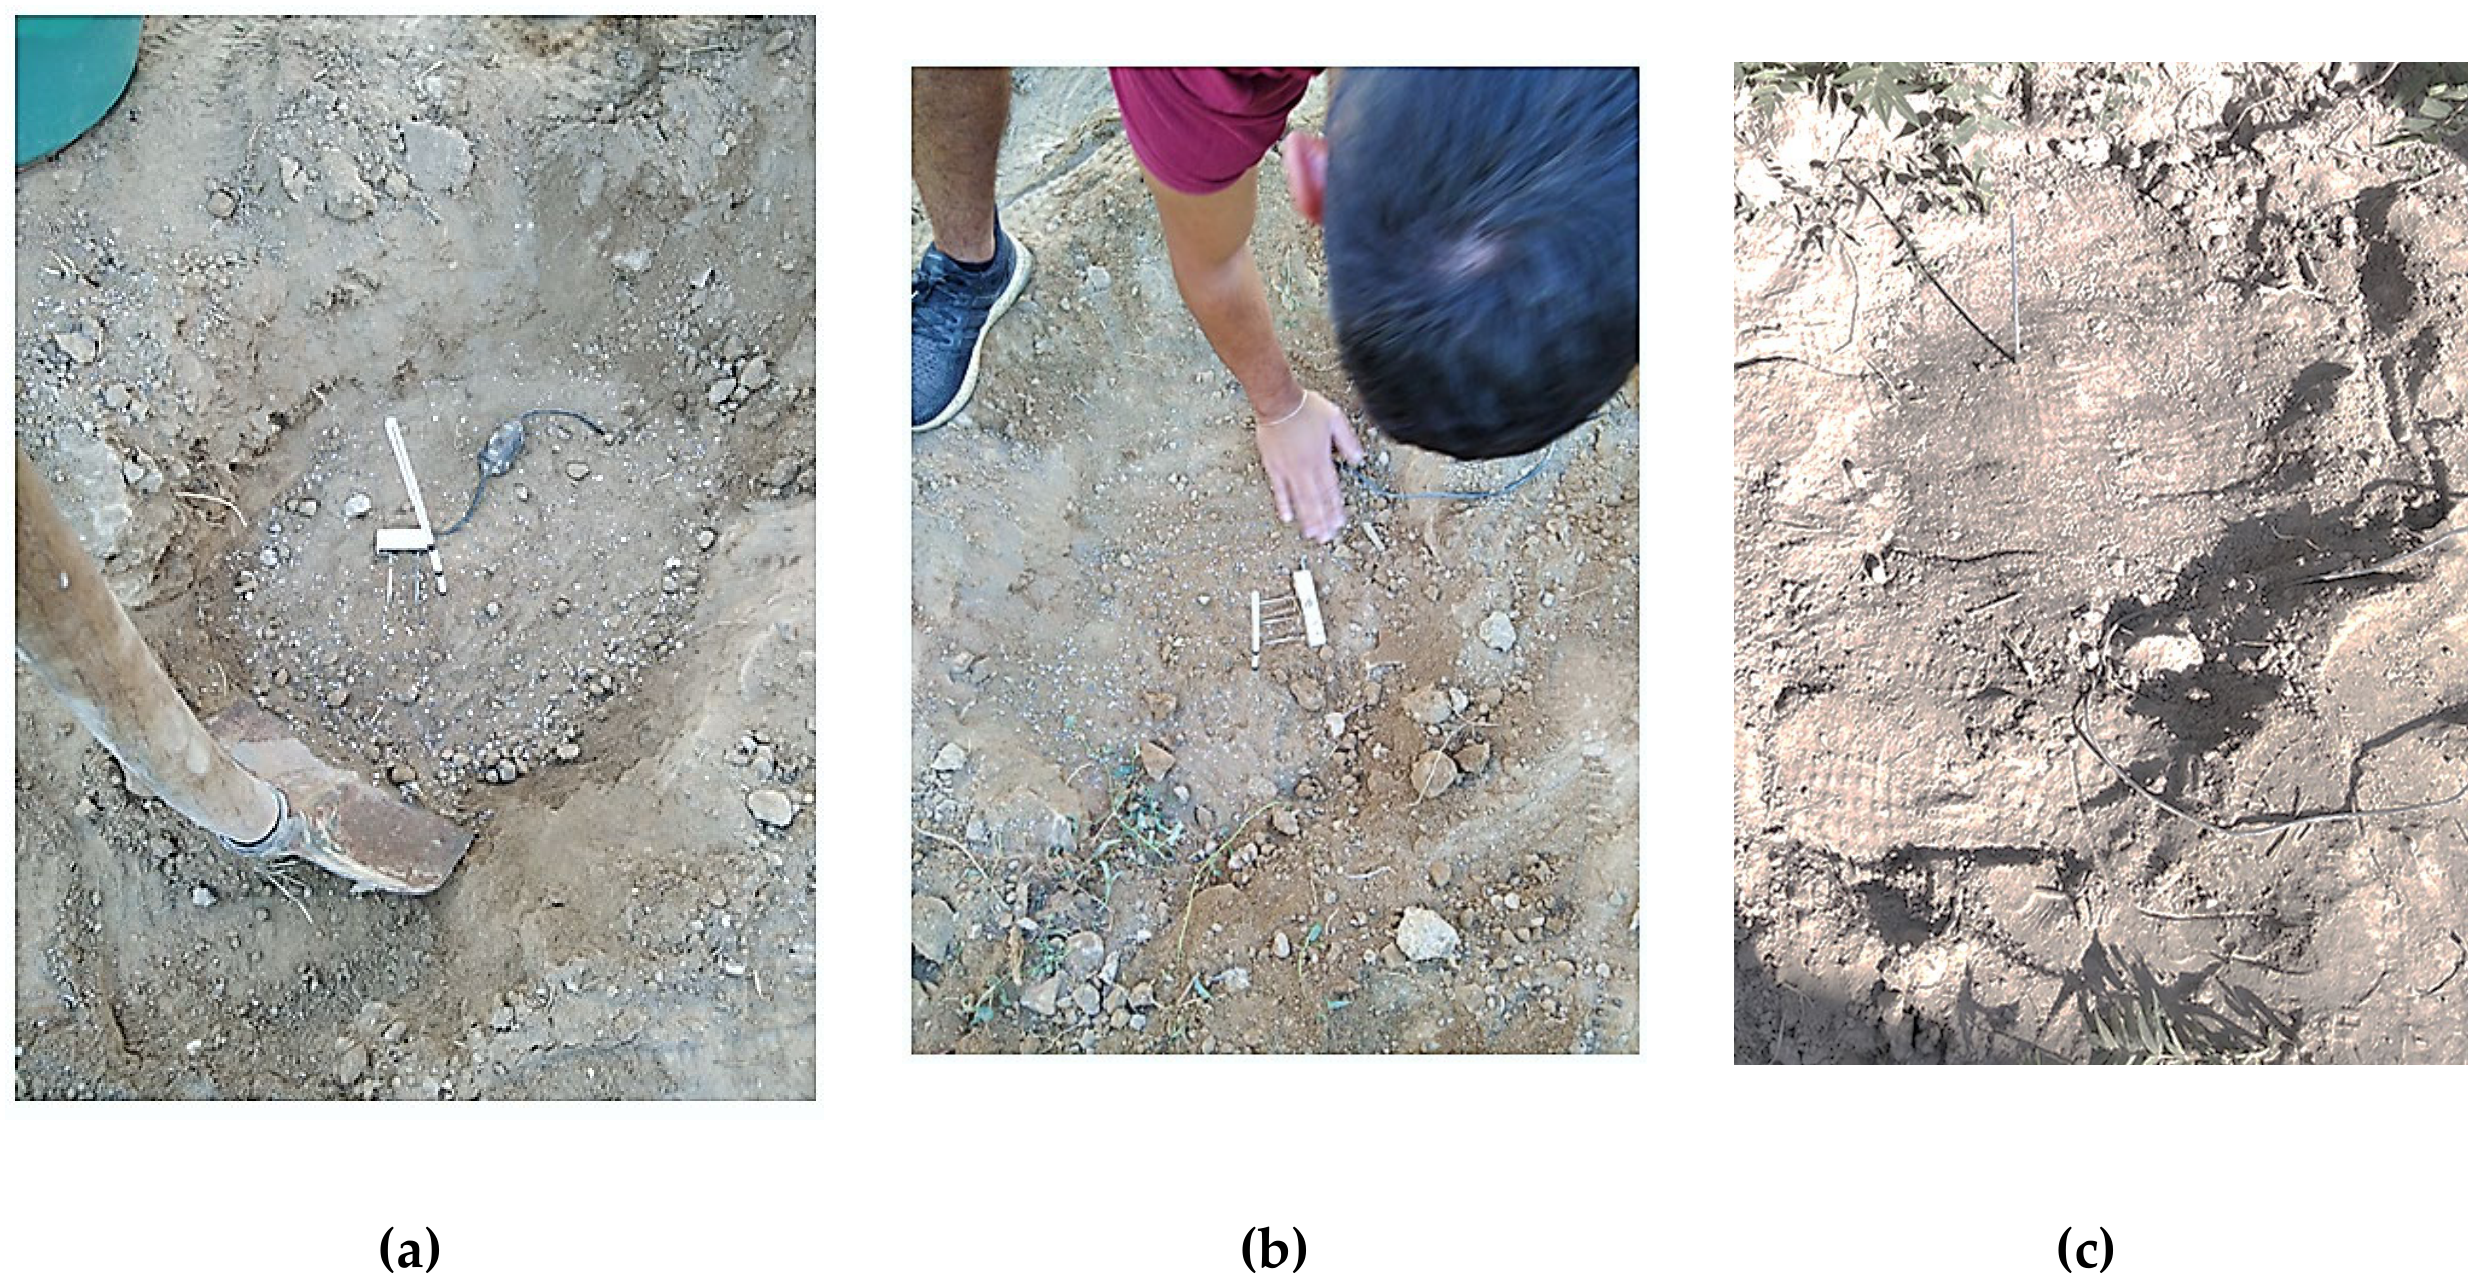
Figure 4.
Actual deployment of the irrigation event emulation equipment in the agricultural field: (a) node intercepting the total water flow and pressure and controlling the three irrigation valves (with its front protection cover intentionally open); (b) irrigation junction separating the irrigation emitters in different groups and the valve emulating emitter stenosis per holes A and B; (c) irrigation pipes per holes A and B and the corresponding soil monitoring equipment.
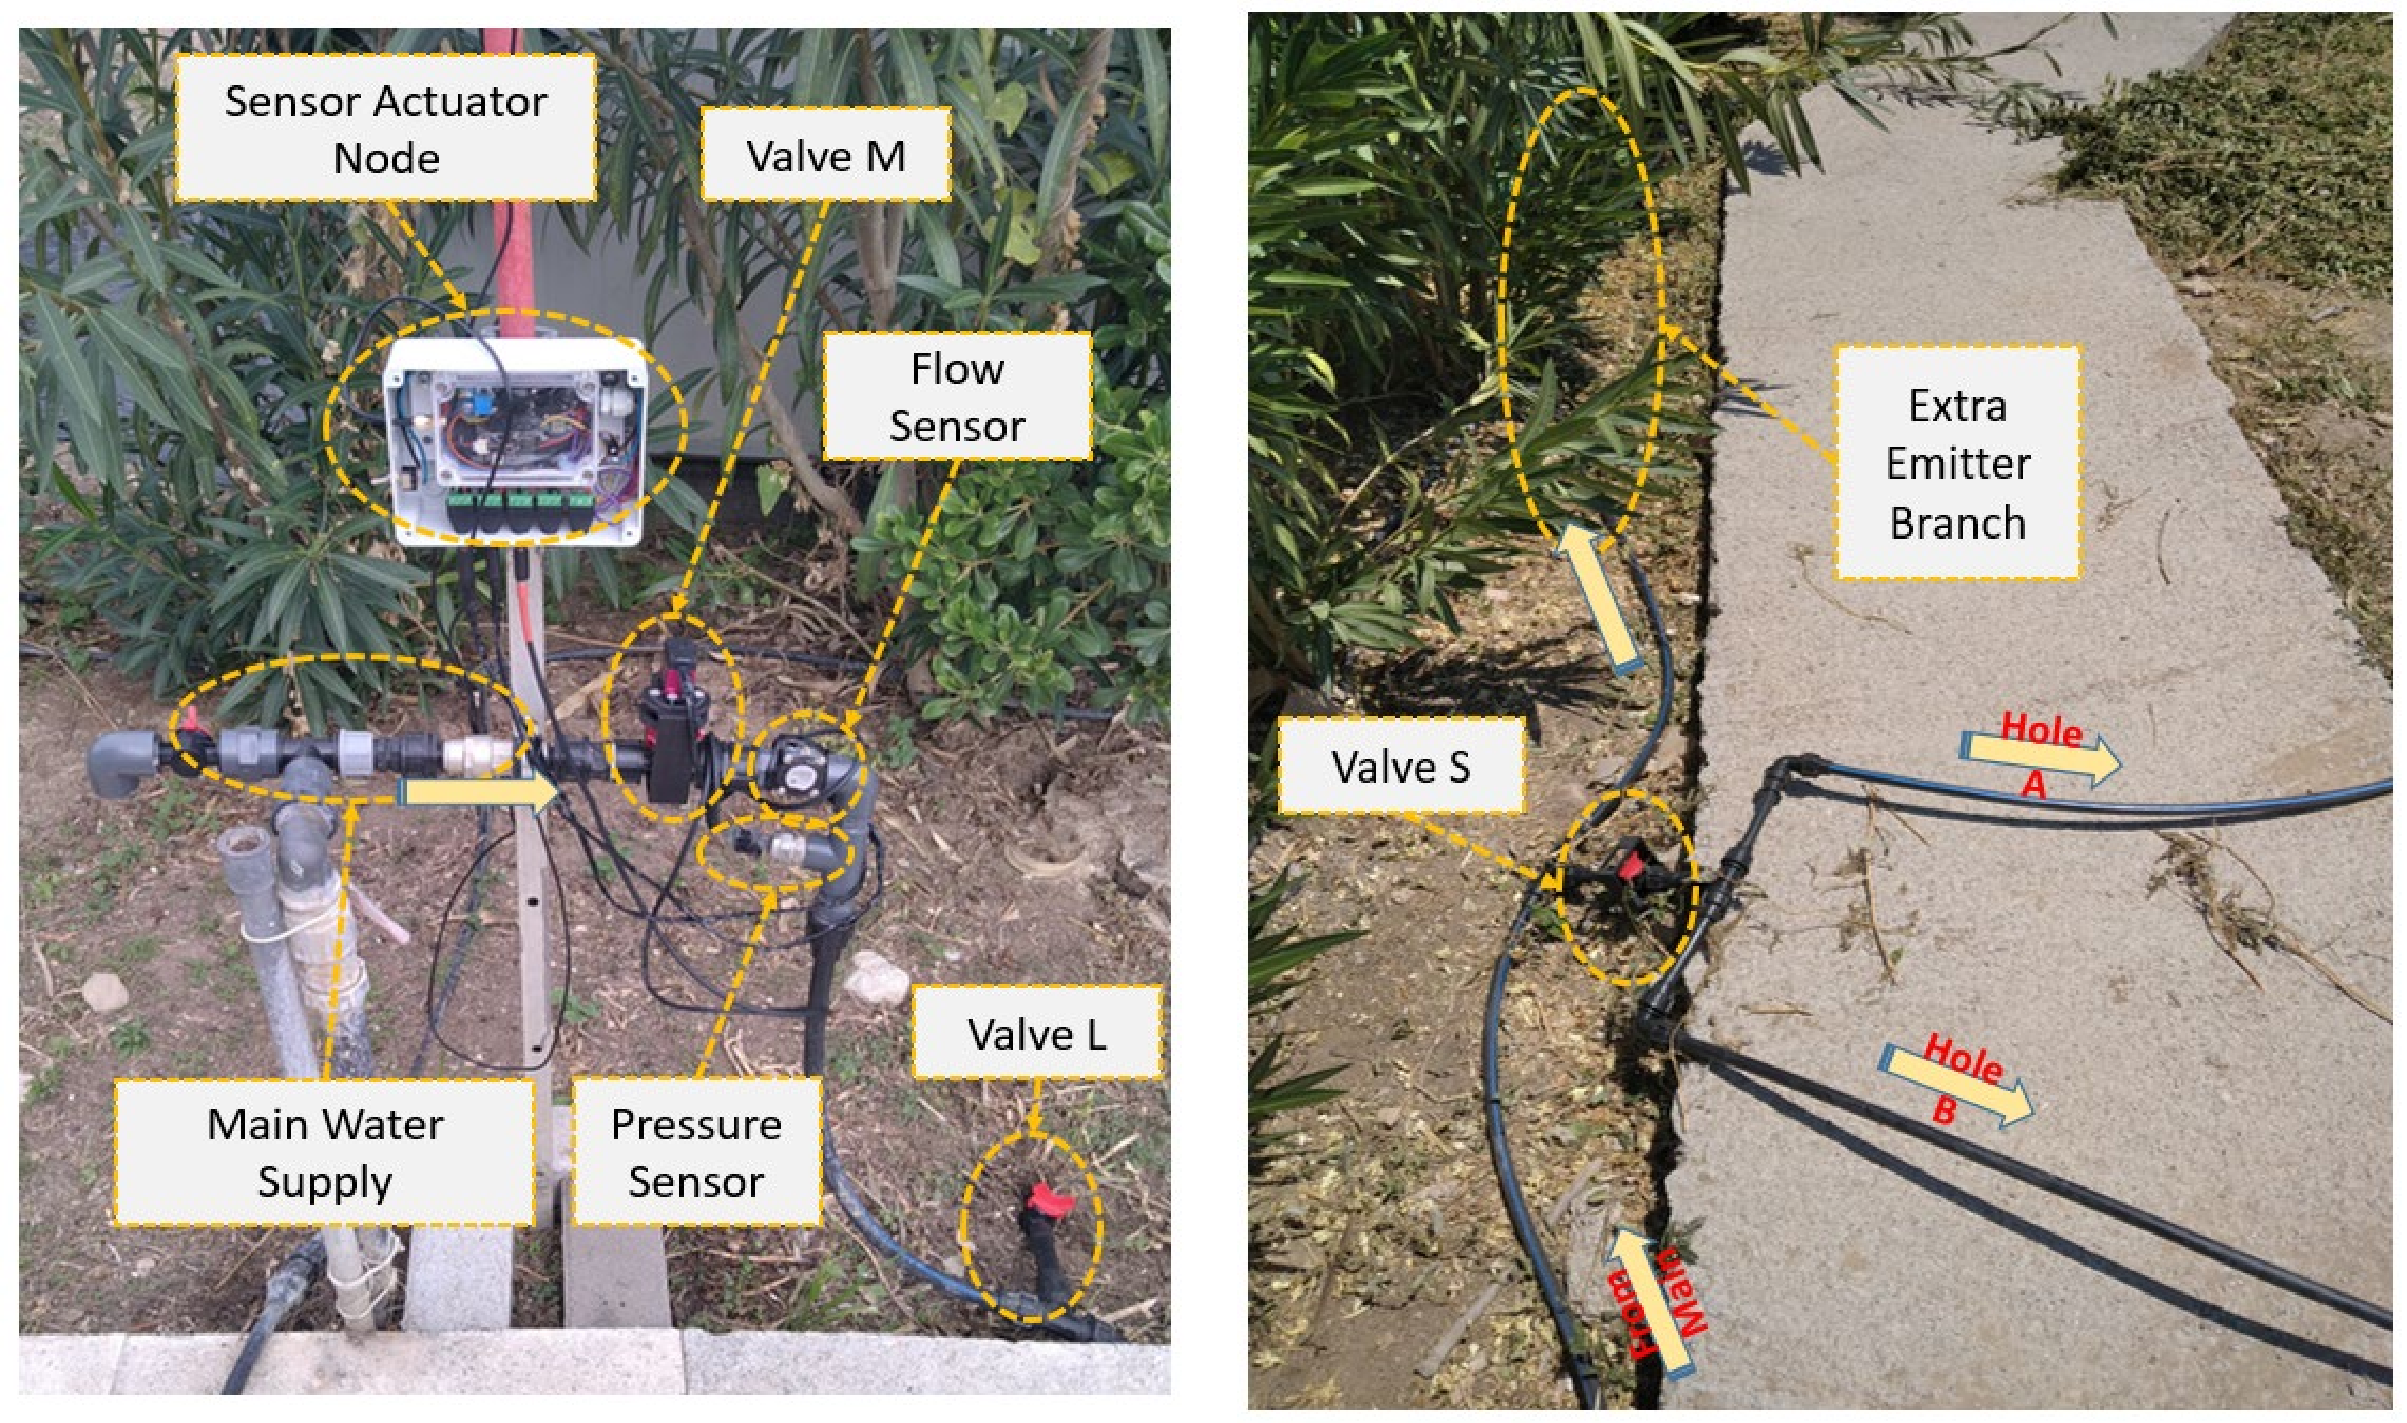
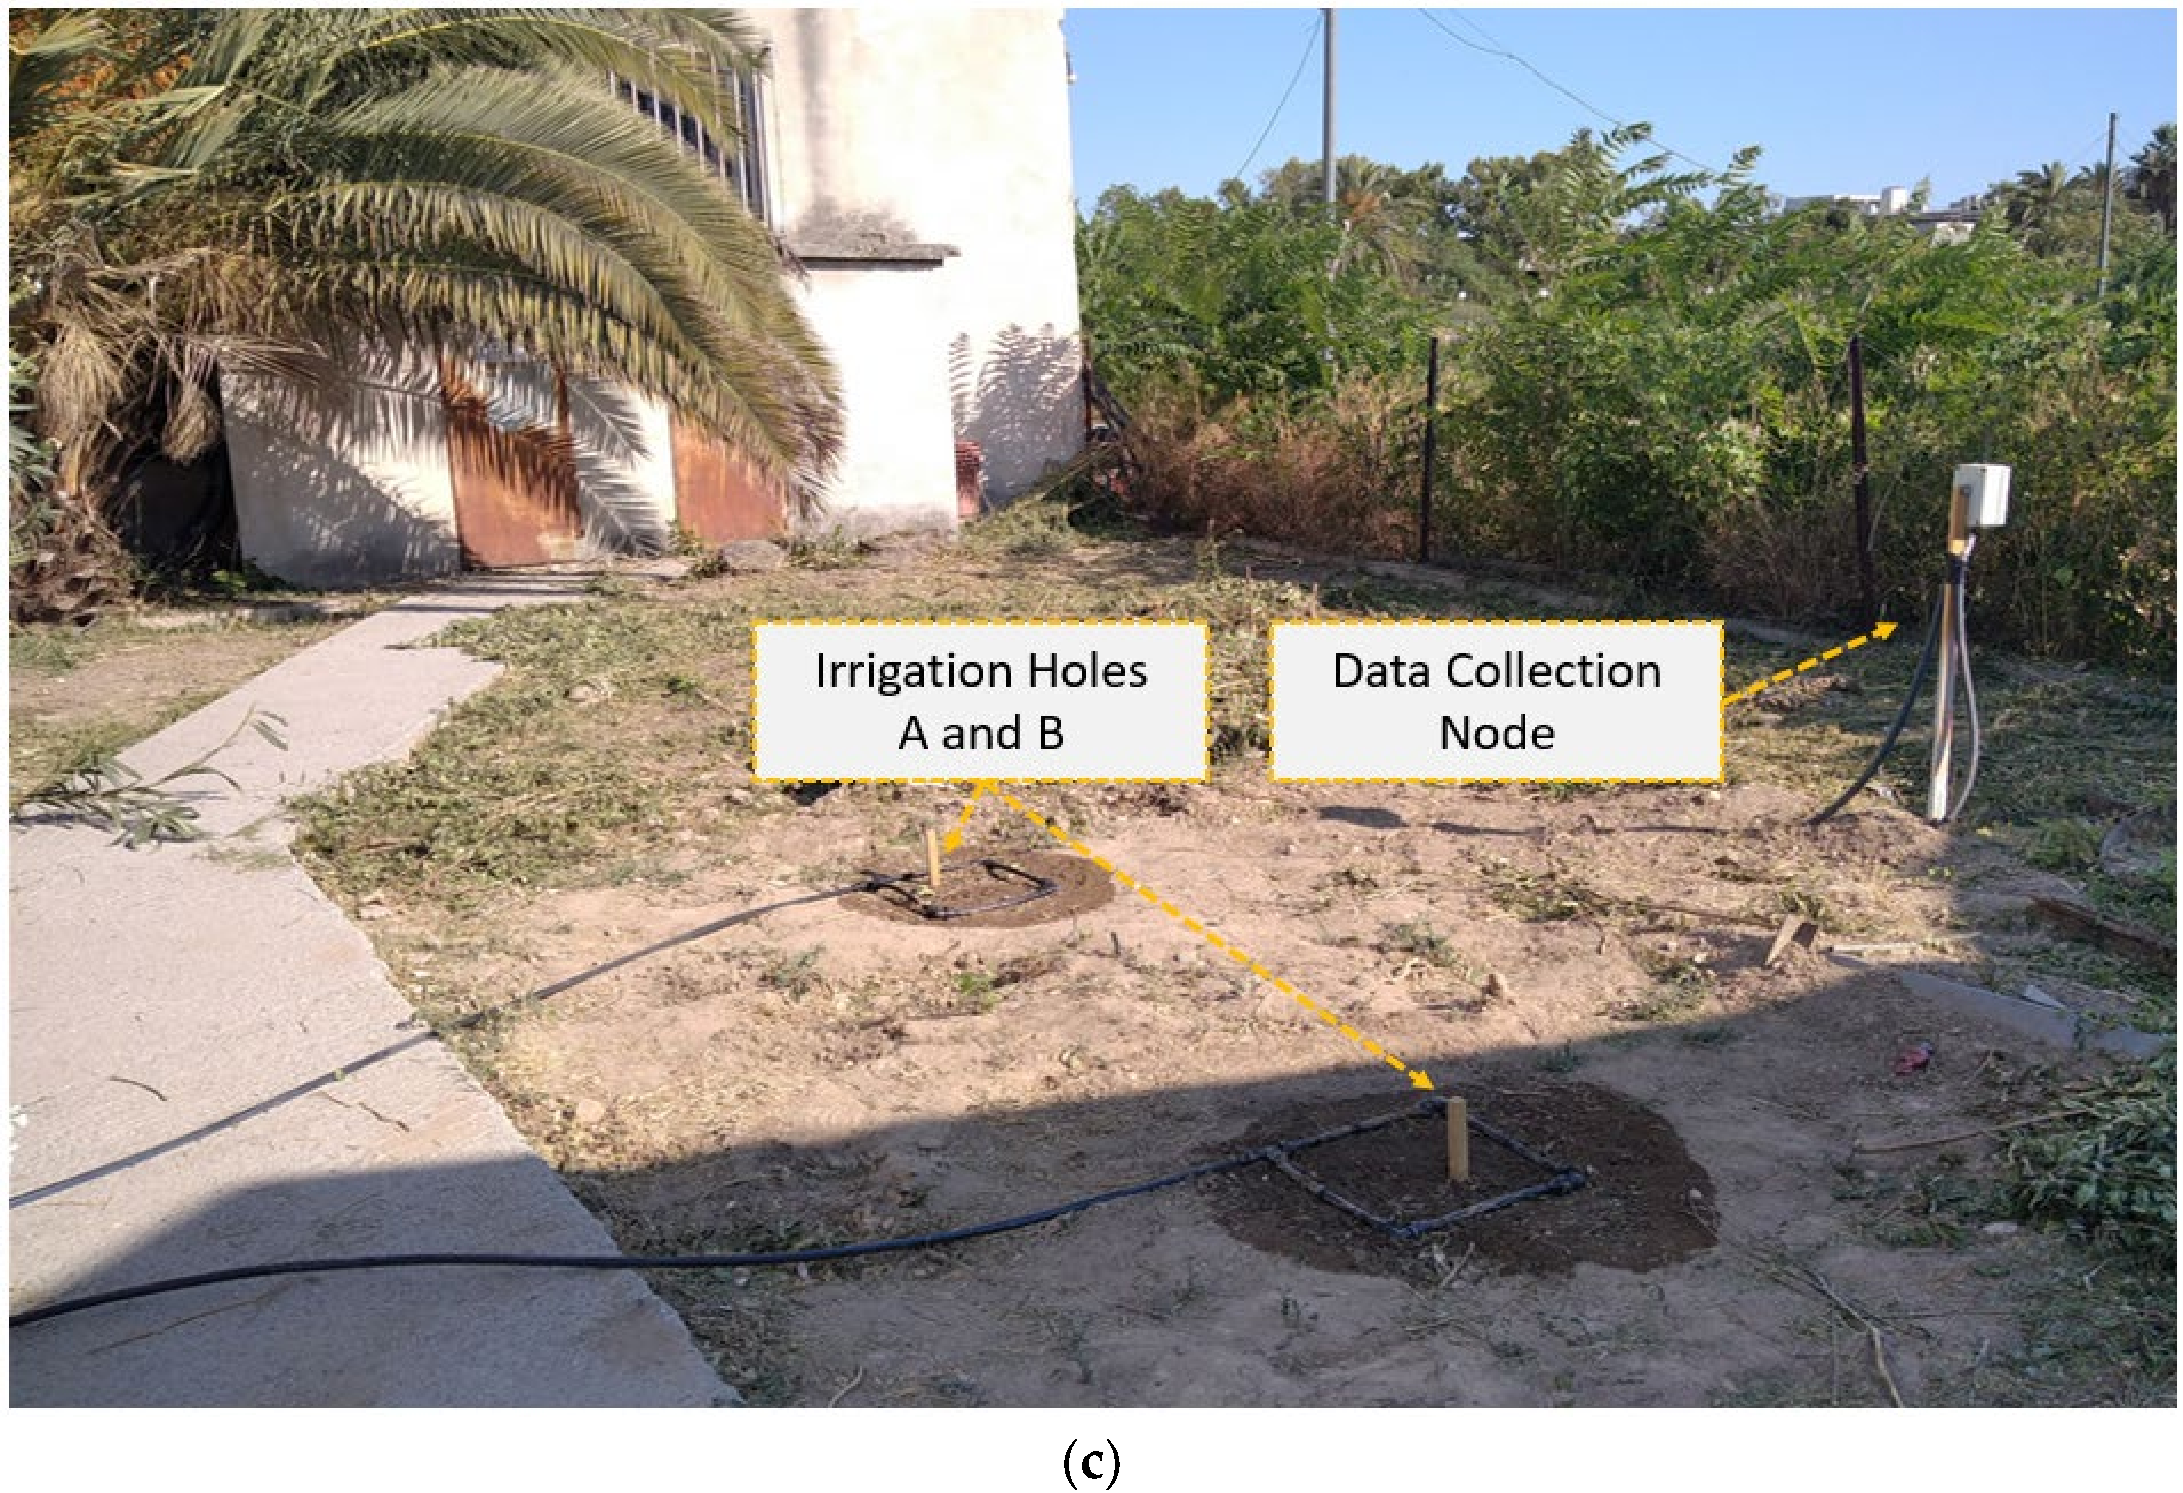
Figure 5.
The initial 3D printed attachment to a typical plastic valve to convert it to a servo-assisted unit: (a) 3D design; (b) 3D printed implementation with PLA and a direct link between the servo and the valve axes.
Figure 5.
The initial 3D printed attachment to a typical plastic valve to convert it to a servo-assisted unit: (a) 3D design; (b) 3D printed implementation with PLA and a direct link between the servo and the valve axes.
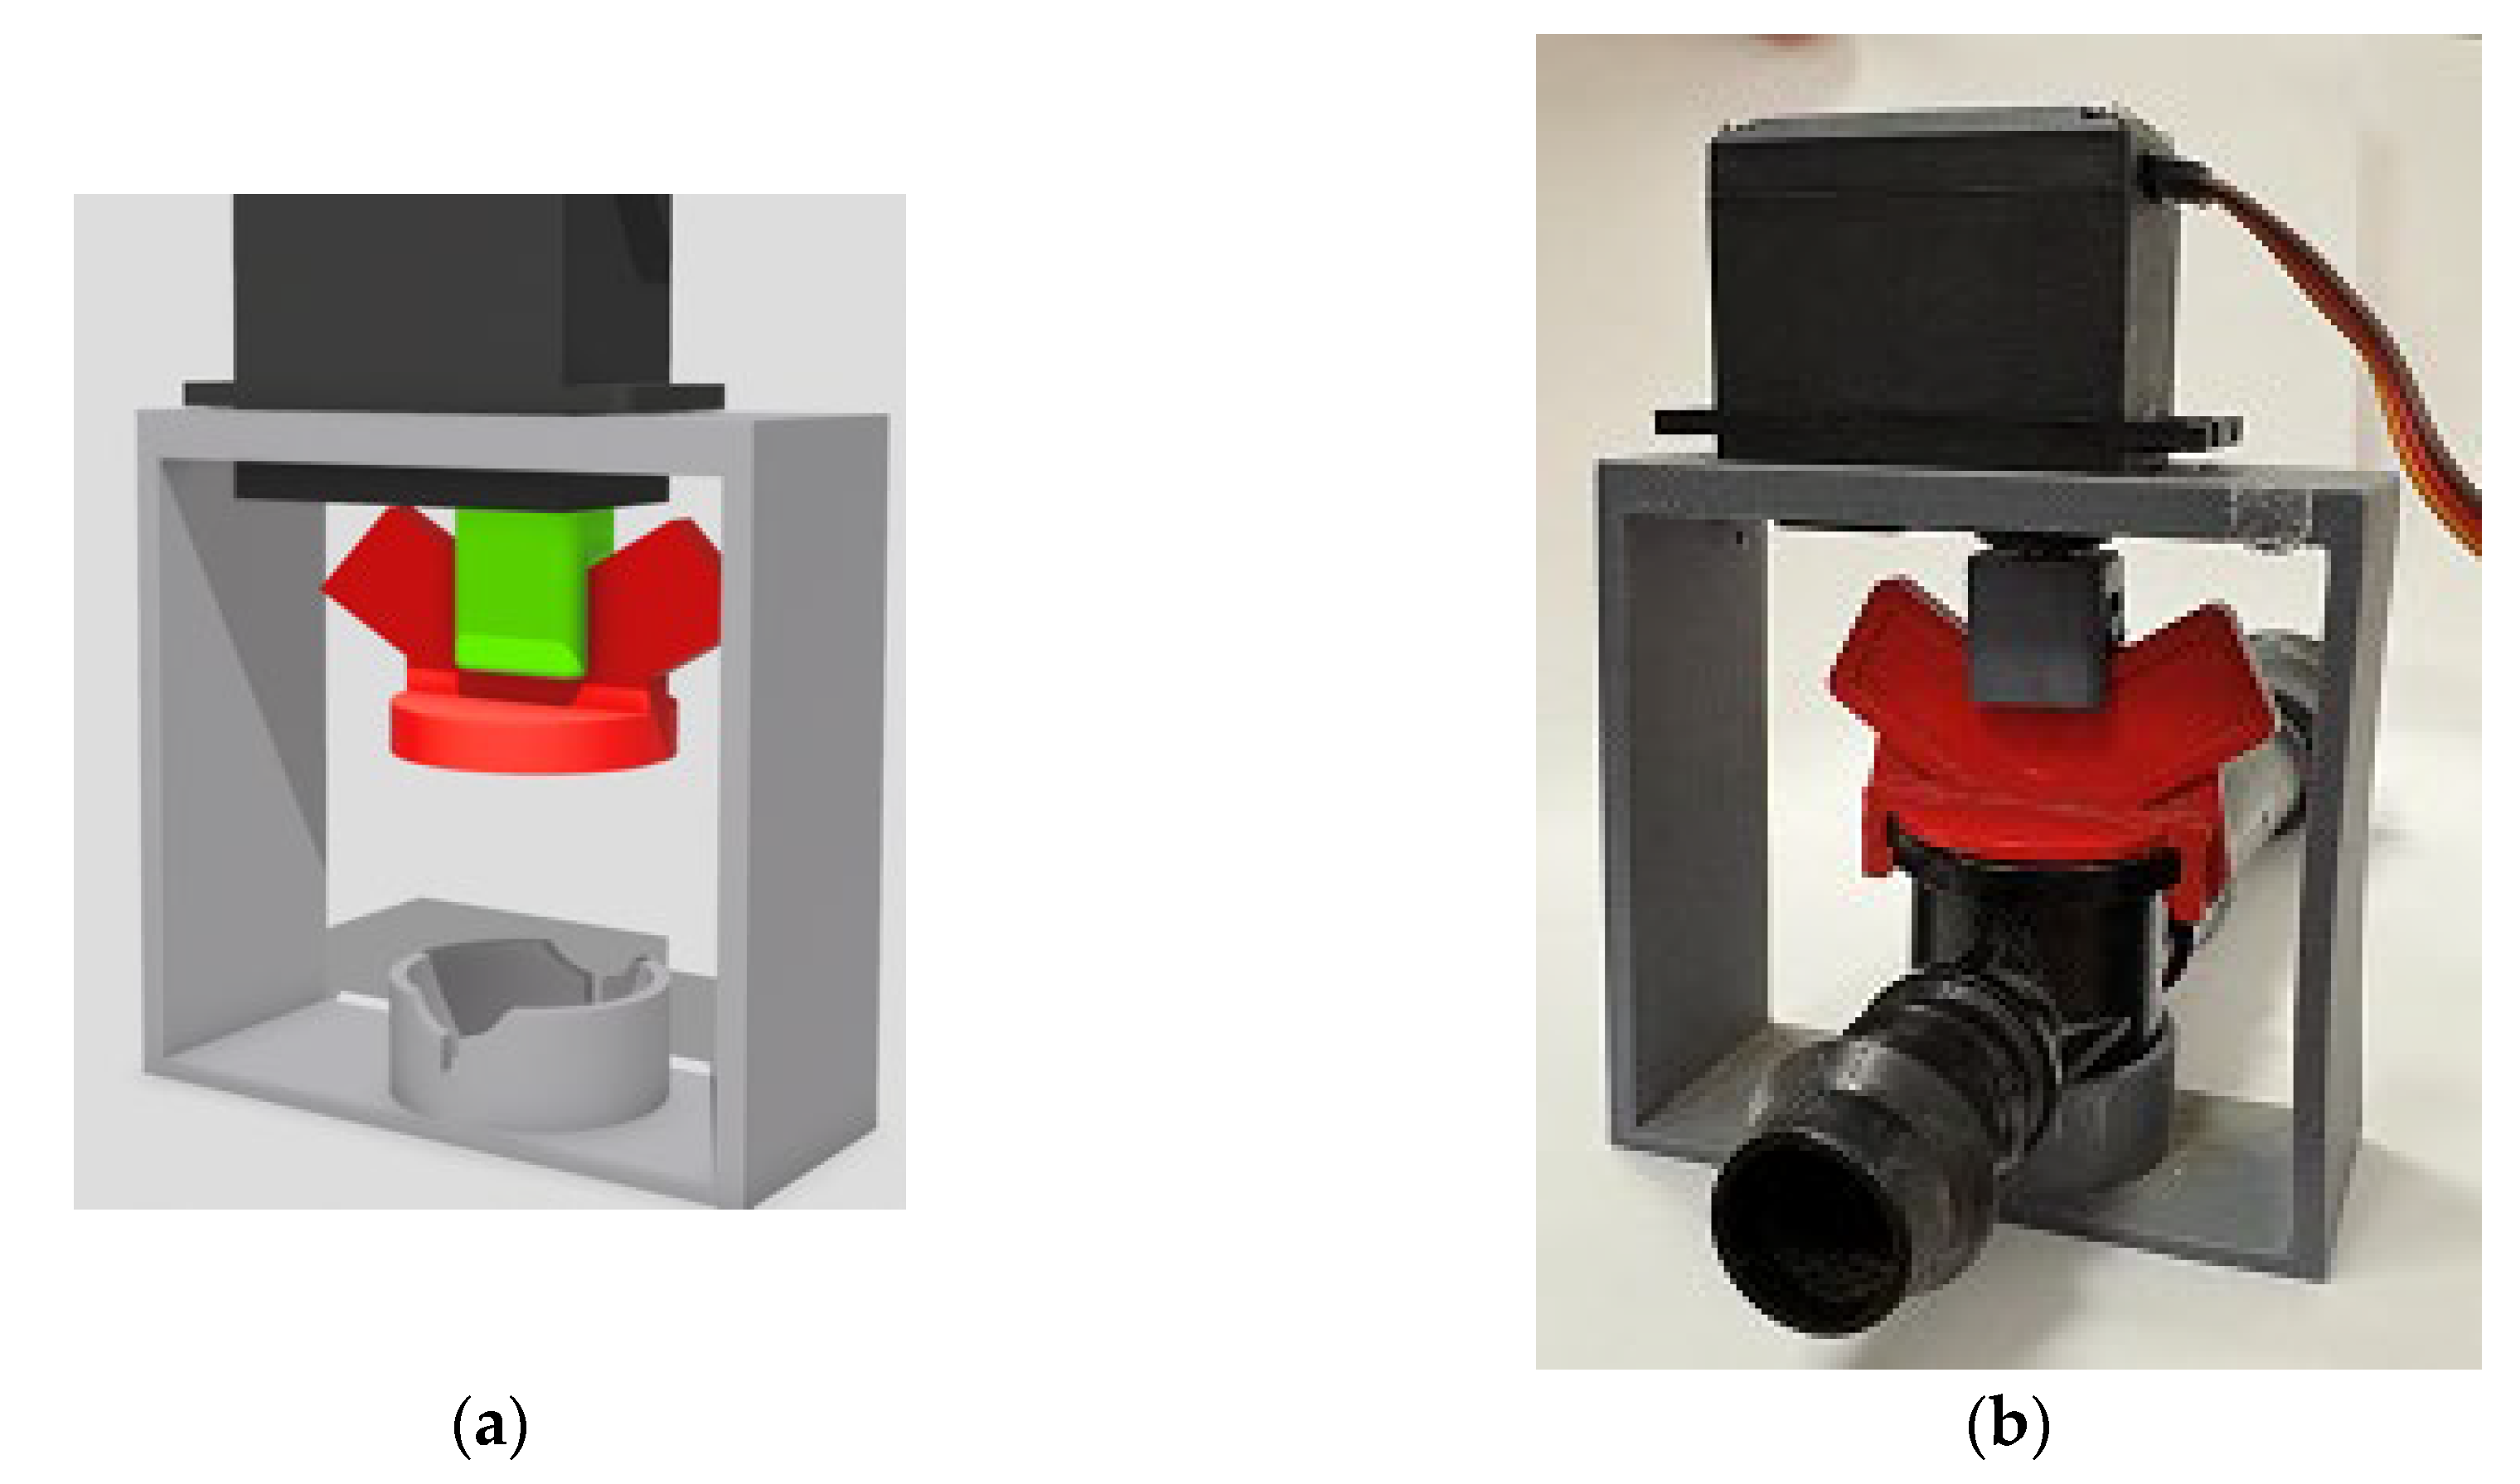
Figure 6.
The gateway utilized by the proposed platform: (a) details of the components comprising the node; (b) final installation position inside the farm systems laboratory of our university.
Figure 6.
The gateway utilized by the proposed platform: (a) details of the components comprising the node; (b) final installation position inside the farm systems laboratory of our university.
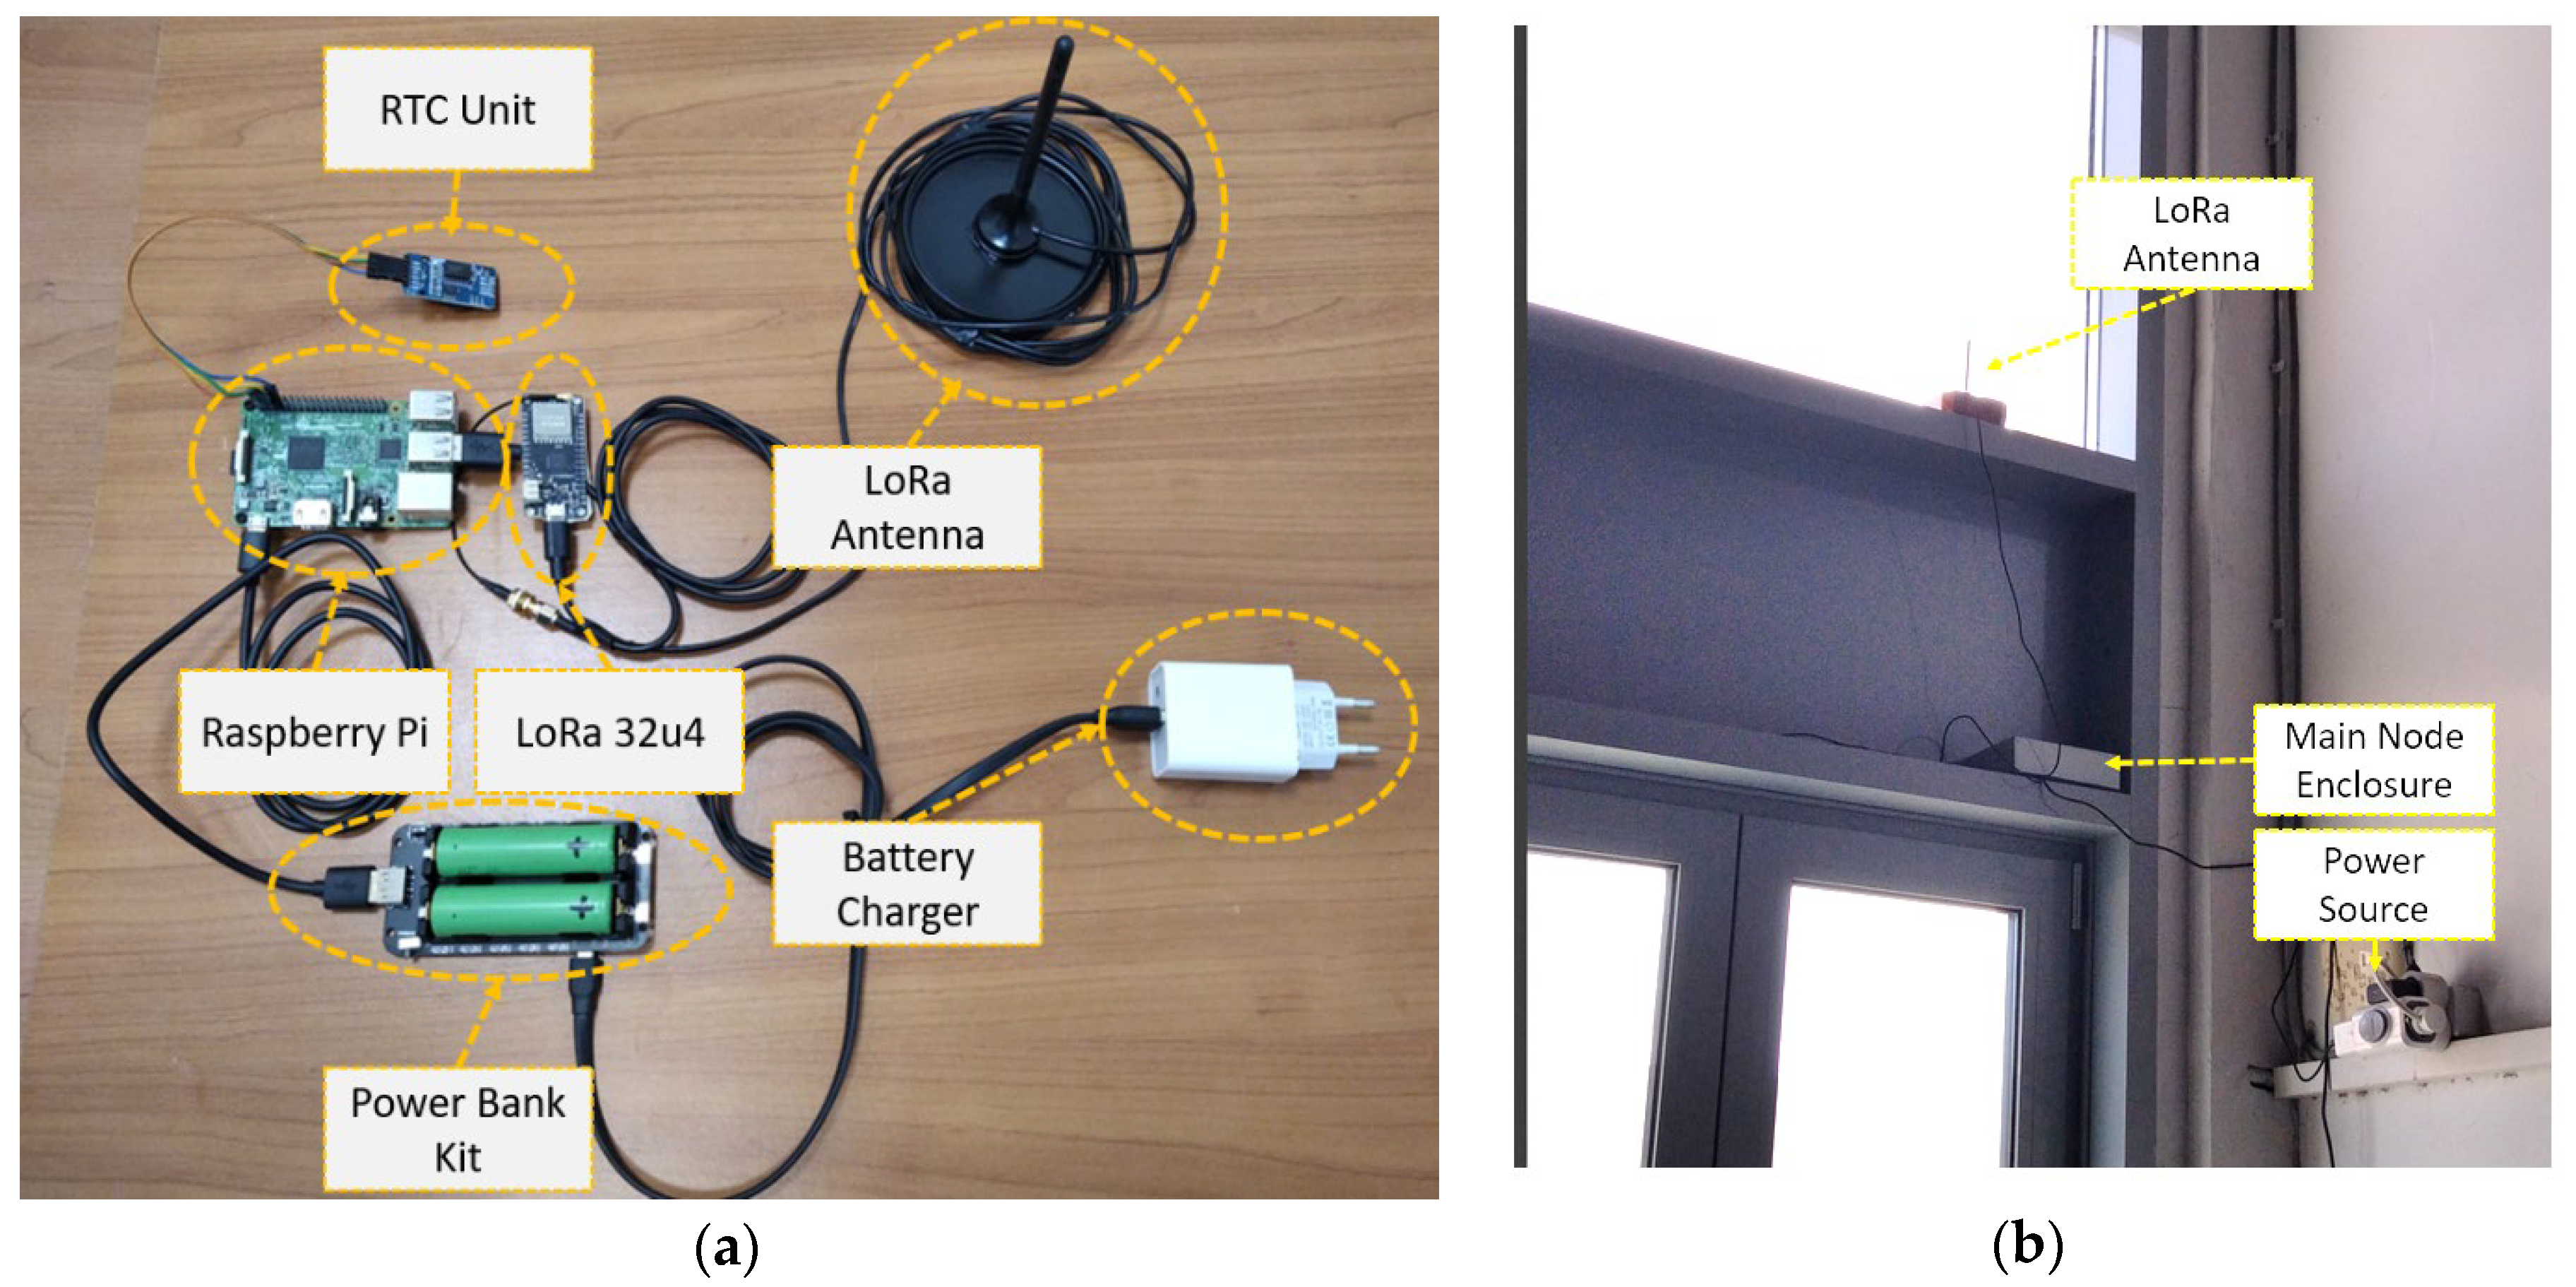
Figure 7.
The effects of real-time monitoring of flow and pressure inside the water pipes: (a) capturing the high-pressure shockwave following a sudden (manual) open of the main supply valve (pressure – red curve, sensor voltage – blue curve); (b) aggregate flow measurement variation inside the drip irrigation system as a function of the incoming water pressure inside the piping.
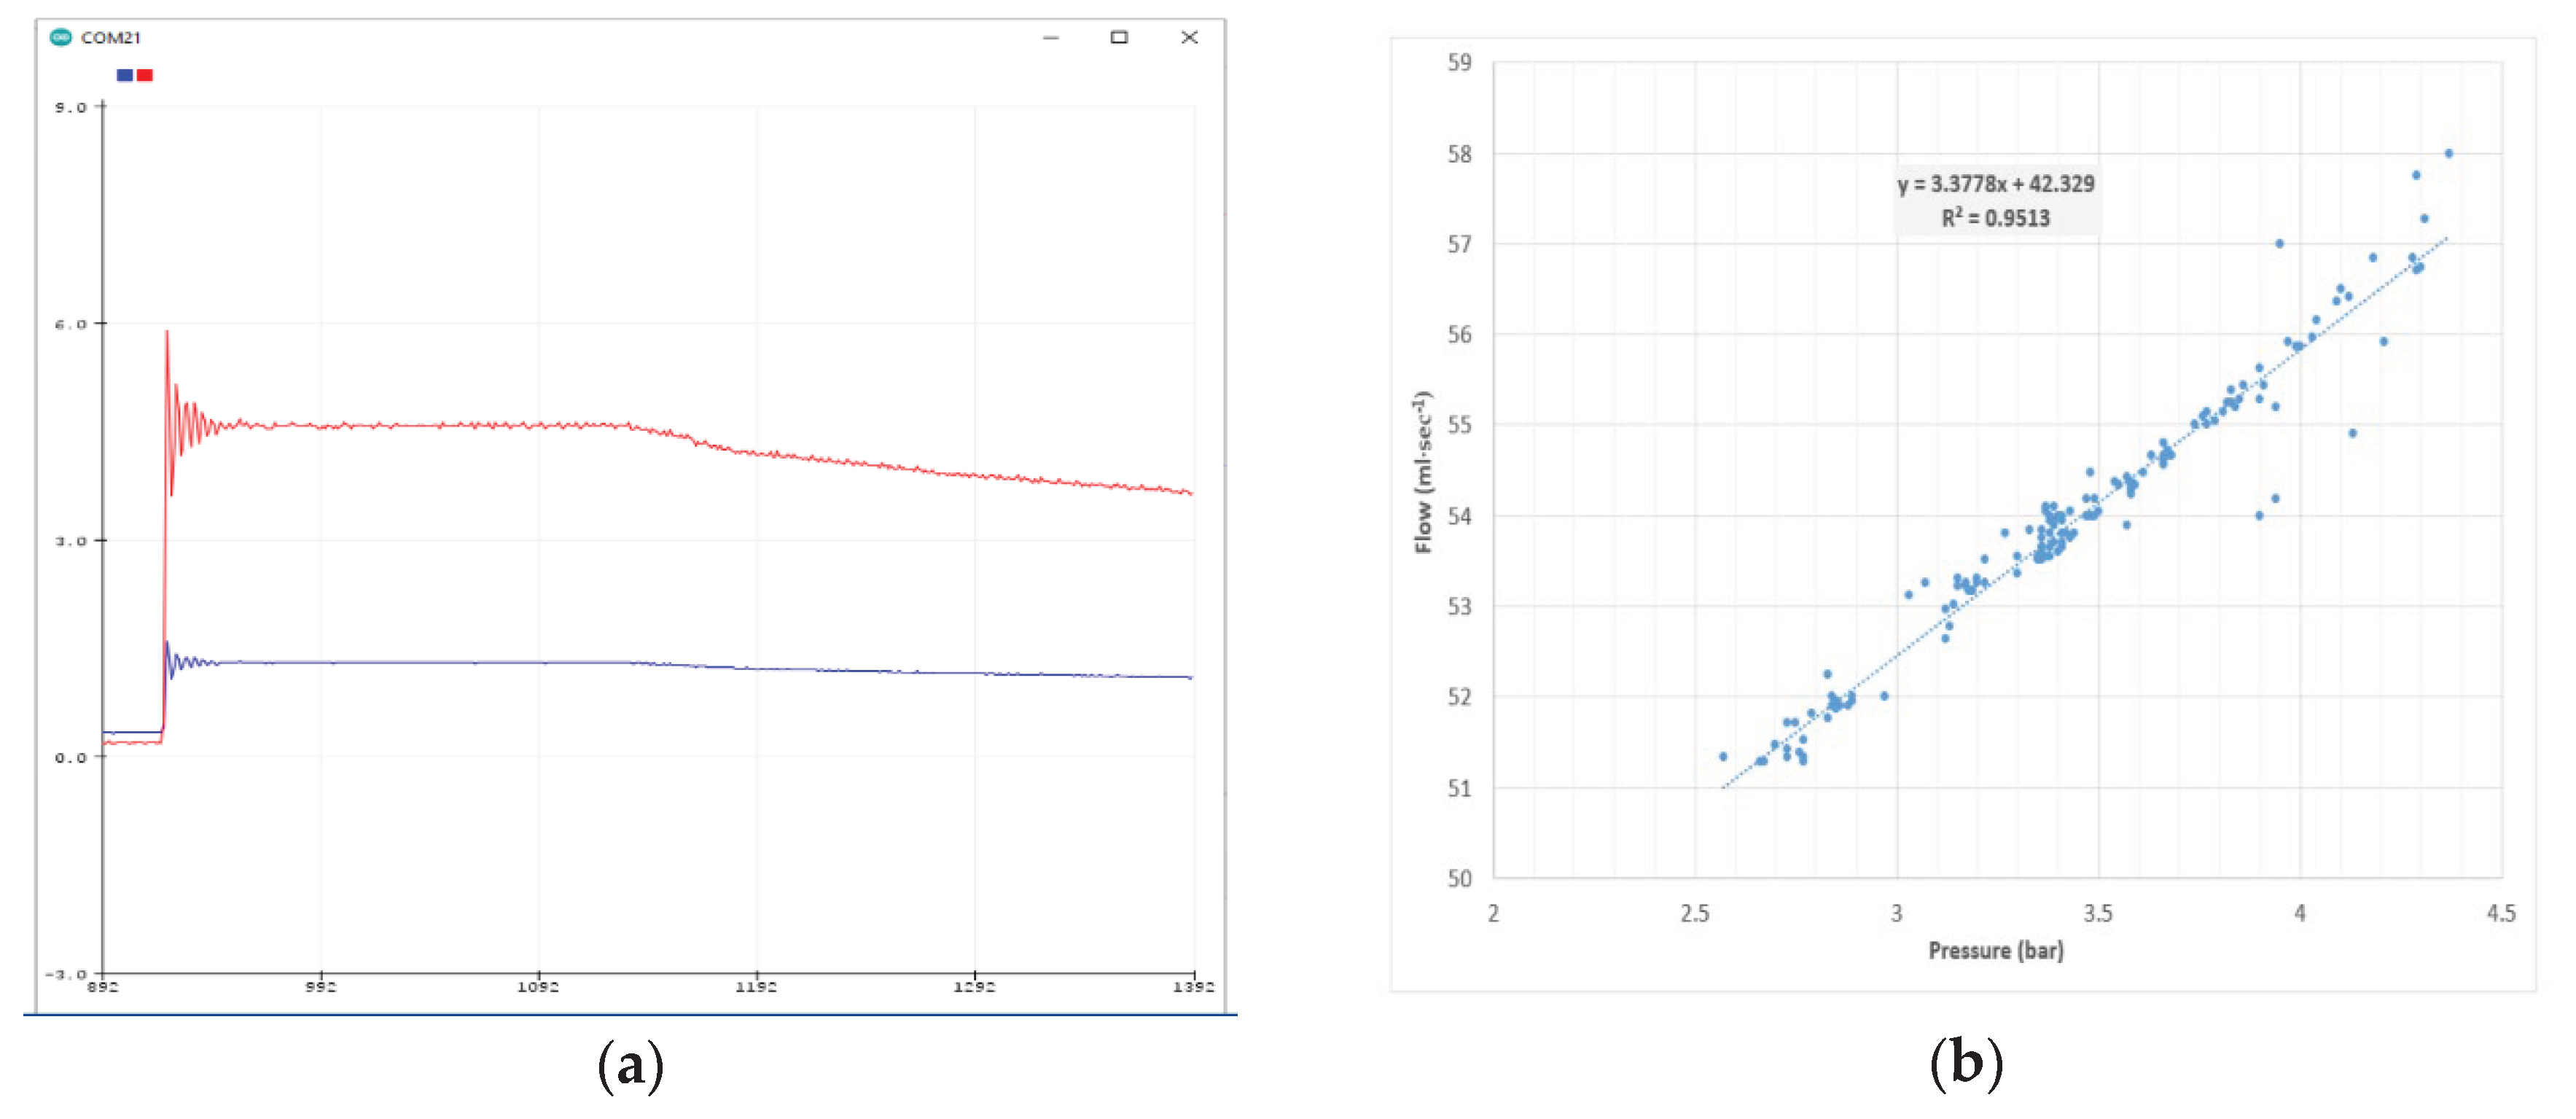
Figure 8.
Time evolution of simultaneous irrigation events at experimental installations (dugouts) A and B, based on the readings of TEROS 12 and TEROS 10 installed at depths of 8 and 16 cm.
Figure 8.
Time evolution of simultaneous irrigation events at experimental installations (dugouts) A and B, based on the readings of TEROS 12 and TEROS 10 installed at depths of 8 and 16 cm.
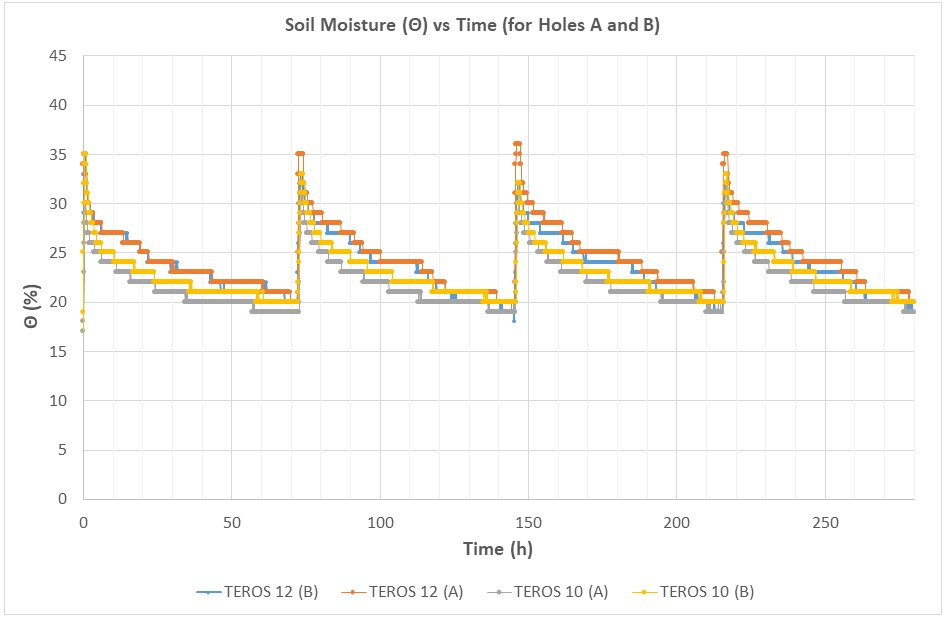
Figure 9.
Time evolution of total flow and pressure quantities during an actual (over)irrigation event at experimental installations (dugouts) A and B, based on the readings of the second sensor/actuator node. The 4/32 amount of this water flow was directed to the soil of each dugout.
Figure 9.
Time evolution of total flow and pressure quantities during an actual (over)irrigation event at experimental installations (dugouts) A and B, based on the readings of the second sensor/actuator node. The 4/32 amount of this water flow was directed to the soil of each dugout.
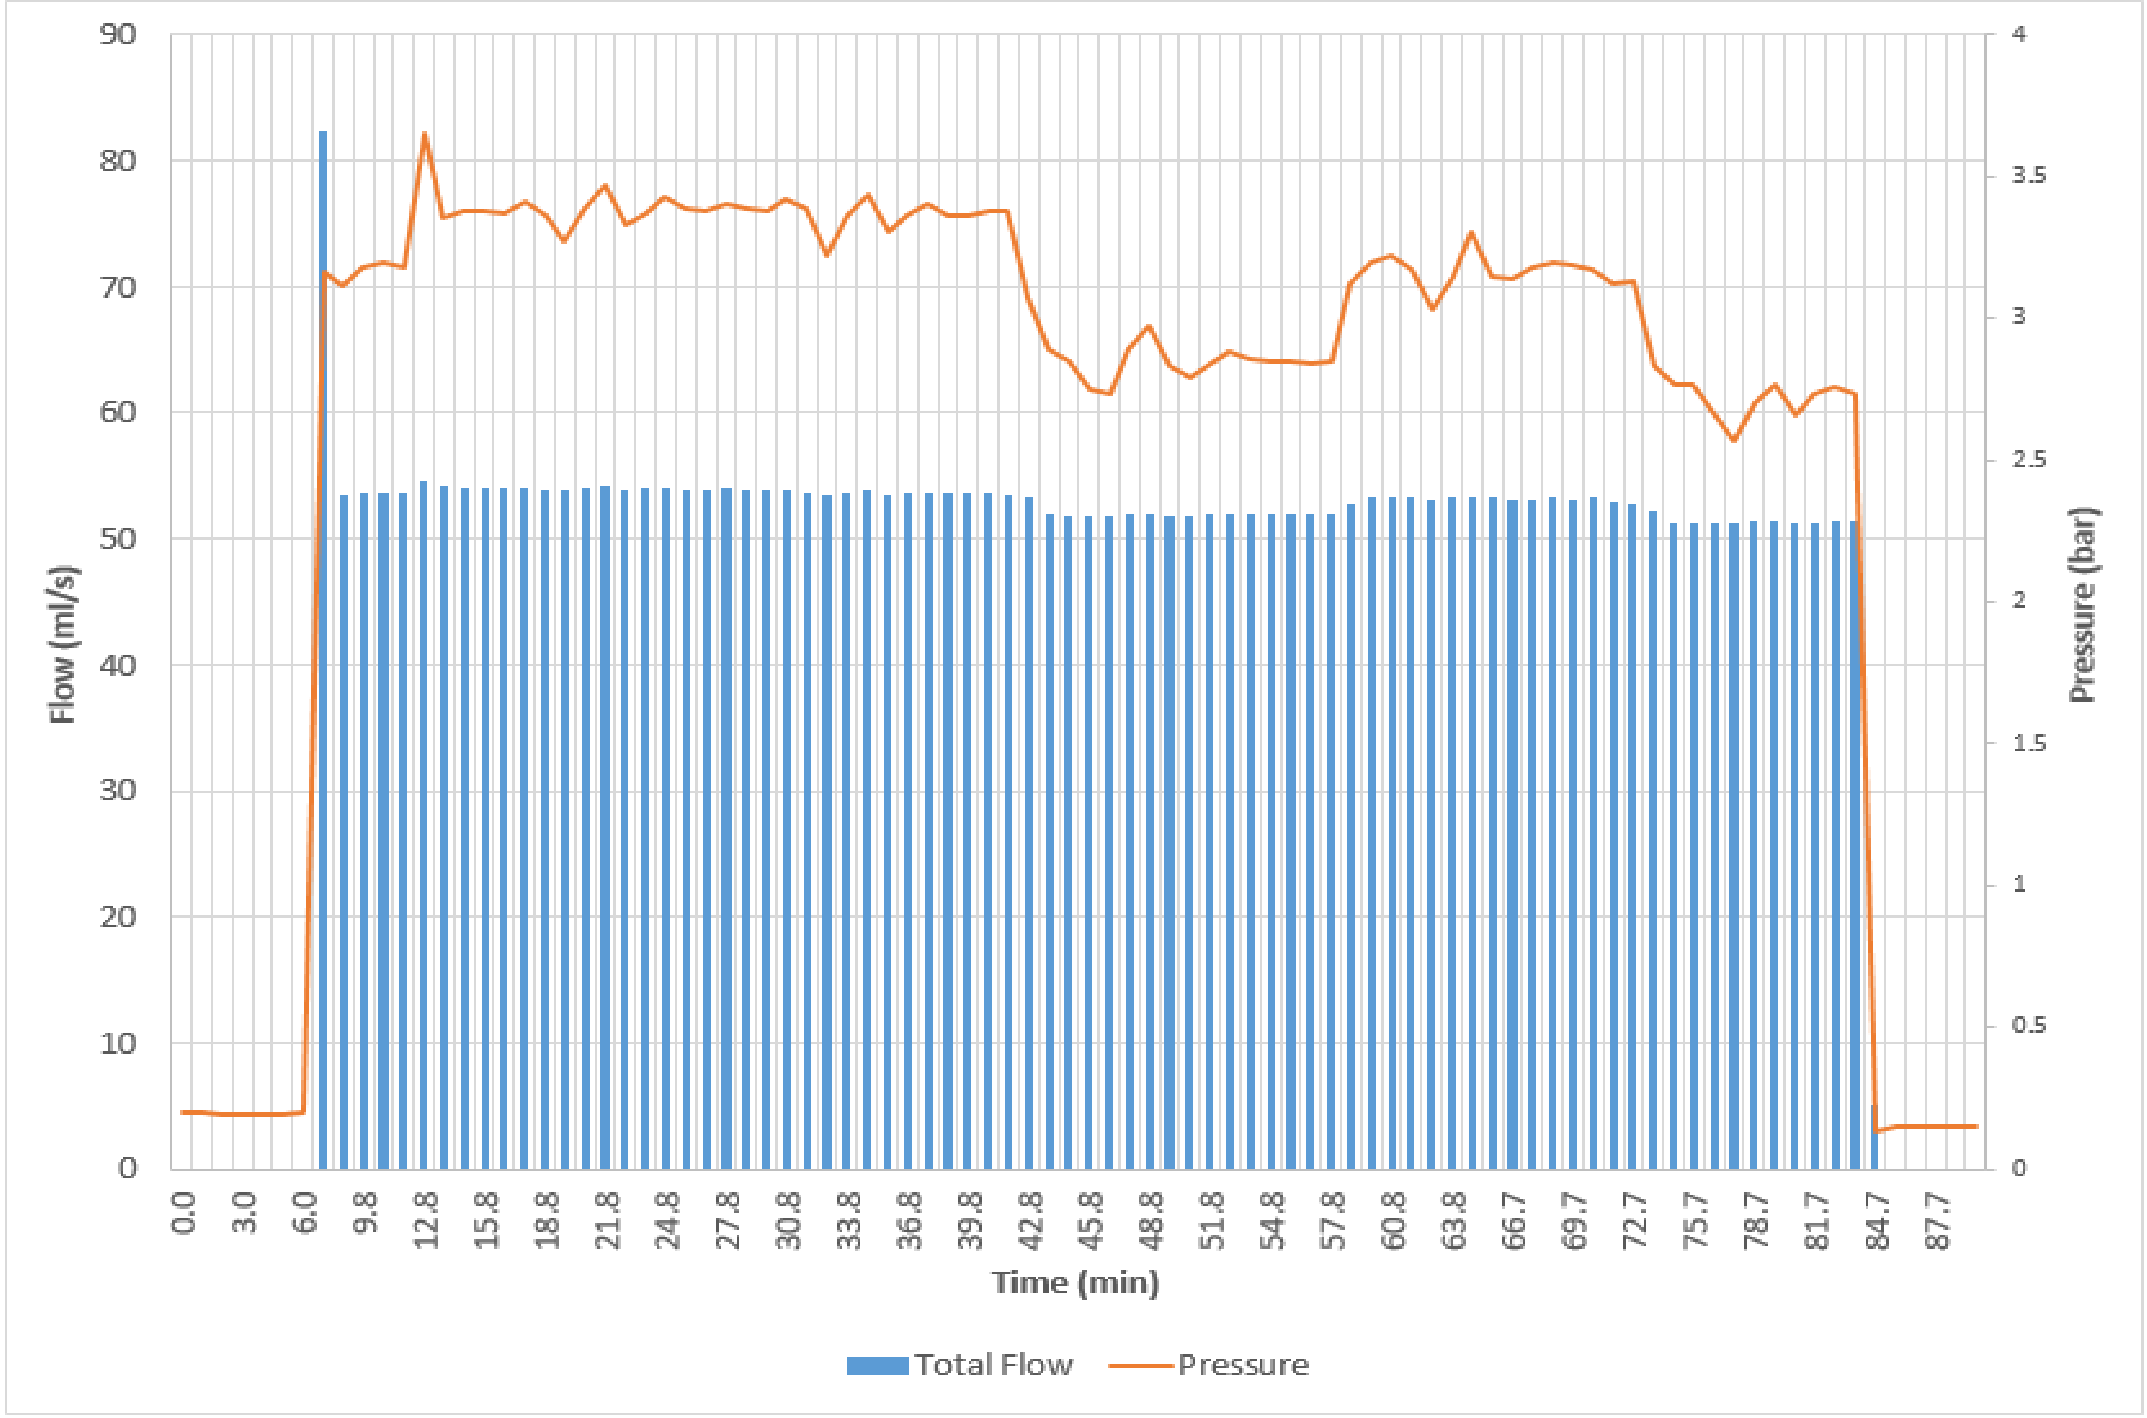
Figure 10.
The air humidity and temperature variation close to the neighboring holes A and B (provided by the SHTC3 sensor module) and the soil temperatures at 8 cm depth (provided by TEROS 12) at the neighboring positions A and B.
Figure 10.
The air humidity and temperature variation close to the neighboring holes A and B (provided by the SHTC3 sensor module) and the soil temperatures at 8 cm depth (provided by TEROS 12) at the neighboring positions A and B.
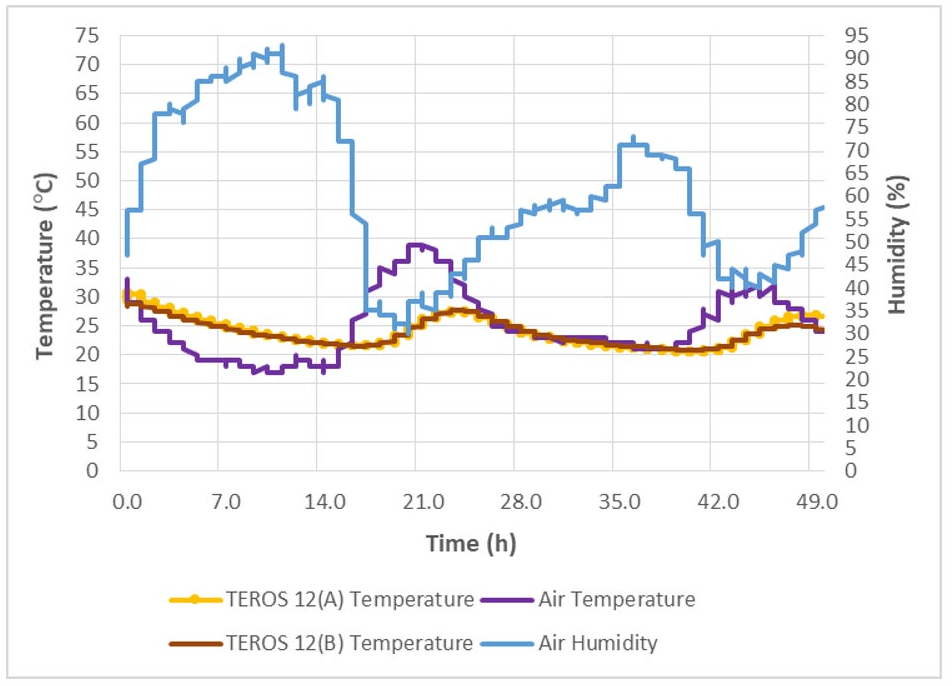
Figure 11.
3D printed servo valve attachment improvements: (a) 3D design with planetary gears for improved torque output; (b) 3D printed implementation with ABS for better durability.
Figure 11.
3D printed servo valve attachment improvements: (a) 3D design with planetary gears for improved torque output; (b) 3D printed implementation with ABS for better durability.
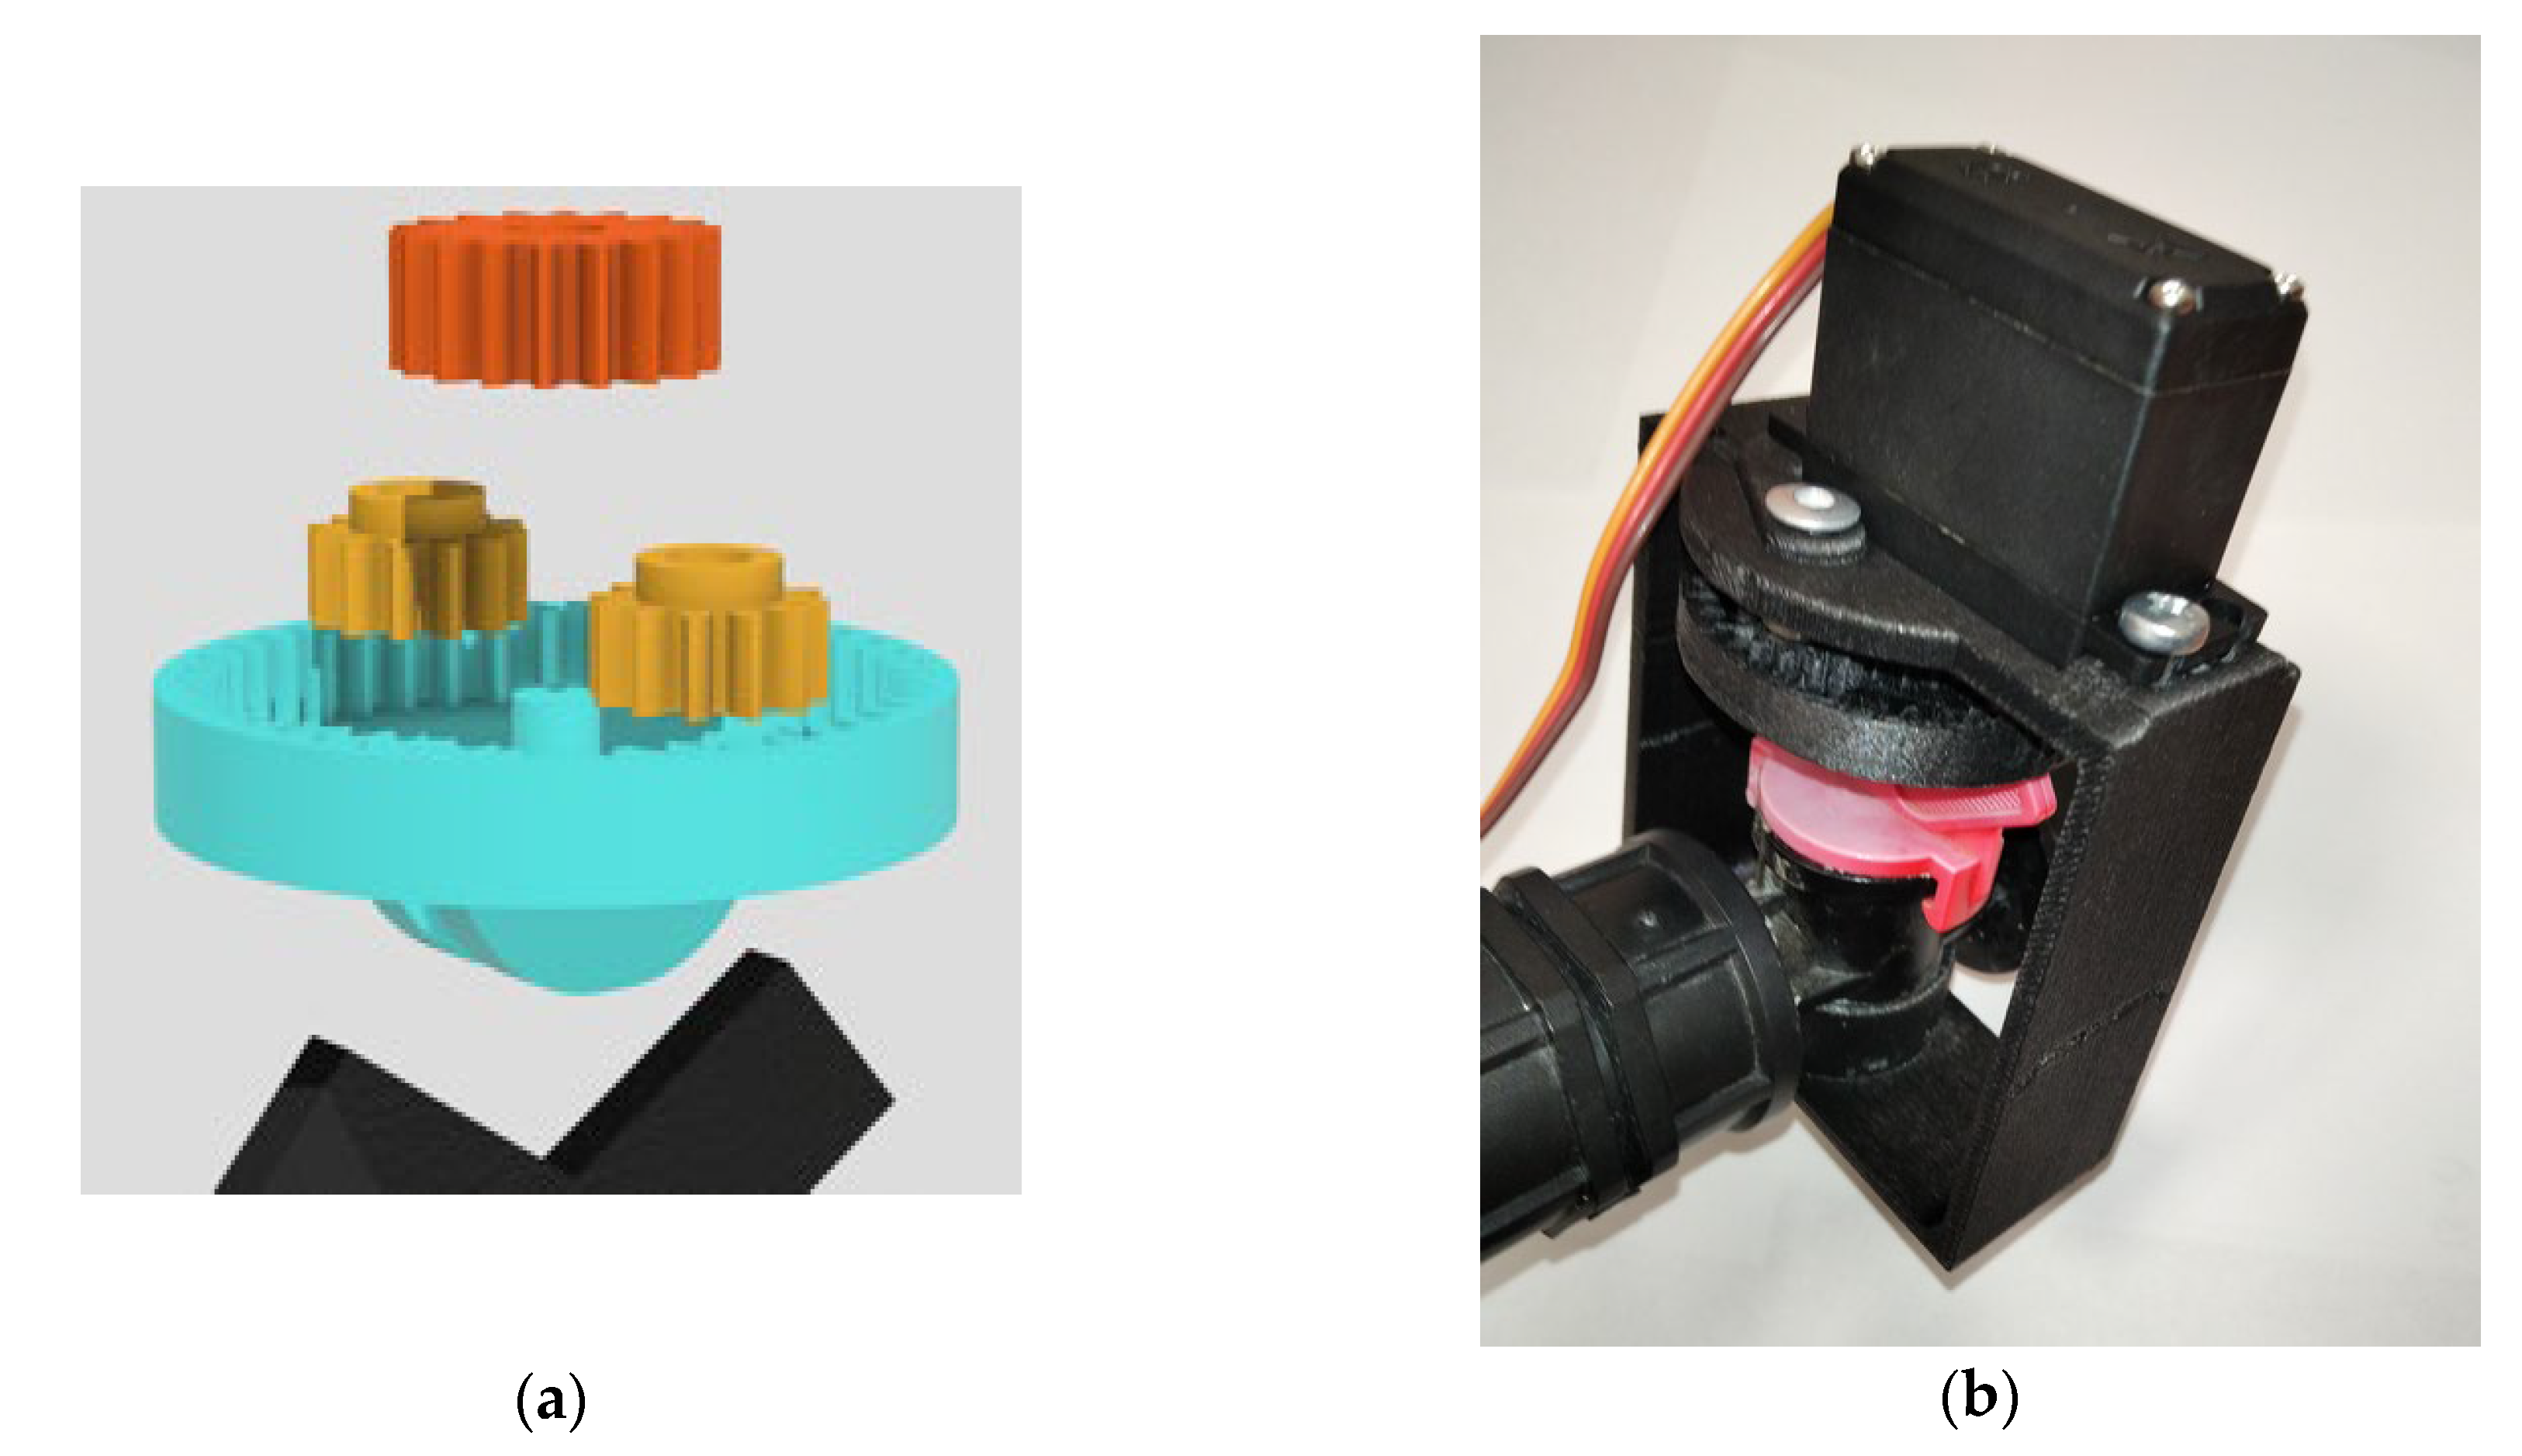
Figure 12.
3D printed servo valve attachment improvements: (a) Custom amperage measuring unit based on ACS712 Hall-based sensor; (b) Sensor-Actuator node amperage consumption (at 3.8V) while progressively opening and closing the main water supply valve (Valve M).
Figure 12.
3D printed servo valve attachment improvements: (a) Custom amperage measuring unit based on ACS712 Hall-based sensor; (b) Sensor-Actuator node amperage consumption (at 3.8V) while progressively opening and closing the main water supply valve (Valve M).
Disclaimer/Publisher’s Note: The statements, opinions and data contained in all publications are solely those of the individual author(s) and contributor(s) and not of MDPI and/or the editor(s). MDPI and/or the editor(s) disclaim responsibility for any injury to people or property resulting from any ideas, methods, instructions or products referred to in the content. |
© 2026 by the authors. Licensee MDPI, Basel, Switzerland. This article is an open access article distributed under the terms and conditions of the Creative Commons Attribution (CC BY) license (http://creativecommons.org/licenses/by/4.0/).
Copyright: This open access article is published under a Creative Commons CC BY 4.0 license, which permit the free download, distribution, and reuse, provided that the author and preprint are cited in any reuse.


