
Submitted:
05 February 2026
Posted:
05 February 2026
You are already at the latest version
Abstract
Atmospheric aerosols strongly regulate surface solar irradiance in tropical coastal environments through scattering and absorption. This study examines aerosol–irradiance interactions over Penang, Malaysia, using Aerosol Robotic Network (AERONET) observations of aerosol optical depth (AOD), single scattering albedo (SSA), and extinction Ångström exponent (AE); NASA’s Prediction of Worldwide Energy Resource (POWER) irradiance data; and MERRA-2 reanalysis for aerosol compositional context. Bottom-of-atmosphere radiative forcing efficiency (BOA RFE) was quantified for global, direct and diffuse irradiance (GHI, DNI and DHI) under clear and all-sky conditions during 2014–2018. Results show persistent aerosol-induced attenuation of surface radiation, with GHI and DNI RFE predominantly negative, while DHI RFE remains consistently positive, indicating redistribution of solar energy from direct to diffuse components. Time resolved analysis reveals daily GHI RFE typically ranging from approximately −0.5 to −3.5 W m⁻² per unit AOD, with episodic excursions below −4 W m⁻² per AOD during high-aerosol events, whereas DNI RFE frequently reaches values below −0.8 W m⁻² per AOD, confirming its greater sensitivity to aerosol extinction. In contrast, DHI RFE commonly exceeds +5 W m⁻² per AOD and intermittently surpasses +10 W m⁻² per AOD, reflecting enhanced scattering and multiple-scattering effects. AOD-stratified analysis demonstrates a nonlinear weakening of forcing efficiency with increasing aerosol burden, with mean GHI RFE decreasing from approximately −1.6 to −0.4 W m⁻² per AOD between low- and high-AOD regimes, accompanied by corresponding reductions in DNI (−0.35 to −0.1 W m⁻² per AOD) and DHI (+3.3 to +0.8 W m⁻² per AOD). Overall, aerosol loading is identified as the dominant control on BOA radiative forcing efficiency in this tropical coastal environment, while SSA and AE act as secondary modulators.
Keywords:
radiative forcing efficiency
; aerosol optical depth
; single scattering albedo
; Ångström exponent
; solar irradiance components
1. Introduction
Solar irradiance is a critical driver of Earth’s energy budget, playing a central role in atmospheric processes, hydrological cycles, and climate dynamics. In urban tropical environments, where solar energy potential is high, understanding the variability of solar radiation is also essential for optimizing photovoltaic (PV) power generation and urban energy planning. However, solar irradiance reaching the Earth’s surface is often modulated by atmospheric aerosols suspended particles such as dust, sea salt, black carbon, and sulfates which scatter and absorb solar radiation, altering both its intensity and spectral distribution [1,2].
Aerosols influence solar radiation in two major ways: directly through scattering and absorption (direct radiative effect), and indirectly by modifying cloud properties (indirect radiative effect) [3]. The direct effects, which are more quantifiable, can reduce the amount of solar radiation reaching the surface (global horizontal irradiance (GHI) and change its angular distribution between direct normal irradiance (DNI) and diffuse horizontal irradiance (DHI) [4]. These effects are highly dependent on aerosol optical depth (AOD), single scattering albedo (SSA), and Angstrom exponent (AE) [5,6].
Recent studies have emphasized the importance of differentiating between clear-sky and all-sky conditions when quantifying aerosol impacts, especially in tropical and monsoonal climates where cloud cover is frequent and heterogeneous [7]. Under clear-sky conditions, aerosol radiation interactions can be isolated, enabling accurate estimation of direct aerosol radiative effects. However, in all-sky scenarios, cloud-aerosol interactions can complicate interpretations of irradiance reductions [8]. Furthermore, the spectral and temporal resolution of irradiance GHI, DNI, DHI under varying aerosol regimes is crucial for solar energy forecasting, climate modeling, and understanding regional air pollution effects [9]. Malaysia, particularly Penang a coastal urban city situated in the tropics experiences significant aerosol loading from both anthropogenic and natural sources, including industrial emissions, vehicular pollution, marine aerosols, and periodic transboundary haze events linked to biomass burning in nearby regions [10,11]. Despite this, the radiative impacts of aerosols on solar irradiance in Penang remain understudied, especially in terms of distinguishing between clear-sky and all-sky conditions and accounting for different aerosol compositions.
This study addresses this knowledge gap by quantifying the impact of atmospheric aerosols on the three main solar irradiance components GHI, DNI, and DHI under both clear-sky and all-sky conditions over Penang, Malaysia, from 2014 to 2018. Using ground-based Aerosol Robotic Network (AERONET) data, satellite-derived aerosol composition from Modern-Era Retrospective analysis for Research and Applications Version 2 (MERRA-2), and meteorological and irradiance data from NASA’s Prediction of Worldwide Energy Resource (NASA POWER), this work analyzes how aerosol optical properties influence surface radiation and estimates the associated radiative forcing efficiency (RFE). The study also evaluates the influence of aerosol types on irradiance variability and radiative effects, with implications for air quality management and solar energy forecasting in Southeast Asia.
2. Materials and Methods
2.1. Study Area and Datasets Used
Penang, located on the northwestern coast of Peninsular Malaysia (approximately 5.42°N latitude and 100.33°E longitude), represents a tropical coastal urban environment characterized by consistently high humidity and temperature throughout the year. The region experiences two primary monsoon periods: the Northeast Monsoon (NEM) November to March and the Southwest Monsoon SEM May to September, separated by two inter-monsoon transitions, March to May and October to early November. These seasonal transitions bring distinct shifts in wind patterns, rainfall intensity, and atmospheric stability. Combined with frequent convective rainfall and periodic transboundary haze events from regional biomass burning, these dynamics create a complex and variable aerosol environment. Given Penang’s rapidly developing urban infrastructure and its sensitivity to both regional meteorological conditions and anthropogenic emissions, the area serves as a representative setting for investigating aerosol–radiation interactions in tropical Southeast Asia [12].
To quantify the impact of aerosols on solar irradiance components in Penang, a multi-source dataset spanning from January 2014 to December 2018 was compiled. Ground-based aerosol optical properties were obtained from the AERONET station located in Penang (Figure 1). The Level 2.0 dataset provided cloud-screened, quality-assured observations of aerosol optical depth (AOD) at wavelengths of 440, 675, and 870 nm, as well as Single Scattering Albedo (SSA) and the Ångström exponent (AE) derived from the spectral AOD. These parameters are essential for evaluating aerosol loading, scattering efficiency, and the relative dominance of fine- or coarse-mode particles [13].
Aerosol parameter (AOD) and related optical properties Level 2.0, provide high-quality ground-based aerosol measurements with reported uncertainties of approximately ±0.01–0.02 for visible-wavelength AOD under well-calibrated conditions. Derived parameters such as SSA and AE exhibit larger uncertainty, particularly under low aerosol loading, due to inversion assumptions and signal-to-noise limitations [14].
Satellite-derived solar irradiance data were obtained from NASA’s Prediction of Worldwide Energy Resource (POWER) project. This study utilized daily average values of GHI, DNI, and DHI to assess aerosol impacts on surface-level solar energy components. These products are derived from a combination of satellite observations, meteorological reanalysis fields, and radiative transfer modeling, and are widely used for climatological and applied solar radiation studies, particularly in regions lacking dense ground-based radiometric networks [15]. Validation studies indicate that NASA POWER GHI estimates typically exhibit uncertainties of approximately 5–10% under clear-sky conditions, increasing to 10–20% under cloudy conditions, while DNI generally shows larger relative uncertainty due to its sensitivity to aerosol extinction and cloud screening [16]. Uncertainty in DHI is further influenced by aerosol scattering assumptions and cloud optical properties, which are particularly relevant in humid tropical environments.
These irradiance parameters were essential for quantifying aerosol–radiation interactions under varying atmospheric loading, particularly in distinguishing the effects under all-sky conditions across different aerosol regimes [17]. Additionally, MERRA-2 data in this study are used primarily for qualitative and relative interpretation of aerosol composition and variability, rather than for precise quantitative forcing estimates. Monthly averaged aerosol extinction optical depths for sulfate, sea salt, organic carbon, black carbon, and dust were extracted and collocated with the other datasets. These extinction values helped identify the dominant aerosol types present during different periods of the study, providing insight into the radiative forcing efficiency of individual species and mixed aerosol events [18]. MERRA-2 data are subject to uncertainties arising from emission inventories, data assimilation constraints, and model parameterizations; however, they have been shown to reliably capture regional-scale aerosol variability and relative contributions of major aerosol species [19].
All datasets were harmonized to a daily temporal resolution to ensure consistency in the analysis. AERONET observations were averaged, where multiple retrievals were available per day, and MERRA-2 monthly values were expanded to match the daily timeline to support compositional comparisons.
2.2. Data Processing
Following data acquisition, extensive pre-processing was performed to ensure consistency and reliability across all datasets. Initially, the AERONET Level 2.0 aerosol optical properties were filtered to remove any remaining anomalies or outliers, and daily averages were computed to match the temporal resolution of the NASA POWER irradiance data. The AERONET values of AOD, AE, and SSA were merged with corresponding daily solar irradiance data.
To distinguish between clear-sky and all-sky conditions, a threshold-based method was adopted, grounded in radiative transfer principles. Clear-sky conditions were identified using a combination of GHI variability and cloud cover surrogates derived from diffuse and direct irradiance ratios. Specifically, days with relatively high DNI and low DHI values were classified as clear-sky, consistent with previous studies that employed similar irradiance-based criteria [20,21]. The ratio of DHI to GHI, in particular, served as a useful indicator of cloud presence, as an increase in scattering from clouds leads to elevated diffuse irradiance levels.
Further validation of clear-sky identification was supported by visual inspection of time series plots and correlation analyses. Days affected by extreme aerosol events, such as haze or dust transport, were flagged using the Angstrom exponent and SSA values. High AOD combined with low AE (<1.0) and SSA (<0.90) suggested the presence of absorbing coarse-mode particles typically associated with regional biomass burning or long-range dust events [5]. For aerosol composition analysis, monthly averaged MERRA-2 aerosol extinction optical depths for five key species sulfate, sea salt, black carbon, organic carbon, and dust were interpolated to daily resolution using nearest-neighbor matching. This allowed each day’s irradiance conditions to be contextualized with prevailing aerosol types, supporting the assessment of species-specific radiative effects.
The complete dataset was merged into a master file and subjected to further consistency checks. Missing or incomplete data were handled conservatively, with days removed only if critical variables were unavailable. This comprehensive processing ensured that each retained data point contained harmonized and quality controlled values for aerosols, irradiance, forming the basis for subsequent radiative forcing efficiency analysis.
2.3. Radiative Forcing Efficiency Estimation
Radiative Forcing Efficiency (RFE) is used in this study as a key metric to quantify the effect of aerosols on surface solar radiation under both clear-sky and all-sky conditions. RFE refers to the reduction in solar irradiance per unit of AOD, capturing the attenuation efficiency of atmospheric aerosols without requiring full radiative transfer modeling. This approach isolates the bottom of atmosphere (BOA) perspective, focusing on how aerosols influence the actual irradiance received at the Earth’s surface rather than the full atmospheric column. The estimation was performed separately for three irradiance components. Clear-sky irradiance data, provided by NASA POWER, were used as a reference to evaluate aerosol-induced deviations in observed (all-sky) values. For each irradiance component, RFE was calculated as the difference between the clear-sky and all-sky measurements, normalized by AOD at 440 nm, using the formula [22]:
where I represents the irradiance (GHI, DNI, or DHI), and is the aerosol optical depth at 440 nm. This formulation enables a wavelength-sensitive evaluation of aerosol impacts, especially relevant for urban regions where particle scattering and absorption vary significantly by type and source [23,24].
The use of AOD at 440 nm in Equation (1) is motivated by both observational and physical considerations. The 440 nm channel represents the shortest standard wavelength in AERONET Level 2.0 retrievals and exhibits the highest sensitivity to fine-mode, light-absorbing aerosols such as biomass-burning smoke and urban pollution, which dominate aerosol radiative impacts in tropical coastal regions. Moreover, shortwave radiative forcing at the surface is more strongly modulated by aerosol extinction at shorter wavelengths, making particularly suitable for normalization when assessing surface irradiance responses. In addition, the 440 nm channel is less affected by calibration uncertainties than extrapolated AOD values derived through AE wavelength conversion, which can introduce additional uncertainty, especially under mixed aerosol conditions and variable particle size distributions [25].
The original solar irradiance data obtained from the NASA POWER database are provided as daily accumulated energy fluxes in units of kilowatt-hours per square meter per day (kWh m⁻² day⁻¹). To ensure consistency with radiative forcing and radiative efficiency calculations, these values were converted to mean power fluxes in watts per square meter (W m⁻²).
RFE in this study is evaluated at the BOA to quantify the sensitivity of surface solar irradiance components to aerosol loading under real atmospheric conditions. While top-of-atmosphere (TOA) radiative forcing is more directly linked to the planetary energy balance and climate response, BOA forcing provides a physically meaningful measure of aerosol impacts on surface energy availability, boundary-layer processes, and surface-based applications such as solar energy assessment [26]. However, a BOA-based RFE framework does not account for aerosol-induced changes in atmospheric absorption or reflection above the surface, nor does it capture the vertical redistribution of radiative energy within the atmospheric column. Consequently, the BOA RFE values reported here characterize surface radiative responses to aerosols rather than total climate forcing, and should be interpreted as complementary to, rather than a substitute for, TOA-based assessments.
2.4. Aerosol Type Classification
Seasonal classification was based on the monsoonal cycle typical of Peninsular Malaysia: NEM, first inter monsoon, SWM, and second inter monsoon. This stratification allowed for assessment of both interseasonal and haze-driven variability in RFE. Aerosol type classification was further applied using SSA and AE thresholds: scattering-dominated aerosols were defined as SSA ≥ 0.95, while absorbing aerosols had SSA < 0.95; fine-mode particles were identified by AE > 1.0, and coarse-mode by AE ≤ 1.0.
Aerosol type classification in this study employed a two tier approach to distinguish between haze impacted and typical urban aerosol conditions. The first tier utilized a curated haze day flag list derived from visibility reduction records, regional haze advisories, and corroborative hotspot data to identify periods of potential transboundary pollution events in Penang. These flags were compiled in a dedicated dataset and cross referenced with daily observations to isolate haze-affected periods across the study timeframe of 2014–2018 [27].
The second tier applied aerosol optical thresholds based on AERONET retrievals to verify aerosol characteristics. Specifically, the AE and SSA were used to infer particle size and absorption properties, respectively. AE values less than 1.0 typically indicate dominance of coarse particles, such as those from biomass burning or dust, while SSA values below 0.95 point to enhanced aerosol absorption, further confirming absorbing-type aerosols [28,29]. Days satisfying both haze flagging and optical property criteria (AE < 1.0 and SSA < 0.95) were classified as “haze,” reflecting the presence of mixed or absorbing aerosol. All other days were categorized as “urban background,” representing locally emitted aerosols from traffic, industry, and marine influences, typically characterized by higher AE and SSA indicative of fine-mode scattering aerosols [30]. This classification framework was critical in enabling a focused assessment of how aerosol types differentially influence bottom-of-atmosphere radiative forcing efficiency (BOA_RFE), specifically across GHI, DNI, and DHI components.
3. Results and Discussion
3.1. Temporal and Seasonal Trends
The temporal evolution of AOD at 440 nm, 675 nm, and 870 nm over Penang for the period 2014–2018 is illustrated in Figure 2. At 440 nm, AOD exhibits the largest magnitude and variability throughout the record, reflecting the strong sensitivity of shorter wavelengths to fine-mode aerosols. Moderate background values generally remain below 0.5 during non-haze periods; however, pronounced peaks are evident during late 2015, where AOD at 440 nm exceeds 4.0, marking the most extreme aerosol loading observed in the entire dataset. This episode corresponds to the well-documented 2015 Southeast Asian transboundary haze, driven by widespread biomass burning under El Niño–induced drought conditions [31].
The 675 nm AOD time series mirrors the temporal structure observed at 440 nm but with slightly reduced magnitudes. Peak values during late 2015 reach approximately 3.5–4.0, reinforcing the dominance of fine-mode aerosols during this period. Outside the haze years, 675 nm AOD generally fluctuates between 0.1 and 0.4, indicative of relatively clean to moderately polluted atmospheric conditions typical of coastal urban environments influenced by marine air masses. At the longest wavelength, 870 nm, AOD values are consistently lower, as expected due to reduced sensitivity to fine particles. Background levels are typically below 0.3, while extreme haze-related peaks during late 2015 rise to about 3.0, confirming that even coarse-wavelength extinction was substantially enhanced during this event. The simultaneous increase across all three wavelengths, with a clear wavelength-dependent gradient (440 nm > 675 nm > 870 nm), strongly indicates a fine-particle–dominated aerosol regime, characteristic of biomass-burning smoke rather than dust or sea salt [5].
From 2017 onward, all wavelengths show markedly reduced AOD levels, with most values remaining below 0.5 and only sporadic short-lived enhancements. This decline reflects the absence of major regional haze episodes during these years and highlights the strong interannual variability of aerosol loading over Penang. The relatively stable and low AOD observed in 2018 further underscores the episodic nature of extreme aerosol events in the region [32].
The Figure 3, illustrates the temporal evolution of key aerosol microphysical properties over Penang from 2014 to 2018, namely the AE derived from 440–870 nm measurements (Panel A) and the SSA at 440 nm, 675 nm, and 870 nm (Panel B). Panel (A) shows that the AE (440–870 nm) predominantly ranges between ~1.0 and 1.6 throughout most of the study period, indicating a persistent dominance of fine-mode aerosols over Penang. Such values are characteristic of urban-industrial pollution, biomass-burning smoke, and aged secondary aerosols, rather than coarse-mode particles such as sea salt or mineral dust. Notably, elevated AE values exceeding 1.6–1.8 are frequently observed during 2014–2016, with pronounced clustering during late 2015, coinciding with the period of extreme aerosol loading identified in the AOD analysis. This reinforces the interpretation that the 2015 haze event was dominated by fine combustion-derived particles, consistent with large-scale biomass burning during El Niño–driven dry conditions in Southeast Asia [33].
Periods where AE temporarily decreases toward ~0.6–0.9 suggest episodic contributions from coarser aerosol components, potentially linked to marine influences, local resuspension, or enhanced atmospheric mixing during cleaner conditions [34]. However, the absence of sustained low AE values confirms that coarse-mode aerosols do not dominate the aerosol climatology of Penang.
Figure 3 (b) presents the temporal evolution of SSA at 440 nm, 675 nm, and 870 nm, with values predominantly ranging between ~0.92 and 0.99 across the study period. These high SSA values indicate that aerosols over Penang are generally scattering-dominated, particularly under background and moderately polluted conditions [35]. However, distinct reductions in SSA are observed during 2015 and early 2016, especially at shorter wavelengths (440 nm), where SSA occasionally drops to ~0.85–0.90. This wavelength-dependent decrease is a strong indicator of enhanced aerosol absorption, consistent with the presence of black carbon and organic carbon associated with biomass-burning smoke. The more pronounced absorption at shorter wavelengths further supports the dominance of fine, light-absorbing particles during haze periods [36].
The gradual recovery of SSA values after 2017, approaching ~0.97–0.99 across all wavelengths, reflects a return to cleaner atmospheric conditions with aerosols that are more weakly absorbing and increasingly influenced by scattering processes. The convergence of SSA values across wavelengths during these periods suggests a more internally mixed aerosol population with reduced absorption efficiency [37].
Figure 4, provides a coupled assessment of daily surface solar irradiance components (Panel A) and aerosol optical composition derived from MERRA-2 (Panel B) over Penang for the period 2014–2018, enabling a robust evaluation of aerosol–radiation interactions under tropical coastal conditions.
Figure 4 (a), shows that GHI remains persistently high throughout the study period, with daily values predominantly ranging between 4.5 and 6.5 kWh m⁻² day⁻¹, reflecting Penang’s near-equatorial solar regime. However, notable short-term depressions are evident, particularly during 2015–2016, when GHI frequently drops below 5.0 kWh m⁻² day⁻¹, indicating episodic atmospheric attenuation. The DNI exhibits substantially stronger variability than GHI, with typical daily values between 3.0 and 5.5 kWh m⁻² day⁻¹ under background conditions. During high-aerosol episodes—most prominently in mid-2015 to early-2016 DNI shows pronounced reductions, frequently falling below 4.0 kWh m⁻² day⁻¹, and in several instances approaching 3.0 kWh m⁻² day⁻¹. These sharp declines underscore the high sensitivity of the direct solar beam to aerosol extinction through combined scattering and absorption processes [38]. In contrast, DHI displays a narrower dynamic range, typically fluctuating between 2.0 and 3.2 kWh m⁻² day⁻¹. Importantly, periods of suppressed DNI coincide with relative stabilization or mild enhancement of DHI, indicating increased multiple scattering under aerosol-laden skies [39]. This compensatory behavior explains why reductions in GHI are systematically smaller than those observed for DNI, despite significant aerosol loading.
Figure 4 (b), reveals that the total aerosol extinction optical depth (TOTEXTTAU) remains relatively moderate during most years, but exhibits a pronounced peak during 2015, marking the most aerosol-intensive period of the study. This peak temporally coincides with the strongest DNI and GHI suppressions observed in Panel (A), confirming a direct aerosol–radiation linkage. Decomposition of TOTEXTTAU indicates that carbonaceous aerosols dominate this enhancement. Both organic carbon (OCEXTTAU) and black carbon (BCEXTTAU) show clear increases during 2015–2016, consistent with large-scale regional biomass-burning events. These absorbing aerosols are particularly effective at attenuating direct solar radiation, providing a physical explanation for the disproportionate suppression of DNI relative to GHI. Sulfate aerosols (SUEXTTAU) contribute persistently throughout the study period, reflecting continuous anthropogenic emissions and secondary aerosol formation, while exhibiting secondary enhancements during polluted years. In contrast, dust (DUEXTTAU) and sea salt (SSEXTTAU) display lower magnitudes and weaker interannual variability, indicating that coarse-mode aerosols play a limited role in driving extreme aerosol loading events over Penang [33].
3.2. Clear-Sky vs. All-Sky Irradiance Responses
Figure 5 compares clear-sky and all-sky surface solar irradiance components, GHI, DNI, and DHI over Penang for the period 2014–2018, highlighting the radiative impacts of aerosols and clouds on the surface energy budget.
The clear-sky GHI consistently exceeds the corresponding all-sky values throughout the study period, with clear-sky GHI predominantly ranging between 280 and 420 W m⁻², while all-sky GHI generally fluctuates between 180 and 320 W m⁻². The systematic reduction of approximately 60–120 W m⁻² under all-sky conditions reflects the combined attenuation effects of aerosols and cloud cover. Interannually, the largest clear-sky to all-sky divergence occurs during 2015–2016, coinciding with enhanced aerosol loading associated with regional haze episodes. Despite Penang’s persistently high solar availability, this reduction demonstrates that aerosol and cloud processes significantly modulate the net surface shortwave flux even in tropical coastal environments [27].
DNI exhibits the strongest sensitivity to atmospheric conditions among the three components. Clear-sky DNI frequently reaches 250–350 W m⁻², whereas all-sky DNI is substantially reduced, often falling within 80–200 W m⁻². During severe attenuation events, particularly in 2015, all-sky DNI occasionally drops below 100 W m⁻², representing reductions exceeding 50–60% relative to clear-sky values. This pronounced suppression highlights the vulnerability of the direct solar beam to aerosol extinction through both scattering and absorption. The magnitude and persistence of DNI reductions emphasize the dominant role of aerosols especially fine-mode and absorbing species in degrading direct solar irradiance under polluted conditions [5].
In contrast to GHI and DNI, the bottom panel shows all-sky DHI exceeding DHI clear-sky. This inversion is due to increased atmospheric scattering, whereby both aerosols and clouds redirect solar radiation from the direct beam into the diffuse component. Notably, the enhancement in DHI under all-sky conditions is especially prominent during hazy periods, reinforcing the role of high-AOD and high-SSA aerosols (e.g., sulfates and organics) in generating diffuse radiation [32]. In contrast to GHI and DNI, DHI shows a reversed behavior, with all-sky DHI consistently exceeding clear-sky values. Clear-sky DHI typically remains within 30–70 W m⁻², while all-sky DHI frequently increases to 80–140 W m⁻², particularly during aerosol- and cloud-rich periods. This enhancement reflects intensified multiple scattering processes in the atmosphere, whereby aerosols and clouds redistribute incoming solar radiation from the direct beam into the diffuse component. Notably, during periods of reduced DNI, DHI partially compensates for the loss of direct irradiance, explaining why GHI reductions are less severe than DNI reductions [40].
These findings are consistent with previous regional and global studies. For instance, Li et al. [7] highlighted the importance of distinguishing aerosol effects under clear-sky versus all-sky conditions in monsoonal Asia, while Kazadzis et al. [41] quantified similar GHI reductions due to aerosol-cloud interactions in Southeast Asia. Moreover, the increase in DHI under all-sky conditions echoes findings from Kudo et al. [42], who documented enhanced diffuse radiation during biomass burning episodes. The behavior observed in Figure provides a quantitative baseline for assessing RFE in the subsequent sections, where the deviations from clear-sky values will be normalized by AOD to derive per-unit aerosol effects.
3.3. Impact of SSA and AE on DHI Partitioning
Figure 6 examines the sensitivity of DHI to aerosol optical characteristics using a classification-based framework, rather than linear regression. This approach allows for a more physically meaningful assessment of aerosol–radiation interactions under different scattering and size regimes, while explicitly accounting for uncertainty through the use of the standard error of the mean (SEM).
The left panel of Figure 6 presents the mean DHI values classified according to aerosol SSA, separating conditions dominated by scattering aerosols (SSA ≥ 0.95) from those dominated by more absorbing aerosols (SSA < 0.95). The results indicate mean DHI values of 98.0 ± 2.3 W m⁻² for scattering aerosols (N = 48) and 101.9 ± 2.5 W m⁻² for absorbing aerosols (N = 40).
From a radiative transfer perspective, aerosols with higher absorption reduce the direct beam more efficiently while still allowing multiple scattering within the atmosphere, which can enhance the diffuse component under certain conditions, particularly when aerosol optical depth is moderate and cloud contamination is minimal [43]. The slightly higher mean DHI observed under absorbing aerosol conditions is therefore physically plausible and consistent with theoretical and observational studies showing that absorbing aerosols can redistribute solar energy from the direct to the diffuse component rather than uniformly suppressing all irradiance components [44].
However, it is important to emphasize that the overlapping SEM ranges indicate that the difference between the two SSA classes is modest and not necessarily statistically significant. This suggests that, over Penang, aerosol absorption alone does not exert a dominant control on DHI variability, and that other factors such as aerosol loading, vertical distribution, relative humidity, and cloud–aerosol interactions likely modulate the observed response [7]. The result therefore supports a moderate sensitivity of DHI to aerosol absorptivity rather than a deterministic relationship.
The right panel of Figure 6 explores the dependence of DHI on aerosol size characteristics using the extinction AE as a proxy, with AE ≥ 1.0 representing fine-mode–dominated conditions and AE ≤ 1.0 representing coarse-mode dominated conditions. The mean DHI under fine-mode conditions is 92.9 ± 15.8 W m⁻² (N = 2), whereas coarse-mode conditions exhibit a higher and more stable mean DHI of 100.0 ± 1.7 W m⁻² (N = 86).
In contrast, the coarse-mode regime is well represented and shows a relatively narrow SEM, indicating a stable diffuse irradiance response. Coarse-mode aerosols, such as sea salt and aged mineral dust, are efficient scatterers at shortwave wavelengths and can substantially enhance diffuse irradiance by increasing multiple scattering within the atmosphere [45]. Given Penang’s coastal location, the dominance of marine aerosols during certain seasons likely contributes to the higher and more consistent DHI observed under coarse-mode conditions. These findings are consistent with previous coastal and island study that report enhanced diffuse radiation under marine-influenced aerosol regimes, particularly in humid tropical environments where hygroscopic growth further amplifies scattering efficiency [46].
Figure 7 examines the relationship between clear-sky and all-sky solar irradiance components, focusing on (a) the partitioning behavior of GHI and DNI, and (b) the nonlinear response of diffuse horizontal irradiance (DHI) under varying atmospheric conditions.
Panel (a) shows scatter plots comparing clear-sky and all-sky values of GHI and DNI, respectively, along with linear fits. The near-unity slopes (≈1.43 for GHI and ≈1.07 for DNI) and extremely high coefficients of determination (R² ≈ 1.00) indicate a strong, nearly linear partitioning between clear-sky and all-sky irradiance for these components. This behavior reflects the fact that GHI and DNI are primarily governed by the attenuation of the direct solar beam by clouds and aerosols, with clear-sky conditions representing an upper radiative bound under a given solar geometry [47]. The tight linearity suggests that, for the study region, all-sky irradiance variability largely scales with the clear-sky baseline, consistent with previous studies using satellite-derived clear-sky products such as NASA POWER and CAMS McClear [48,49].
In contrast to GHI and DNI, panel (b) reveals a markedly nonlinear relationship between clear-sky and all-sky DHI, captured here using a cubic polynomial fit. The relatively low coefficient of determination (R² = 0.081), despite a large sample size (N = 1826), highlights the limited predictive power of simple regression models for diffuse irradiance. The diffuse component of solar radiation is inherently sensitive to multiple interacting processes, including aerosol scattering, cloud optical thickness, cloud fraction, and multiple scattering within the atmosphere. As a result, DHI does not scale linearly with all-sky conditions, and its variability cannot be adequately described by a single deterministic function.
Importantly, the curvature of the fitted relationship suggests a saturation-type behavior at higher DHI values, where additional scattering does not translate into proportional increases in diffuse irradiance. Such behavior has been reported in both observational and modeling studies and reflects the combined effects of aerosol optical depth, absorption, and cloud overlap [50].
3.4. High-AOD Periods with Low GHI and DNI
Figure 8 presents the temporal evolution of surface solar irradiance components GHI, DNI, and DHI stratified by aerosol loading categories (low, moderate, and high AOD). This figure provides a temporally resolved perspective on how aerosol abundance modulates the partitioning of incoming solar radiation at the surface, complementing the regime-based and statistical analyses presented earlier.
The top panel shows the temporal evolution of GHI stratified by aerosol load. Across the study period, low aerosol loading conditions consistently exhibit higher GHI values, frequently exceeding 250 W m⁻², whereas high aerosol loading conditions are associated with a downward shift in GHI, with many values clustered below 220 W m⁻².
This behavior reflects the integrated effect of aerosols on the total shortwave radiation reaching the surface. Aerosols attenuate GHI primarily through scattering and absorption, reducing the direct solar beam and partially redistributing energy into the diffuse component. Under high aerosol loading, enhanced extinction leads to a net reduction in GHI despite potential increases in diffuse radiation. The overlap between aerosol classes indicates that aerosol loading is not the sole driver of GHI variability; cloud cover, solar geometry, and seasonal meteorology also play important roles.
The middle panel reveals a much clearer separation between aerosol loading regimes for DNI. Low aerosol loading conditions are characterized by higher DNI values, often exceeding 200–250 W m⁻², while high aerosol loading conditions show pronounced suppression of DNI, with values frequently below 150 W m⁻². This strong sensitivity arises because DNI depends almost entirely on the direct solar beam, which is highly vulnerable to aerosol extinction along the optical path [8,9,10]. Both scattering out of the beam and absorption by aerosols reduce the direct component, making DNI a particularly sensitive indicator of aerosol radiative effects. The sharp reduction in DNI under high aerosol loading is consistent with theoretical expectations and observational studies across tropical and subtropical regions [51,52].
The bottom panel illustrates the response of DHI to aerosol loading. In contrast to GHI and DNI, moderate to high aerosol loading conditions tend to exhibit comparable or slightly elevated DHI values, often clustering between 90 and 120 W m⁻². Low aerosol loading conditions, while still producing substantial DHI, display a somewhat broader spread toward lower values. This pattern reflects the dual role of aerosols as scatterers and absorbers. Increased aerosol loading enhances multiple scattering within the atmosphere, redirecting solar radiation from the direct beam into the diffuse component. As a result, DHI can remain stable or even increase under moderate aerosol conditions, even as DNI is strongly suppressed. However, under very high aerosol loading or strongly absorbing aerosol regimes, the enhancement of DHI may be limited by absorption losses and reduced total incoming radiation [53].
Figure 9 provides a physically coherent comparison between a representative clean day (9 February 2017) and a polluted day (6 October 2015), linking aerosol optical properties to changes in surface solar radiation components.
The comparison from Figure 9 (a) illustrates the profound impact of elevated aerosol loading on solar energy availability. On the polluted day, the AOD₄₄₀ increased dramatically to 3.29, compared to just 0.12 on the clean day. This difference nearly an order of magnitude represents an extreme turbidity event, likely influenced by transboundary biomass burning and stagnant meteorological conditions. Such extreme AOD values have been previously reported during Southeast Asian haze events, particularly in 2015 when prolonged El Niño-induced drought amplified fire activity across Sumatra and Kalimantan [54].
The polluted day is also associated with a decrease in SSA (from 0.98 to 0.86), indicating the dominance of absorbing aerosols most likely black carbon and organic matter from biomass combustion. Lower SSA values are known to increase atmospheric absorption, thereby reducing the solar radiation that reaches the surface [51]. The accompanying change in AE from 1.32 (clean) to 1.20 (polluted) suggests a modest shift in aerosol size distribution, likely due to the contribution of both fine- and coarse-mode particles during the pollution event. The consequences of these aerosol characteristics are clearly reflected in the irradiance metrics.
From Figure 9 (b) GHI dropped from 237.92 W/m² on the clean day to 209.17 W/m² on the polluted day, while DNI experienced an even sharper decline from 193.33 W/m² to 154.44 W/m². These reductions represent losses of ~12% and ~20%, respectively, underscoring the greater susceptibility of DNI to aerosol extinction. This is consistent with radiative transfer modeling studies that show direct beam irradiance is particularly sensitive to increases in AOD and SSA changes [55].
Interestingly, DHI increased from 92.92 W/m² (clean) to 111.33 W/m² (polluted), highlighting the diffuse enhancement effect caused by aerosol scattering. Such an increase is typical when scattering aerosols dominate and is frequently observed in urban haze conditions, where radiation that would otherwise reach the surface directly is instead redistributed through multiple scattering processes. However, this increase in DHI does not fully compensate for the losses in DNI and GHI, confirming the net negative radiative effect of aerosols pollution episodes [56]. This clean-vs-polluted day comparison demonstrates the radiative signature of heavy aerosol loading and reaffirms the use of optical parameters such as AOD, SSA, and AE as reliable predictors of surface irradiance suppression. It also validates the time series results from Figure 8 and supports the development of aerosol-aware irradiance forecasting models, particularly for solar energy applications in haze-prone tropical regions.
3.5. Temporal and Statistical Insights into RFE of Solar Irradiance Components
In this study, Radiative Forcing Efficiency (RFE) is defined as the change in solar irradiance per unit increase in AOD, expressed in W/m² per unit AOD. A positive RFE value indicates that the irradiance component increases with aerosol loading, while a negative value denotes a decrease. For GHI and DNI, negative RFE values are typically expected under aerosol-dominated conditions due to extinction by scattering and absorption. In contrast, DHI may exhibit positive or negative RFE depending on aerosol type.
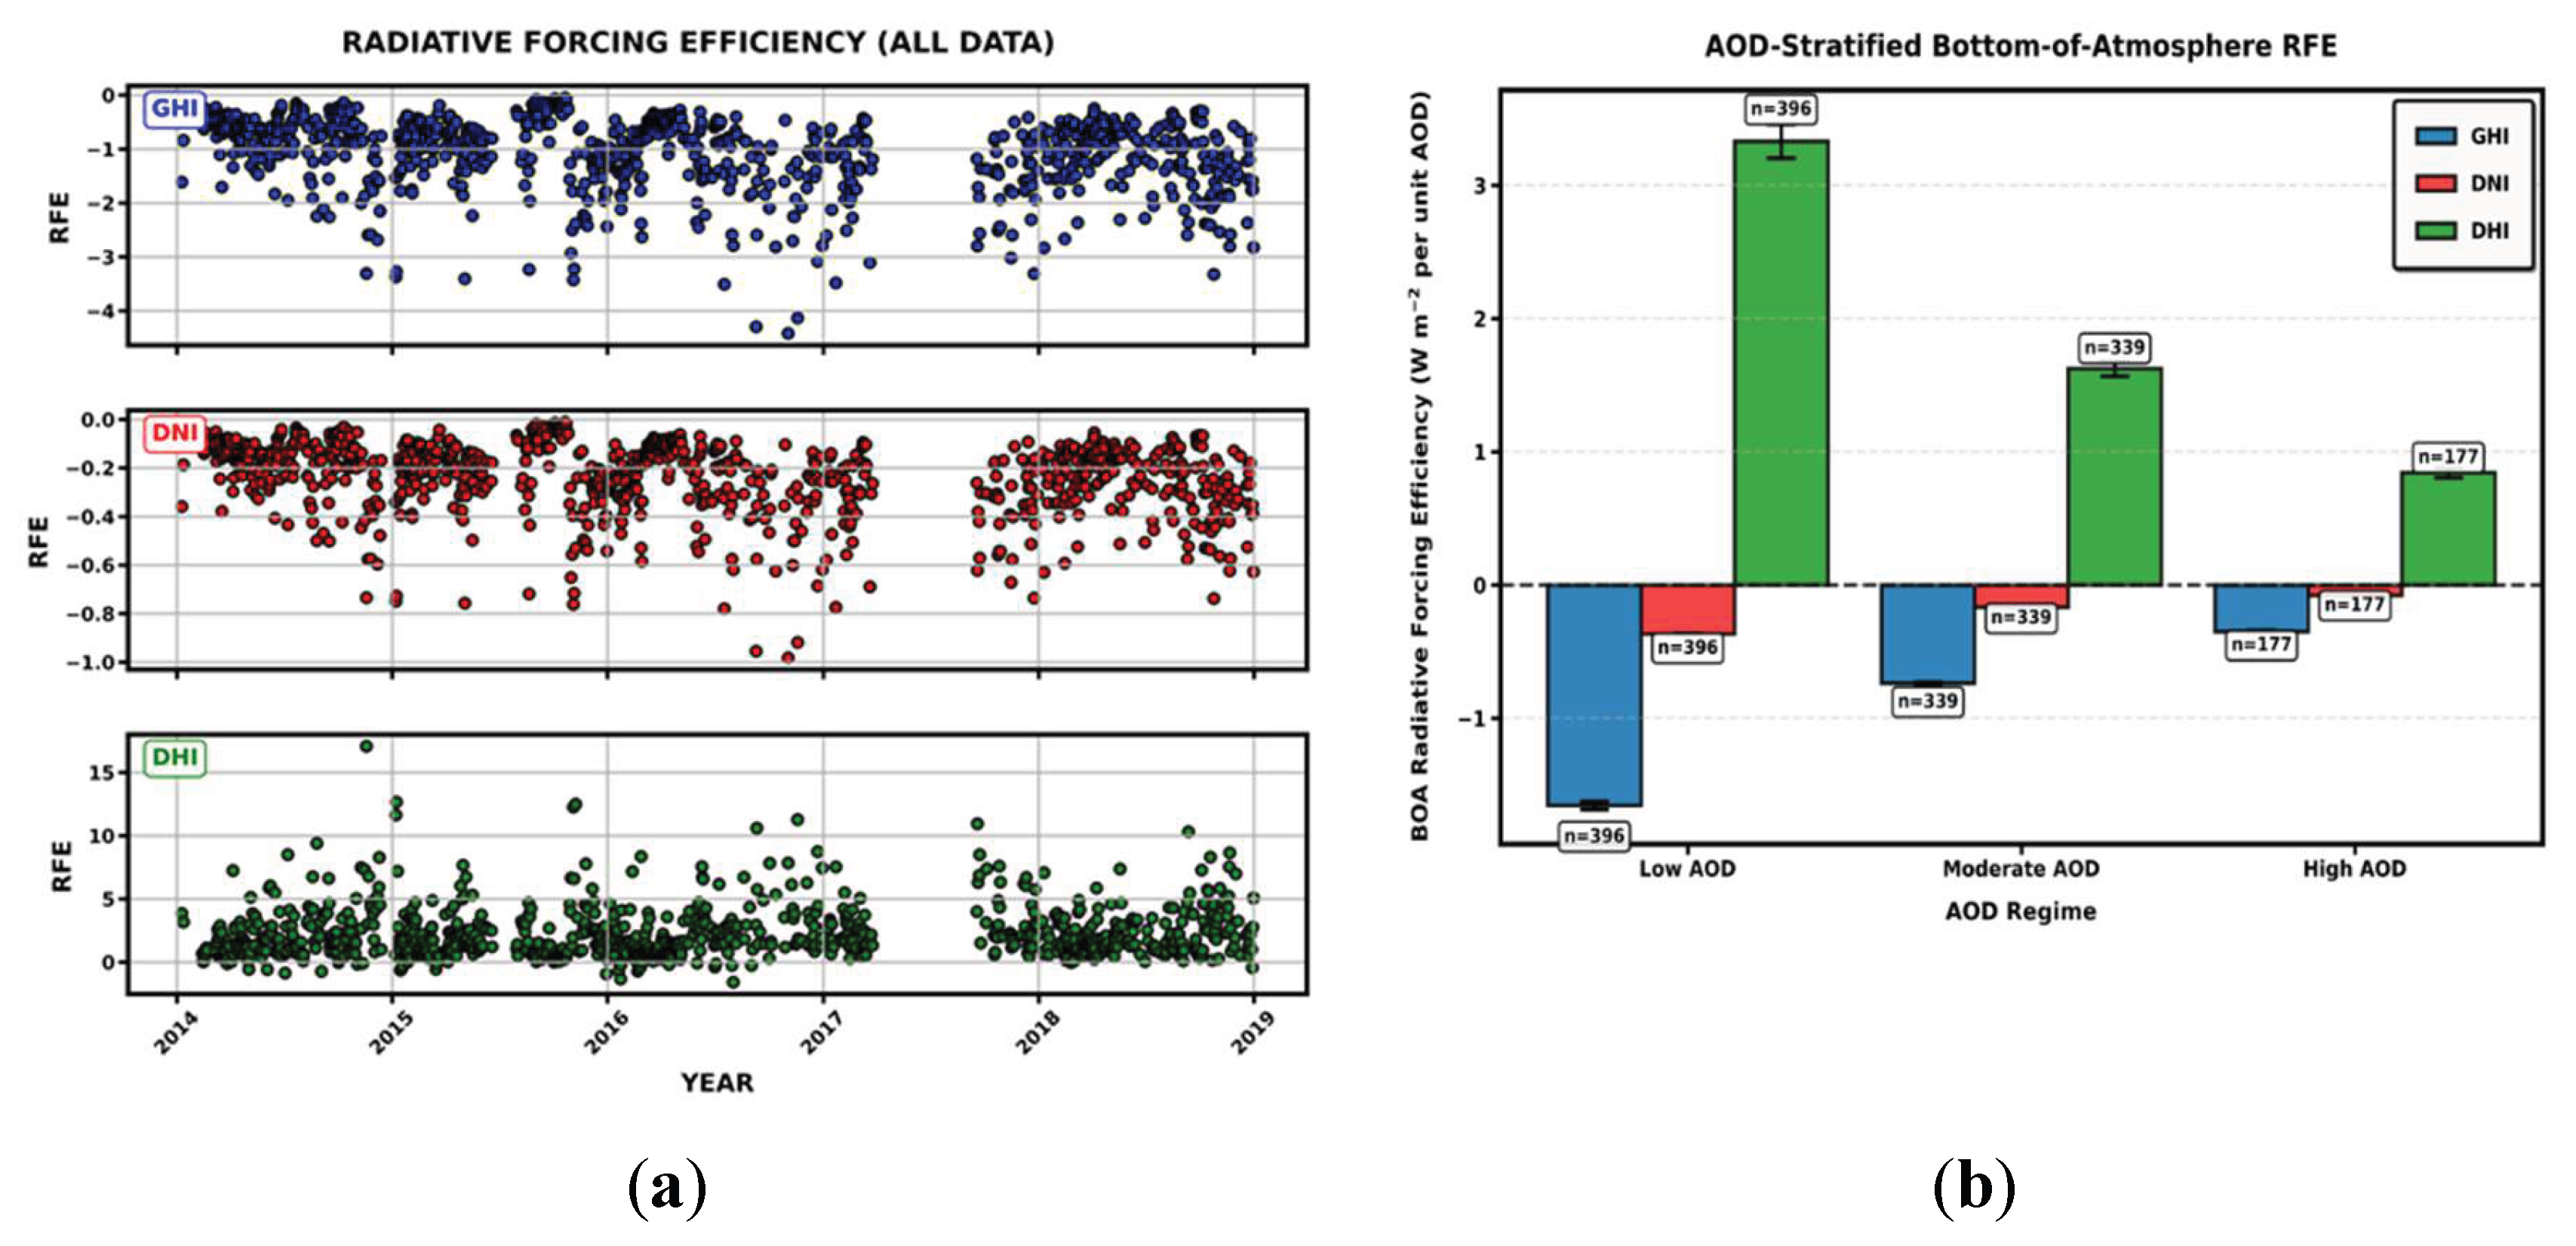
Figure 10a presents the temporal evolution of BOA-RFE derived from GHI, DNI, and DHI. By normalizing surface irradiance perturbations by aerosol optical depth, the RFE metric isolates the efficiency with which aerosols modify surface solar radiation, allowing intercomparison across periods characterized by different aerosol burdens and atmospheric conditions.
The top panel shows that GHI RFE is consistently negative throughout the study period, with values predominantly ranging between approximately −0.5 and −3.5 W m⁻² per unit AOD, and occasional excursions approaching −4 W m⁻² per unit AOD, particularly during 2016–2017. This persistent negative forcing indicates that aerosols systematically reduce the total solar energy reaching the surface. The strongest negative GHI RFE values coincide temporally with known high-aerosol periods in the region, including transboundary haze episodes. These enhanced negative excursions suggest that during such events, aerosols are not only more abundant but also more radiatively efficient in attenuating solar radiation, likely due to increased contributions from absorbing fine-mode particles. Periods of relatively stable or less negative RFE (e.g., early 2014 and parts of 2018) indicate conditions dominated by weaker aerosol–radiation interactions, consistent with cleaner atmospheric states [8].
The middle panel highlights that DNI RFE exhibits the strongest and most variable negative forcing among the three components. Values generally range from about −0.2 to −0.8 W m⁻² per unit AOD, with several pronounced minima reaching nearly −1.0 W m⁻² per unit AOD, particularly around 2015–2017. This enhanced sensitivity of DNI reflects the direct beam’s vulnerability to aerosol extinction through both scattering and absorption. The sharp negative spikes indicate episodic conditions under which aerosols especially absorbing and fine-mode particles severely attenuate the direct solar beam [57]. Compared to GHI, the narrower dynamic range but deeper negative excursions of DNI RFE underscore that aerosol radiative effects preferentially impact the direct component, a key result for solar energy and radiative transfer studies.
In contrast, the bottom panel shows that DHI RFE is predominantly positive, with typical values between 0 and 5 W m⁻² per unit AOD, and intermittent peaks reaching ~10–15 W m⁻² per unit AOD, particularly during 2014–2016. These positive values clearly demonstrate that aerosols enhance the diffuse component of surface irradiance through increased scattering. The episodic nature of the highest DHI RFE peaks suggests that aerosol type and microphysical properties play a decisive role: scattering-dominated aerosols and mixed aerosol populations enhance diffuse radiation most efficiently. The gradual decline in extreme DHI RFE magnitudes after 2017 is consistent with a reduction in intense scattering episodes, possibly reflecting interannual variability in aerosol sources and atmospheric conditions.
Overall, the temporal behavior of BOA RFE highlights the dual role of aerosols in reducing total surface solar irradiance while enhancing diffuse radiation in this tropical coastal environment. These findings have important implications for surface energy balance, atmospheric thermodynamics, and solar energy applications, particularly in regions where aerosol composition and loading exhibit strong temporal variability.
Figure 10b presents the (BOA RFE) stratified by AOD regimes for GHI, DNI, and DHI, providing a quantitative assessment of how aerosol loading modulates the efficiency of surface radiative perturbations. Unlike absolute forcing, this stratified RFE framework isolates the marginal radiative impact per unit aerosol loading, allowing a clearer interpretation of aerosol–radiation interactions across clean and polluted conditions [58].
For GHI, the BOA RFE is consistently negative across all AOD regimes, confirming that aerosols reduce total surface solar irradiance regardless of loading. However, the magnitude of this negative forcing efficiency decreases systematically with increasing AOD. Under low-AOD conditions, GHI RFE exhibits the strongest negative values (approximately −1.6 to −1.7 W m⁻² per unit AOD), while under moderate and high AOD conditions the magnitude weakens to around −0.7 and −0.3 W m⁻² per unit AOD, respectively. This progressive reduction in forcing efficiency indicates a non-linear aerosol–radiation response, where incremental increases in aerosol loading become less effective at further reducing surface irradiance once the atmosphere is already optically thick [59,60].
The DNI-based BOA RFE also remains negative across all AOD classes, reflecting the direct attenuation of the solar beam by aerosol extinction. Similar to GHI, the strongest DNI forcing efficiency occurs under low-AOD conditions (approximately −0.35 to −0.4 W m⁻² per unit AOD), with progressively weaker magnitudes under moderate and high AOD regimes. This behavior highlights that the direct beam is most sensitive to incremental aerosol loading in relatively clean atmospheres, whereas under polluted conditions the direct irradiance is already substantially diminished, limiting further reductions per unit AOD [51]. The comparatively smaller magnitude of DNI RFE relative to GHI further emphasizes the compensating role of diffuse radiation in the surface energy budget.
In contrast, the DHI-based BOA RFE is positive across all AOD regimes and exhibits the strongest dependence on aerosol loading. Under low-AOD conditions, DHI RFE reaches its maximum values (approximately 3.2–3.4 W m⁻² per unit AOD), indicating highly efficient enhancement of diffuse radiation per unit aerosol loading. As AOD increases to moderate and high regimes, DHI RFE decreases markedly, dropping to approximately 1.6 and 0.8 W m⁻² per unit AOD, respectively. This decline reflects a transition from efficient single and multiple scattering enhancement at low aerosol concentrations to a regime where absorption, forward scattering, and radiative saturation limit further diffuse gains. Such behavior is consistent with recent studies showing that diffuse enhancement efficiency peaks at moderate optical depths and diminishes as absorbing aerosol fractions and photon trapping increase under heavy pollution [61].
Overall, the AOD-stratified BOA RFE analysis demonstrates that aerosol radiative efficiency is highest under clean atmospheric conditions and decreases as aerosol loading increases. This finding has important implications for climate forcing assessments, solar energy applications, and air quality mitigation strategies, as it highlights that reductions in aerosol concentrations can yield disproportionately large radiative benefits in relatively clean environments compared to already polluted ones.
4. Conclusions
This study demonstrates that aerosol loading is the dominant control on bottom-of-atmosphere radiative forcing efficiency over Penang, Malaysia. Elevated aerosol conditions consistently suppress global horizontal and direct normal irradiance, with GHI RFE frequently below −3.5 W m⁻² per unit AOD and DNI exhibiting even stronger sensitivity, while diffuse irradiance is systematically enhanced through scattering-driven redistribution of solar energy. Forcing efficiency weakens nonlinearly with increasing aerosol optical depth, indicating radiative saturation under optically thick conditions. Clean–polluted day contrasts and seasonal analyses further confirm stronger negative forcing extremes during the Southwest and Post-Southwest monsoon periods, consistent with enhanced regional aerosol transport. Overall, the results highlight aerosol loading as the primary driver of surface radiative forcing in this tropical coastal environment, with aerosol optical properties acting as secondary modulators, carrying important implications for surface energy balance and solar resource assessments.
Acknowledgments
We acknowledge the AERONET program with financial support from FRGS grant, Investigation of the direct and semi-direct radiative effect of burning aerosols From AERONET and MPLNET data over Southeast Asian Maritime Continent, 203.PFIZIK.6711608.The authors gratefully acknowledge the NASA Langley Research Center for providing NASA POWER and MERRA-2 aerosol datasets used in this study. Special appreciation is extended to the Penang AERONET site principal investigators for maintaining high-quality ground-based observations and Nigerian TetFund for sponsoring and Paying the APC charges.. This research was supported by USM short term grant number 304/PFIZIK/6315382.
Conflicts of Interest
The authors declare no conflicts of interest.
References
- IPCC. Climate Change 2021: The Physical Science Basis. Contribution of Working Group I to the Sixth Assessment Report of the Intergovernmental Panel on Climate Change; Cambridge University Press: Cambridge, United Kingdom and New York, NY, USA, 2021. [Google Scholar]
- Haywood, J.M.; Boucher, O. Estimates of the Direct and Indirect Radiative Forcing Due to Tropospheric Aerosols: A Review. Rev. Geophys. 2000, 38, 513–543. [Google Scholar] [CrossRef]
- Lohmann, U.; Feichter, J. Global Indirect Aerosol Effects: A Review. Atmos. Chem. Phys. 2005, 5, 715–737. [Google Scholar] [CrossRef]
- Gueymard, C.A. Importance of Atmospheric Turbidity and Associated Uncertainties in Solar Radiation Modeling. Energy 2005, 30, 1603–1615. [Google Scholar] [CrossRef]
- Eck, T.F.; Holben, B.N.; Reid, J.S.; Dubovik, O.; Smirnov, A.; O’Neill, N.T.; Slutsker, I.; Kinne, S. Wavelength Dependence of the Optical Depth of Biomass Burning, Urban, and Desert Dust Aerosols. J. Geophys. Res. Atmos. 1999, 104, 31333–31349. [Google Scholar] [CrossRef]
- Dubovik, O.; King, M.D. A Flexible Inversion Algorithm for Retrieval of Aerosol Optical Properties from Sun and Sky Radiance Measurements. J. Geophys. Res. Atmos. 2000, 105, 20673–20696. [Google Scholar] [CrossRef]
- Li, Z.; Lau, W.K.-M.; Ramanathan, V.; Wu, G.; Ding, Y.; Manoj, M.G.; Liu, J.; Qian, Y.; Li, J.; Zhou, T.; et al. Aerosol and Monsoon Climate Interactions Over Asia. Rev. Geophys. 2016, 54, 866–929. [Google Scholar] [CrossRef]
- Khatri, P.; Takamura, T. Aerosol Direct Radiative Forcing Estimation Using Ground-Based Spectral Radiation and AERONET Data. Atmos. Environ. 2009, 43, 5830–5837. [Google Scholar] [CrossRef]
- Kazadzis, S.; Kouremeti, N.; Nyeki, S.; Gröbner, J.; Wehrli, C. Aerosol Direct Radiative Effect from Ground-Based Spectral Measurements at a European Urban Site. Atmos. Environ. 2018, 187, 46–57. [Google Scholar] [CrossRef]
- Juneng, L.; Latif, M.T.; Tangang, F.T.; Mansor, H. The Influence of Synoptic-Scale Atmospheric Circulation on Transboundary Smoke Haze in Southeast Asia. Atmos. Environ. 2009, 43, 4180–4189. [Google Scholar] [CrossRef]
- Abdullah, K.; Mispan, M.R.; Ali, M.H. Impact of Haze Pollution on the Global Solar Radiation in Peninsular Malaysia. Atmos. Environ. 2012, 62, 270–277. [Google Scholar] [CrossRef]
- Tangang, F.T.; Juneng, L.; Ahmad, S. Trend and Interannual Variability of Temperature in Malaysia: 1961–2003. Theor. Appl. Climatol. 2007, 92, 307–316. [Google Scholar] [CrossRef]
- Holben, B.N.; Eck, T.F.; Slutsker, I.; Tanré, D.; Buis, J.P.; Setzer, A.; Vermote, E.; Reagan, J.A.; Kaufman, Y.J.; Nakajima, T.; et al. AERONET—A Federated Instrument Network and Data Archive for Aerosol Characterization. Remote Sens. Environ. 1998, 66, 1–16. [Google Scholar] [CrossRef]
- Dubovik, O.; Sinyuk, A.; Lapyonok, T.; Holben, B.N.; Mishchenko, M.; Yang, P.; Eck, T.F.; Volten, H.; Muñoz, O.; Veihelmann, B.; et al. Application of Spheroid Models to Account for Aerosol Particle Non-Sphericity in Remote Sensing of Desert Dust. J. Geophys. Res. Atmos. 2006, 111, D11208. [Google Scholar] [CrossRef]
- Stackhouse, P.W.; Zhang, T.; Westberg, D.; Barnett, A.J.; Bristow, T.; Macpherson, B.; Hoell, J.M. The NASA POWER Project: Data, Tools, and Applications. Earth Space Sci. 2018, 5, 409–429. [Google Scholar] [CrossRef]
- Yang, D.; Bright, J.M.; Gueymard, C.A. Worldwide Validation of 8 Satellite-Derived and Reanalysis Solar Radiation Products: A Preliminary Evaluation and Overall Metrics for Hourly Data Over 27 Years. Sol. Energy 2020, 210, 3–19. [Google Scholar] [CrossRef]
- Stackhouse, P.W.; Whitlock, C.H.; Pinker, R.T. Surface Radiation Budget and Climate Data from NASA’s POWER Project. In Proceedings of the 2006 International Radiation Symposium (IRS2006), Busan, Korea, 24–29 August 2006; pp. 25–29. [Google Scholar]
- Randles, C.A.; da Silva, A.M.; Buchard, V.; Colarco, P.R.; Darmenov, A.; Govindaraju, R.; Smirnov, A.; Holben, B.; Ferrare, R.; Hair, J.; et al. The MERRA-2 Aerosol Reanalysis, 1980 Onward. Geosci. Model Dev. 2017, 10, 4477–4495. [Google Scholar] [CrossRef]
- Buchard, V.; da Silva, A.M.; Randles, C.A.; Colarco, P.R.; Ferrare, R.; Hair, J.; Hostetler, C.; Tackett, J.; Winker, D. The MERRA-2 Aerosol Reanalysis, 1980 Onward. Part II: Evaluation and Case Studies. J. Clim. 2017, 30, 6851–6872. [Google Scholar] [CrossRef] [PubMed]
- Gueymard, C.A. Clear-Sky Irradiance Predictions for Solar Resource Mapping and Large-Scale Applications: Improved Validation Methodology and Detailed Performance Analysis of 18 Broadband Radiative Models. Sol. Energy 2012, 86, 2145–2169. [Google Scholar] [CrossRef]
- Reno, M.J.; Hansen, C.W.; Stein, J.S. Global Horizontal Irradiance Clear Sky Models: Implementation and Analysis (Report No. SAND2012-2389); Sandia National Laboratories: Albuquerque, NM, USA, 2012. [Google Scholar]
- Ramachandran, S.; Kedia, S. Aerosol Radiative Forcing Over India: Regional and Seasonal Variations. Aerosol Air Qual. Res. 2012, 12, 1017–1030. [Google Scholar] [CrossRef]
- Juneng, L.; Latif, M.T.; Tangang, F.T.; Hwee, S.L. Study of the 2005 Haze Episode Over Peninsular Malaysia Using the Air Quality Monitoring Data. Atmos. Environ. 2011, 45, 5131–5138. [Google Scholar] [CrossRef]
- Stackhouse, P.W.; Zhang, T.; Chandler, W.S. NASA POWER: Prediction of Worldwide Energy Resource Data for Assessing Renewable Energy and Climate; NASA Langley Research Center: Hampton, VA, USA, 2018. [Google Scholar]
- Schuster, G.L.; Dubovik, O.; Holben, B.N. Angstrom Exponent and Bimodal Aerosol Size Distributions. J. Geophys. Res. Atmos. 2006, 111, D07207. [Google Scholar] [CrossRef]
- Wild, M. Decadal Changes in Radiative Fluxes at Land and Ocean Surfaces and Their Relevance for Global Warming. Wiley Interdiscip. Rev. Clim. Chang. 2016, 7, 91–107. [Google Scholar] [CrossRef]
- ASEAN Specialised Meteorological Centre (ASMC). Haze Monitoring and Hotspot Information; ASMC: Singapore, 2023. [Google Scholar]
- Zhang, Z.; Li, J.; Che, H.; Dong, Y.; Dubovik, O.; Eck, T.F.; Gupta, P.; Holben, B.N.; Kim, J.; Lind, E.; et al. Long-Term Trends in Aerosol Properties Derived from AERONET Measurements. EGUsphere 2024, 1–45. [Google Scholar] [CrossRef]
- Dubovik, O.; Holben, B.N.; Eck, T.F.; Smirnov, A.; Kaufman, Y.J.; King, M.D.; Tanré, D.; Slutsker, I. Variability of Absorption and Optical Properties of Key Aerosol Types Observed in Worldwide Locations. J. Atmos. Sci. 2002, 59, 590–608. [Google Scholar] [CrossRef]
- Chin, M.; Rood, R.B.; Lin, S.J.; Muller, J.F.; Thompson, A.M. Atmospheric Sulfur Cycle Simulated in the Global Model GOCART: Model Description and Global Properties. J. Geophys. Res. Atmos. 2000, 105, 24671–24687. [Google Scholar] [CrossRef]
- Field, R.D.; van der Werf, G.R.; Fanin, T.; Fetzer, E.J.; Fuller, R.; Jethva, H.; Levy, R.; Livesey, N.J.; Luo, M.; Torres, O.; et al. Indonesian Fire Activity and Smoke Pollution in 2015 Show Persistent Nonlinear Sensitivity to El Niño-Induced Drought. Proc. Natl. Acad. Sci. USA 2016, 113, 9204–9209. [Google Scholar] [CrossRef]
- Chang, C.P.; Wang, Z.; McBride, J.; Liu, C.H. The East Asian Monsoon; World Scientific: Singapore, 2005. [Google Scholar]
- Schuster, G.L.; Dubovik, O.; Holben, B.N. Angstrom Exponent and Bimodal Aerosol Size Distributions. J. Geophys. Res. Atmos. 2006, 111, D07207. [Google Scholar] [CrossRef]
- Prospero, J.M.; Lamb, P.J. African Droughts and Dust Transport to the Caribbean: Climate Change Implications. Science. 2003, 302, 1024–1027. [Google Scholar] [CrossRef]
- Foyo-Moreno, I.; Lozano, I.L.; Alados, I.; Guerrero-Rascado, J.L. A New Method to Estimate Aerosol Radiative Forcing on Photosynthetically Active Radiation. Atmos. Res. 2023, 291, 106819. [Google Scholar] [CrossRef]
- Lorenzo, G.R.; Arellano, A.F.; Cambaliza, M.O.; Castro, C.; Cruz, M.T.; Di Girolamo, L.; Gacal, G.F.; Hilario, M.R.A.; Lagrosas, N.; Ong, H.J.; et al. An Emerging Aerosol Climatology via Remote Sensing over Metro Manila, the Philippines. Atmos. Chem. Phys. 2023, 23, 10579–10608. [Google Scholar] [CrossRef]
- Kazadzis, S.; Kouremeti, N.; Bais, A. Solar Irradiance and Aerosol Variability over Southeast Asia: Impact of Haze Events on Radiation and Cloud Properties. Atmos. Environ. 2018, 187, 380–394. [Google Scholar] [CrossRef]
- Gatebe, C.K.; King, M.D. Influence of Aerosols and Clouds on the Amount of Solar Radiation Reaching the Surface. Remote Sens. 2016, 8, 777. [Google Scholar] [CrossRef]
- Li, Z.; Guo, J.; Ding, A.; Liao, H.; Liu, J.; Sun, Y.; Wang, T.; Xue, H.; Zhang, H.; Zhu, B. Aerosol and Solar Energy in China: Current Status and Future Perspectives. Sci. Bull. 2017, 62, 776–788. [Google Scholar] [CrossRef]
- Xia, X. Spatiotemporal Variation of Aerosol Optical Depth and Its Relationship to Radiative Forcing over China. Atmos. Environ. 2010, 44, 2370–2376. [Google Scholar] [CrossRef]
- Kazadzis, S.; Kouremeti, N.; Gerasopoulos, E.; Vourtisi, V.; Psiloglou, B.; Nyeki, S. Solar Irradiance Under Clear and Cloudy Conditions Based on Measurements and Model Simulations. Atmos. Res. 2018, 208, 123–135. [Google Scholar] [CrossRef]
- Kudo, R.; Nishizawa, T.; Aoyagi, T. Effect of Aerosol Optical Properties on Diffuse and Direct Solar Radiation in the Presence of Biomass Burning Smoke. Atmos. Environ. 2012, 50, 120–127. [Google Scholar] [CrossRef]
- Satheesh, S.K.; Ramanathan, V. Large Differences in Tropical Aerosol Forcing at the Top of the Atmosphere and Earth’s Surface. Nature 2000, 405, 60–63. [Google Scholar] [CrossRef] [PubMed]
- Ramanathan, V.; Carmichael, G. Global and Regional Climate Changes Due to Black Carbon. Nat. Geosci. 2008, 1, 221–227. [Google Scholar] [CrossRef]
- Tegen, I.; Neubauer, D.; Ferrachat, S.; Siegenthaler-Le Drian, C.; Bey, I.; Schutgens, N.; Stier, P.; Watson-Parris, D.; Stanelle, T.; Schmidt, H.; et al. The Global Aerosol–Climate Model ECHAM6.3–HAM2.3 – Part 1: Aerosol Evaluation. Geosci. Model Dev. 2019, 12, 1643–1677. [Google Scholar] [CrossRef]
- Li, F.; Zhou, Y.; Zhang, L.; Wang, X.; Wang, S. Influence of Marine Aerosols on Surface Solar Radiation over Coastal Regions. Atmos. Res. 2020, 235, 104759. [Google Scholar] [CrossRef]
- Long, C.N.; Ackerman, T.P. Identification of Clear Skies from Broadband Pyranometer Measurements and Calculation of Downwelling Shortwave Cloud Effects. J. Geophys. Res. Atmos. 2000, 105, 15609–15626. [Google Scholar] [CrossRef]
- Stackhouse, P.W.; Zhang, T.; Westberg, D.; Barnett, A.J.; Bristow, T.; Macpherson, B.; Hoell, J.M. The NASA POWER Project: Data Access and Tools for Renewable Energy Applications. Earth Space Sci. 2018, 4, 409–419. [Google Scholar] [CrossRef]
- Bright, J.M.; Engerer, N.A.; Killinger, S.; Suri, M. Global Validation of the CAMS Radiation Service. Sol. Energy 2017, 154, 396–413. [Google Scholar] [CrossRef]
- Schwarz, J.P.; Gao, R.S.; Fahey, D.W.; Thomson, D.S.; Watts, L.A.; Wilson, J.C.; Reeves, J.M.; Darbeheshti, M.; Baumgardner, D.G.; Kok, G.L.; et al. Radiative Impacts of Absorbing Aerosols in Cloudy Environments. Geophys. Res. Lett. 2010, 37, L17805. [Google Scholar] [CrossRef]
- Bond, T.C.; Doherty, S.J.; Fahey, D.W.; Forster, P.M.; Berntsen, T.; DeAngelo, B.J.; Flanner, M.G.; Ghan, S.; Kärcher, B.; Koch, D.; et al. Bounding the Role of Black Carbon in the Climate System: A Scientific Assessment. J. Geophys. Res. Atmos. 2013, 118, 5380–5552. [Google Scholar] [CrossRef]
- Jacobson, M.Z. Strong Radiative Heating Due to the Mixing State of Black Carbon in Atmospheric Aerosols. Nature. 2001, 409, 695–697. [Google Scholar] [CrossRef]
- Schwarz, J.P.; Gao, R.S.; Fahey, D.W.; Thomson, D.S.; Watts, L.A.; Wilson, J.C.; Reeves, J.M.; Darbeheshti, M.; Baumgardner, D.G.; Kok, G.L.; et al. Radiative Impacts of Absorbing Aerosols in Cloudy Environments. Geophys. Res. Lett. 2010, 37, L17805. [Google Scholar] [CrossRef]
- Reid, J.S.; Hyer, E.J.; Johnson, R.S.; Holben, B.N.; Yokelson, R.J.; Zhang, J.; Campbell, J.R.; Christopher, S.A.; Di Girolamo, L.; Giglio, L.; et al. Observing and Understanding the Southeast Asian Aerosol System by Remote Sensing: An Initial Review and Analysis for the Seven Southeast Asian Studies (7SEAS) Program. Atmos. Res. 2013, 122, 403–468. [Google Scholar] [CrossRef]
- Ramachandran, S.; Kedia, S. Black Carbon Aerosols Over an Urban Region and a High-Altitude Remote Site: Characteristics, Radiative Effects and Divergence. Atmos. Environ. 2010, 44, 3644–3652. [Google Scholar] [CrossRef]
- Babu, S.S.; Satheesh, S.K.; Moorthy, K.K. Aerosol Radiative Forcing Due to Enhanced Black Carbon at an Urban Site in India. Geophys. Res. Lett. 2002, 29, 101-1–101-4. [Google Scholar] [CrossRef]
- Ying, T.; Li, J.; Fu, Q.; Liu, G.; Zhang, L.; Xia, Y.; Hu, Y. Fractional Change of Scattering and Absorbing Aerosols Contributes to Northern Hemisphere Hadley Circulation Expansion. Sci. Adv. 2024, 10, eadq9716. [Google Scholar] [CrossRef] [PubMed]
- Li, Z.; Wang, Y.; Guo, J.; Zhao, C.; Cribb, M.C.; Dong, X.; Fan, J.; Gong, D.; Huang, J.; Jiang, M.; et al. East Asian Study of Tropospheric Aerosols and Their Impact on Regional Clouds, Precipitation, and Climate (EAST-AIRᶜP). Bull. Am. Meteorol. Soc. 2022, 103, E301–E335. [Google Scholar] [CrossRef]
- Bellouin, N.; Quaas, J.; Gryspeerdt, E.; Kinne, S.; Stier, P.; Watson-Parris, D.; Boucher, O.; Carslaw, K.S.; Christensen, M.; Daniau, A.-L.; et al. Bounding Global Aerosol Radiative Forcing of Climate Change. Rev. Geophys. 2020, 58, e2019RG000660. [Google Scholar] [CrossRef] [PubMed]
- Samset, B.H.; Sand, M.; Smith, C.J.; Bauer, S.E.; Forster, P.M.; Fuglestvedt, J.S.; Osprey, S.; Schleussner, C.-F. Climate Impacts from a Removal of Anthropogenic Aerosol Emissions. Geophys. Res. Lett. 2018, 45, 1020–1029. [Google Scholar] [CrossRef]
- Yang, Y.; Zhao, C.; Wang, Q.; Cong, Z.; Yang, X.; Fan, H. Aerosol Radiative Forcing and Efficiency in the Heavily Polluted North China Plain: Insights from Measurements of Aerosol Optical Properties. J. Geophys. Res. Atmos. 2020, 125, e2019JD031668. [Google Scholar] [CrossRef]
Figure 1.
Map of Penang Showing Aeronet Site Location, https://aeronet.gsfc.nasa.gov/.
Figure 1.
Map of Penang Showing Aeronet Site Location, https://aeronet.gsfc.nasa.gov/.
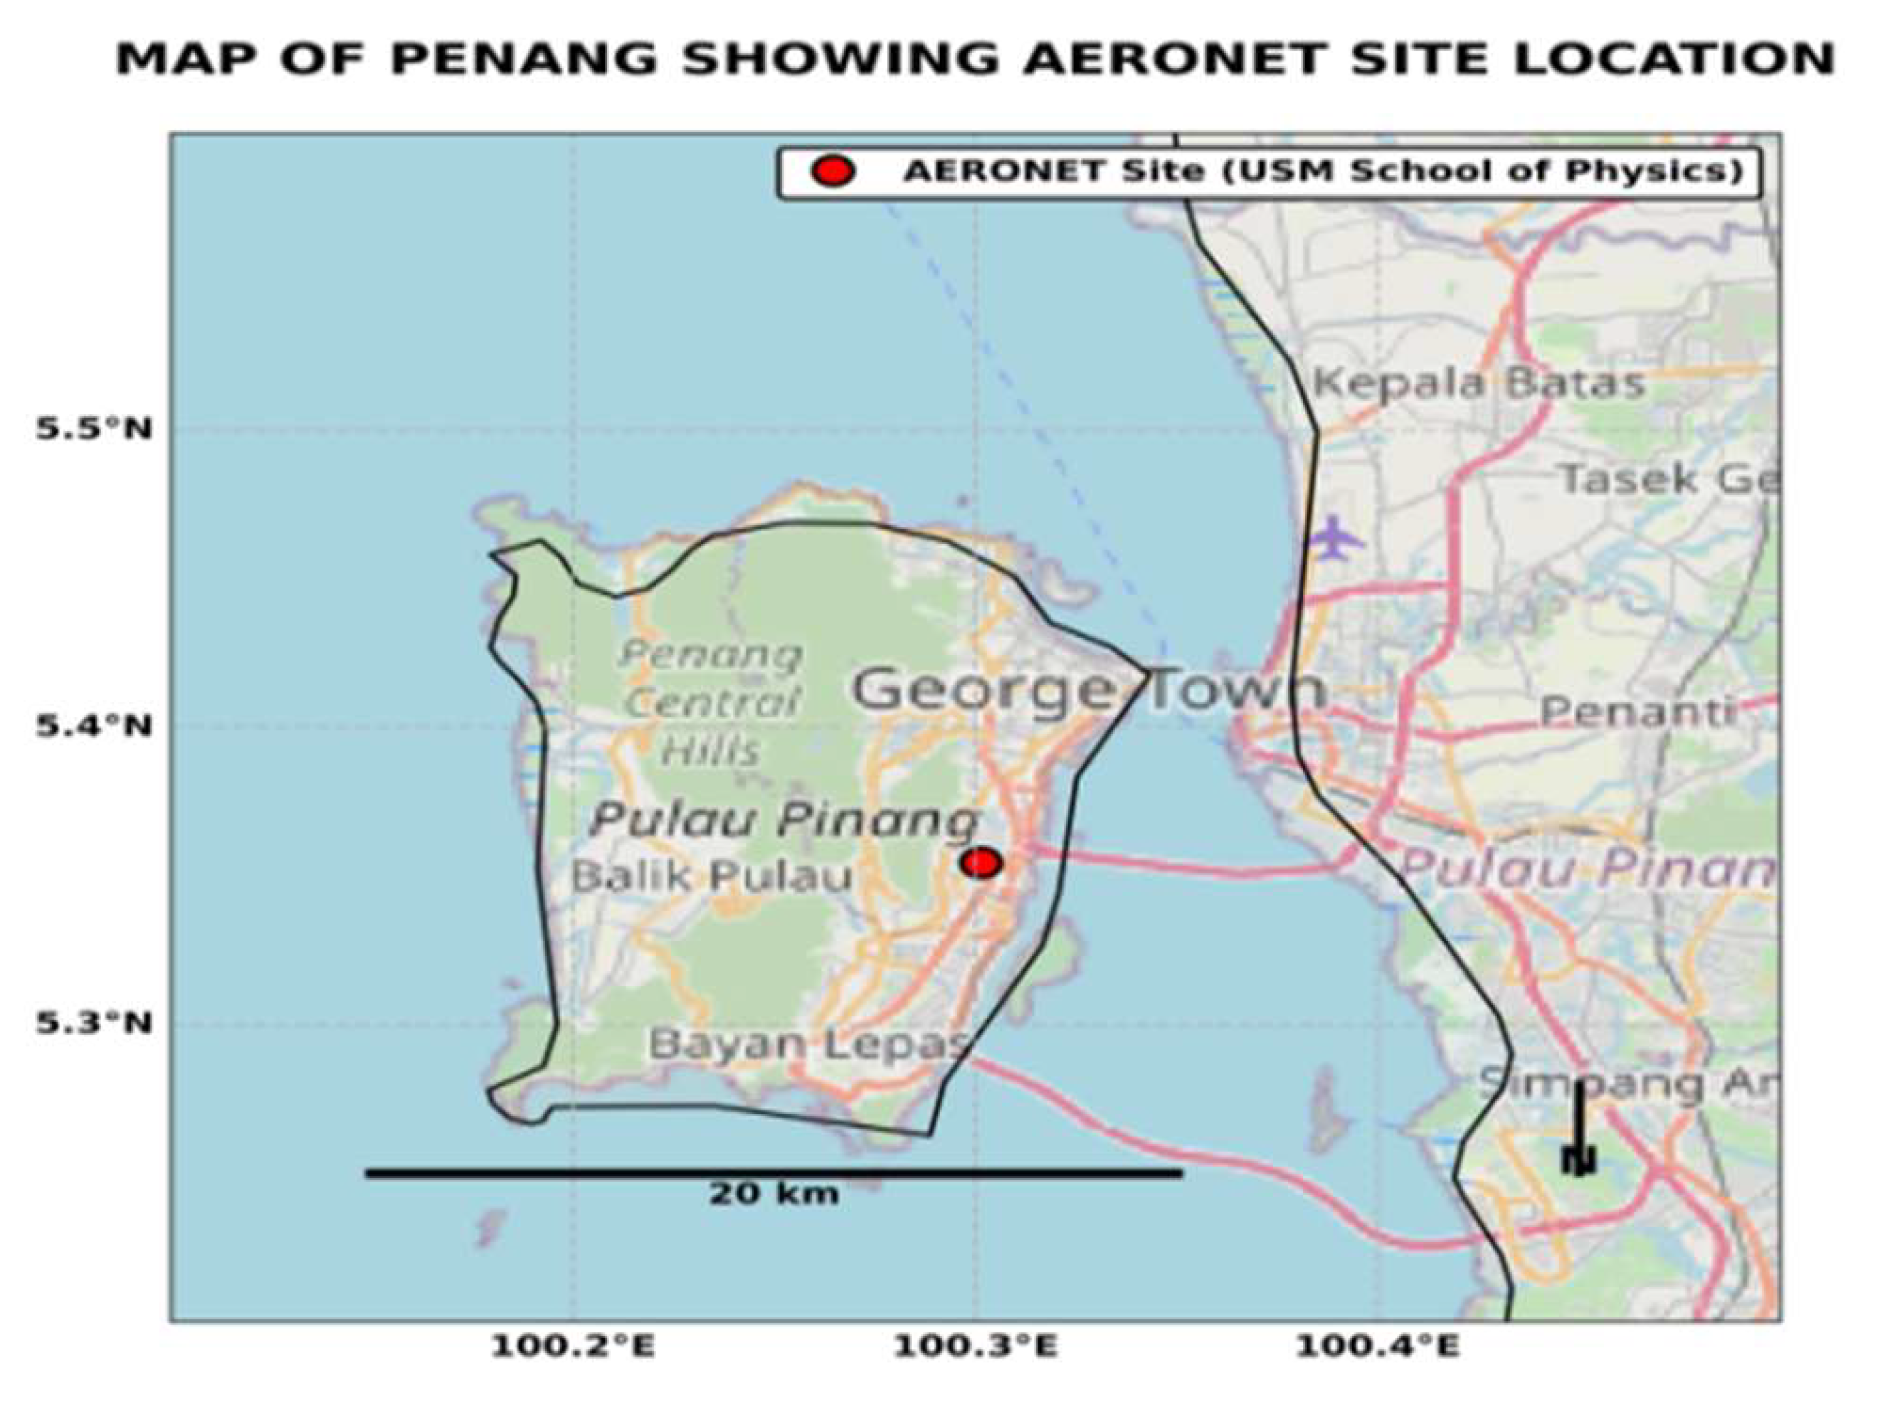
Figure 2.
Time series of AOD at 870 nm (top), 675 nm (middle), and 440 nm (bottom) over Penang from 2014 to 2018.
Figure 2.
Time series of AOD at 870 nm (top), 675 nm (middle), and 440 nm (bottom) over Penang from 2014 to 2018.
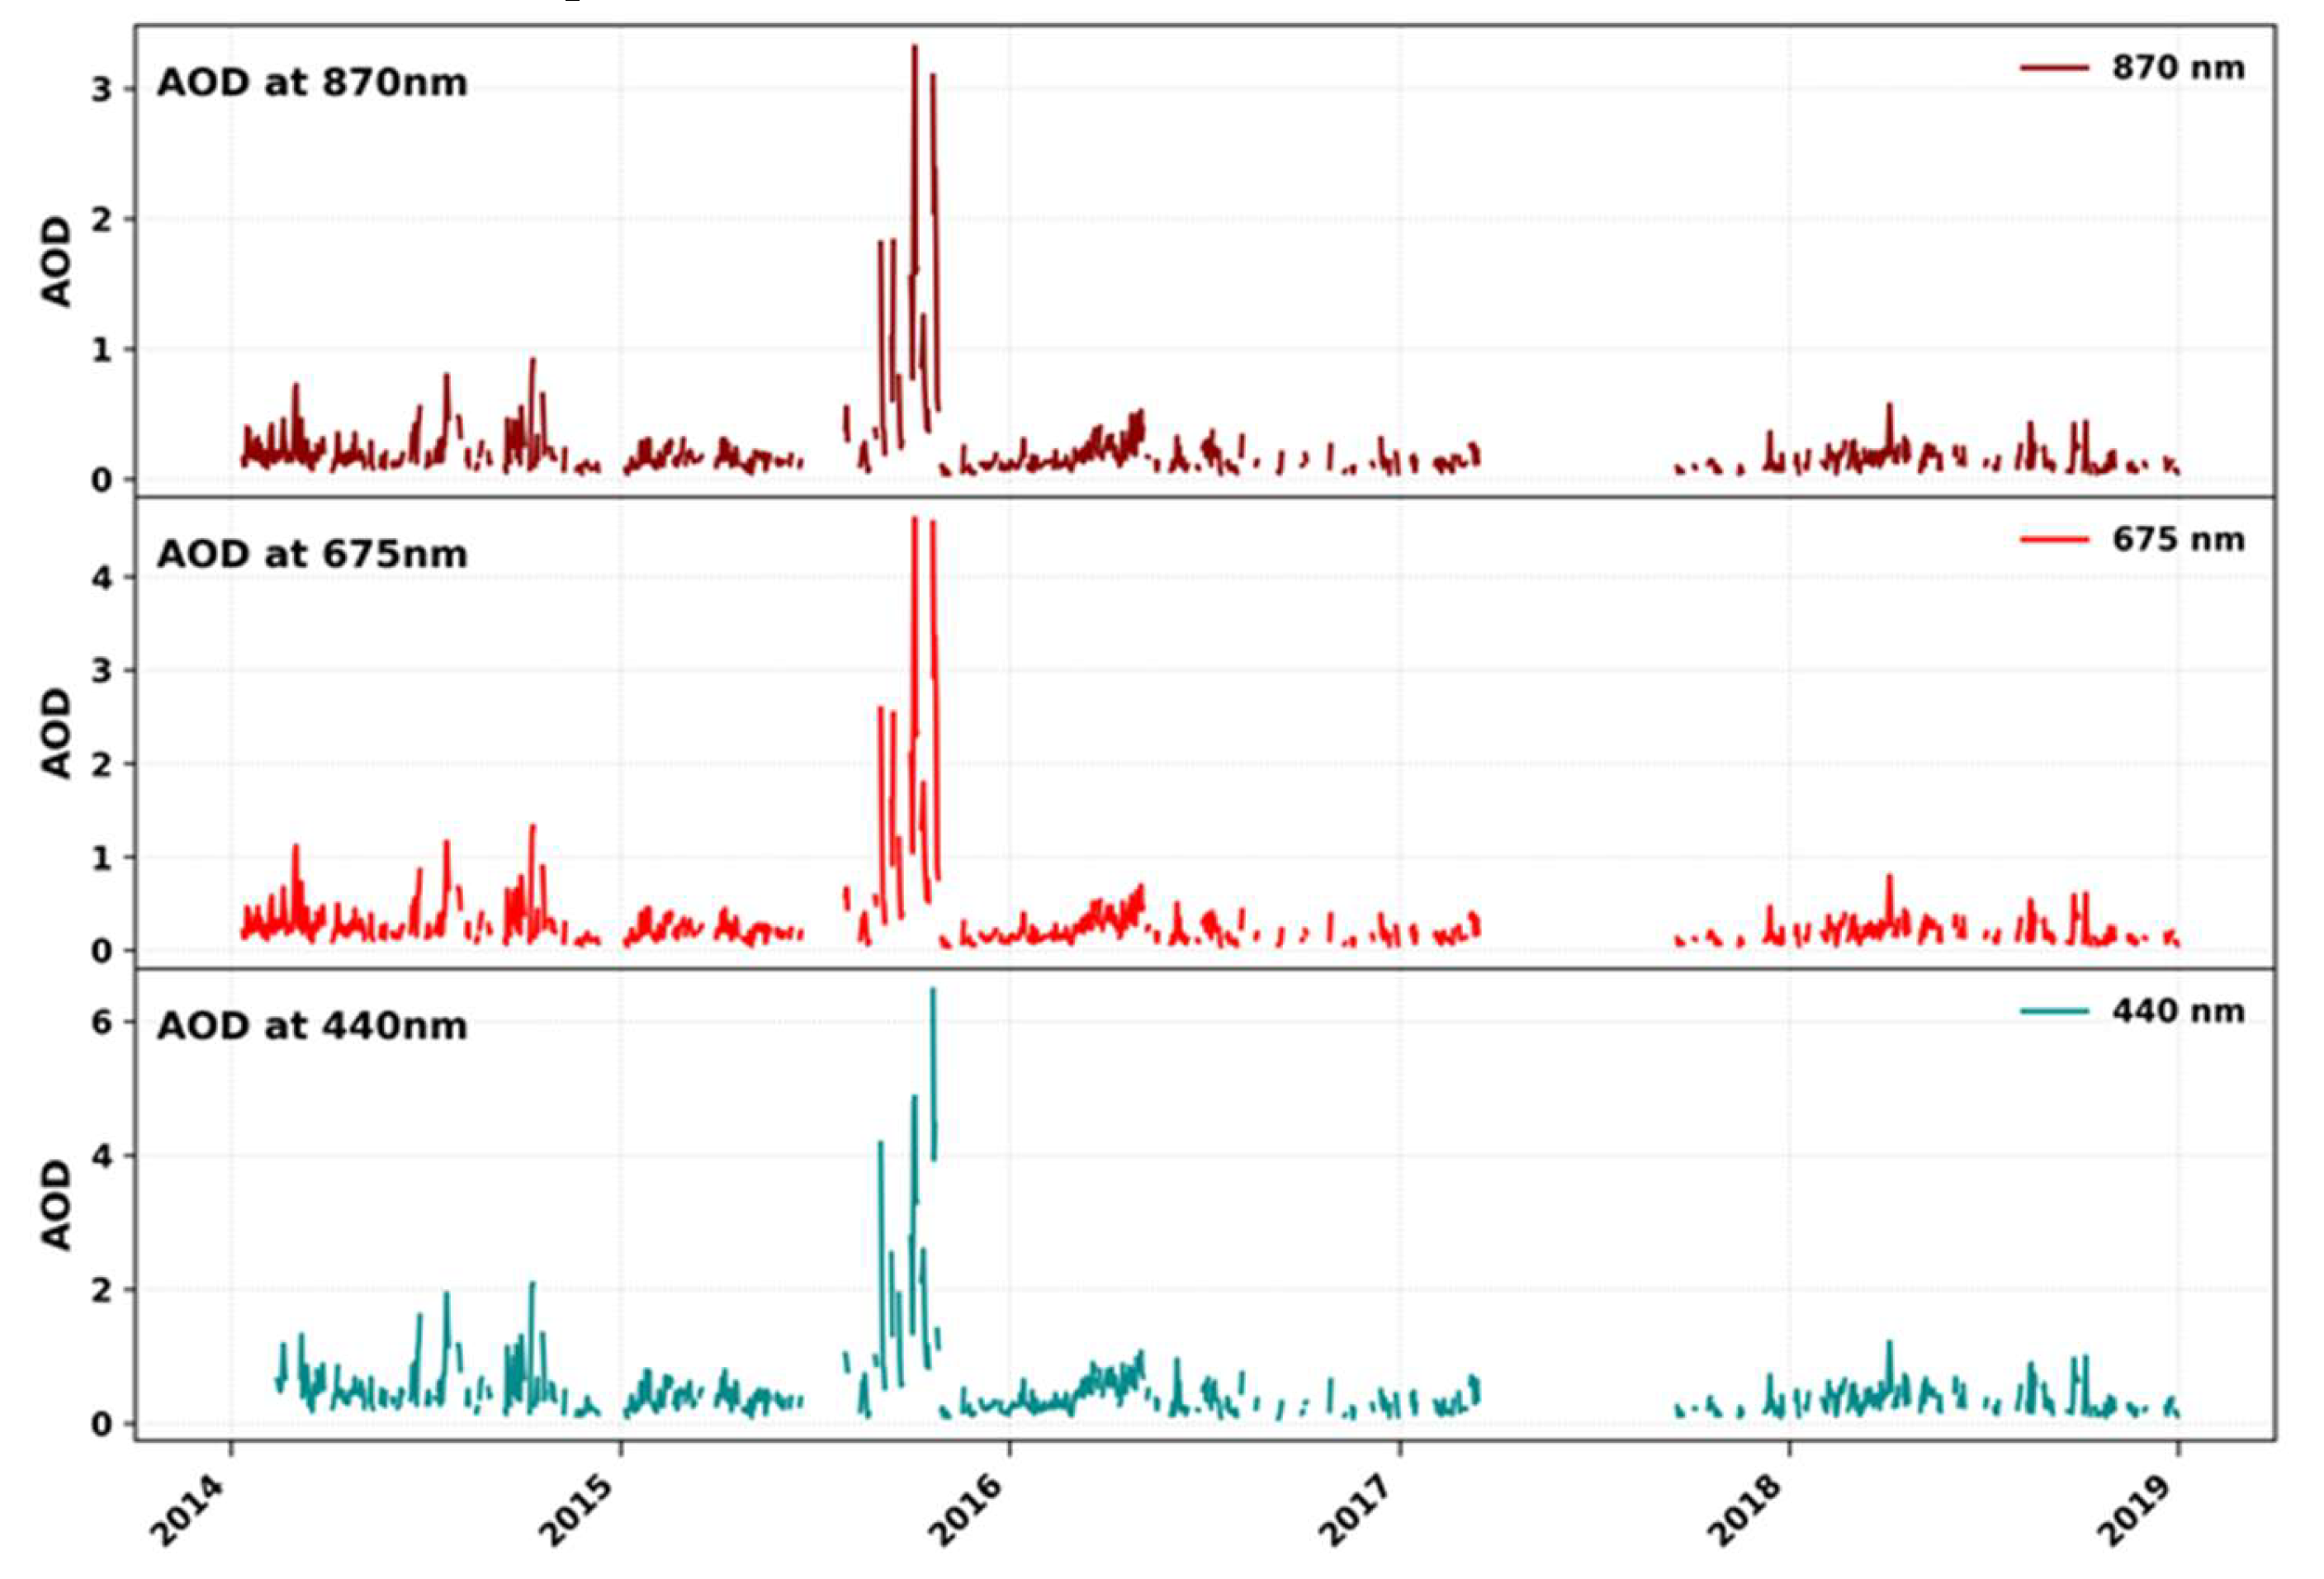
Figure 3.
(a) Time series of Angstrom Exponent (440–870 nm) from AERONET (2014–2018). (b) Single Scattering Albedo (SSA) at 440 nm, 675 nm, and 870 nm over Penang.
Figure 3.
(a) Time series of Angstrom Exponent (440–870 nm) from AERONET (2014–2018). (b) Single Scattering Albedo (SSA) at 440 nm, 675 nm, and 870 nm over Penang.
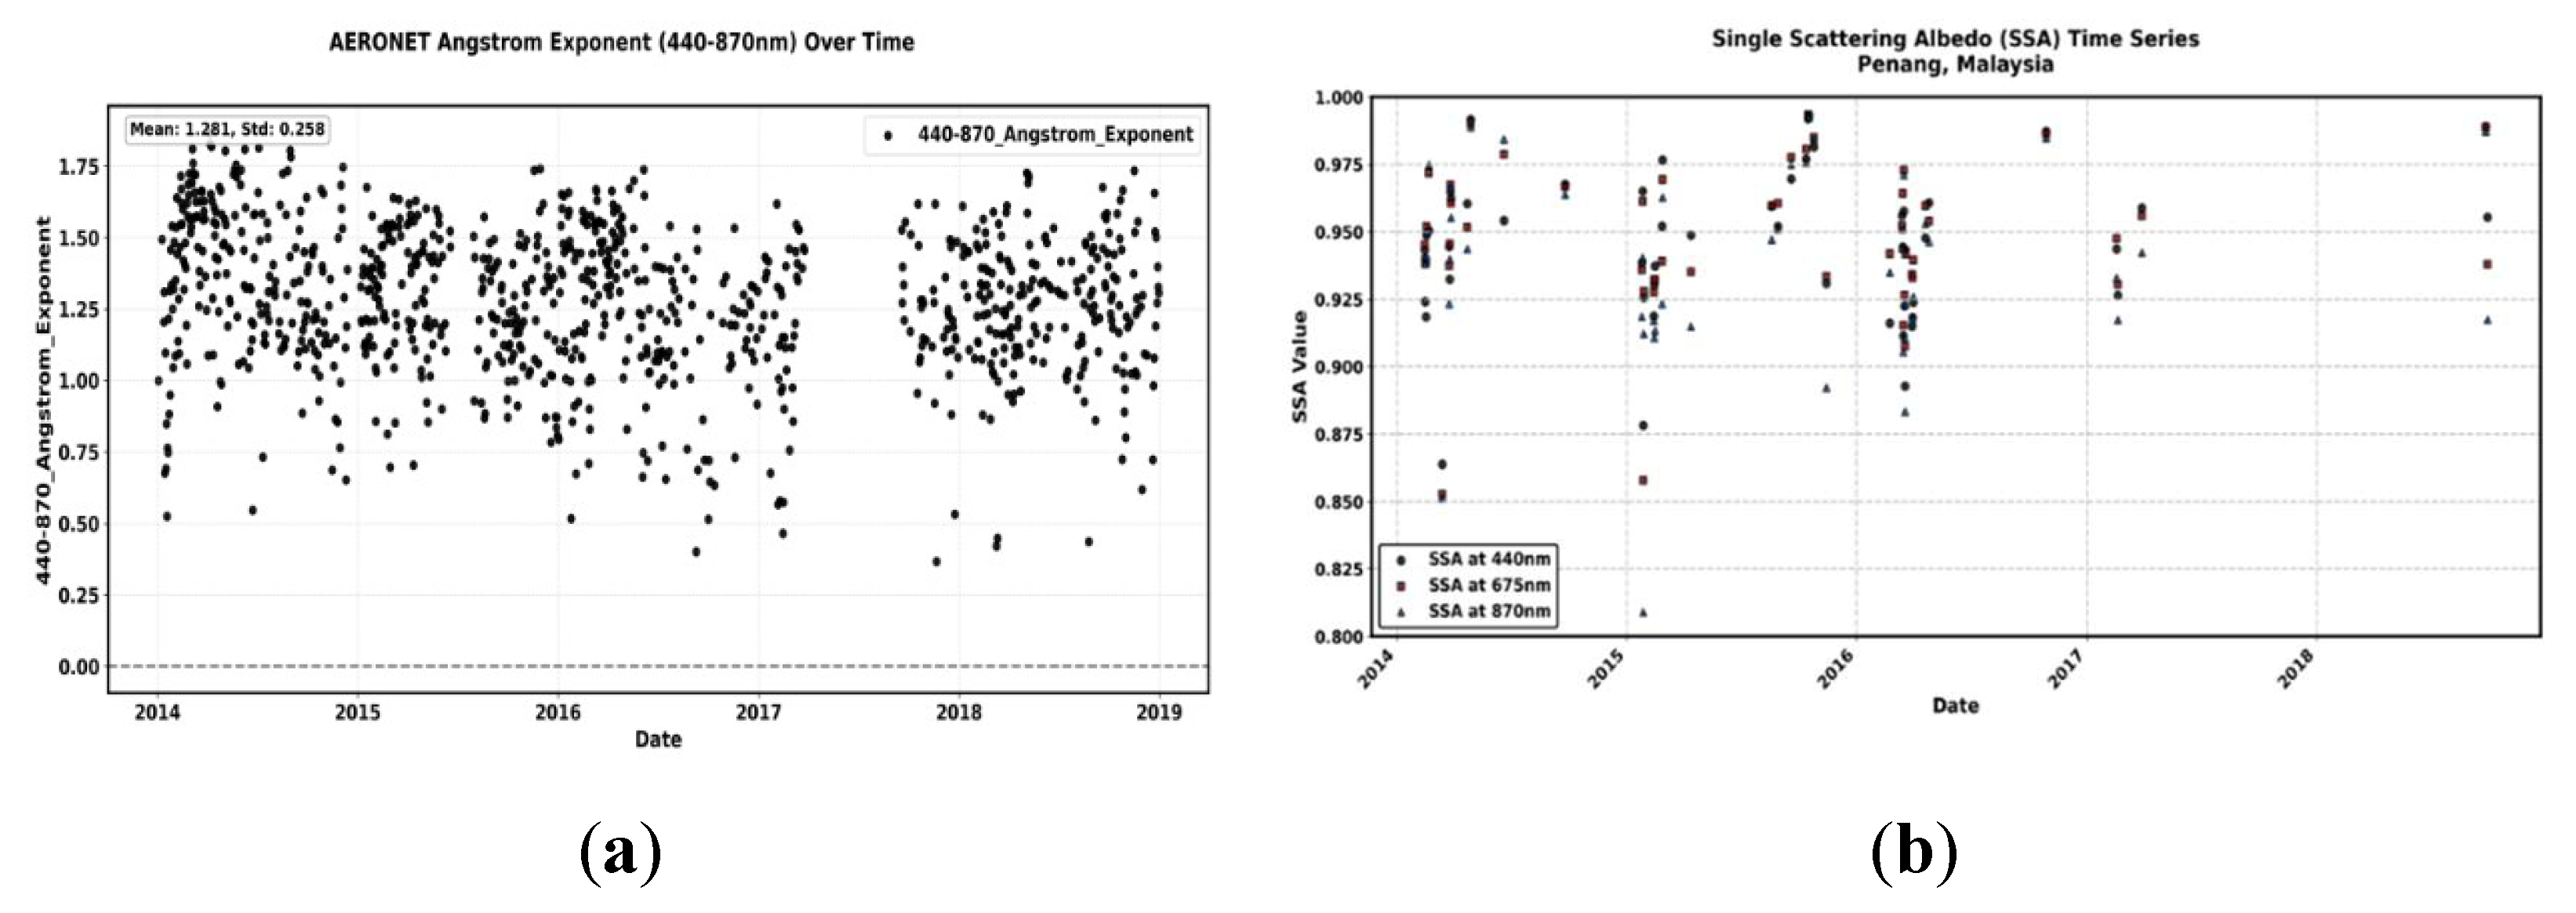
Figure 4.
(a) Daily time series of GHI, DNI, and DHI irradiance from NASA POWER (2014–2018). (b) Monthly extinction AODs of MERRA-2 aerosol species over Penang: TOTEXTTAU, DUEXTTAU, BCEXTTAU, OCEXTTAU, SEEXTTAU, SSEXTTAU.
Figure 4.
(a) Daily time series of GHI, DNI, and DHI irradiance from NASA POWER (2014–2018). (b) Monthly extinction AODs of MERRA-2 aerosol species over Penang: TOTEXTTAU, DUEXTTAU, BCEXTTAU, OCEXTTAU, SEEXTTAU, SSEXTTAU.
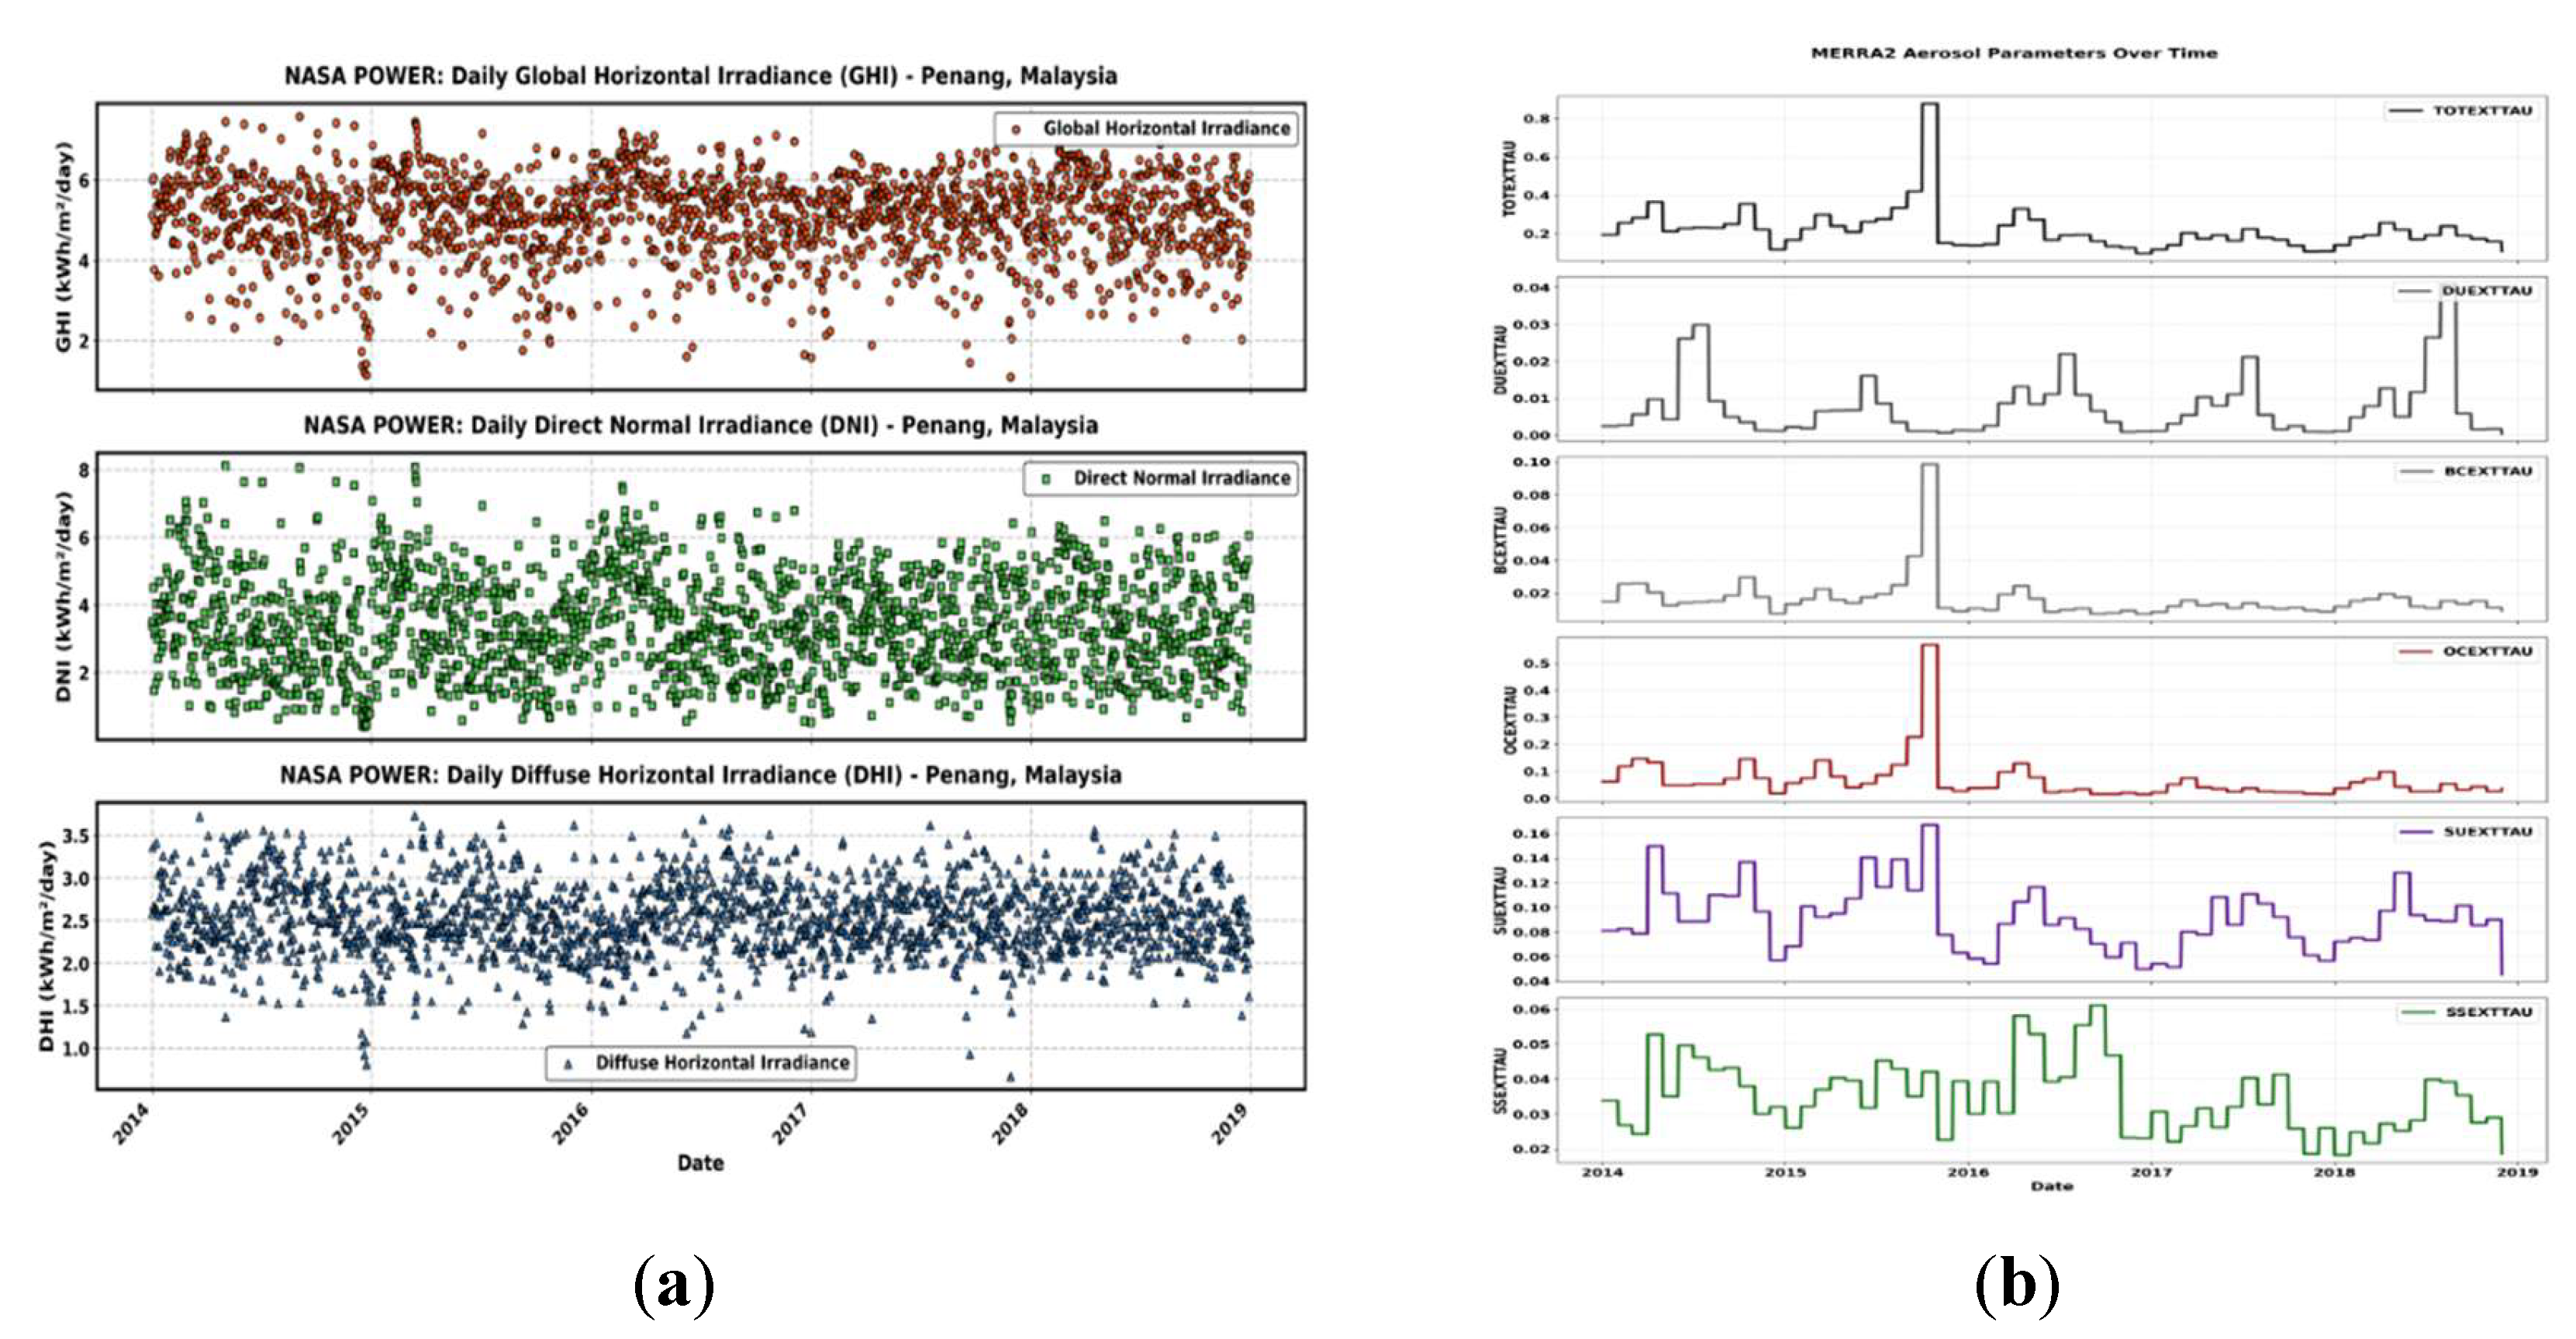
Figure 5.
Daily Time Series Comparison of Clear-Sky and All-Sky Solar Irradiance Components (GHI, DNI, DHI) from 2014 to 2018 in Penang.
Figure 5.
Daily Time Series Comparison of Clear-Sky and All-Sky Solar Irradiance Components (GHI, DNI, DHI) from 2014 to 2018 in Penang.
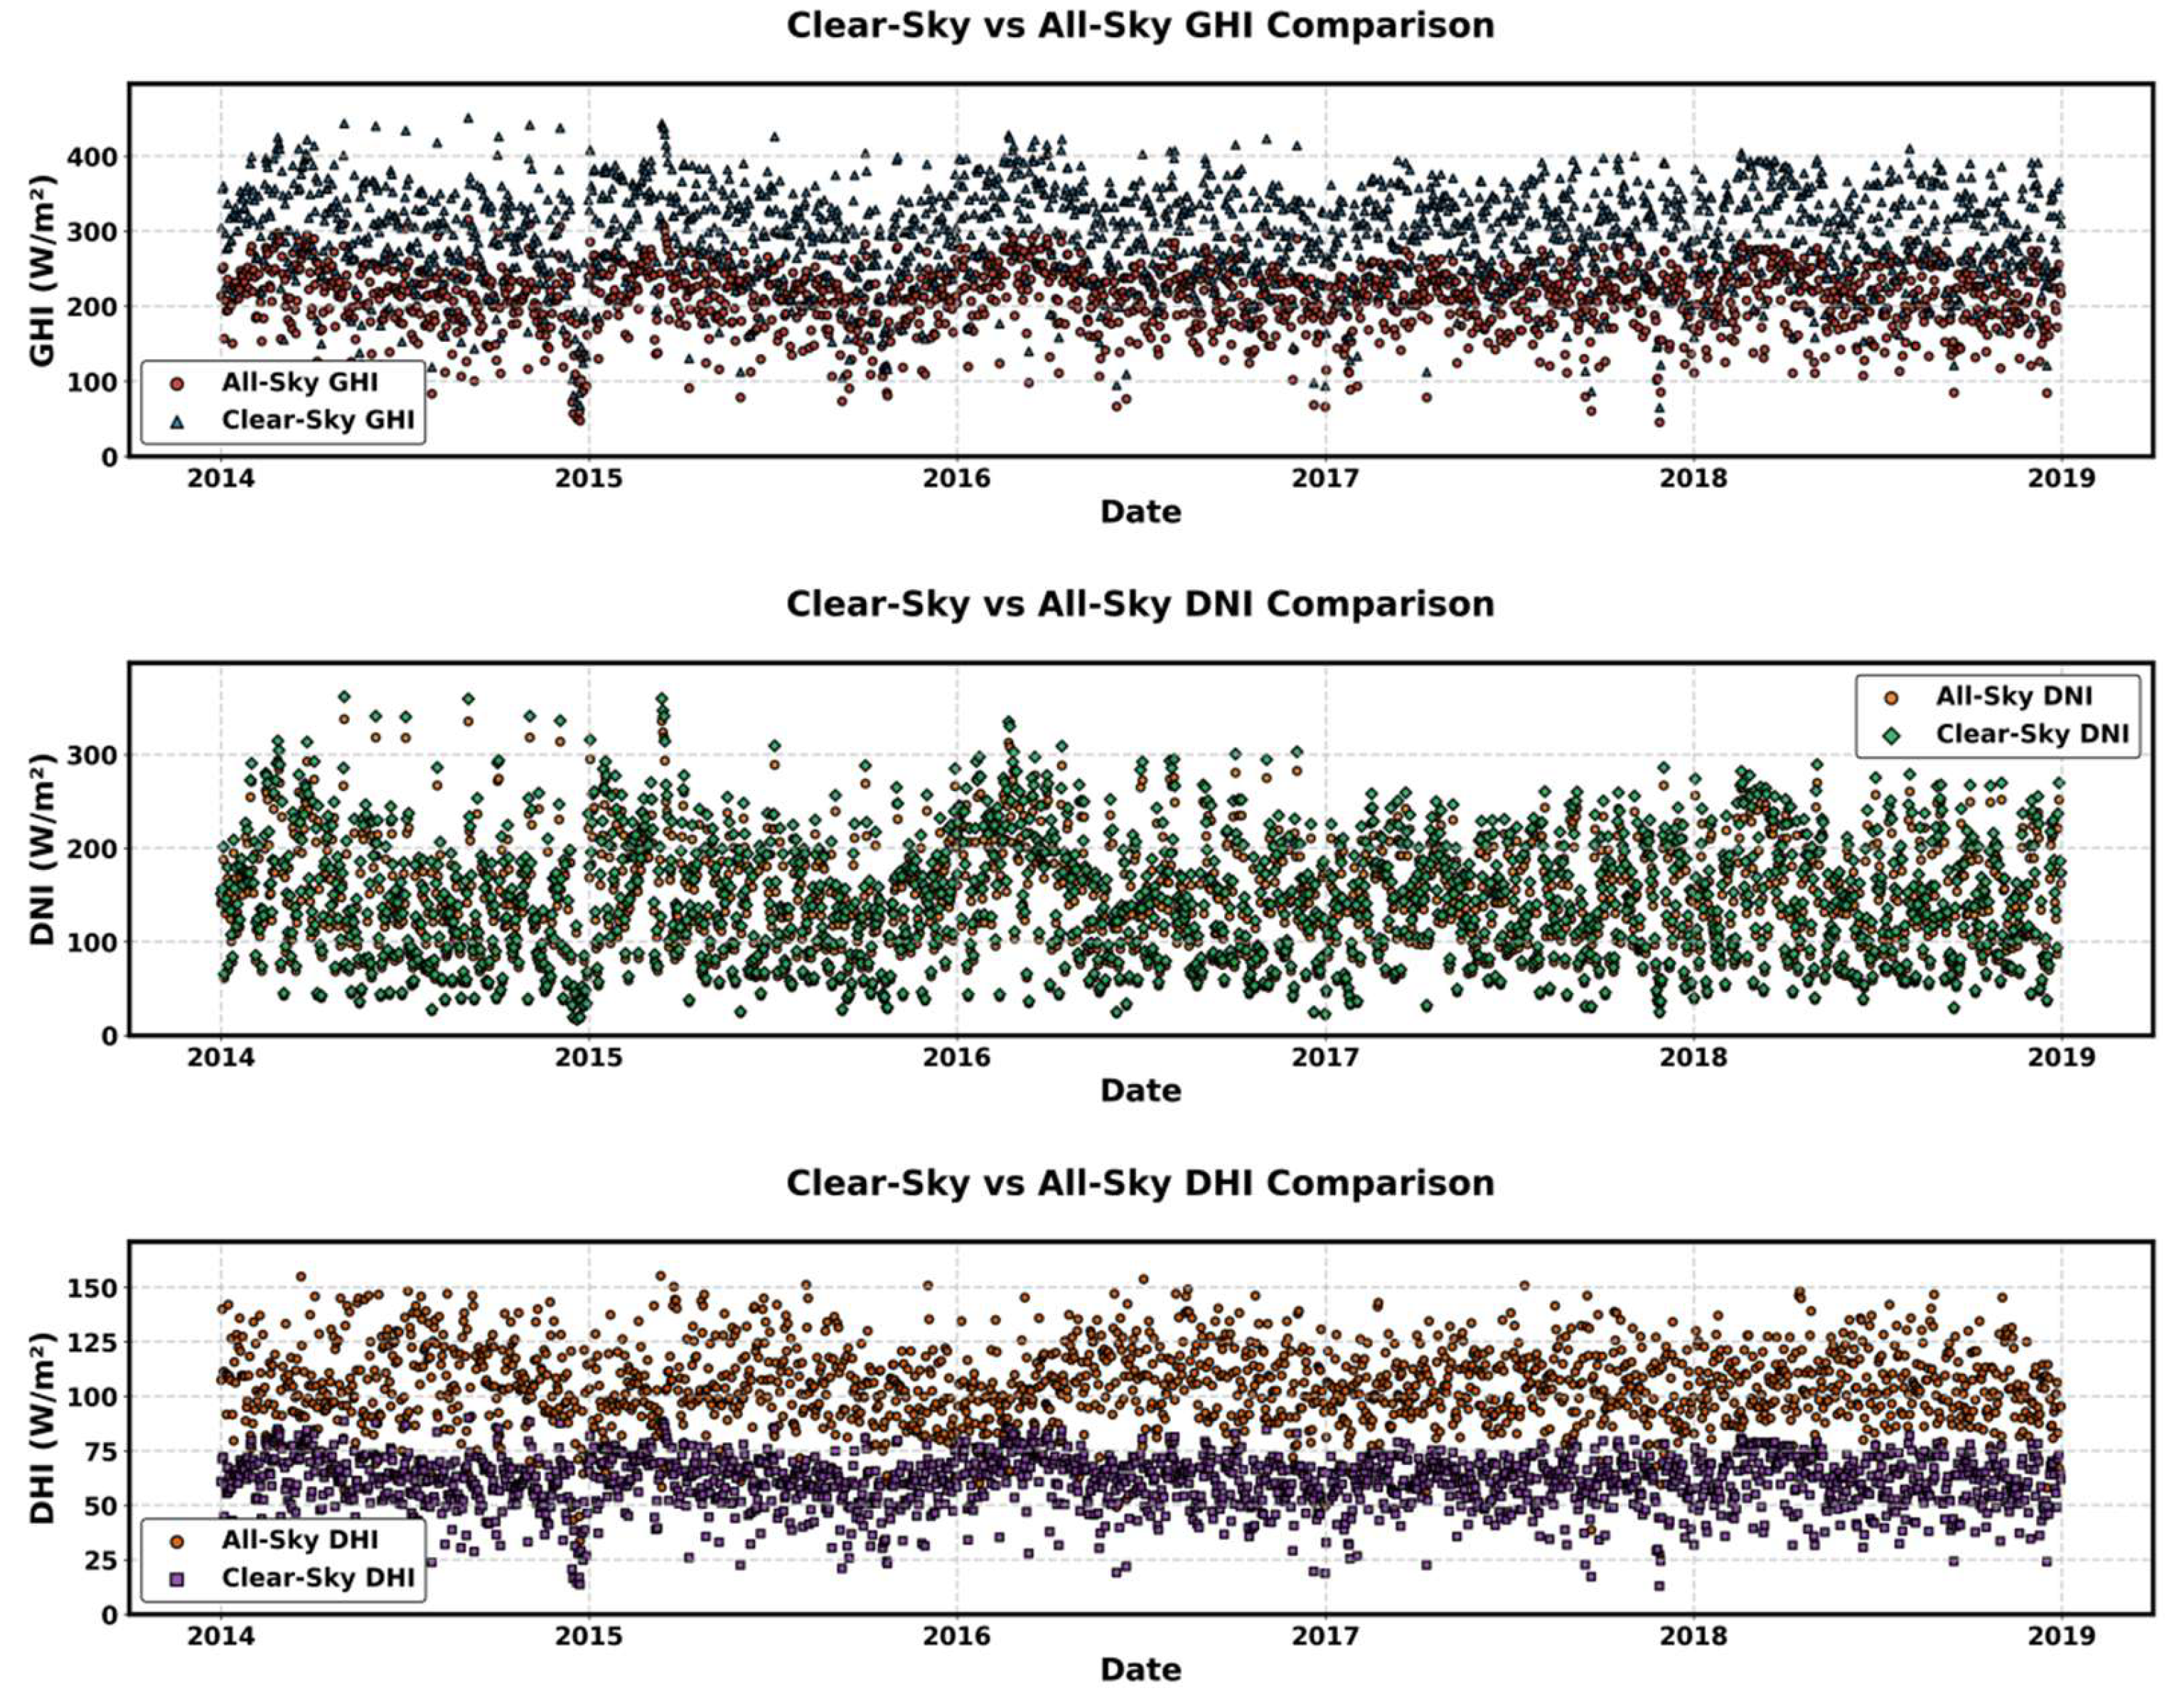
Figure 6.
Variation of Mean DHI across Aerosol Single Scattering Albedo (SSA) and Ångström Exponent (AE) under Different Aerosol types.
Figure 6.
Variation of Mean DHI across Aerosol Single Scattering Albedo (SSA) and Ångström Exponent (AE) under Different Aerosol types.
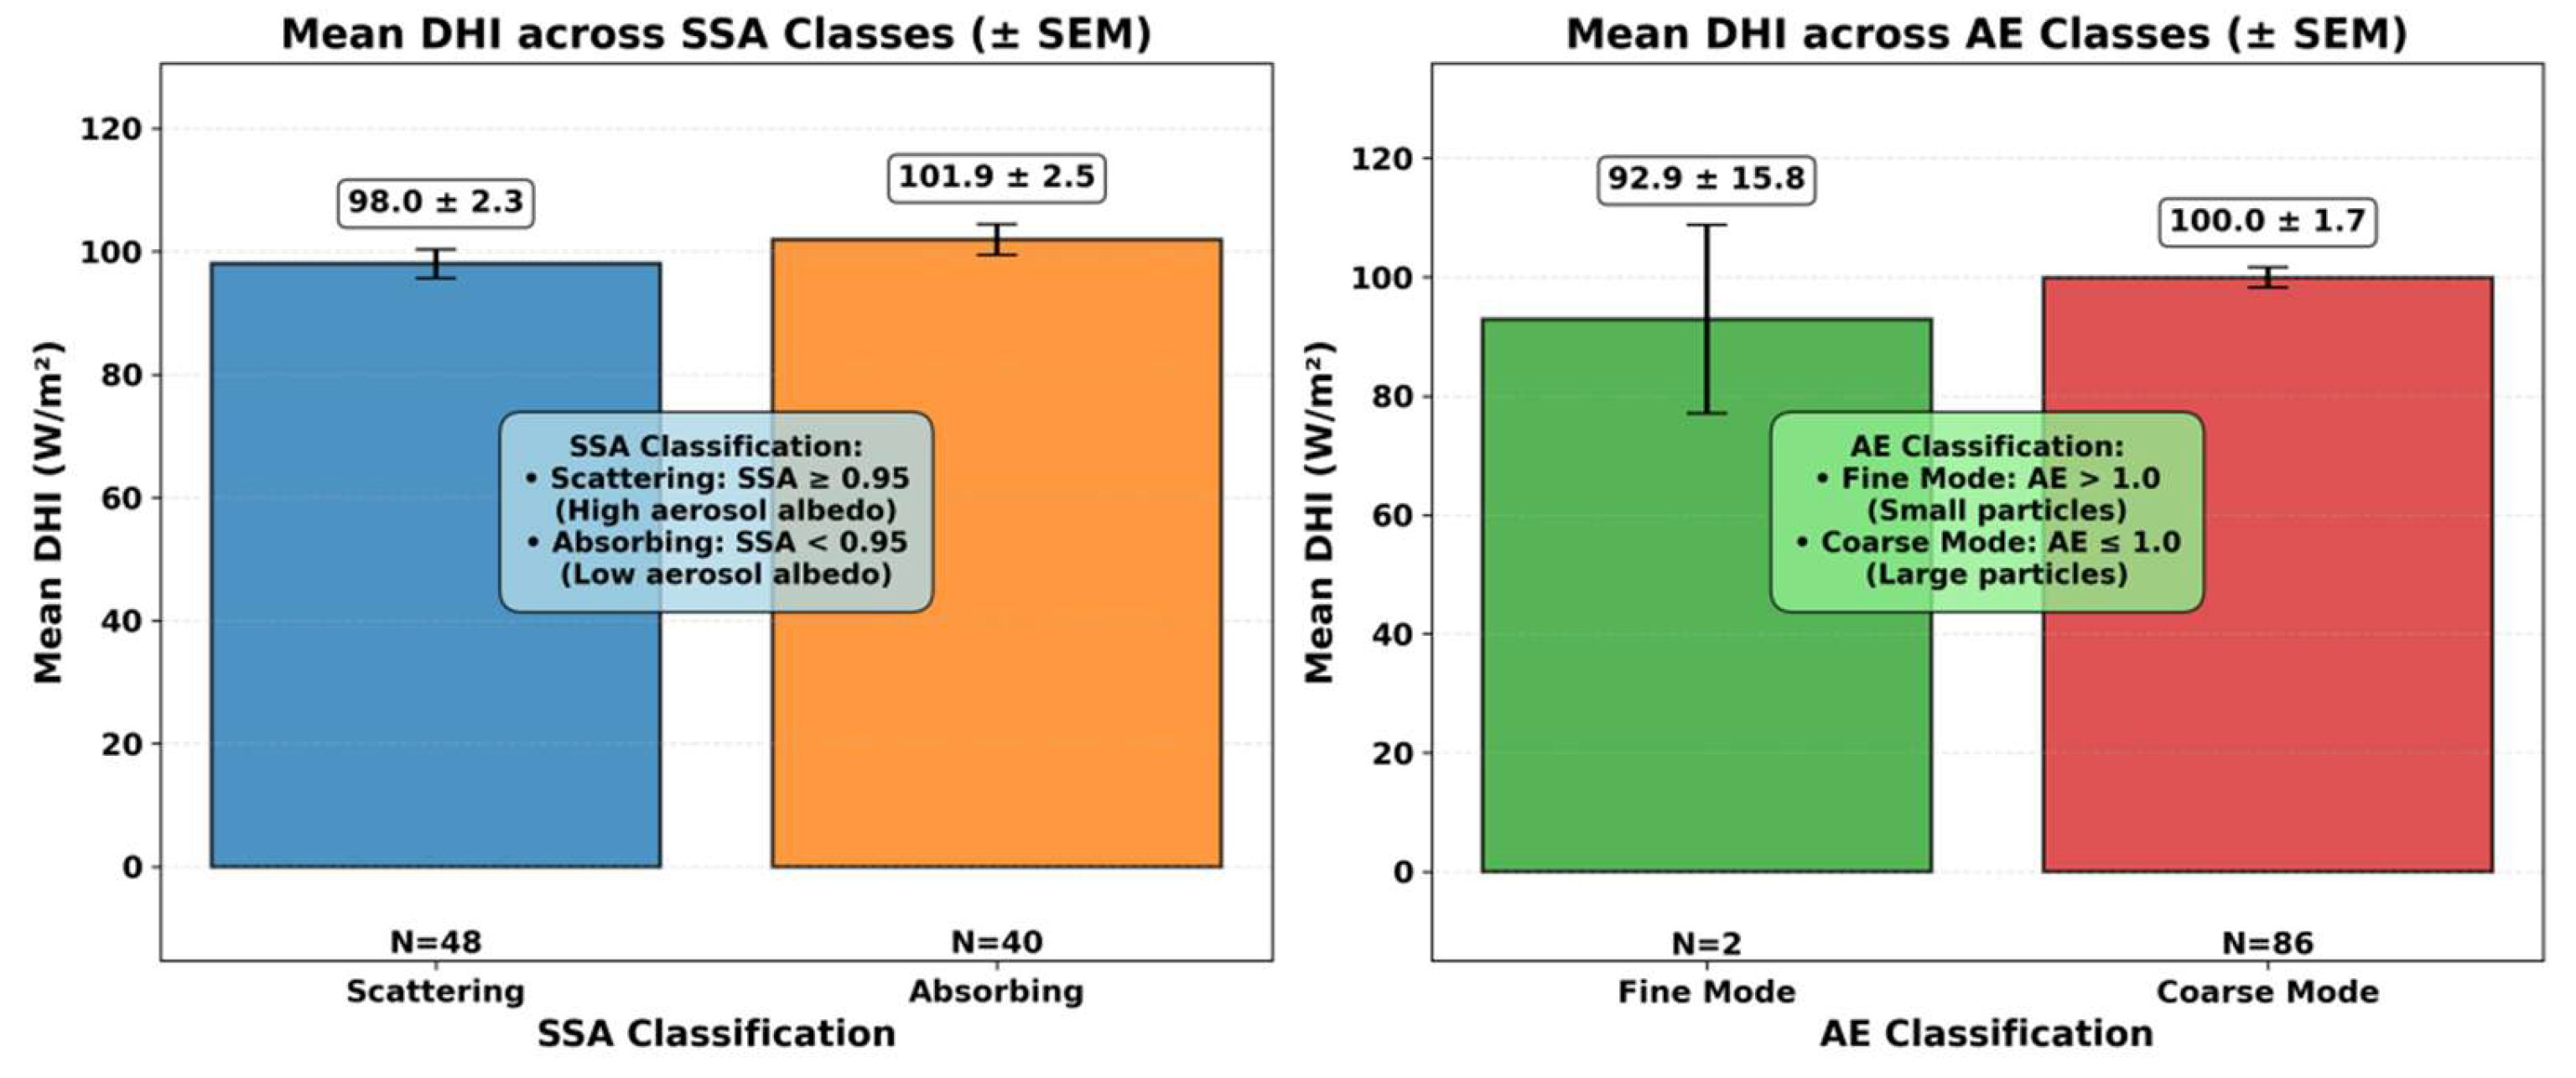
Figure 7.
Scatter plots of Clear-Sky vs All-Sky Solar Irradiance Components (GHI, DNI, DHI).
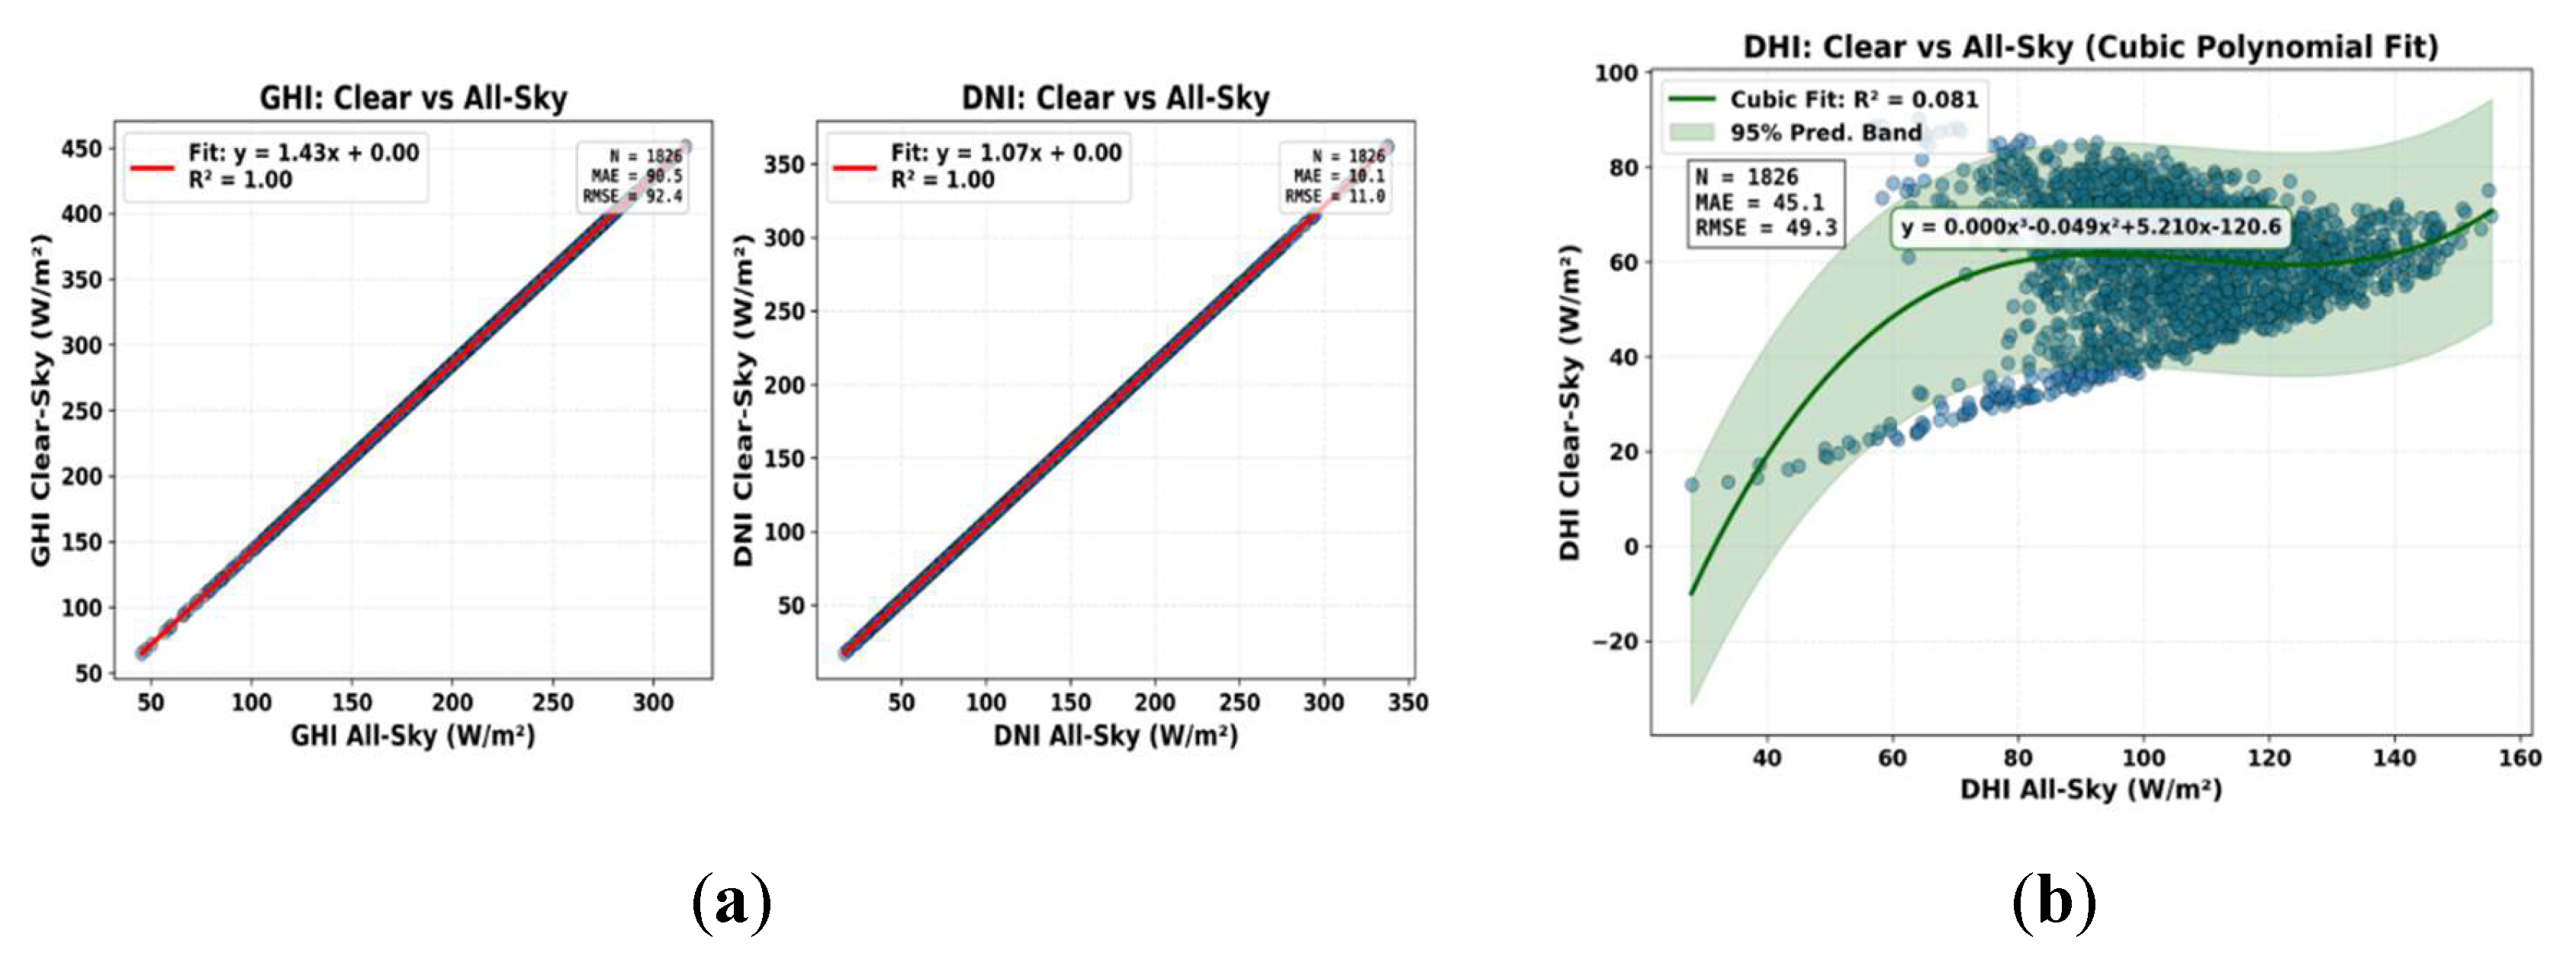
Figure 8.
Time Series of GHI, DNI, and DHI under Low, Moderate, and High AOD Conditions.
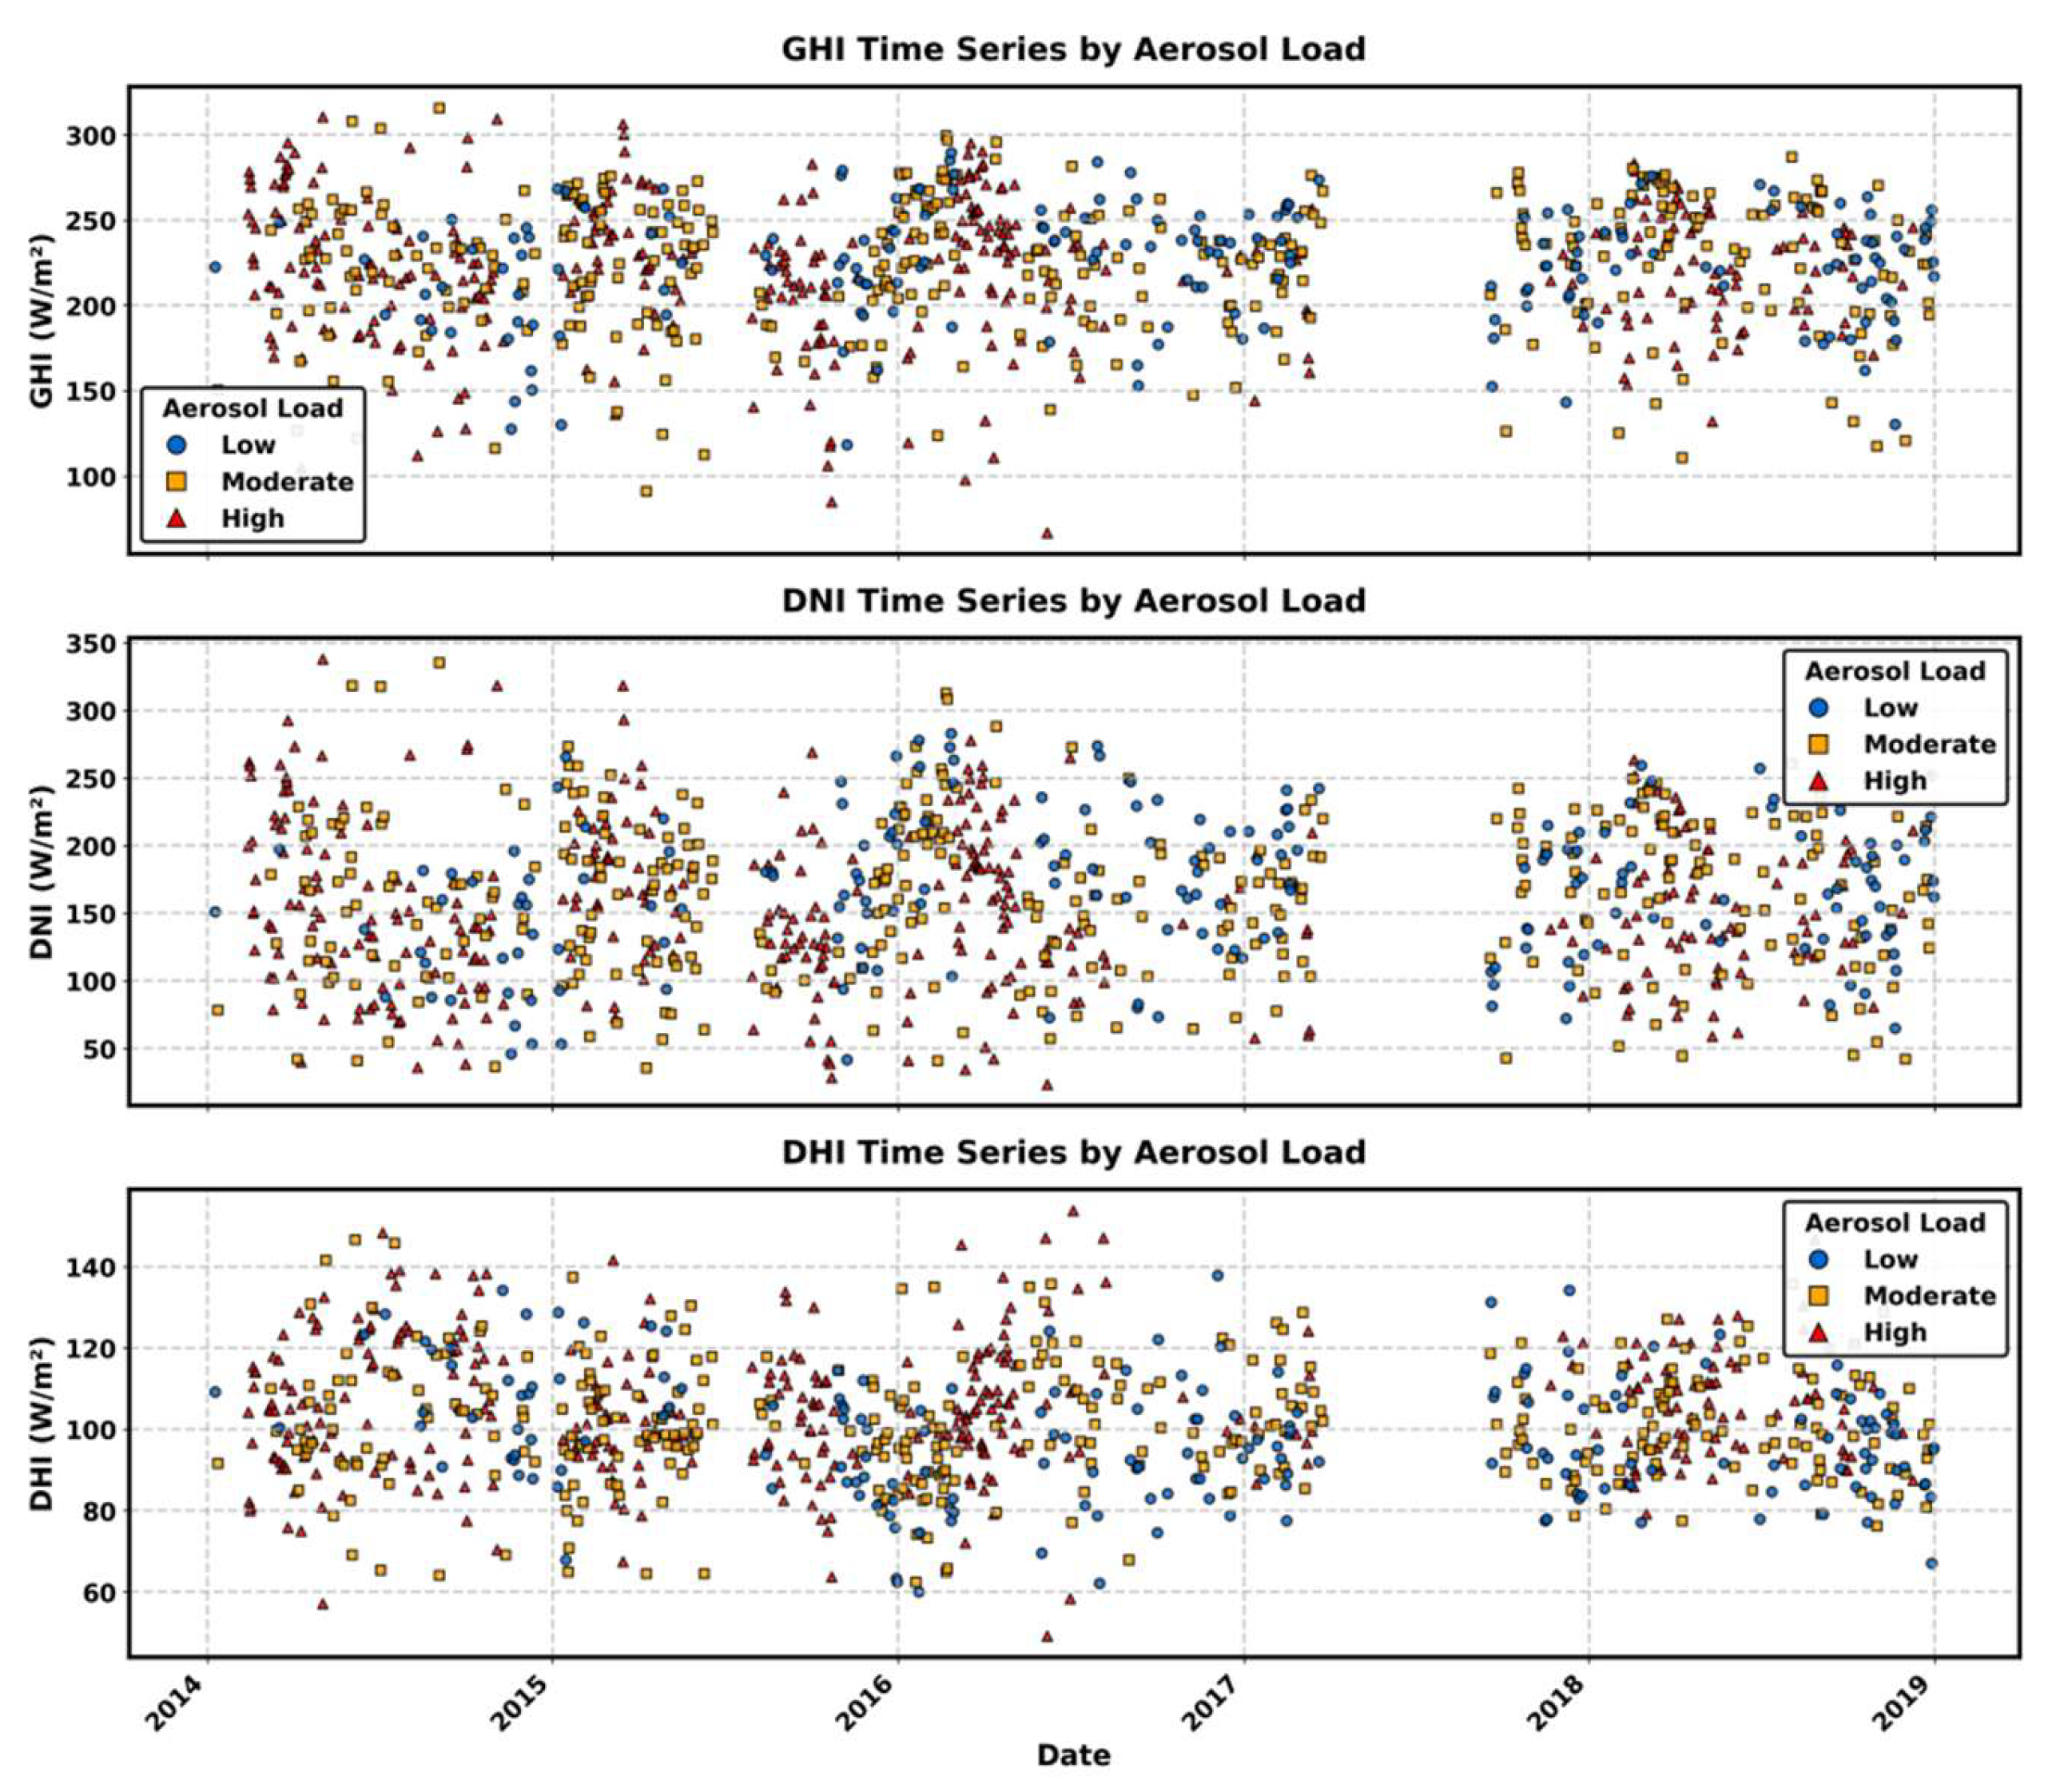
Figure 9.
Comparative Radiative Signatures of a Clean-Sky Day (2017-02-09) and a Severe Haze Day (2015-10-06) in Penang.
Figure 9.
Comparative Radiative Signatures of a Clean-Sky Day (2017-02-09) and a Severe Haze Day (2015-10-06) in Penang.
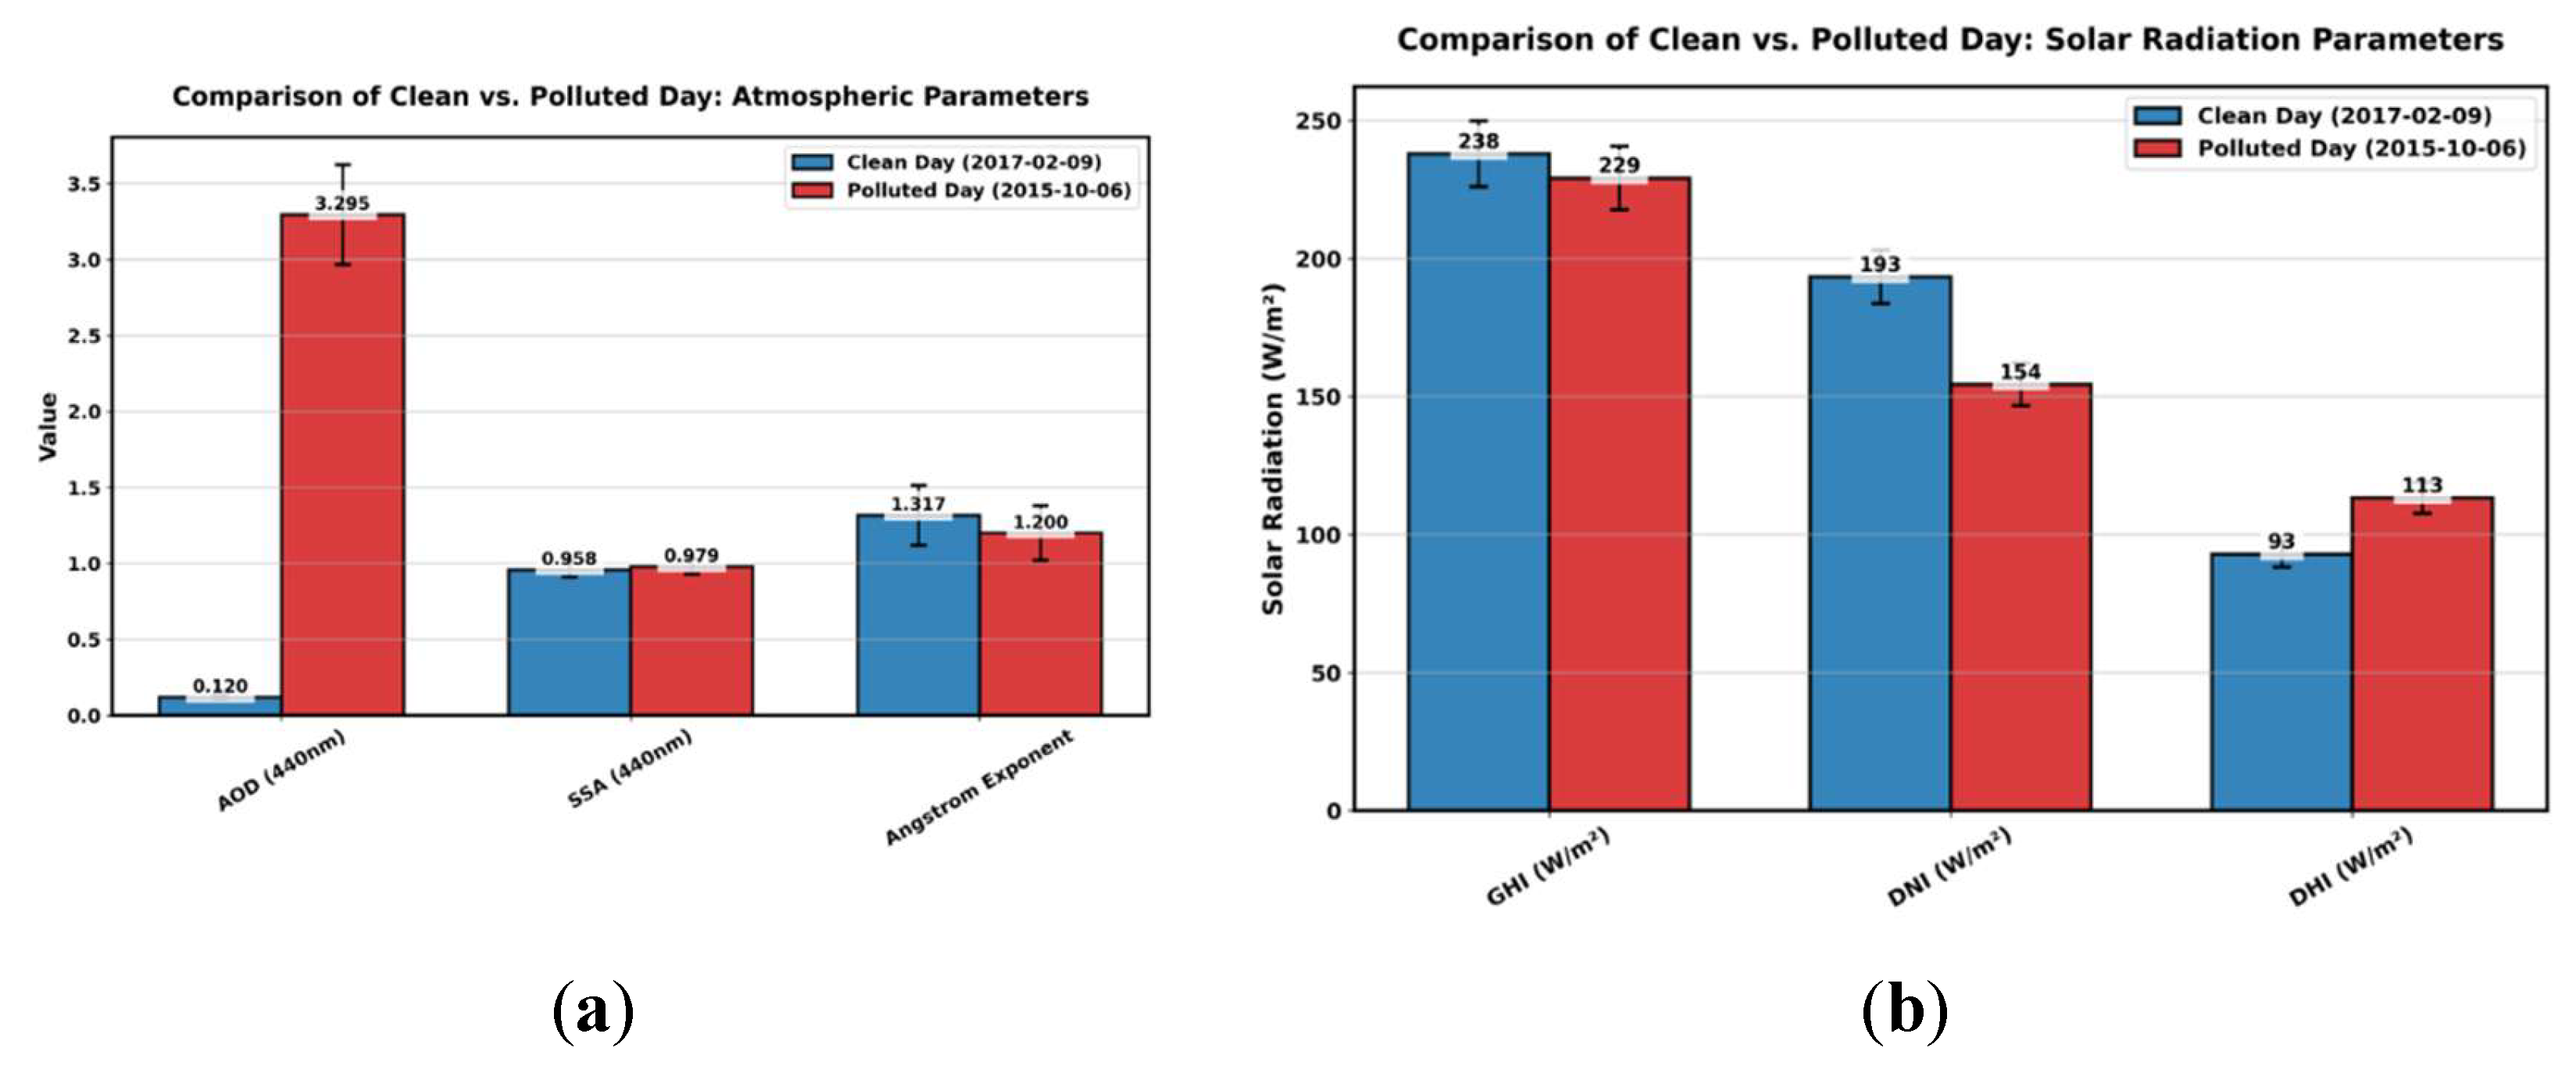
Figure 10.
(a) Daily Time Series of Bottom of the Atmosphere Radiative Forcing efficiency (BOA RFE) for GHI, DNI, and DHI. (b) BOA RFE stratified by AOD regimes for GHI, DNI, and DHI, (2014–2018).
Figure 10.
(a) Daily Time Series of Bottom of the Atmosphere Radiative Forcing efficiency (BOA RFE) for GHI, DNI, and DHI. (b) BOA RFE stratified by AOD regimes for GHI, DNI, and DHI, (2014–2018).
Disclaimer/Publisher’s Note: The statements, opinions and data contained in all publications are solely those of the individual author(s) and contributor(s) and not of MDPI and/or the editor(s). MDPI and/or the editor(s) disclaim responsibility for any injury to people or property resulting from any ideas, methods, instructions or products referred to in the content. |
© 2026 by the authors. Licensee MDPI, Basel, Switzerland. This article is an open access article distributed under the terms and conditions of the Creative Commons Attribution (CC BY) license.
Copyright: This open access article is published under a Creative Commons CC BY 4.0 license, which permit the free download, distribution, and reuse, provided that the author and preprint are cited in any reuse.


