Submitted:
04 February 2026
Posted:
05 February 2026
You are already at the latest version
Abstract
As urban populations age, the built environment becomes a vital determinant of health equity. This research evaluates the sidewalk infrastructure, surrounding the Health Center in Aigaleo, Greece, in order to quantify its impact on healthcare accessibility for older adults. Using a GIS-based approach to simulate realistic navigation, a routing algorithm prioritized the "easiest" path over the shortest distance by transforming accessibility scores into traversal costs. The results revealed a significant disadvantage in healthcare access, with routes to the Health Center scoring lower than the average accessibility of the greater study area. In addition, the negative correlation (r = -0.20, p < 0.001) confirms the pattern of environmental injustice, where neighborhoods with the highest older adult density systematically face the poorest infrastructure. Eventually, Moran’s I of 0.912 identifies the "Accessibility Deserts" which are comprised of a 92.5% absence of crosswalks and an 81.7% rate of obstructions. This study outlines that those who depend most on the sidewalk network, are disproportionately affected by inadequate urban planning conditions. By underscoring the necessity to remediate these low-accessibility clusters, public health is improved, ensuring equitable healthcare access and supporting healthy aging.
Keywords:
urban accessibility
; GIS
; spatial autocorrelation
; environmental injustice
; healthcare access
; healthy aging
1. Introduction
In the context of a livable community, high-quality and walkable sidewalks, are crucial components for promoting physical activity, social interaction, and improved access to health services. As primary determinants of quality of life, these characteristics are essential for supporting the aging population. In contrast, when sidewalks are poorly maintained or missing, they pose serious mobility challenges increasing the risk of falling and injury [1,2,3,4]. For older adults managing age-related changes, such as slower gait, shorter strides, or compromised balance [5,6], uneven or missing pavements are more than just inconveniences, are significant to falls. An accessible built environment is the foundation of healthcare equity, as it preserves independence and reduces health risks that originate from mobility limits [7,8,9], essentials to an equitable access to healthcare [10,11].
Taking into consideration that population is getting older and so are their needs, the "walkability" of a neighborhood is of paramount importance for health equity as it allows residents to "age in place" [12,13]. Physical deficiencies like cracks, uneven surfaces, and a lack of curb ramps, make it difficult for older adults to move safely [14,15,16]. Besides, these barriers are not only restricting physical movement but also function as gatekeepers to vital services. Inaccessible and poor maintained sidewalks often lead to missed medical appointments, delayed treatment, or a forced reliance on others for transportation [17,18].
In Greece, despite the fact that there are initiatives, such as Sustainable Urban Mobility Plans (SUMP - SVAK in Greek) [19] and "Low Pollution Zones" [20] that aim to expand pedestrian networks, the necessity of older adults for walkable sidewalks remains unmet. The walkability of Athens’ center and the surrounding municipalities remains a significant hurdle for inclusive urbanism [21]. Aigaleo's pedestrian network is characterized by deficiencies, such as lack of curb ramps and constrained sidewalk widths. In order to support the mobility requirements of older adults, it is important to focus on micro-scale improvements, such as barrier-free pavements and the strategic placement of public benches [22].
The research investigates the conditions of the sidewalks around the Health Center of Aigaleo and evaluates their potential impact on older adult accessibility to the former. Also, it aims to quantify how environmental factors affect older adults' accessibility to healthcare services, as sidewalks characterized by various accessibility factors that vary across the study area's spatial landscape. Beyond a simple audit, this study analyses the broader implications of the conditions of the sidewalks as they pose accessibility barriers to health, well-being, bridging the gap between urban design and geriatric health outcomes.
2. Materials and Methods
2.1. Definition of the Study Area
The study focuses on the walking catchment area surrounding the Aigaleo’s Health Center in West Athens, Greece. A 500-meter network buffer was established as the primary service area, excluding the non-residential highways of Thivon and Iera Odos. A 5-to-10-minute trip for the average adult [23,24] is typically around 500 meters. However, for older adults, especially for those with physical limitations, this distance is a significant threshold.
Between 2011 and 2021, based on the census data from Hellenic Statistical Authority (ELSTAT) [25], the growth of the city of Aigaleo's older population was significant. As age groups between 60-69 and 70-79 years old, it expanded by 19.4% and 10.6%, respectively. The city was selected as the study area, precisely because it serves as a representative microcosm of Greece's broader aging trend and low quality of life [26,27,28,29]. This demographic pressure, underscored the urgent need to audit local infrastructure, which is needed to meet the needs of an increasingly older adult population.
The selection of a 500-meter radius is a threshold supported by extensive literature, as it promotes walking behaviour and independence among older adults [30,31]. Walking is the easiest form of physical activity for this population as it promotes their health, life-space mobility, and ability to "age in place" [13,23,32,33,34].
Moving beyond simple distance metrics, what is concerned here, is the quality of this urban environment. Within this 500-meter catchment, micro-scale infrastructure factors, such as the curb ramp availability, the sidewalk width, and the sidewalk continuity [35,36], dictates the safety of the journey to the Health Center. This specific buffer provides a pragmatic and scientific area, for our accessibility assessment (Figure 1).
2.2. Data Acquisition and Preparation
Multiple sources were used to obtain data, to ensure a robust geospatial analysis of the study area. The sidewalk network, which serves as the primary infrastructure layer, was derived from the Hellenic Statistical Authority’s geospatial database by interpreting census blocks. This method follows standard urban accessibility practices by preserving the specific spatial geometry of pedestrian paths [37] Supplementary, to enhance the spatial analysis, demographic insights for residents aged 65 and above were extracted from the ELSTAT Census (Urban Block level), as well as the location of the Aigaleo’s Health Center, as recorded by the National Public Health Organization [38].
Following data collection, the focus was to refine the sidewalk network connectivity. The sidewalk dataset was expanded, to include crosswalks and segments, effectively transforming a collection of lines into a functional grid, that reflects the actual navigable space available to older adults. A comprehensive topological correction was then performed to resolve connectivity issues and ensure the network accurately represented the physical walking paths within the study area. This refined grid allows for a precise evaluation of how environmental barriers affect movement toward the healthcare facility.
To determine the distribution of the target population, census data for residents aged 65 and over were integrated into the 500-meter service area using a density-based approach. This method estimated the number of older adults residing within each Urban Block (UB) relative to the Health Center. In cases where UBs only partially overlapped the 500-meter buffer, the proportion of the population residing within the intersection, was estimated. In this way, the overestimation was prevented and ensured that the demographic totals remain strictly representative of the study's specific catchment area.
2.3. Sidewalk Accessibility Assessment
To quantify sidewalk conditions, each sidewalk segment within the study area underwent a detailed assessment based on a set of critical accessibility factors for older adults’ mobility. This assessment involved evaluating various attributes of the pedestrian infrastructure against defined scoring criteria.
2.3.1. Accessibility Factor Evaluation
Each sidewalk segment within the study area was evaluated against 12 distinct accessibility factors identified as critical for safe and comfortable older adult mobility (Table 1). A standardized 0-2 scale was applied to each attribute, where 0 denotes poor conditions, 1 represents fair, and 2 signifies good. To account for the varying influence of these factors on safety, a weighting scheme was established through expert consensus across the fields of geography, urban planning, and gerontology.
2.3.2. Composite Accessibility Score Calculation
The next step involved generating a weighted accessibility index. This index was a standardized composite score ranging from 0 to 10, to evaluate each segment's performance. This standardized metric was essential for identifying spatial disparities. Allowing, to rank sidewalk quality across the entire study area. Under this scoring system, higher values (approaching 10) correlate directly with increased safety and fewer barriers, offering a clear visual and statistical representation of age-friendly zones. This composite score was derived using the following equation:
Accessibility_Score = ∑(i=0)^n(Fi*Wi)
To calculate the final accessibility score, we applied the individual factors (Fi) and their relative weights (Wi) as established in the criteria outlined in Table 1. This aggregate value serves as the primary indicator for determining how spatial variations in sidewalk infrastructure potentially impact access to the Aigaleo Health Center.
2.4. Healthcare Access Route Analysis
Rather than relying on standard Euclidean or 'shortest path' distances, the simulation that was used in this study (the 'ease of travel') aimed at the functional reality of how an older adult is navigating when seeking healthcare.
2.4.1. Optimal Route Calculation
To ensure both demographic accuracy and comprehensive spatial coverage, a hybrid approach was used to generate 841 origin points for the accessibility analysis. This involved combining census block centroids, which reflect population distribution, with a systematic 50-meter grid placed along the sidewalk network. The 50-meter interval was selected based on established sampling methods [69] and represents a realistic, manageable distance for older adults with varying mobility levels [70,71,72]. This dual strategy minimizes sampling bias and ensures that the entire sidewalk network is uniformly represented within the UB of the study area.
"Easiest" vs. "Shortest" Path
To better reflect the lived experience of aging, the routing algorithm to prioritize ease of movement over strict geometric brevity was designed. For older adults, the decision-making process is rarely about saving time, but it is truly ensuring safety. Meaning that they are making conscious detours to bypass risks like steep slopes or obstructed walkways [53,54]. The model that was used in this study, simulated a more realistic “age-friendly” path-finding behavior that prioritizes stability and accessibility.
Inverse Cost Transformation logic
To prioritize more accessible paths in the network analysis, the 0-10 composite accessibility scores were transformed into traversal costs. In this model, high accessibility corresponds to a low travel "cost," while poor conditions act as a high-cost barrier that the algorithm seeks to avoid. The transformation was calculated using the following inverse cost equation:
Inverse_Cost = (Maximum_Score - Accessibility_Score) + 1
Where: Maximum_Score: The highest possible composite score (10), representing a perfectly accessible segment. Accessibility_Score: The actual calculated accessibility score of each segment (0-10). 1: A constant added to ensure all cost values remain positive and to maintain a distinction even between segments that achieve the maximum accessibility score.
By minimizing this inverse cost, the algorithm identifies the path of least resistance, effectively routing analysis through segments with the highest quality infrastructure and the fewest mobility obstacles.
2.4.2. Route Statistics Extraction
The final step of the methodology involved extracting key metrics for each of the 841 calculated paths to provide a comprehensive profile of the pedestrian journey. These metrics included each path’s mean accessibility score, which offers a general indication of the route's overall quality. To capture segments that might deter movement despite high quality elsewhere (bottlenecks) the analysis identified the minimum accessibility score encountered on any single segment along each path [40,48,49]. To identify the most hazardous zones, the study isolated sidewalk segments with scores below 2.5. This cutoff point is not arbitrary, but it represents the level of infrastructure decay that, according to established research, correlates with higher fall risks and a sharp decline in walking capacity for the elderly [41,42].
2.4.3. Integrating Sidewalk Conditions with Older Adult Population Data
Moving beyond general observation, this study examined how infrastructure quality aligns with demographic needs, as sidewalk accessibility was cross-referenced with residential density data. This integration served two main purposes. Initially, a GIS spatial overlay combined sidewalk accessibility scores with census-level population data was used, providing a clear visual of where infrastructure fails in high-density senior neighborhoods. Then proximity analysis was employed, measuring the distance between population centroids and sidewalk segments. Categorizing these segments into three functional classes, 'Significant Barriers' (0-2.5), 'Partially Accessible' (2.6-7.0), and 'Fully Accessible' (7.1-10.0). The 2.5 threshold was selected, to mark the absence of no-safety features like curb ramps, or surfaces that essentially constrained mobility [40,44]. This classification enabled researchers to pinpoint the exact Urban Blocks where infrastructure neglect acts as a direct gatekeeper to healthcare services.
2.5. Software Used
The data analysis followed an integrated GIS-to-statistics workflow. The assessment of sidewalk accessibility and the modeling of healthcare access routes, were executed in ArcGIS Pro 3.2 (ESRI, Redlands, CA, USA). Specific libraries within R (version 4.1.4), utilizing ‘rgdal’ for spatial data management, ‘spdep’ for Local Indicators of Spatial Association (LISA) and Getis-Ord Gi* cluster analysis, ‘spatialreg’ for spatial regression modeling, and ‘ggplot2’, ‘tidyverse’ for data manipulation and visualization.
3. Results
The spatial analysis confirms that sidewalk conditions follow a clear pattern of environmental injustice. Rather than being scattered randomly across the study area, infrastructure barriers are heavily clustered in zones where healthcare demand is most acute. The data shows a systemic mismatch, where the densest concentrations of older residents are effectively forced to navigate the most hostile pedestrian environments.
The analysis identifies a substantial healthcare access gap for routes leading to the Health Center compared to the broader study area. With a mean score of 2.76 against broader study area average of 3.17, this 13% drop in accessibility deficit was statistically highly significant (t = 6.50, df = 535.69, p<0.001), pointing out that the infrastructure is disproportionately poor along the paths that older adults must use to access medical care. Indicating that the physical urban environment acts as a systemic barrier to essential services, which directly influence the mobility choices and safety of the aging population [53,54]. Further evidence of institutional neglect is found in the significant negative correlation between older adult density and route accessibility (r = -0.20, t = -6.02, p<0.001). This inverse relationship indicates that as the density of older residents within an Urban Block (UB) rises, the quality of the pedestrian fabric tends to decline.
Although the correlation coefficient of -0.20 suggests a modest effect, its high statistical significance, which was reinforced by a 95% confidence interval of [-0.27, -0.14], confirmed that this inverse relationship is a consistent, non-random feature of the study area's geography. As illustrated in Figure 2, this data confirms a troubling socio-spatial reality, where the neighborhoods with the highest demand for safe and walkable infrastructure are the most underserved. This trend represents a localized form of environmental injustice, where the most vulnerable citizens, those who rely most heavily on accessible sidewalks for "aging in place", are forced to navigate the most hazardous environments to reach vital healthcare services.
The spatial analysis demonstrates that sidewalk accessibility is not randomly distributed across the study area but follows Tobler’s First Law of Geography, exhibiting high spatial autocorrelation. Rather than appearing as isolated incidents, high-quality sidewalk segments are geographically adjacent, while infrastructure-deficient zones are similarly clustered.
This spatial dependence suggests that inequality is systematic, where a resident living in an area with poor access is statistically more likely to be surrounded by equally poor infrastructure. Local Indicators of Spatial Association (LISA) analysis quantified this phenomenon, identifying strong spatial dependence in 427 routes (50.8% of the total sample). As illustrated in Figure 3a, these clusters were categorized into two primary enclaves:
A. "Accessibility Deserts" (Low-Low Cluster): Comprising 242 routes (28.8%), these zones represent compact areas of poor accessibility where older adults are surrounded by continuous infrastructure barriers.
B. "Accessibility Islands" (High-High Cluster): Comprising 185 routes (22.0%), these orange-coded segments represent isolated zones of high-quality infrastructure and prosperity.
In contrast, only 3 routes (0.4%) showed isolated inequalities (spatial outliers), where high-quality routes were located within wider zones of low accessibility.
Having analyzed LISA, an additional statistical method was employed to confirm the patterns previously found. The Getis-Ord Gi* analysis (Figure 3b) corroborated these patterns with almost identical results, identifying 242 "Cold Spots" and 187 "Hot Spots." The consistency between these two distinct statistical methods provides high confidence in the findings.
The spatial clustering of these barriers is undeniable, as the exceptionally high Moran’s I value of 0.912 (p<0.001) confirms a nearly perfect positive spatial autocorrelation. This level of clustering suggests that the study area is not just experiencing random decay but is instead divided into distinct 'enclaves' of infrastructure neglect. Figure 4, clarifies the severity of this environmental failure. The analysis revealed that the infrastructure is marked by a 92.5% absence of crossings and an 81.7% obstruction rate. Conditions that systematically drive older adults off the sidewalk and into conflict with vehicular traffic. Coupled with a widespread lack of resting places (75.9%), the urban pedestrian environment fails to provide even the most basic support and exposes older adults to traffic risks and physical exhaustion, transforming the walk to the Health Center into a hazardous journey.
A separated analysis of infrastructure quality distinguished between safety-related and comfort-related deficiencies across the network. Regarding comfort, it was found that 61.6% of segments lacked basic micro-climate features like shading or resting points. With 45.7% of the segments in the network, failed on fundamental safety grounds, due to missing ramps, dark routes, or broken pavement. For nearly half the study area, the infrastructure acts as a physical hazard, creating barriers that effectively block older residents from reaching the Health Center safely.
Populations and sidewalk quality is not a statistical artifact. This negative impact of senior population density on accessibility remains statistically significant (β=−6.78e−06, p<0.001). Confirming that the correlation between aging neighborhoods and crumbling infrastructure is systemic. As shown within localized enclaves, a higher density of older residents is a reliable predictor of degraded walking conditions. A comparative analysis of the specific routes to the Health Center versus the broader study area (Figure 5) reveals a distinct infrastructure paradox. The identified routes showed certain structural advantages, including wider pavements (-10.88% width deficit compared to the average), better network connectivity (-15.24%), and significantly fewer obstacles (-22.98%).
Despite these macro-level structural strengths, the study area struggles with features referred to sidewalk design. Meaning that although they meet the standards for sidewalk width, they are lacking in age-specific features. Recording a 25.71% deficiency in curb ramps and a 32.33% gap in adequate lighting compared to the study area average, with additional deficits in resting benches (+10.13%) and shading (+9.06%), these paths may appear realistically 'well-designed', but they remain functionally harmful to older adults. This confirms that spatial connectivity is an empty metric if it lacks the granular safety features required for inclusive mobility.
4. Discussion
This study provides significant findings that sidewalk infrastructure in the wider area of the Health Center in Aigaleo presents systematic barriers to healthcare access for older adults. The analysis reveals a distinct "healthcare access penalty", where the routes most critical for medical visits are significantly more degraded than the surrounding study area. With an average accessibility score of 2.76 on these routes compared to 3.17 elsewhere, older adults are forced to navigate disproportionately poor infrastructure exactly when their need for reliable mobility is greatest. Suggesting that the urban environment functions as a systemic hurdle, where the safety and mobility choices of older residents are shaped [53,54].
What is mostly concerns, in the identified pattern of environmental injustice, a statistically significant negative correlation (r = -0.20, p < 0.001) confirms that as the density of the elderly population increases, infrastructure quality paradoxically declines. Which is a contradiction that is also documented in socio-spatial disparities in urban environment [2]. Also, it is highlighted that the populations most dependent on walkable environments often encounter the most unsuited physical area, perpetuating a cycle of healthcare disadvantage and social isolation [3]. In parallel, the exceptionally high Moran’s I value of 0.912 was an unexpected but clear indicator of how tightly these infrastructure failures are grouped. Within these zones, older adults’ density reaches 5,457 residents per km2. However, poor sidewalk segments are five times higher than in "Accessibility Islands". This contrast confirms that the urban fabric is fragmented into many spatial patterns [25,30].
Regarding the individual infrastructure components, a failure of safety has been observed. Notably, the near-total lack of marked crosswalks (92.5%) and the high prevalence of obstacles (81.7%), leave older adults with no choice but to risky interactions with vehicles. Coupled with inadequate lighting and protective buffers (at 35.6% and 33.3% respectively), these conditions risen the risk of falls and discourage the active mobility, especially during winter months [36,60]. These gaps, in the urban infrastructure, are acting as a significant constraint for older adults seeking care, likely causing them to skip medical appointments or delay necessary care [32,49].
Delving into the 242 'Low-Low' cluster routes, offers a direct path towards prioritization, of the study area into an age-friendly neighborhood. These clusters, which are characterized by infrastructure failure, are the densest urban blocks of older adult population. In other words, it is mandatory to shift from macro-level planning to micro-level pedestrian interventions. Key factors for urban design, as their deployment, especially the systematic crosswalks, physical buffer zones and improved lighting, can enhance walkability [50,51]. Additionally, the appearance of physical obstacles, in the sidewalk network, suggests that the existing urban design must be reconfigured to maintain a fluid 'walking stream', especially to those who are at risk.
Beyond physical upgrades, strengthening the regulatory framework for sidewalk maintenance and involving older adults directly in the planning process are critical steps toward ensuring health equity. Although this study captures an individual case study of a health center at a specific moment in time, the underlying GIS methodology remains highly adaptable by prioritizing 'easiest' transit paths rather than just 'shortest' distances. Besides, it provides a scalable step-by-step approach for other municipalities. Similarly, the focus should be on connecting public transit and the economic relief they might offer to healthcare system.
5. Conclusions
By investigating the infrastructure surrounding the Health Center in Aigaleo, this study quantifies the sidewalk conditions, shaping healthcare access for older adults. Highlighting, that the sidewalk network has systematically disadvantages for older adults. This isn't just a maintenance issue, but a profound spatial inequality, where the urban environment itself acts as a barrier to health, forming a pattern of exclusion that overrides personal choice and limits the quality of life for the elderly.
The analysis conclusively demonstrates a measurable "healthcare access penalty". Routes specifically leading to the Health Center exhibit significantly worse conditions than the broader study area, effectively taxing the mobility of those who can least afford it. Beyond this, a strong negative correlation between where older adults live, and the quality of their sidewalks has been revealed. Where the most densely populated senior neighborhoods are precisely impacted by systemic infrastructure neglect. Resulting, the creation of gaps in accessibility, where the built environment actively hinders rather than supports healthy aging.
The results emphasized that the sidewalk infrastructure is a health determinant, not just an urban amenity. In which the systemic barriers highlighted in this study (including physical obstacles and infrastructure gaps), create a 'chain of exclusion' that leads directly to delayed medical care and social isolation. This research moves beyond the theoretical 'age-friendly' rhetoric by providing a data-driven, replicable framework. Allowing a deep collaboration across the fields of geography, urban planning, transportation, public health, and community, to shift to precise, empirical interventions that resolve existing accessibility failures. By talking down these spatial barriers, cities can move towards an environment where 'aging in place' is supported.
Author Contributions
Conceptualization, N.S.; methodology, N.S. and K.K.; software, N.S., K.K. and A.T.; validation, Κ.K. and N.S.; formal analysis, N.S. ; data curation, N.S. and K.K.; writing-original draft preparation, N.S.; writing-review and editing, Κ.K., A.T., M.M., and N.S.; visualization, N.S.; All authors have read and agreed to the published version of the manuscript.
Funding
This is financially supported by Special Account for Research Funds of University of West Attica (ELKE UNIWA).
Data Availability Statement
The datasets generated during and/or analysed during the current study are available from the corresponding author on reasonable request.
Conflicts of Interest
The authors declare no conflicts of interest.
References
- Carlson, S.A.; Whitfield, G.P.; Peterson, E.L.; Ussery, E.N.; Watson, K.B.; Berrigan, D.; Fulton, J.E. Creating Walkable Communities: Understanding Trade-Offs. Prev. Chronic Dis. 2018, 15, E123. [Google Scholar] [CrossRef]
- Rajaee, M.; Echeverri, B.; Zuchowicz, Z.; Wiltfang, K.; Lucarelli, J.F. Socioeconomic and racial disparities of sidewalk quality in a traditional rust belt city. SSM Popul. Health 2021, 16, 100975. [Google Scholar] [CrossRef]
- Alves, F.; Cruz, S.; Ribeiro, A.; Bastos Silva, A.; Martins, J.; Cunha, I. Walkability Index for Elderly Health: A Proposal. Sustainability 2020, 12, 7360. [Google Scholar] [CrossRef]
- Stasinos, N.; Tsatsaris, A.; Plakas, S.; Kalogeropoulos, K.; Mastrogianni, T.E.; Mantzorou, M. Exploring Falls in older adults: A GIS approach. Eur. Geriatr. Med. 2024, 15 (Suppl. 1), S1–S419. [Google Scholar] [CrossRef]
- Piergiovanni, S.; Terrier, P. Validity of Linear and Nonlinear Measures of Gait Variability to Characterize Aging Gait with a Single Lower Back Accelerometer. Sensors 2024, 24, 7427. [Google Scholar] [CrossRef]
- Rezaei, A.; Bhat, S. G.; Cheng, C. H.; Pignolo, R. J.; Lu, L.; Kaufman, K. R. Age-related changes in gait, balance, and strength parameters: A cross-sectional study. PloS one 2024, 19(10), e0310764. [Google Scholar] [CrossRef]
- Dubbeldam, R.; Lee, Y.Y.; Pennone, J.; Mochizuki, L.; Le Mouel, C. Systematic review of candidate prognostic factors for falling in older adults identified from motion analysis of challenging walking tasks. Eur Rev Aging Phys Act. 2023, 20, 2. [Google Scholar] [CrossRef]
- Freiberger, E.; Sieber, C.; Kob, R. Mobility in Older Community-Dwelling Persons: A Narrative Review. Front. Physiol. 2020, 11, 881. [Google Scholar] [CrossRef]
- Stasinos, N.; Tsatsaris, A.; Plakas, S.; Kalogeropoulos, K.; Mantzorou, M. Geo-Enabling Public Health: A System-atic Review of GIS Applications. In GeNeDIS 2024; Vlamos, P., Ed.; Advances in Experimental Medicine and Biology; Springer: Cham, Switzerland, 2026; Volume 1487, pp. 201–211. [Google Scholar] [CrossRef]
- Barnett, D.W.; Barnett, A.; Nathan, A.; Van Cauwenberg, J.; Cerin, E. on behalf of the Council on Environment and Physical Activity (CEPA) Older Adult Work Group. Built environmental correlates of older adults’ total physical activity and walking: a systematic review and meta-analysis. Int. J. Behav. Nutr. Phys. Act. 2017, 14, 103. [Google Scholar] [CrossRef]
- Stasinos, N.; Tsatsaris, A.; Plakas, S.; Kalogeropoulos, K.; Mastrogianni, T.E.; Mantzorou, M. Optimizing healthcare access of older adults: The role of GIS. Abstracts of the 20th Congress of the European Geriatric Medicine Society; Eur. Geriatr. Med. 2024, 15 (Suppl 1), S1–S419. [Google Scholar] [CrossRef]
- E, J.; Xia, B.; Chen, Q.; Buys, L.; Susilawati, C.; Drogemuller, R. Impact of the Built Environment on Ageing in Place: A Systematic Overview of Reviews. Buildings 2024, 14, 2355. [Google Scholar] [CrossRef]
- Tao, Y.; Zhang, W.; Gou, Z.; Jiang, B.; Qi, Y. Planning Walkable Neighborhoods for “Aging in Place”: Lessons from Five Aging-Friendly Districts in Singapore. Sustainability 2021, 13, 1742. [Google Scholar] [CrossRef]
- van Biljon, H.; van Niekerk, L.; Margot-Cattin, I.; Adams, F.; Plastow, N.; Bellagamba, D.; Kottorp, A.; Patomella, A. H. Correction: The health equity characteristics of research exploring the unmet community mobility needs of older adults: a scoping review. BMC Geriatr. 2023, 23, 19. [Google Scholar] [CrossRef]
- Lee, S. Falls associated with indoor and outdoor environmental hazards among community-dwelling older adults between men and women. BMC Geriatr. 2021, 21(1), 547. [Google Scholar] [CrossRef]
- Zandieh, R.; Martinez, J.; Flacke, J.; Jones, P.; van Maarseveen, M. Older Adults’ Outdoor Walking: Inequalities in Neighbourhood Safety, Pedestrian Infrastructure and Aesthetics. Int. J. Environ. Res. Public Health 2016, 13, 1179. [Google Scholar] [CrossRef]
- MacLeod, K. E.; Ragland, D. R.; Prohaska, T. R.; Smith, M. L.; Irmiter, C.; Satariano, W. A. Missed or Delayed Medical Care Appointments by Older Users of Nonemergency Medical Transportation. Gerontologist 2014, 55, 1026–1037. [Google Scholar] [CrossRef]
- Patil, D. S.; Bailey, A.; George, S.; Hyde, M.; Ashok, L. Unpacking the role of transport inequalities among older adults for accessing healthcare in Bengaluru, India. Glob. Public Health 2023, 18, 2274438. [Google Scholar] [CrossRef]
- Hellenic Ministry of Infrastructure and Transport (HMIT). Law 4784/2021: Greece on the Move: Sustainable Urban Mobility - Micromobility and Other Provisions; Official Government Gazette (OGG 40/A/9-3-2021): Athens, Greece, 2021.
- Chondrogianni, D.; Stephanedes, Y.J.; Saranti, P.-G. Regenerating Athens City Center to a Low Pollution and Restricted Vehicle Traffic Zone. In Lecture Notes in Intelligent Transportation and Infrastructure; Springer: Cham, Switzerland, 2023; p. 1654. [Google Scholar] [CrossRef]
- Bartzokas-Tsiompras, A.; Photis, Y.N. Microscale walkability modelling. The case of Athens city centre. International Journal of Sustainable Development and Planning 2021, 16, 413–426. [Google Scholar] [CrossRef]
- Ptak-Wojciechowska, A.; Gawlak, A.; Maciejewski, P.; Romaniv, D.; Skrzypek, M.; Brzeziński, D.; Stefanowski, J. Developing and Validating a Data-Driven Application for Street-Accessible Urban Bench Analysis and Planning to Support Evidence-Based Decision Making in Age-Friendly, Sustainable Cities. Sustainability 2025, 17, 8251. [Google Scholar] [CrossRef]
- Akinci, Z. S.; Delclòs-Alió, X.; Vich, G.; Salvo, D.; Ibarluzea, J.; Miralles-Guasch, C. How different are objective operationalizations of walkability for older adults compared to the general population? A systematic review. BMC Geriatr. 2022, 22(1), 673. [Google Scholar] [CrossRef]
- Winters, M.; Voss, C.; Ashe, M.C.; Gutteridge, K.; McKay, H.; Sims-Gould, J. Where do they go and how do they get there? Older adults’ travel behaviour in a highly walkable environment. Social science & medicine 2015, 133, 304–312. [Google Scholar] [CrossRef]
- Hellenic Statistical Authority (ELSTAT). 2021 Population-Housing Census; ELSTAT: Piraeus, Greece, 2025. [Google Scholar]
- Amaya, V.; Moulaert, T.; Gwiazdzinski, L.; Vuillerme, N. Assessing and Qualifying Neighborhood Walkability for Older Adults: Construction and Initial Testing of a Multivariate Spatial Accessibility Model. Int. J. Environ. Res. Public Health 2022, 19, 1808. [Google Scholar] [CrossRef]
- Chalkiadakis, C.; Tzanis, D. Enabling older citizens safe mobility: The ACTIVAGE approach. arXiv 2020, arXiv:2010.07298. [Google Scholar] [CrossRef]
- Kalogeropoulos, K.; Fragkopoulos, D.; Andreopoulos, P.; Tragaki, A. Shifting Sands: Examining and Mapping the Population Structure of Greece Through the Last Three Censuses. Economies 2024, 12, 294. [Google Scholar] [CrossRef]
- Faka, A.; Kalogeropoulos, K.; Maloutas, T.; Chalkias, C. Urban Quality of Life: Spatial Modeling and Indexing in Athens Metropolitan Area, Greece. ISPRS Int. J. Geo-Inf. 2021, 10, 347. [Google Scholar] [CrossRef]
- Wang, Z.; Shepley, M. The Relationship of Neighborhood Walking Behavior to Duration of Aging in Place—A Retrospective Cohort Study. Int. J. Environ. Res. Public Health 2022, 19, 16428. [Google Scholar] [CrossRef]
- Yu, Y.; Dong, T. Deep Learning-Driven Geospatial Modeling of Elderly Care Accessibility: Disparities Across the Urban-Rural Continuum in Central China. Appl. Sci. 2025, 15, 4601. [Google Scholar] [CrossRef]
- Koller, D.; et al. A Framework for Measuring Neighborhood Walkability for Older Adults-A Delphi Consensus Study. J. Urban Health 2024. [Google Scholar] [CrossRef]
- Cerin, E.; Barnett, A.; Zhang, C.J.P.; Lai, P.C; Sit, C.H.P.; Lee, R.S.Y. How urban densification shapes walking behaviours in older community dwellers: a cross-sectional analysis of potential pathways of influence. Int J Health Geogr. 2020, 19, 14. [Google Scholar] [CrossRef]
- Clarke, P.; Gallagher, N.A. Optimizing Mobility in Later Life: The Role of the Urban Built Environment for Older Adults Aging in Place. J. Urban Health 2013, 90, 997–1009. [Google Scholar] [CrossRef]
- Stefanidis, R.-M.; Bartzokas-Tsiompras, A. Pedestrian Accessibility Analysis of Sidewalk-Specific Networks: Insights from Three Latin American Central Squares. Sustainability 2024, 16, 9294. [Google Scholar] [CrossRef]
- Emad, Y.; Neef, S.P.; Taylor, L.; Kerse, N.; Cavadino, A.; Moyes, S.A.; Comber, K.; Wu, X.S.; Molloy, J.; Bacon, C.J. Shedding Light on Falls: The Effect of Lighting Levels on Fall Risk in Long-Term Residential Care Facilities. J. Appl. Gerontol. 2025, 44, 1318–1327. [Google Scholar] [CrossRef]
- Karamitov, K.; Petrova-Antonova, D. Pedestrian Accessibility Assessment Using Spatial and Network Analysis: A Case of Sofia City. Int. Arch. Photogramm. Remote Sens. Spat. Inf. Sci. 2022, XLVIII-4/W5, 53–60. [Google Scholar] [CrossRef]
- National Public Health Organization (NPHO). Primary Healthcare Providers and Health Centers Registry. Available online: https://eody.gov.gr/ (accessed on 25 January 2026).
- Kochtitzky, C.S.; Freeland, A.; Yen, I.H. Ensuring Mobility-Supporting Environments for an Aging Population: Critical Actors and Collaborations. J. Aging Res. 2011, 2011, 138931. [Google Scholar] [CrossRef]
- Rosenberg, D.E.; Huang, D.L.; Simonovich, S.D.; Belza, B. Outdoor Built Environment Barriers and Facilitators to Activity among Midlife and Older Adults with Mobility Disabilities. Gerontologist 2013, 53, 268–279. [Google Scholar] [CrossRef]
- Fonseca, F.; Rodrigues, A.; Silva, H. Pedestrian Perceptions of Sidewalk Paving Attributes: Insights from a Pilot Study in Braga. Infrastructures 2025, 10, 79. [Google Scholar] [CrossRef]
- Wojnowska-Heciak, M.; Heciak, J.; Kłak, A. Concrete Paving Slabs for Comfort of Movement of Mobility-Impaired Pedestrians—A Survey. Int. J. Environ. Res. Public Health 2022, 19, 3183. [Google Scholar] [CrossRef]
- Paudel, C.; Timperio, A.; Loh, V.; Deforche, B.; Salmon, J.; Veitch, J. Understanding the relative importance of micro-level design characteristics of walking paths in parks to promote walking among older adults. Urban For. Urban Green. 2023, 89, 128129. [Google Scholar] [CrossRef]
- Gálvez-Pérez, D.; Guirao, B.; Ortuño, A.; Picado-Santos, L. The Influence of Built Environment Factors on Elderly Pedestrian Road Safety in Cities: The Experience of Madrid. Int. J. Environ. Res. Public Health 2022, 19, 2280. [Google Scholar] [CrossRef]
- Anderson, J.C.; Kothuri, S.; Monsere, C.; Hurwitz, D. Systemic Opportunities to Improve Older Pedestrian Safety: Merging Crash Data Analysis and a Stakeholder Workshop. Transp. Res. Rec. 2022, 2676, 351–360. [Google Scholar] [CrossRef]
- Bhagavathula, R.; Gibbons, R.B.; Kassing, A. Roadway Lighting’s Effect on Pedestrian Safety at Intersection and Midblock Crosswalks; Report No. 21-028; Virginia Tech Transportation Institute: Blacksburg, VA, USA, 2021. [Google Scholar] [CrossRef]
- Vignali, V.; Cuppi, F.; Acerra, E.; Bichicchi, A.; Lantieri, C.; Simone, A.; Costa, M. Effects of median refuge island and flashing vertical sign on conspicuity and safety of unsignalized crosswalks. Transp. Res. Part F Traffic Psychol. Behav. 2019, 60, 427–439. [Google Scholar] [CrossRef]
- Yin, L. An Exploration and a Participatory Study Toolkit: Identifying the Relationship between Pavements and Older Pedestrians. Ph.D. Thesis, Brunel University, London, UK, 2019. Available online: https://bura.brunel.ac.uk/bitstream/2438/19615/1/FulltextThesis.pdf (accessed on 20 December 2025).
- Horák, J.; Kukuliac, P.; Koktava, N.; Orlikova, L.; Maresova, P. Impact of street-level barriers on walking accessibility for persons with declining mobility: Comparison of two cities. Cities 2025, 166, 106220. [Google Scholar] [CrossRef]
- Gálvez-Pérez, D.; Guirao, B.; Ortuño, A. Age-Friendly Urban Design for Older Pedestrian Road Safety: A Street Segment Level Analysis in Madrid. Sustainability 2024, 16, 8298. [Google Scholar] [CrossRef]
- Tuckett, A.; Banchoff, A.W.; Winter, S.J.; King, A.C. The built environment and older adults: A literature review and an applied approach to engaging older adults in built environment improvements for health. Int. J. Older People Nurs. 2018, 13, e12171. [Google Scholar] [CrossRef]
- Mantilla, J.I.A.; Burtt, D. Safer Road Design for Older Pedestrians; Victoria Transport Policy Institute: Victoria, BC, Canada, 2016; Available online: https://trid.trb.org/view.aspx?id=1423732 (accessed on 15 December 2025).
- Klein, S.; Brondeel, R.; Chaix, B.; Klein, O.; Thierry, B.; Kestens, Y.; Gerber, P.; Perchoux, C. What triggers selective daily mobility among older adults? A study comparing trip and environmental characteristics between observed path and shortest path. Health & Place 2023, 79, 102730. [Google Scholar] [CrossRef]
- Cerin, E; Nathan, A; van Cauwenberg, J; Barnett, DW; Barnett, A. Council on Environment and Physical Activity (CEPA) - Older Adults working group. The Neighbourhood Physical Environment and Active Travel in Older Adults: A Systematic Review and Meta-Analysis. J. Transp. Health 2017, 7, 15–39. [Google Scholar] [CrossRef]
- Jiang, J.; Xia, Z.; Sun, X.; Wang, X.; Luo, S. Social Infrastructure and Street Networks as Critical Infrastructure for Aging Friendly Community Design: Mediating the Effect of Physical Activity. Int. J. Environ. Res. Public Health 2022, 19, 11842. [Google Scholar] [CrossRef]
- Perchoux, C.; Brondeel, R.; Wasfi, R.; Klein, O.; Caruso, G.; Vallée, J.; Klein, S.; Thierry, B.; Dijst, M.; Chaix, B.; et al. Walking, Trip Purpose, and Exposure to Multiple Environments: A Case Study of Older Adults in Luxembourg. J. Transp. Health 2019, 13, 170–184. [Google Scholar] [CrossRef]
- Fotios, S.; Unwin, J.; Farrall, S. Road lighting and pedestrian reassurance after dark: A review. Light. Res. Technol. 2014, 47, 449–469. [Google Scholar] [CrossRef]
- Portnov, B.A.; Saad, R.; Trop, T.; Kliger, D.; Svechkina, A. Linking nighttime outdoor lighting attributes to pedestrians’ feeling of safety: An interactive survey approach. PLoS ONE 2020, 15, e0242172. [Google Scholar] [CrossRef]
- Grant, L.K.; St Hilaire, M.A.; Heller, J. P.; Heller, R. A.; Lockley, S. W.; Rahman, S. A. Impact of Upgraded Lighting on Falls in Care Home Residents. J. Am. Med. Dir. Assoc. 2022, 23, 1698–1704.e2. [Google Scholar] [CrossRef]
- Thölking, T.W.; Lamers, E.C.T.; Rikkert, M.G.M.O. A Guiding Nightlight Decreases Fear of Falling and Increases Sleep Quality of Community-Dwelling Older People: A Quantitative and Qualitative Evaluation. Gerontology 2020, 66, 295–303. [Google Scholar] [CrossRef]
- Brookfield, K.; Ward Thompson, C.; Scott, I. The Uncommon Impact of Common Environmental Details on Walking in Older Adults. Int. J. Environ. Res. Public Health 2017, 14, 190. [Google Scholar] [CrossRef]
- Buo, I.; Sagris, V.; Jaagus, J.; Middel, A. High-resolution thermal exposure and shade maps for cool corridor planning. Sustain. Cities Soc. 2023, 93, 104499. [Google Scholar] [CrossRef]
- Litman, T. Cool walkability planning: Providing pedestrian thermal comfort in hot climate cities. J. Civ. Eng. Environ. Sci. 2023, 9, 79–86. [Google Scholar] [CrossRef]
- Močnik, Š.; Moogoor, A.; Yuen, B. Exploring facilitators and barriers of older adults’ outdoor mobility: A walk-along study in Singapore. J. Transp. Health 2022, 26, 101386. [Google Scholar] [CrossRef]
- Tomasi, M.; Nikolopoulou, M.; Giridharan, R.; Löve, M.; Ratti, C. Definition of a maximum threshold of direct solar radiation exposure for pedestrians of diverse walking abilities. Int. J. Biometeorol. 2024, 68, 17–31. [Google Scholar] [CrossRef]
- Kevern, J.T.; King, G.W.; Bruetsch, A.P. A. Pervious Concrete Surface Characterization to Reduce Slip-Related Falls. J. Perform. Constr. Facil. 2012, 26, 526–531. [Google Scholar] [CrossRef]
- Ma, J.; Zheng, S.; Zhang, Z.; Han, B.; Geng, D.; Hong, X.; Yu, G.; Li, Y.; Li, L.; Cheng, C. Evaluation of Skid Resistance and Comfort of Pedestrian Pavement with Asphalt-Based Wood Chip. Buildings 2024, 14, 1512. [Google Scholar] [CrossRef]
- Georgescu, A.I.; Allahbakhshi, H.; Weibel, R. The impact of microscale street elements on active transport of mobility-restricted individuals: A systematic review. J. Transp. Health 2024, 38, 101842. [Google Scholar] [CrossRef]
- Apparicio, P.; Abdelmajid, M.; Riva, M.; Shearmur, R. Comparing alternative approaches to measuring the geographical accessibility of urban health services: Distance types and aggregation-error issues. Int. J. Health Geogr. 2008, 7, 7. [Google Scholar] [CrossRef]
- Nguyen, D.T.; Penta, M.; Chinh, N.V.; Sauvage, C. Comparison of walking performance with the 6-minute and the 2-minute walk tests in elderly living in the community and in a nursing home. J. Rehabil. Res. Pract. 2025, 6, 9–16. [Google Scholar] [CrossRef]
- Bohannon, R. W.; Bubela, D.; Magasi, S.; McCreath, H.; Wang, Y. C.; Reuben, D.; Rymer, W. Z.; Gershon, R. Comparison of walking performance over the first 2 minutes and the full 6 minutes of the Six-Minute Walk Test. BMC Res. Notes 2014, 7, 269. [Google Scholar] [CrossRef]
- Shumway-Cook, A.; Patla, A.E.; Stewart, A.; Ferrucci, L.; Ciol, M.A.; Guralnik, J.M. Environmental Demands Associated With Community Mobility in Older Adults With and Without Mobility Disabilities. Phys. Ther. 2002, 82, 670–681. [Google Scholar] [CrossRef]
Figure 1.
Study area location and the 500-meter walking catchment zone, surrounding the Health Center in Aigaleo. The red catchment area, represents the functional walking distance, established to evaluate micro-scale accessibility features within a critical walking distance for older adults.
Figure 1.
Study area location and the 500-meter walking catchment zone, surrounding the Health Center in Aigaleo. The red catchment area, represents the functional walking distance, established to evaluate micro-scale accessibility features within a critical walking distance for older adults.
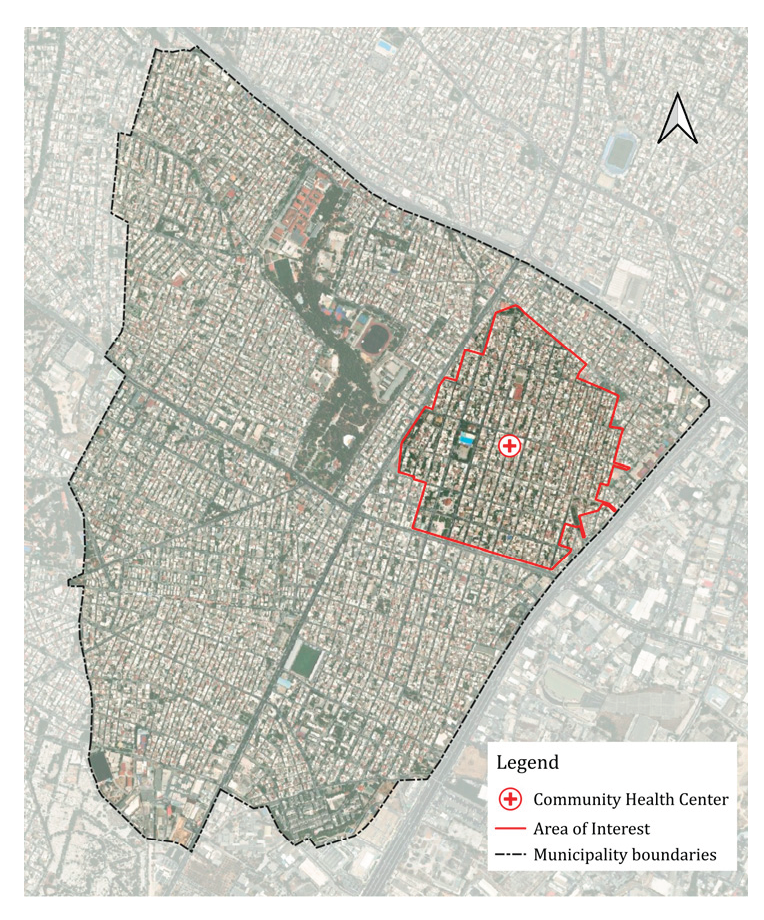
Figure 2.
Correlation between senior population density (older_adults_density) and mean pedestrian accessibility (mean_accessibility). The scatter plot demonstrates this systemic inverse relationship (r=−0.203, p<0.001), highlighting that the most 'aged' blocks are frequently the most underserved.
Figure 2.
Correlation between senior population density (older_adults_density) and mean pedestrian accessibility (mean_accessibility). The scatter plot demonstrates this systemic inverse relationship (r=−0.203, p<0.001), highlighting that the most 'aged' blocks are frequently the most underserved.
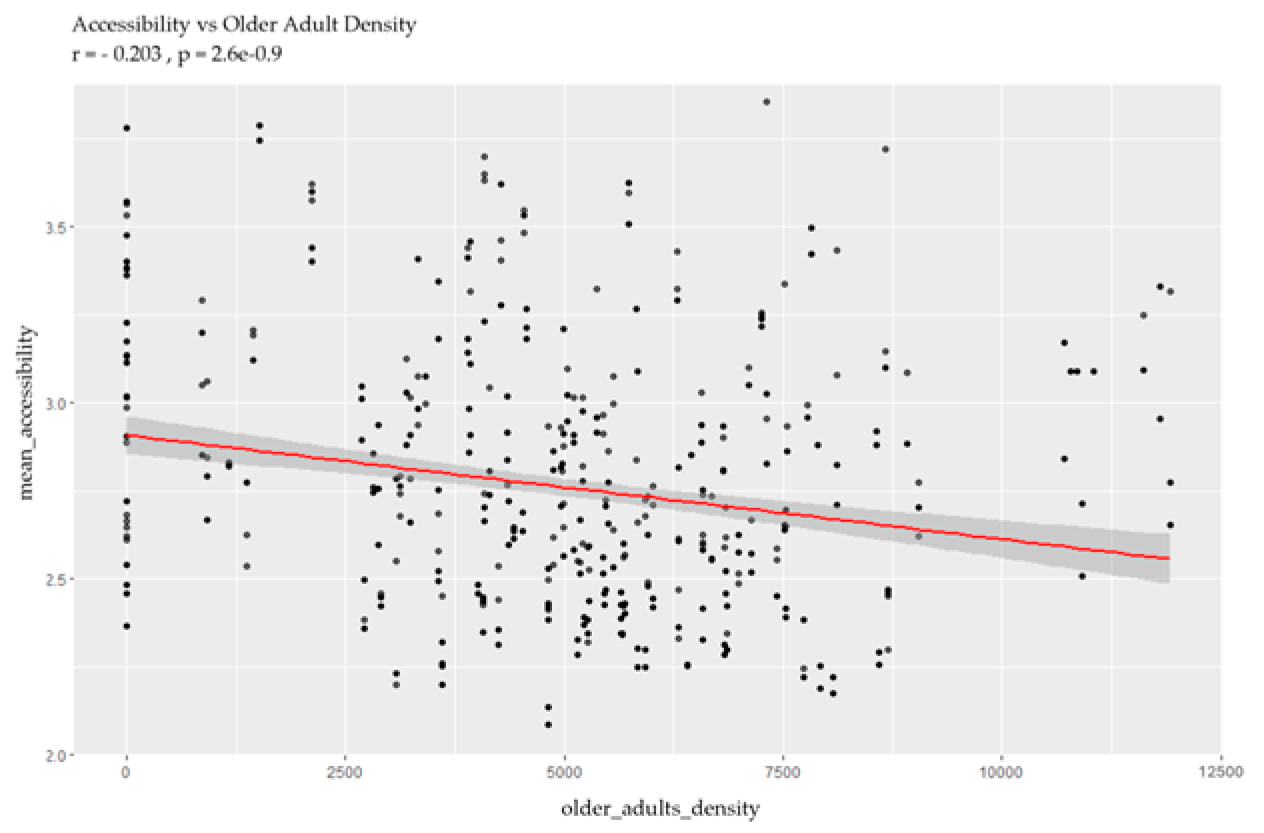
Figure 3.
Sidewalk accessibility analysis: (a) Local Indicators of Spatial Association (LISA) for sidewalk quality. The analysis identified significant spatial autocorrelation (50.8%), highlighting "Accessibility Deserts" (Low-Low clusters in light blue) and "Accessibility Islands" (High-High clusters in orange). The high Moran’s I value of 0.912 (p<0.001) confirms that infrastructure gaps are concentrated in specific zones, creating systemic barriers for local mobility. (b) Getis-Ord Gi* Hot Spot map for pedestrian accessibility. By identifying 242 statistically significant 'Cold Spots' (orange) and 187 'Hot Spots' (green), this analysis provides a robust validation of the previously identified spatial patterns. This dual-method approach confirms that the 'Accessibility Deserts' are not isolated incidents but part of a larger, consistently under-resourced pedestrian landscape.
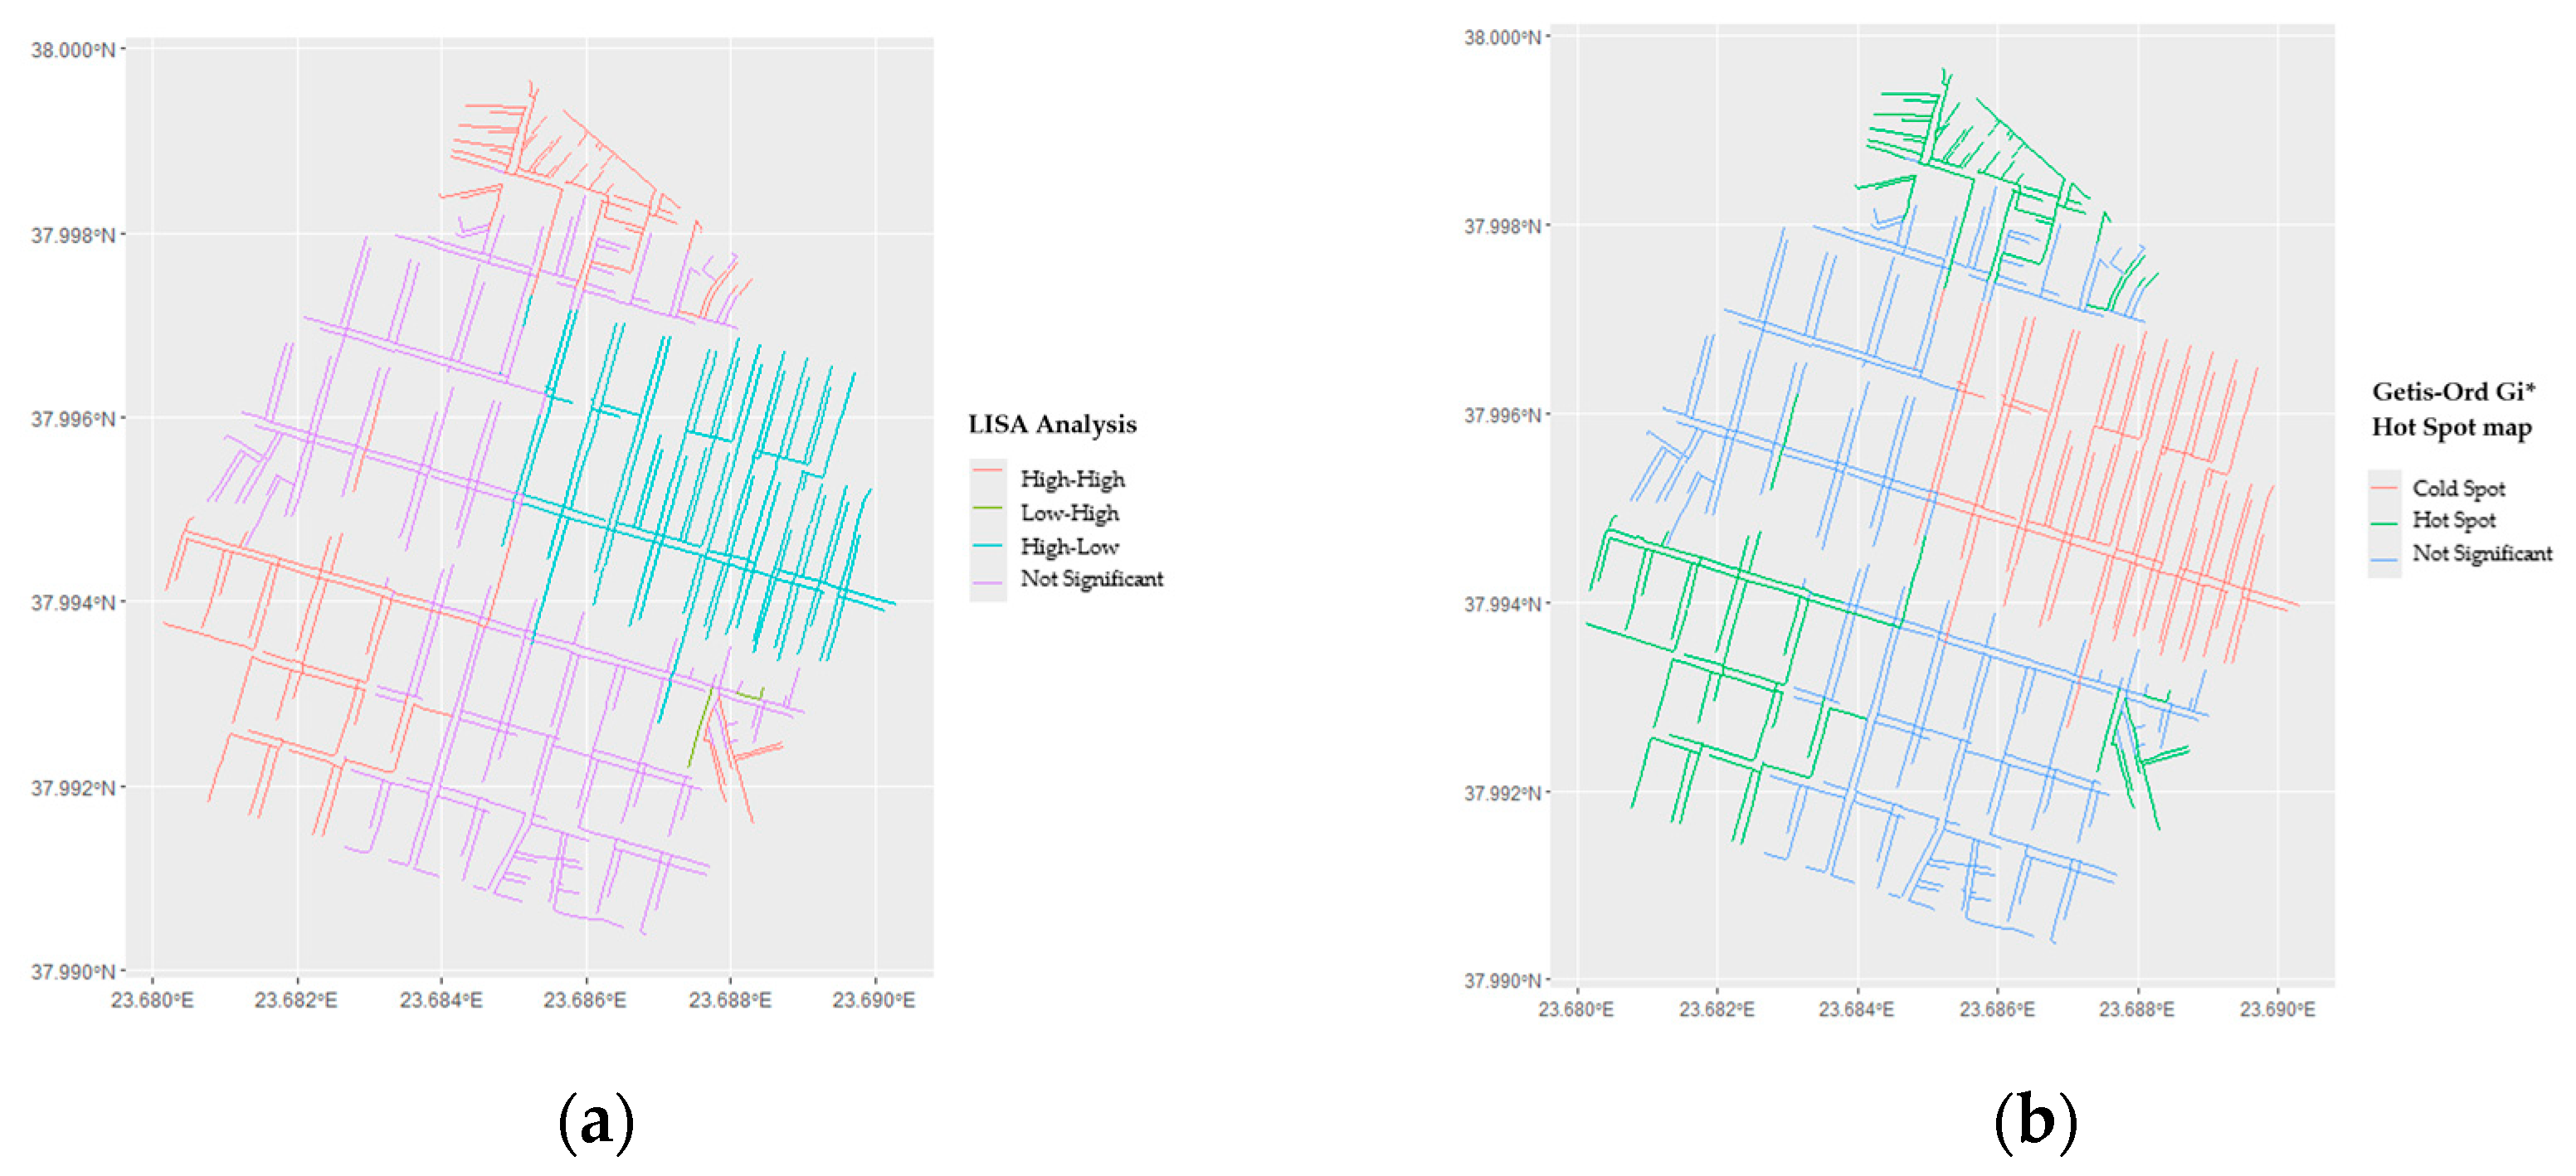
Figure 4.
Distribution of infrastructure deficiencies and their impact on walkability. Percentages indicate segments scoring 0 on specific factors, with missing crosswalks (92.5%), high obstacles (81.7%), and no resting place (75.9%) emerging as the primary deterrents to safe walking.
Figure 4.
Distribution of infrastructure deficiencies and their impact on walkability. Percentages indicate segments scoring 0 on specific factors, with missing crosswalks (92.5%), high obstacles (81.7%), and no resting place (75.9%) emerging as the primary deterrents to safe walking.
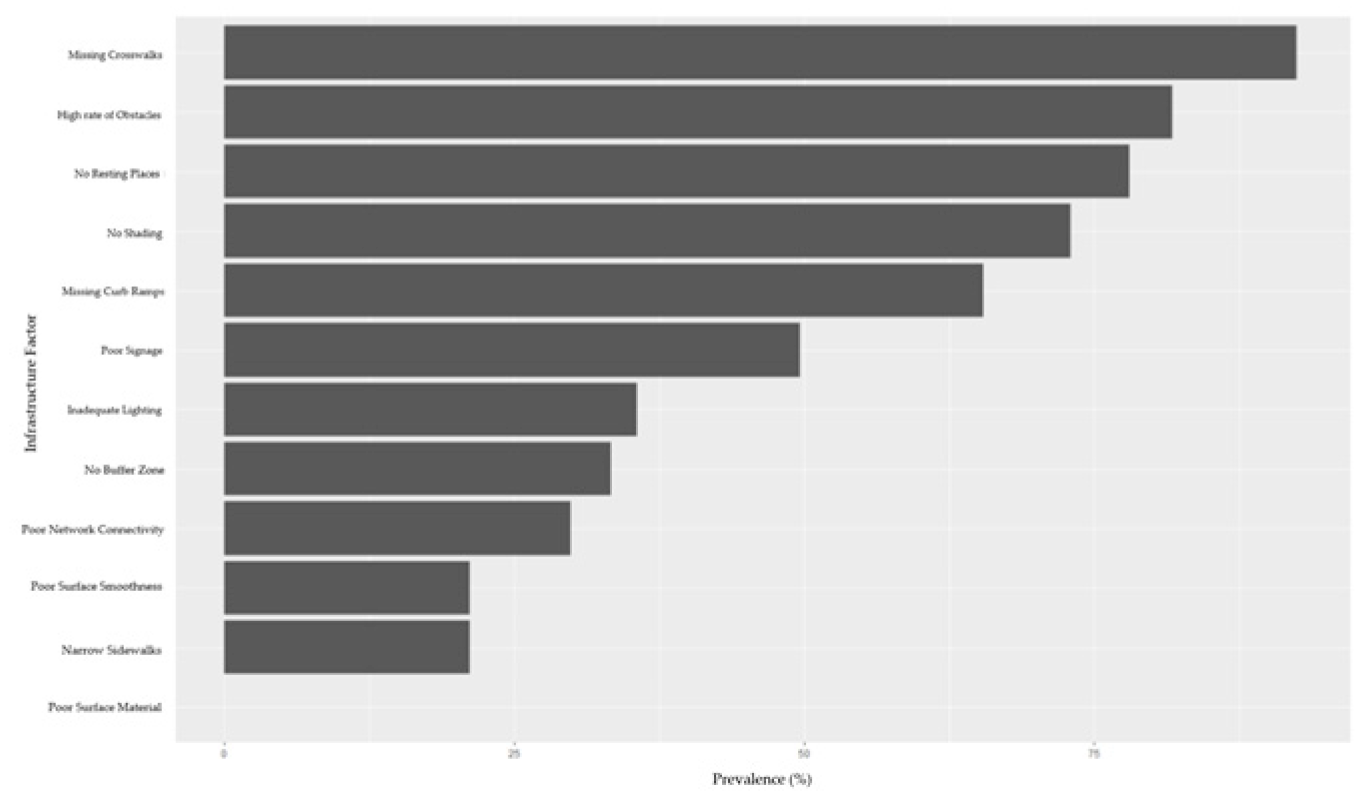
Figure 5.
Factor Deficit Analysis, comparing Health Center routes to the broader study area. The horizontal bars indicate the percentage difference in average scores, where green bars (negative values) represent structural advantages of health routes (e.g., fewer obstacles and better connectivity), and red bars (positive values) represent critical deficiencies in micro-scale infrastructure (e.g., lighting and curb ramps) essential for older adults.
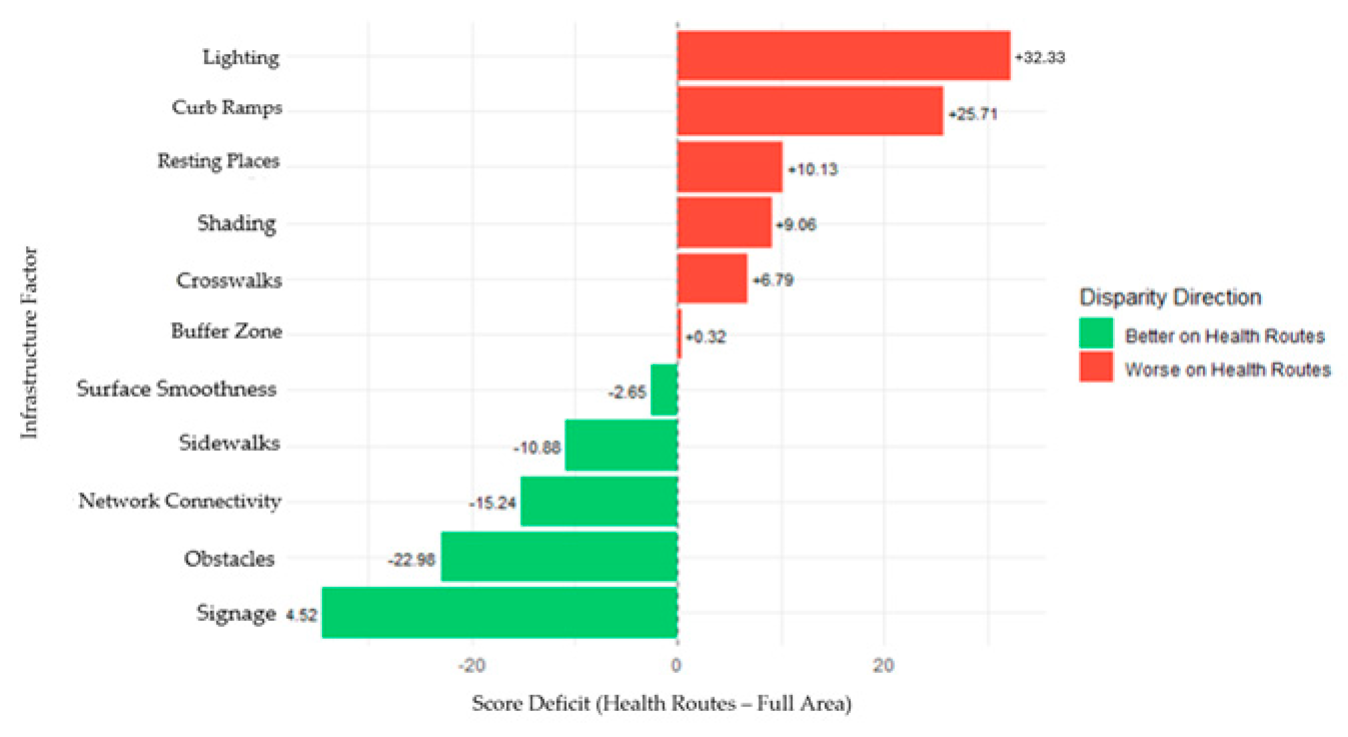

Table 1.
Micro-scale infrastructure factors for evaluating older adults' accessibility, including the weighted importance and compliance thresholds for the 0-2 scoring scale.
Table 1.
Micro-scale infrastructure factors for evaluating older adults' accessibility, including the weighted importance and compliance thresholds for the 0-2 scoring scale.
| Accessibility Factor | Weight (%) | Score 0 (Significant Barrier) | Score 1 (Partially Accessible) | Score 2 (Fully Accessible) | References |
|---|---|---|---|---|---|
| Curb Ramps | 15% | Absent | Present but non-compliant | Present and compliant | Sidewalks and curbs can sometimes act as barriers for people with disabilities, including age-related disabilities [39]. The presence and the status of curb ramps are key elements, focusing on older adults with mobility disabilities [40]. |
| Surface Smoothness | 15% | Severe cracks/uplift | Minor cracks | Smooth, even surface | Poor sidewalk conditions, (uneven or cracked sidewalks), are linked to outdoor falls, specifically for vulnerable age groups, like older adults [41]. Sidewalk quality significantly affects pedestrians, especially for those with difficulties [42]. |
| Sidewalk Width | 15% | <1.0m | 1.0-1.5m | >1.5m | Wider sidewalks, are generally preferred by older adults, as they offer more space, are safer and reduce the risk of injury [43,44]. |
| Crosswalks | 10% | Unmarked | Marked but faded | Highly visible | Crosswalks are important factors, influencing the mobility of older adults [39]. The more visible the crosswalks are, the safer the neighborhood is [45,46,47]. |
| Obstacles | 10% | Frequent clutter | Occasional obstacles | Minimal or none | Broken pavement tiles, parked vehicles, and overgrown plants, that can be documented as sidewalk obstacles, are hazardous factors [48]. Minimizing obstacles on the sidewalk network, older adults are keen to walk independently [49]. |
| Buffer Zone | 7% | No buffer | Narrow strip (<0.5m) | Wide buffer (>0.5m) | Buffer zones, can be characterized as a safety strip of space between the sidewalk and the street. Providing physical separation from vehicular traffic, elements like bushes, metal fences, help to prevent collisions [50,51,52]. |
| Network Connectivity | 7% | Dead-end | Minor detour required | Continuous | Sidewalk continuity is vital for promoting walking and maintaining the quality of life of older adults [53,54,55,56]. |
| Lighting | 5% | No streetlights | Sporadic lighting | Consistent lighting | Securing safety after dark, with consistent street lighting, is crucial for pedestrians as well as the older adults [57,58]. Street lights, can significantly reduce the risk of falls for older adults by improving visibility, especially during evenings [59,60]. |
| Resting Places | 5% | No benches in 200m | 1 bench in 200m | Multiple benches | The availability of benches is strongly associated with the encouragement of outdoor social interaction, which is the most important asset of the physical activity among older adults [43,61]. |
| Shading | 5% | No shading | Partial shading | Full/heavy shading | Crucial for protecting heat-vulnerable older adults in Mediterranean climates [62,63,64,65]. |
| Surface Material | 4% | Gravel/dirt | Asphalt/brick | Smooth concrete | Choice of material impacts slip resistance, stability, and walking comfort [41,66,67]. |
| Signage Poles | 2% | Major obstacle | Minor obstacle | Well-placed/none | Poorly placed furniture restricts effective width and complicates navigation [68]. |
Disclaimer/Publisher’s Note: The statements, opinions and data contained in all publications are solely those of the individual author(s) and contributor(s) and not of MDPI and/or the editor(s). MDPI and/or the editor(s) disclaim responsibility for any injury to people or property resulting from any ideas, methods, instructions or products referred to in the content. |
© 2026 by the authors. Licensee MDPI, Basel, Switzerland. This article is an open access article distributed under the terms and conditions of the Creative Commons Attribution (CC BY) license (http://creativecommons.org/licenses/by/4.0/).
Copyright: This open access article is published under a Creative Commons CC BY 4.0 license, which permit the free download, distribution, and reuse, provided that the author and preprint are cited in any reuse.


