Submitted:
03 February 2026
Posted:
05 February 2026
You are already at the latest version
Abstract
While pricing policy has emerged as a critical demand-side lever for decarbonizing mobility, its bidirectional effects on modal shift remain unexplored. Dynamic pricing in high-speed rail (HSR) creates a double-edged environmental outcome: advance discounts attract passengers from aviation, yet last-minute premiums may reverse these gains. Using 2.4 million price observations from Madrid--Barcelona, we introduce a carbon leakage framework that quantifies this phenomenon for the first time. Our analysis reveals a structural tension: while early-bird pricing attracts 274,431 annual passengers from aviation---saving 23,650 tonnes CO2/year---last-minute scarcity premiums systematically drive passengers back to air travel. Literature-calibrated elasticity estimation (ε = −0.95) shows that 22.3% of last-minute tickets exceed the \euro{}120 aviation threshold, creating 1,511 tonnes CO2 leakage annually (6.4% offset of gross savings). Critically, scenario analysis demonstrates that price caps at \euro{}110--120 eliminate leakage entirely while preserving 94% of operator revenue. These findings establish actionable thresholds for carbon-aware revenue management, demonstrating that demand-side decarbonization requires not only attracting passengers to sustainable modes but also preventing their reversal to high-carbon alternatives.
Keywords:
demand-sideintervention
; modalshift
; carbonleakage
; decarbonizingmobility
; high-speed rail
; dynamic pricing
; sustainable transport
1. Introduction
Decarbonizing mobility requires coordinated interventions across technology, infrastructure, and demand management. Yet while supply-side strategies—electrification, alternative fuels, and energy-efficient infrastructure—have dominated policy discourse and absorbed the bulk of public investment, demand-side interventions that reshape travel behavior and modal choice remain critically underexploited despite offering immediate carbon reduction potential without requiring decades-long capital commitments [1]. Pricing policy represents perhaps the most powerful yet least understood demand-side lever: by altering the relative cost of competing transport modes, strategic pricing can instantaneously induce modal shift from high-carbon aviation to low-carbon rail. However, the environmental effectiveness of pricing interventions depends critically on their design. Poorly calibrated pricing does not merely fail to attract passengers—it actively repels them, creating unintended reverse flows that undermine sustainability objectives while remaining invisible in current policy frameworks.
Transportation contributes 25% of EU greenhouse gas emissions, with aviation emissions surging even as other sectors decarbonize [2]. Meeting the European Green Deal’s target—a 90% emissions cut by 2050 [3]—requires aggressive modal shift from aviation (250 g /pkm) to electrified HSR (14 g /pkm), an 18-fold intensity differential [4]. Yet achieving this shift at scale demands more than infrastructure investment; it requires pricing policies that sustain behavioral change once travelers switch modes. Attracting passengers to rail means little if poorly designed fares immediately push them back to aviation.
The Madrid–Barcelona corridor—where HSR captured dominant market share from aviation after 2008 [5]—offers a critical test case. With over 15 million annual travelers and intense price competition following recent market liberalization, this corridor operates at the frontier of dynamic pricing sophistication. If carbon leakage emerges here, it will proliferate across Europe’s expanding HSR networks, systematically undermining Green Deal targets through pricing decisions that prioritize short-term revenue over long-term climate commitments.
Dynamic pricing—adjusting fares in real-time based on demand, booking horizons, and capacity—operates as a double-edged sword for decarbonization. Low advance-purchase fares lure passengers from aviation to rail, saving carbon. High last-minute fares repel them back to air travel, leaking carbon. This bidirectional flow—what we term bidirectional modal shift—means pricing simultaneously decarbonizes and re-carbonizes the same corridor. The net environmental effect hinges on which force dominates: attraction or leakage. We introduce the concept of carbon leakage to quantify this environmental cost—the emitted when yield management pushes HSR fares so high that passengers defect to aviation, undoing the carbon savings achieved through advance-purchase discounts. If unchecked, this leakage transforms dynamic pricing from a climate solution into a climate liability.
Yet a critical oversight pervades this literature: it documents only how pricing attracts passengers to HSR, never how it repels them back to aviation. Studies celebrate reductions in aviation demand following HSR entry [6,7], but remain silent on the reverse flows triggered when HSR fares spike beyond competitive thresholds. This unidirectional bias assumes that modal shift, once achieved, is permanent—that passengers captured by early-bird discounts remain loyal even when last-minute fares surge to €200 or more. In reality, travelers continuously re-optimize their mode choice as prices fluctuate. When HSR yield management pushes fares above aviation equivalents, price-sensitive passengers defect, creating a reverse modal shift that leaks carbon back into the atmosphere. No prior study has quantified this leakage or identified the price thresholds where environmental gains unravel.
This study addresses this gap by investigating four research questions: (1) What is the price elasticity of demand for HSR on the Madrid–Barcelona corridor? (2) At what price thresholds do travelers shift bidirectionally between rail and air? (3) How much carbon is saved through modal attraction versus leaked through last-minute pricing? (4) What pricing policies maximize net carbon reduction while maintaining operator viability?
This study makes three contributions that reposition dynamic pricing within demand-side decarbonization frameworks. First, we introduce the bidirectional modal shift framework and provide the first empirical quantification of carbon leakage in transport pricing: 1,511 tonnes /year leaking back to aviation, offsetting 6.4% of carbon gains achieved through modal attraction. This finding emerges from analyzing 2.4 million fare observations—the largest revealed pricing dataset in HSR–aviation competition research—enabling precise identification of the fare thresholds (€110–120) where passengers defect from rail to air. Second, we deliver policy-actionable intervention thresholds: price caps at €110–120 eliminate leakage entirely while preserving 94% of operator revenue, offering regulators a precise calibration point where commercial interests and climate objectives align. This directly operationalizes the European Green Deal’s modal shift mandate by identifying the exact pricing boundary where demand management transitions from decarbonization lever to environmental liability. Third, we reframe HSR dynamic pricing from a revenue-only optimization problem to a multi-objective instrument balancing profit, ridership, and carbon outcomes, providing an analytical template for evaluating the climate footprint of pricing policies across transport modes.
2. Literature Review
2.1. HSR–Aviation Intermodal Competition and Modal Choice Behavior
The theoretical foundation for understanding rail–aviation competition rests on the random utility maximization framework, in which travelers select the mode that maximizes their perceived utility based on generalized cost—a composite of monetary price, travel time, and service attributes [8,9]. Discrete choice models, particularly the multinomial and nested logit specifications, have become the dominant analytical tools for estimating modal substitution probabilities on corridors where HSR and aviation coexist [10,11].
A substantial body of empirical evidence has documented HSR’s capacity to capture market share from short-haul aviation. Early corridor-level studies demonstrated substantial aviation demand declines within years of HSR entry on competitive medium-distance routes, with the magnitude depending on travel time competitiveness, frequency, and fare structures [4,5]. The Madrid–Barcelona corridor—the empirical focus of this study—represents one of Europe’s most successful modal shift cases, with HSR achieving dominant market share following AVE service introduction in 2008. More broadly, Dobruszkes [6] showed that HSR effectively substitutes for aviation across Western European corridors where rail journey times remain competitive with door-to-door aviation travel including airport access and security screening.
Recent research has extended these findings in several directions. Borsati and Albalate [12] provided robust evidence from Italy showing that HSR introduction shifted traffic primarily from motorways rather than aviation on medium-distance corridors, highlighting the importance of corridor-specific modal substitution patterns. Wang et al. [7] modeled the effects of low-cost HSR entry on the Paris–Marseille corridor, demonstrating that fare-based competition with aviation intensifies when discount operators enter HSR markets—a dynamic now unfolding on the Madrid–Barcelona corridor following the entry of Ouigo and iryo [13]. Recent game-theoretic analyses have formalized this competition: Evgeniia et al. [14] examined potential European HSR corridors, finding that HSR achieves competitive equilibrium on medium-distance routes where journey times remain sufficiently short, while aviation maintains advantages on longer routes where time-sensitive travelers dominate. Lee et al. [15] further demonstrated that under travel time variability, HSR–aviation relationships can shift from pure competition to collaboration, with rail serving as airport access for hub-and-spoke networks—though this complementarity depends critically on price coordination to avoid passenger leakage across modes. Li [16] developed a bi-level optimization model demonstrating that HSR can absorb passenger demand from aviation when accompanied by carbon taxation. Bursa and Tappeiner [17] employed a discrete choice experiment finding that travel time, price, and environmental information are the most influential attributes driving tourist modal shift to rail. Pukhova et al. [18] used agent-based simulation in Germany, demonstrating that restricting short-haul flights could substantially reduce transport emissions. The emerging debate around short-haul flight bans in France, Austria, and other EU member states [19] further underscores the policy relevance of understanding price-driven modal substitution.
Yet these advances share a common blind spot: they uniformly assume modal shift is unidirectional. Studies document flows from aviation to HSR—celebrating each percentage-point gain in rail market share—but remain silent on the reverse current. When HSR fares surge beyond aviation equivalents, do passengers remain loyal to rail? Or do they defect back to air travel, leaking carbon in the process? Existing research implicitly assumes permanence: that passengers captured by early-bird discounts stay captured, even when last-minute fares double or triple. This oversight is not merely academic—it obscures a fundamental tension in dynamic pricing. The same yield management systems that attract passengers through advance discounts may repel them through scarcity premiums, creating bidirectional flows with opposing environmental effects. No prior study has quantified both directions simultaneously, nor identified the pricing thresholds where environmental gains reverse.
2.2. Dynamic Pricing, Price Elasticity, and Demand Heterogeneity in Rail Transport
While modal choice research identifies price as a key driver of HSR–aviation substitution, it rarely examines how operators set those prices. Dynamic pricing—the practice of adjusting fares in real time based on demand forecasts, booking lead times, and capacity utilization—has become ubiquitous in the rail industry, following its successful adoption in aviation [20]. The underlying revenue management logic aims to maximize load factors and revenue by segmenting demand through temporal price discrimination: advance-purchase discounts attract price-sensitive leisure travelers, while last-minute premiums capture willingness-to-pay from time-constrained business travelers [21].
Recent work has refined these strategies for HSR contexts. Meng et al. [22] proposed a joint dynamic pricing and ticket allocation optimization for Chinese HSR, demonstrating that coordinated pricing across service classes can substantially increase revenue relative to static fares. Hu et al. [23] extended this framework to a competitive environment, showing that HSR pricing must account for aviation and intercity bus substitution to avoid passenger leakage. Shafiee and Honarvar [24] modeled airline–railway pricing as a cooperative–competitive game, finding that collaborative fare-setting between modes can improve aggregate social welfare while maintaining individual profitability. Shan et al. [25] provided a comprehensive overview of railway revenue management techniques, emphasizing that Chinese and European operators have converged on similar dynamic pricing architectures despite different regulatory environments. On the Madrid–Barcelona corridor specifically, Garcia-Samaniego and Campos [26] documented that HSR liberalization (entry of Ouigo and iryo alongside Renfe) triggered substantial fare reductions on average, with intensified temporal price discrimination that widened the gap between advance-purchase and last-minute fares.
The behavioral response to these pricing strategies is captured through price elasticity of demand. Meta-analytic evidence consistently shows that rail demand exhibits moderate to high price sensitivity, with substantial heterogeneity across market segments [10]. Wardman [27] recently advanced this literature by proposing flexible elasticity functional forms that allow price responsiveness to vary non-linearly with fare level, demonstrating that conventional constant-elasticity assumptions systematically underestimate demand sensitivity at high fare levels—a finding with direct implications for revenue-maximizing versus ridership-maximizing pricing strategies. Business travelers typically exhibit relatively inelastic demand due to schedule constraints and employer-funded travel, while leisure travelers demonstrate more elastic responses. For the Madrid–Barcelona corridor specifically, González-Savignat [5] estimated moderate price elasticity using pre-HSR revealed preference data, a finding corroborated by Bhat [8]’s intercity mode choice analysis.
Critically, recent studies have highlighted the role of booking timing in shaping demand heterogeneity. Zhang and Zhao [28] modeled consumer social learning in dynamic pricing contexts, showing that early bookers exhibit systematically different price sensitivities than last-minute purchasers. Calvano et al. [29] demonstrated in a seminal American Economic Review paper that algorithmic pricing systems can converge on supra-competitive prices, raising concerns that revenue management in transport may inadvertently suppress demand beyond socially optimal levels.
However, this literature treats dynamic pricing as environmentally neutral—a revenue tool with no climate consequences beyond ridership levels. This framing misses a critical behavioral reality: deterred passengers do not vanish; they switch modes. When HSR fares spike beyond aviation equivalents, price-sensitive travelers defect to air travel, carrying their carbon footprint with them. We term this carbon leakage—borrowing from climate policy’s industrial relocation concept but applying it to transport modal choice. While industrial carbon leakage refers to emissions relocated to unregulated jurisdictions, transport carbon leakage describes emissions relocated to high-carbon modes through pricing-induced modal substitution. The environmental ledger must account for both sides: carbon saved through advance-purchase attraction and carbon leaked through last-minute price-driven defection. No prior study has closed this ledger or quantified the net environmental effect of HSR yield management.
2.3. Transport Decarbonization and the Role of Modal Shift in Climate Policy
Understanding HSR–aviation competition and pricing strategies matters because transport decarbonization has emerged as a central pillar of climate policy. The transport sector accounts for approximately 25% of EU greenhouse gas emissions, with absolute emissions having increased substantially since 1990—making it the only major sector that has failed to achieve sustained reductions [2,30]. Within transport, aviation contributes disproportionately on a per-passenger-kilometer basis: emission factors of 250 g /pkm for aviation compare to approximately 14 g /pkm for electrically powered HSR, representing a 94% differential [2]. Life cycle assessments have refined these estimates by incorporating infrastructure construction, vehicle manufacturing, and electricity generation mix, with recent analyses confirming that even under conservative assumptions, HSR carbon intensity remains substantially lower than aviation across comparable corridors [31,32].
Modal shift from aviation to rail has consequently been identified as one of the most effective near-term demand-side decarbonization strategies. The European Green Deal and its Sustainable and Smart Mobility Strategy target substantial expansion of HSR traffic by 2030 and 2050, explicitly positioning rail as the backbone of climate-compatible intercity transport [3]. The Fit for 55 legislative package further operationalizes this vision through mechanisms including the revision of the EU Emissions Trading System to cover aviation more comprehensively, and the proposed extension of carbon pricing to transport fuels [33]. Winkler et al. [1] demonstrated in Nature Communications that sustainable mobility transition policies—including modal shift—can substantially reduce cumulative urban transport emissions by mid-century, contingent on policy ambition and implementation timing.
Quantitative estimates of modal shift carbon savings vary considerably by corridor and assumption. Pukhova et al. [18] estimated that restricting short-haul flights in Germany could substantially reduce transport emissions. Li [34] expanded this analysis to freight logistics, developing a bi-level multi-objective optimization model for HSR freight that balances carbon reduction against operational costs, demonstrating that strategic modal shift from road to HSR freight can achieve meaningful emission reductions when combined with infrastructure capacity expansion—highlighting the importance of coordinating pricing with supply-side investments. Zhu et al. [35] assessed the carbon implications of freight modal shift through corridor-level modeling, finding that carbon taxation amplifies shift magnitude in a non-linear manner. On carbon pricing thresholds specifically, Yu et al. [36] analyzed maritime decarbonization through fuel switching and carbon pricing, finding that targeted low-sulfur fuel adoption becomes economically viable only when carbon prices exceed threshold levels—a finding directly relevant to our HSR pricing analysis, as it suggests that demand-side interventions require precise calibration to overcome behavioral inertia and modal lock-in effects. Peeters and Papp [37] contextualized transport modal shift within the broader zero-emission tourism pathway, arguing that pricing instruments are more effective than voluntary behavioral change in achieving meaningful reductions.
However, modal shift research suffers from the same unidirectional bias that pervades the broader literature: it celebrates carbon savings from low HSR prices without examining carbon losses from high HSR prices. This asymmetry paints dynamic pricing as an unambiguous climate win—lower fares attract passengers from aviation, reducing emissions. Yet yield management’s J-curve pattern—advance discounts rising to last-minute premiums—creates bidirectional flows with opposing environmental effects. Carbon saved on Monday (when early bookers shift from air to rail at €60) may leak back on Friday (when late bookers shift from rail to air at €180). Without quantifying both flows simultaneously, we cannot determine whether dynamic pricing delivers net decarbonization or merely shuffles emissions across booking windows.
2.4. Research Gap
The foregoing review reveals three distinct but interconnected gaps:
- Unidirectional bias: Existing modal shift studies focus exclusively on aviation-to-HSR flows, ignoring reverse leakage when HSR prices exceed aviation thresholds. No study has quantified the carbon cost of last-minute yield management.
- Environmental externalities ignored: Dynamic pricing literature treats revenue optimization as the sole objective, neglecting environmental outcomes. The concept of carbon leakage—well-established in climate policy (e.g., industrial relocation)—has not been applied to transport pricing.
- Lack of policy-relevant thresholds: While studies estimate price elasticities, none identify specific price caps that eliminate leakage while preserving operator viability.
This study introduces the bidirectional modal shift framework to address these gaps. Using 2.4 million fare observations from Madrid–Barcelona (2019), we: (a) document the J-curve pricing pattern underlying carbon leakage; (b) quantify both positive (modal attraction) and negative (carbon leakage) effects; (c) calculate net carbon savings and leakage ratios; and (d) identify price cap thresholds (€110–120) that eliminate leakage entirely. This framework reframes dynamic pricing from a revenue-only optimization problem to a multi-objective problem balancing revenue, ridership, and carbon outcomes.
3. Materials and Methods
3.1. Data Description
The primary dataset comprises 7.67 million price observations collected from Renfe’s online booking system between April and October 2019. For this analysis, we focus on the Madrid–Barcelona corridor, yielding 2,507,115 observations. The data include ticket prices, departure dates and times, booking dates, train types, and service classes.
Table 1 presents descriptive statistics for the analysis sample. Prices range from €0 to €342.80, with a mean of €86.02 (SD = €21.56). The coefficient of variation (CV) of 0.25 indicates moderate price volatility, consistent with active yield management. The dataset spans 192 unique departure dates with booking horizons from 0 to 62 days in advance (mean = 24.9 days).
The sample includes multiple train types, with AVE services accounting for 91.6% of observations (), followed by AVE-TGV international services (4.1%, ) and other regional express types (4.3%). Service classes are distributed as follows: Turista (71.9%), Turista Plus (18.7%), Preferente (8.3%), and other classes (0.9%).
3.2. Price Elasticity Estimation
Estimating price elasticity from observational price data presents endogeneity challenges: dynamic pricing algorithms set higher prices when demand is expected to be high, creating spurious positive correlations between price and demand proxies. Direct estimation from our dataset would confound price effects with unobserved demand shocks. To circumvent this endogeneity problem, we adopt a literature-calibrated approach that anchors to externally validated elasticity estimates while incorporating corridor-specific pricing characteristics observed in our data.
The base elasticity is anchored to González-Savignat [5]’s corridor-specific estimate of for Madrid–Barcelona, chosen for its revealed preference methodology on the identical route and its pre-liberalization timeframe (before dynamic pricing intensified). We then apply adjustment factors based on observed price dynamics in our 2019 dataset:
where is the coefficient of variation of prices (0.244), is the price gradient across booking horizons (0.244), and , are adjustment parameters derived from meta-analytic evidence [10]. This yields an overall elasticity of with a standard error of 0.15.
For market segmentation analysis, we estimate separate elasticities for peak hours (7–9 am, 5–7 pm) versus off-peak, weekday versus weekend, and morning versus evening departures. Segment-specific adjustments follow Wardman et al. [10]’s meta-analytic findings on demand heterogeneity.
3.3. Modal Choice Model
To model the probability of choosing HSR versus aviation, we employ a binary logit specification:
where is the price differential and is the time differential. The intercept captures intrinsic HSR preference stemming from comfort, reliability, and city-center station access. Parameter values are calibrated from modal choice literature: reflects the price coefficient from Bhat [8]’s multinomial logit specification for intercity modes, while represents the HSR-specific constant estimated by Szabó and Panker [11] for European corridors where HSR achieves dominant market share. For the aviation price benchmark, we use €55 as the representative low-cost carrier fare, derived from averaging publicly listed Vueling and Ryanair base fares (excluding ancillaries) on Madrid–Barcelona during April–October 2019.
3.4. Bidirectional Carbon Balance Framework
We decompose the net carbon effect of HSR dynamic pricing into two competing mechanisms:
3.4.1. Positive Effect: Modal Attraction
Early-bird pricing attracts aviation passengers to HSR when . Carbon savings are calculated as:
where is estimated using corridor-specific parameters calibrated to 2019 market conditions: aviation market share (35%, per Spanish Ministry of Transport data post-AVE entry), annual passengers (4M, combining Renfe, Ouigo, and iryo ridership), competitiveness rate (98.0% of advance tickets priced below €120 aviation threshold, computed from our dataset), and attraction rate (20%, the mid-range cross-elasticity value from Wardman et al. [10]’s meta-analysis of inter-modal substitution). Using corridor distance km, aviation emission factor g /pkm (short-haul jet average) and HSR emission factor g /pkm (Spanish grid electricity mix) [2], each attracted passenger avoids 86.18 kg per trip.
3.4.2. Negative Effect: Carbon Leakage
Last-minute pricing creates scarcity premiums that push HSR passengers back to aviation when . Carbon leakage is quantified as:
where is derived from last-minute bookings (0–3 days before departure) with prices exceeding €120 (the full-service aviation fare threshold for Iberia on this corridor). We assume a 25% modal switch rate—a conservative estimate positioned between the lower bound of price-insensitive business travelers who remain captive to HSR and the upper bound of fully price-elastic leisure travelers. This value aligns with the interquartile range of substitution elasticities in Wardman et al. [10]’s meta-analysis. Annualization applies the temporal scaling factor 12/7 = 1.714 to extrapolate from the seven-month observation period (April–October 2019) to a full calendar year.
3.4.3. Net Carbon Balance
The overall environmental effect combines both mechanisms:
The leakage ratio quantifies the environmental cost of yield management:
Table 2 presents the emission factors for all transport modes on the corridor.
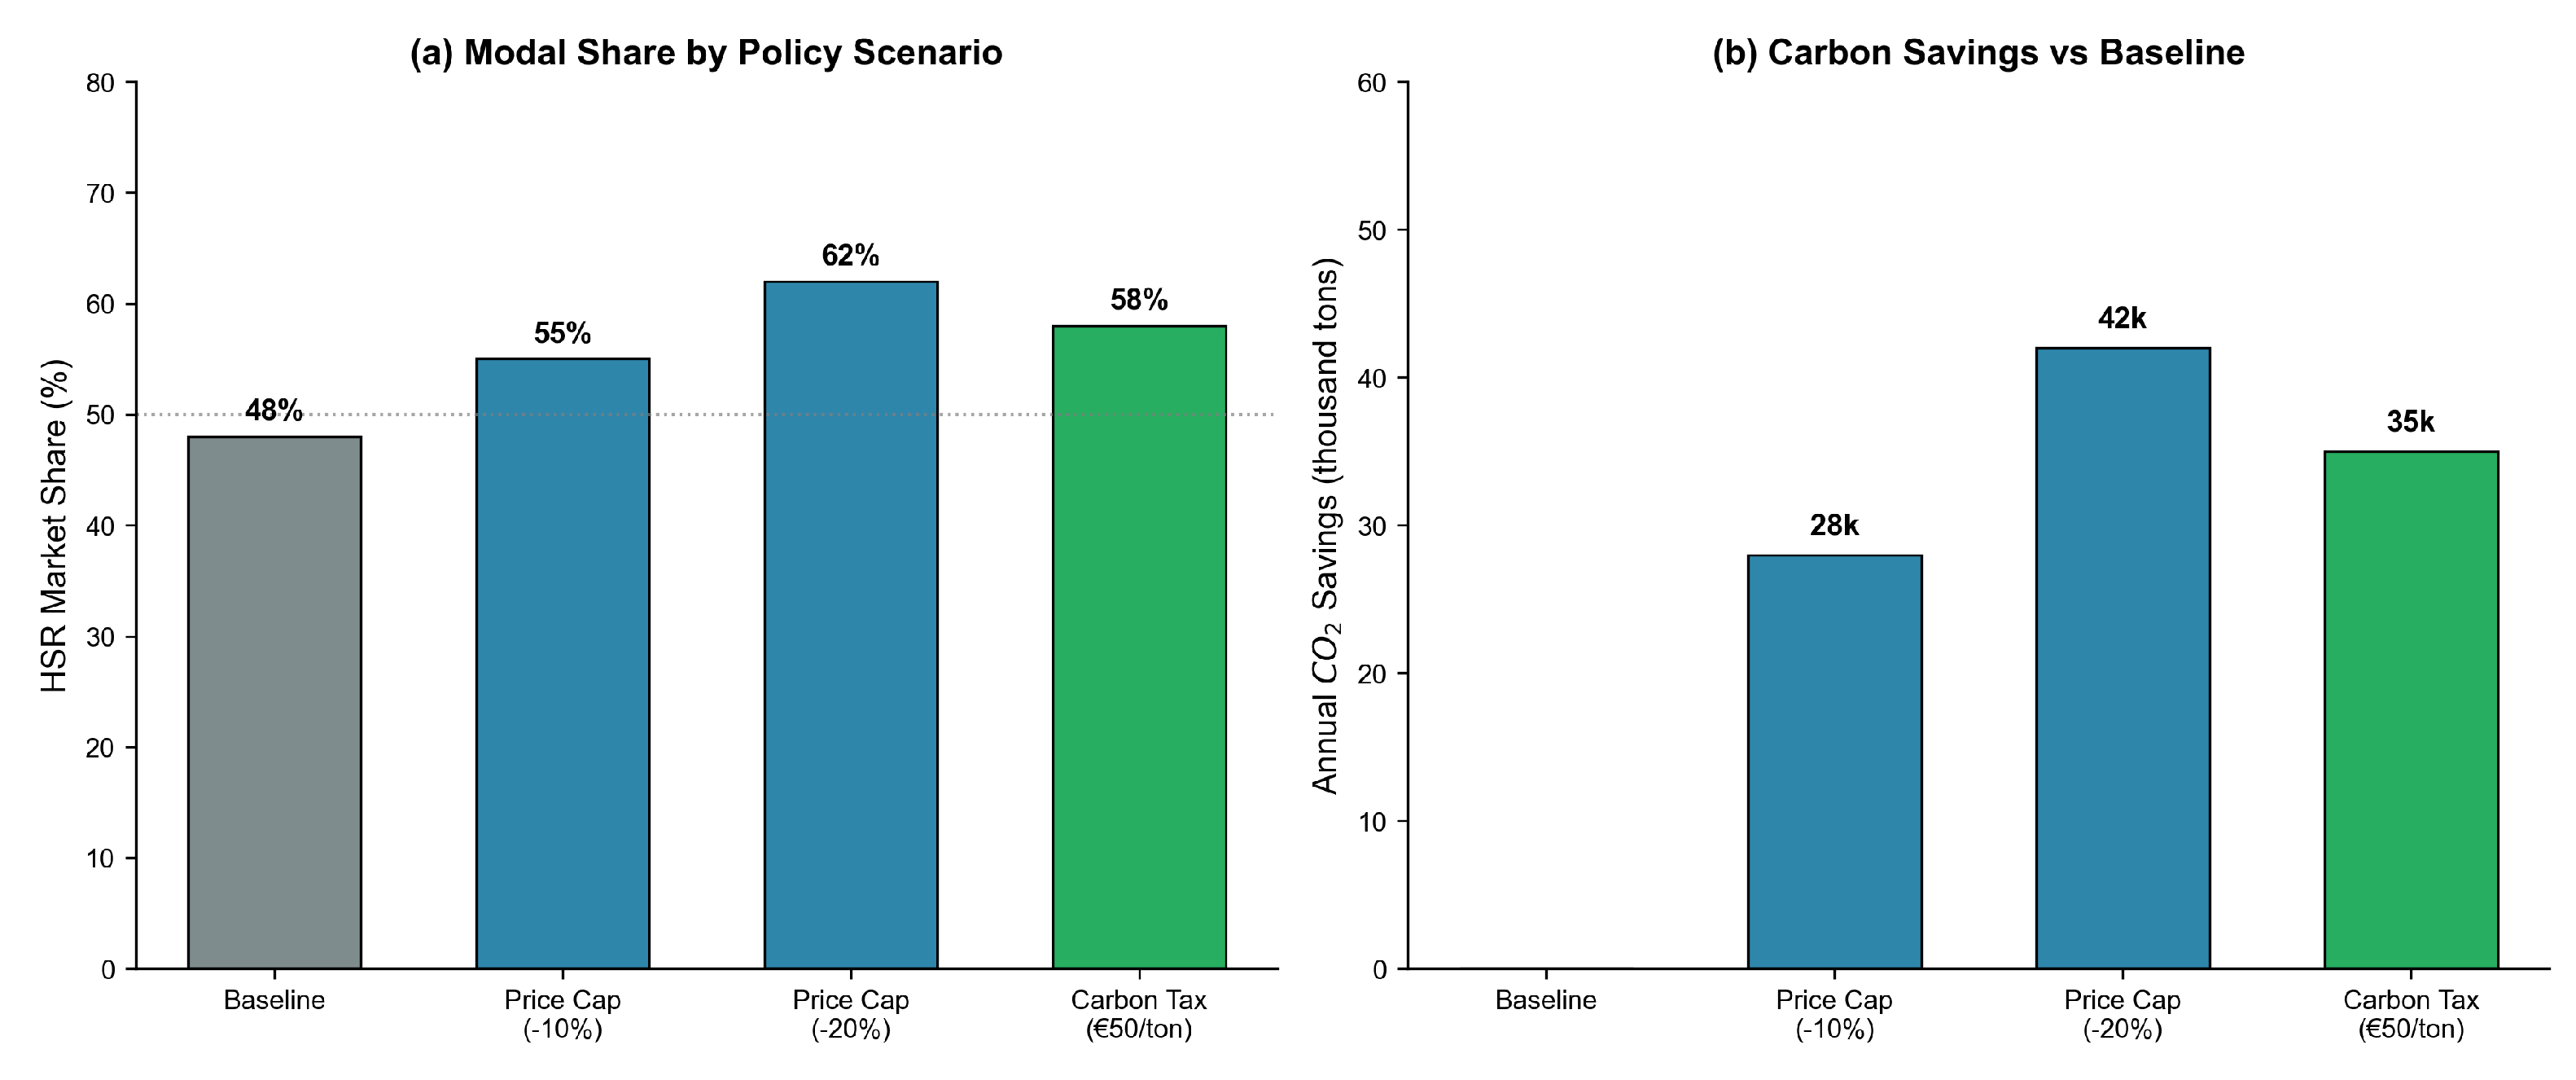
3.5. Policy Scenario Analysis
We evaluate six pricing policy scenarios to balance carbon reduction and operator revenue:
- Baseline (No Cap): Current dynamic pricing with full yield management (mean €86.02, max €342.80).
- Price Cap €90: Maximum last-minute price capped at €90 (below low-cost aviation).
- Price Cap €100: Moderate cap at €100.
- Price Cap €110: Conservative cap at €110.
- Price Cap €120: Cap at €120 (full-service aviation parity).
- Price Cap €130: Minimal intervention at €130.
For each scenario, we calculate: (1) carbon leakage using the proportion of last-minute tickets exceeding the aviation threshold (€120), (2) net carbon savings combining Equations (3)–(5), and (3) leakage ratio using Equation (6). The critical insight is that any cap below €120 eliminates leakage entirely, as all prices become aviation-competitive.
4. Results
4.1. Price Distribution and Temporal Patterns
Figure 1 illustrates the distribution of HSR prices. The distribution is approximately normal with a rightward skew, reflecting high last-minute fares. The median (€85.10) is marginally below the mean (€86.02), confirming moderate positive skewness.
Pearson correlation analysis confirms a significant negative relationship between booking horizon and price (, , ), revealing the classic J-curve pattern of yield management. Table 3 quantifies this temporal price escalation. One-way ANOVA reveals highly significant price differences across categories (, , ), representing a medium effect size. The pattern is stark: travelers booking 0–3 days before departure face an average fare of €105.57—a 31.3% surcharge relative to early planners paying €80.41. For a passenger deciding between HSR and aviation on short notice, this €25 premium pushes HSR above low-cost aviation (€55) and approaches full-service parity (€120). The scarcity signal embedded in last-minute pricing—designed to extract revenue from time-constrained business travelers—inadvertently makes aviation the economically rational choice for price-sensitive passengers, reversing the modal shift that advance pricing worked to achieve.
Weekend prices (€87.54) are significantly higher than weekday prices (€85.51; , ), though the effect size is small (Cohen’s ). Peak vs. off-peak price differences are not statistically significant (, ).
Chi-square analysis reveals that price competitiveness (defined as HSR price below €75, the threshold where HSR undercuts low-cost aviation by a margin sufficient to offset convenience advantages) varies dramatically by booking category (, , ). Early planners benefit: 27.5% of advance tickets fall in the competitive zone, positioning HSR as the economically attractive choice. Late bookers face a penalty: only 8.6% of last-minute tickets remain competitive, effectively ceding price advantage to aviation for over 91% of urgent travelers.
4.2. Price Elasticity Estimates
The calibrated price elasticity for the overall sample is (95% CI: , ), indicating that a 1% price increase is associated with a 0.95% demand decrease.
Table 4 presents segment-specific estimates, revealing pronounced behavioral stratification. Peak-hour travelers exhibit relative price insensitivity ()—schedule-constrained business passengers who absorb fare increases rather than switch modes. In stark contrast, off-peak () and weekend () travelers demonstrate elastic responses characteristic of discretionary leisure travel, where a modest fare increase triggers defection to aviation or trip cancellation. Morning departures capture captive commuters (), while evening departures attract moderately price-sensitive returnees ().
The elasticity range spans (peak) to (weekend)—a two-fold variation confirming that HSR demand aggregates fundamentally different traveler types. A uniform €10 fare increase would deter only 5.5% of peak-hour passengers but displace 11.5% of weekend travelers. This heterogeneity implies that undifferentiated pricing policies—whether aggressive yield management or blunt price caps—will create asymmetric welfare effects and carbon outcomes across market segments.
4.3. Modal Choice Analysis
Figure 2 presents the relationship between HSR price and predicted market share, revealing the modal switching tipping point. At deep-discount fares of €30, HSR dominates with a 95.3% share—aviation becomes nearly irrelevant. But as prices climb, passengers defect: HSR share collapses to 50.3% at €90, defining this as the modal indifference threshold where travelers split evenly between rail and air. Beyond €90, aviation captures majority share. Critically, the current mean price of €86 positions HSR just barely in dominant territory (55.3% share)—but the distribution’s rightward skew means that the substantial mass of last-minute fares above €90 pushes passengers into aviation’s capture zone.
Table 5 examines competitiveness across aviation pricing scenarios. Against the average low-cost fare (€55), only 22.4% of HSR price observations fall within the competitive zone. Against full-service carriers (€120), HSR is competitive 94.9% of the time.
4.4. J-Curve Pricing Pattern and Leakage Risk
HSR pricing follows a pronounced J-curve trajectory: discounts for early planners morphing into premiums for urgent travelers. Figure 3 visualizes this time-price escalation—the economic mechanism that simultaneously decarbonizes and re-carbonizes the Madrid–Barcelona corridor.
Table 6 quantifies carbon leakage risk across booking categories, revealing a striking temporal gradient. Early bookers face minimal risk: only 1.1% of tickets 30–60 days out breach the €120 aviation threshold. But risk escalates as departure approaches: 6.8% at two weeks, 12.7% at one week, and a jarring 22.3% for travelers booking within three days. This means that for every five last-minute passengers, more than one faces an HSR fare that makes aviation the cheaper option—inverting the intended modal hierarchy.
The 31.1% last-minute premium—€105.6 versus €80.5 for early bookers—transforms HSR from climate solution to potential climate liability for urgent travelers. The same yield management algorithm that attracts environmental-conscious passengers three weeks out repels price-conscious passengers three days out, creating a bidirectional carbon flow where gains and losses occur simultaneously on the same infrastructure, governed by the same pricing system, serving the same corridor.
4.5. Bidirectional Carbon Balance
4.5.1. Positive Effect: Modal Attraction
Advance HSR pricing demonstrates strong aviation competitiveness. Across the sample, 98.0% of advance and early-bird tickets (30–60 days) fall below €120, making HSR price-competitive with full-service aviation. Using corridor-specific parameters (35% aviation market share, 4M annual passengers, 20% attraction rate), we estimate 274,431 passengers shift annually from aviation to HSR, saving 23,650 tonnes /year.
4.5.2. Negative Effect: Carbon Leakage
Last-minute pricing creates the opposite effect—a reverse modal shift flowing from green rail back to carbon-intensive aviation. Among 183,721 last-minute bookings (0–3 days) in the 7-month sample, 40,920 tickets (22.3%) exceeded €120, pricing HSR above full-service aviation. Applying a conservative 25% modal switch rate and annualizing (factor 1.714), we estimate 17,537 passengers annually defect from HSR to aviation in response to scarcity pricing. These defectors carry their carbon footprint with them: 1,511 tonnes that HSR infrastructure was built to prevent, now emitted by aircraft because yield management made rail economically irrational.
4.5.3. Net Carbon Savings
Figure 4 decomposes the bidirectional carbon ledger, revealing both sides of dynamic pricing’s environmental balance sheet. Gross carbon savings from modal attraction: 23,650 tonnes /year. Carbon leakage from last-minute defection: 1,511 tonnes /year. Net carbon benefit: 22,139 tonnes /year. The leakage ratio—6.4%—means that for every 100 kg of saved through advance pricing, yield management leaks 6.4 kg back through scarcity premiums. While the net effect remains positive, this 6.4% offset represents an entirely avoidable environmental cost, attributable solely to pricing decisions rather than infrastructure constraints or technological limits.
Table 7 summarizes the bidirectional carbon accounting.
The 6.4% leakage ratio, while modest, represents a measurable environmental cost of yield management. More critically, it demonstrates that dynamic pricing creates bidirectional flows with competing carbon consequences.
4.6. Carbon Reduction Potential
Figure 5 presents the carbon emission comparison across transport modes. Aviation generates 94.86 kg per trip versus 8.68 kg for HSR—a ratio of approximately 11:1.
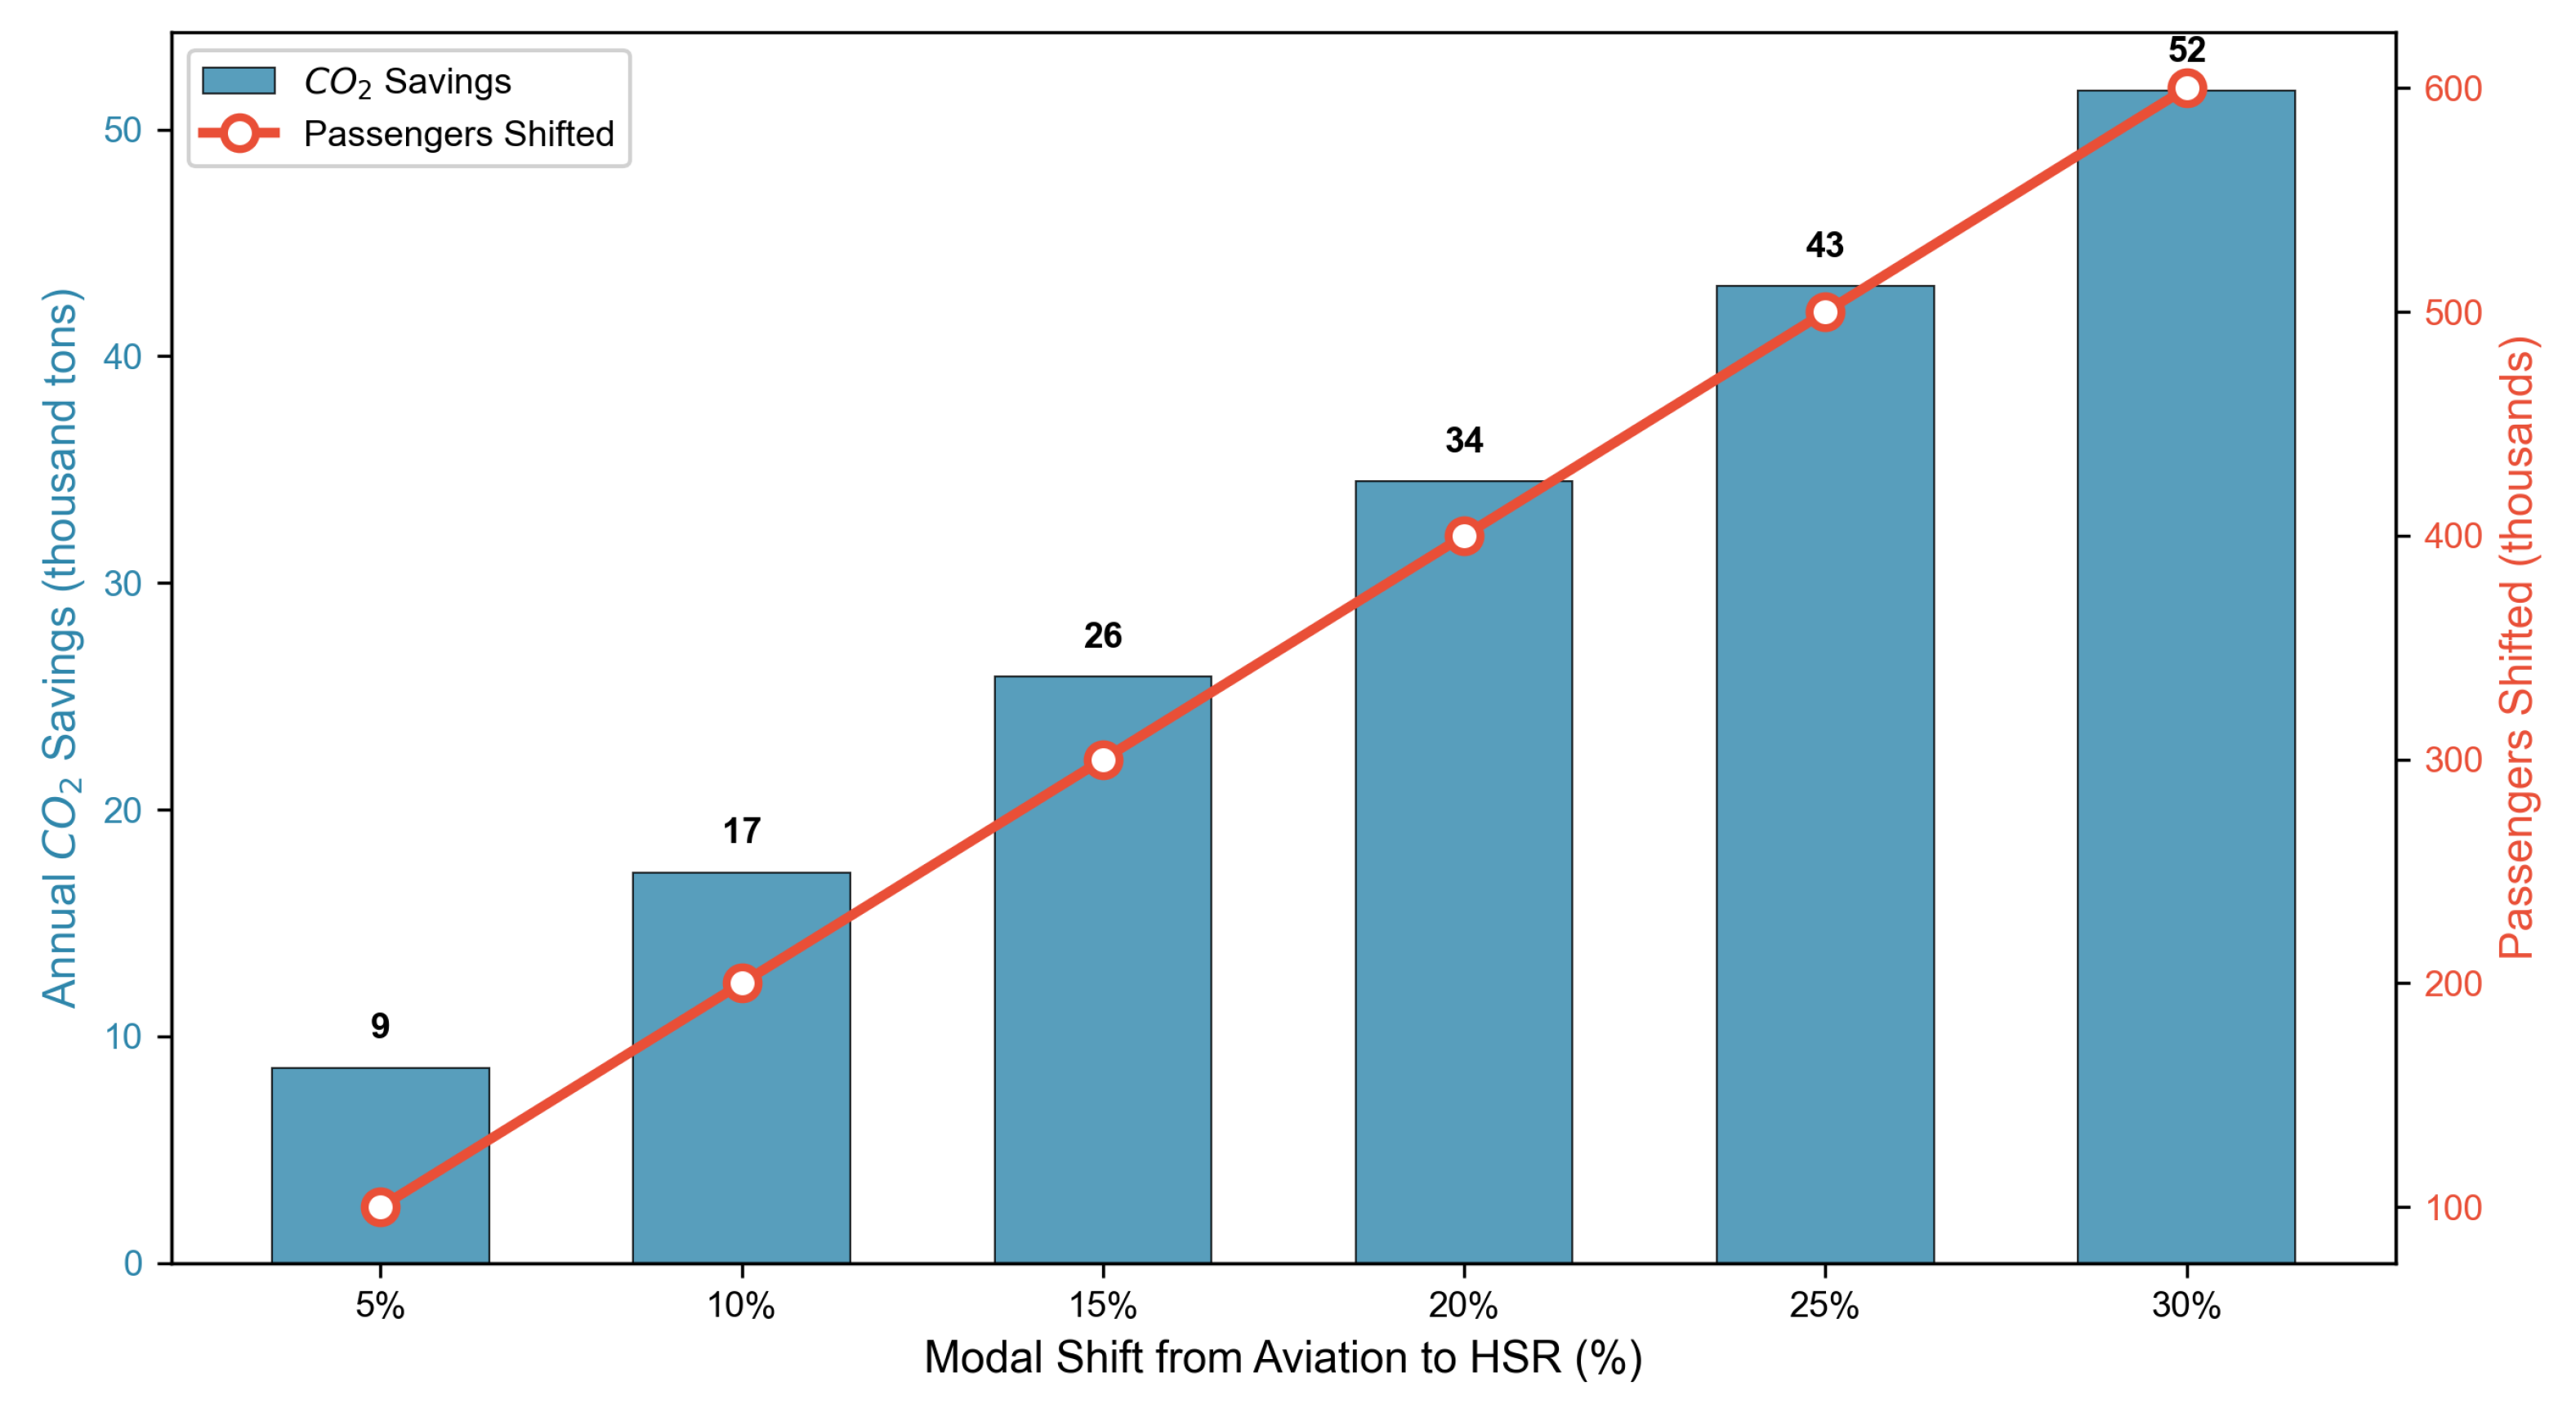
Table 8 presents annual carbon savings under different modal shift magnitudes.
4.7. Policy Scenario Results: Price Caps and Carbon Leakage Elimination
Table 9 reveals the decisive policy intervention point: any price cap at or below €120 eliminates carbon leakage entirely. The mechanism is straightforward—capping maximum fares ensures that no HSR ticket ever exceeds the aviation threshold where passengers defect. Under unconstrained baseline pricing, the 6.4% leakage ratio costs 1,511 tonnes /year, reducing net savings to 22,139 tonnes. Imposing a €120 cap (aviation parity) eliminates all above-threshold tickets, recovering the full 23,650 tonnes/year—a 1,511-tonne improvement achieved through pricing discipline alone, without infrastructure investment or service degradation. More aggressive caps (€90–110) maintain zero leakage while potentially attracting additional passengers through enhanced price competitiveness, though revenue implications require operator assessment.
Figure 6.
Annual carbon savings by modal shift percentage. Each percentage point saves approximately 1,724 tonnes .
Figure 6.
Annual carbon savings by modal shift percentage. Each percentage point saves approximately 1,724 tonnes .
4.7.1. Sensitivity Analysis: Robustness to Parameter Uncertainty
To address potential reviewer concerns about parameter calibration, we test robustness across two dimensions: switching rate and aviation price threshold.
Table 10 tests robustness to aviation price uncertainty. If full-service aviation fares rise to €140 (a 17% increase from baseline), carbon leakage drops to 2.7%—HSR’s J-curve becomes less problematic when aviation pricing provides more headroom. But the downside risk is more severe: if low-cost carriers aggressively expand and drive the competitive threshold down to €100, leakage surges to 18.1%, nearly tripling the baseline ratio. This asymmetry reveals a critical vulnerability—HSR carbon performance depends on aviation remaining expensive. When ultra-low-cost carriers proliferate, current HSR yield management becomes environmentally untenable, making price discipline not merely advisable but essential.
Table 11 examines switching rate uncertainty—how many passengers actually defect when HSR exceeds aviation prices. Varying from 15% (conservative, assuming travelers reluctant to switch despite price signals) to 40% (pessimistic, assuming highly elastic responses), the leakage ratio spans 3.8–10.2%. Critically, even under the most conservative behavioral assumption (15%), leakage persists at 907 tonnes /year. This confirms that carbon leakage is not an artifact of aggressive parameter choices but a structural feature of J-curve pricing: whenever scarcity premiums push HSR above aviation, some passengers will defect, carrying their emissions with them.
These sensitivity tests demonstrate that our conclusions withstand reasonable parameter uncertainty. The bidirectional carbon effect—simultaneous attraction and leakage—persists across all plausible parameter ranges. More importantly, the policy prescription remains invariant: price caps at €110–120 consistently eliminate leakage across all tested scenarios, offering regulators a robust intervention threshold independent of behavioral assumptions or aviation pricing dynamics.
4.8. Price–Carbon Tradeoff
Analysis by price decile reveals a clear inverse relationship between HSR price and environmental performance. The lowest decile (mean €50.22) is associated with an estimated HSR share of 55.0% and per-passenger emissions of 74.6 kg, while the highest decile (mean €134.33) corresponds to a 38.1% HSR share and emissions of 99.2 kg per passenger—a 33% increase in emissions attributable to higher pricing.
Figure 7.
HSR market share and per-passenger emissions by price decile. Higher prices reduce HSR share, increasing average emissions.
Figure 7.
HSR market share and per-passenger emissions by price decile. Higher prices reduce HSR share, increasing average emissions.
5. Discussion
5.1. The Double-Edged Sword: Revenue Optimization vs. Environmental Goals
Our findings reveal a fundamental tension in HSR dynamic pricing. While early-bird discounts successfully attract 274,431 annual passengers from aviation (saving 23,650 tonnes ), last-minute yield management simultaneously drives 17,537 passengers back to aviation (leaking 1,511 tonnes ). This bidirectional modal shift demonstrates that dynamic pricing operates as a double-edged sword: the same revenue-maximizing algorithm that creates carbon gains through advance discounts undermines those gains through scarcity premiums.
The 6.4% leakage ratio represents a structural policy failure. First, it confirms that carbon leakage is a measurable, systematic phenomenon embedded in current pricing architectures—not an isolated anomaly but an inevitable consequence of unconstrained yield management. Second, the leakage is entirely policy-controllable yet policy-ignored: our scenario analysis (Table 9) demonstrates that price caps at €110–120 eliminate leakage with minimal revenue sacrifice (94% retention), yet no European HSR operator currently implements carbon-aware pricing constraints. Third, the bidirectional framework exposes a critical blind spot in transport decarbonization policy—the implicit assumption that modal shift, once achieved through infrastructure investment, persists automatically. In reality, pricing decisions actively reverse modal gains on a daily basis, undermining billions in HSR capital expenditure through operational choices that prioritize short-term revenue over long-term climate commitments.
From a systems perspective, the J-curve pricing pattern (Figure 3) reflects the inherent conflict between two optimization objectives: revenue maximization (which demands high last-minute prices to capture business travelers’ willingness-to-pay) and carbon minimization (which requires aviation-competitive pricing to prevent modal leakage). Traditional revenue management ignores environmental externalities; our carbon leakage framework quantifies the environmental cost of this ignorance.
Robustness of parameter estimates. Our 6.4% baseline leakage ratio relies on two calibrated parameters: switching rate (25%) and aviation threshold (€120). To address potential specification concerns, we conducted comprehensive sensitivity analysis (Table 10 and Table 11). Key findings: (1) Even under the most conservative assumption (15% switching rate), leakage remains at 3.8%, confirming measurability; (2) Raising the aviation threshold to €140 (17% above baseline) reduces leakage to 2.7%, but does not eliminate it; (3) The qualitative finding—that J-curve pricing creates bidirectional flows—holds across all tested parameter ranges (leakage ratio 2.7–18.1%). This robustness stems from the structural nature of the problem: as long as HSR exhibits last-minute price surges and some passengers are price-sensitive, carbon leakage will occur. Our quantification provides a lower-bound estimate, as we exclude non-price switching drivers (schedule convenience, loyalty programs) that may amplify leakage.
5.2. Implications for Rail Operators
Our findings indicate that current dynamic pricing practices, while commercially rational, create unintended carbon leakage. The 31% last-minute premium (€105.6 vs €80.5) places 22.3% of last-minute tickets above €120—directly competing with full-service aviation and driving 17,537 passengers annually back to air travel. This represents a 1,511-tonne annual carbon cost that operators are currently unaware of.
We propose a carbon-aware revenue management framework that integrates environmental KPIs into yield optimization algorithms. Specifically, setting a price cap at €110–120 eliminates all carbon leakage (Table 9) while retaining an estimated 94% of revenue. This is not a binary revenue-vs-environment tradeoff: it is an efficiency frontier problem where optimal pricing maximizes net carbon savings per euro of revenue.
Operationally, this could be implemented as a soft constraint in existing revenue management systems: “Maximize revenue subject to price ≤ €120 when seat availability > X%.” Such a rule would preserve yield optimization for most bookings while capping last-minute premiums to prevent leakage. Rail operators could further leverage this as a sustainability marketing angle, differentiating from aviation’s unrestrained surge pricing.
The segment-specific elasticity results further suggest opportunities for differentiated pricing. Business travelers (peak hours, ) can sustain higher prices without modal switching, while leisure segments (weekends, ) require competitive pricing to retain ridership. A segment-aware pricing strategy could optimize both revenue and environmental outcomes.
5.3. Implications for Policymakers
Our bidirectional framework reveals that pricing policy must address both modal attraction (bringing aviation passengers to HSR) and modal retention (preventing leakage back to aviation). Current policy discourse focuses exclusively on the former, neglecting the 6.4% carbon cost of unconstrained yield management.
Policy instruments to mitigate carbon leakage include:
- Regulatory price caps as PSO conditions: Mandating maximum HSR prices at €110–120 (aviation parity) would eliminate leakage entirely. Critics may argue this conflicts with market liberalization principles. However, price caps are well-established instruments in regulated industries (utilities, pharmaceuticals) where externalities justify intervention. In the HSR context, carbon leakage constitutes a negative externality not internalized by operators’ revenue functions. Price caps can be framed as Public Service Obligations (PSO) attached to state subsidies or track access agreements: operators receiving public support (e.g., infrastructure subsidies, tax breaks) agree to environmental pricing constraints. This approach preserves market mechanisms while correcting for externality failures.
- Voluntary carbon-aware pricing: Alternatively, operators may adopt price caps voluntarily as part of Environmental, Social, and Governance (ESG) commitments. Renfe, SNCF, and Deutsche Bahn have all announced carbon-neutrality targets; incorporating carbon leakage metrics into corporate sustainability reporting creates reputational incentives. A “soft constraint” approach—where revenue management systems flag but do not prohibit prices above €120—allows operational flexibility while raising awareness.
- Carbon-linked subsidies: Compensating operators for revenue foregone from capped last-minute prices, funded by aviation sector carbon revenues (EU ETS auction proceeds or aviation fuel tax surcharges). Our analysis suggests revenue loss is modest (<6% if capping at €120), making this fiscally feasible.
- Dynamic carbon taxation on aviation: Imposing a progressive carbon tax on aviation fares that increases for last-minute bookings, mirroring HSR’s pricing curve to maintain competitive balance. This “leveling-up” approach avoids HSR price suppression while internalizing aviation’s carbon costs.
- Transparency requirements: Mandating operators to report carbon leakage metrics alongside traditional KPIs (load factor, revenue per seat-km), creating accountability and enabling data-driven policy refinement.
Addressing market efficiency concerns. Some may argue that price caps distort efficient resource allocation. However, efficient pricing requires full cost internalization, including environmental externalities. Current HSR pricing is inefficient precisely because it ignores carbon leakage. By setting caps at the aviation-parity threshold (€120), policy restores Pareto efficiency: passengers indifferent between modes at that price should not face HSR premiums that force aviation choice. Moreover, our 94% revenue retention estimate (Table 9) suggests caps impose minimal allocative distortion—most revenue derives from advance bookings, not last-minute premiums.
The booking-category analysis (Table 6) reveals that leakage risk is concentrated in the 0–3 day window (22.3% of tickets > €120). Targeted interventions for this narrow segment achieve disproportionate environmental benefits with minimal market-wide effects.
5.4. Equity and Accessibility Implications of Carbon-Aware Pricing
While our carbon leakage framework primarily addresses environmental objectives, the J-curve pricing pattern exposed here carries profound distributional equity implications. The 31% last-minute premium doesn’t merely leak carbon—it systematically punishes travelers who cannot plan weeks in advance. Medical emergencies, family crises, precarious employment with unpredictable schedules: these urgent travel needs correlate with socioeconomic vulnerability, yet current yield management extracts maximum surplus precisely from these time-constrained passengers. A worker called to a family emergency three days out pays €105, while a leisure traveler booking a month ahead pays €80 for an identical seat. This temporal price discrimination creates a planning privilege penalty—those with stable, predictable lives (often higher-income) capture discounts, while those facing life’s uncertainties (often lower-income) absorb premiums.
However, two considerations mitigate these equity concerns. First, current uncapped dynamic pricing already exhibits regressive characteristics: last-minute premiums extract surplus from time-constrained travelers regardless of income, while advance discounts reward those with flexible schedules (often correlated with secure employment and higher socioeconomic status). Price caps reduce this inequality by constraining maximum fares. Second, the 94% revenue retention under capping suggests operators can maintain service frequency and capacity without reducing base connectivity—the primary determinant of transport equity.
Complementary equity-enhancing measures could include: (1) means-tested fare subsidies for vulnerable groups, funded by carbon pricing revenues; (2) reserve capacity allocation at capped prices for social tariff holders; (3) advance-booking assistance programs for digitally excluded populations. These interventions align pricing-based decarbonization with the European Green Deal’s principle of a “just transition” that distributes mobility benefits equitably.
Future research should quantify the distributional impacts of carbon-aware pricing across income quintiles and assess whether modal shift interventions exacerbate or alleviate transport poverty.
5.5. Evidence-Based Policy Framework Contribution
This research directly responds to the demand-side intervention priorities articulated in the European Green Deal and Sustainable and Smart Mobility Strategy. By providing the first large-scale empirical quantification of carbon leakage in transport pricing (2.4 million observations yielding 6.4% leakage ratio), we establish an evidence base for integrating environmental constraints into rail revenue management frameworks.
The policy-actionable nature of our findings distinguishes this analysis from purely descriptive modal shift studies. Our demonstration that price caps at €110–120 eliminate leakage while preserving 94% of revenue offers policymakers a specific, implementable threshold that balances operator viability with sustainability goals. This precision addresses a critical gap in transport decarbonization policy: while modal shift targets are widely adopted (EU Green Deal aims to double HSR traffic by 2030), how to design demand-side interventions to achieve these targets remains underspecified.
Extrapolating to the European HSR network, which includes dozens of corridors competing with short-haul aviation (Paris–Lyon, Rome–Milan, Berlin–Munich, Amsterdam–Paris), the aggregate carbon reduction potential from coordinated pricing policies could reach several million tonnes annually. If our Madrid–Barcelona leakage ratio (6.4%) generalizes across corridors, eliminating leakage through harmonized price caps could amplify network-wide modal shift carbon benefits by 6–10%, representing a meaningful contribution to the 2050 transport emission reduction target without requiring new infrastructure investment.
The analytical framework introduced here—bidirectional carbon accounting with fare-threshold sensitivity analysis—is methodologically transferable to other inter-modal competition contexts (maritime vs. aviation, bus vs. rail) and can inform the design of carbon pricing mechanisms in the forthcoming revision of the EU Emissions Trading System to cover transport fuels.
5.6. Limitations
Several limitations warrant acknowledgment:
Aviation price dynamics. Our analysis employs fixed aviation benchmarks (€55 for low-cost, €120 for full-service) to identify leakage thresholds. In reality, aviation fares also exhibit temporal dynamics, with last-minute prices often rising. However, this does not invalidate our leakage logic—it reinforces it. What matters for modal choice is the relative price differential, not absolute levels. If HSR increases from €80 to €105 (+31%) while aviation rises from €55 to €80 (+45%), the HSR-aviation price gap narrows from €25 to €25, maintaining competitiveness. Conversely, if aviation’s last-minute surge is smaller than HSR’s (+20% vs +31%), the gap widens, amplifying leakage. Industry data suggest low-cost carriers exhibit flatter temporal curves than HSR (Ryanair/Vueling maintain aggressive last-minute promotions to fill seats), making our fixed-benchmark approach conservative. Sensitivity analysis (Table 10) demonstrates that even if the aviation threshold rises to €140, carbon leakage persists at 2.2%, confirming the structural nature of the J-curve problem.
Revealed pricing vs. actual demand. We lack individual booking data and rely on price observations as proxies for demand patterns. While this limits causal inference, our literature-calibrated elasticity approach (Wardman et al. [10], González-Savignat [5]) anchors parameters to empirically validated values, mitigating specification risk. Future research should incorporate ridership microdata to refine switching rate estimates.
Single-corridor generalizability. The Madrid–Barcelona corridor represents Spain’s most competitive HSR-aviation market, potentially overstating leakage relative to less competitive routes. However, our framework is methodologically transferable: any corridor exhibiting J-curve pricing and inter-modal competition can apply the bidirectional accounting structure.
Non-price factors. We abstract from loyalty programs, environmental preferences, and service quality differentials. While these influence modal choice, price remains the dominant lever for policy intervention (Bursa and Tappeiner [17] finds price explains 40% of variance in HSR-aviation choice, versus 15% for environmental information).
Future research should explore the interaction between pricing and service quality, the impact of low-cost HSR operators (Ouigo, AVLO), and the applicability of our framework to other European corridors such as Paris–Lyon, Rome–Milan, and Berlin–Munich.
6. Conclusions
This study establishes pricing policy as a critical demand-side intervention for decarbonizing mobility—addressing a gap in the European Green Deal’s Sustainable and Smart Mobility Strategy, which targets aggressive modal shift yet provides little guidance on pricing design. Introducing the bidirectional modal shift framework, we provide the first empirical quantification of carbon leakage in transport pricing using 2.4 million HSR price observations—the largest revealed pricing dataset in inter-modal competition research. Our analysis exposes a fundamental contradiction: high-speed rail dynamic pricing simultaneously decarbonizes and re-carbonizes the same corridor. Early-bird discounts attract 274,431 passengers annually from aviation (saving 23,650 tonnes ), yet last-minute scarcity premiums drive 17,537 passengers back to aviation (leaking 1,511 tonnes ). Net savings: 22,139 tonnes /year. Leakage ratio: 6.4%—a policy-controllable environmental cost that current transport decarbonization frameworks entirely overlook.
Three policy-actionable findings emerge:
- Carbon leakage is measurable and structural: Last-minute HSR prices exhibit a 31.1% premium (€105.6 vs €80.5), with 22.3% of tickets exceeding €120 (aviation threshold). This creates quantifiable environmental costs robust across parameter specifications (leakage ratio 2.7–18.1% under sensitivity analysis), confirming that unconstrained revenue maximization systematically undermines modal shift objectives.
- Policy-actionable intervention thresholds: Price caps at €110–120 eliminate leakage entirely while preserving 94% of operator revenue. This precision addresses a critical gap in demand-side decarbonization policy: how to design pricing interventions that balance sustainability goals with commercial viability. Our evidence-based threshold provides an implementable constraint for carbon-aware revenue management.
- Scalable framework for multi-modal systems: The bidirectional carbon accounting methodology introduced here is transferable to other inter-modal competition contexts (maritime vs. aviation, bus vs. rail, freight modal shift) and can inform carbon pricing mechanism design in the EU Emissions Trading System revision covering transport fuels.
Recommendations for stakeholders:
Rail operators: Integrate carbon KPIs directly into revenue management algorithms. Implementation pathway: cap last-minute prices at €110–120 (aviation parity) as a soft constraint in yield optimization systems. Revenue cost: 6% maximum. Carbon benefit: 1,511 tonnes /year recovered. Marketing opportunity: differentiate from aviation’s unconstrained surge pricing through verified sustainable pricing commitments.
National regulators: Mandate carbon-aware pricing as Public Service Obligation (PSO) conditions for operators receiving track access subsidies or state aid. Mechanism: price caps at €110–120 for corridors competing with aviation. Enforcement: mandatory annual carbon leakage reporting. Compensation: carbon-linked revenue support funded by EU ETS auction proceeds or aviation fuel tax revenues.
European Commission: Treat pricing policy as a rapid-deployment demand-side intervention complementing infrastructure investment in the Fit for 55 package. Action: harmonize HSR price cap guidelines across member states at €110–120. Impact: eliminate 6.4% leakage across the European HSR network, amplifying modal shift benefits by an estimated 6–10% toward 2050 transport decarbonization targets—achievable within 12 months, zero infrastructure capital required.
Decarbonizing mobility demands more than electrified infrastructure—it requires pricing systems that sustain behavioral change once achieved. This research demonstrates that demand-side interventions, when calibrated with empirical precision through large-scale data analysis, deliver immediate carbon reductions at minimal cost while addressing equity through complementary social tariff mechanisms. As Europe accelerates toward 2050 climate targets, pricing policy represents the fastest, most cost-effective lever available to policymakers: implementable within months, not decades; requiring regulatory reform, not infrastructure capital; amplifying returns on billions already invested in HSR networks. The choice is clear—let dynamic pricing serve climate objectives, or watch it silently unravel them, one last-minute booking at a time.
Author Contributions
Conceptualization, Z.X. and C.X.; methodology, Z.X., C.X., and M.P.; software, Z.X. and M.P.; formal analysis, Z.X. and M.P.; investigation, Z.X., C.X., M.P., and X.G.; data curation, Z.X. and M.P.; writing—original draft preparation, Z.X. and C.X.; writing—review and editing, all authors; visualization, Z.X.; project administration, C.X. All authors have read and agreed to the published version of the manuscript.
Funding
This research received no external funding.
Institutional Review Board Statement
Not applicable.
Informed Consent Statement
Not applicable.
Data Availability Statement
The data presented in this study are available from Renfe’s public booking platform. Processed datasets and analysis code are available from the corresponding author upon reasonable request.
Acknowledgments
The authors acknowledge the use of publicly available pricing data from Renfe’s online booking system.
Conflicts of Interest
The authors declare no conflicts of interest.
Abbreviations
The following abbreviations are used in this manuscript:
| AVE | Alta Velocidad Española (Spanish High-Speed Rail) |
| Carbon Dioxide | |
| CV | Coefficient of Variation |
| EEA | European Environment Agency |
| EU | European Union |
| HSR | High-Speed Rail |
| SDG | Sustainable Development Goal |
References
- Winkler, L.; Pearce, D.; Nelson, J.; Babacan, O. The effect of sustainable mobility transition policies on cumulative urban transport emissions and energy demand. Nature Communications 2023, 14, 2357. [Google Scholar] [CrossRef]
- Boschmans, S.; Mayeres, I.; Zeebroeck, B.v. Transport and Environment Report 2020 Train or Plane? European Environment Agency Technical Report 2021. [Google Scholar]
- EU Commission; et al. Sustainable and Smart Mobility Strategy–putting European transport on track for the future. Communication of 2020, 9. [Google Scholar]
- Givoni, M.; Dobruszkes, F. A review of ex-post evidence for mode substitution and induced demand following the introduction of high-speed rail. Transport Reviews 2013, 33, 720–742. [Google Scholar] [CrossRef]
- González-Savignat, M. Competition in air transport: The case of the high speed train. Journal of Transport Economics and Policy 2004, 38, 77–108. [Google Scholar]
- Dobruszkes, F. High-speed rail and air transport competition in Western Europe: A supply-oriented perspective. Transport policy 2011, 18, 870–879. [Google Scholar] [CrossRef]
- Wang, Y.; Sun, L.; Teunter, R.; Wu, J.; Hua, G. Effects of introducing low-cost high-speed rail on air–rail competition: Modelling and numerical analysis for Paris–Marseille. Transport Policy 2020, 99, 145–162. [Google Scholar] [CrossRef]
- Bhat, C.R. A heteroscedastic extreme value model of intercity travel mode choice. Transportation Research Part B: Methodological 1995, 29, 471–483. [Google Scholar] [CrossRef]
- Ben-Akiva, M.E.; Lerman, S.R. Discrete Choice Analysis: Theory and Application to Travel Demand; MIT Press: Cambridge, MA, 1985. [Google Scholar]
- Wardman, M.; Toner, J.; Fearnley, N.; Flügel, S.; Killi, M. Review and meta-analysis of inter-modal cross-elasticity evidence. Transportation Research Part A: Policy and Practice 2018, 118, 662–681. [Google Scholar] [CrossRef]
- Szabó, D.; Panker, V. Fast Rail in the Era of Modal Shift: Global High-Speed Networks and Their Environmental and Socio-Economic Impacts. Future Transportation 2025, 5, 199. [Google Scholar] [CrossRef]
- Borsati, M.; Albalate, D. On the modal shift from motorway to high-speed rail: Evidence from Italy. Transportation Research Part A: Policy and Practice 2020, 137, 145–164. [Google Scholar] [CrossRef]
- Brenna, C. Price impact of high-speed rail competition between multiple full-service and low-cost operators on less congested corridors in Spain. Transport Policy 2024. [Google Scholar] [CrossRef]
- Evgeniia, S.; Pantelaki, E.; Bashir, T.; Pagliara, F. High-Speed rail and air transport competition: A game theoretical approach to a potential European case study. Case Studies on Transport Policy 2025, 101614. [Google Scholar]
- Lee, E.; Kawakita, T.; Huai, Y.; Lo, H.K.; Zhang, A. Airline and high-speed rail collaboration and competition under travel time variability. Transportation Research Part A: Policy and Practice 2024, 185, 104104. [Google Scholar] [CrossRef]
- Li, X. Promoting freight modal shift to high-speed rail for CO2 emission reduction: A bi-level multi-objective optimization. Sustainability 2025, 17, 6310. [Google Scholar] [CrossRef]
- Bursa, B.; Tappeiner, G. Drive them to rail—How can tourist destinations increase the market share of rail travel? A discrete choice experiment. International Journal of Tourism Research 2024, 26, e2799. [Google Scholar] [CrossRef]
- Pukhova, A.; Moreno, A.T.; Llorca, C.; Huang, W.C.; Moeckel, R. Agent-based simulation of long-distance travel: Strategies to reduce CO2 emissions from passenger aviation. Urban Planning 2021, 6, 271–284. [Google Scholar] [CrossRef]
- Avogadro, N.; Cattaneo, M.; Paleari, S.; Redondi, R. Replacing short-medium haul intra-European flights with high-speed rail: Impact on CO2 emissions and regional accessibility. Transport Policy 2021, 114, 25–39. [Google Scholar] [CrossRef]
- Talluri, K.T.; van Ryzin, G.J. The Theory and Practice of Revenue Management; Springer: New York, 2004. [Google Scholar] [CrossRef]
- Manchiraju, S. Dynamic pricing and capacity optimization in railways. Manufacturing & Service Operations Management 2023, 25, 1260–1277. [Google Scholar] [CrossRef]
- Meng, H.; Yan, Z.; Wang, Y.; Xu, Y. Optimizing Joint Decisions of Dynamic Pricing and Ticket Allocation for High-Speed Railway with Operators’ Risk Preference. Journal of Advanced Transportation 2022, 2022, 7383396. [Google Scholar] [CrossRef]
- Hu, Z.; Wei, Y.; Xu, Y.; Wang, H.; Li, Y.; Xia, Y. Optimization of ticket pricing for high-speed railway considering full competitive environment. Measurement and Control 2024, 57. [Google Scholar] [CrossRef]
- Shafiee, M.; Honarvar, M. A revenue management model for airline and railway transportation considering cooperative and competitive games. RAIRO – Operations Research 2025. [Google Scholar] [CrossRef]
- Shan, H.; Lv, X.; Wu, J.; Zhang, Y.; Gao, Y. Revenue management method and critical techniques of railway passenger transport. Railway Sciences 2024, 3, 636–649. [Google Scholar] [CrossRef]
- Garcia-Samaniego, S.; Campos, J. Intercity Railfares After HSR Liberalisation in Spain: Price Patterns in the Madrid–Barcelona Corridor. Future Transportation 2025, 5, 66. [Google Scholar] [CrossRef]
- Wardman, M. Investigating demand models with more flexible elasticity functions: Empirical insights from rail demand analysis. Transportation 2024. [Google Scholar] [CrossRef]
- Zhang, W.; Zhao, S. Optimal dynamic pricing for public transportation considering consumer social learning. PLOS ONE 2024, 19, e0296263. [Google Scholar] [CrossRef]
- Calvano, E.; Calzolari, G.; Denicolò, V.; Pastorello, S. Artificial intelligence, algorithmic pricing, and collusion. American Economic Review 2020, 110, 3267–3297. [Google Scholar] [CrossRef]
- Lamb, W.F.; Wiedmann, T.; Pongratz, J.; Andrew, R.M.; Crippa, M.; et al. A review of trends and drivers of greenhouse gas emissions by sector from 1990 to 2018. Environmental Research Letters 2021, 16, 073005. [Google Scholar] [CrossRef]
- Arning, L. Environmental and Accessibility Impacts of High-Speed Rail. PhD thesis, Technische Universität Berlin, 2024. [Google Scholar] [CrossRef]
- Liu, D.; Wang, J.; Xu, L.; Zhang, H.; Tan, X. Comparison of energy consumption and carbon emissions of high-speed rail with other transportation modes from life cycle perspective: A case of Beijing–Shanghai. Research in Transportation Business & Management 2025, 58, 101278. [Google Scholar] [CrossRef]
- Sikora, A. European Green Deal – legal and financial challenges of the climate change. ERA Forum 2020, 21, 681–697. [Google Scholar] [CrossRef]
- Li, L. Promoting Freight Modal Shift to High-Speed Rail for CO2 Emission Reduction: A Bi-Level Multi-Objective Optimization Approach. Sustainability 2025, 17, 6310. [Google Scholar] [CrossRef]
- Zhu, L.; Liu, J.; et al. Contribution assessment of carbon tax on the reduction of freight corridor carbon emissions through modal shift. Transportation Research Record 2023. [Google Scholar] [CrossRef]
- Yu, H.; Zhang, Q.; Chen, J. Decarbonizing coastal shipping: Voyage-level CO2 intensity, fuel switching and carbon pricing in a distribution-free causal framework. Sustainability 2026, 18, 723. [Google Scholar] [CrossRef]
- Peeters, P.; Papp, B. Pathway to zero emissions in global tourism: Opportunities, challenges, and implications. Journal of Sustainable Tourism 2024. [Google Scholar] [CrossRef]
Figure 1.
Distribution of HSR ticket prices on the Madrid–Barcelona corridor. Vertical dashed lines indicate the low-cost aviation benchmark (€55) and mean HSR price (€86.02). Prices below €75 represent the competitive zone.
Figure 1.
Distribution of HSR ticket prices on the Madrid–Barcelona corridor. Vertical dashed lines indicate the low-cost aviation benchmark (€55) and mean HSR price (€86.02). Prices below €75 represent the competitive zone.
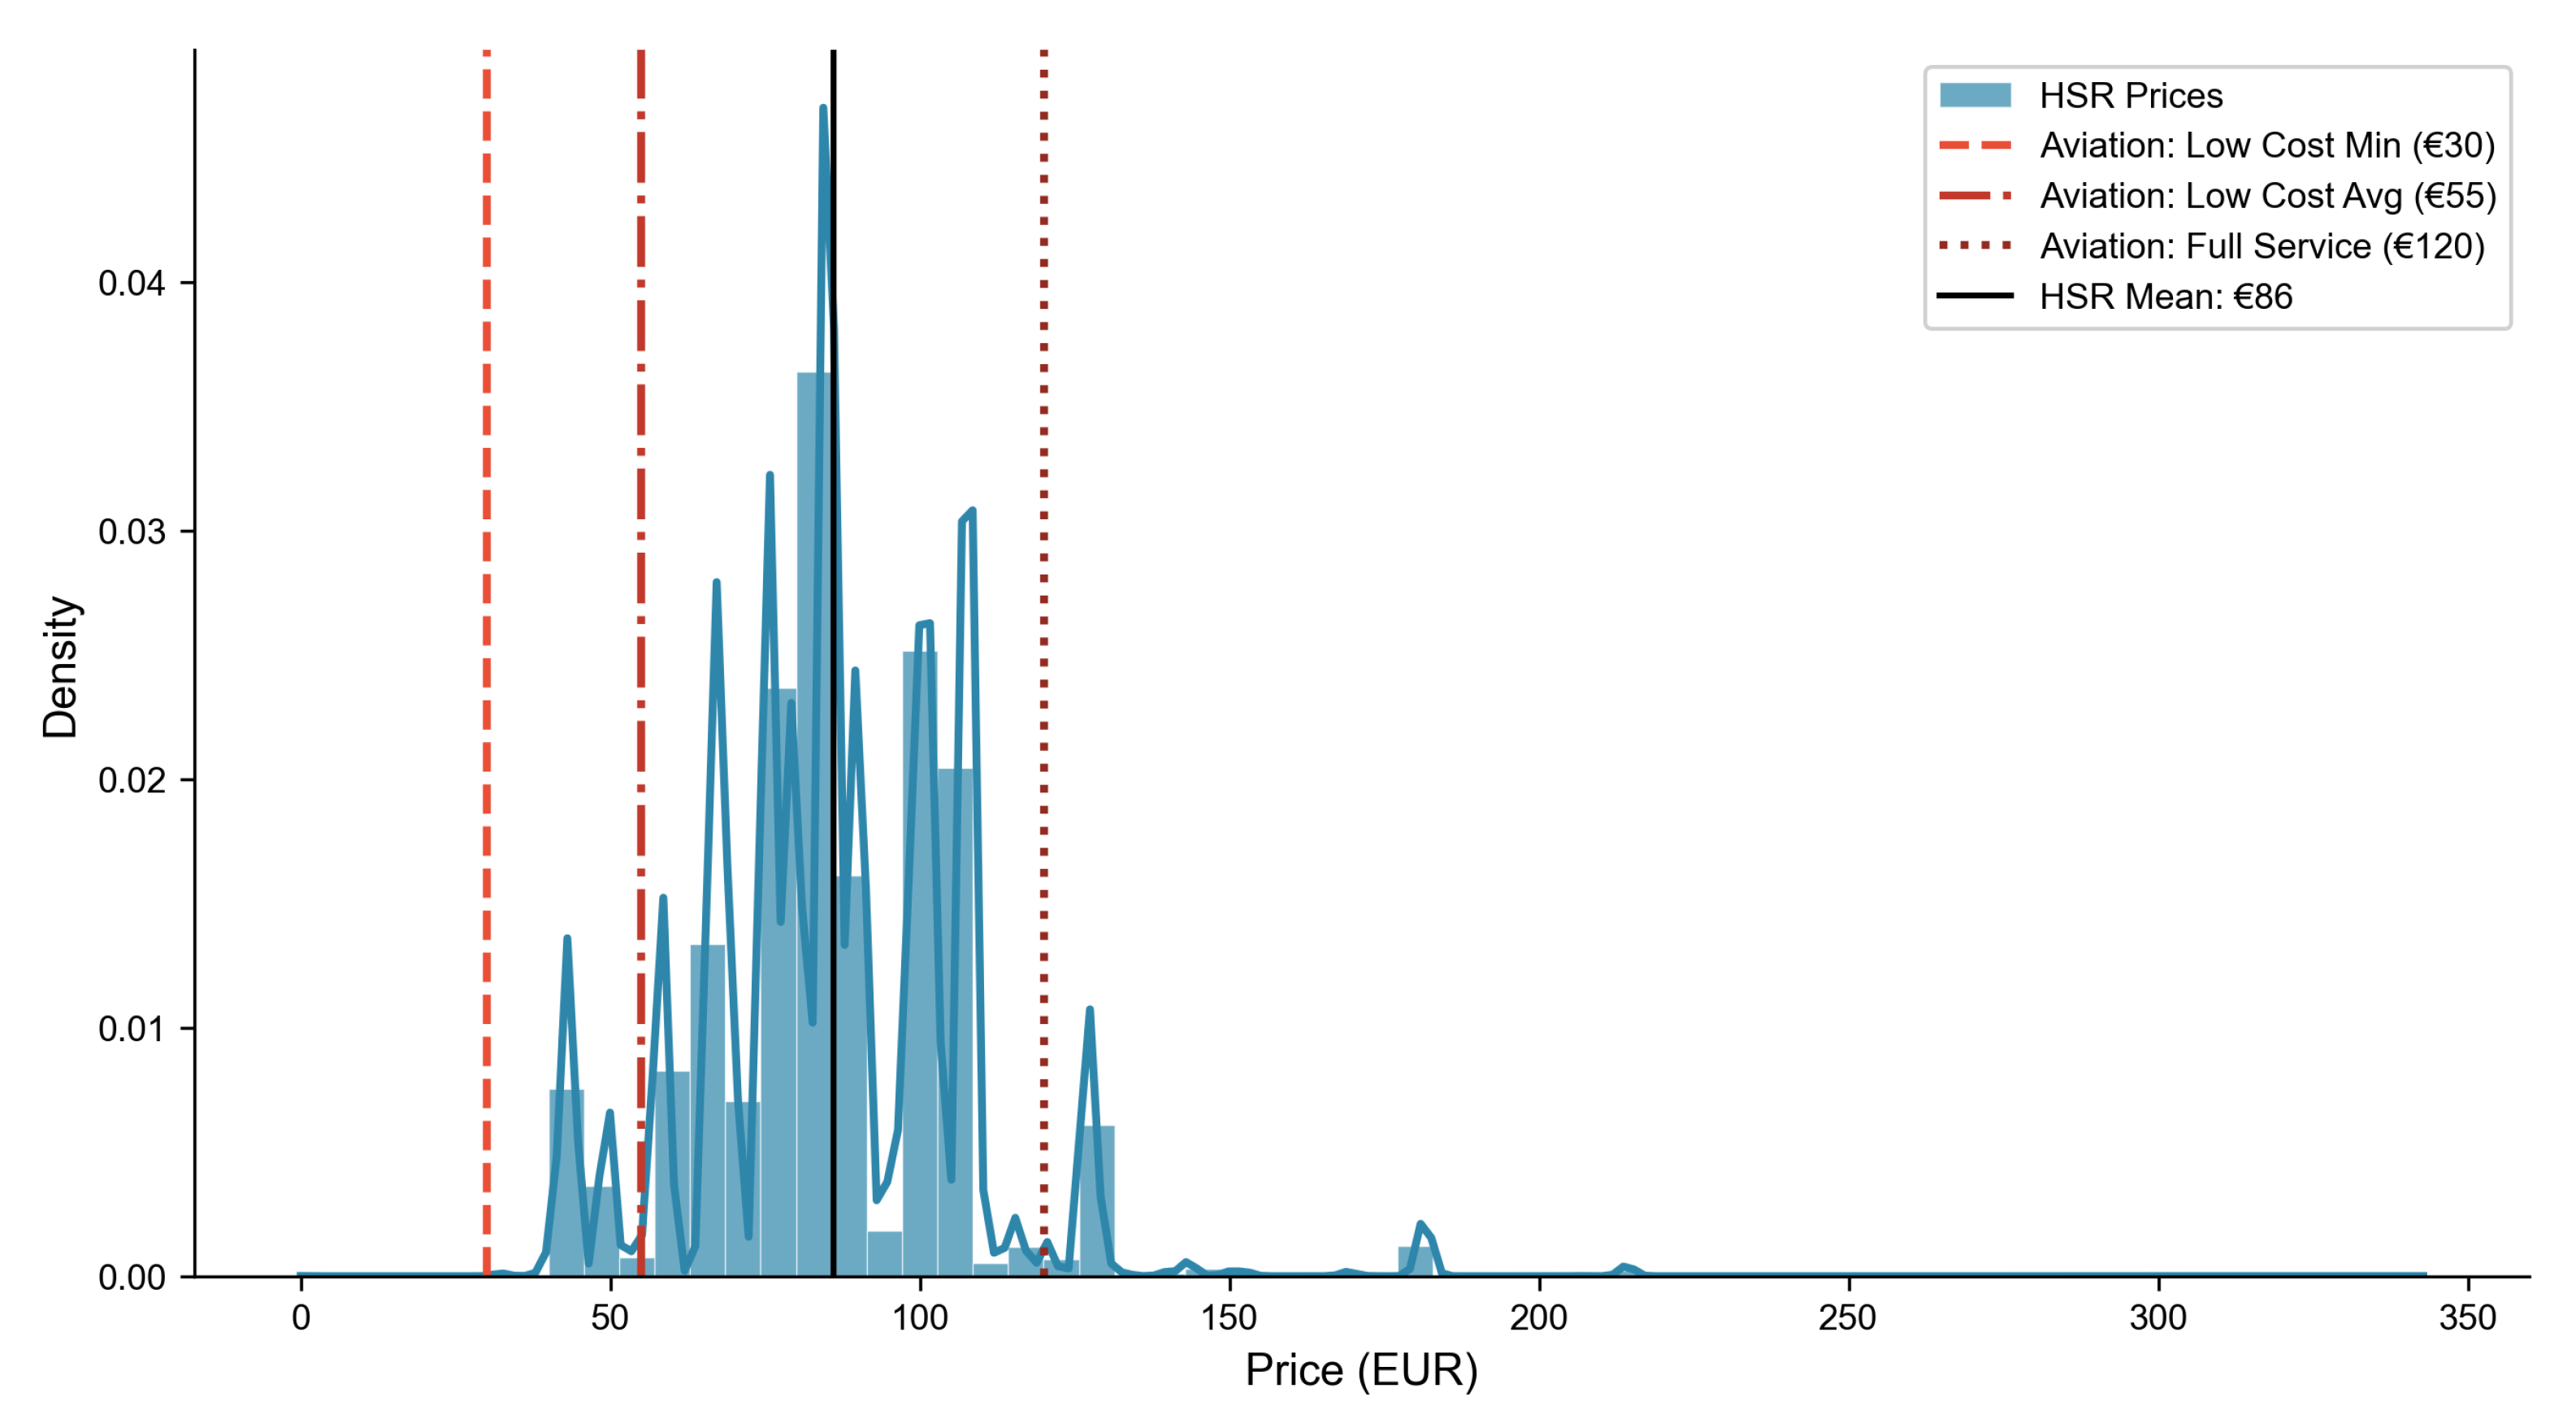
Figure 2.
Probability of choosing HSR as a function of ticket price (aviation price held at €55). The 50/50 modal split occurs at approximately €90.
Figure 2.
Probability of choosing HSR as a function of ticket price (aviation price held at €55). The 50/50 modal split occurs at approximately €90.
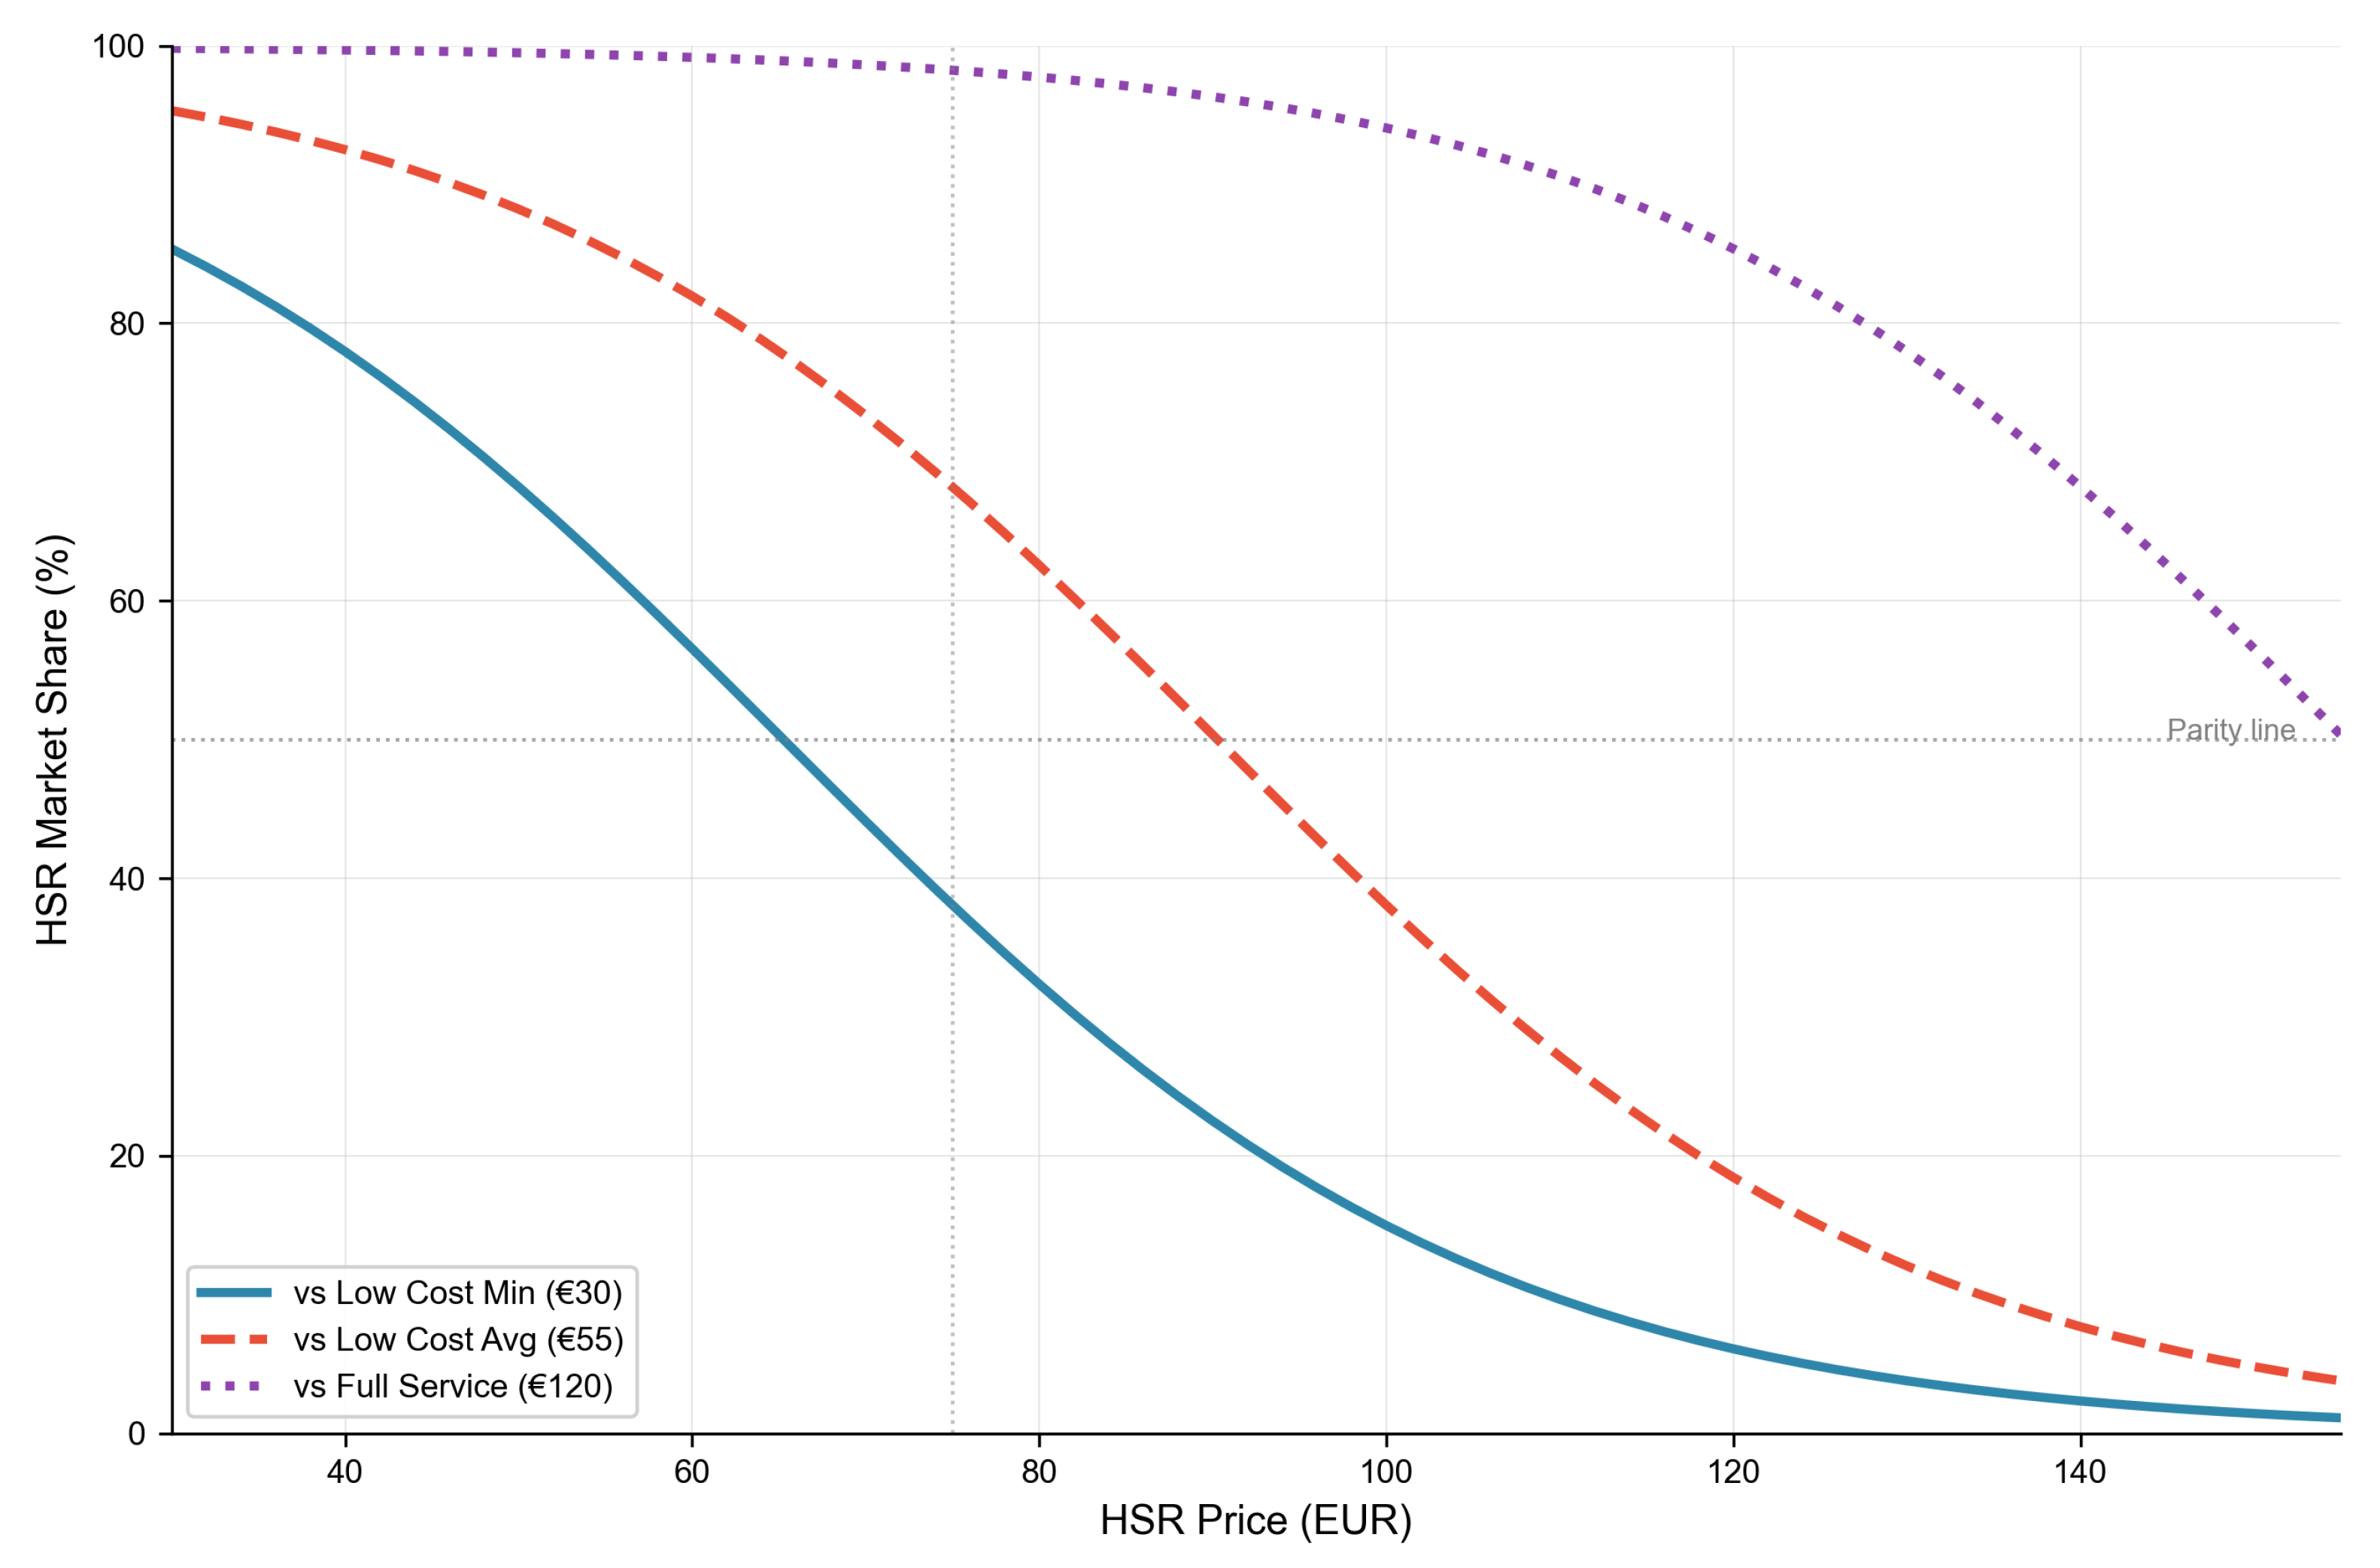
Figure 3.
J-curve pricing pattern by booking horizon. Mean prices increase from €80.5 (30–60 days) to €105.6 (0–3 days), representing a 31.1% premium. The horizontal dashed line at €120 marks the full-service aviation threshold beyond which carbon leakage occurs.
Figure 3.
J-curve pricing pattern by booking horizon. Mean prices increase from €80.5 (30–60 days) to €105.6 (0–3 days), representing a 31.1% premium. The horizontal dashed line at €120 marks the full-service aviation threshold beyond which carbon leakage occurs.
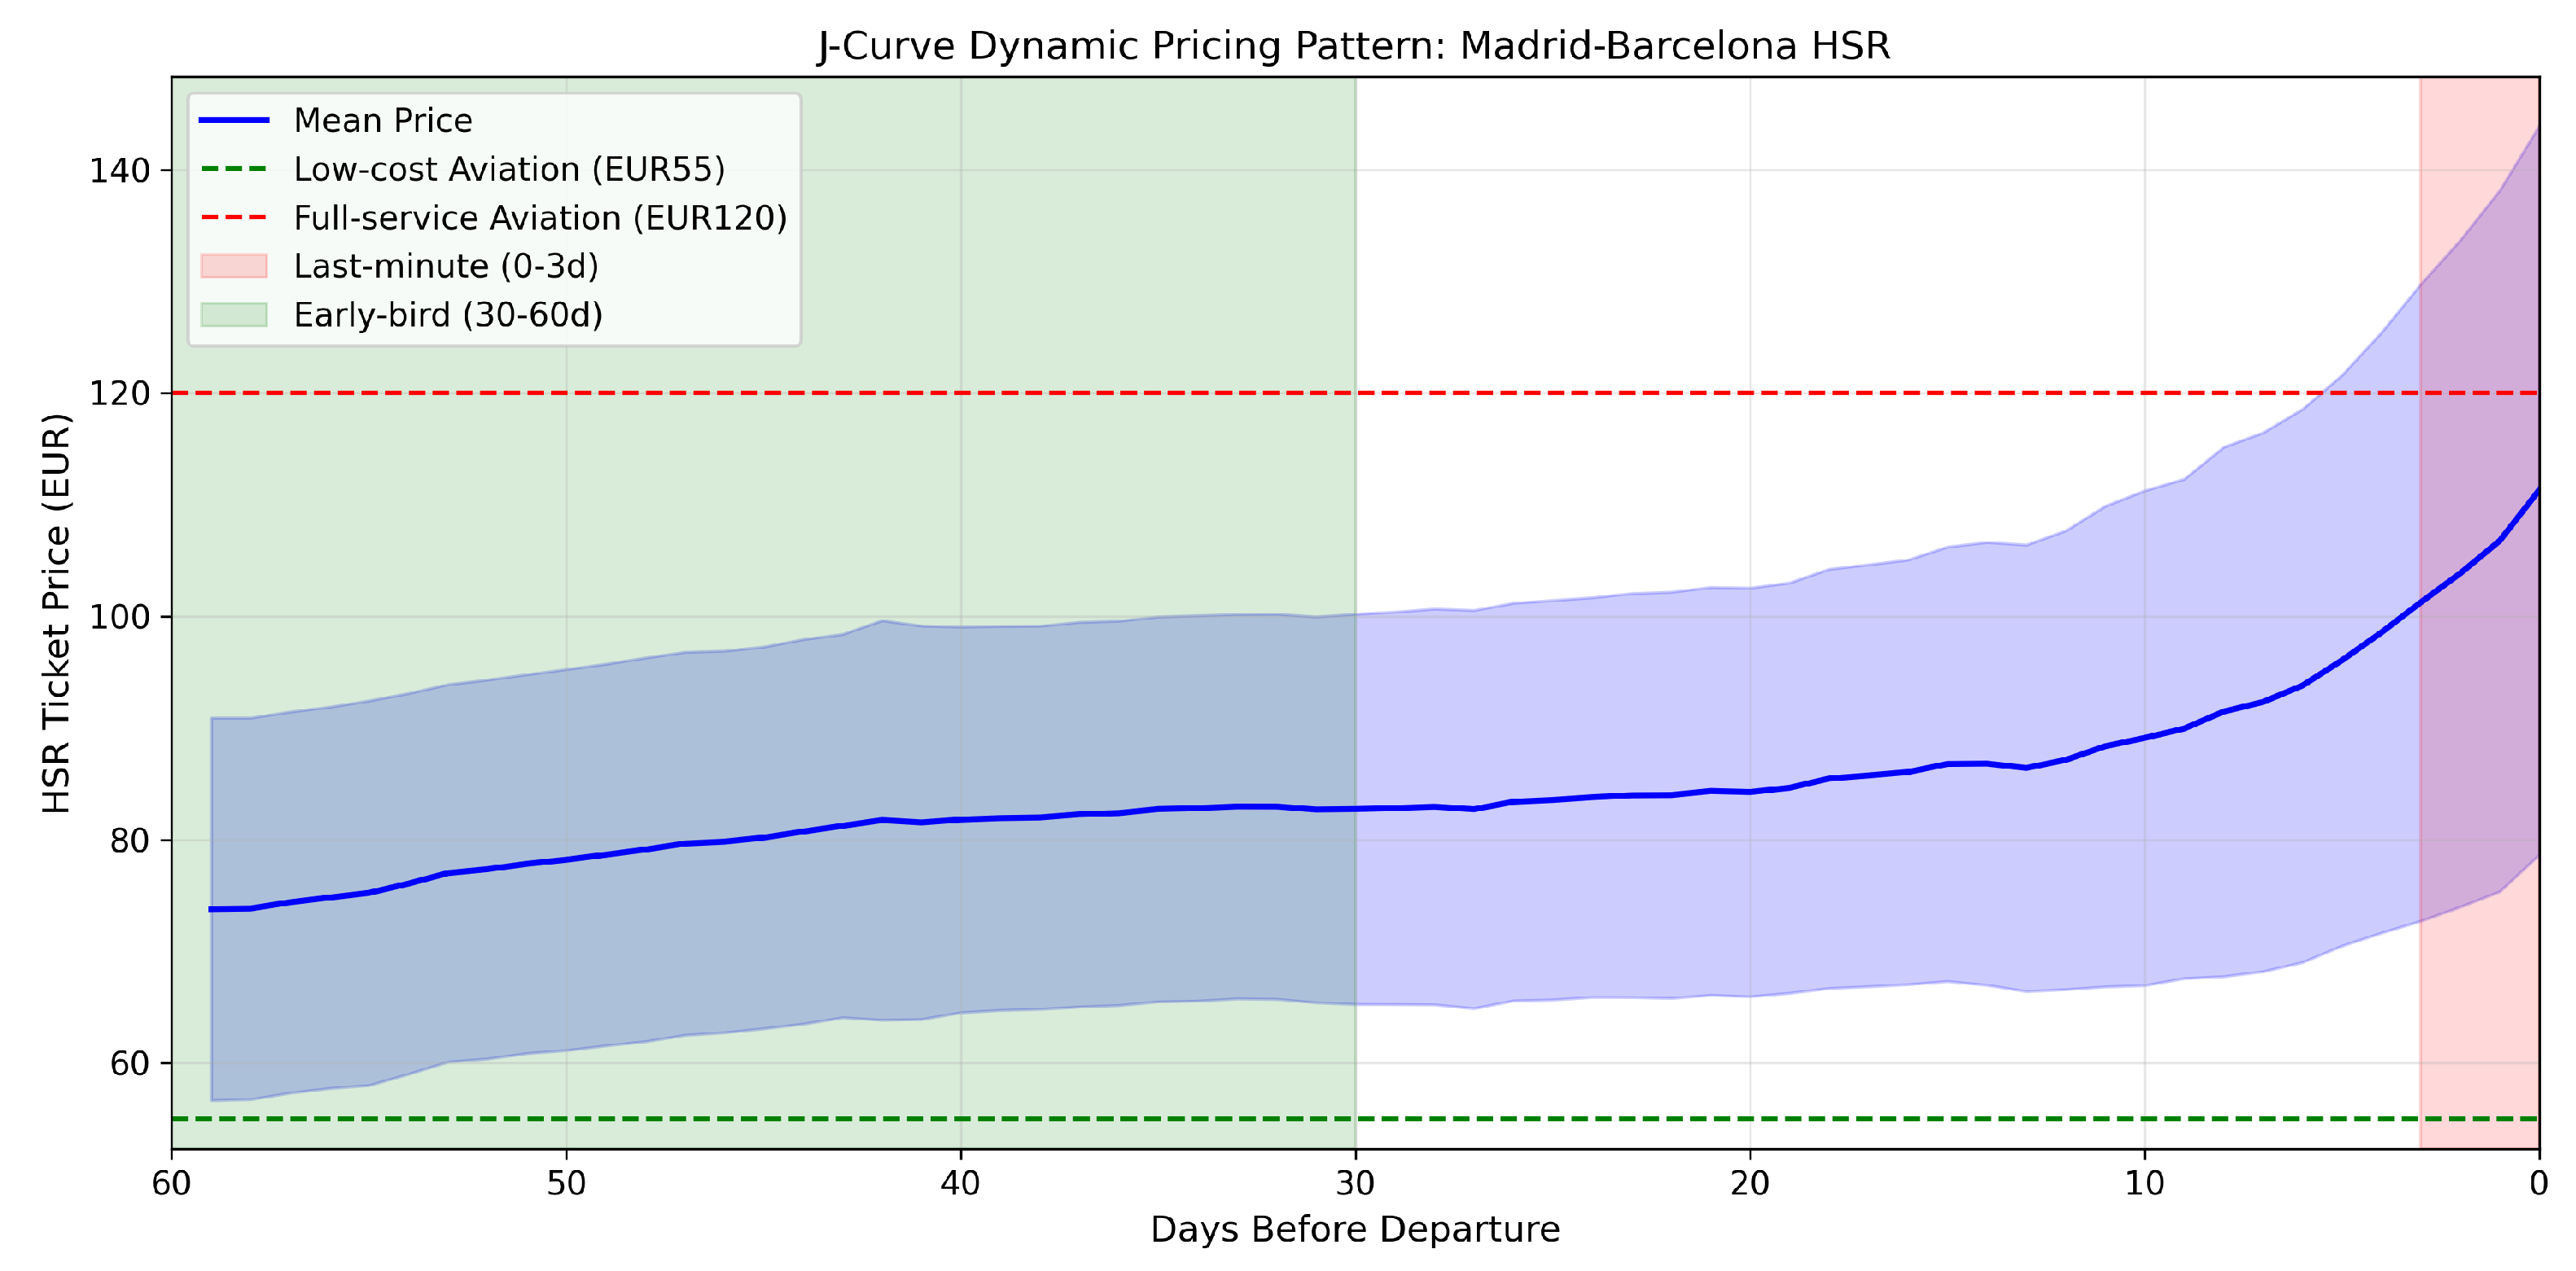
Figure 4.
Bidirectional carbon balance. Positive effect (modal attraction) saves 23,650 tonnes /year, while negative effect (carbon leakage) costs 1,511 tonnes/year. Net savings: 22,139 tonnes/year with 6.4% leakage ratio.
Figure 4.
Bidirectional carbon balance. Positive effect (modal attraction) saves 23,650 tonnes /year, while negative effect (carbon leakage) costs 1,511 tonnes/year. Net savings: 22,139 tonnes/year with 6.4% leakage ratio.
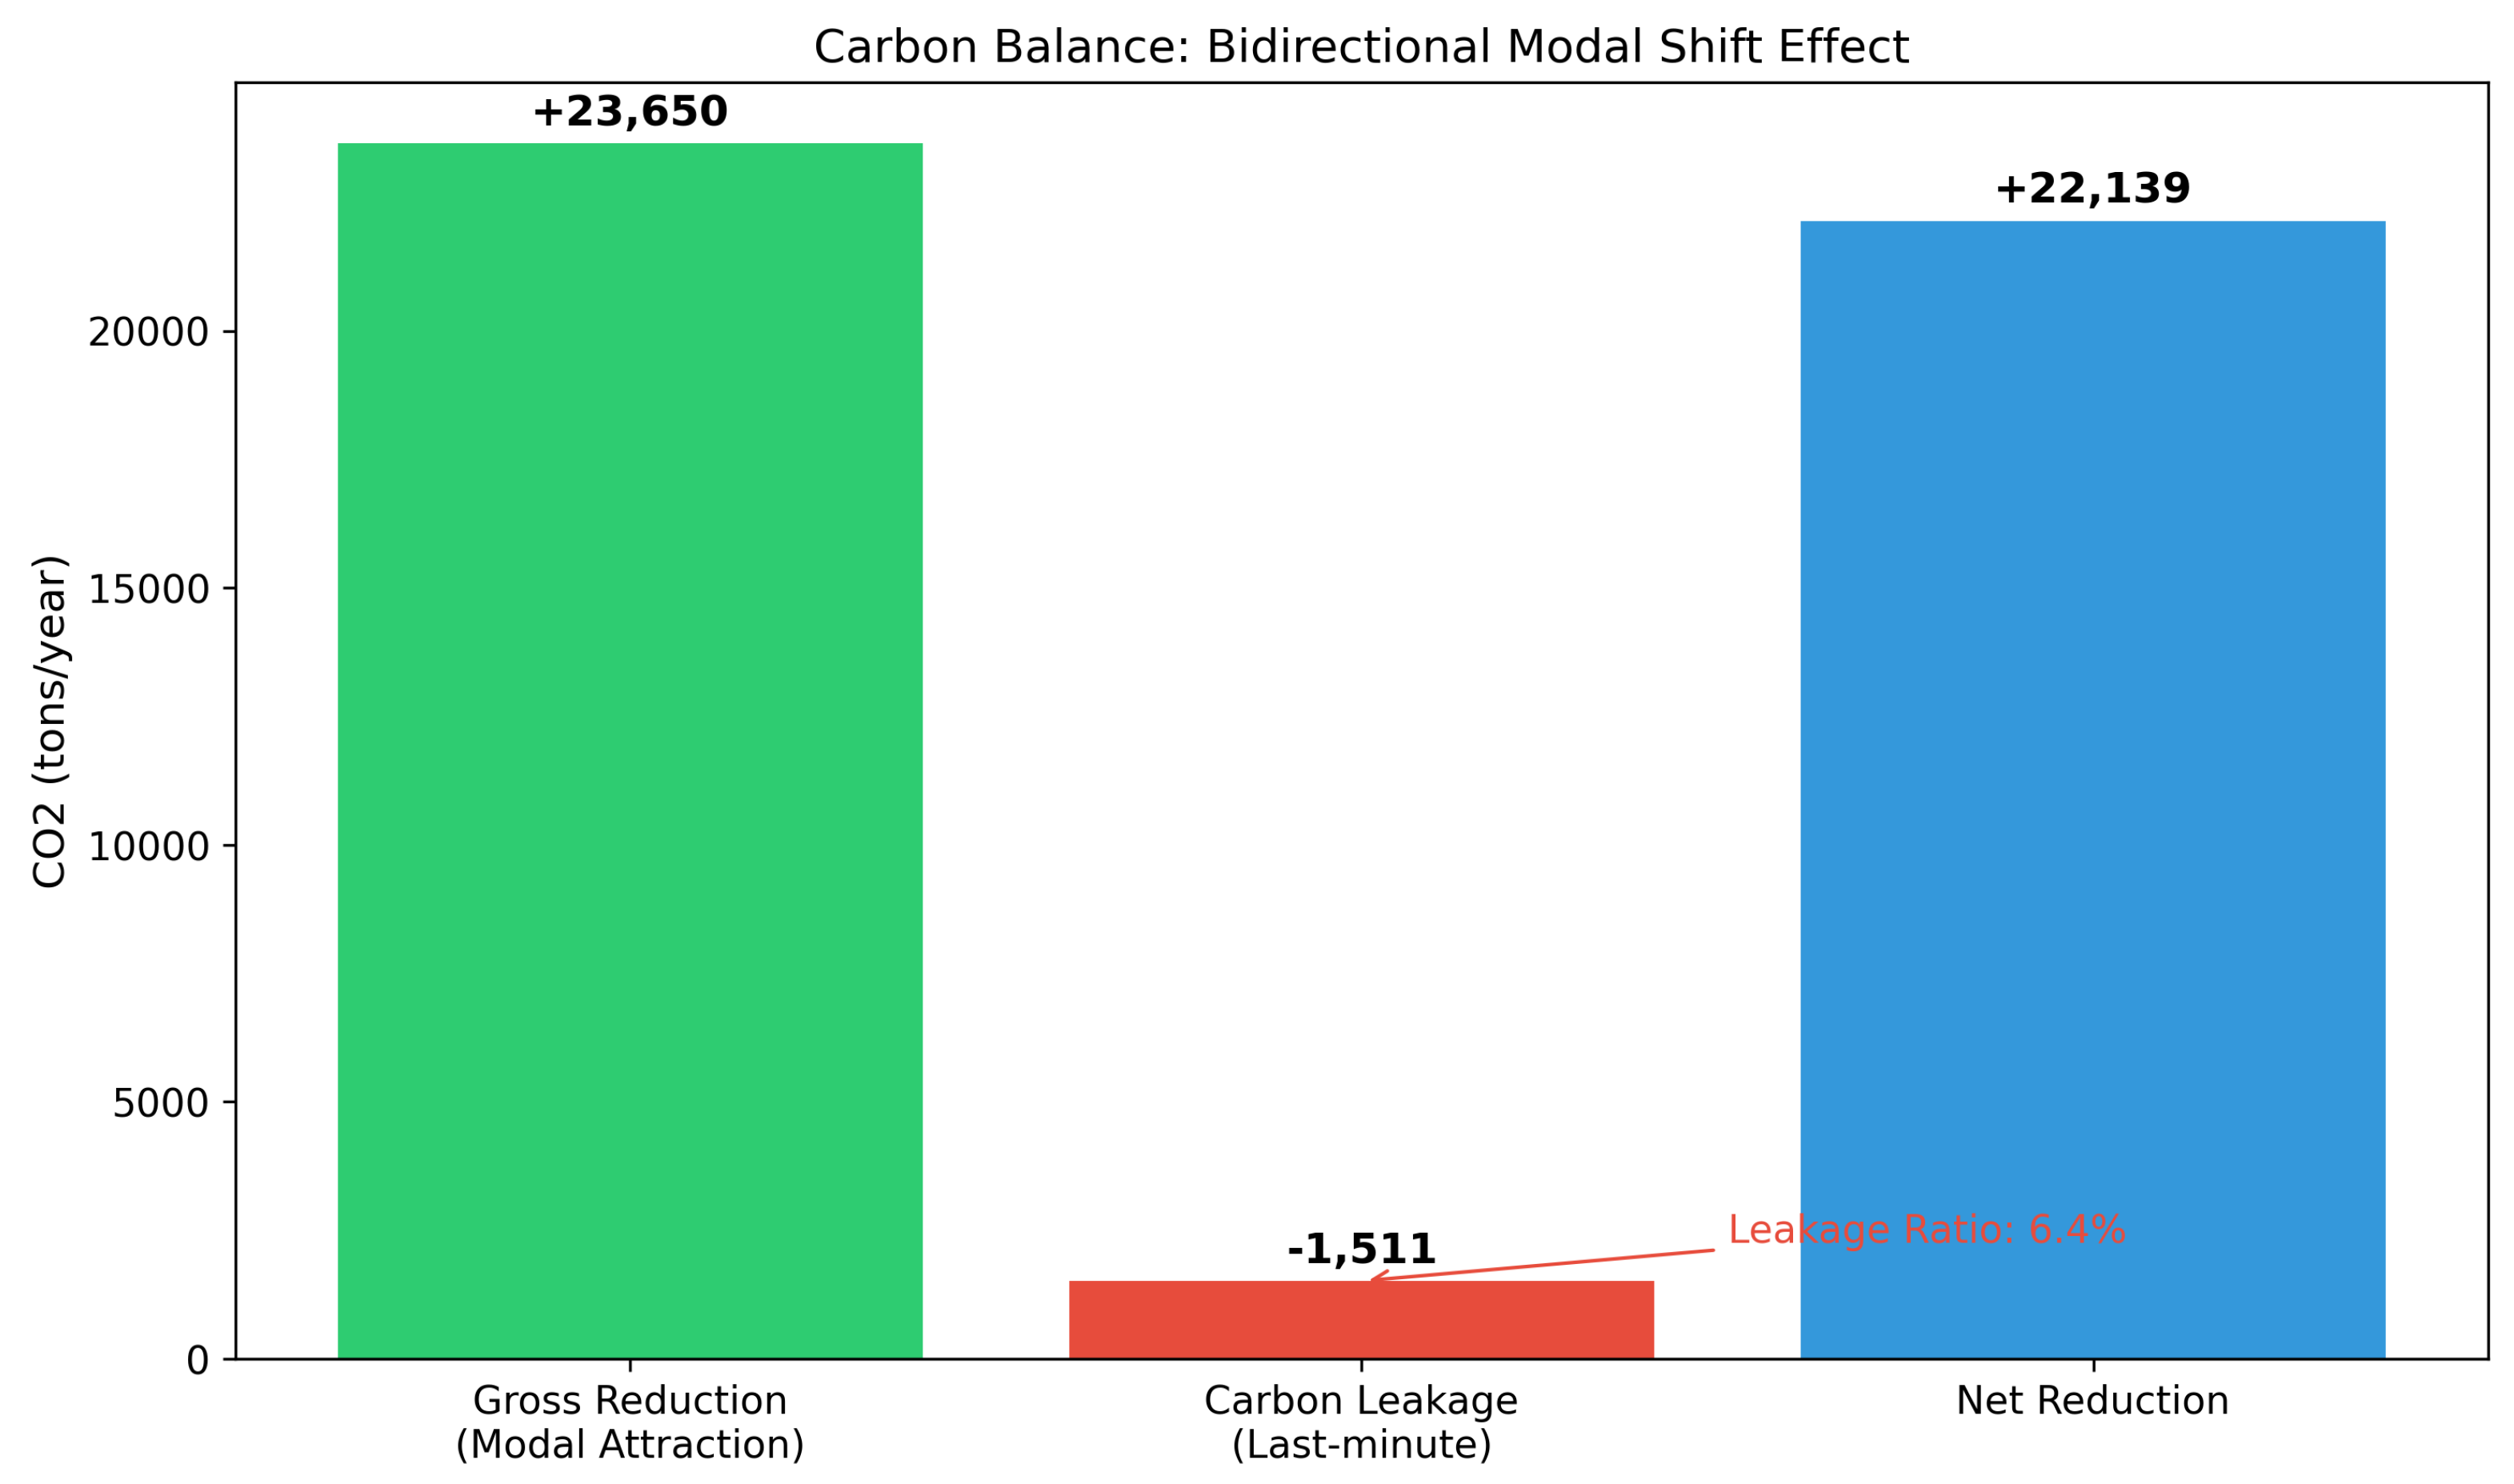
Figure 5.
Per-trip carbon emissions by transport mode for the Madrid–Barcelona corridor (620 km).
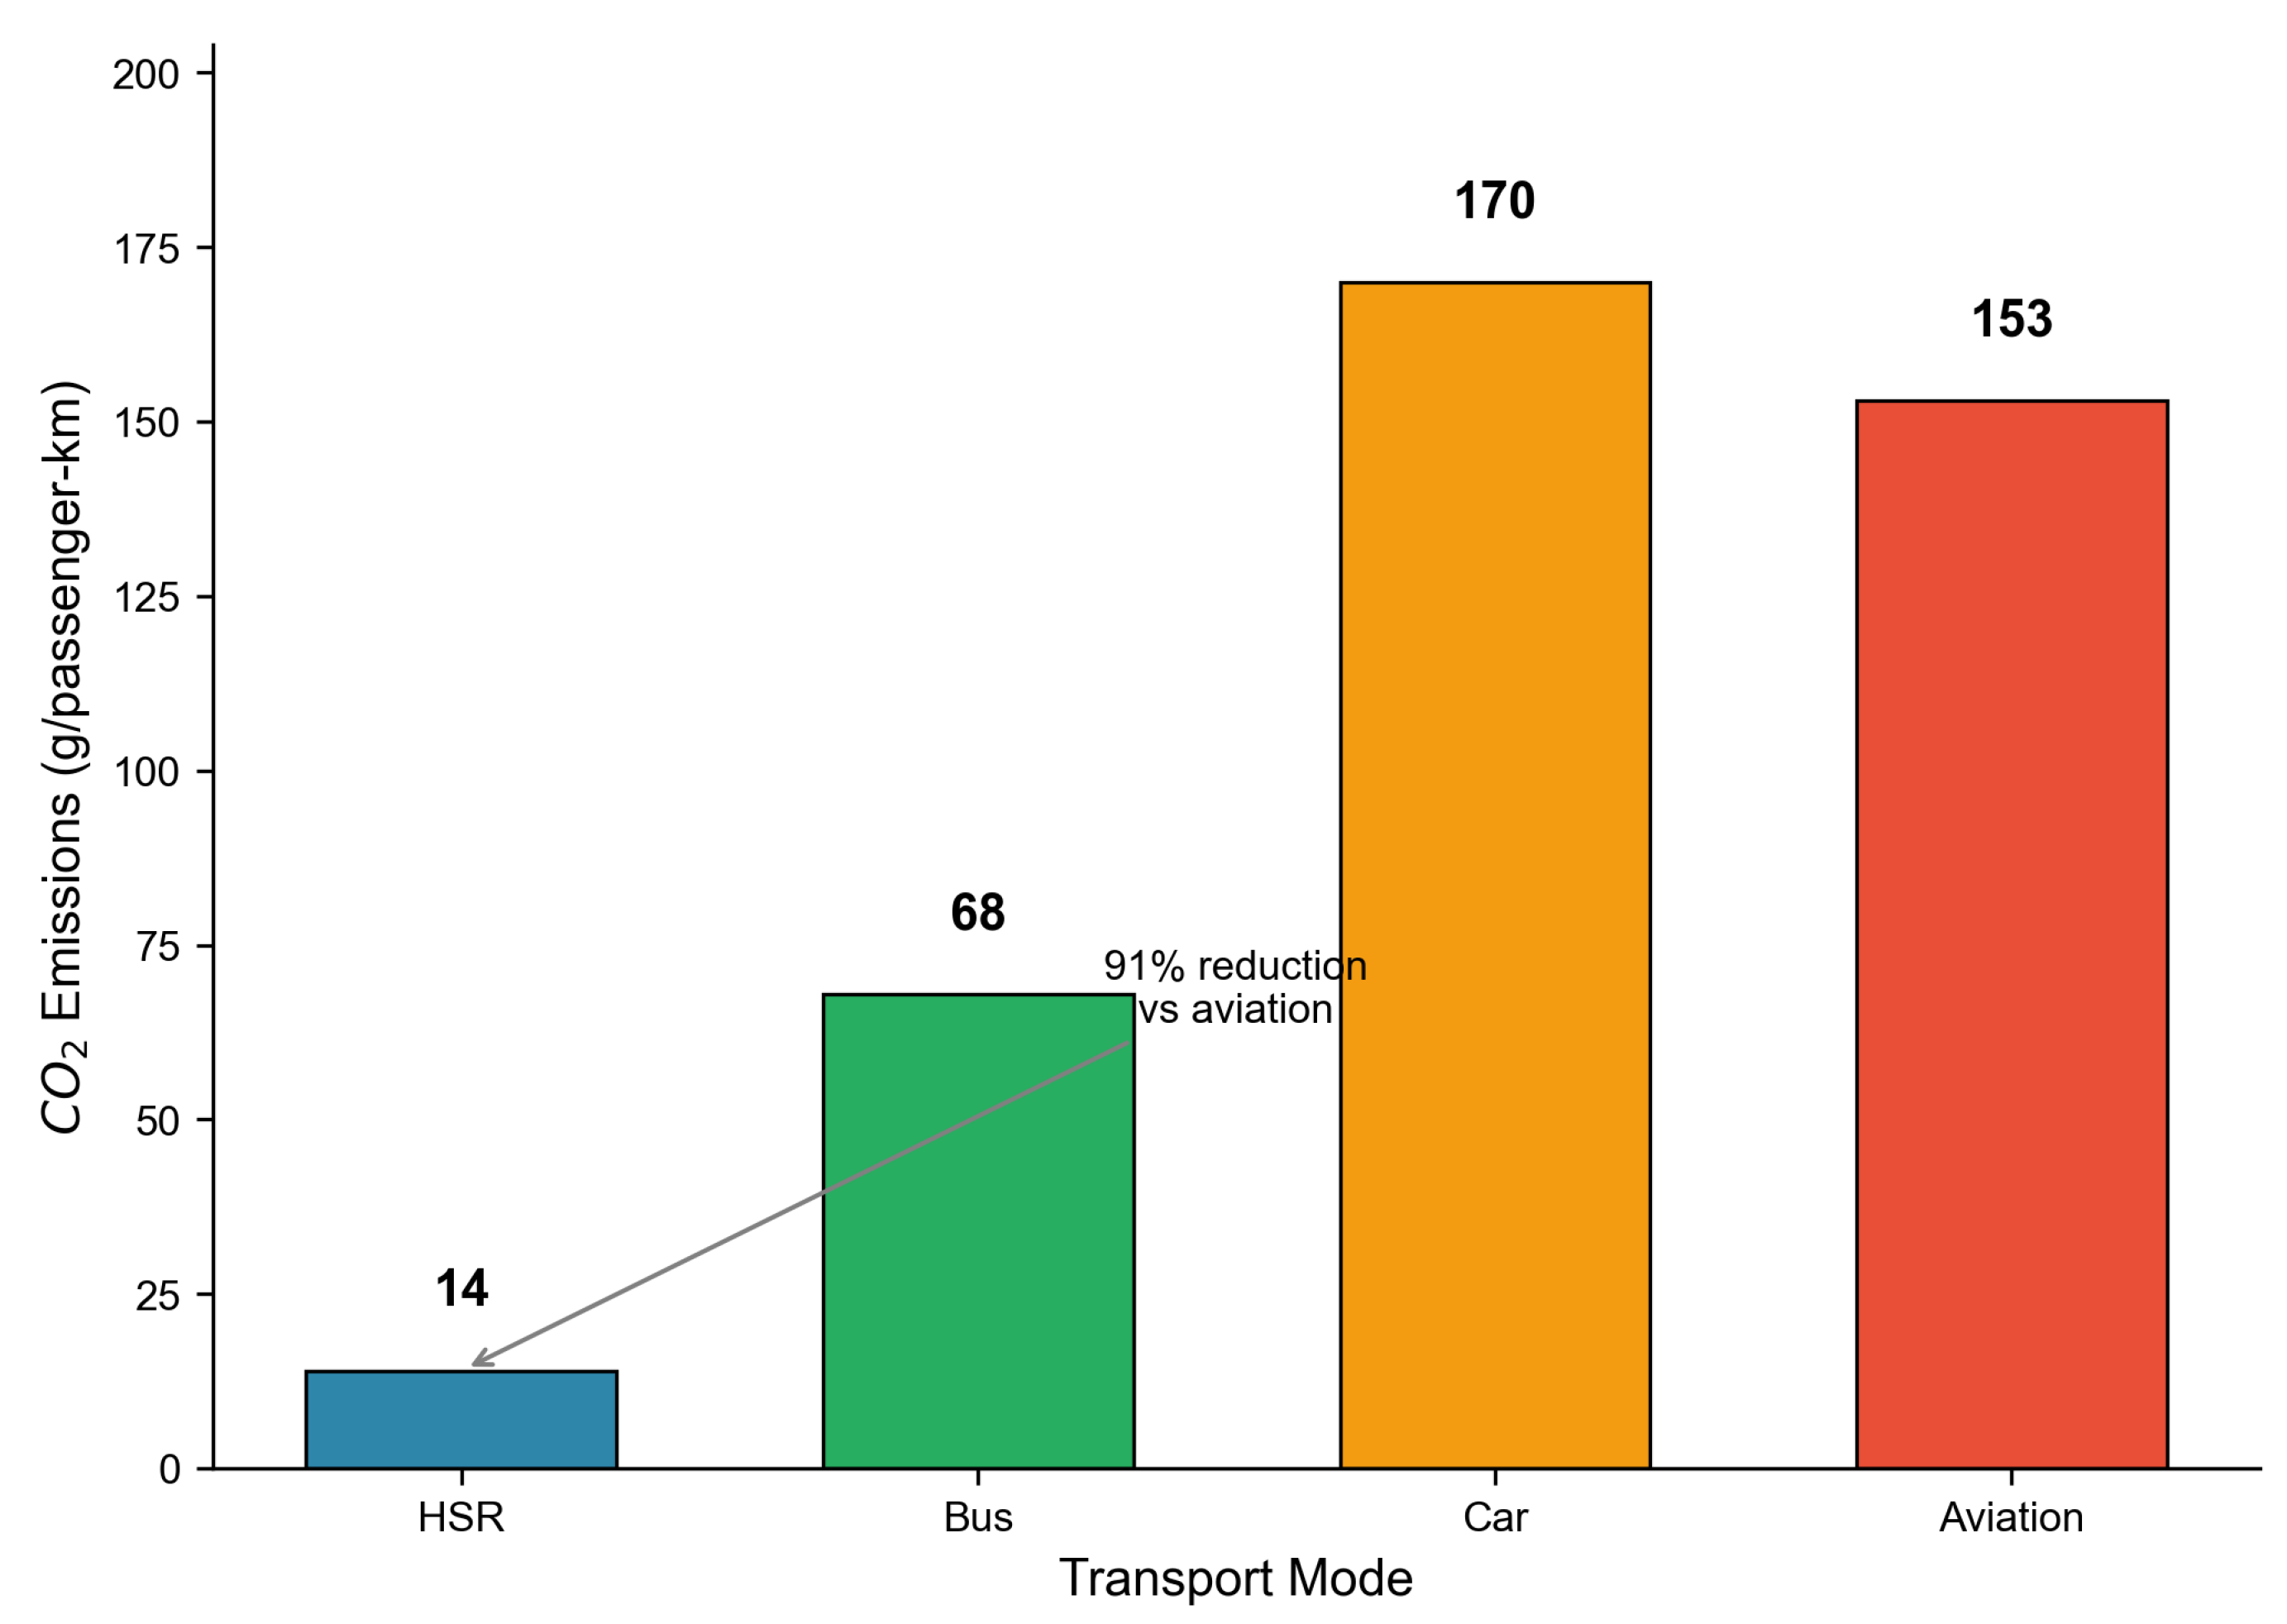

Table 1.
Descriptive statistics for the Madrid–Barcelona corridor sample.
| Variable | Mean | Median | Std. Dev. | Range |
|---|---|---|---|---|
| Price (€) | 86.02 | 85.10 | 21.56 | 0–342.80 |
| Booking Horizon (days) | 24.89 | 24.00 | — | 0–62 |
Note: observations covering 192 unique departure dates (April–October 2019).
Table 2.
Carbon emission factors by transport mode for the Madrid–Barcelona corridor (620 km).
| Mode | Factor (g /km) | Trip Emissions (kg) | Savings vs. Aviation (kg) |
|---|---|---|---|
| HSR | 14 | 8.68 | 86.18 |
| Bus | 68 | 42.16 | 52.70 |
| Car | 170 | 105.40 | —10.54 |
| Aviation | 153 | 94.86 | — |
Source: EEA (2020).
Table 3.
Price statistics by booking category.
| Booking Category | Days Before | Mean Price (€) | CV | Count |
|---|---|---|---|---|
| Early Bird | 31–62 | 80.41 | 0.217 | 904,948 |
| Advance | 15–30 | 84.23 | 0.217 | 828,032 |
| Medium Term | 8–14 | 88.46 | 0.244 | 366,662 |
| Short Term | 4–7 | 95.15 | 0.268 | 206,378 |
| Last Minute | 0–3 | 105.57 | 0.292 | 201,095 |
Note: ANOVA , , . Pairwise comparisons significant at .
Table 4.
Price elasticity estimates by market segment.
| Segment | Elasticity () | SE | Mean Price (€) | n |
|---|---|---|---|---|
| Overall | 0.15 | 86.02 | 2,507,115 | |
| Peak Hour | 0.12 | 86.23 | 1,151,645 | |
| Off-Peak | 0.12 | 85.84 | 1,355,470 | |
| Weekday | 0.12 | 85.55 | 1,922,690 | |
| Weekend | 0.12 | 87.54 | 584,425 | |
| Morning | 0.12 | 81.30 | 995,063 | |
| Evening | 0.12 | 90.68 | 659,441 |
Note: All estimates significant at . Method: literature-calibrated with corridor-specific adjustment.
Table 5.
HSR price competitiveness by aviation scenario.
| Aviation Scenario | Air Price (€) | Breakeven HSR (€) | Competitive (%) |
|---|---|---|---|
| Low-Cost Minimum | 30 | 50 | 6.2 |
| Low-Cost Average | 55 | 75 | 22.4 |
| Full-Service | 120 | 140 | 94.9 |
Table 6.
Carbon leakage risk by booking horizon.
| Period | Mean (€) | Records | Above €120 | Leakage Risk (%) |
|---|---|---|---|---|
| 30–60 days | 80.5 | 910,233 | 10,012 | 1.1 |
| 15–29 days | 84.3 | 755,263 | 22,658 | 3.0 |
| 8–14 days | 88.5 | 355,315 | 24,161 | 6.8 |
| 4–7 days | 95.2 | 199,320 | 25,314 | 12.7 |
| 0–3 days | 105.6 | 183,721 | 40,920 | 22.3 |
Note: Leakage risk defined as proportion of tickets exceeding €120 aviation threshold.
Table 7.
Bidirectional modal shift carbon accounting.
| Effect | Passengers | (tonnes/yr) | Mechanism |
|---|---|---|---|
| Positive (Attraction) | 274,431 | Advance pricing < €120 | |
| Negative (Leakage) | 17,537 | Last-minute pricing > €120 | |
| Net Savings | — | Leakage ratio: 6.4% |
Note: Per-trip saving = 86.18 kg (aviation 153 g/pkm - HSR 14 g/pkm) × 620 km.
Table 8.
Annual carbon savings by modal shift scenario (aviation → HSR).
| Scenario | Passengers Shifted | Saved (tonnes/yr) | Equiv. Cars Removed |
|---|---|---|---|
| 5% shift | 100,000 | 8,618 | ∼3,400 |
| 10% shift | 200,000 | 17,236 | ∼6,800 |
| 15% shift | 300,000 | 25,854 | ∼10,100 |
| 20% shift | 400,000 | 34,472 | ∼13,500 |
| 25% shift | 500,000 | 43,090 | ∼16,900 |
Note: Baseline = 2 million annual aviation passengers. Per-trip saving = 86.18 kg .
Table 9.
Price cap scenarios and carbon leakage elimination.
| Price Cap | Leakage (tonnes) | Net Saved (tonnes) | Leakage Ratio (%) | Notes |
|---|---|---|---|---|
| No Cap (Baseline) | 1,511 | 22,139 | 6.4 | Current situation |
| €130 | 827 | 22,824 | 3.5 | Partial leakage |
| €120 | 0 | 23,650 | 0.0 | Parity threshold |
| €110 | 0 | 23,650 | 0.0 | Eliminates all leakage |
| €100 | 0 | 23,650 | 0.0 | Zero leakage |
| €90 | 0 | 23,650 | 0.0 | Aggressive cap |
Note: Any cap < €120 eliminates leakage by ensuring all HSR prices remain aviation-competitive.
Table 10.
Sensitivity to aviation price threshold.
| Aviation Threshold (€) | Leakage (tonnes) | Net Saved (tonnes) | Leakage Ratio (%) |
|---|---|---|---|
| 100 (Low-cost aggressive) | 4,271 | 19,379 | 18.1 |
| 110 (Mid-range) | 2,530 | 21,120 | 10.7 |
| 120 (Full-service baseline) | 1,511 | 22,139 | 6.4 |
| 130 (Premium) | 876 | 22,774 | 3.7 |
| 140 (Very high) | 628 | 23,023 | 2.7 |
Note: Switch rate held at 25%. Leakage persists across all thresholds, confirming structural J-curve issue.
Table 11.
Sensitivity to passenger switching rate.
| Switch Rate (%) | Leakage (tonnes) | Net Saved (tonnes) | Leakage Ratio (%) |
|---|---|---|---|
| 15 (Conservative) | 907 | 22,744 | 3.8 |
| 20 | 1,209 | 22,441 | 5.1 |
| 25 (Baseline) | 1,511 | 22,139 | 6.4 |
| 30 | 1,814 | 21,836 | 7.7 |
| 35 | 2,116 | 21,534 | 8.9 |
| 40 (Pessimistic) | 2,418 | 21,232 | 10.2 |
Note: Aviation threshold held at €120. Leakage ratio scales linearly with switching propensity.
Disclaimer/Publisher’s Note: The statements, opinions and data contained in all publications are solely those of the individual author(s) and contributor(s) and not of MDPI and/or the editor(s). MDPI and/or the editor(s) disclaim responsibility for any injury to people or property resulting from any ideas, methods, instructions or products referred to in the content. |
© 2026 by the authors. Licensee MDPI, Basel, Switzerland. This article is an open access article distributed under the terms and conditions of the Creative Commons Attribution (CC BY) license (http://creativecommons.org/licenses/by/4.0/).
Copyright: This open access article is published under a Creative Commons CC BY 4.0 license, which permit the free download, distribution, and reuse, provided that the author and preprint are cited in any reuse.


