Submitted:
04 February 2026
Posted:
06 February 2026
You are already at the latest version
Abstract
Germany's global competitiveness, historically rooted in its high-quality education system, is threatened by a severe investment backlog in its public-school infrastructure. While national estimates of this deficit are substantial, the literature lacks a granular empirical analysis at the municipal level, where fiscal responsibility for these assets primarily lies. This paper addresses this critical gap by providing the first municipal-level study of Germany's school investment crisis and exploring the necessity and viability of private capital as a solution. Using a mixed-methods approach, we conduct a cross-sectional analysis of 30 municipalities in North Rhine-Westphalia, integrating demographic, fiscal, and real estate data. We introduce a novel composite metric, the ‘Need Score,’ to offer a more nuanced tool for identifying high-need municipalities. Our findings reveal a profound structural underfunding, with planned municipal investments covering less than 10% of the estimated backlog. The backlog is weakly correlated with GDP growth but not significantly predicted by other common socio-economic indicators, highlighting the limitations of macro-level diagnostics. Conversely, a higher share of private school enrolment is significantly associated with a lower public investment backlog (r = -0.51, p < 0.05). A detailed financial case study demonstrates that investments in educational real estate can deliver stable, positive returns (IRR of 4.5%–19.8%), positioning them as an attractive asset class for institutional investors. We conclude that private capital is not merely an alternative but a necessity for securing Germany’s educational future and propose a policy framework for fostering effective public-private partnerships (PPPs) to bridge this critical infrastructure gap.
Keywords:
educational real estate
; public-private partnership (ppp)
; impact investing
; urban finance
; infrastructure investment
; municipal governance
; need score
; germany
; north rhine-westphalia
1. Introduction
The quality of a nation’s educational infrastructure is a fundamental determinant of its long-term economic prosperity and social cohesion [1]. In advanced economies, which rely on intellectual capital rather than natural resources, the physical environments where learning occurs are not merely passive backdrops but active components of the educational production function [2]. Across Germany, however, the condition of many schools has deteriorated to a state of systemic crisis, threatening the very foundation of its knowledge-based economy. The KfW Kommunalpanel 2025, estimates the national investment backlog in school infrastructure at €68 billion [3]. This figure, while staggering, only hints at the depth of a crisis rooted in decades of deferred maintenance and fiscal consolidation at the sub-national level [4]
This structural decay coincides with a decline in Germany’s performance in international educational assessments, such as the Programme for International Student Assessment (PISA), where student achievement now hovers around the OECD average [5]. This trend is particularly alarming given the extensive body of research correlating the quality of learning environments with educational outcomes [6]. Compounding this issue are demographic pressures, including a projected 6.8% rise in pupil numbers by 2035 [7], and new statutory mandates, such as the legal entitlement to all-day care for primary school children from 2026. These forces exert unprecedented pressure on an already strained infrastructure, creating a critical policy challenge: a foundational renewal of school facilities is a prerequisite for any meaningful improvement in German education.
Given the well-documented fiscal constraints of public funding mechanisms, a consensus is emerging that private investment may be essential to bridge this infrastructure chasm. However, while the national problem is widely acknowledged in government reports and media, the academic literature lacks granular, municipal-level empirical analysis. This is a critical blind spot, as municipalities are the primary stewards of these assets under Germany’s system of fiscal federalism [8].
This paper fills this gap through a two-part design. First, a theoretical framework is developed from a structured literature review, outlining the governance of school infrastructure, the drivers of the investment backlog, alternative financing models such as public-private partnerships (PPPs) [9], and the risk-return profile of educational real estate. Second, drawing on this framework, we conduct a comprehensive empirical analysis of 30 municipalities in North Rhine-Westphalia (NRW), Germany’s most populous state. This analysis tests eight hypotheses to investigate the relationships between the investment backlog and a range of socio-economic, demographic, and fiscal indicators.
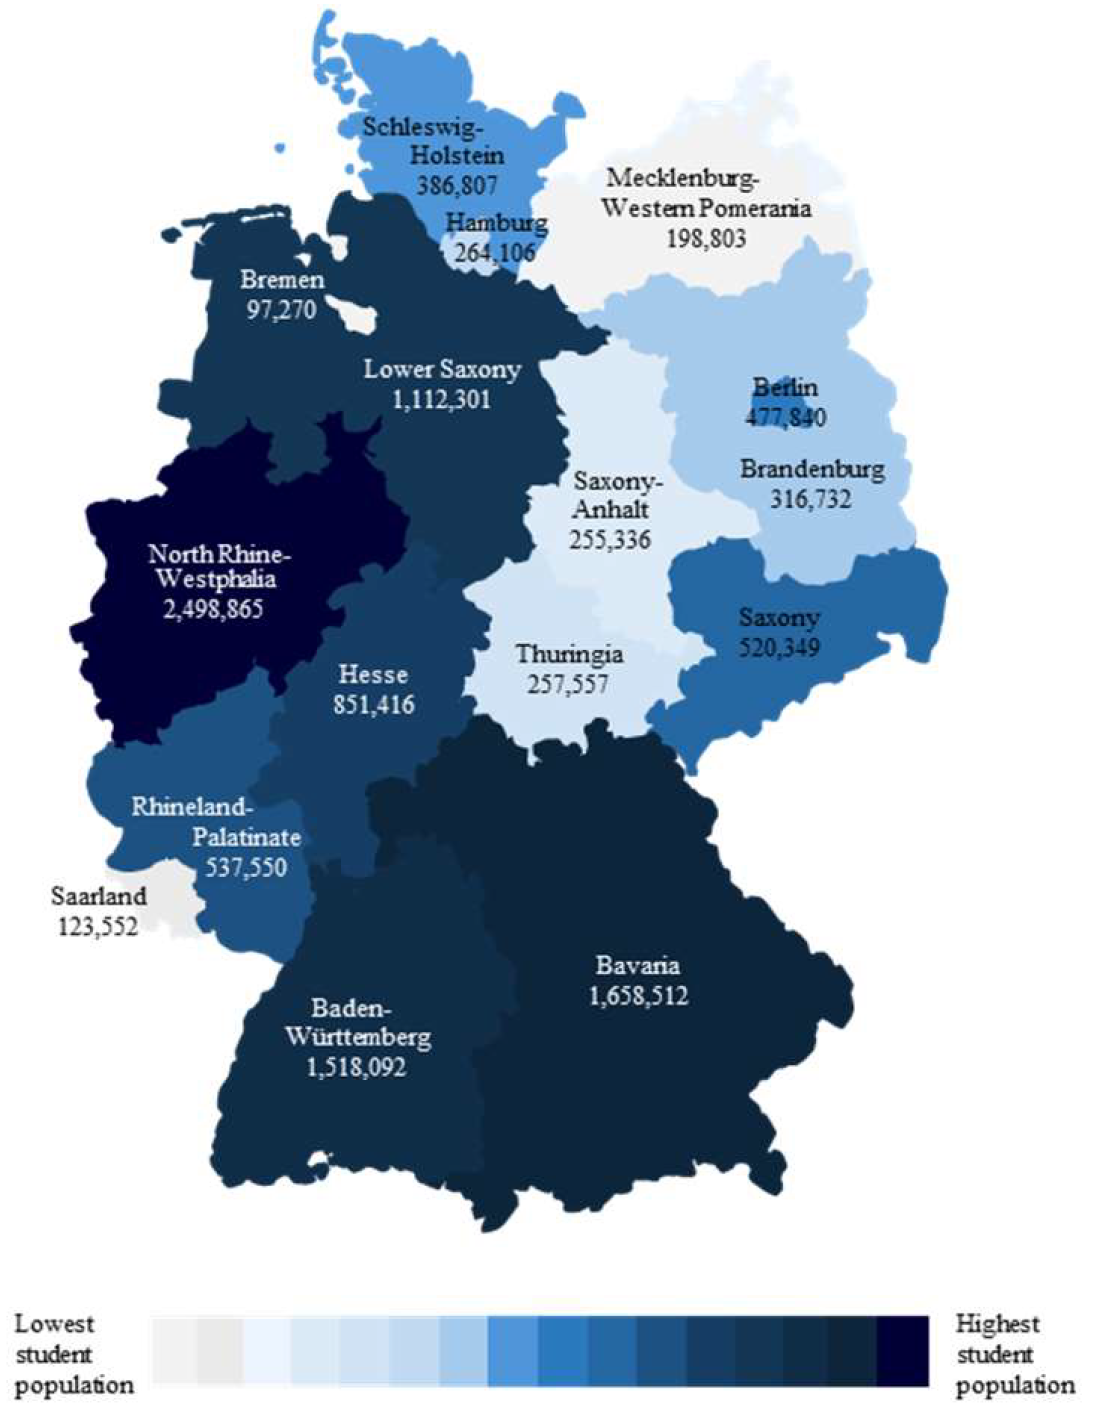
Figure 1 below shows the concentration of students in different states.
A key methodological contribution of this study is the development of a bespoke evaluative metric, the ‘‘Need Score’’, which provides a data-driven tool for identifying high-need municipalities. This quantitative analysis is complemented by a financial case study of a school development project, which models returns from an investor’s perspective.
This study is guided by two primary research questions:
- Are private investors necessary to secure the future of Germany’s educational infrastructure, and to what extent can investments in educational infrastructure be financially beneficial for private investors?
- Which socio-economic indicators moderate the investment backlog in educational real estate, and can they be used to identify high-need municipalities?
By providing the first municipal-level empirical evidence of Germany’s school investment crisis, this article offers critical insights for public-sector decision-makers, urban planners, and private investors. It argues that a strategic infusion of private capital, structured within effective governance frameworks, is not only financially viable but indispensable for modernizing Germany’s educational landscape.
2. Literature Review
This section establishes the theoretical foundations for our empirical inquiry by synthesizing literature from urban governance, public finance, and real estate economics. We first contextualize Germany’s infrastructure deficit within the broader academic discourse on public investment and fiscal federalism, which explains the structural pressures on municipal budgets [10]. We then critically evaluate Public-Private Partnerships (PPPs) as a potential solution, drawing on international evidence regarding their performance and governance [11]. Finally, we assess educational real estate as an emerging asset class, examining its risk-return profile and its alignment with the principles of impact investing [12].
Fiscal Federalism and the Roots of Infrastructure
Decay Germany’s school infrastructure crisis is not an isolated event but a manifestation of systemic pressures inherent in many decentralized governance systems. The principle of fiscal federalism, which assigns expenditure responsibilities and revenue-raising powers to distinct levels of government, is central to this issue [13]. In Germany, municipalities are responsible for the “external” aspects of schooling, including the construction, operation, and maintenance of buildings [14] While this local control can foster responsiveness to local needs, it also exposes essential public services to the volatility of municipal finance. Academic literature demonstrates that when facing fiscal stress, sub-national governments often defer capital expenditures and maintenance, as these cuts are less politically visible in the short term than cuts to services or employment [15] ; [16]. The estimated €68 billion national backlog [3]is the cumulative result of such decisions over decades. This pattern of deferred maintenance is a well-documented phenomenon in public finance, leading to higher long-term costs and deteriorating asset quality [14].
Public-Private Partnerships as a Financing Mechanism.
In response to such fiscal constraints, governments worldwide have turned to Public-Private Partnerships (PPPs) [17]. A PPP can be defined as a long-term contract between a private party and a government entity for providing a public asset or service, in which the private party bears significant risk and management responsibility [18]. Proponents argue that PPPs can introduce private-sector efficiencies, innovation, and, most critically, capital, thereby overcoming the limitations of public procurement and debt ceilings. However, the international experience with PPPs is mixed [19]. While some studies report efficiency gains and value-for-money (VFM), others highlight challenges related to high transaction costs, complex contract negotiations, and the risk of poor performance if contracts are not properly structured and monitored [20]. For social infrastructure like schools, ensuring that efficiency goals do not compromise educational quality and equity is paramount [21]. Our analysis of a PPP case study will therefore assess not just its financial viability but also its potential as a scalable policy tool within this complex theoretical context.
Educational Real Estate:
An Emerging Asset Class From an investor perspective, the attractiveness of educational properties lies in their unique risk-return profile. As government-tenanted, long-lease assets, they can offer stable, bond-like income streams. While the market for educational properties is still maturing and transaction data are limited, initial industry evidence suggests net initial yields in the range of 4.5% to 5.5% [22]. This positions educational real estate within a core or core-plus investment strategy, offering portfolio diversification and long-duration, inflation-indexed income. However, these properties are also “special purpose,” which can elevate third-party usability risk and limit capital value appreciation compared to traditional asset classes like office or retail [23]; [24]. Our financial case study empirically evaluates these theoretical trade-offs [25].
Impact Investing and ESG Alignment
Beyond purely financial metrics, a paradigm shift is occurring in investment management toward generating measurable social value alongside financial returns, a practice known as ‘impact investing’ [26]. Investments in educational infrastructure align directly with this paradigm, addressing multiple UN Sustainable Development Goals (SDGs), particularly SDG 4 (Quality Education). For an investment to be credibly designated as “impact,” its social benefits must be systematically documented and evaluated, often through frameworks like the “Theory of Change” [27]. For investors, the demonstrable social impact of modernizing schools can enhance corporate reputation, attract capital from ESG-mandated funds, and create a virtuous circle where financial success and social value are mutually reinforcing [28]. This study evaluates educational real estate through this dual lens of financial return and social impact.
3. Methods
This study employs a mixed-method research design to investigate the necessity and viability of private investment in Germany’s educational infrastructure [29]. This approach allows us to first establish macro-level patterns through a quantitative cross-sectional analysis and then to assess micro-level financial feasibility through a qualitative case study.
Data and Sample Selection
The research is centered on an empirical analysis of all 30 municipalities in North Rhine-Westphalia (NRW) with populations exceeding 100,000 inhabitants. NRW was chosen as it is Germany’s most populous state, exhibits significant socio-economic heterogeneity, and reports one of the highest perceived investment backlogs, making it a critical case for analysis. The dataset comprises 47 variables for the 30 municipalities, compiled from official public sources (e.g., IT.NRW for demographic and economic data), municipal budget plans, and private sources (e.g., real estate portals for rent data). Missing data points for the investment backlog, a key variable, were managed using multiple imputation [30] to ensure a robust dataset for regression analysis. The key variables are operationalised as follows:
- Investment Backlog: The reported total investment backlog for school infrastructure in a municipality (€). This figure, while based on municipal self-reporting and subject to variation in estimation methods, represents the best available proxy for the scale of need.
- Planned Investments: The total planned investments in school infrastructure for the period 2025-2028, as reported in municipal financial plans (€).
- Pupil Data: Total number of pupils, forecasts for 2033/34, and the distribution between public and private schools.
- Socio-Economic Indicators: Inhabitants, GDP per capita (2022), change in GDP per capita (2015–2022), and unemployment rates.
- Real Estate Indicators: Base rent for apartments and houses from leading real estate portals (Immoscout, Engel & Völkers), serving as a proxy for local market wealth and attractiveness.
- Municipal Finance: Data on municipal debt, reserves, and budget balances.
NRW was chosen as the geographical focus for several reasons. It is Germany’s most populous state, with a high concentration of large urban centres. It exhibits significant economic and social heterogeneity, providing a diverse sample of municipalities. Furthermore, NRW municipalities report one of the highest perceived investment backlogs in Germany, making it a particularly relevant area for this research [31]. The sample includes the 25 largest independent cities (‘kreisfreie Städte’) and 5 other large municipalities, providing a representative cross-section of major urban areas in the state.
Methods of Analysis
The data analysis was conducted in three main stages.
Stage 1: Descriptive and Inferential Statistics The first stage involved a descriptive analysis of the key variables to understand their distribution, central tendencies (mean, median), and dispersion (standard deviation). This provides an initial overview of the scale of the investment backlog and planned spending across the sample. This was followed by inferential statistical tests to examine the relationships articulated in our hypotheses. Given the small sample size (n=30), non-parametric tests were considered where the assumptions of normality were violated (as assessed by the Shapiro-Wilk test). Pearson correlation coefficients and paired t-tests were used to assess the strength and significance of relationships between variables.
Stage 2: Development of the ‘‘Need Score’’ A central methodological innovation of this study is the creation of a composite ‘‘Need Score’’. The investment backlog figure, while useful, is an absolute measure that does not account for the size of a municipality or its specific pressures. To create a more nuanced and comparable metric, we developed a regression-based formula. The ‘Need Score’ is a linear combination of several weighted variables theoretically linked to infrastructure need.
The base model is defined as:
‘Need Score’ (€) = β₀ + β₁ * (Absolute Increase in General Education Pupils) + β₂*(Total Number of Schools) + β₃ * (Total Number of Pupils) + ε
The variables were selected based on their direct theoretical relevance to infrastructure demand. The coefficients (β) were estimated via Ordinary Least Squares (OLS) regression, effectively weighting the contribution of each component based on the observed data. A second, standardised ‘Need Score’ was also created by normalising the score by the number of inhabitants, allowing for a per-capita comparison of investment need across municipalities of different sizes. These scores were then used to rank municipalities and were visualised using heat maps to identify geographical clusters of high need.
Stage 3: Financial Feasibility Case Study To address the financial viability question from an investor’s perspective, a case study analysis was conducted on a hypothetical new-build school project. This analysis models the financial returns of a PPP project under a long-term lease agreement with a municipality. Key assumptions include a 30-year lease term, a specific project cost, rental rates derived from market data, and financing parameters (loan-to-cost ratio, interest rates). The analysis calculates several standard real estate investment metrics, including the Internal Rate of Return (IRR), Equity Multiple (EM), and Cash-on-Cash (CoC) return, under different scenarios (e.g., with and without public subsidies). This provides a tangible assessment of whether such projects can meet the return hurdles of private institutional investors.
In this section, where applicable, authors are required to disclose details of how generative artificial intelligence (GenAI) has been used in this paper (e.g., to generate text, data, or graphics, or to assist in study design, data collection, analysis, or interpretation).
4. Results
This section presents the findings from our empirical analysis. We begin with a descriptive overview of the investment landscape, followed by the results of the hypothesis tests and the application of our ‘Need Score’ metric. Finally, we present the outcomes of the financial feasibility case study.
The Scale of the Investment Chasm: A Descriptive Overview
The descriptive statistics reveal a staggering disconnect between the identified investment need and the planned financial commitment of the municipalities in our sample.
The below table summarises the key aggregate figures for the 30 NRW municipalities analysed.

Table 1.
Aggregate Investment Backlog and Planned Investments in 30 NRW Municipalities.
| Metric | Total Value (€) | Median per Municipality (€) |
|---|---|---|
| Total Estimated Investment Backlog | 9,974,400,000 | 1,224,000,000 |
| Total Planned Investments (2025-2028) | 9,139,129,594 | 226,511,500 |
Table 1: Source: Authors’ own elaboration.
As shown in Table 1, the cumulative reported investment backlog for the sampled municipalities is just under €10 billion. The median backlog per municipality is a substantial €1.22 billion. In stark contrast, the total planned investments for schools over the four-year period from 2025 to 2028 amount to approximately €9.1 billion.
This leads to the first major finding: the planned investment volume is structurally insufficient to address the existing backlog. This directly supports Hypothesis 1 (H1). On average, the four-year planned investment sum for a municipality covers only a fraction of its reported backlog. For instance, Cologne reports a backlog of €2 billion but plans to invest only €2.8 billion over four years, while Bonn has a backlog of €1.2 billion and plans of just €763 million. This confirms that, even without accounting for new needs arising from demographic growth or rising construction costs, municipal budgets are incapable of closing the existing investment gap. The problem is not cyclical but structural.
Evaluating the Drivers of the Investment Backlog
We assessed a series of hypotheses to identify the socio-economic and demographic factors that might predict the size of the investment backlog. The results were counterintuitive, challenging common assumptions about the drivers of infrastructure decay.
The results of our hypothesis tests challenge common assumptions about the drivers of infrastructure decay.
Table 2.
Summary of Hypothesis Testing Outcomes.
| Hypothesis | Independent Variable | Dependent Variable | Expected Relationship |
Result | Supported? |
|---|---|---|---|---|---|
| H2 | GDP Growth (2015-2022) | Investment Backlog per Pupil | Negative | Weak Negative Correlation (r = -0.29) |
Partially |
| H3 | Rent Levels (€/m²) | Investment Backlog per Pupil | Negative | No Significant Correlation |
No |
| H4 | Pupil Growth Forecast | Investment Backlog | Positive | No Significant Correlation |
No |
| H5 | Investment Backlog per Pupil | Planned Investment per Pupil | Positive | Strong Positive Correlation (r = 0.86, p < 0.01) | Yes |
| H6 | Share of School Types | Investment Backlog | No Relationship | No Significant Relationship Found | Yes |
| H7 | Share of Private School Pupils | Investment Backlog | Negative | Significant Negative Correlation (r = -0.51, p < 0.05) | Yes |
Table 2: Source: Authors’ own elaboration.
- Economic Performance (H2 & H3): We expected that municipalities with weaker economic performance (lower GDP growth, lower rent levels) would have higher investment backlogs. However, the analysis revealed only a weak and not statistically significant negative correlation between GDP growth and the backlog per pupil (H2 partially supported). More strikingly, there was no significant correlation between local rent levels and the investment backlog (H3 not supported). This suggests that the backlog is a pervasive issue affecting both economically strong and weak cities, rather than being concentrated solely in fiscally distressed areas. Wealthier cities like Düsseldorf and Cologne have some of the largest backlogs in absolute terms.
- Demographic Pressure (H4): Contrary to expectations, there was no significant correlation between the projected increase in pupil numbers and the size of the investment backlog (H4 not supported). This indicates a potential disconnect in municipal planning, where future demographic needs are not yet systematically reflected in the assessment of current infrastructure deficits. The backlog is driven more by the legacy of past underinvestment than by initiative-taking planning for future growth.
- Planning Response (H5): A strong, statistically significant positive correlation was found between the investment backlog per pupil and the planned investment per pupil (H5 supported). This is an encouraging sign, suggesting that municipalities are, in principle, responsive to identified needs. Where the backlog is higher, planned spending is also higher. However, as established in H1, the magnitude of this response is insufficient to close the gap.
- Role of Private Schools (H7): A key finding emerged from testing H7. There is a statistically significant negative correlation between the share of pupils attending private schools and the public investment backlog (H7 supported). Municipalities with a higher proportion of students in the private system, such as Bonn and Münster, tend to have a lower public investment backlog. This provides strong empirical evidence that private schools can and do alleviate pressure on the public infrastructure system, corroborating the theoretical argument for their role in a diversified educational landscape.
Identifying High-Need Areas: The ‘Need Score’
To move beyond simple indicators, we applied our regression based ‘Need Score’. The regression model yielded the following formula for the absolute ‘Need Score’:
‘Need Score’ (€) = -1.27E+09 + 54,831 * (Pupil Increase) + 29,325,123 * (No. of Schools) + 16,929 * (No. of Pupils)
The model produced an R² of 0.75, indicating a strong fit and suggesting that the selected variables are robust predictors of investment need. When this score was compared to the self-reported investment backlog, there was a close agreement, validating the ‘Need Score’ as a reliable evaluative tool.
The tables below present the top 15 municipalities ranked by their absolute and standardised (per inhabitant) ‘Need Score’s.
Table 3.
Top 15 Municipalities by Absolute ‘Need Score’ (€).
| Rank | Municipality | Absolute ‘Need Score’ (€) |
|---|---|---|
| 1 | Cologne | 2,050,457,984 |
| 2 | Düsseldorf | 1,189,207,178 |
| 3 | Dortmund | 1,123,053,799 |
| 4 | Essen | 1,061,043,921 |
| 5 | Duisburg | 823,230,229 |
| 6 | Bonn | 763,553,248 |
| 7 | Wuppertal | 722,863,165 |
| 8 | Bochum | 620,832,238 |
| 9 | Bielefeld | 614,024,475 |
| 10 | Münster | 586,183,184 |
| 11 | Gelsenkirchen | 506,000,523 |
| 12 | Mönchengladbach | 473,088,294 |
| 13 | Aachen | 448,318,349 |
| 14 | Hagen | 385,827,872 |
| 15 | Krefeld | 363,225,511 |
Table 3: Source: Authors’ own elaboration.
The next table presents the ranking based on the standardised ‘Need Score’ per inhabitant.
Table 4.
Top 15 Municipalities by Standardised ‘Need Score’ (per Inhabitant).
| Rank | Municipality | Standardised ‘Need Score’ (€ per Inhabitant) |
|---|---|---|
| 1 | Bonn | 2,277 |
| 2 | Hagen | 2,057 |
| 3 | Wuppertal | 1,977 |
| 4 | Cologne | 1,878 |
| 5 | Essen | 1,826 |
| 6 | Münster | 1,840 |
| 7 | Düsseldorf | 1,906 |
| 8 | Gelsenkirchen | 1,974 |
| 9 | Dortmund | 1,911 |
| 10 | Bielefeld | 1,838 |
| 11 | Bochum | 1,709 |
| 12 | Aachen | 1,797 |
| 13 | Duisburg | 1,675 |
| 14 | Herne | 1,601 |
| 15 | Mönchengladbach | 1,833 |
Table 4: Source: Authors’ own elaboration.
The ‘Need Score’ rankings reveal important nuances. While large cities like Cologne, Düsseldorf, and Dortmund dominate the absolute need ranking due to their sheer size, the per-capita ranking highlights a different picture. Cities like Bonn, Hagen, and Wuppertal emerge as having the highest relative investment need.
This demonstrates that the infrastructure pressure is not just a large-city problem but is intensely felt in medium-sized cities as well. The heat maps generated from these scores (see Supplementary Information) show that high-need municipalities are geographically clustered, particularly in the Rhine-Ruhr metropolitan region, indicating a regional concentration of the crisis. The ‘Need Score’ thus provides a powerful diagnostic tool for policymakers to target interventions more effectively.
Financial Feasibility for Private Investors
The final component of our analysis addresses the critical question of financial attractiveness for private capital. To evaluate Hypothesis 8 (H8)—which posits that educational real estate generates positive but comparatively lower returns—we modelled a hypothetical school development project. The case study assumes a new-build primary school with a total project cost of €30 million, financed with 40% equity (€12 million) and 60% debt. The school is leased to the municipality for a 30-year term.
We analysed the project’s returns under four different financial scenarios, varying the rental yield and the inclusion of a 10% public investment subsidy.
The table below outlines the financial feasibility scenarios and their resulting returns.
Table 5.
Financial Feasibility Scenarios for a Hypothetical School PPP Project.
| Scenario | Rental Yield | Subsidy | IRR (Internal Rate of Return) | Equity Multiple |
|---|---|---|---|---|
| 1: Base Case | 4.5% | No | 5.9% | 2.5x |
| 2: Higher Yield | 5.5% | No | 7.8% | 3.3x |
| 3: Base with Subsidy | 4.5% | Yes (10%) | 7.9% | 3.1x |
| 4: Higher Yield with Subsidy | 5.5% | Yes (10%) | 10.3% | 4.1x |
| 5: Development Project | 6.5% | No | 19.8% | 5.2x |
Table 5: Source: Authors’ own elaboration.
The results unequivocally demonstrate that investments in educational real estate can be financially viable and attractive for private investors. In the most conservative base case (Scenario 1), the project yields a 5.9% IRR and an equity multiple of 2.5x over the holding period. These are stable, bond-like returns consistent with a core investment strategy.
As the rental yield increases or public subsidies are introduced, the returns become significantly more compelling. A 10% subsidy, for example, increases the IRR from 5.9% to 7.9% (Scenario 3), highlighting the powerful catalysing effect of even modest public co-investment. In a development scenario with higher perceived risk and a corresponding higher target yield (Scenario 5), the IRR can reach 20%.
These returns are competitive and, in many cases, exceed those of other stable real estate asset classes in the current market environment. Therefore, H8—which posited that returns would be positive but comparatively lower—is only partially supported. While base returns are moderate, they are highly stable and can become highly attractive with modest enhancements. This finding robustly confirms that a strong financial case exists for private investment in educational infrastructure.
5. Discussion
The results of our analysis provide a granular, evidence-based picture of the educational infrastructure crisis, yielding critical insights that link directly to the theoretical frameworks of public finance and investment.
First, our findings confirm that the underfunding of municipal school infrastructure is a deep, structural reality, not a cyclical issue. The fact that planned investments cover only a fraction of the backlog demonstrates that the public-sector-only model is fiscally unsustainable. This aligns with public finance literature identifying a systemic tendency toward deferred maintenance in fiscally constrained sub-national governments [32]. The problem is not a lack of recognition—as evidenced by the strong correlation between backlog and planned spending (H5)—but a fundamental incapacity to fund the recognized need.
Second, the surprising disconnect between the backlog and traditional economic indicators like GDP growth (H2) or rent levels (H3) suggests the crisis is systemic and widespread. It is a legacy issue affecting affluent and less affluent municipalities alike, a consequence of decades of deferred maintenance across the board. This implies that policy solutions based solely on fiscal transfers to “poor” municipalities may be insufficient. The problem is also one of capacity and governance, afflicting even wealthy cities like Düsseldorf.
Third, our analysis highlights the strategic value of educational real estate as an emerging asset class. The financial case study demonstrates that these assets can be structured to offer highly attractive risk-adjusted returns. The combination of a government-backed, long-term tenant and inflation-indexed leases creates a profile that is exceptionally well-suited to the objectives of institutional investors (e.g., pension funds, insurance companies) and aligns perfectly with the mandates of impact investors seeking measurable social returns alongside financial ones [33].
Fourth, the significant negative correlation between the share of private schools and the public investment backlog (H7) provides compelling empirical evidence for the role of a diversified educational ecosystem. While the German system is overwhelmingly public, our data suggest that a vibrant private school sector can measurably ease the fiscal burden on municipalities. This supports a policy view that private providers can function as valuable partners, bringing innovation, capital, and capacity to the system.
Finally, the development of the ‘Need Score’ underscores the critical importance of data-driven assessment in public investment planning. The fact that self-reported backlogs do not correlate with forward-looking demographic pressures (H4) suggests a reactive rather than proactive approach. A composite metric like the ‘Need Score’ allows for a more nuanced and objective identification of high-need areas, enabling policymakers to make more strategic, evidence-based decisions.
Policy Implications and Recommendations
Our findings lead to a set of actionable recommendations for policymakers at the federal, state, and municipal levels, as well as for private investors seeking to enter this market.
Embrace Public-Private Partnerships as a Core Strategy
Municipalities must move beyond viewing PPPs as a peripheral or last-resort option and instead integrate them as a core component of their infrastructure delivery strategy. The scale of the investment backlog is simply too large to be addressed by public funds alone. This requires building in-house expertise in PPP procurement and contract management or engaging specialised advisors.
Streamline Bureaucracy and Strengthen Municipal Capacity
State governments should continue and expand efforts, such as the recent reforms in NRW, to simplify public procurement law for infrastructure projects. Furthermore, states should establish dedicated task forces or agencies to provide municipalities with the technical, legal, and financial expertise needed to structure and execute complex PPP projects, thereby overcoming the capacity constraints at the local level.
Use Public Funds Catalytically
Instead of attempting to fully fund projects, public money should be used strategically to de-risk investments and attract private capital. The provision of modest capital subsidies, loan guarantees, or availability-based payments can significantly improve the financial viability of projects for private partners, allowing a limited pool of public funds to leverage a much larger volume of private investment.
For Private Investors: Seize the First-Mover Advantage
The German educational real estate market is still in its nascent stages. For institutional investors, this presents a significant opportunity for early market entry. By partnering with experienced developers and engaging proactively with municipalities, investors can secure a pipeline of high-quality, long-term, government-backed assets that are perfectly aligned with modern ESG and impact investing mandates.
Adopt Composite Metrics for Investment Targeting
Municipal and state planners should adopt more sophisticated, data-driven tools like the ‘Need Score’ to prioritise investment. This will enable a more equitable and efficient allocation of resources, directing them to areas with the highest objective need, not just the largest absolute backlog figures.
Incorporate Private Providers in School Development Planning
Municipal school development plans should formally incorporate the capacity and potential contributions of private and non-profit school providers. A holistic planning approach that views the entire educational ecosystem as a single system can lead to more efficient resource allocation and greater choice for families.
Limitations and Future Research
This study, while providing novel insights, has several limitations that offer avenues for future research. First, the analysis is based on a cross-sectional dataset from a single German state, NRW. While NRW is a significant and representative case, future research should expand the analysis to other states and conduct longitudinal studies to track the evolution of the investment backlog over time. Second, the investment backlog data are based on municipal self-reporting, which may lack methodological consistency across different jurisdictions. The development of a standardised, nationwide methodology for assessing infrastructure conditions would enhance the quality of future research and policymaking. Finally, while this study makes a compelling case for PPPs, further research should conduct ex-post evaluations of completed school PPP projects in Germany and internationally to compare their long-term value-for-money and impact on educational outcomes against traditionally procured projects.
6. Conclusions
Germany’s prosperity is built on the foundation of its education system, but that foundation is crumbling. This research has moved beyond national-level aggregates to provide the first granular, municipal-level empirical evidence of the profound structural deficit plaguing Germany’s school infrastructure. Our analysis demonstrates that the current public-sector financing model is inadequate to meet the challenge. The investment gap is too vast, the fiscal constraints on municipalities too severe, and the need for modernisation too urgent.
In this context, private capital is not merely an option; it is a necessity. Our findings show that a compelling financial case exists for private investment in educational real estate, an asset class that offers stable, government-backed returns and aligns perfectly with the growing demand for impact-oriented investments. Through well-structured Public-Private Partnerships, private-sector capital and expertise can be harnessed to rebuild Germany’s schools, creating modern, effective, and inspiring learning environments for generations to come.
The challenge is immense, but so is the opportunity. By embracing data-driven planning, fostering innovative partnerships, and strategically deploying both public and private resources, Germany can bridge its infrastructure chasm and secure its future as a global leader in education and innovation.
Supplementary Materials
The following supporting information can be downloaded at the website of this paper posted on Preprints.org.
Author Contributions
Conceptualization, K.H. and D.H.; methodology, K.H., D.H. and A.V.; software, K.H.; validation, K.H., D.H. and A.V.; formal analysis, K.H.; investigation, K.H., D.H. and A.V.; resources, K.H. and A.V.; data curation, K.H., D.H. and A.V.; writing—original draft preparation, K.H..; writing—review and editing, K.H., D.H. and A.V; visualization, K.H..; supervision, K.H., D.H. and A.V.; project administration, K.H. and A.V. All authors have read and agreed to the published version of the manuscript.
Funding
This research received no external funding.
Institutional Review Board Statement
Not applicable.
Informed Consent Statement
Not applicable.
Data Availability Statement
All data generated or analysed during this study are included in this published article and available in the Supplementary Information.
Acknowledgments
During the preparation of this manuscript the author(s) used Chat-GPT 5.2. to verify accessibility and academic grammar. The authors have reviewed and edited the output and take full responsibility for the content of this publication.
Conflicts of Interest
The authors declare no conflicts of interest.
Abbreviations
The following abbreviations are used in this manuscript:
Appendix A
Detailed Variable List and Sources
The table below provides a comprehensive list of all variables collected for the 30 NRW municipalities, along with their sources. This dataset forms the basis for all quantitative analyses presented in the article.
Calculation of the ‘Need Score’
The ‘Need Score’ was derived using an Ordinary Least Squares (OLS) regression model. The dependent variable was the reported School Investment Backlog. The independent variables were selected based on their direct theoretical link to infrastructure demand: Absolute Increase in General Education Pupils (Forecast), Total Number of Schools, and Total Number of Pupils.
The model was estimated as follows:
School Investment Backlog = f(Absolute Increase in General Education Pupils, Total Number of Schools, Total Number of Pupils)
The regression output provided the coefficients used to construct the ‘Need Score’ formula presented in the Results section. The model diagnostics were as follows:
- R-squared: 0.751
- Adjusted R-squared: 0.722.
- F-statistic: 26.2 (p < 0.001)
All independent variables were statistically significant at the p < 0.05 level. The strong R-squared and significant F-statistic confirm the model’s predictive power and validate the ‘Need Score’ as a robust tool for assessing relative investment need. The Standardised ‘Need Score’ was then calculated by dividing the absolute ‘Need Score’ for each municipality by its total number of inhabitants.
Figure A1.
Heat map of absolute investment need by municipality. Source: Author’s own elaboration.
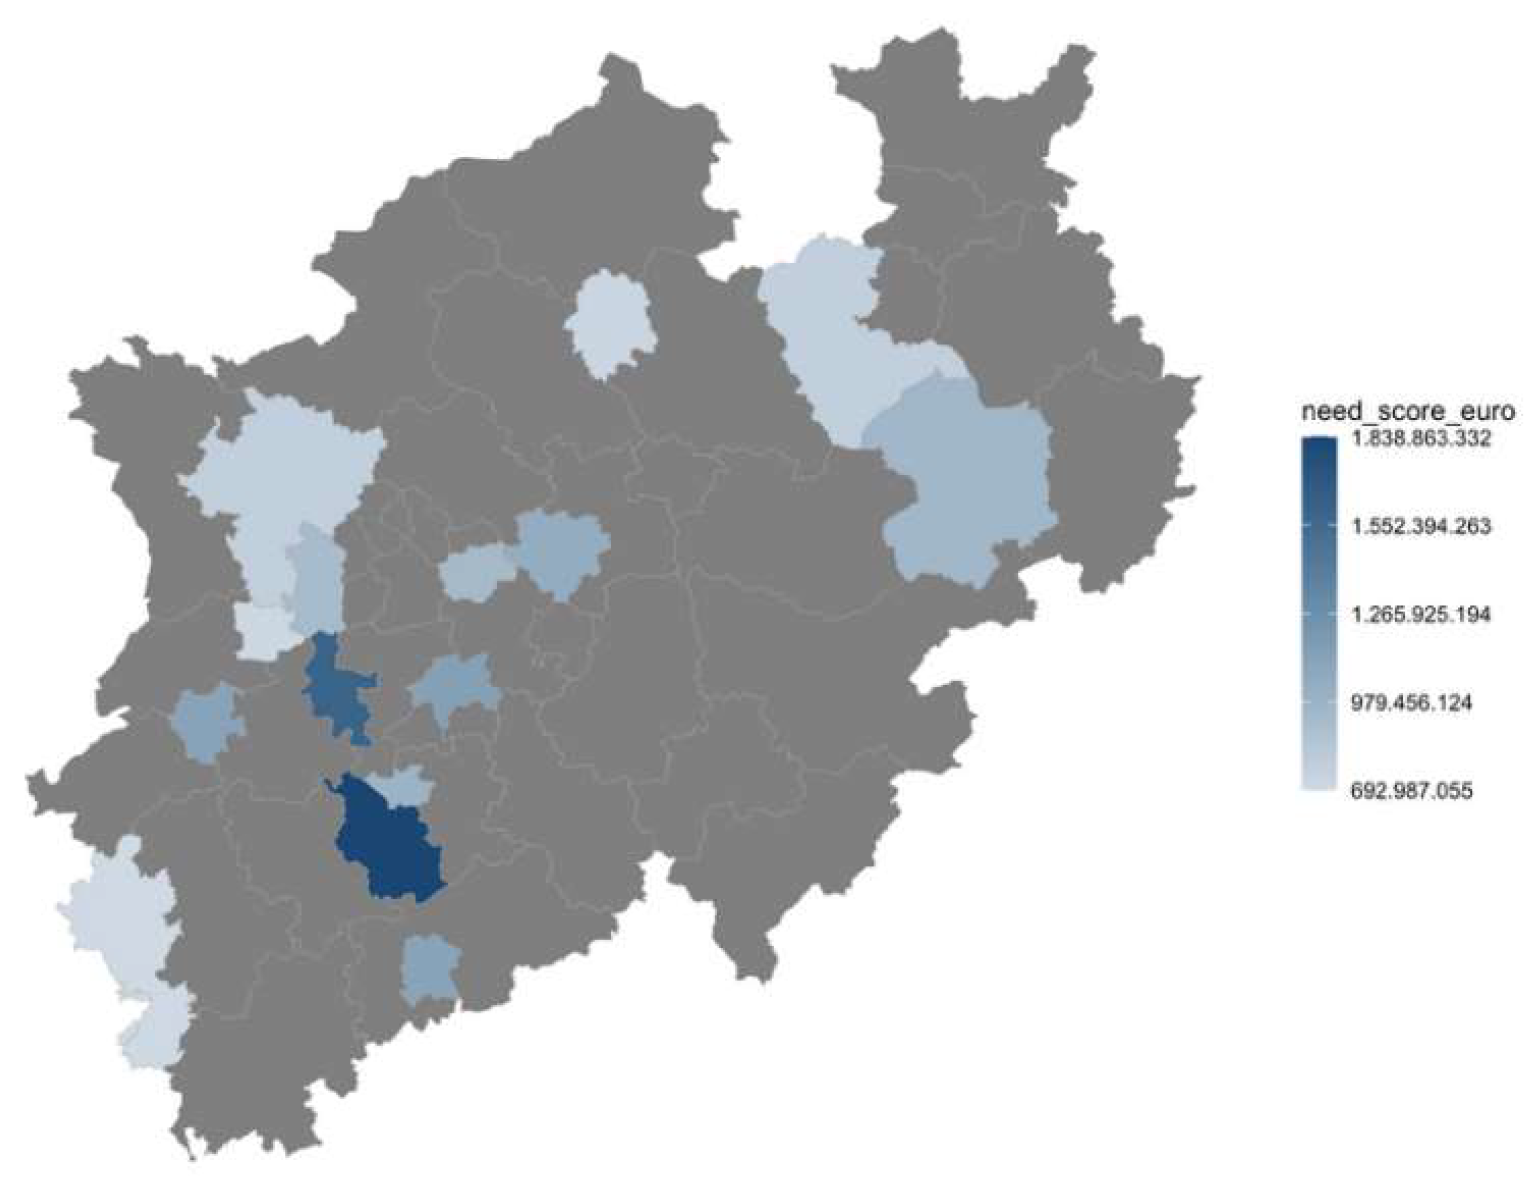
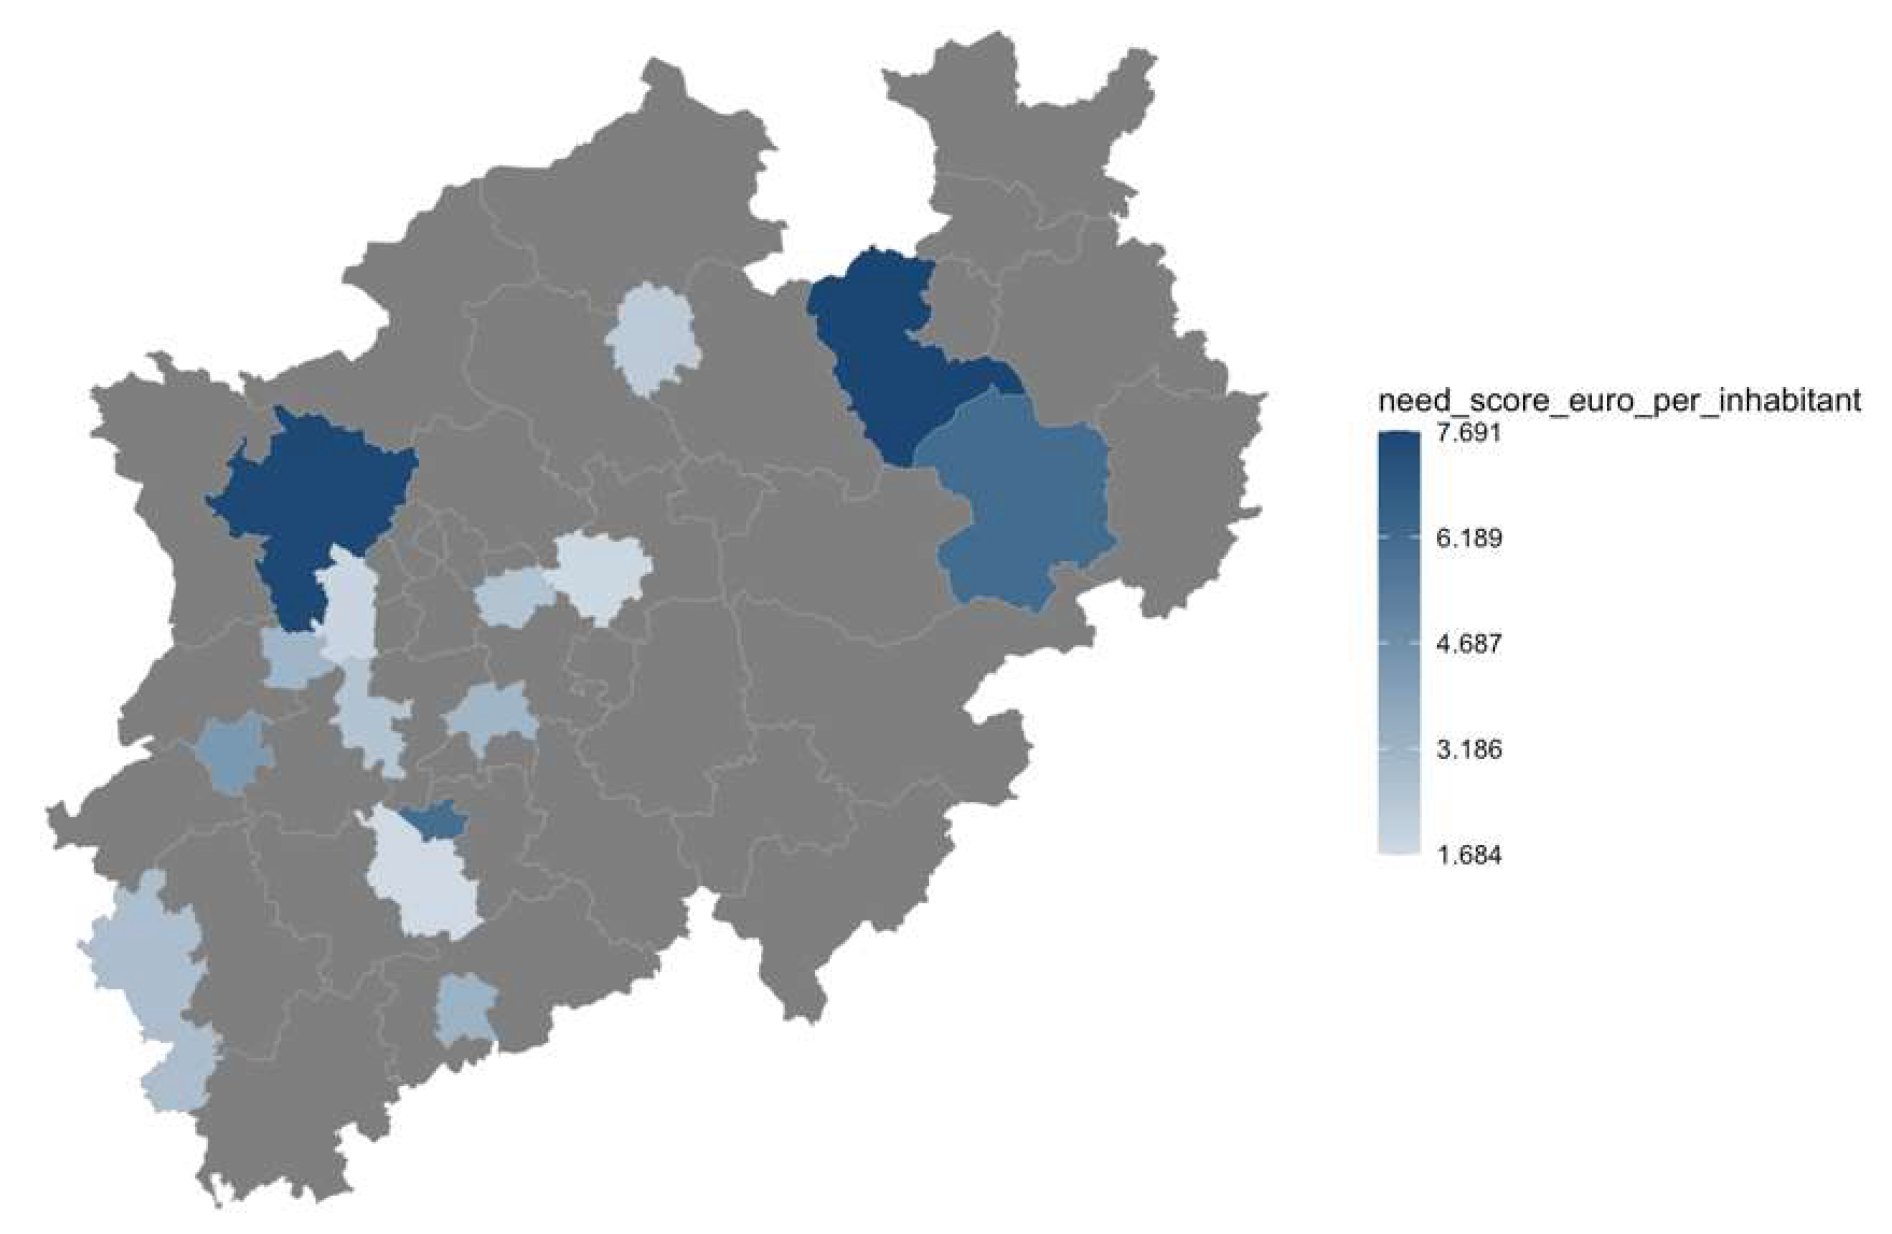
Figure A2.
Heat map of standardised investment need by municipality. Source: Author’s own elaboration.
Figure A2.
Heat map of standardised investment need by municipality. Source: Author’s own elaboration.
References
- Andrade, E.; Padilla, L.; Carrington, S. J. Educational spaces: The relation between school infrastructure and learning outcomes. Heliyon 2024, 10(19), e38361. [Google Scholar] [CrossRef]
- Hampf, F.; Woessmann, L. Vocational vs. General Education and Employment over the Life Cycle: New Evidence from PIAAC. CESifo Economic Studies 2017, 63(3), 255–269. [Google Scholar] [CrossRef]
- Borghorst, M.; Brilon, S. Municipal investment backlog has reached a new high. KfW Kommunalpanel 2025. [Google Scholar]
- Hefetz, A.; Warner, M. Contracting or public delivery? The importance of service, market, and management characteristics. Journal of Public Administration Research and Theory 2012, 22(2), 289–317. [Google Scholar] [CrossRef]
- OECD. “PISA 2022 Results (Volume I and II) - Country Notes: Germany,” PISA 2022 Database, Tables I.B1.2.1, I.B1.2.2 and I.B1.2.3., 3 12 2023. Available online: https://www.oecd.org/en/about/programmes/pisa/pisa-publications.html (accessed on 3 5 2025).
- Barrett, P.; Davies, F.; Zhang, Y.; Barrett, L. The impact of classroom design on pupils’ learning: Final results of a holistic, multi-level analysis. Building and Environment 2015, 89, 118–133. [Google Scholar] [CrossRef]
- Kultusministerkonferenz, K. “Sekretariat der Kultusministerkonferenz,” Statistische Veröffentlichungen der Kultusministerkonferenz. 2024. [Google Scholar]
- Agrawal, D. R.; Brueckner, J. K.; Brülhart, M. Fiscal federalism in the twenty-first century. Annual Review of Economics 2024, 16(1), 429–454. [Google Scholar] [CrossRef]
- Fabre, A.; S. S. The Impact of Public–Private Partnerships (PPPs) in Infrastructure, Health, and Education. Journal of Economic Literature 2023, 61(2), 655–715. [Google Scholar] [CrossRef]
- Bremer, B.; Di Carlo, D.; Wansleben, L. The constrained politics of local public investment under cooperative federalism. Socio-Economic Review 2022, 21(2), 1007–1034. [Google Scholar] [CrossRef]
- Hodge, G. A.; Greve, C. Public–Private Partnerships: An International performance review. Public Administration Review 2007, 67(3), 545–558. [Google Scholar] [CrossRef]
- Ruming, K.; Liu, S. Universities as asset class: Private sector investment in property for universities. Geoforum 2024, 157, 104138. [Google Scholar] [CrossRef]
- Oates, W. E. An Essay on Fiscal Federalism. Journal of Economic Literature 1999, 37(3), 1120–1149. [Google Scholar] [CrossRef]
- Warner, M. E.; Hefetz, A. Insourcing and outsourcing. Journal of the American Planning Association 2012, 78(3), 313–327. [Google Scholar] [CrossRef]
- Auerbach, A. J. Tax Equivalences and Their Implications. Tax Policy and the Economy 2019, 33, 81–107. [Google Scholar] [CrossRef]
- Seitz, H. Fiscal Policy, Deficits and Politics of Subnational Governments: The Case of the German Laender. Public Choice 2000, 102, 183–218. [Google Scholar] [CrossRef]
- L. T.; W. S. Using public-private partnerships for the building and management of school assets and services. Engineering, Construction and Architectural Management 2014, 21(2), 206–223. [Google Scholar] [CrossRef]
- Kollatz-Ahnen, M.; Roick, M. J. Financing public sector investment. Public Sector Economics 2018, 42(2), 111–124. [Google Scholar] [CrossRef]
- De Mare, G.; Di Piazza, F. The Role of Public-Private Partnerships in School Building Projects. In in Computational Science and Its Applications; 2015. [Google Scholar]
- Hodge, G. A.; Greve, C. On Public–Private Partnership Performance: A Contemporary Review: A Contemporary Review. Public Works Management & Policy 2017, 22(1), 55–78. [Google Scholar]
- Scheller, H.; Walker, B. Municipal infrastructure policies in the Federal Republic—In between growing disparities and losing political autonomy? European Policy Analysis 2017, 3(2), 343–371. [Google Scholar] [CrossRef]
- Fleishman, L; Fogel, N; Fridman, I; S. Y. The effect of school performance on property values: a literature review and a case study. Journal of European Real Estate Research 2017, 10(3), 277–302. [Google Scholar] [CrossRef]
- Carlo, A.; Eichholtz, P. K. N. Three Decades of Global Institutional Investment in Real Estate. SSRN, 2021. [Google Scholar]
- Geltner, D. Real Estate Price Indices and Price Dynamics: An Overview from an Investments Perspective. Annual Review Financial Economics 2015, 7, 615–633. [Google Scholar] [CrossRef]
- Schrödl; Müller, K.; Cordes, E.; Lambertz, A. Der Markt für Schulimmobilien in Deutschland. In PwC Deutschland; 2025. [Google Scholar]
- Höchstädter, A.; Scheck, B. What’s in a Name: An Analysis of Impact Investing Understandings by Academics and Practitioners. J Bus Ethics 2015, 132, 449–475. [Google Scholar] [CrossRef]
- Monaghan, C.; King, E. How Theories of Change Can Improve Education Programming and Evaluation in Conflict-Affected Contexts. Comparative Education Review 2018, 62(3). [Google Scholar] [CrossRef]
- Moon, H.-C.; Parc, J.; Yim, S. H.; Park, N. An Extension of Porter and Kramer’s Creating Shared Value (CSV): Reorienting Strategies and Seeking International Cooperation. Journal of International and Area Studies 2011, 18(2), 49–64. [Google Scholar]
Figure 1.
Number of students by states. Source: Author’s own elaboration.
Disclaimer/Publisher’s Note: The statements, opinions and data contained in all publications are solely those of the individual author(s) and contributor(s) and not of MDPI and/or the editor(s). MDPI and/or the editor(s) disclaim responsibility for any injury to people or property resulting from any ideas, methods, instructions or products referred to in the content. |
© 2026 by the authors. Licensee MDPI, Basel, Switzerland. This article is an open access article distributed under the terms and conditions of the Creative Commons Attribution (CC BY) license (http://creativecommons.org/licenses/by/4.0/).
Copyright: This open access article is published under a Creative Commons CC BY 4.0 license, which permit the free download, distribution, and reuse, provided that the author and preprint are cited in any reuse.


