Submitted:
02 February 2026
Posted:
05 February 2026
You are already at the latest version
Abstract
Technological advances such as Vehicle-to-Grid (V2G) have the potential to support renewable energy integration and grid stability, but their large-scale deployment depends on user participation, particularly in public charging environments. While prior research has examined V2G from technical and system-level perspectives, limited attention has been given to users’ perspectives on participating in V2G services outside the home. This study investigates electric vehicle (EV) users’ willingness to engage in V2G services in public spaces, with a focus on incentives, expectations, and everyday routines. A mixed-method approach was applied, combining a survey of 544 car users with two waves of user-centered interviews. The survey data were analyzed using factor analysis and linear regression models, while the interview data were thematically analyzed. The results show that users’ evaluations of V2G are shaped by sustainability expectations, perceived efficiency, and uncertainties, and that preferences for public V2G participation are strongly influenced by convenience, clarity of the offer, and existing parking and charging conditions. Economic incentives, such as reduced charging or parking costs, were generally preferred over more complex reward models, while concerns related to control over trips, battery degradation, and trust in service providers remain important barriers. The findings highlight the need for user-centered design of public V2G services that align with users’ routines, preferences, and expectations to improve user acceptance.
Keywords:
electric vehicles
; bi-directional charging
; V2G
; charging behavior
1. Introduction
Technological advances in the energy and transportation sectors are critical for achieving sustainable development, with renewable energy and electric vehicles (EVs) playing central roles. Among these advances, Vehicle-to-Grid (V2G) technology has emerged as a promising solution by enabling bidirectional energy exchange between EVs and the power grid. Through this interaction, EVs can function as mobile energy storage units, contributing to grid stability and load balancing. When integrated with renewable energy sources, V2G can enhance system reliability and increase the overall environmental value of electrified transport. Importantly, V2G supports a transition toward a more decentralized energy system in which individual users move from being passive consumers to active participants in energy production, storage, and distribution [1,2].
User adoption of V2G is essential for the delivery of many—if not all—potential V2G services. Key user-related factors include willingness to participate, plug-in probability, plug-in duration, and the share of battery capacity made available for V2G. These behaviors are influenced by users’ knowledge, motivations, and exposure to both financial and non-financial incentives. Together, such behavioral and psychological factors shape both the pace and extent of V2G market development [3]. Consequently, research that examines user behavior, user needs, and interactions with other actors within the V2G ecosystem is of central importance.
Despite the growing body of research on V2G technology, previous research has examined user acceptance, motivations, and barriers related to V2G, this work has largely concentrated on home-based contexts or experimental trials, leaving everyday public settings underexplored.
Public environments introduce distinct decision-making conditions, shaped by parking arrangements, charging convenience, and trust in multiple service providers. As a result, insights derived from home charging contexts cannot be directly transferred to public V2G participation. Moreover, current literature lacks an integrated understanding of how household energy practices, parking behavior, perceived barriers, and incentive structures jointly influence users’ willingness to engage in V2G services in public spaces. This study addresses this gap and aims at answering the following research questions:
RQ 1. What aspects of economic incentives attract the most EV users to participate in V2G in public spaces?
RQ 2. What future expectations do EV users have for bi-directional charging, based on their preferences, needs and routines?
Literature Overview
This paper focuses on users’ willingness to participate in V2G services in public environments, such as workplace parking locations. Although the target behavior concerns public settings, understanding decision-making in these contexts requires insight into users’ reference points. Home charging remains the most common and preferred charging context [4], and therefore the home environment is expected to serve as an anchoring baseline when users evaluate participation in V2G services in public spaces.
We identified four key aspects as particularly relevant in the literature for understanding users’ behaviors and needs related to V2G services in public environments: household-level energy consumption behavior, parking behavior, user-perceived barriers, and incentive design for V2G participation [5].
- Energy consumption at household level
One of the key challenges within the V2G ecosystem is the monetization of V2G services for users. This challenge is partly driven by uncertainties across multiple actors, including variability in users’ charging behaviors. In addition, users’ charging patterns are closely linked to household electricity consumption, making household energy practices a critical contextual factor.
An EV typically represents a substantial share of a household’s electricity demand, meaning that electricity contracts play an important role in determining potential revenues from V2G services. The type of electricity contract held by a user may also indicate an interest in flexibility and energy efficiency at the household level, which in turn may reflect a higher degree of behavioral readiness for V2G participation.
By 2022, all Nordic countries had achieved near-universal deployment of smart meters [6,7]. Smart meters constitute a technical prerequisite for adopting Time-of-Use (ToU) electricity contracts, which are commonly based on hourly electricity consumption and corresponding spot prices.
A Swedish study involving 2,679 households found that 75.6% of respondents who reported actively managing their electricity consumption began doing so in 2022, with 54.4% starting during the autumn of that year. Even households that had held ToU contracts for more than two years reported that increased price volatility between day and night, as well as across days in 2022, heightened their awareness and interest in managing electricity use [8].
The most frequently cited motivations for managing electricity consumption were reducing electricity trading costs under ToU contracts and lowering grid-related costs linked to power- or time-based tariffs. Cost savings, along with technological interest, were also identified as primary motivations among households that had adopted ToU contracts earlier [8].
Households that did not actively manage their electricity use were asked to rank factors that might encourage them to do so. Respondents living in detached houses most frequently ranked greater potential savings as the most influential factor, followed by lower costs for acquiring control systems and improved information regarding achievable savings. These factors highlight the central role of financial incentives and uncertainty about economic benefits [8].
- 2.
- Parking behavior
Another critical determinant of V2G potential is vehicle parked time and associated plug-in behavior. EVs can only provide V2G services when parked and connected to a charger. Although vehicles are parked for most of the day, transforming parked time into plug-in time requires both access to charging infrastructure and user willingness to connect the vehicle. While parked time is largely determined by driving patterns, plug-in behavior can be influenced through incentives and behavioral interventions.
A Dutch study found that EV users expressed a preference for V2G at locations where they already tend to charge, such as home or the workplace. However, no clear preference emerged between these two locations, and neither was identified as a decisive factor for V2G acceptability [4].
- 3.
- Barriers
Range anxiety has been identified as one of the main barriers to V2G adoption, as concerns about driving range may reduce users’ willingness to share battery capacity through V2G services [9].
A UK study measuring drivers’ physiological responses under different charging conditions showed that anxiety levels decrease with greater experience and familiarity with EVs. However, the study also identified a direct correlation between heart rate and anxiety, revealing increased stress associated with infrastructure bottlenecks such as limited charger availability and payment system complexity [10]. Additional UK research confirms that range anxiety decreases with longer BEV experience and is further reduced among participants in V2G trials over time [11].
Beyond range anxiety, other behavioral factors significantly influence V2G adoption, including charging preferences, desired state of charge, time constraints, minimum plug-in durations, driving needs, and contract conditions [12,13,14,15]. Psychological factors—such as the need for control, perceptions of guilt-free mobility, hedonic motivations, gender roles, perceived transparency of contract terms, and willingness to pay—can also limit V2G uptake if system design does not adequately reflect users’ needs and boundaries [16]. Additional barriers include double taxation, negative experiences with public charging infrastructure [17], limited trust in V2G stakeholders, and concerns regarding battery degradation [18].
- 4.
- Incentives
Using a self-report online survey conducted among 929 Norwegian car users in November 2021, a study examined how perceptions and beliefs about the V2G system influence both electric vehicle (EV) users and non-EV users (combustion engine car owners as potential future EV users) to utilize V2G technology. The main findings from the authors were that positive perceptions and beliefs about V2G technology significantly motivate users to adopt it, while concerns about the reliability and cost of V2G systems are major barriers to adoption. Younger users and those with higher environmental awareness are more likely to support V2G technology [19].
While several businesses have been emerging in the European and Nordic markets aiming at monetizing V2G services, some studies have identified other drivers for V2G participation, such as the idea of having a smart and resilient home. A Swedish study conducted an online questionnaire to gather data from Swedish EV drivers. Respondents were asked about their preferences and concerns related to V2X applications. The study found that Swedish EV drivers are more interested in V2H applications compared to V2G. V2H allows EVs to supply power to homes, which is seen as more beneficial by the respondents [20].
In a study of how household values and attitudes towards automated electric vehicle (EV) charging systems influence the adoption and use of such technology, the authors identified that households prioritize environmental sustainability and express a strong preference for technologies that contribute to a cleaner planet. They also found that automated EV charging is seen as beneficial for reducing the environmental footprint and simplifying the charging process for their participants [21].
While non-monetary incentives, such as having a smart, sustainable and resilient household, may be an important driver for potential users of V2G services, the literature has also looked at the potential economic incentives and revenues for the users that could increase willingness to participate in V2G services.
A Norwegian study found that Norwegians require a financial compensation (FC) of $144 and a minimum state of charge (SoC) of 71% to use V2G services. The analysis revealed a reciprocal and negative relationship between FC and minimum SoC, both influenced by external factors. In a multi-equation equilibrium context, the marginal effects indicate that a one-unit increase in minimum SoC leads to a $5 reduction in the expected FC, all else being equal. Conversely, a $1 increase in FC results in a 0.05 decrease in the required minimum SoC, all else being equal [22].
The economic relationship between minimum SoC and FC is significantly affected by factors such as age, perceived usefulness of the V2G system, experience with EVs, and higher levels of trust in the V2G system. Specifically, individuals with high trust in V2G require less FC for a given amount of minimum SoC. Additionally, younger individuals (aged 18–22) tend to demand higher FC when minimum SoC is reduced.[22]
Based on these four key aspects from the literature, this study was designed to provide information for designing incentives that are most attractive to users and how expectations, needs, and routines shape future acceptance of bidirectional charging in public contexts.
2. Methods
This study applied a mixed-method research design combining a quantitative survey with qualitative interviews. The mixed-method approach was chosen to capture both the breadth of user attitudes toward Vehicle-to-Grid (V2G) services and the depth of users’ underlying motivations, expectations, and concerns. The two methods were applied sequentially, with the survey providing a general overview of user perspectives and the interviews offering contextualized insights into the survey findings.
Survey data were analyzed using exploratory factor analysis to identify latent constructs related to users’ perceptions of V2G, followed by linear regression analysis to examine the relationship between these constructs and users’ stated willingness to participate in public V2G services. Standard diagnostic tests were conducted to ensure that the assumptions underlying the regression models were satisfied.
Qualitative interview data were analyzed using thematic analysis. Interview transcripts were coded iteratively, with themes emerging both from the data and from concepts identified in the literature. This approach enabled triangulation between quantitative and qualitative findings and strengthened the interpretation of results.
2.1. Survey
The objective of the survey was to assess the overall evaluation of attitudes and expectations towards V2G with a larger sample size. The items were based on other studies that also have incorporated behavioral questions in their research questions [13,14] and went through expert validation with a diverse set of stakeholders (such as representatives of OEMs, parking operators, electricity providers).
The survey was sent out via intranet by one of the partners of the project and it was composed of 25 items, taking approximately 5 – 7 minutes to fill in. The questions comprised the following aspects: sociodemographic, household profile, travel behavior patterns, access to charging infrastructure, energy consumption behavior, attitudes towards V2G and willingness to use a vehicle that has the V2G functionality. The latent variables were measured by a 7-point Likert scale, which 1 means “totally disagree” and 7 means “totally agree”.
The final sample comprised 544 valid answers. The majority of respondents were men (N = 452; 83.1%), among the age groups 36-45 years old (N = 160; 29.4%) and 46-55 years old (N = 202; 37.1%), with children in the household (N = 339; 62.3%).
2.2. Interviews
The interviews were divided into two waves: the first wave aimed at understanding the daily needs and routines around the EV and potential for V2G in the household context; the second wave aimed at understanding what offers of V2G in the context of public spaces would attract EV users and why. The interview data were recorded using Microsoft Teams, and the recordings were uploaded to the Reduct qualitative analysis platform and transcribed.
2.2.1. Interviews - Wave 1
In the first wave of interviews, the participants were invited for an interview of approximately one and a half hours. They described their daily routines and uses of EV and answered to questions related to the potential future use of a vehicle with V2G functionality (see the protocol in Appendix B). The interview data was coded by three researchers independently and cross-checked for a consistent analysis. Five tag groups were used for coding– Individual values, Household characteristics, Daily/occasional routine, System level and Expectations on V2G.
The predefined tags were related to answering the research questions. The Individual values category contained aspects such as positive and negative attitudes, fears and uncertainties, pain points and potential positive outcomes related to V2G. The Household characteristics category included demographic tags such as age, occupation, family, car brand and type of ownership, and what type of energy contract was used in the household. The Daily/occasional routine category contained behavioral tags connected to the daily life of the participants, how they charged their vehicles, how much, where and how they drive, what role the vehicle has in their daily life and for occasional trips. The Expectations on V2G, included tags on incentives, battery health, the need for minimum state-of-charge, and to what level of detail the participants require to control the charge/discharge algorithm and the related information flow. After the coding process was done, the material was clustered according to themes using the canvas function in the Reduct software. The clusters were further reviewed by three researchers.
Eight EV drivers were interviewed; the age span was 35 – 65, two interviewees were women, all except one participant lived in a detached house and had a parking space. In Appendix A, Table A1 presents a summary of characteristics of the participants in terms of car ownership, household profiles, housing characteristics (type, electricity contracts, and energy systems), charging patterns and locations, use of alternative modes of transport, concerns about battery degradation, and overall self-evaluations of how much weather affects their travelling habits.
2.2.2. Interviews - Wave 2
In the second wave of interviews, seven participants were invited to a 30 minutes interview in which they were exposed to five different offers of parking, provided that they would make their vehicles available for V2G services while parked at two different locations: Location L and Location T (for a description of participants’ profiles from wave 2, see Appendix A, Table A2). Location L is a business area in Gothenburg, Sweden where parking is provided by different fees and contracts with parking operators; Location T is an enclosed private area where parking is free for employees. The participants of wave 2 were employees of the organization partner of the research project.
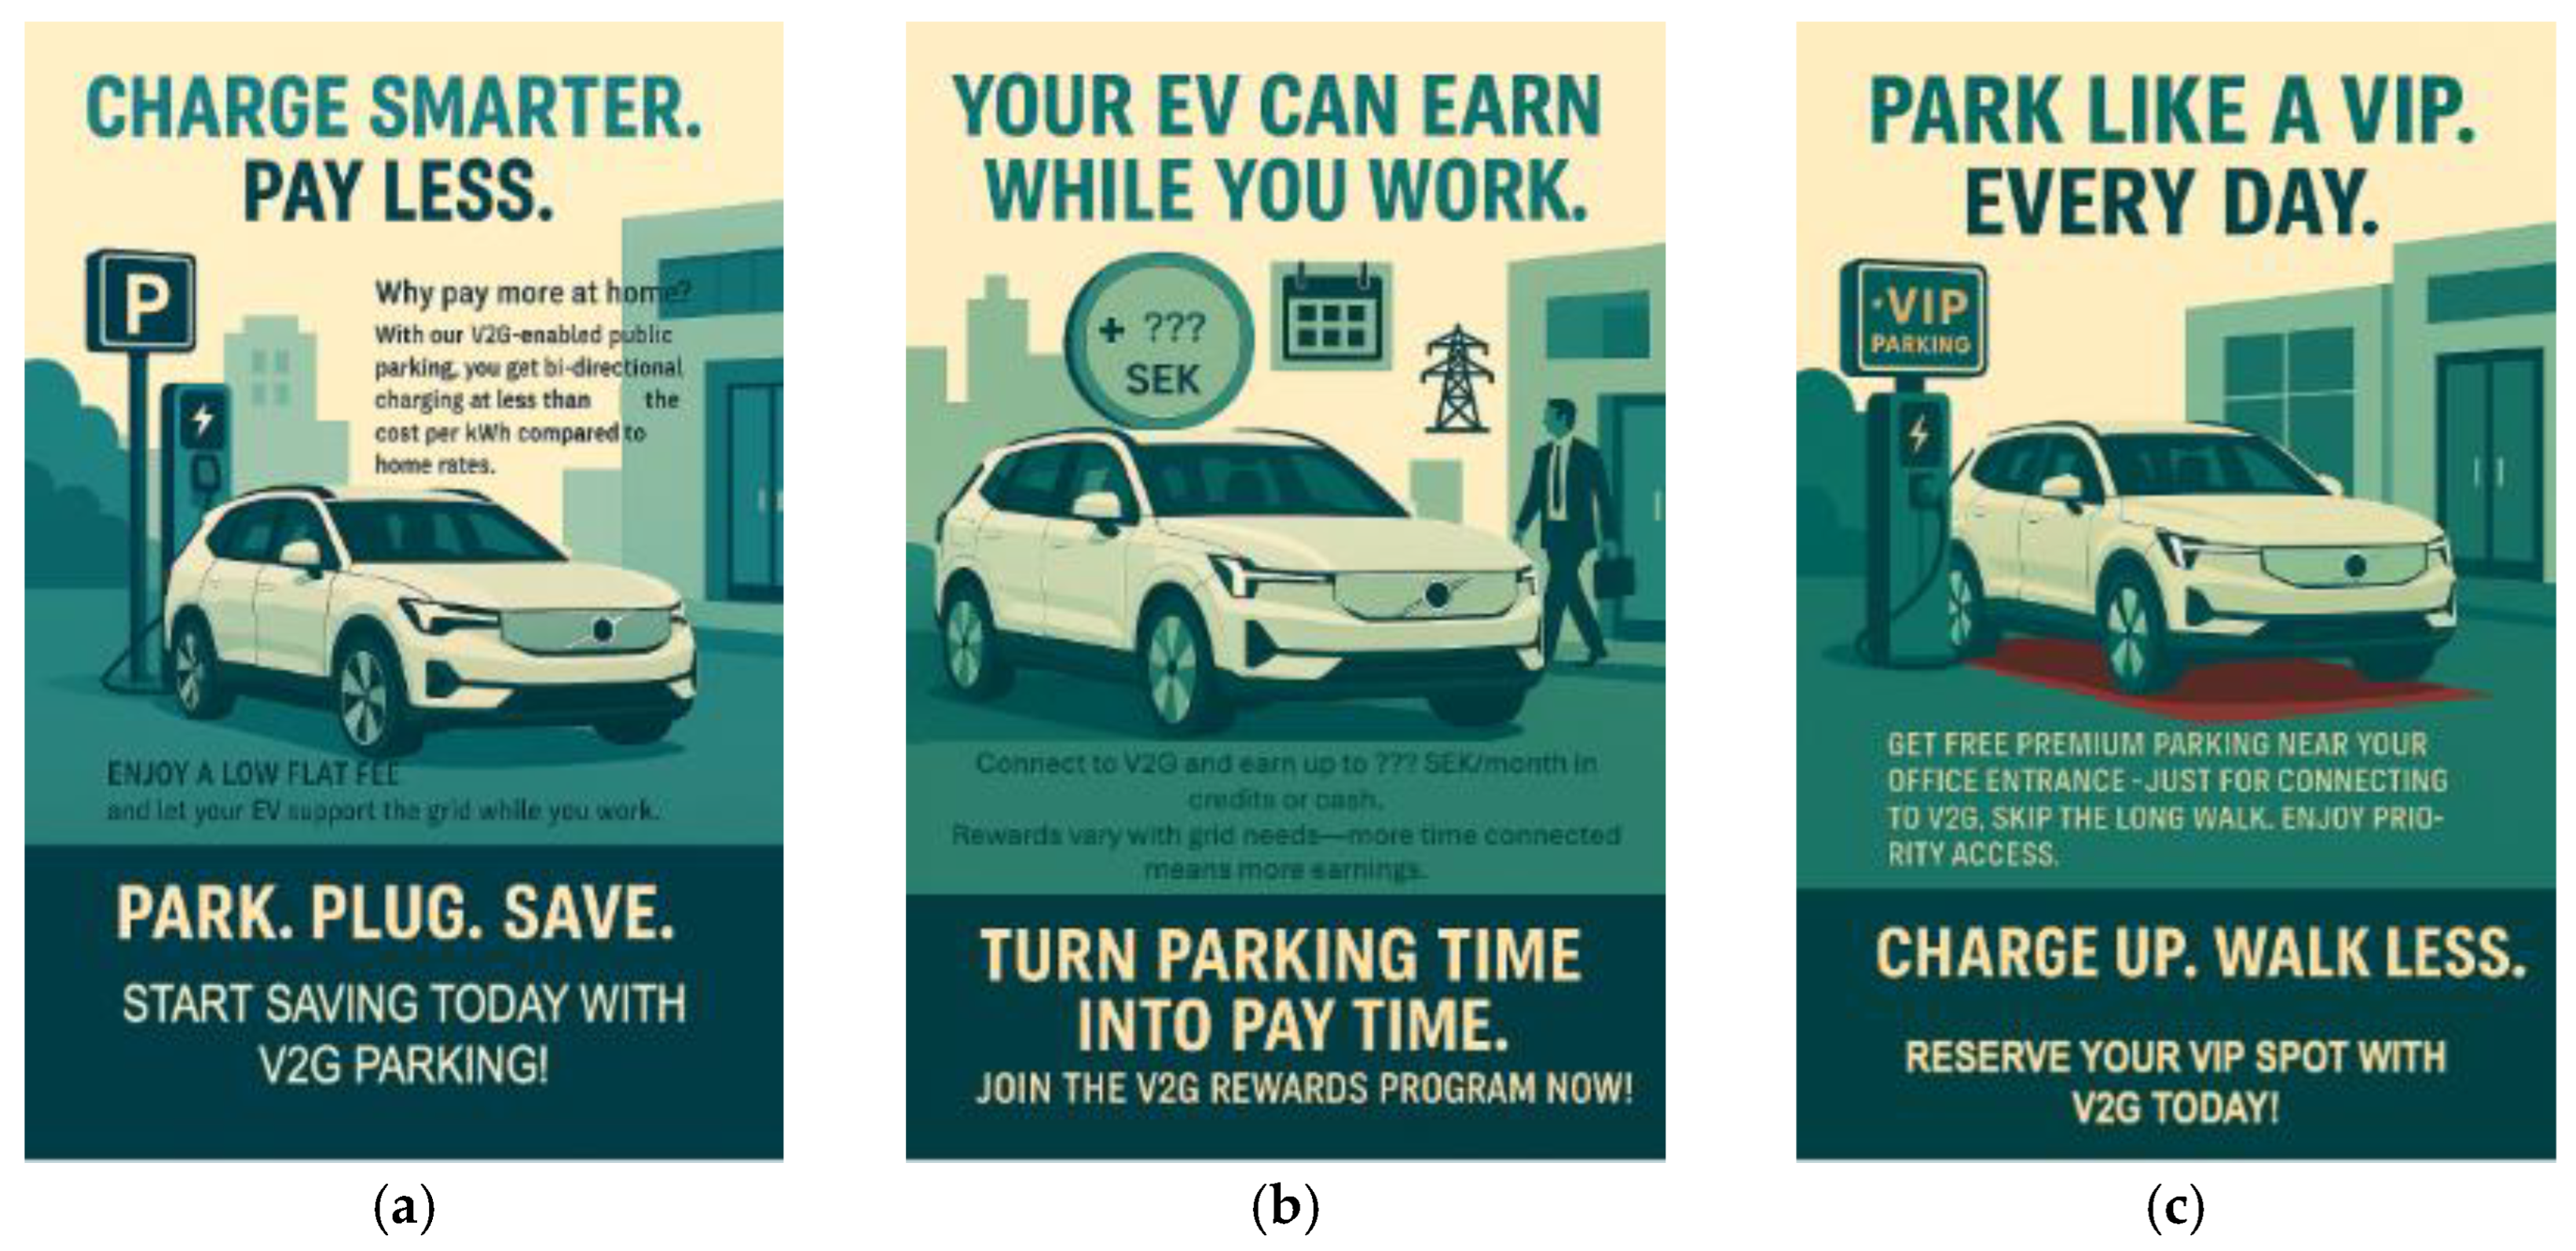
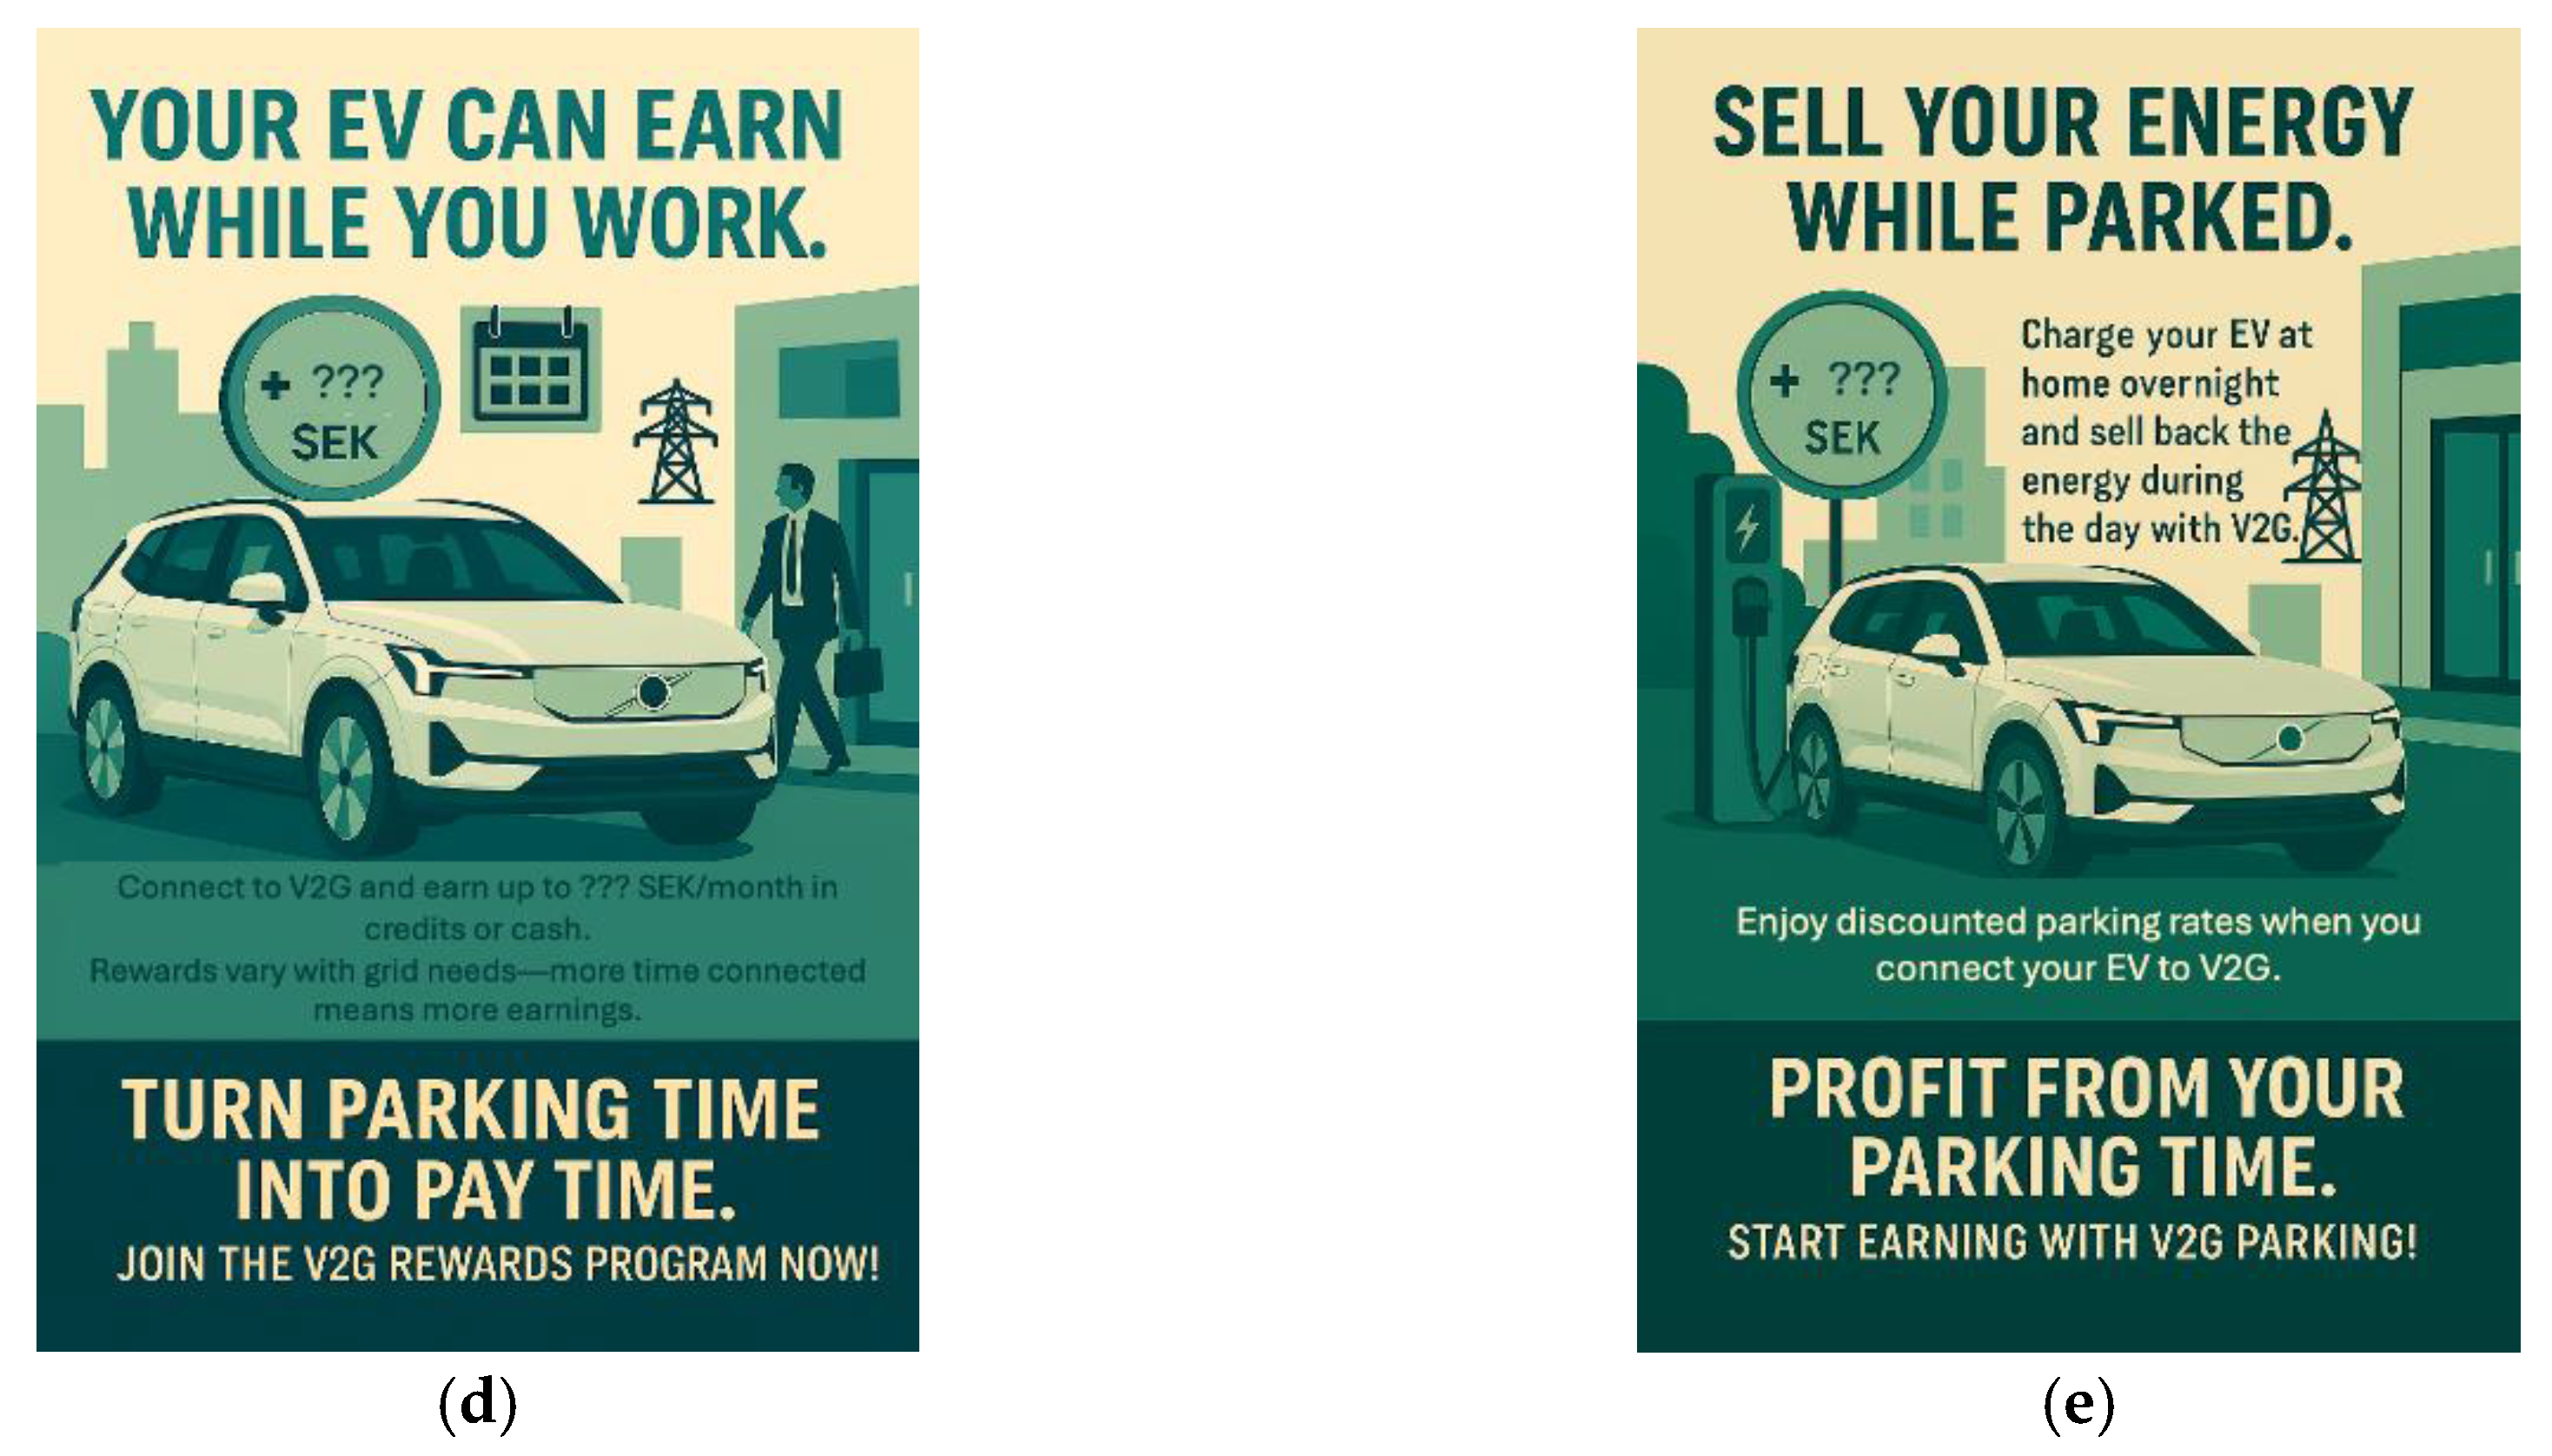
The participants were asked to rank the offers based on their preferences and explain why they have chosen the given order (see the protocol in Appendix B). The offers presented to the participants were based on the premise that provided that the EV would be available for V2G services during a certain period and under a certain agreement, a benefit would be exchanged for this availability, and the benefits were classified into 5 offers (for visual representation of the offers, see Appendix A, Figure A1). The offers were:
A - Cheaper charging: This offer provides discounts for charging.
B - Point system: This offer includes a system of credits and points that the EV user could collect and exchange for other products and services.
C - VIP parking: This offer provides a parking spot better located (in terms of proximity to the final destination, better availability, and size/comfort).
D - Cheaper parking: This offer provides a discount for parking (not applicable at Location T, the participants from this location were asked to base their answer on locations where they typically pay for parking).
E - Selling electricity/capacity: This offer gives the possibility of the EV user selling electricity/capacity to the grid and therefore receiving direct monetary incentives.
3. Results
This section is divided by the results from the survey and results from the interviews.
3.1. Results from the Survey
The results of the survey study are dived in two subsections. First, a factor analysis was performed to identify the underlying factors that build the evaluation of V2G by the EV users. Three factors were identified: Sustainability, Efficiency and Uncertainties. This result is presented under the subsection Factor analysis. Following, these three factors were used as outcomes variables in multiple linear regressions in which the sociodemographic variables were used as predictors. The objective of this analysis was to identify societal groups that could be associated with the different factors of evaluation of V2G. For example, with these regressions, one may identify associations between different types of household profiles and in what extent they value the sustainability of V2G; or for example, identify if there are certain groups that have higher levels of uncertainties towards V2G. These results are presented in the subsection Linear regression models.
3.1.1. Factor Analysis
Three components were extracted in a Principal Component Analysis (PCA) with Oblimin rotation; RMSR = 0.03; TLI = 0.93; RMSEA = 0.076, with 90% CI [0.058, 0.094]. The three components accounted to 61% of the total variance. The scale of expected outcomes was then defined into the factors of “Sustainability”, “Efficiency” and “Uncertainties” as underlying factors of cognitive evaluation of V2G technology. All three dimensions presented satisfactory levels of reliability. The items, components’ loadings after rotation, and reliability tests (Cronbach’s alpha, α) are shown in Appendix A, Table A3.
3.1.2. Linear Regression Models
To determine the effect of socio-demographic variables on the three dimensions of expected outcomes from V2G, meaning the three dimensions extracted from the PCA “Sustainability”, “Efficiency” and “Uncertainties”, three multiple linear regression were modelled with the dimensions as dependent variables and the socio-demographic variables as independent variables. The prediction of each dimension was based on car type (ICE, PHEV, BEV), gender, age, electricity plan (Variable rate hourly, variable rate monthly or fixed rate), housing (house, rented apartment or owned apartment) (see Table 1).
For the regression model for Sustainability, the coefficients for gender, housing and electricity contracts presented values under the significance level. Women (ß = -0.33, p = .024) and people living in apartments that they own (ß = -0.34, p = .037) had a negative association with the sustainability aspects of V2G, while users that have hourly based electricity contracts had a positive association (ß = 0.35, p = .008).
For the regression model for Efficiency, the coefficients for gender, housing and car type presented values under the significance level. Women (ß = 0.31, p = .026), people living in apartments that they own (ß = 0.38, p = .014) and drivers of ICE cars (ß = 0.56, p = .014) had positive associations with aspects related to the efficiency of V2G.
For the regression model for Uncertainties, any of the tested socio-demographic variables presented values under the significance level.
3.2. Results from the Interviews
In the first wave of interviews, the following themes were identified as critical for the acceptance of V2G technology in the everyday life of the interviewees: Convenient and resilient home, minimum range for emergencies, fear of battery degradation, trust in system providers, economic and social incentives, user preferences, and need for control. Following, each theme is described and quotes are provided to exemplify the themes.
- Convenient and Resilient home
Most of the participants stated that home charging is their main way of charging. There are strong routines related to the commute journey and charging the car when coming home from work and it is important that the charging can be performed in a convenient way. Apparently, connecting the vehicle for short periods of charging e.g., at a supermarket does not seem to be needed or of interest for many of the participants, unless the vehicle SOC is very low. Home resilience, i.e., the idea of using the car as a source of backup electricity in case of power outages is also mentioned as an interesting and valuable feature, although very few have actually tried it in practice.
“We have a charging box at home. So we always charge at home. I’ve charged away from home once in a year, so I have the habit of plugging in and charging every time we come home.” Participant M
“No, it’s the same thing there. In that parking lot, there are charging stations, but since they are from an external provider, I feel it’s too complicated for me to connect the car, charge it so that I maybe have a driving range of two miles. And then I go home again. It’s way too complicated. So, I just park.” Participant K
- Minimum range for emergencies
The minimum range left in the vehicle is an important concern for all participants. However, the number of kilometers varies greatly depending on the daily life of the vehicle owner and the family’s routines. For example, one participant mentions sick relatives in combination with living on the countryside as a concern with an impact on minimum range needed for potential emergencies. For others, a lower SOC level is acceptable but can vary with weekly routines.
“If I’m driving only in the city, but still I will want to charge it when it’s like close to 60-50km [Remaining range]. That’s when I feel like I need to charge. But my husband usually let it go to like 30km. He said, “yeah, but we don’t need to charge it”. “Yes, we do.”” Participant A
“That it never discharges more than 50% [Battery level]. But I could allow it to discharge down to 20%, provided that by the time I need to leave, it is back to at least 50%.” Participant JN
- Fears of battery degradation
There is an apparent fear of economical loss related to the hypothetical question of possible battery degradation when increasing the number of charging cycles due to V2G services. The participants seem aware of the value of a non-degraded battery to maintain the vehicles value on the second-hand market. Different types of economical compensations for the battery degradation were discussed. Battery insurance from the V2G service provider was also suggested to reduce the fear of battery degradation by relieving the battery ownership responsibility. Another aspect mentioned is the possibility to sell the battery on the second life market.
“So, if I had owned the car, I would definitely have been more worried about the wear and tear on the battery. Eh, because then I would have invested in the car in a different way.” Participant M
“I need to be sure somehow that doesn’t affect too much, doesn’t degrade too much.” Participant D
- Trust in the system/providers
There are many actors in the V2G eco-system, such as electricity-, grid-, parking-, car leasing companies, etcetera. Some participants mention the need to have trust in the service providers and stakeholders setting the rules and prerequisites for V2G services. The vehicle owner’s engagement is crucial for enabling V2G capabilities, and participants state a fear of being exploited, i.e., someone else making a profit on their engagement and effort, rather than contributing to the society and sustainable energy production.
“It’s less likely that they’re going to be working [Public charging]. So you run into ones where the screen doesn’t work or the payment system doesn’t work and you have to download a new app and it’s kind of frustrating thing.” Participant J
“Yeah, because I mean, that from, I think that is one if you look at the society as a whole and then, the aspect of bidirectional becomes more relevant to me if it’s clear how it’s being used and if it’s being used as a benefit to society, then I would be more likely to use it rather than if I just, ok, it’s some electrical company who has some sort of gain, then I would be less interested for my liking” Participant K
- Economic and social incentives
Most participants express economic incentives as a key driver to become involved in V2G services. Incentives of interest can be purely economic, as in getting paid for the energy fed back to the grid or the power used for frequency balancing. Other economic rewards can also be cut in parking costs. There is also an interest in convenience rewards such as a parking spot closer to the office building. Social incentives are also mentioned as an important driver, e.g., helping the grid from a societal or environmental perspective.
“One would like to see perhaps the needs of the grid if one can somehow predict it. When will the next need arise? Uh, in time, so one might be able to adapt oneself. Okay. Yes, but then one might be able to park here and help out, right?” Participant P
“And then it is the case that when I have looked at charging in places other than at home, I have never seen dynamic prices there, but it is the same price regardless of when I would charge. And since those prices are significantly higher than what I charge at home, it is not interesting because it [home charging] take me back and forth. It is more of an emergency solution.” Participant JN
- User preferences and need for control of V2G services
Everyone expressed some basic needs for charging status at a glance and controls to be able to set up their preferences for the type of charging and minimum charge level. Some expressed a need for more detailed information on the energy flow, historically, now and as forecast. This was mentioned to be needed to be able to build trust in the service or provide fun facts about the usage.
“I want to see the numbers and the values and build trust for the numbers and the estimations. And when I get an idea of how much error there is in the estimations” Participant D
“I always sort of connect [Charging cable] and then normally it will be used either as a vehicle to grid or charging or whatever. Yeah. As long as it doesn’t go below my threshold [minimum battery level]. But I always want the possibility to say, ah, today I want something else.” Participant L
In the second wave of interviews, it was identified that convenience and clarity of the business offer for participating in V2G services in public spaces were the main drivers of choices. The choices were also influenced by their current parking conditions; the participants from Location T (free parking at workplace) rated the offer with Cheaper charging as their favourite, while the ones who are currently paying for parking at Location L, had the Cheaper parking offer as their top-rated offer.
Table 2 shows the ranking of each offer by each participant. The rows present the ranking number (from 1 – least preferred to 5 – most preferred) for each participant (named with fictional letters by columns). Each offer has a total score indicating the degree of preference; the higher the score, the more preferred by the participants. The participants are grouped by the locations that they park their car at workplace.
The participants favoured models that were easy to understand and use. Cheaper charging and parking offers were consistently ranked high due to their direct and predictable benefits. The Selling electricity/capacity offer was polarising; some found it attractive for financial gain, others saw it as too complex or disruptive. The offer with a Point system to collect credits was the least favoured due to concerns about complexity and unclear value.
4. Discussion
This study set out to examine electric vehicle (EV) users’ willingness to participate in Vehicle-to-Grid (V2G) services in public charging environments, with particular attention to incentives, perceived benefits, and behavioral constraints. By focusing on public settings and anchoring user decision-making in everyday routines, the findings directly address the research gap identified in the introduction and extend existing V2G literature that has largely emphasized technical feasibility and home-based contexts.
The results demonstrate that users’ evaluations of public V2G services are strongly shaped by convenience, clarity, and perceived control. These findings align with earlier studies showing that user acceptance of V2G depends not only on financial compensation but also on how well services fit into existing charging and parking practices [1,2,3]. Similar to findings previously reported [3,14], users in this study expressed a preference for V2G participation at home, where charging already occurs as part of daily routines, rather than locations requiring additional effort or behavioral change, in this case the workplace.
As discussed in the introduction, home charging remains the dominant reference point for EV users, and expectations formed in this setting appear to influence how public V2G offers are evaluated. The practices of home charging, the perception of charging availability, and satisfaction with charging infrastructure are different between drivers living in detached houses and apartment buildings [23].
The linear regression models indicated that women and apartment owners had a negative association with the sustainability aspects of V2G, despite having positive associations with its efficiency aspects. Similarly, drivers of ICE cars showed positive associations with V2G’s efficiency aspects, while individuals with ToU electricity contracts had positive associations with V2G’s sustainability aspects. This supports earlier research suggesting that household energy practices and electricity contract types shape users’ openness to flexibility services more broadly [4,5]. Users familiar with time-based electricity pricing and active energy management were more likely to view V2G as understandable and potentially beneficial, reinforcing the role of prior experience and learning effects identified in demand flexibility research [4,5].
Consistent with previous V2G studies, economic incentives were found to be important but not sufficient on their own to motivate participation to V2G services in public spaces [2,7]. Users showed a clear preference for simple and transparent incentives, such as reduced charging or parking costs, over more complex remuneration schemes. This finding echo earlier work highlighting that complexity and uncertainty can undermine perceived fairness and reduce willingness to engage in flexibility services [8,9].
Beyond monetary compensation, trust emerged as a critical factor influencing acceptance. Concerns related to battery degradation, loss of control, and unclear responsibilities among service providers mirror barriers identified in earlier V2G trials and pilot studies [10,11,12]. These results reinforce the argument that V2G services at public spaces must be designed not only as technical solutions but also as socio-technical systems in which transparency, contractual clarity, and user autonomy are central design principles.
The findings contribute to the broader discussion on the decentralization of energy systems by empirically demonstrating how individual users become active actors in flexibility provision. As outlined in the introduction, V2G represents a shift from centralized control toward user-centered energy systems. However, the results suggest that this shift is contingent on aligning system design with users’ everyday constraints and expectations. Without such alignment, the decentralizing potential of V2G risks remain theoretical rather than realized in practice.
From a policy and market design perspective, the results suggest that participation in V2G services at public spaces should prioritize locations with more predictable parking durations, clear user benefits, and low participation barriers. These insights complement system-level modeling studies by providing behavioral evidence that can inform more realistic assumptions about user participation rates and available flexibility.
Limitations
Several limitations should be acknowledged when interpreting the results. First, the study is based on self-reported data, which may be subject to social desirability bias and hypothetical bias, particularly regarding stated willingness to participate in future V2G services. While the mixed-method approach helped contextualize survey responses, actual behavior in real-world V2G deployments may differ.
Second, the study focuses on users within the Swedish regulatory context characterized by relatively high EV adoption, widespread smart metering, and increasing exposure to time-based electricity pricing. As a result, the findings may not be directly transferable to countries or markets with different tariff structures, charging infrastructure availability, or levels of user familiarity with energy flexibility.
Third, public charging environments were examined primarily through users’ perceptions rather than direct observation of charging behavior; and the qualitative interviews were conducted with a small sample size. Future research combining stated preferences with empirical charging and discharging data from public V2G pilots would strengthen the evidence base.
Despite these limitations, the study provides robust insights into user perspectives on public V2G participation and highlights key design considerations for scaling V2G services beyond the home environment.
Author Contributions
Conceptualization, E.M.S.R., T.L., J.A., and J.H.; methodology, E.M.S.R., T.L., J.A.; validation, E.M.S.R., T.L., J.A.; formal analysis, E.M.S.R., T.L.; investigation, E.M.S.R., T.L., J.A.; resources, E.M.S.R., T.L., J.A., and J.H; data curation, E.M.S.R., T.L., J.A.; writing—original draft preparation, E.M.S.R., T.L., J.A., and J.H.; writing—review and editing, E.M.S.R., T.L., J.A., and J.H.; visualization, E.M.S.R., T.L.; project administration, E.M.S.R. and J.H. All authors have read and agreed to the published version of the manuscript.
Funding
This research was funded by the Swedish program Strategic Vehicle Research and Innovation (FFI).
Data Availability Statement
The data presented in this study are available on request from the corresponding author due to organizational policy of the project partners involved in the project that funded this study.
Informed consent statement
Informed consent for participation was obtained from all subjects involved in the study.
Acknowledgments
During the preparation of this manuscript/study, the author(s) used the tool Reduct for the purposes of transcription of interviews and thematic grouping of interviews’ transcriptions. The authors have reviewed and edited the output and take full responsibility for the content of this publication.
Conflicts of Interest
The authors declare no conflicts of interest. The funders had no role in the design of the study; in the collection, analyses, or interpretation of data; in the writing of the manuscript; or in the decision to publish the results.
Abbreviations
The following abbreviations are used in this manuscript:
| EV | Electric Vehicle |
| ICE | Internal Combustion Engine |
| PHEV | Plug-in Hybrid Electric Vehicle |
| PV | Solar Photovoltaics |
| SoC | Minimum State of Charge |
| ToU | Time of Use |
| V2G | Vehicle-to-Grid |
Appendix A
Appendix A is composed of Tables and Figures with detailed information from participants, methods, and materials used in the interviews.

Table A1.
Profile of participants in Wave 1 of interviews.
| J male |
D male |
A female |
JN male |
K male |
M female |
P male |
L male |
|
|---|---|---|---|---|---|---|---|---|
| Car ownership | Owner | Owner | Owner | Owner | Leased | Leased | Leased | Leased |
| Household | 2 adults,3 children | 2 adults | 2 adults,2 children | 1 adult | 1 adult | 2 adults | 3 adults | 3 adults |
| Housing type | House | House | House | House | Apartment | House | House | House |
| Energy contracts | ToU (Hourly based) |
ToU (Hourly based) |
ToU (Hourly based) |
ToU (Hourly based) |
NA | Fixed | ToU (Hourly based) |
ToU (Monthly based) |
| House’s energy system | Pellets | Heat pump, radiator and fireplace | Solar panels | Floor heating with an exhaust air heat pump | NA | NA | Solar panels | Heat pump |
| Commuting driving distances | Short | Long | Long | Long | Long | Long | Long | Long |
| Charging location | Home mostly | Home only | Home mostly | Home mostly | Public | Home mostly | Home – sunny days | Home mostly |
| Minimun SoC | 30% | 60% | 60% | 40% | NA | NA | NA | NA |
| Other modes of transport | Active commuting | None | Active commuting | None | None | None | Active commuting | None |
| Battery degradation | Not much concerned | Concerned | NA | Not much concerned | Concerned | Concerned if private owner | Concerned | Not much concerned |
Table A2.
Profile of participants in Wave 2 interviews.
| SK female |
PL female |
NÅ female |
CU male |
NH male |
MW male |
CE female |
MH male |
|
|---|---|---|---|---|---|---|---|---|
| N Cars | 3 (2 BEVs) | 1 BEV | 2 BEVs | 2 (1 BEV) | 2 (1 BEV) | 2 (1 BEV) | Leased | 2 BEVs |
| Household | 2 adults with teens | 2 adults | 2 adults with teens | 2 adults with children | 2 adults with teens/children | 2 adults with children | 2 adults with children |
2 adults with teens/children |
| Housing type | House | Apartment | House | House | House | House | House | House |
| Energy contracts | ToU (Hourly + power tariff) |
ToU (Monthly) |
ToU (Hourly + power tariff) |
ToU (Hourly + power tariff) |
ToU (Monthly) |
ToU (Hourly) |
ToU (Monthly) |
ToU (Monthly + power tariff) |
| Charging and energy set up | Walllbox | Walllbox |
Walllbox |
Walllbox |
Walllbox |
Walllbox + solar +battery |
Walllbox |
Walllbox + solar |
| Commuting driving distances (km) | 40 | 10 | 20 | 15 | 20 | 15 | 70 | 60 |
| Charging location | Home mostly | Home mostly | Home only | Home only | Home only | Home only | Home and Workplace | Home only |
Table A3.
Obliquely (oblimin) rotated principal components loadings of ratings of Sustainability, Efficiency and Uncertainties evaluations of V2G.
Table A3.
Obliquely (oblimin) rotated principal components loadings of ratings of Sustainability, Efficiency and Uncertainties evaluations of V2G.
| Sustainability (std. α = 0.77) |
Efficiency (std. α = 0.85) |
Uncertainties (std. α = 0.85) |
|
|---|---|---|---|
| “I believe that the use of renewable energy will increase” | 0.58 | 0.22 | -0.09 |
| “I believe that parked cars will be better used if connected to V2G” | 0.96 | 0.25 | -0.11 |
| “I believe that the energy prices on the market will decrease” | 0.24 | 0.80 | -0.16 |
| “I believe that the risk of power outages will decrease” | 0.25 | 0.81 | -0.15 |
| “I believe that the need for energy production will decrease” | 0.11 | 0.71 | -0.01 |
| “I would fear that I would not have sufficient range to complete my transport needs” | -0.05 | -0.15 | 0.71 |
| “I would be afraid that battery life would be shorter than without bidirectional charging” | -0.04 | -0.07 | 0.60 |
| “I would expect an increase of charging failures on public spaces” | -0.16 | -0.09 | 0.62 |
| “I fear that V2G will add complexity to planning the charging of my vehicle” | -0.05 | -0.06 | 0.84 |
| “I will lose some control of charging my electric vehicle” | -0.07 | -0.01 | 0.83 |
| Cumulative Variance explained | 0.27 | 0.20 | 0.14 |
Figure A1.
Visualization of the offers for the participants in the Interviews Wave 2. Each offer was described to the participants as: (a) Cheaper charging: This offer provides discounts for charging; (b) Point system: This offer includes a system of credits and points that the EV user could collect and exchange for other products and services; (c) VIP parking: This offer provides a parking spot better located (in terms of proximity to the final destination, better availability, and size/comfort); (d) Cheaper parking: This offer provides a discount for parking (not applicable at Location T, the participants from this location were asked to base their answer on locations where they typically pay for parking); (e) Selling electricity/capacity: This offer gives the possibility of the EV user selling electricity/capacity to the grid and therefore receiving direct monetary incentives.
Appendix B
Appendix B is composed by the interviews’ protocols.
Interview Guide - Wave 1
Intro and consent: Hand over to the consent form to the participant, explain the materials and the research purpose.
Block 1 – Understanding the participants’ routines and habits
There is a basic setup of wood blocks and small roads made of textile
Participants will use post its to write the name of places and indicate distances
Ask about daily routine and the use of the car on a typical day
Household conditions
Number of cars, owned or leased cars, number of children, when the car is at home, when it is charged, who looks at the prices in the household, use of the app, what app is used, climatization use, power tariffs, how the energy system of the household works, energy contracts.
Commuting distances and activities that demand the use of the car over weekdays and weekends.
Charging behavior
Car ownership type and duration
Are there solar panels in the household?
Preferred parking options (Why these places? Distances?)
Is the car shared with family members?
Use of other modes of transport
What are the reasons to use and to not use the car?
Does the weather affect the travel mode choice and preferences?
Block 2 – Standardized explanation of V2G
Explanation of V2G
How much would it be worth bringing the car to the office? What is the the anchoring point? What are the potential inconveniences of changing the routine, such as congestion charges, parking, or other relevant aspects?
Are there any concerns or reflections about battery degradation? Or about the car’s resale value?
Block 3 – Scenario with V2G
“If you are driving a vehicle with V2G functionality, how the routine that you described before would look like?”
Block 4 – Future expectations
What is expected from the participation in V2G services in terms of economic incentives? What is valuable?
Willingness to participate
What business offers could be attractive and why?
Interview Guide - Wave 2
- Introduction (5 min.)
Show the five offers and explanations of the objective of the interview.
- 2.
- Individual ranking (5 min)
Q2.1: Which of these five offers do you find most attractive? Rank them from 1 (most attractive) to 5 (least attractive).
Q2.2: What made you put [offer X] as number 1?
- 3.
- In-depth discussion per offer (20 min)
Q3.1: What do you think are the advantages of this offer?
Q3.2: Are there any disadvantages or doubts?
Q3.3: What would take for you to want to use it?
Q3.4: How important is this offer to you compared to the others?
- 4.
- Critical Parameters (10 min)
Q4.1: What factors are most crucial for you to want to use public V2G?
Price per kWh
Reward model (fixed vs. variable)
Service provider and purpose (increase of renewable energy, local grid limitations, national energy needs)
Access to chargers (cables, availability of V2G chargers)
Location of the parking lot (convenient parking, inside/outside, safe etc.)
Security and trust in technology
Convenience and time consumption
- 5.
- Conclusion (5 min.)
References
- Zhang, C., Kitamura, H., & Goto, M. (2025). A New Framework of Vehicle-to-Grid Economic Evaluation: From Semi-Systematic Review of 132 Prior Studies. In Energies (Vol. 18, Issue 12). Multidisciplinary Digital Publishing Institute (MDPI). [CrossRef]
- Sovacool, B.K.; Kester, J.; Noel, L.; Zarazua de Rubens, G. Actors, business models, and innovation activity systems for vehicle-to-grid (V2G) technology: A comprehensive review. Renew. Sustain. Energy Rev. 2020, 131, 109963. [Google Scholar] [CrossRef]
- Baumgartner, N.; Kellerer, F.; Ruppert, M.; Hirsch, S.; Mang, S.; Fichtner, W. Does experience matter? Assessing user motivations to accept a vehicle-to-grid charging tariff. Transp. Res. Part Transp. Environ. 2022, vol. 113, 103528. [Google Scholar] [CrossRef]
- van Heuveln, K.; Ghotge, R.; Annema, J. A.; van Bergen, E.; van Wee, B.; Pesch, U. Factors influencing consumer acceptance of vehicle-to-grid by electric vehicle drivers in the Netherlands. Travel Behavior and Society 2021, 24, 34–45. [Google Scholar] [CrossRef]
- Goncearuc, A.; de Cauwer, C.; Sapountzoglou, N.; van Kriekinge, G.; Huber, D.; Messagie, M.; Coosemans, T. The barriers to widespread adoption of vehicle-to-grid: A comprehensive review. Energy Reports 2024, 12, 27–41. [Google Scholar] [CrossRef]
- ACER/CEER, the European Union Agency for the Cooperation of Energy Regulators/ the European Energy Regulators (2022). Annual Report on the Results of Monitoring the Internal Electricity and Natural Gas Markets in 2021. Retrieved from: https://www.acer.europa.eu/sites/default/files/documents/Publications/MMR_2021_Energy_Retail_Consumer_Protection_Volume.pdf.
- SCB, Statistics Sweden (2025). Distribution of electricity contracts by bidding zone and contract type. Month 2013M04 – 2025M01. Retrieved from: https://www.statistikdatabasen.scb.se/pxweb/sv/ssd/START__EN__EN0301__EN0301A/SSDManadElAvtalstyp/.
- Hennlock, M.; Karlsson, A.; Nilsson, A.; Grahn, D.; Fransson, N. Consumer Perspective on Demand Flexibility; IVL Swedish Environmental Research Institute: Stockholm, Sweden, 2023. Available online: https://ei.se/download/18.4ed2158a18722d7df785bc9/1680686319221/Konsultrapport-Konsumentperspektiv-p%C3%A5-efterfr%C3%A5geflexibilitet-IVL.pdf (accessed on 29 December 2025).
- Sovacool, B. K.; Axsen, J.; Kempton, W. The Future Promise of Vehicle-to-Grid (V2G) Integration: A Sociotechnical Review and Research Agenda. Annu. Rev. Environ. Resour. 2017, vol. 42(no. 1), 377–406. [Google Scholar] [CrossRef]
- Chamberlain, K.; al Majeed, S. Evaluating the barrier effects of charge point trauma on uk electric vehicle growth. World Electric Vehicle Journal 2021, 12(3). [Google Scholar] [CrossRef]
- Torkey, A.; Zaki, M. H.; el Damatty, A. A. Transportation Electrification: A Critical Review of EVs Mobility during Disruptive Events. Transportation Research Part D: Transport and Environment 2024, 128. [Google Scholar] [CrossRef]
- Geske, J.; Schumann, D. Willing to participate in vehicle-to-grid (V2G)? Why not! Energy Policy 2018, vol. 120, 392–401. [Google Scholar] [CrossRef]
- Noel, L.; Papu Carrone, A.; Jensen, A. F.; Zarazua De Rubens, G.; Kester, J.; Sovacool, B. K. Willingness to pay for electric vehicles and vehicle-to-grid applications: A Nordic choice experiment. Energy Econ. 2019, vol. 78, 525–534. [Google Scholar] [CrossRef]
- Noel, L.; Zarazua de Rubens, G.; Kester, J.; Sovacool, B. K. Leveraging user-based innovation in vehi-cle-to-X and vehicle-to-grid adoption: A Nordic case study. J. Clean. Prod. 2021, vol. 287, 125591. [Google Scholar] [CrossRef]
- Parsons, G. R.; Hidrue, M. K.; Kempton, W.; Gardner, M. P. Willingness to pay for vehicle-to-grid (V2G) electric vehicles and their contract terms. Energy Econ. 2014, vol. 42, 313–324. [Google Scholar] [CrossRef]
- Sovacool, B. K.; Kester, J.; Noel, L.; Zarazua de Rubens, G. Are electric vehicles masculinized? Gender, identity, and environmental values in Nordic transport practices and vehicle-to-grid (V2G) preferences. Transp. Res. Part Transp. Environ. 2019, vol. 72, 187–202. [Google Scholar] [CrossRef]
- Chamberlain, K.; al Majeed, S. Evaluating the barrier effects of charge point trauma on uk electric vehicle growth. World Electric Vehicle Journal 2021, 12(3). [Google Scholar] [CrossRef]
- Goncearuc, A.; de Cauwer, C.; Sapountzoglou, N.; van Kriekinge, G.; Huber, D.; Messagie, M.; Coosemans, T. The barriers to widespread adoption of vehicle-to-grid: A comprehensive review. Energy Reports 2024, 12, 27–41. [Google Scholar] [CrossRef]
- Mehdizadeh, M.; Nayum, A.; Nordfjærn, T.; Klöckner, C. A. Are Norwegian car users ready for a transition to vehicle-to-grid technology? Transport Policy 2024, 146, 126–136. [Google Scholar] [CrossRef]
- Khezri, R.; Steen, D.; Anh Tuan, L. Willingness to Participate in Vehicle-to-Everything (V2X) in Sweden, 2022—Using an Electric Vehicle’s Battery for More Than Transport. Sustainability (Switzerland) 2024, 16(5). [Google Scholar] [CrossRef]
- Kaviani, F.; Dahlgren, K.; Koppel, S.; Strengers, Y.; Martin, R.; Korsmeyer, H.; Pink, S. “We’d rather have a clean planet than anything else”: Household values and automated future electric vehicle charging. Energy Research and Social Science 2025, 121. [Google Scholar] [CrossRef]
- Mehdizadeh, M.; Nordfjaern, T.; Klöckner, C. A. Estimating financial compensation and mini-mum guaranteed charge for vehicle-to-grid technology. Energy Policy 2023, 180. [Google Scholar] [CrossRef]
- Martins Silva Ramos, É.; Hagman, J. Swedish EV Users’ Routines and Behaviors Without Home Charging Availability. Presented at the EVS38 International Battery, Hybrid and Fuel Cell Electric Vehicle Symposium, Göteborg, Sweden, 15–18 June 2025; Available online: https://ri.diva-portal.org/smash/record.jsf?pid=diva2%3A1989003 (accessed on 29 December 2025).
Table 1.
Multiple linear regression analyses with the variables Sustainability, Efficiency and Uncertainties as outcomes and sociodemographic variables as predictor variables.
Table 1.
Multiple linear regression analyses with the variables Sustainability, Efficiency and Uncertainties as outcomes and sociodemographic variables as predictor variables.
| Sustainability | Efficiency | Uncertainties | |||||||
| ß (SE) | t | p | ß (SE) | t | p | ß (SE) | t | p | |
| Car type ICE | -0.45(0.24) | -1.86 | 0.063 | 0.56(0.23) | 2.46 | 0.014 | -0.27(0.23) | -1.15 | 0.248 |
| Car type PHEV | -0.28(0.23) | -1.17 | 0.241 | 0.42(0.22) | 1.86 | 0.062 | -0.17(0.23) | -0.72 | 0.468 |
| Gender (woman) |
-0.33(0.14) | -2.25 | 0.024 | 0.31(0.13) | 2.23 | 0.026 | -0.25(0.14) | -1.78 | 0.075 |
| Age (26-35 years) | -0.13(0.56) | -0.23 | 0.817 | -0.12(0.53) | -0.23 | 0.813 | -0.44(0.55) | -0.80 | 0.420 |
| Age (36-45 years) | -0.33(0.56) | -0.59 | 0.554 | 0.13(0.53) | 0.24 | 0.803 | -0.58(0.55) | -1.06 | 0.289 |
| Age (46-55 years) | -0.33(0.56) | -0.59 | 0.552 | 0.37(0.53) | 0.69 | 0.487 | -0.50(0.55) | -0.91 | 0.359 |
| Age (56-65 years) | -0.53(0.56) | -0.93 | 0.348 | 0.39(0.54) | 0.72 | 0.468 | -0.65(0.56) | -1.16 | 0.244 |
| Age (66+ years) | 0.35(1.09) | 0.32 | 0.745 | -0.78(1.04) | -0.75 | 0.450 | -1.23(1.07) | -1.14 | 0.253 |
| El_plan Others | -0.25(0.29) | -0.86 | 0.389 | -0.13(0.27) | -0.49 | 0.617 | -0.08(0.28) | -0.30 | 0.764 |
| EL_plan Variable rate (hourly) | 0.35(0.13) | 2.62 | 0.008 | -0.21(0.12) | -1.67 | 0.094 | 0.13(0.13) | 0.99 | 0.322 |
| EL_plan Variable rate (monthly) |
-0.11(0.13) | -0.84 | 0.400 | -0.03(0.12) | -0.28 | 0.776 | -0.19(0.13) | -1.49 | 0.136 |
| Housing_Rented apartment | -0.05(0.17) | -0.28 | 0.776 | 0.25(0.16) | 1.53 | 0.125 | -0.14(0.17) | -0.81 | 0.418 |
| Housing_Owned apartment | -0.34(0.16) | -2.08 | 0.037 | 0.38(0.15) | 2.45 | 0.014 | -0.00(0.16) | -0.02 | 0.977 |
| Housing_Other | 1.06(0.98) | 1.08 | 0.279 | -0.75(0.93) | -0.81 | 0.417 | 0.06(0.96) | 0.06 | 0.948 |
| Model | R2 adju = 08, F(14, 369) = 3.5, p <.001 | R2 adju = .07, F(14, 369) = 3.07, p <.001 | R2 adju = .01, F(14, 369) = 1.48, p = .112 | ||||||
Table 2.
Ranking of V2G offers in public spaces by participants from two different locations.
| Location L | Location T | ||||||||
| Offer | NH | CU | NA | Total | PL | MH | CE | SK | Total |
| A – Cheaper charging | 3 | 1 | 3 | 7 | 5 | 3 | 4 | 5 | 17 |
| B – Point system | 1 | 3 | 1 | 5 | 1 | 4 | 2 | 2 | 9 |
| C – VIP parking | 4 | 2 | 2 | 8 | 3 | 1 | 5 | 4 | 13 |
| D – Cheaper parking | 5 | 4 | 5 | 14 | 2 | 2 | 3 | 3 | 10 |
| E – Selling electricity/capacity | 2 | 5 | 4 | 11 | 4 | 5 | 1 | 1 | 11 |
*Location L (paid parking at workplace); Location T (free parking at workplace).
Disclaimer/Publisher’s Note: The statements, opinions and data contained in all publications are solely those of the individual author(s) and contributor(s) and not of MDPI and/or the editor(s). MDPI and/or the editor(s) disclaim responsibility for any injury to people or property resulting from any ideas, methods, instructions or products referred to in the content. |
© 2026 by the authors. Licensee MDPI, Basel, Switzerland. This article is an open access article distributed under the terms and conditions of the Creative Commons Attribution (CC BY) license (http://creativecommons.org/licenses/by/4.0/).
Copyright: This open access article is published under a Creative Commons CC BY 4.0 license, which permit the free download, distribution, and reuse, provided that the author and preprint are cited in any reuse.


