Submitted:
03 February 2026
Posted:
05 February 2026
You are already at the latest version
Abstract
The most common defect in reinforced concrete structures is corrosion damage to the working reinforcement within the concrete. The primary risks associated with corrosion damage include: the volumetric expansion of corrosion products, which induces additional tensile stresses in the concrete along the bar length leading to spalling of the protective layer; reduction of the working reinforcement diameter; and localized exposure of reinforcement due to the destruction of the protective layer. Numerous methods exist for assessing the stress-strain state of damaged structures, but specific refinements to calculation methods are required for each damage type. This paper presents an analysis of domestic and international literature on the assessment of reinforcement bonding with concrete, along with the authors' experimental test results evaluating bond loss in corrosion-damaged reinforcing bars embedded in concrete.
Keywords:
corrosion of reinforcement and concrete
; numerical studies
; reinforcement adhesion to concrete
; experimental studies
1. Introduction
The bond between reinforcement and concrete is a fundamental factor enabling reinforced concrete to function as a monolithic composite. A reduction in the reinforcement-concrete bond leads to excessive crack formation, decreased structural (or element) stiffness, and an overall reduction in the structure's load-bearing capacity.
Since the inception of reinforced concrete, research has been conducted to study the bond between reinforcement and concrete to account for their joint deformation. It has been established that numerous parameter influence bond stress: the maximum tensile stress of concrete, concrete type and composition, reinforcement bar diameter and profile type, load type (static, dynamic, cyclic, alternating), and the type of internal force in the reinforcement (compression or tension). All these parameters are considered to ensure the required anchorage of reinforcement within the concrete. However, when assessing the load-bearing capacity of structures within calculation models, it is necessary to account for the influence of external negative factors on reinforced concrete structures that lead to the degradation of concrete-to-reinforcement bond.
Table 1 provides an overview of techniques for determining the bond between reinforcement and concrete.
As can be seen from the literature analysis, many relationships have been proposed to determine the bonding of concrete to reinforcement based on experimental data.
2. Experimental Research Methods
To evaluate the bond between reinforcement and concrete, an experiment was conducted at Moscow State University of Civil Engineering. Reinforcement bars of class A500C, 400 mm long and 8 mm in diameter, were embedded in concrete cubes of strength class B25. The bonded length of the bar was five diameters (40 mm). The remaining length of the reinforcing bar was isolated from the concrete using a plastic sleeve.
Two series of specimens were produced. The first series is control, the second series has corrosion damage of the reinforcing bar.
Corrosion of the reinforcement was created by electrochemical corrosion. The specimens were placed in a plastic container and filled with 5% NaCl solution. Using a constant current controller, a positive charge was applied to the reinforcement bar and a negative charge was applied to the salt solution. The corrosion process at a constant current of 0.5A took 60 days. The diameter of the reinforcement before corrosion determined by weighing was 8.12 mm (As=0.52 cm2). After corrosion, the diameter of the reinforcement was 7.14 mm (As,cor=0,40 cm2), percentage of corrosion of reinforcement in the concrete body by diameter and by cross-sectional area . The scheme of testing of specimens is presented in Figure 1 and Figure 2.
Based on the results of the tests, the obtained averaged data were analyzed and plots of the displacement of the free end of the reinforcing bar from the applied external load were drawn. The reinforcement stubble slip graphs are shown in Figure 2 and Figure 3.
The relative anchorage length of the uncorroded rod was 40 mm / 8.12 mm = 4.93, for the corrosion-damaged one taking into account the reduced diameter 40 mm / 7.14 mm = 5.6. As can be seen from the deformation diagrams, the non-corroded rod slips at higher axial load and has a smoother deformation pattern without sharp drops in the graph. The specimen with corrosion damage (Figure 3) has a linear deformation plot with no curvature almost up to the peak load.
The explanation for this behavior of specimens in the graph can be due to the loss of bond between the rod and concrete. In Figure 2, at a load of 8 kN, there is a slight fracture after which the angle of inclination of the graph to the horizontal axis changes. At this point, the tensile stress in the concrete at the point of contact with the reinforcement profile becomes nonlinear in the concrete deformation graph.
For the series of specimens with bond damage, there is no such fracture, which is explained by the friction of the rod against the corrosion products that are held by adhesion in the concrete body. Nonlinearity is evident at 0.9 of the maximum load.
We plot the deformation in the axes " Stress-displacement relationship of bar end " (Figure 4). Bond stresses from experimental data are determined by formula 1:
where - axial load on the bar; - anchoring length of the bar in concrete; - bar diameter.
3. Numerical Modeling
Numerical modeling replicating the experimental tests was performed using the Ansys software package. The analysis was conducted using an axisymmetric formulation. Concrete and reinforcement were modeled using Plane183 elements (rectangular 8-node elements) with a finite element size of 1x1 mm.
Figure 7.
Object of study: a) general view of the model; b) finite element model.
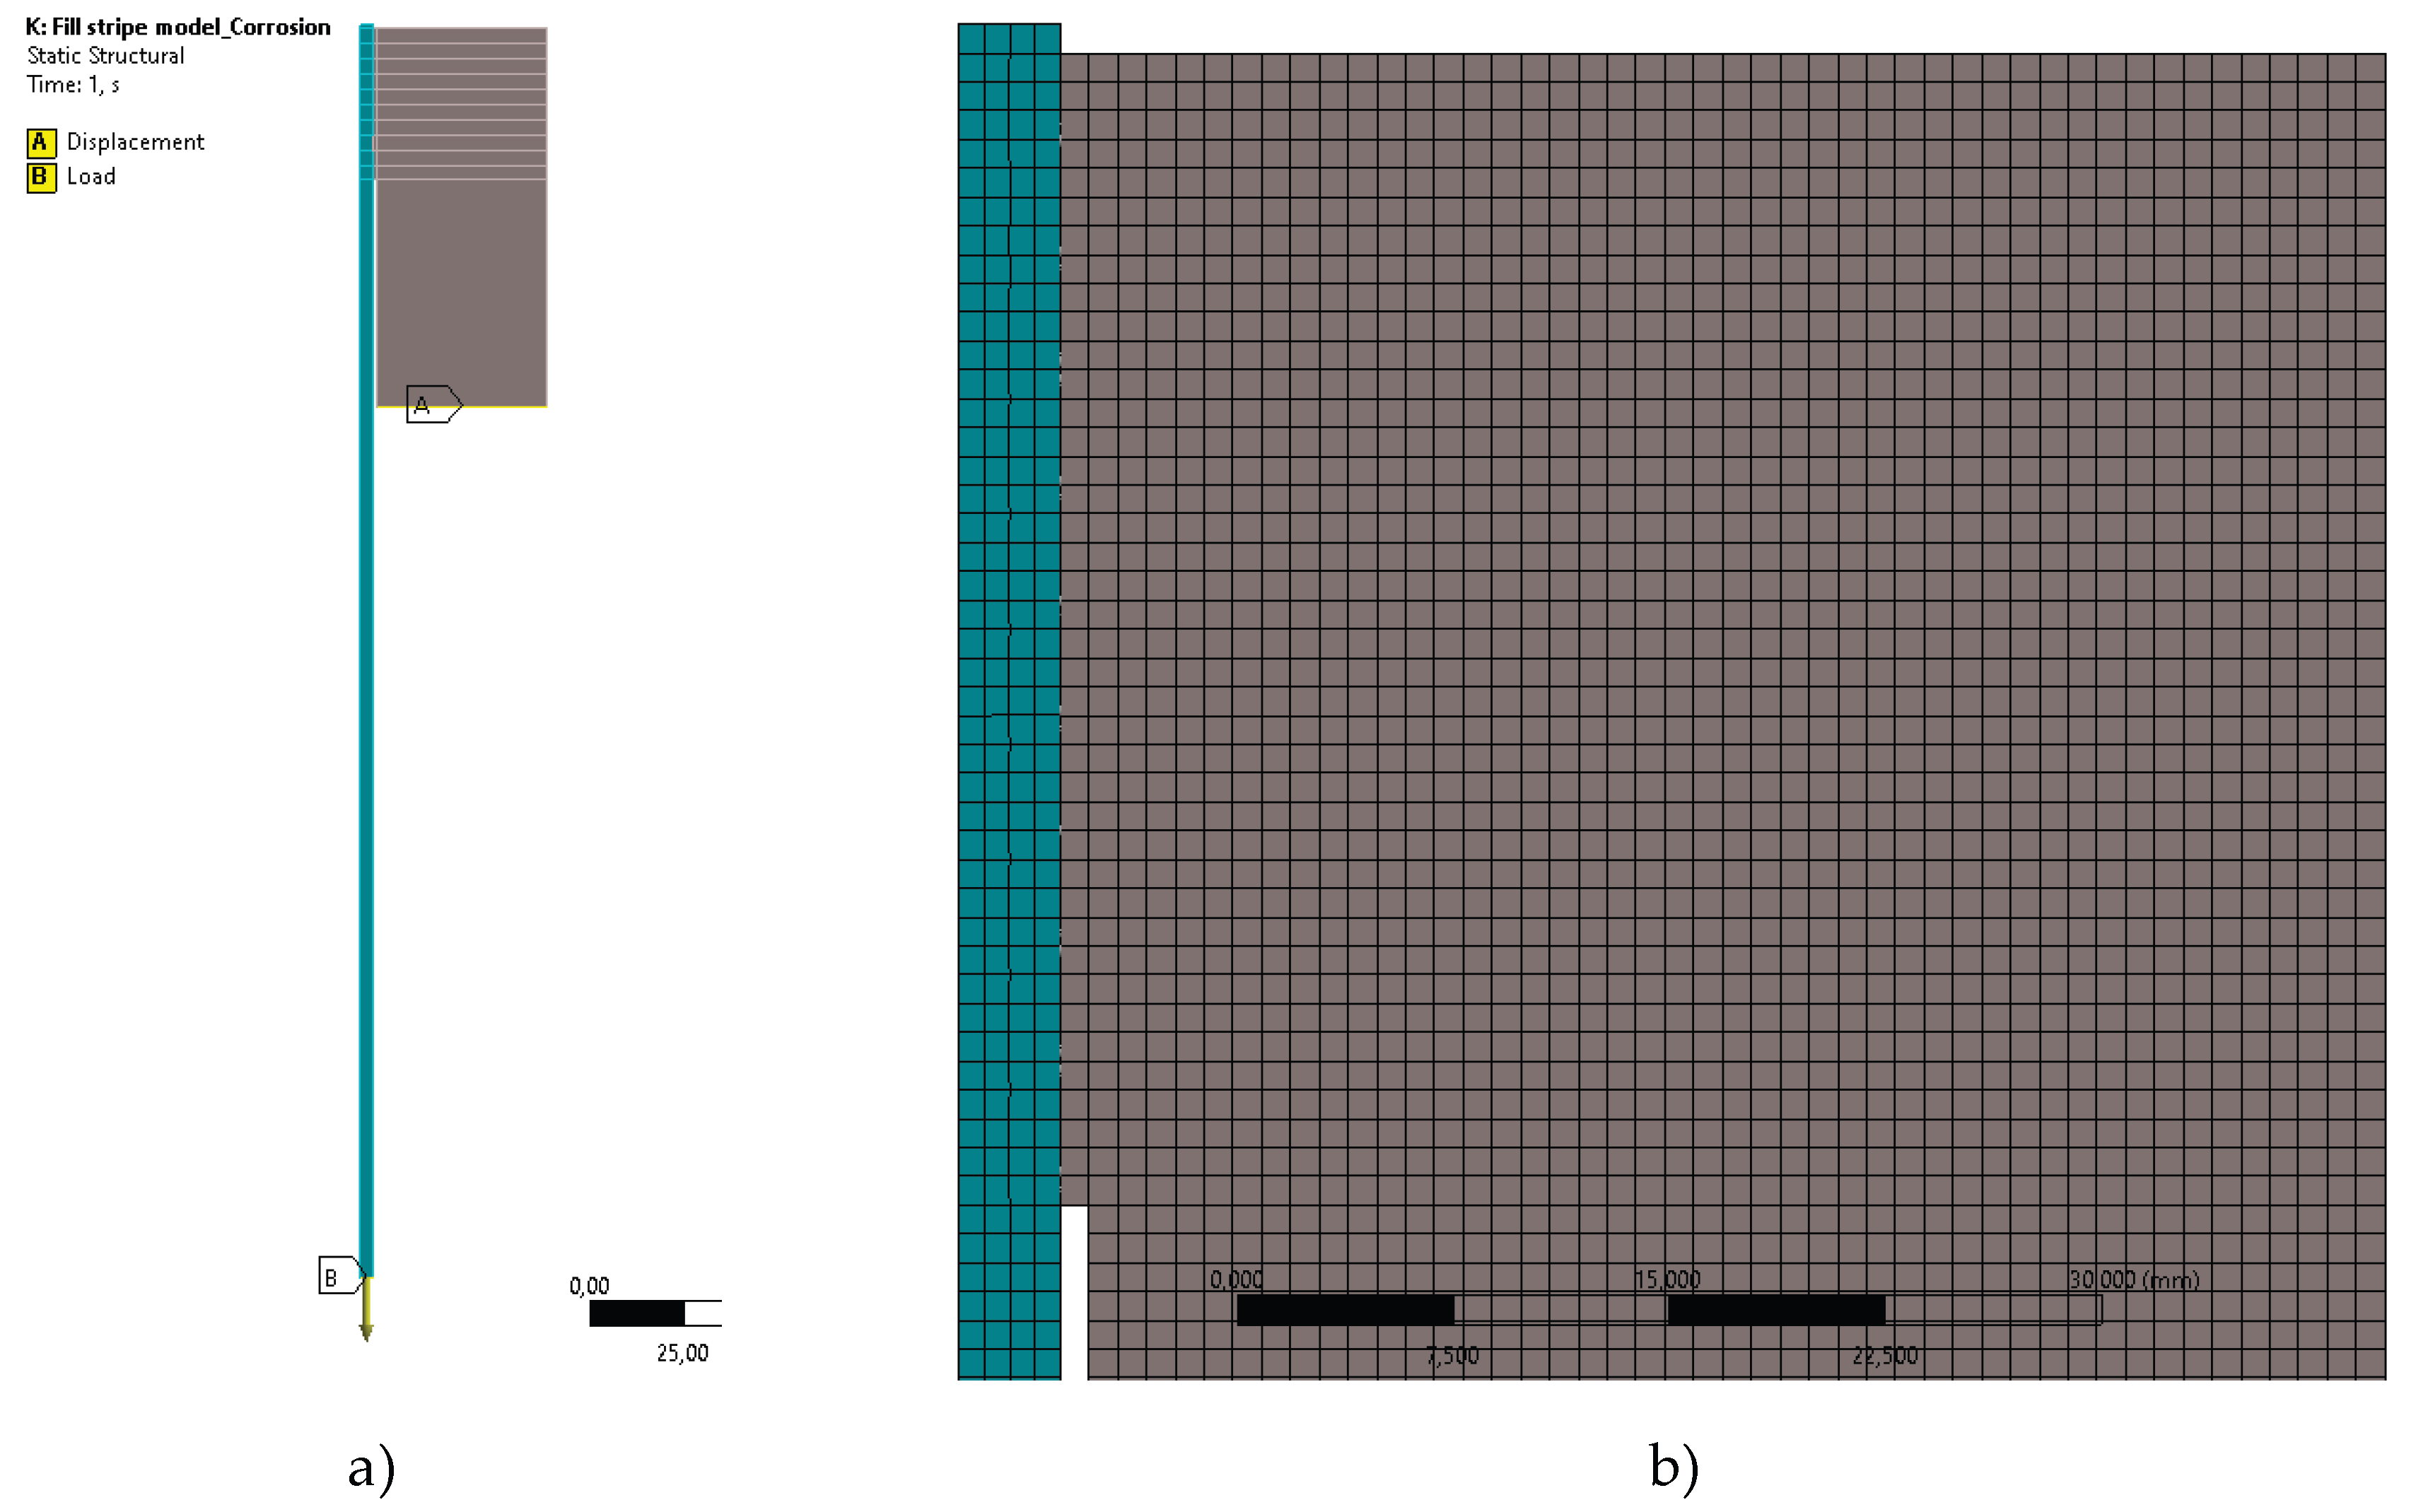
A straightforward method for numerically modeling reinforcement-concrete interaction and analyzing subsequent deformation (failure) processes in pull-out problems involves methods that explicitly account for the discontinuity of the concrete-reinforcement bond [1,2].
The modeling of the non-continuity, i.e., the slippage of the reinforcement relative to the concrete is described by a simplified method that simulates the real processes of jointing reinforcement with concrete. The simplification consists in modeling a smooth reinforcing bar, and its coupling with concrete in the form of nonlinear springs, the stiffness of which is determined on the basis of experimental data.
The nonlinear springs were modeled using the COMBIN39 element. The reinforcement-concrete interface zone was divided into 10 sections, each of which modeled a spring element; this division led to a more correct analysis of the stress-strain state. The first end of the spring was fixed to the reinforcement bar node and the second end to the concrete surface (Figure 8). This method was chosen for its clarity and computational stability in capturing the global load-slip relationship. The spring stiffness law (Formula 4) was directly back-calculated from the experimental F−δ curves, thereby inherently encapsulating the integrated, complex effect of corrosion products—including loss of adhesion, altered friction, and possible radial pressure—on the bond-slip behavior. While more sophisticated frameworks like Cohesive Zone Models (CZM) or continuum Damage Mechanics (DM) could offer a more fundamental representation of interface decohesion, they require extensive additional experimental data. The adopted simplified method provides a practical and validated engineering tool for the analyzed problem.
The behavior of concrete was described using the Menetrey-Willam model [24], which uses plastic flow theory as its basis. The Menetrey-Willam model is generally more applicable for modeling the behavior of bound aggregates such as concrete than the Drucker-Prager model without modifications [25,26].
This model uses plastic flow theory as a basis. The concrete model consists of three main components:
- The three-invariant limit surface fMW described by formula 2:
- 2.
- The surface of the plastic potential [24], which is responsible for the direction of the plastic strain vector described by the formula 3:
where Bg and Cg are parameters characterizing the plastic potential.
- 3.
- Laws of evolution of the limiting surface, responsible for hardening and de-hardening of the material. The model provides separate evolution laws for compression and tension (see Figure 10):
The strength and deformation characteristics of concrete used in the numerical calculation are determined on the basis of in-situ tests, the cubic compressive strength is 32,5 MPa, which corresponds to concrete class B25, hence the tensile strength can be assumed to be 1.55 MPa. To determine the elastic, plastic and total deformations and their corresponding stresses required to set the laws of evolution (Figure 10), according to Appendix D of SP 63.13330 [23], the corresponding values are determined:
- -
- Concrete compressive strength is 18,5 MPa;
- -
- Ωci=0,65 - 18,5x0,65=12,02 MPa;
- -
- Ωcu=0,85 - 18,5x0,85=15,72 MPa;
- -
- Ωcr=0,175 - 18,5x0,175=3,23 MPa;
- -
- Initial modulus of elasticity ;
- -
- Tensile strength of concrete - 1,55 MPa;
- -
- Ωtr=0,1 – 1,55x0,1=0,155 MPa.
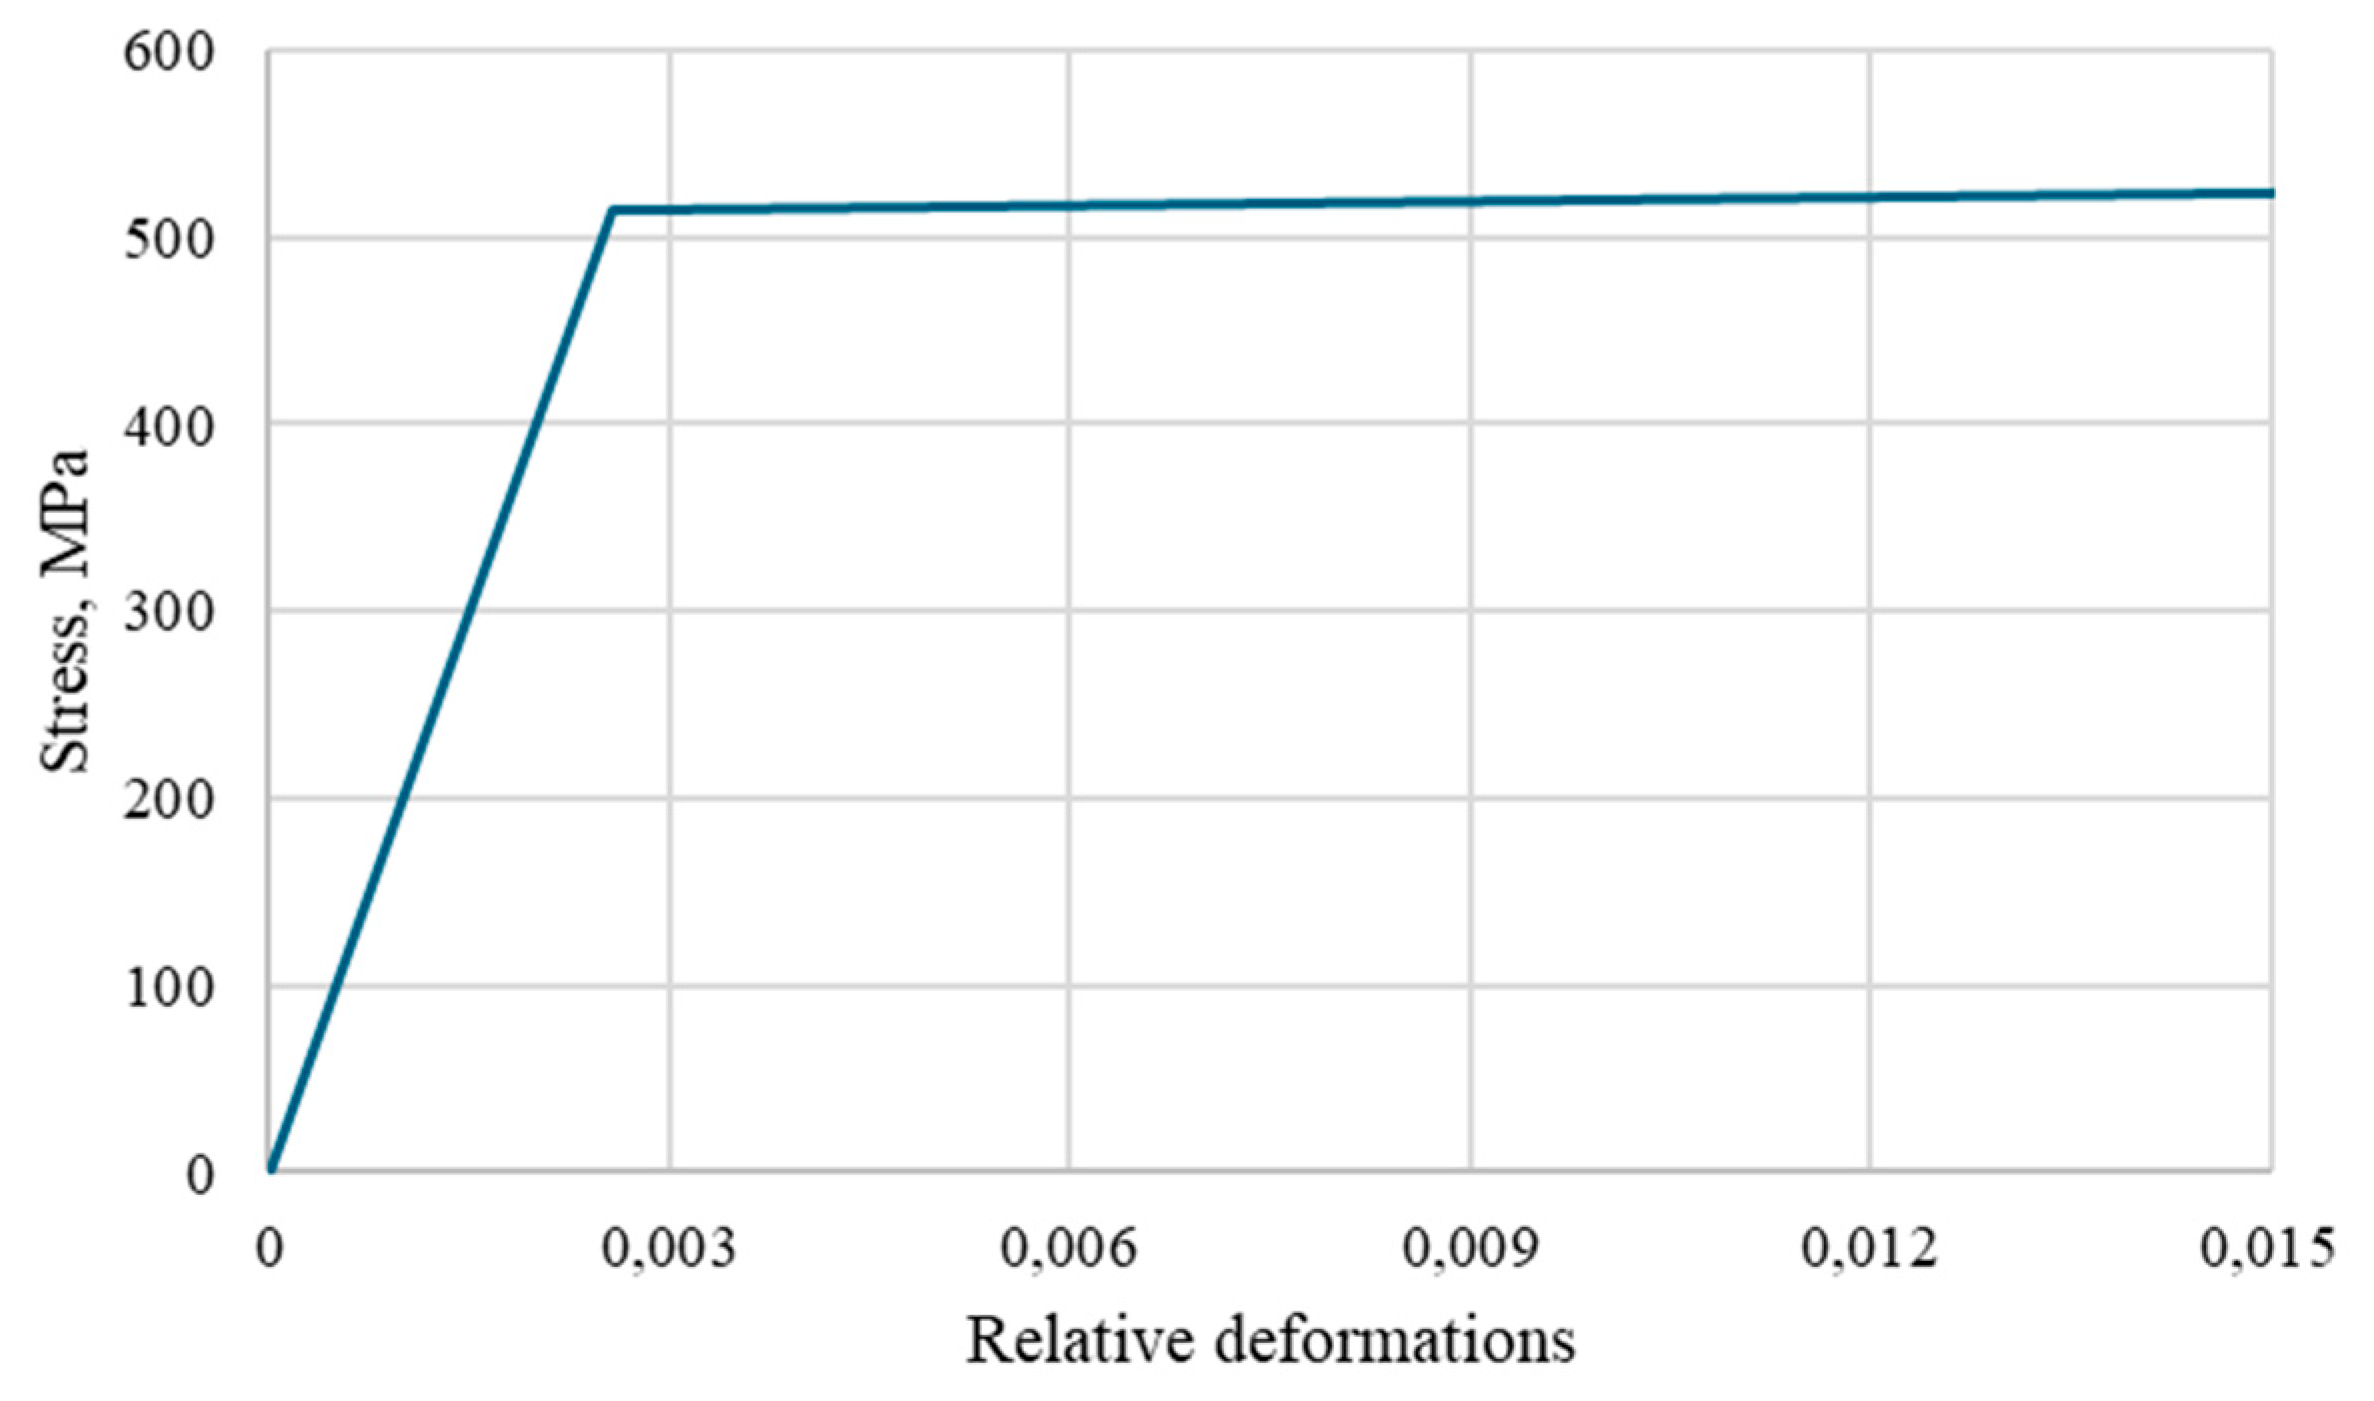
The behavior of reinforcing steel is described by bilinear dependence with yield strength of 515MPa, accepted on the basis of the conducted experimental studies (Figure 7////). The sensitivity of the bilinear steel model was negligible for this specific pull-out setup, as stresses in the short embedded bar remained predominantly elastic. This observed insensitivity of the key outputs to reasonable parameter variations validates the reliability of the model for simulating the bond-slip mechanism under the defined conditions.
The problem was solved in a nonlinear formulation under static loading conditions using the stepwise Newton-Raphson method. The loading of the model was performed by specifying displacements of the lower end of the reinforcing bar, simulating experimental tests. The displacement application was divided into 100 equal sub-steps.
Figure 11.
Bilinear diagram of reinforcement deformation.
Spring stiffness in corrosion-damaged and undamaged models was determined based on the results of experimental studies. The spring stiffness is determined by the dependence of the acting pull-out load on the displacement of the upper end of the rod. Assuming the equality of springs in the whole section of bond between reinforcement and concrete, the stiffness of each spring can be determined by the formula 4:
where F is the value of the force applied to the rod; n is the number of springs; s is the displacement of the upper end of the rod.
In calculations, the spring parameters were given by the exponential dependence obtained on the basis of in-situ tests, shown in Figure 4.
Model Calibration and Verification. The parameters for the concrete model (Menetrey-Willam) were obtained directly from the accompanying tests, which ensures physical representativeness. The predictive ability of the model was tested in two stages:
Bond-Slip Verification: The force-displacement response (F−δ) of the control (uncorroded) FE model was compared against the experimental average curve (Figure 4). An iterative adjustment of the initial spring stiffness (within a ±10% range of the value from Eq. 4) was performed to minimize the root-mean-square error, achieving a final correlation coefficient R2>0.95.
Failure Mode Verification: The numerical crack pattern and concrete damage localization around the reinforcement pull-out zone were qualitatively compared with the experimental failure specimens (Figure 5 and Figure 6), confirming the model's ability to replicate splitting and crushing mechanisms.
Sensitivity Analysis. A parametric study was conducted to assess the influence of key numerical inputs on the peak pull-out force (Nmax):
Concrete Tensile Strength: Varied ±20% from the nominal 1.55 MPa. A 20% increase in led to a ~7% increase in Nmax for the control specimen, highlighting the model's sensitivity to the concrete's resistance to splitting.
Spring Law Definition: The exponential fit for spring force-displacement (Figure 4) was compared to a simplified bilinear approximation. The bilinear simplification resulted in an overestimation of the post-peak ductility by up to 15%, emphasizing the need for a non-linear spring definition derived from experiments.
4. Results
A constant displacement of 1,5 mm was set to the lower end of the rod. The calculation results corresponding to the peak load for the corrosion-damaged and undamaged model are shown in the Figure 12, where the vertical displacement of the rod relative to the concrete section is observed and the characteristic picture of stress distribution along the contact.
Figure 13 shows a graphical comparison of the reaction force dependence on the displacement of the upper and lower ends of the reinforcement. There is a significant difference in the displacements between the ends of the reinforcement, which shows the presence of deformation of the rod, despite the fact that the modulus of elasticity of steel is significantly greater than the modulus of elasticity of concrete, which indicates the inadmissibility in such problems to consider the rod as an absolutely rigid body.
Thus, the difference in displacement of the lower and upper ends of the undamaged and corrosion-damaged rod is 20% (0.62mm and 0.75mm) and 115% (0.093mm and 0.2mm), respectively. The difference between the displacement of the lower end of the undamaged and damaged rod is 6.6 times (0.62mm and 0.093mm) and the upper end is 3.75 times (0.75mm and 0.2mm). The obtained results show that the presence of corrosion damage leads to degradation of bonding forces and as a result to reduction of deformation of reinforcing bars and tensile forces occurring in them.
The values of ultimate pull-out force at 22% corrosion damage of reinforcing bars decreases by 17%, hence the presence of corrosion damage of reinforcing bars leads not only to known and to some extent studied negative consequences such as destruction of the protective layer of concrete, reduction of bearing capacity, but also to hidden negative consequences, such as failure to provide the required anchorage length, which does not guarantee the joint work of concrete and reinforcement and may lead to slippage of reinforcement in the body, which will lead to transformation of the static work of the structure, a different redistribution of internal forces and change the stress-strain state of the designed structure.
5. Discussion
Although the present study primarily focuses on local bond degradation between corroded reinforcement and concrete, the obtained results have direct implications for the global structural performance of reinforced concrete elements. Bond deterioration leads to premature slip of reinforcement, which alters the strain compatibility condition between concrete and steel. As a consequence, the effective anchorage length is reduced, resulting in earlier yielding of reinforcement or loss of force transfer prior to reaching the flexural or axial capacity predicted by conventional design models. Based on the experimental results, a 6.05% reduction in maximum bond stress at a corrosion level of approximately 23% corresponds to a 17% decrease in ultimate pull-out force. When extrapolated to structural elements such as beams or slabs, this reduction may result in a significant decrease in effective stiffness, increased crack spacing, and redistribution of internal forces. In statically indeterminate systems, such redistribution may trigger secondary damage mechanisms and progressive loss of load-bearing capacity. Therefore, bond degradation should be treated not only as a local interface phenomenon but as a governing factor influencing the global structural capacity and serviceability of corrosion-damaged reinforced concrete elements.
The numerical parameters adopted in the finite element model were directly correlated with experimentally observed micro-scale damage mechanisms.
Experimental observations revealed the formation of corrosion products at the steel–concrete interface, leading to internal radial pressure, microcracking of the surrounding concrete, and partial loss of mechanical interlock. These microstructural changes were reflected in the numerical model through a reduction of spring stiffness and modification of the nonlinear force–displacement relationship assigned to the interface elements.
The linear behavior observed in the load–slip response of corroded specimens up to approximately 0.9 of the peak load is attributed to frictional resistance mobilized by corrosion products. This mechanism was captured at the macro-scale by using an exponential degradation law for spring stiffness, calibrated against experimental pull-out curves.
Thus, the proposed modeling strategy establishes a consistent micro–macro transition, where experimentally observed degradation mechanisms are embedded into the numerical parameters governing interface behavior.
6. Conclusions
- The test results showed a 6.05% reduction in bond strength for the corroded bar relative to the uncorroded bar, with a reinforcement cross-sectional area loss of 23.08%
- The maximum stress in the corrosion-damaged bar was 6.84% higher than in the undamaged bar. This effect results from the reduced cross-sectional area, despite a slight decrease in the maximum load on the specimen.
- The deformation graphs reveal the influence of corrosion products on bar performance. Corrosion-damaged reinforcement is held primarily by friction against the corrosion products, resulting in a more linear graph. For undamaged reinforcement, plastic deformations in the concrete between the bar ribs are evident during pull-out.
- The numerical method for calculating the bond of corrosion-damaged reinforcement using a set of nonlinear springs allows for correct analysis and description of bond force versus displacement relationships.
- To obtain more reliable data on the effect of corrosion on bond, a comprehensive study involving different reinforcement diameters, corrosion percentages, relative anchorage lengths, and concrete strength classes is needed.
Acknowledgments
The authors of the article express their gratitude to the laboratory of testing of building materials, products and structures for the opportunity to conduct experimental studies on the basis of technical equipment of the laboratory. And also to the employee of the unit Kovalev Mikhail for all-round assistance and support and Vasyutin Vladimir for the preparation of experimental samples.
References
- Benin, A. V.; Semyonovich, Semyonov Artyom; Semyonov, S. G. G.; Melnikov, B. E. Finite-element modeling of fracture processes and resource estimation of the highway bridge elements taking into account the corrosion damage. Magazine of Civil Engineering 2012, №7(33). [Google Scholar]
- Vladimirovich, Benin Andrey; Semyonovich, Semyonov Artem; Georgievich, Semyonov Sergey; Evgenyevich, Melnikov Boris. Mathematical modeling of the process of fracture of bonding of reinforcement with concrete. Part 1. Models taking into account non-continuity of the connection. Magazine of Civil Engineering 2013, №5(40). [Google Scholar]
- Benin, Andrey; Semenov, Artem Semenovich; Semenov, Sergey Georgievich; Melnikovich, Boris. MATHEMATICAL MODELING OF THE PROCESS OF ARMATURE CELL BREAKING WITH CONCRETE. PART 2. MODELS WITHOUT CONSIDERATION OF INCONSISTENCY OF CONNECTION. Magazine of Civil Engineering 2014, №1(45). [Google Scholar]
- Kholmianskiy, M.M. Kontakt armatury s betonom [Contact between concrete and reinforcement] Moscow: Stroyizdat, 1981. 184 p. (rus).
- Shima, H.; Chou, L.-L.; Okamura, H. Micro and Macro Models for Bond in Reinforced Concrete. J. Fac. Eng. Univ. Tokyo 1987, 39, 133–194. [Google Scholar]
- Balázs, G.L. Connecting Reinforcement to Concrete by Bond // Beton- und Stahlbetonbau. 2007; No.102, 46–50. [Google Scholar]
- CEB-FIP Model Code 90.
- Cruz, J.S.; Barros, J. Modeling of bond between near-surface mounted CFRP laminate strips and concrete// Computers and Structures. 2004. No.82. Pp.1513–1521.
- Rehm, G. The fundamental law of bond, Proceedings of the Symposium on Bond and Crack Formation in Reinforced Concrete, Stockholm, pp. 491–498. 1957; 491–498. [Google Scholar]
- Wu, Y.F.; Zhao, X.M. Unified bond stress-slip model for reinforced concrete. J. Struct. Eng. 2012, 139, 1951–1962. [Google Scholar] [CrossRef]
- Lee, H.S.; Noguchi, T.; Tomosawa, F. Evaluation of the bond properties between concrete and reinforcement as a function of the degree of reinforcement corrosion. Cem. Concr. Res. 2002, 32, 1313–1318. [Google Scholar] [CrossRef]
- Cabrera, J.G. Deterioration of concrete due to reinforcement steel corrosion. Cem. Concr. Compos. 1996, 18, 47–59. [Google Scholar] [CrossRef]
- Stanish, K.D.; Hooton, R.D.; Pantazopoulou, S.J. Corrosion effects on bond strength in reinforced concrete. ACI Struct. J. 1999, 96, 915–921. [Google Scholar] [CrossRef] [PubMed]
- Yuan, Y.; Yu, S.; Jia, F. Deterioration of bond behavior of corroded reinforced concrete. Indust. Constr. (in Chinese). 1999, 29, 47–50. [Google Scholar]
- Auyeung, Y.; Balaguru, P.; Chung, L. Bond behavior of corroded reinforcement bars. ACI Mater. J. 2000, 97, 214–220. [Google Scholar] [CrossRef] [PubMed]
- Chung, L.; Cho, S.H.; Kim, J.H.J.; Yi, S.T. Correction factor suggestion for ACI development length provisions based on flexural testing of RC slabs with various levels of corroded reinforcing bars. Eng. Struct. 2004, 26, 1013–1026. [Google Scholar] [CrossRef]
- Chung, L.; Kim, J.H.J.; Yi, S.T. Bond strength prediction for reinforced concrete members with highly corroded reinforcing bars. Cem. Concr. Compos. 2008, 30, 603–611. [Google Scholar] [CrossRef]
- Bhargava, K.; Ghosh, A.K.; Mori, Y.; Ramanujam, S. Suggested empirical models for corrosion-induced bond degradation in reinforced concrete. J. Struct. Eng. 2008, 134, 221–230. [Google Scholar] [CrossRef]
- Kivell, A.R.L. Effects of bond deterioration due to corrosion on seismic performance of reinforced concrete structures, University of Canterbury, New Zealand. 2012. [Google Scholar]
- Lin, H.W.; Zhao, Y.X. Effects of confinements on the bond strength between concrete and corroded steel bars. Constr. Build. Mater. 2016, 118, 127–138. [Google Scholar] [CrossRef]
- ACI Committee 318. “Building Code Requirements for Structural Concrete (ACI 318-02) and Commentary (318R-02),” American Concrete Institute, Farmington Hills, MI, 2002, 443 pp.
- Hindawi, *!!! REPLACE !!!*. Experimental Study on Bond Performance and Damage Detection of Corroded Reinforced Concrete Specimens, Advances in Civil Engineering, Vol. 2020, Article ID 7658623, p.p. 15. [CrossRef]
- SP 63.13330.2018 Concrete and reinforced concrete structures. Basic provisions. SNiP 52-01-2003 (with Amendment No. 1) Code of Regulations from 19.12.2018.
- Dmitriev, A.; Novozhilov, Y.; Mikhalyuk, D.; Lalin, V. Calibration and Validation of the Menetrey-Willam Constitutive Model for Concrete // Construction of Unique Buildings and Structures. 2020. Volume 88. Article No 8804. 84–91.
- Korsun, V.I.; Karpenko, S.N.; Makarenko, S.Yu.; Nedoresov, A.V. Modern strength criteria for concrete under triaxial stress states. Building and Reconstruction 2021, 5, 16–30. [Google Scholar] [CrossRef]
- Model Code for Concrete Structures 2010. International Federation for Structural Concrete, 2013. ISBN: 978-3-433-03061-5, 434 p.
Figure 1.
Schematic of the test.
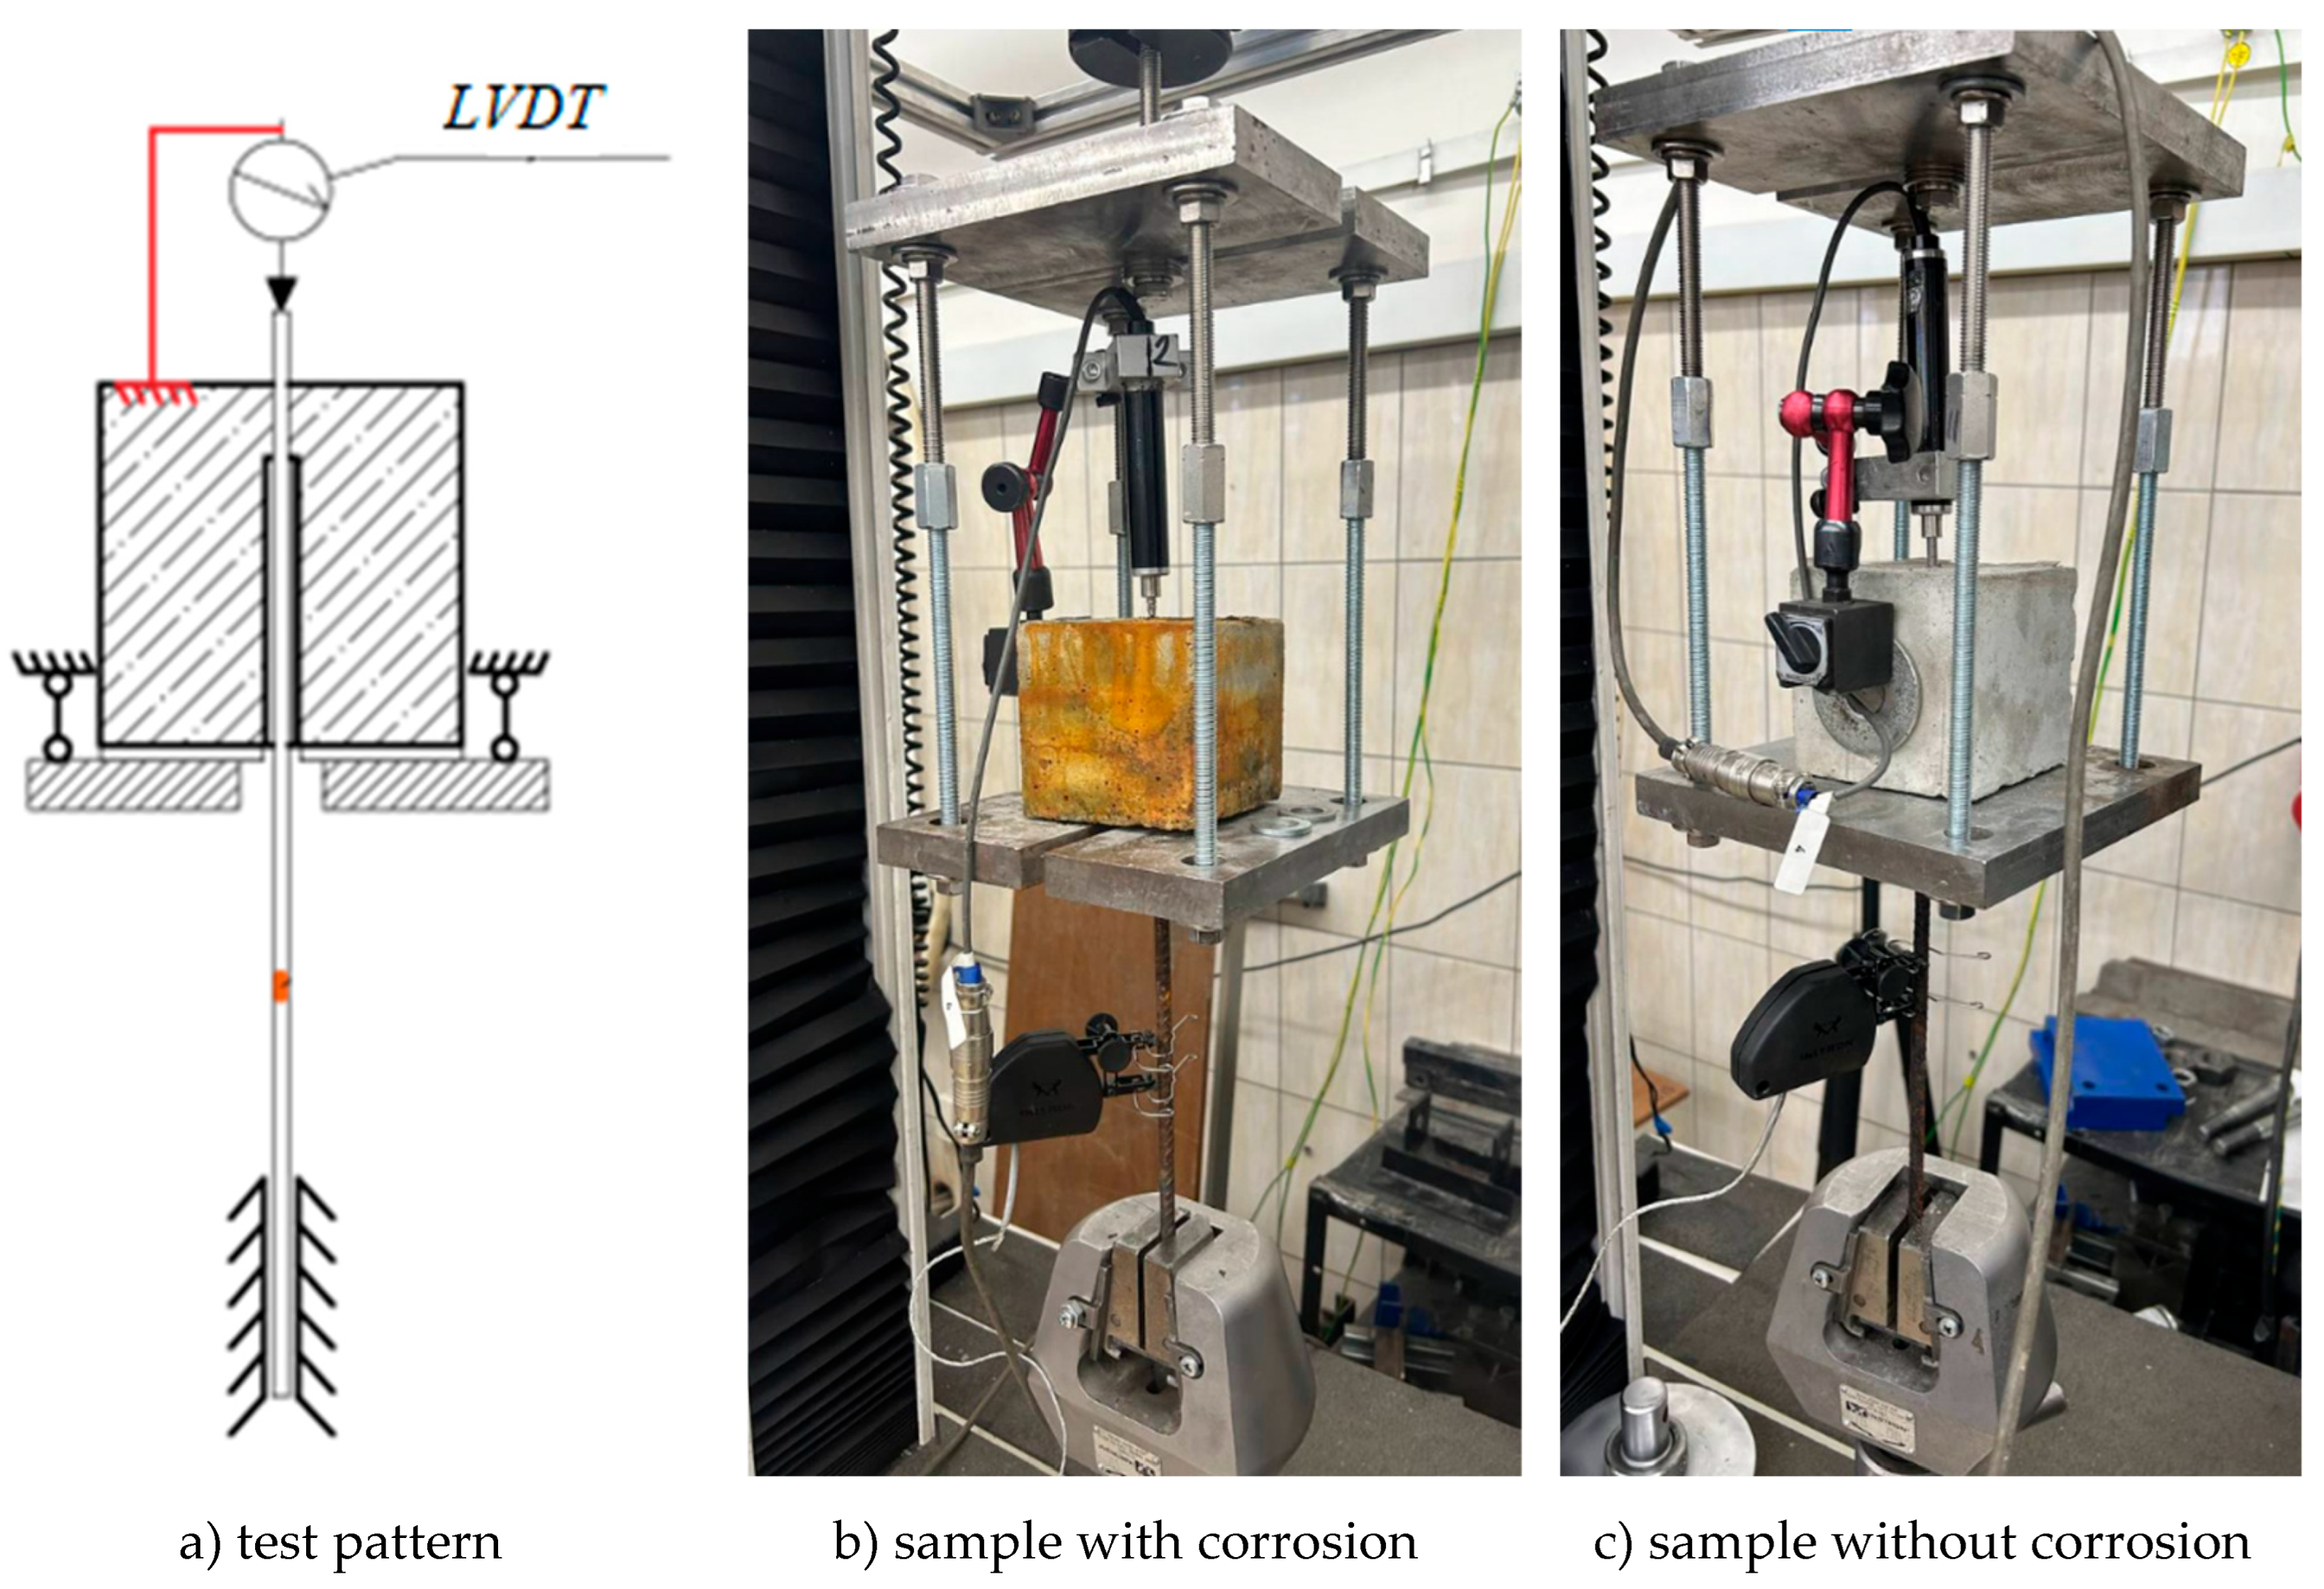
Figure 2.
Bonding of reinforcement prior to corrosion.
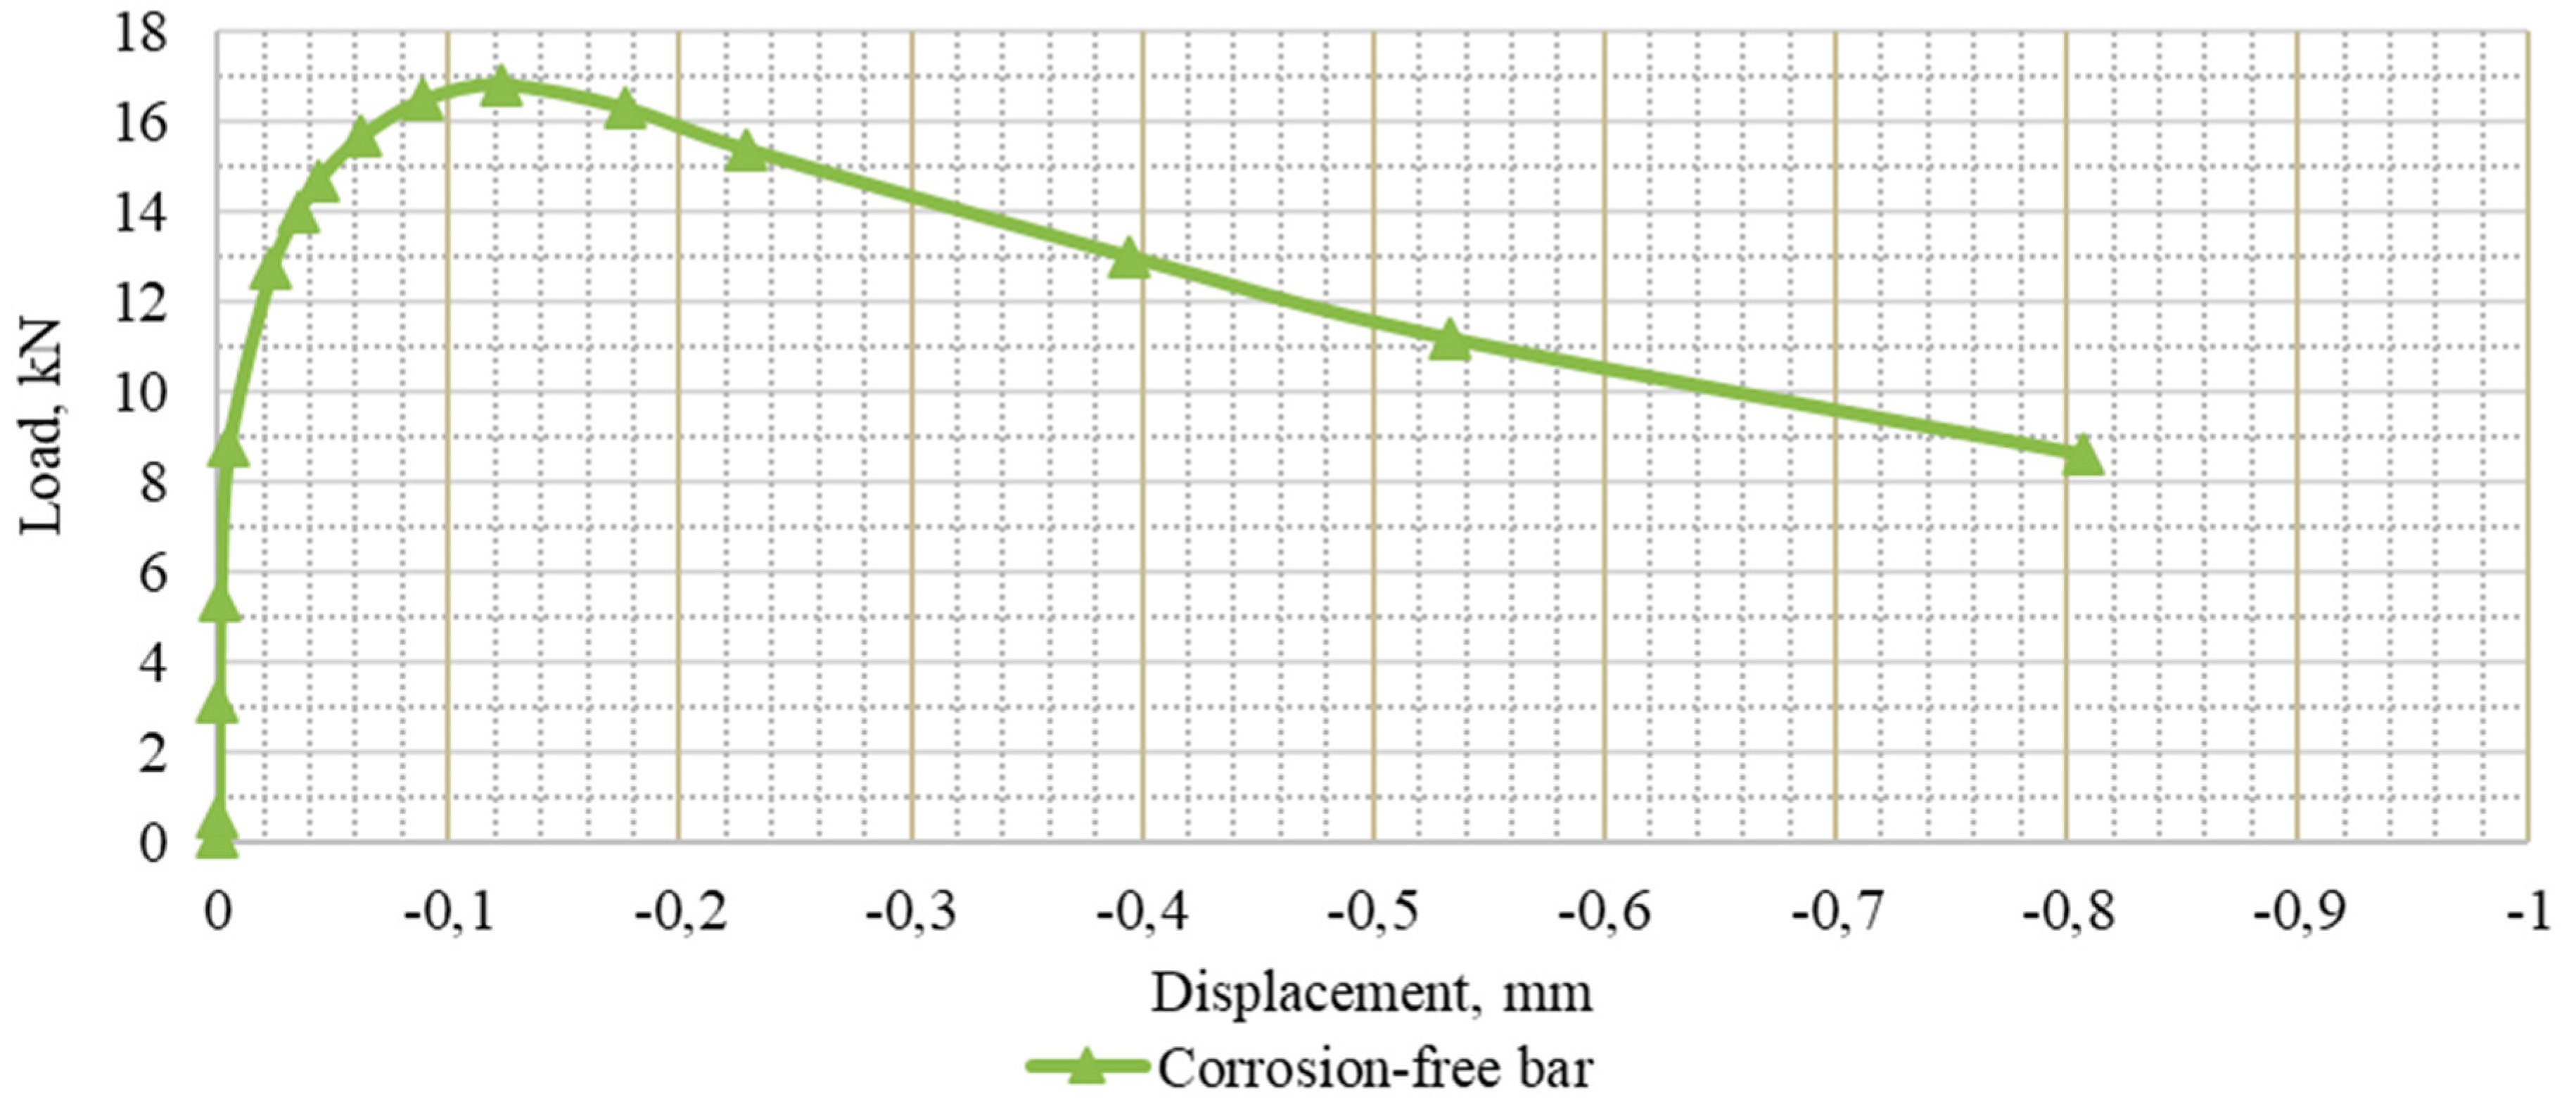
Figure 3.
Bonding of reinforcement after corrosion.
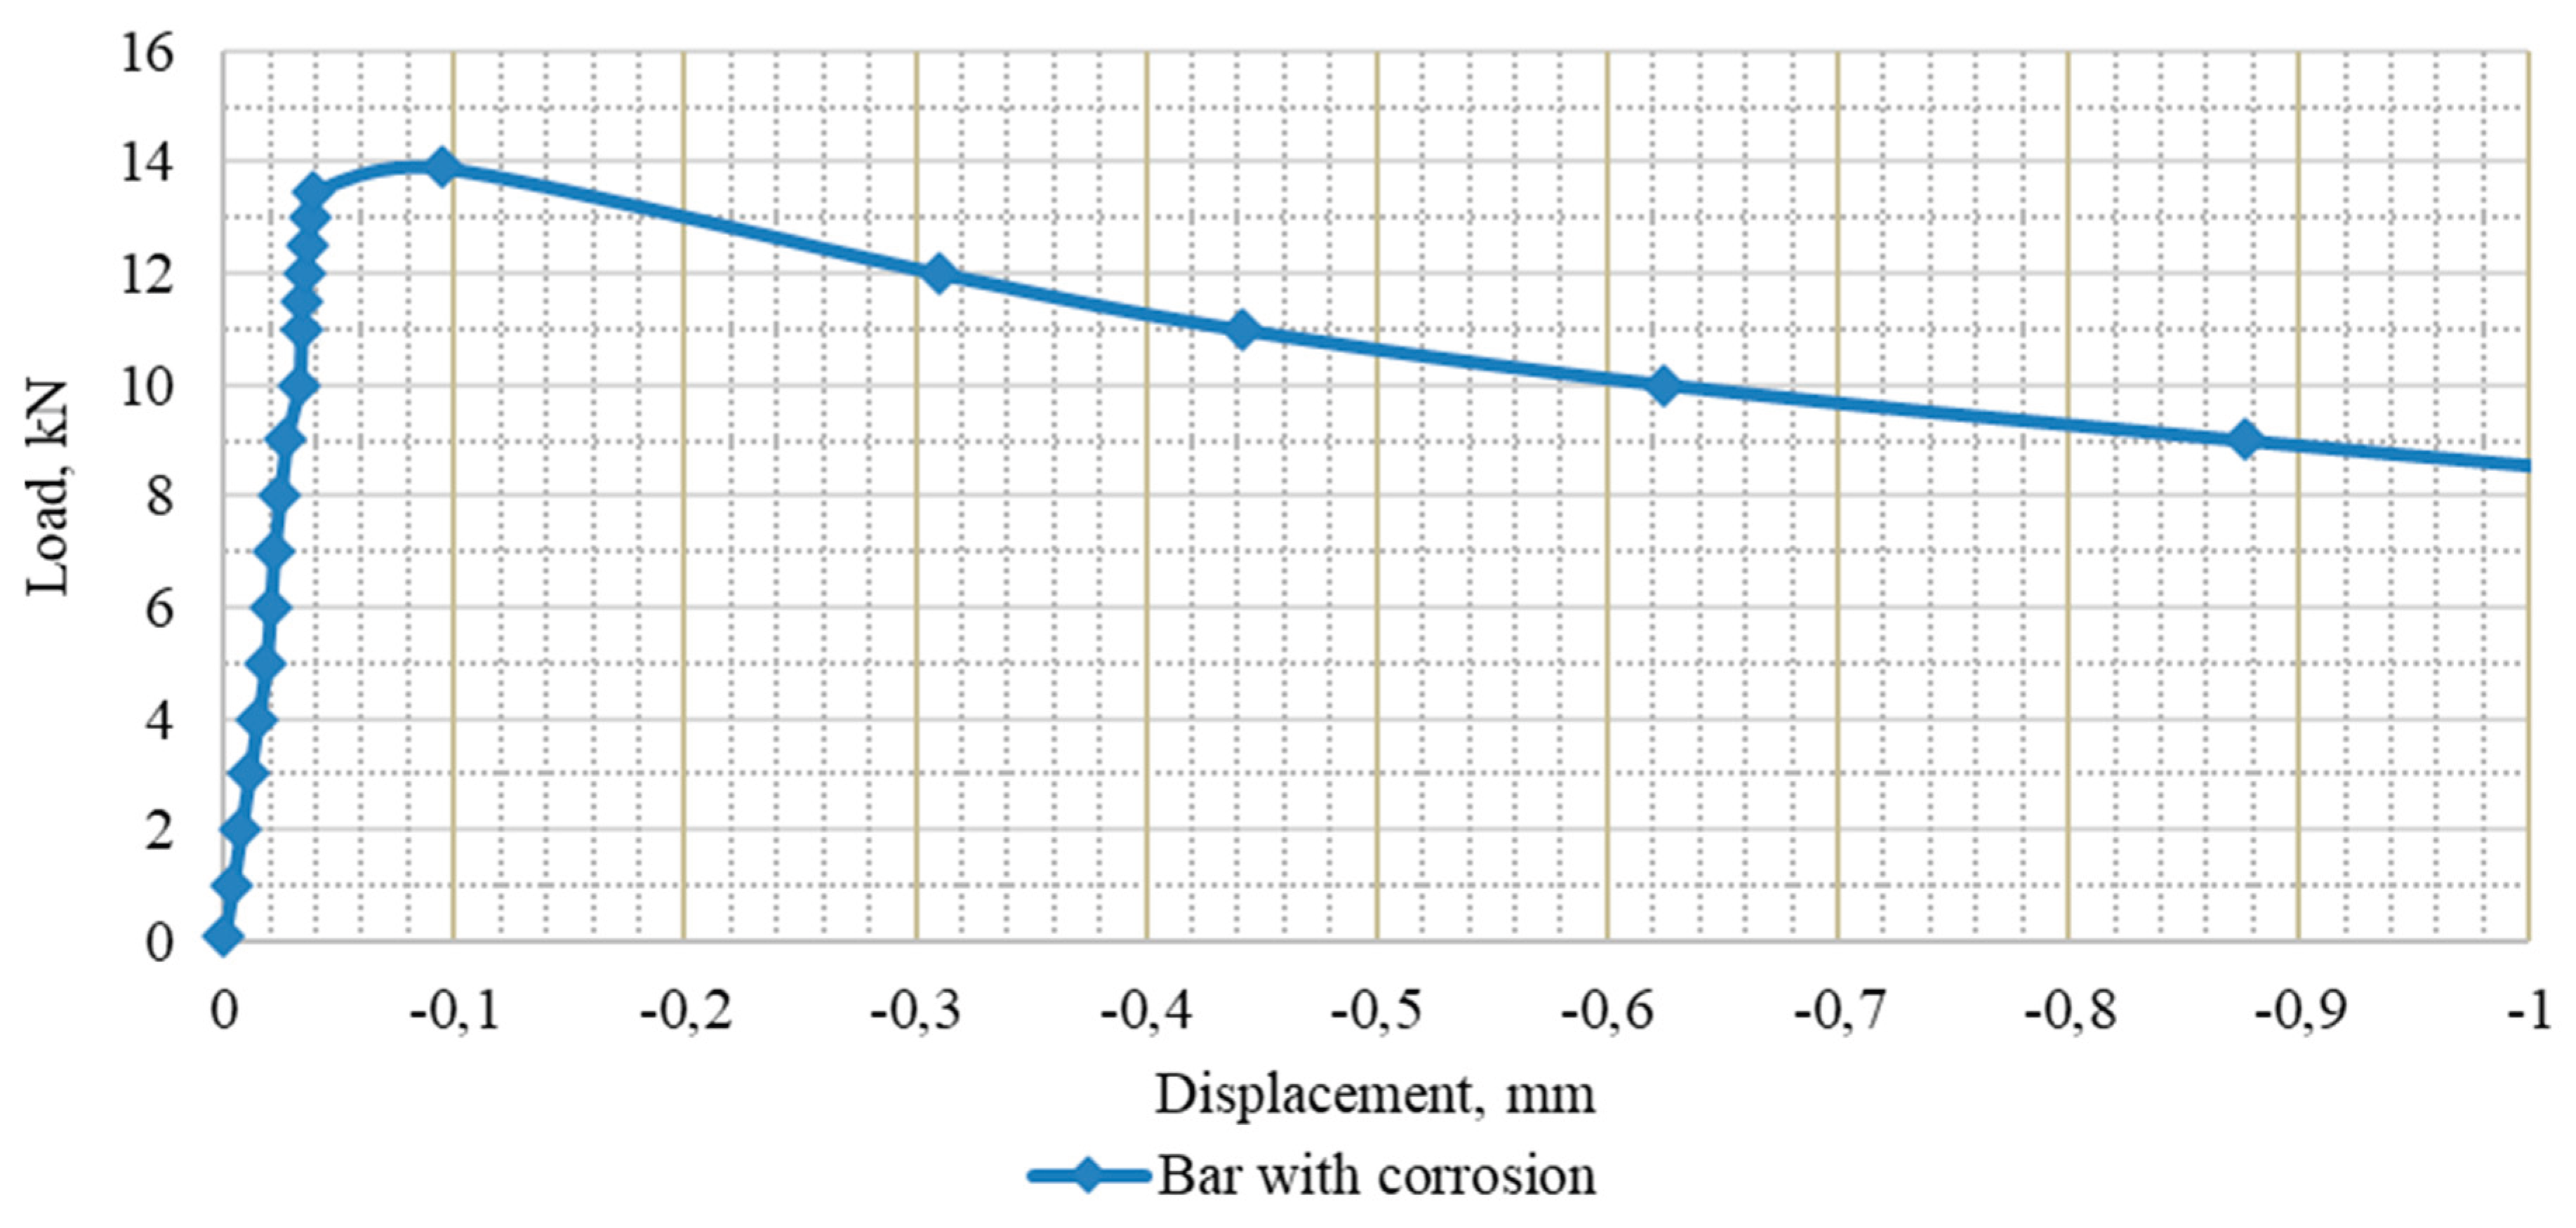
Figure 4.
Diagram of the test results.
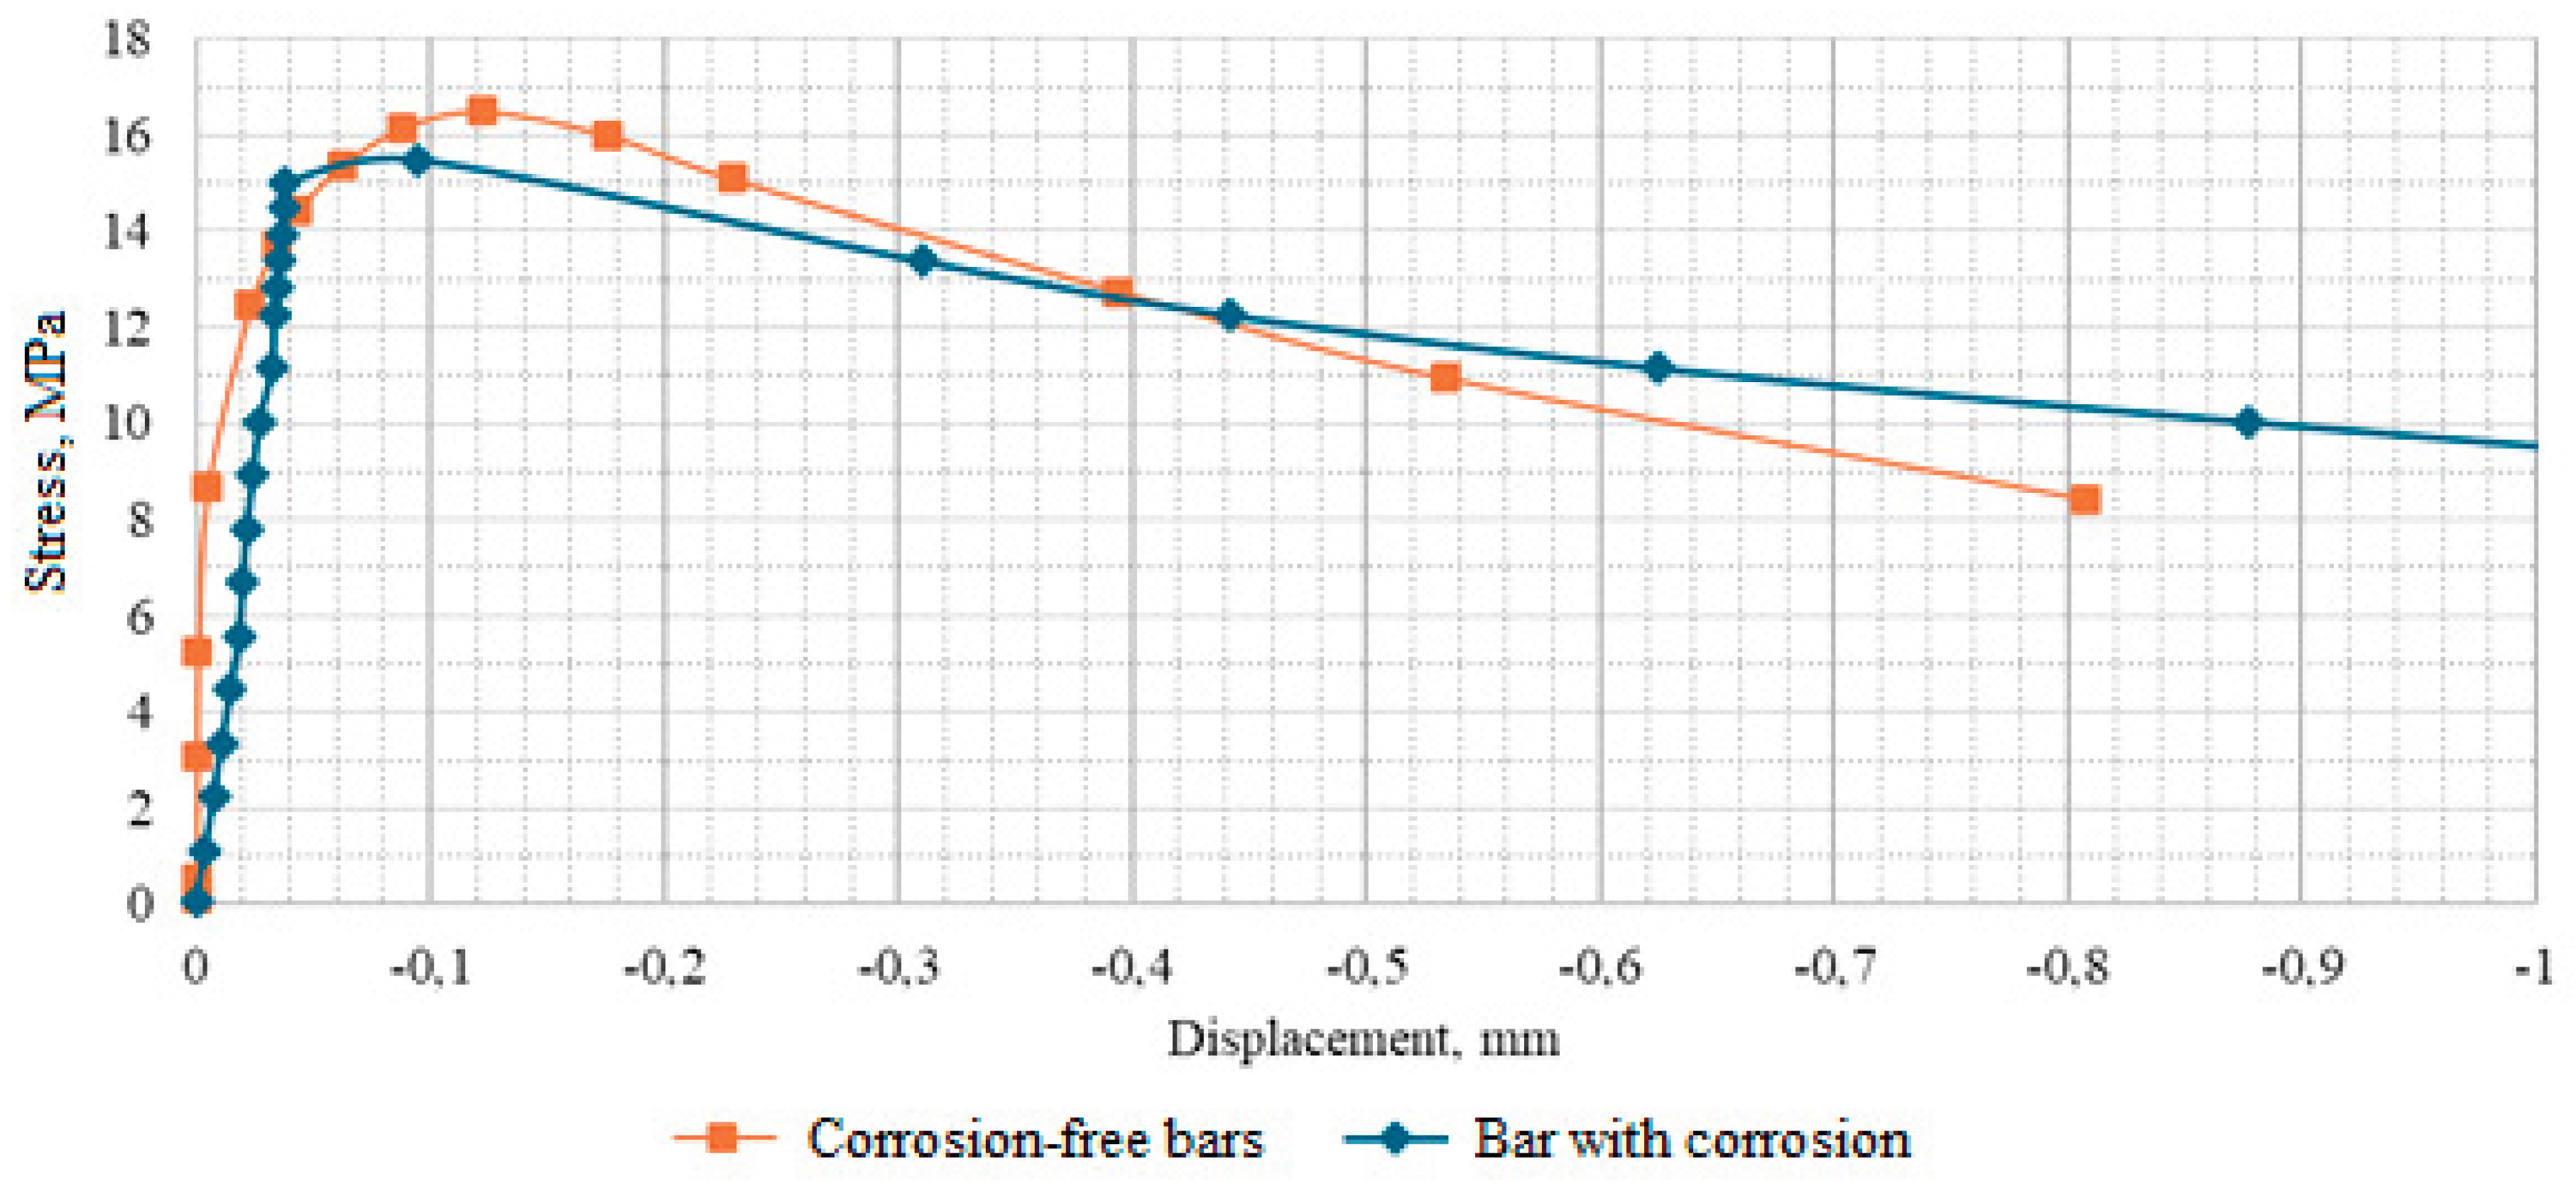
Figure 5.
Bars after testing.
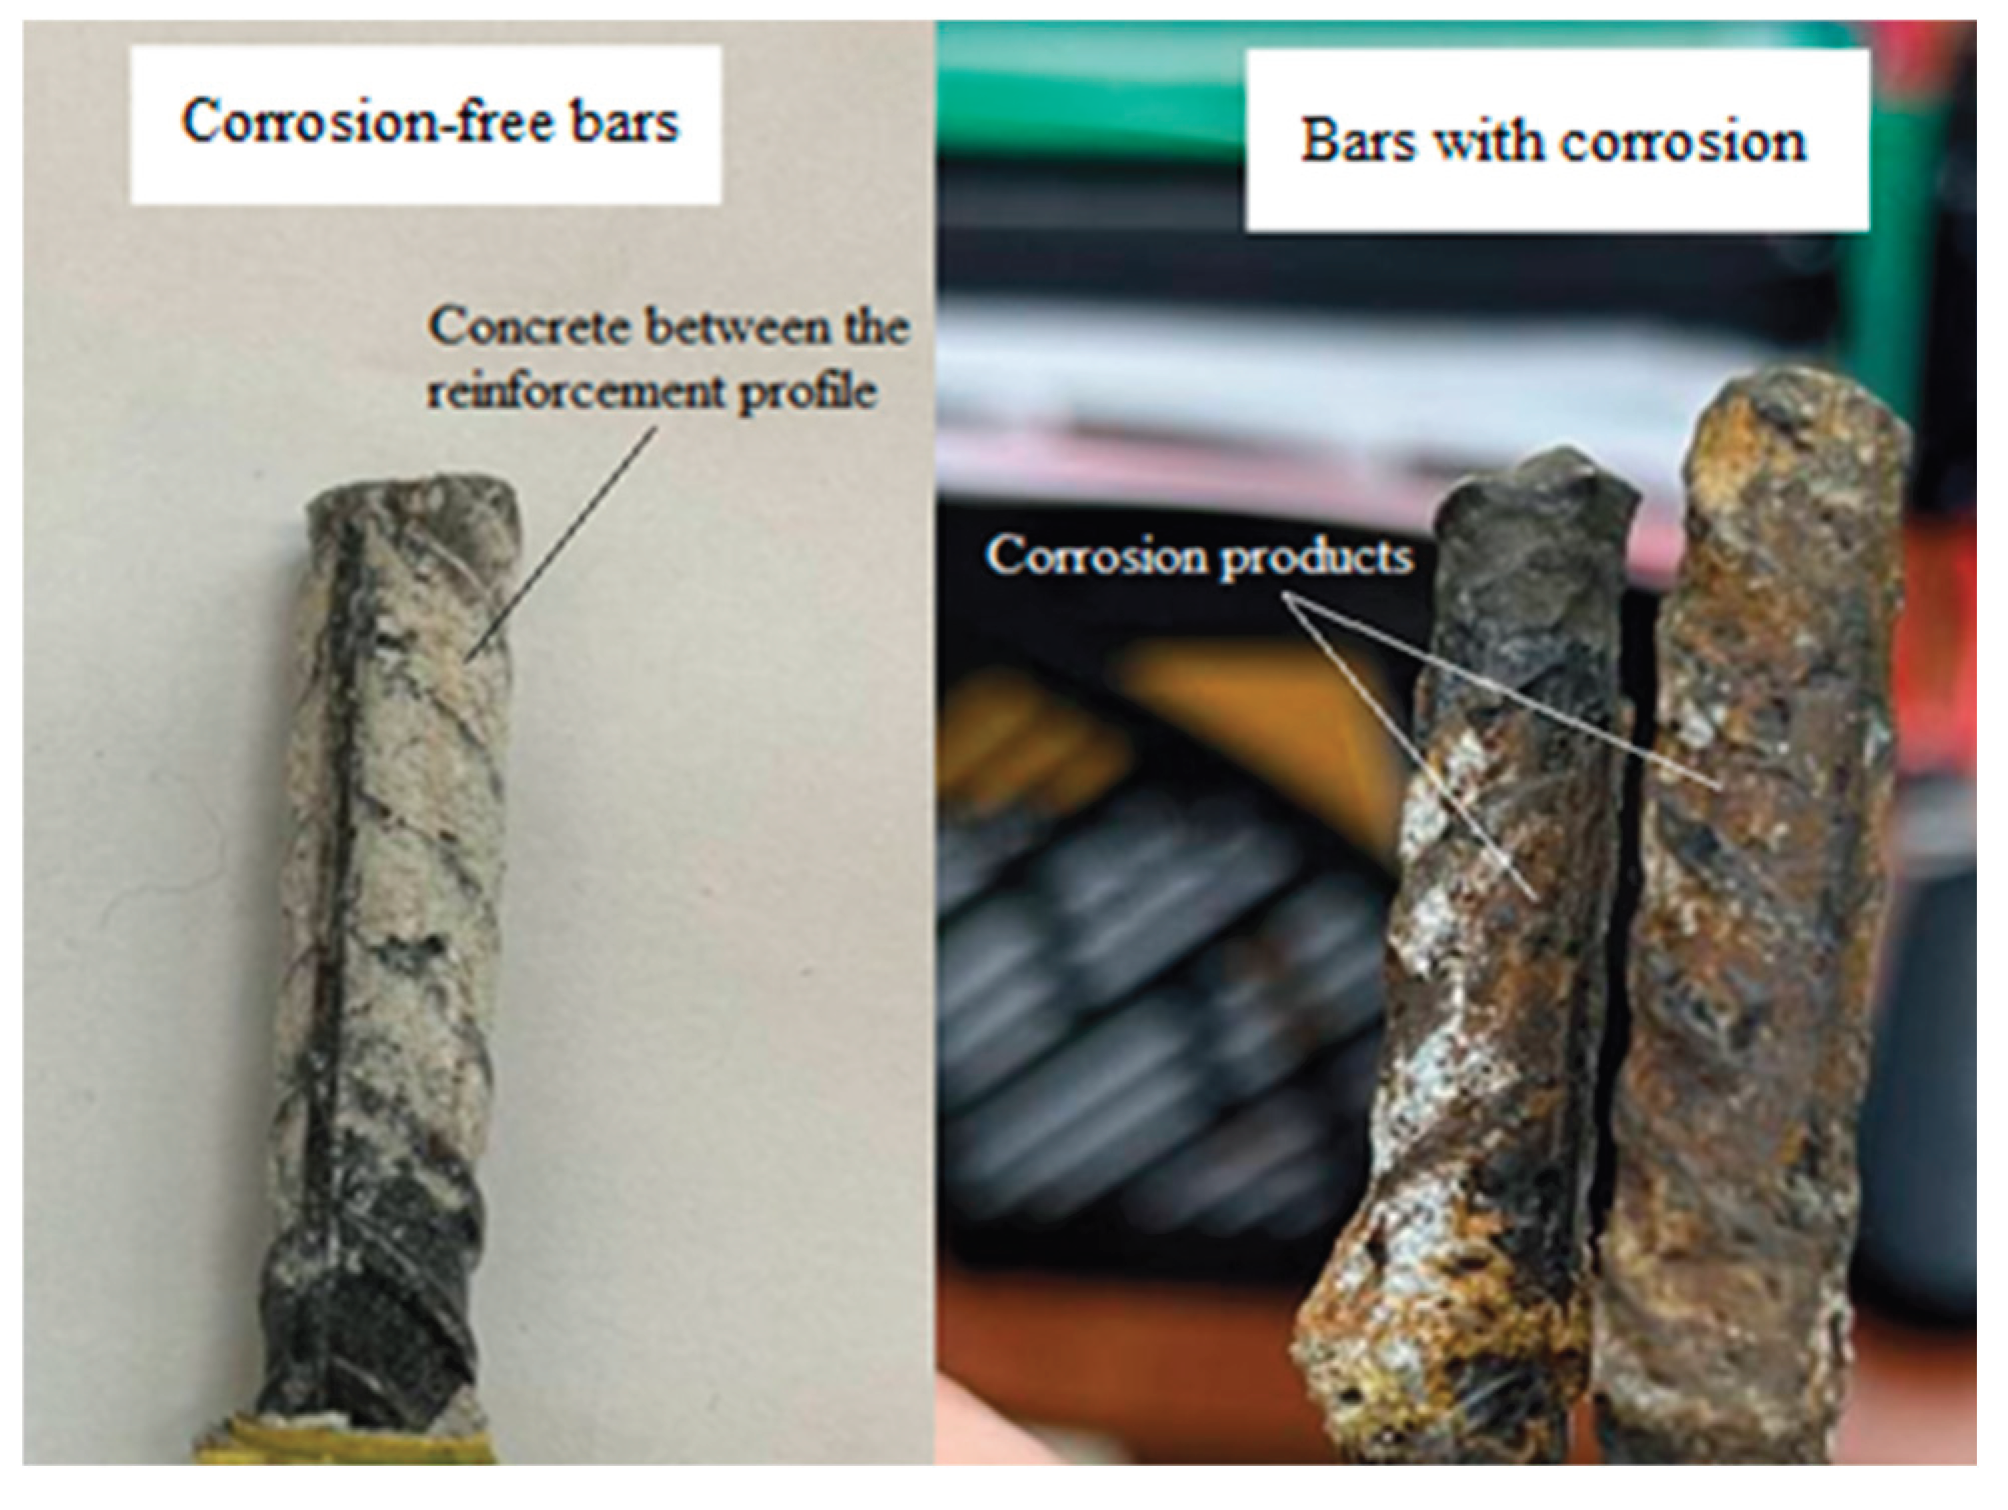
Figure 6.
Flaking of corrosion products in the concrete body.
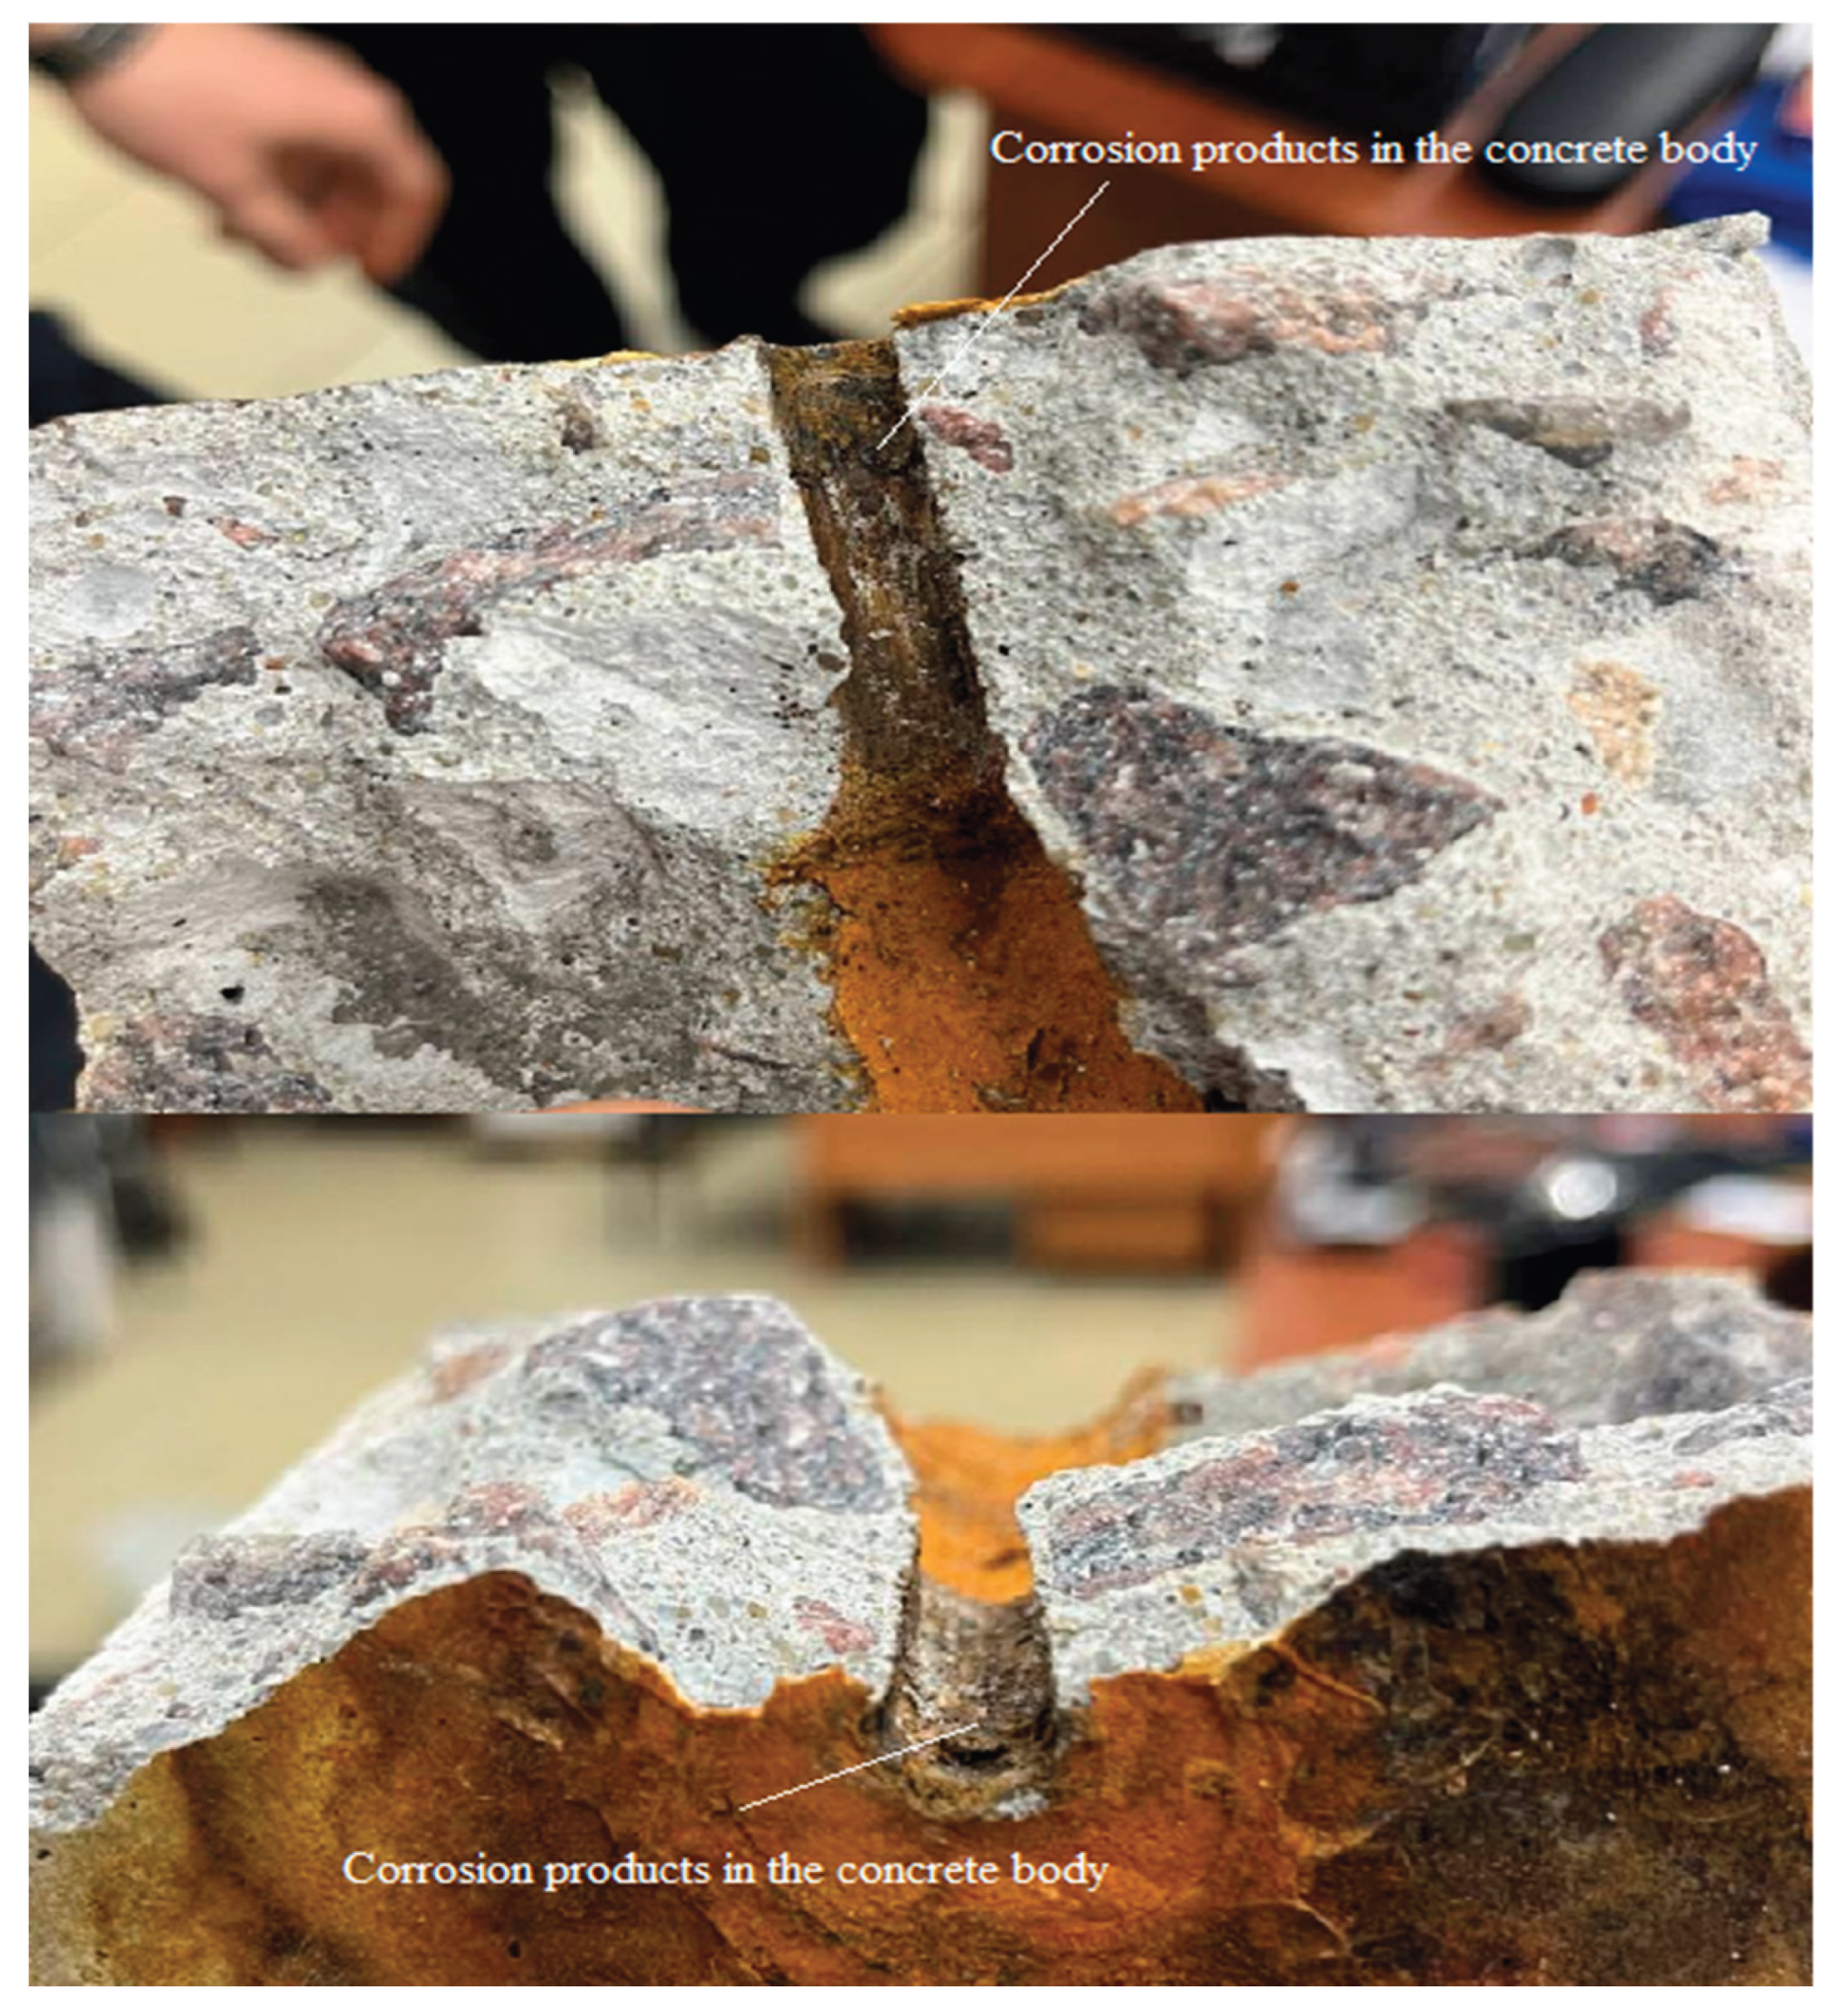
Figure 8.
Spring modeling in the reinforcement-concrete interface zone.
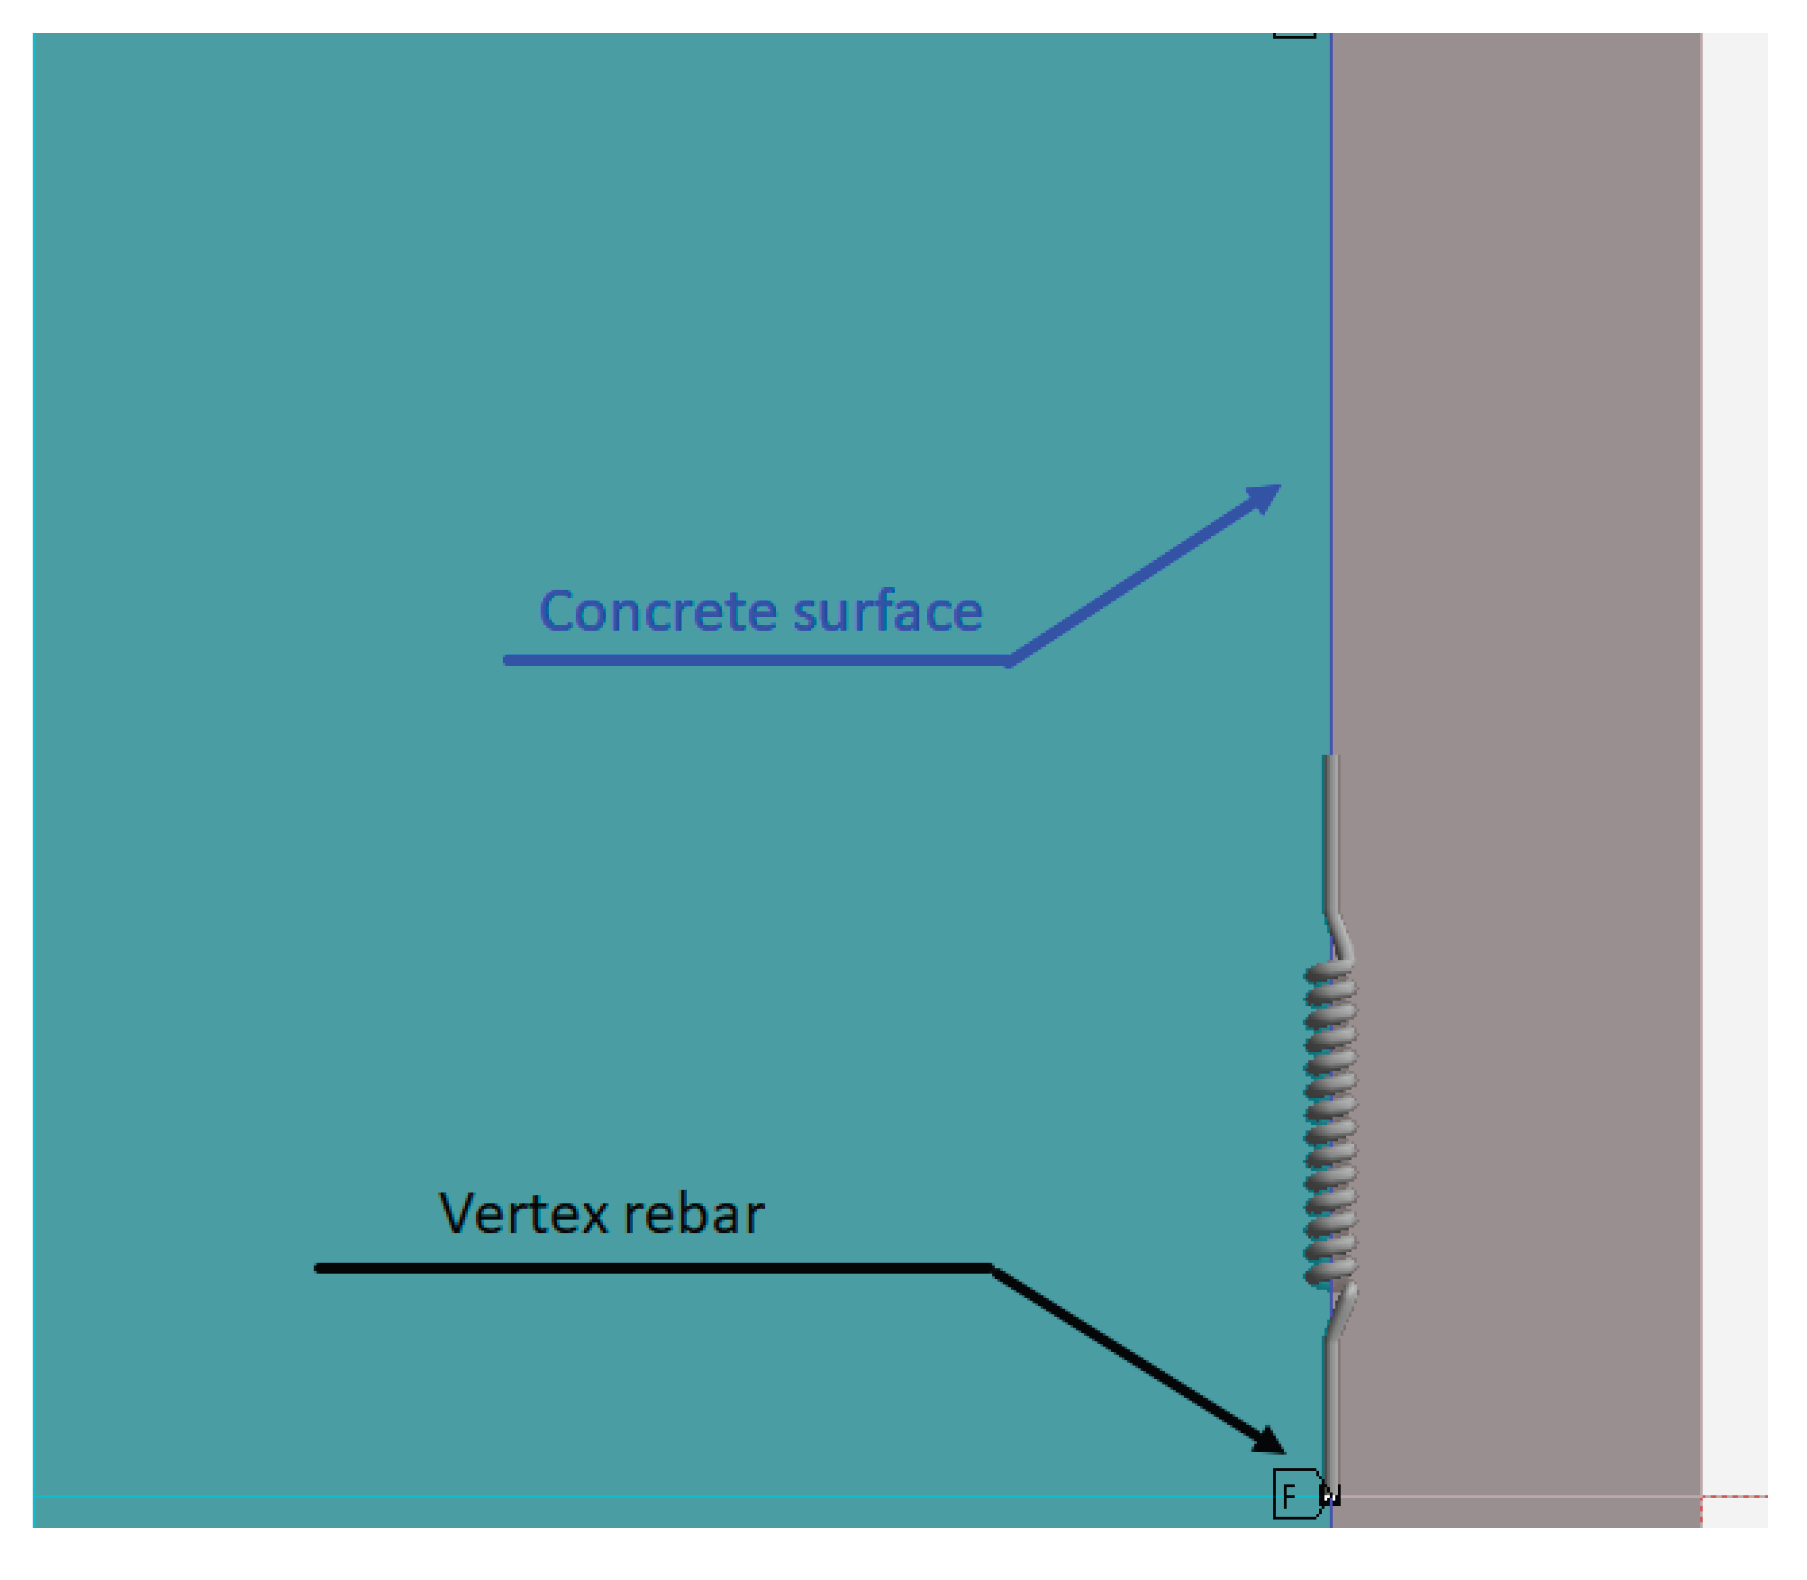
Figure 9.
The limiting surface of the Menetrey-Willam model.
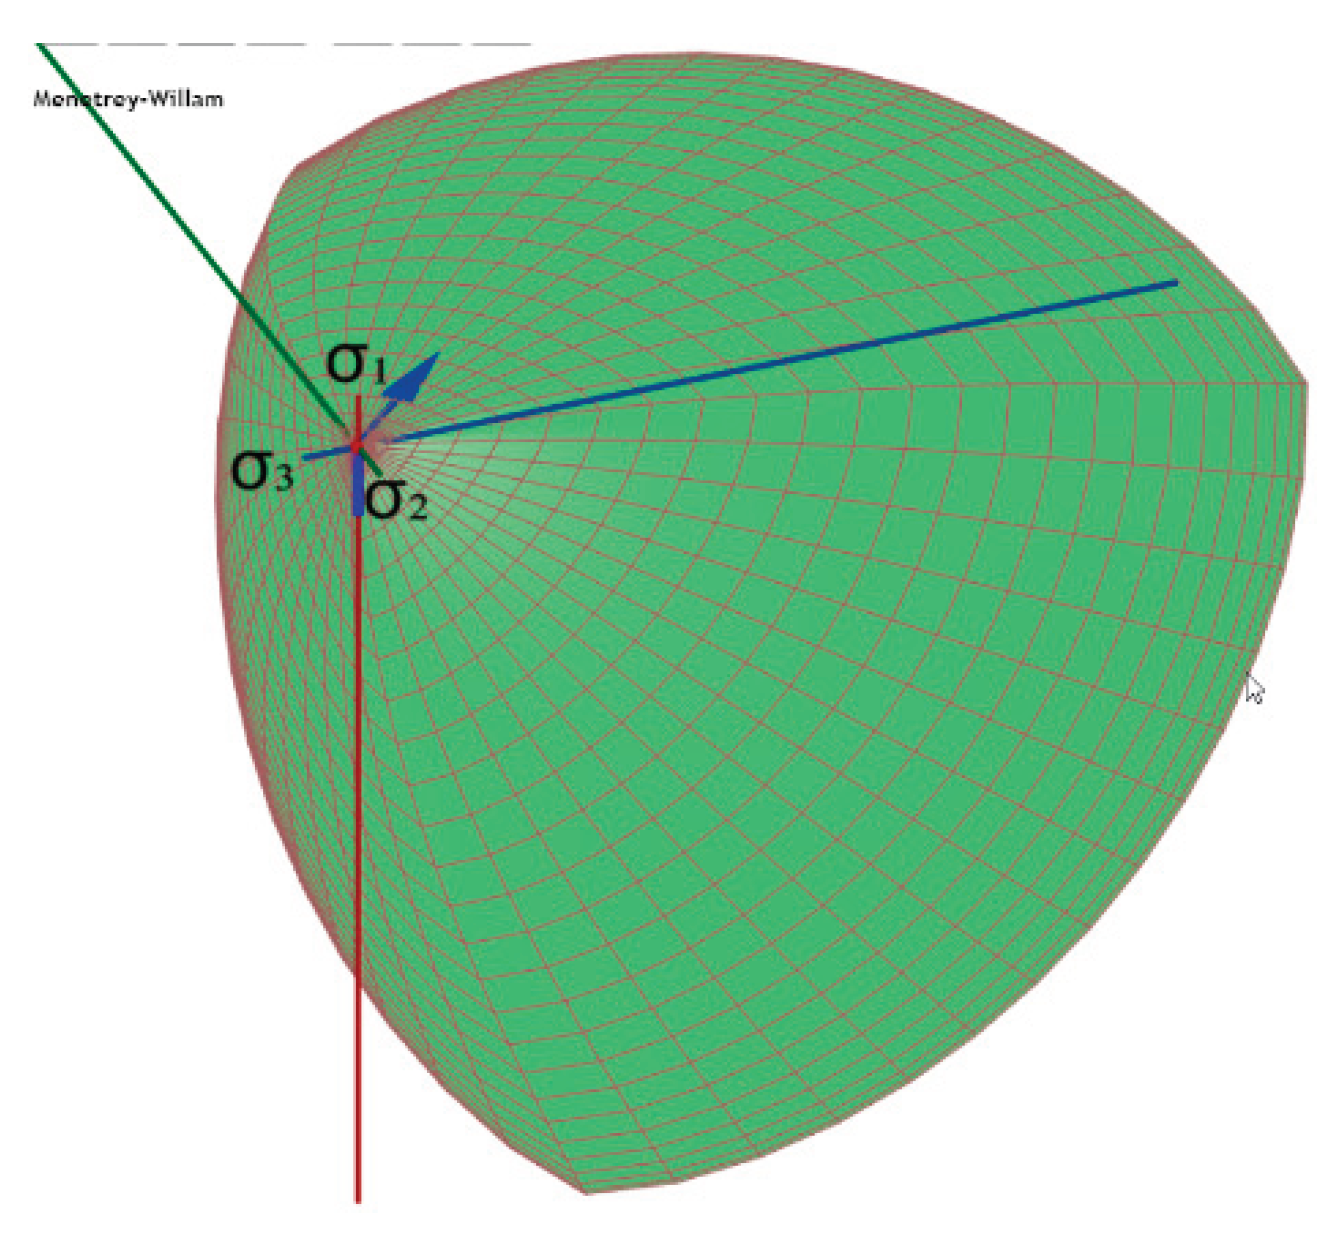
Figure 10.
Graphical interpretation of the laws of evolution of the limiting surface in compression (a) and tension (b).
Figure 10.
Graphical interpretation of the laws of evolution of the limiting surface in compression (a) and tension (b).
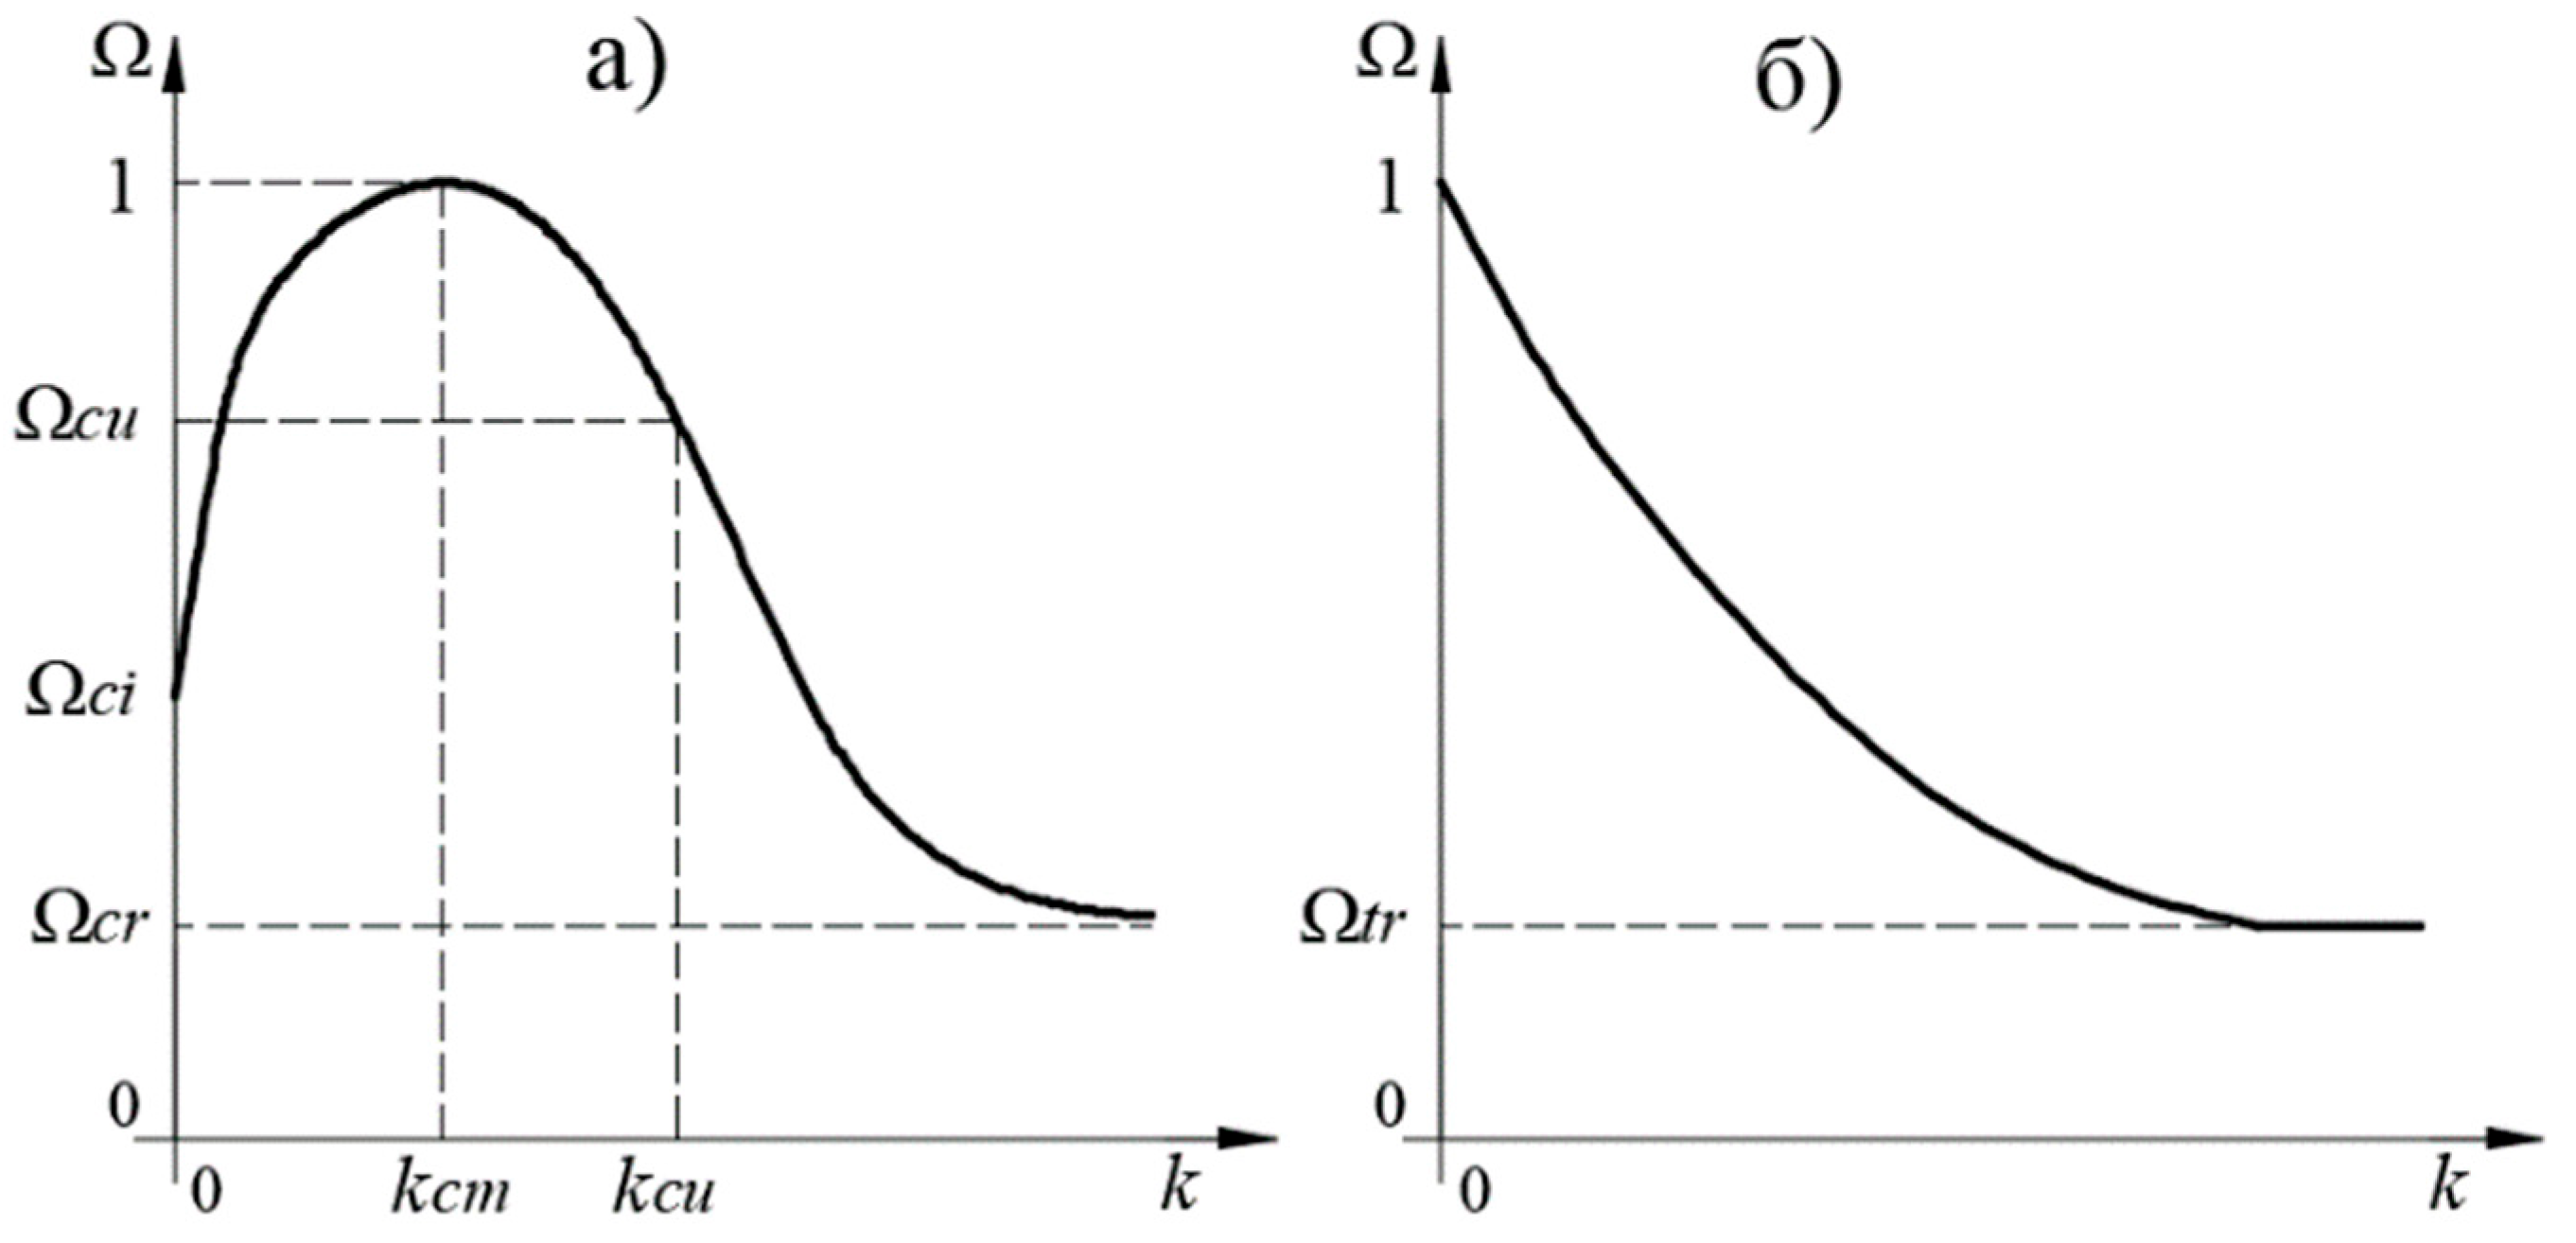
Figure 12.
Isopoles of vertical displacements and tangential stresses in concrete of undamaged (a and c) and corrosion-damaged (b and d) models.
Figure 12.
Isopoles of vertical displacements and tangential stresses in concrete of undamaged (a and c) and corrosion-damaged (b and d) models.
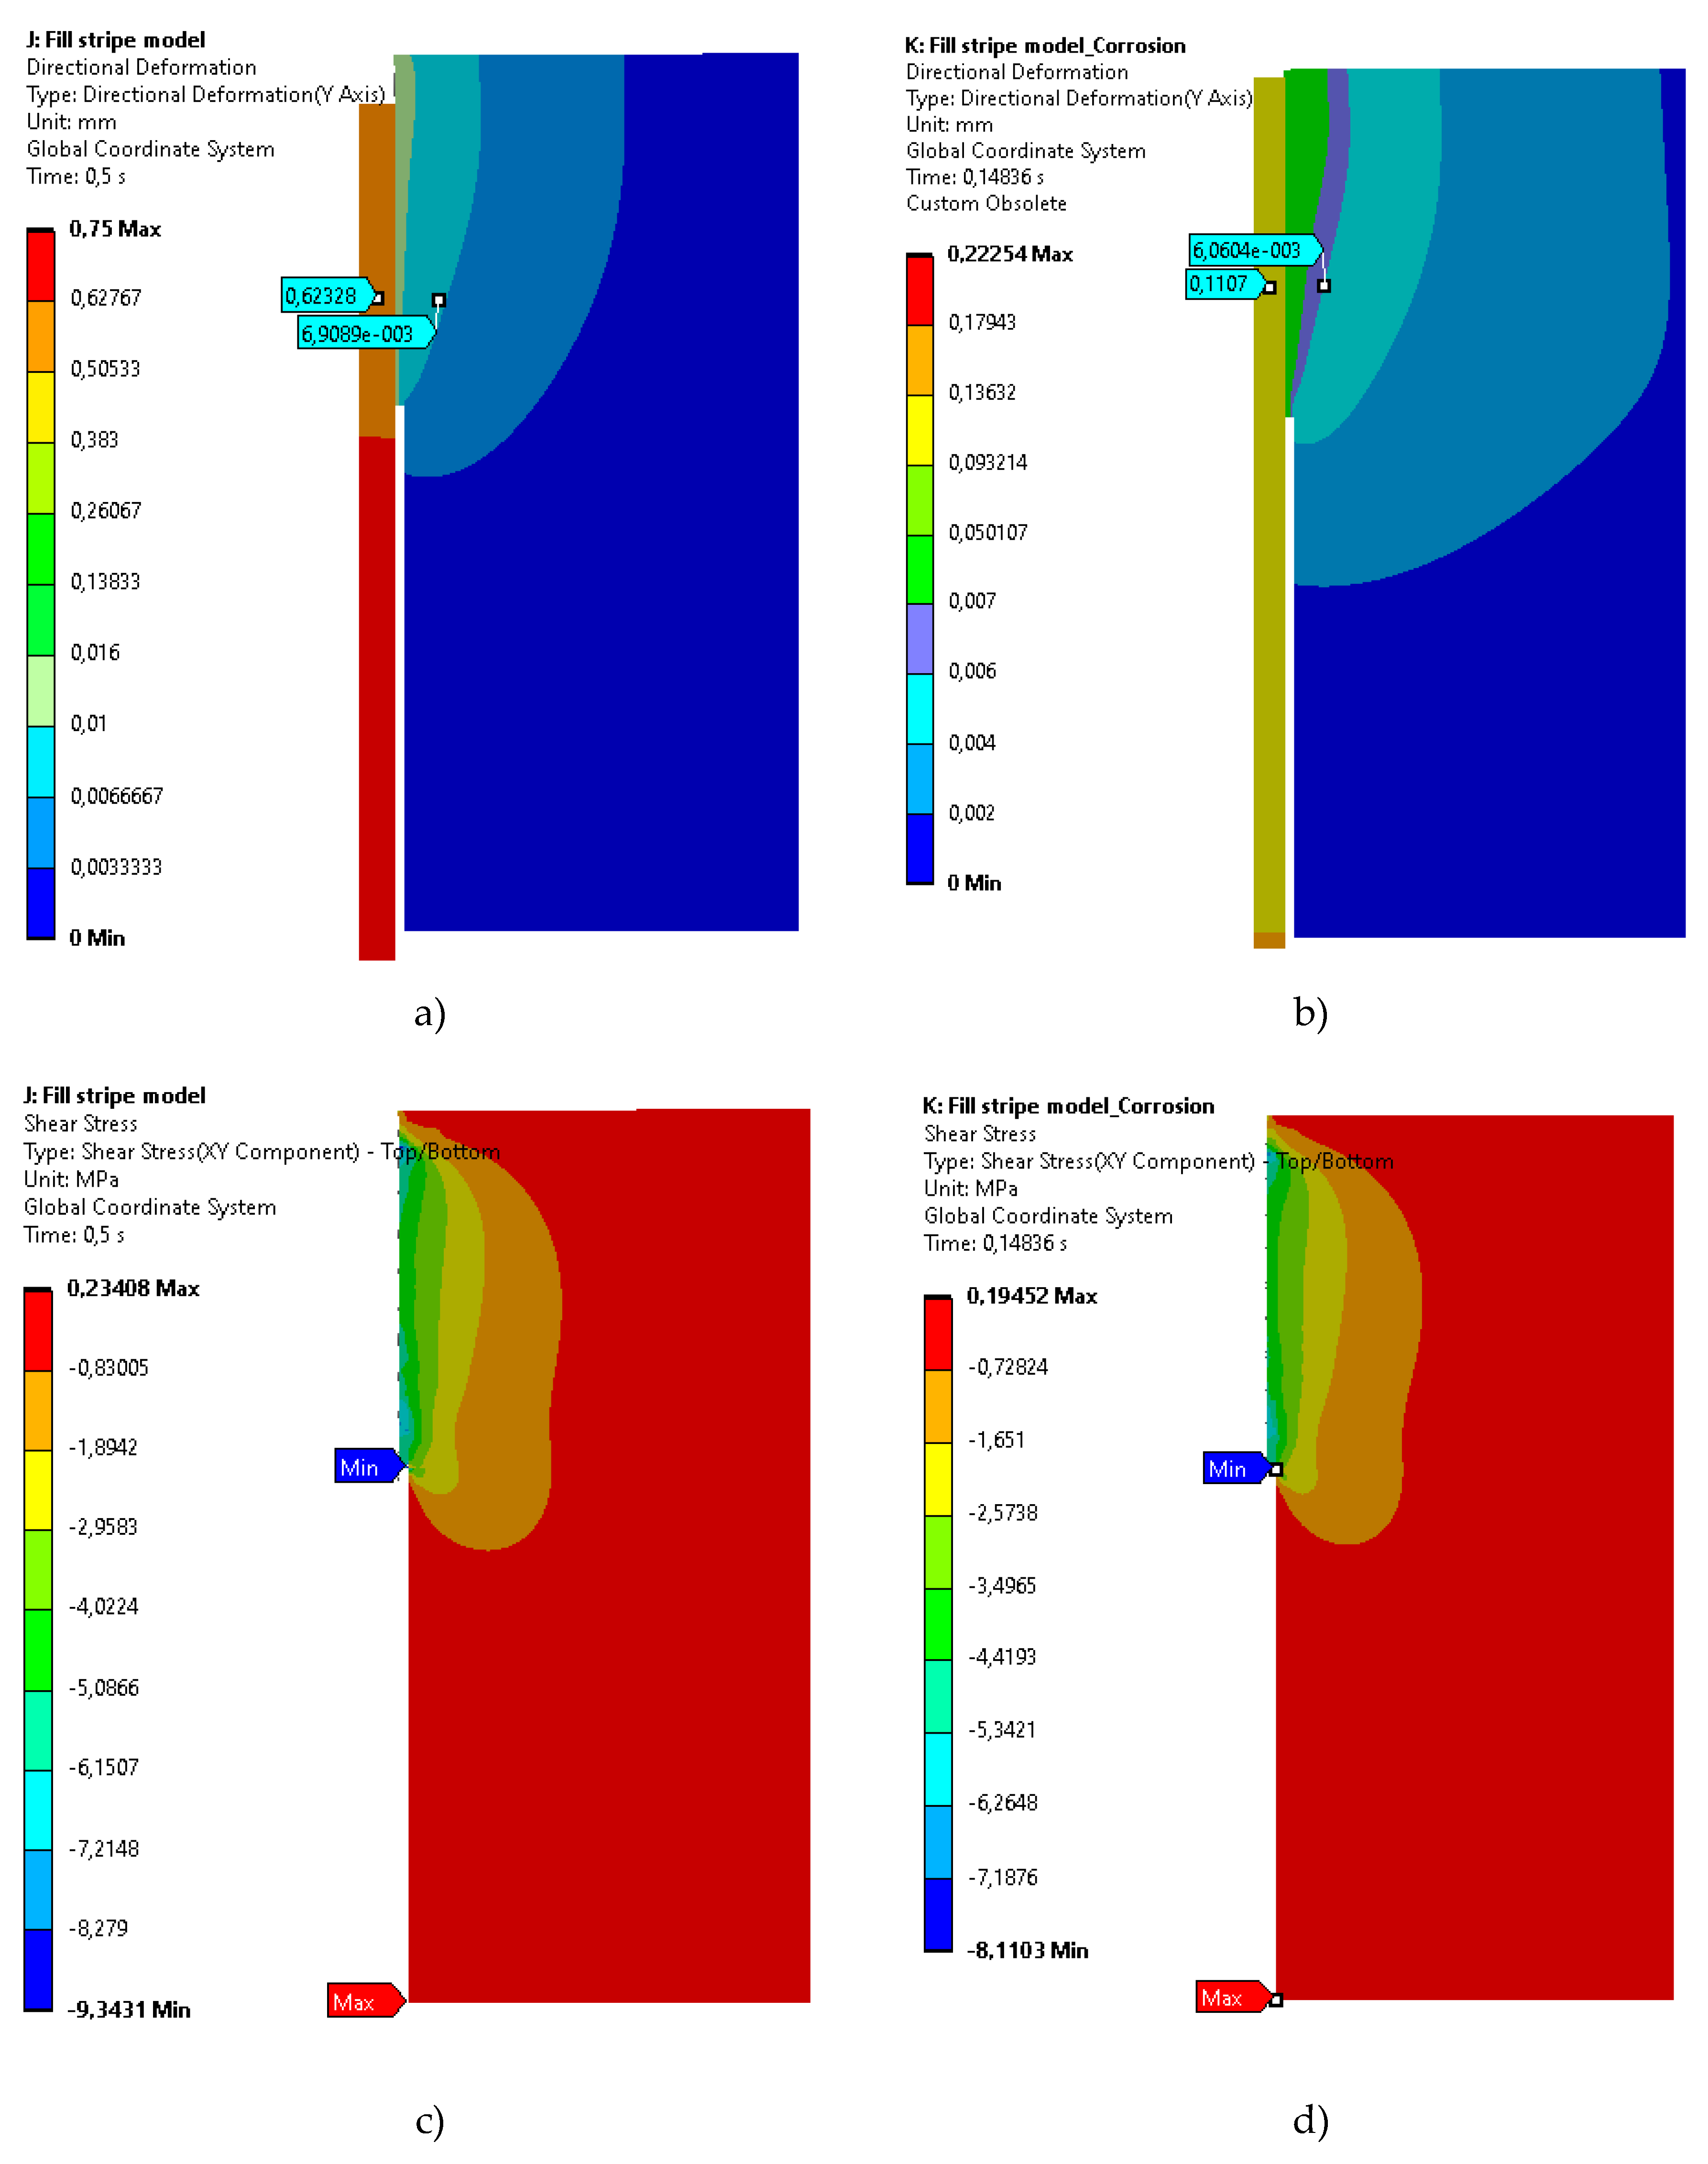
Figure 13.
Comparison of pull-out force from displacement of the lower and upper ends of corroded (a) and undamaged rod (b).
Figure 13.
Comparison of pull-out force from displacement of the lower and upper ends of corroded (a) and undamaged rod (b).
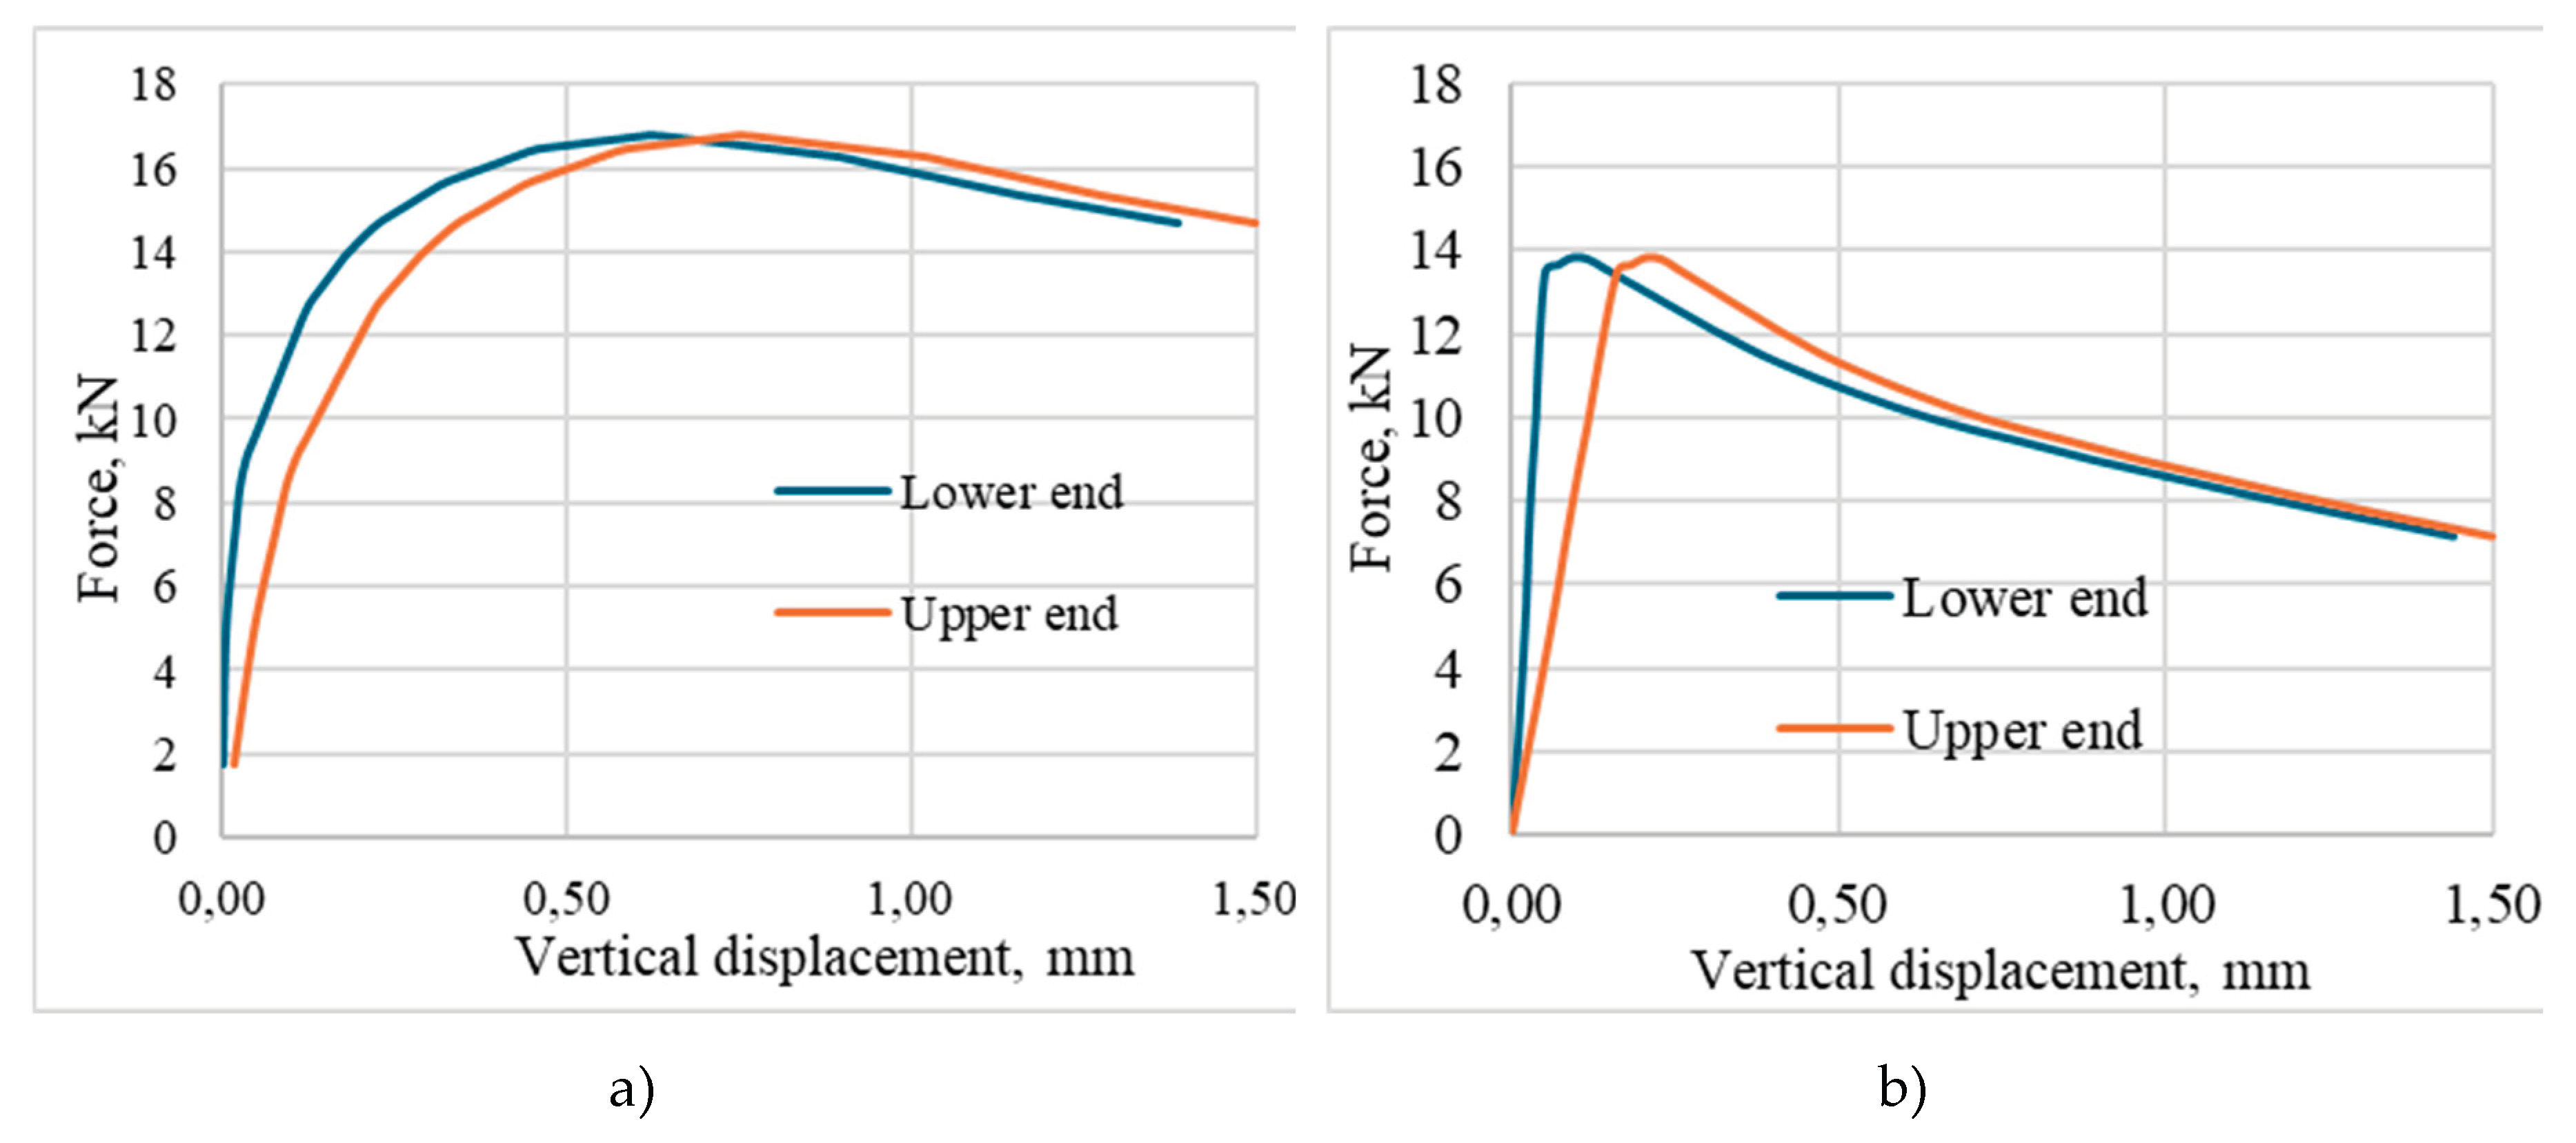

Table 1.
Methods for determining the bond between reinforcement and concrete.
| Authors | A literary source | Method of calculation |
|---|---|---|
| Kholmianskiy M.M. | [4] |
, where and coefficients accepted on the basis of experimental studies. |
| Shima H., Chou L.-L., Okamura H. Micro and Macro Models | [5] | |
| Balázs G.L. |
[6] | |
| CEB-FIP Model Code 90 | [7] |
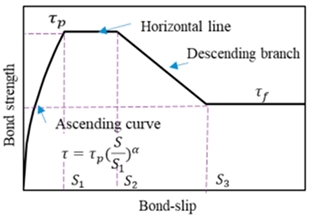 where and are the maximum and residual bond stress, respectively; , , and are the slips at different turning points of the bond-slip curve; and α is an index controlling the shape of the ascending part of the curve. |
| Cruz J.S., Barros J. | [8] |
Modification CEB-FIP Model Code 90, taking into account the nonlinear character of the descending branch of the diagram. |
| G. Rehm | [9] |
, where - the bond stress and the relative slip between reinforcement and concrete, respectively; and a are experimentally identified coefficients. |
| Y.F. Wu, X.M. Zhao | [10] |
where and denote the confinement effect of concrete cover and stirrups, respectively, and the combined confinement effect isgiven by ; and are the strength and cover thickness of concrete,respectively; is the diameter of the longitudinal bars; is thearea of stirrups including all legs; is the number of tensions barsenclosed by stirrups; and is the spacing of stirrups. |
| H.S. Lee, T. Noguchi, F. Tomosawa |
[11] | |
| J.G. Cabrera |
[12] | |
| K.D. Stanish, R.D. Hooton, S.J. Pantazopoulou |
[13] | |
| Y. Yuan, S. Yu, F. Jia, |
[14] | |
| Y. Auyeung, P. Balaguru, L. Chung |
[15] | |
| L. Chung, S.H. Cho, J.H.J. Kim, S.T. Yi |
[16] | |
| L. Chung, J.H.J. Kim, S.T. Yi |
[17] | |
| K. Bhargava, A.K. Ghosh, Y. Mori, S. Ramanujam |
[18] | |
| A.R.L. Kivell |
[19] | |
| H.W. Lin, Y.X. Zhao | [20] |
where |
| ACI Committee 318 | [21] |
where bond strength , quantified herein as an average shear stress acting on the lateral surface of the bar is, apart from initial adhesion , proportional to the normal confining pressure mobilized on the bar over the anchorage. The normal confining pressure comprises contributions from the hoop stresses of the concrete cover , the reaction of stirrups as they cross the splitting plane (calculated as the average normal compressive stress in reaction to the stirrup tensile forces), and any transverse compressive stress field existing in the anchorage zone.Thus, the values of the term taken from the international literature correspond to the product 2μ/π. |
| Hindawi |
[22] |
where is the average bonding strength; is the slip betweenlongitudinal reinforcement and concrete; and are theultimate bonding strength and slip, respectively; is thecracking bonding strength, taking the value of 0,9; isthe cracking slip, taking the value of 0,9; and are the residual bonding strength and the residual slip, respectively; , , and are the slope of the first three stages and could be calculated by the following equations: According to the measured experimental data, the, , , and are fitted as follows: , |
| SP 63.13330 | [23] |
Where - coefficient that takes into account the influence of the type of reinforcement surface; - coefficient taking into account the reinforcement bar diameter; - axial tensile strength of concrete. |
Table 2.
Test results.
| Type of sample | Bar diameter, mm | Maximum load, kN | τmax, MPa | Stress in the bar σ, MPa | Δτ, % | Δσ, % |
| With corrosion | 7,14 | 13,89 | 15,5 | 347,3 | 6,05 | 6,84 |
| No corrosion | 8,12 | 16,83 | 16,5 | 325,1 |
Disclaimer/Publisher’s Note: The statements, opinions and data contained in all publications are solely those of the individual author(s) and contributor(s) and not of MDPI and/or the editor(s). MDPI and/or the editor(s) disclaim responsibility for any injury to people or property resulting from any ideas, methods, instructions or products referred to in the content. |
© 2026 by the authors. Licensee MDPI, Basel, Switzerland. This article is an open access article distributed under the terms and conditions of the Creative Commons Attribution (CC BY) license (http://creativecommons.org/licenses/by/4.0/).
Copyright: This open access article is published under a Creative Commons CC BY 4.0 license, which permit the free download, distribution, and reuse, provided that the author and preprint are cited in any reuse.


