Submitted:
03 February 2026
Posted:
03 February 2026
You are already at the latest version
Abstract
In Mexico, more than 70% of water rights are allocated to agriculture, yet irrigation efficiency remains low, ranging from 40% to 60%. In arid regions of northwestern México and the southwestern United States, prolonged drought, rising temperatures, and elevated evapotranspiration intensify irrigation demand and accelerate depletion of shared transboundary groundwater aquifers, which represent the primary water source for agriculture and communities on both sides of the border. Continued overexploitation threatens the long-term viability of these interconnected systems, underscoring the urgent need for coordinated, binational strategies for sustainable groundwater management. This study presents the implementation of water-saving technologies to enhance irrigation efficiency in small farms within transboundary basins, using Smart Farming Technologies (SFT) and Climate-Smart Agriculture (CSA) approaches. A real-time digital platform was developed to collect soil and atmospheric data through sensors and weather stations connected via a LoRaWAN network. These data were used to estimate localized evapotranspiration and crop-specific water requirements for pecan orchards. By synchronizing irrigation with actual crop water demand, farmers significantly reduced groundwater pumping, energy consumption, and conveyance losses. After five years, water use declined by approximately 60% compared to traditional flood irrigation. Broad adoption of these tools can mitigate transboundary aquifer depletion, strengthen cross-border collaboration, and promote resilient, water-efficient agriculture under increasing climate stress.
Keywords:
smart farming
; transboundary groundwater
; Internet of Things
; Agriculture 4.0
; climate change
; irrigation
1. Introduction
The state of Chihuahua, located in northern Mexico, is the largest producer of pecans [Carya illinoinensis] in the country, with 102 thousand tons (average 1.5 tons per hectare), which represents 65% of total national production and a total value of approximately 627 million dollars [1]. However, pecan trees are also a high water consumption crop, which increases water demands for this economic agricultural activity, requiring as much as 1700 mm of annual evapotranspiration (ET) as it relates to tree age, canopy, soil type, tree density per hectare, and agricultural practices [2,3,4,5,6]. Furthermore, losses in irrigation efficiency in this desert region occur through evaporation, deep percolation, or runoff [7]; whereas the binational region of the Los Muertos/Pluvial Lake Palomas Basin and regions nearby are facing increasing demands for water under stressed climate change conditions, where drought is intensifying, [8]. Therefore, rural communities in Chihuahua are struggling with limited surface water resources for irrigation, which in turn causes demand for groundwater, generating water table depletion while providing for such surface water deficit; in turn, new groundwater resources are demanded while searching for groundwater in a complex geohydrological desert environment [9,10,11]. Thus, water availability and most importantly, groundwater resources for agriculture, will play a significant role in the binational region [12].
Under current drought conditions in northwestern Mexico/southwest US, the situation in the state of Chihuahua is even more critical [13]. According to the North American Drought Monitor, 100% of Chihuahua was under a specific drought category in 2025, with the northwest transboundary region experiencing the most severe conditions [14]. In this region, severe drought affected 48% of the state, and exceptional drought affected another 28% [13]. Furthermore, flash droughts (FDs), which are defined in this paper as intensified, rapid changes in precipitation, temperature, wind, and radiation[15] in the state of Chihuahua, represent an extraordinarily dynamic and potentially devastating climatic phenomenon that emerges with little warning, leading to severe drought conditions within weeks. These conditions are characterized by high temperatures, rapid soil moisture depletion, and increased evapotranspiration (ET), collectively accelerating land drying. Such FDs, particularly when coinciding with heatwaves, can have disproportionate impacts on disadvantaged communities, as seen across many regions of the Global South. Chihuahua, a predominantly semi-arid region, is particularly susceptible to the effects of FDs given its already limited water availability. However, the combination of drought and extreme heat, known as compound heat-flash drought (CHFD) events, can significantly exacerbate constraints on plant photosynthesis due to the strong coupling between soil moisture and temperature [16]. This, in turn, limits ecosystem productivity and exacerbates the vulnerability of local populations and agricultural systems. In terms of socioeconomic impacts, these events can result in significant losses of agricultural land, livestock, and water resources in the region, thereby affecting the food and economic security of communities. Given that Chihuahua is part of the Global South, where the regions most affected by the decline in socio-ecosystem productivity due to CHFDs are located, local and national authorities must focus their efforts on monitoring, predicting, and mitigating the rise of these phenomena to minimize their adverse impacts [16]. Hence, to sustain the pecan industry and maintain productivity under extreme climatic conditions in this transboundary region, greater attention should be given to developing a better understanding of water management strategies for sustainable agriculture and food security [2].
In Mexico, more than 70% of water rights adjudications are destined for agricultural production; however, the efficiency of water use in this sector is relatively low (40-60%) [17]. Moreover, in the Mexican section of this transboundary watershed, nearly 300 groundwater rights adjudications are registered in the Public Registry of Water Rights (REPDA), where most groundwater wells employ inefficient irrigation technologies and draw from low-yielding aquifers [18]. In addition, it has been documented that agricultural water demand will compete with other users under climate change, reducing food production in agricultural areas in the southwestern US and northern México [19,20,21]. Therefore, irrigation scheduling which improves crop water use efficiency (Actual Evapotranspiration ETa) can be estimated while using a specific crop coefficient (kc) and its Reference Evapotranspiration (ET0) for the cultivar under consideration [22]; however, real-time monitoring of water loss due to CHFD throughout the duration of the growing season (DGS) could improve traditional irrigation scheduling while saving a significant volume of water for agriculture while applying a SFT/CSA approach [23]. Nonetheless, managing real-time information for agricultural applications can be challenging, as specialized technologies are required (e.g., computer servers, online connectivity, Internet of Things (IoT), which refers to the hyper connections of devices, sensors, and data storage and transmission tools, soil moisture sensors, remote sensing data, and algorithms). In contrast, vast amounts of digital data are collected to estimate agricultural parameters, which could improve decision-making and reduce farm risks when implemented using machine learning (ML) approaches. Therefore, technology for hosting digital data applied to agricultural practices for water conservation could enable the capture of specific details across different situations during the DGS, thereby improving the selection of solutions that fit complex problems by leveraging the development of various techniques, such as real-time irrigation scheduling [24].
This article aims at two main objectives: (i) to evaluate a methodological framework to implement SFT/CSA in the northwest region of Chihuahua, México; and (ii) to present preliminary results from the placement and operation phase of IoT SFT/CSA as they relate to real-time ET in a pecan orchard. This research is presented as a pilot study designed to share the technology with local small-scale farmers on both sides of the border between Mexico and the USA. We explore the potential benefits of an SFT/CSA approach for reducing water consumption and present our experience implementing these technologies in a drought-stressed binational agricultural region. It is essential to note that a cost-benefit analysis, the socio-economic impacts of such an experience, or an evaluation of farmers' adoption of such an SFT/CSA are not reported; however, this will be addressed in a future paper as the project continues its current evaluation and development.
2. Materials and Methods
2.1. Study Area
The Chihuahuan Desert is a transboundary arid ecosystem located in NW-México and SW-US territory, encompassing the Los Muertos/Lake Palomas Basin (LM/LPB), which lies in Dona Anna County, NM, in the US, and in the Municipality of Ascensión, Chihuahua, México.
Within the LM/LPB, the Palomas-Guadalupe Victoria aquifer (0812) covers an area of 1830 km2 [25], whereas the specific sample data site is located 40 km south of the border region of Columbus, NM, in the United States (Figure 1). The climate of the area is classified according to the Köppen classification, adapted by E. García for the conditions of the Mexican Republic [26]. This region corresponds to climate type BWk(x'), which resembles a very arid, temperate climate, whose general characteristics average an annual temperature between 12º C and 18º C. The coldest month ranges from -3ºC to 18ºC, and the hottest month averages less than 22ºC; precipitation is distributed throughout the year, and winter precipitation is estimated to be greater than 18% of the annual total. For the regional climatological analysis, information from the Ascensión, Palomas, and Bismarck climatological stations, which have records from 1903 to 2008, was used. Based on these datasets, the average annual precipitation in the study area is approximately 318 mm. The average annual temperature is 17.3 °C and exhibits a parabolic pattern, with higher values in May, June, July, August, and September and lower values in the remainder of the year. The lowest recorded temperatures occur in December, January, and February, whereas potential evaporation is 1686 mm/year [25]. For this research, climatological data from the weather station at Rancho El Regalo (RER) located at the study site were used to formulate calculations with data for the period from 2021 to 2025.
2.2. Socioeconomic Assessment with an Emphasis on Uses of Groundwater for Agriculture
A socioeconomic assessment with an emphasis on the uses of groundwater for agriculture in the Palomas-Guadalupe Victoria aquifer (0812) was based on data from the Public Register of Water Rights (REPDA) up to the year 2021, where land tenure and equity in the allocation of water rights adjudication volumes to different groundwater users were used to calculate the Gini Index [27]. To obtain the population of the study area, data from the Population and Housing Censuses [28] were used. These datasets are comprehensive, periodic studies that collect demographic, socioeconomic, and housing information on Mexico's population at a specific point in time. Identification of groundwater wells and their allocated water volumes were obtained from the Public Register of Water Rights (REPDA) provided by Conagua for the Palomas-Guadalupe Victoria aquifer (0812). This data, updated as of December 31, 2021, provided details on the geographic locations of groundwater wells, the purposes of water use, the allocated pumping volumes per well, and the groundwater adjudication permits. Additionally, a Geographic Information System (GIS) running under ArcGIS Pro was used as the primary tool for processing and analyzing the collected data. In the initial stage, the data were converted from XLS to SHP format to determine the distribution and concentration of groundwater wells and population, as well as their relationships with other geospatial elements [29].
Using these data, the second stage of the process involved determining per capita groundwater availability in the Palomas-Guadalupe Victoria aquifer. Several key elements were considered for this calculation. First, the total amount of available groundwater equals the sum of all allocated groundwater volumes. This was essential to have an accurate estimate of the amount of groundwater available based on hydrologic mass balance; second, the total population represents the number of people living in the region that comprises the study area, based on current and reliable demographic data, to reflect the current population; third, the consistent units for the amounts of water and population were expressed in the same units so that the calculation made sense. Water volumes are typically expressed in cubic meters (m³) or liters, and population refers to the total number of people living in the region under consideration. And finally, the basic calculation was based on the total amount of available groundwater and the total population, usage, and distribution factors. This included the amount of groundwater allocated to different uses, such as agriculture, industry, and domestic consumption. Once the elements were obtained, the calculation was carried out following the formula in eq. 1.
Groundwater availability per cápita=(Total amount of available water)/(Total population)
This calculation yielded an average value indicating the amount of water available to each person within the aquifer area. However, it is essential to recognize that groundwater availability is not the only factor in assessing water security; other factors, such as water quality, the sustainability of water sources, and the effective management of water resources, must also be considered.
2.3. Commitment to Our Work
Within the study area, most withdrawals from aquifer 0812 are for irrigated agriculture, whereas a minimum amount is for domestic purposes [30,31]. The absence of a Smart Farming Technologies (SFT) and Climate-Smart Agriculture (CSA) approach to improve water efficiency in irrigation practices is common in this transboundary watershed. Furthermore, many pecan orchards in this region use flood irrigation, which is inefficient and wasteful. At the same time, other farmers have lost their production potential due to drought and water scarcity, with groundwater depletion threatening their investments. This is relevant to a holistic, common strategy for groundwater sustainability in this binational region, as similar challenges are occurring on the US side at the Los Muertos Basin, where the Mimbres aquifer system is located. In this aquifer, it has been documented that over the past 40 years, the water table has declined close to 27 m in this region, resulting in changes to the transboundary water table surface [32]. Furthermore, extensive research has documented the need for binational groundwater information, with substantial evidence supporting the transboundary characteristics of these aquifer systems, particularly with respect to groundwater flow connections, which have been recognized by the International Shared Aquifer Resources Management Agency (ISARM). For example, the research region receives groundwater flow from the Las Palmas and Palomas-Guadalupe Victoria aquifers, which highlights the importance of ensuring sustainable groundwater use on both sides of the US-Mexico border [33].
The farm where the research site of this paper was established comprised a 4-ha parcel, planted in January 2020 in a 10 m by 10 m tree distribution, with a micro-sprinkler irrigation system at a flow rate of 36 lph. Hence, evaluating evapotranspiration (ET) and soil moisture at pecan orchards is a constant necessity among farmers in northern México to improve irrigation efficiencies and protect binational water resources, which are subjected to intense demands for agricultural production, where pecan trees are one of the most extensively cultivated crops due to their profitability and long-term agricultural advantages.
The need to implement water-saving irrigation technologies while managing real-time digital data (e.g., climatic temperatures and soil moisture) and to apply a Smart Farming Technologies/Climate-Smart Agriculture (SFT/CSA) approach at the farm is relevant to the future of agriculture in this binational region. SFT/CSA is a new approach to agricultural production that uses real-time monitoring, gathering digital data to address the need for in-farm information to support decision-making for small-scale farmers [23]. Furthermore, the use of digital data in agriculture can play an important role when real-time monitoring practices are applied to evaluate soil moisture, soil temperature, and soil salinity, as well as changes in climatic temperatures to monitor climatic conditions for in situ decision-making at the farm, thereby estimating evapotranspiration (ETP) and other crop parameters, such as crop coefficients (Kc). These technical practices for collecting digital data can improve water efficiency and provide cloud-based internet support for real-time information transfer to farmers and for research and academic purposes. These datasets can be used to model irrigation schedules, fill gaps in real-time information, complete the loop of necessary inputs for real-time irrigation scheduling, and support water conservation and decision-making at the farm. Furthermore, the online availability of digital data can be used to compare and evaluate binational regional climate changes and agricultural water demands, and to assess the implementation of such SFT/CSA approaches on both sides of the border.
This research addressed the lack of scientific research and strengthened different research lines aligned with these interests to promote water conservation, binational data sharing, and the use of real-time digital data in agriculture. This is a multiyear project (10 years) managed on an annual basis, during which planned tasks will be carried out once all computers and sensors are installed and connected to the cloud. We also expect multiannual results from the different stages of the project, including data collection and processing. Installing digital piezometric dataloggers for groundwater monitoring, continuing to install soil moisture sensors to assess water availability at sites with changing soil textures, and expanding the use of automated micro-irrigation (drip) systems to improve water-use efficiency are part of the project's ongoing agenda. Digital data can play an important role in real-time monitoring of soil degradation, transboundary groundwater depletion, and climatic conditions to support in situ decision-making at the farm.
2.4. Data Collection and Processing Procedures
Pecan trees are one of the most important crops in northern Mexico, with annual acreage increments above other types of crops. To help reduce the challenges of producing more food with fewer resources, especially water, in situ monitoring is a key tool for evaluating potential solutions in these rural communities, which face significant criticism for their high-water consumption in pecan production. Therefore, IoT capacity at the farm is essential for implementing and enhancing technological solutions. In México, the approach towards humanitarian technology (innovation for all) is considered an important factor to support the implementation of such SFT/CSA approach. Therefore, addressing the technological burden of adopting real-time digital data in agricultural practices and training small farmers to adopt technology holistically are essential to the success of agriculture. Practical applications of capturing digital data at the research site of this study will significantly contribute to a cloud-based “Data Lake” for agricultural production, benefiting the farms surrounding the site. Such a vision requires computing capacity and real-time solutions to enhance the regional economy and, most importantly, to improve family income among local farmers, thereby reducing the gap between farm investments and productivity. However, at the research site, demand for irrigation water for pecan orchards has increased significantly over the past 20 years, whereas irrigation practices remain deficient due to limited or nonexistent irrigation technologies. Irrigation scheduling is a key tool for water-efficient agricultural practices; therefore, it is important to estimate real-time ETP using meteorological data and to install tensiometers to measure soil moisture and map soil physical parameters. In this project, these data were available via a cloud-based protocol for accessing modeling results after real-time regional ETP and Kc were estimated, and the preliminary results were shared with local farmers. Computer-based tools and cloud computing were used to develop the model for real-time ETP and Kc estimates, which was improved while integrating computer programming protocols, enhancing the data architecture while “cleaning data” through an ETL (Extraction-Transformation-Loading) process was applied while managing our integrated data base from the “Data Lake” reservoir and using an SQL protocol while running descriptive and predictive analysis to our process.
Additionally, agroclimatology enabled the prediction of the behavior of climatological variables and their effects on agricultural production, thereby facilitating decision-making. These practices, such as managing irrigation schedules and estimating crop water stress, help improve water-use practices while pursuing SFT/CSA. To estimate reference evapotranspiration (ET0), Hargreaves and Samani [34] developed an equation (Eq. 2) using minimum climatological data, accounting for variations in temperature and the solar radiation value (R0). For this purpose, climatological “data lakes” generated at the Rancho El Regalo (RER) climatological station were used, as well as a network of humidity and temperature sensors installed in the pecan orchard located at the research site.
ET0 = 0,0135 KT (Tmed + 17,78) R0 * (Tmax - Tmin) 0,5
Subsequently, Eq. 2 was considered using 0.162 as the coefficient of transpiration (KT) value for inland regions, following the modification proposed by Allen and accepted by Samani [36]. Values for solar radiation (R0) were taken from the extraterrestrial solar radiation table, using the average range value for latitudes between 30° and 32°, in the Northern Hemisphere [37], obtaining the results of the ET0 for the years 2021, 2022, and 2023 from Eq. 2. In addition, other climatological variables, such as precipitation and relative humidity, were examined to identify trends in their relationships with ET0.
The RER meteorological station collected daily data at 5-minute intervals, and maximum (Tmax) and minimum (Tmin) temperatures were monitored daily from January 2021 to December 2025, contrasting the official temperature estimations for the region [26] (Garcia, 2004). Climatological data were obtained from a Davis Vantage Pro meteorological station, which provided precipitation and potential evapotranspiration (ETo) data, which were calculated using the Penman-Monteith formula, as specified in Manual 56 of the FAO [36]. During this period, the temperature at the RER station where the research site is located averaged –2.7 °C in winter, and the highest temperatures were recorded in July, peaking at 37 °C (Figure 2).
For this study, daily values and monthly average ET0 were estimated for digital data transfer and administration. ETL and SQL protocols were developed to enhance the project's “Data Lake” infrastructure. A web page built using the Things Board protocol displayed real-time soil humidity, salinity, and temperature (http://tablero-agroia.iinia.center:8080/login).
The study covered a total area of 4 ha, with two wired tensiometers distributed according to soil texture types at depths of 25 cm and 45 cm (in this area, 375 two-inch-diameter pecan trees were established in 2021 with 10 m x 10 m spacing). ETP calculations using the Penman-Monteith and Hargreaves-Samani Equations [5] were incorporated into an algorithm to support real-time ET calculation. Additionally, digital piezometric sensors were installed at nearby wells within the watershed to monitor and evaluate groundwater depletion, thereby informing future transboundary management of the binational aquifers. Equipment with cutting-edge technology was installed in 2020 for real-time monitoring of soils irrigated under a TORO® microsprinkler system (36 lph); while measurements of evapotranspiration (ETP) and atmospheric conditions at the pecan orchard were done with a Davis Weather Station®, two LSE01 Dragino sensors (Dragino Technology Co., LTD.) were installed at depths of 25 cm and 45 cm which collected data every 20 minutes measuring soil temperature (°C), available soil moisture (%) and soil electric conductivity (Us/cm). The sensors employ the FDR (Frequency-Domain Reflectometry) method to measure the soil's dielectric constant. The sensors were calibrated according to Hrisko methodology [37], which enabled calibration of the volumetric humidity of the field-collected sample at the specified depths against the sensor voltage using a linear equation. The sensors were installed on November 15, 2023, and collected daily data until Dec 30, 2025.
To visualize real-time soil moisture, temperature, and salinity using the Internet of Things (IoT), Dragino sensors were placed at strategic locations within the pecan orchard with greater canopy homogeneity. The sensor data was transmitted 100 m to the LG308 Dragino gateway, enabling connection to the server, and an integration with the Dragino Sensor platform was established to view the data in real time on the Things Board internet platform.
Crop evapotranspiration (ETc) was estimated through the variation in soil moisture, without the presence of rain. Since the sensor collects information every 20 minutes, it was decided to average over the period from 24:00 to 14:00, as mentioned by Rashid and Jia (2019). The formula for estimating the ETc is the following Eq 3.
ETc: is the daily crop evapotranspiration (mm); Zri: is the depth of the sensor (mm); ∆SWCi: is the variation of the sensor humidity (%); and ∆t: is the validation time (one day).
Estimation of the crop coefficient and its relationship with remote sensors was calculated using equation 4, where Kc is the crop coefficient; ETc is the crop evapotranspiration calculated with Eq. 3 (mm d-1), and ETo is the potential reference evapotranspiration measured with climate data from the RER meteorological station and Eq.2.
Data for the ETc calculation were collected with the RER weather station at the research site, whereas ETc (Crop Evapotranspiration) is crop-specific and represents the water needed by a specific crop and is used for scheduling irrigation, calculating crop water requirements, and water management by multiplying ETo by a crop coefficient (Kc) (Eq. 5).
ETc= ETo x Kc
3. Results
Results indicate that, in the 5th year of the study, water savings exceeded 50% relative to traditional flood irrigation practices in the region (Table 1). Furthermore, farmers are becoming familiar with this technology and are interested in implementing these tools in their own orchards. Continuous monitoring enabled us to understand water demand in the pecan orchard as trees mature and begin nut production; this will require more water as they become economically viable, producing more with less water resources. For calibration of the soil moisture sensors and measurement of crop evapotranspiration, the sensors detected trends in soil water content during the established period (Figure 3), with a high correlation (R2 = 0.99), indicating a compatible soil moisture monitoring system. This correlation indicated that the sensors were measuring the correct soil moisture at the field where they were installed, which had a sandy loam soil texture, primarily sand (typically <35%) with significant silt and some clay. This information enabled irrigation scheduling and monitoring of plant stress due to soil moisture deficiency in the field, while controlling water availability between the permanent wilting point and field capacity without overwatering, thereby avoiding inefficiencies in water application to the orchard (Figure 4).
The results of the calculated crop evapotranspiration (ETc) and estimated reference evapotranspiration (ETo) are presented in Figure 5 and show a downward trend of mm/day in the winter months and an upward trend until July-August, consistent with the development of the tree's foliage. ETo (Reference Evapotranspiration), which is climate-driven, represents the atmospheric demand for water based solely on climate factors (sun, wind, humidity). This analysis quantifies the amount of moisture the air absorbs, estimates the general drying power of the atmosphere, and indicates that compound heat-flash drought (CHFD) events are particularly water-demanding for the crop. These findings are relevant to planning irrigation schedules using the generated data and to applying an SFT/CSA approach.
The calculated Kc is shown in Figure 6, which indicates maximum values ranging from 1.0 to 1.3 from April to August, like those reported by Escalante et al. (2004) for the same species (black dots in Figure 6). These Kc values were used to estimate pecan orchard-specific water requirements throughout the growing season, accounting for differences in plant morphology, physiology, and growth stages relative to the reference crop when planning irrigation schedules. The irrigation schedule used for this specific real-time Kc is shown in Table 1 and Figure 7, with an IoT display of soil moisture during a period when irrigation was applied.
The net irrigation depth per irrigation applied under an SFT/CSA approach is compared with traditional irrigation schedule shows the advantage of estimating irrigation calendars while using digital data to calculate crop water consumption and potential savings with significant difference of water demand on the orchard (Table 1).
The theoretical model clearly outlines the four classic phenological stages of the crop. An initial Kc of approximately 0.3 is observed, corresponding to the dormancy and bud break stage, dominated by soil evaporation, and an average Kc that reaches a plateau of 0.92 during the stage of maximum leaf cover and fruit filling. Analysis of the observed data reveals two distinct patterns: Low demand stages (Initial and Final). There is a high correlation between the observed values and the theoretical curve during the winter and autumn months (January-March and October-November). The low dispersion suggests that the water balance adequately captured actual evapotranspiration, which is primarily driven by soil evaporation. Significant variability is observed during the development and mid-growth stages, particularly in the summer months (June-September). Negative deviations (Kc < 0.6 in June-July) suggest possible episodes of water stress that limit crop transpiration to levels below theoretical potential. Conversely, outliers exceeding 1 (Kc > 1.0 in August) are likely attributable to errors in estimating deep drainage after precipitation events, resulting in an overestimation of water consumption in the mass balance.
4. Discussion
Groundwater is the most important natural resource in northern México, where transboundary aquifers are located, and these water resources are naturally shared with neighboring users along the border. Furthermore, groundwater use for agricultural purposes is relevant to economic and social development; conserving and efficiently using groundwater is important. Measuring real-time ETP to determine the exact amount of water plants use during their growing season is a relevant activity that requires specialized tools and skills that farmers typically lack on-site. In this report, we used technological tools to measure soil moisture and to regulate irrigation scheduling, thereby reducing water consumption in a pecan orchard. However, greater water savings were achieved by directly measuring ETP and soil moisture, estimating water consumption during the growing season, and providing the plant with the specific amount of water as it developed. Reducing the applied water volume to plants based on actual measurements of moisture loss due to compound heat-flash drought (CHFD) events and changes in temperature during the growing season, reduced pumping hours at groundwater wells, while lowering the amount of water applied to the orchard. Even though the reference pecan orchard is in its middle stage of maturity (5 years), the practice of measuring real-time ETP and soil moisture to estimate water loss and calculate the specific amount of water to be applied according to the irrigation schedule during the growing season has reduced the water demands by more than 50% without affecting its vegetative development.
Furthermore, increasing the number of irrigations while reducing the hours of irrigation has helped reduce stress on trees that had to endure excess saturation or the permanent wilting point stage while waiting for the next scheduled irrigation. This, in turn, helped maintain the soil in a field capacity stage, providing water to the root zone while allowing pore space to fill with sufficient oxygen for the trees to develop successfully, thereby reducing irrigation water use. Visualizing soil moisture evolution enables real-time decision-making to improve irrigation and save water, thereby reducing production risks. Access to this information while using the IoT platform represented a considerable advance over traditional methods for field decision-making, in which the opportunity to save irrigation water is often constrained by the farmer's experience. However, soil moisture content varies with soil texture, which in turn varies across fields; hence, calibrating soil moisture sensors is essential when using the technology to improve irrigation water efficiency. Moreover, installing computer facilities on the farm is not straightforward, not to mention expensive. However, Internet connections are widely accessible throughout México; therefore, the region of influence of the computer facilities in the study area has a radius of approximately 5 km. This provides sufficient signal strength to receive and process soil-sensor signals from nearby irrigation fields, potentially helping to save irrigation water on those fields. For digital data sharing among project colleagues, Internet access to the RER weather station and to soil moisture sensor data was granted by sharing the IoT link and password, enabling visualization of real-time measurements of soil moisture, soil temperature, and soil salinity.
5. Conclusions
The need to integrate SFT/CSA technologies in the process of food production is an undisputable necessity to make agricultural activities a viable, scalable and effective approach to a sustainable pathway to help reduce water consumption while promoting the improvement of irrigation efficiency. This in turn promotes groundwater conservation in transboundary, drought-prone regions such as northwestern Chihuahua, México, and the southwestern United States. The integration of combined technology tools such as the implementation of real-time soil moisture sensors, localized climatic data, Internet of Things (IoT) infrastructure, and evaporation-based irrigation scheduling, such as the work presented on this study, can help on addressing the structural inefficiencies occurring on traditional irrigation practices in the research region. Preliminary results of this research from a five-year pilot study implemented on a pecan orchard within the Palomas-Guadalupe Victoria Aquifer have improved irrigation water savings above 50% compared to the traditional volume use with flood irrigation without applying an SFT/CSA approach for water conservation. These savings could be achieved when irrigation decisions are aligned with actual crop water demands rather than fixed schedules or from empirical experience alone. The practice of automated continuous monitoring of soil moisture adding real-time estimation of reference and crop evapotranspiration (ETo and ETc) allows for a more frequent and flexible irrigation schedule but with smaller volumes, keeps soil moisture near a stage of field capacity avoiding both water stress and excessive saturation. This in turn will not only reduce groundwater pumping but will be also related to the associated energy consumption supporting healthy vegetative development during the different growing stages on the orchard showing how water conservation can be achieved without compromising productivity.
We have also generated a localized database of the estimated crop coefficients (Kc) for arid and semi-arid environments derived from our measurements showing how the observed seasonal dynamics of Kc values were fluctuating in accordance with the established phenological patterns in the pecan orchard with deviations from the associated compound heat-flash droughts (CHFD) events which are representative of extreme summer conditions. These findings reinforce the value of real-time, site-specific monitoring to adjust irrigation management where extremely variable climatic conditions are a factor if the limitations of generalized or statistical coefficients are not representative for a specific region. Furthermore, we also highlight the emphasis of the broader socio-environmental relevance the application of SFT/CSA for transboundary aquifer has, such as in the study area where agriculture remains as the main economic activity in which groundwater is the key source of water and where well permits are unevenly distributed and aquifer depletion threatens long-term water scarcity for all users, including agriculture and domestic uses. Therefore, while improving irrigation efficiency represents a “win-win” strategy since it reduces pressure on shared groundwater resources while promoting economic resilience of small farmers which in turn show a growing interest in understanding and adopting such technologies where the transfer and capacity building can play a crucial role in scaling up water-saving practices.
We also demonstrated the feasibility of data sharing through a cloud-based structure for binational collaboration between project partners where the use of a IoT platform allowed for the sharing of digital “data-lakes” with real-time access to climatic and soil moisture information, promoting transparency and sharing of learning experiences while generating comparative analysis across the U.S.-México border. These data sharing infrastructures promoted not only on-site decisions, but also evaluated regional water planning options, groundwater monitoring and the development of cooperation and coordination strategies for the regional transboundary aquifer. Nonetheless, even though the results are promising, there remain several limitations. We still need to evaluate the economic cost and benefits while adopting the technology, as well as the long-term impact on yields and farm profitability and the social factors that might influence farmers from accelerating the adoption of SFT/CSA tools, since soil heterogeneity and soil sensor calibration might be important for site-specific implementation and technical support. Future research should therefore focus on comprehensive cost-specific analysis, adoptions of technology dynamics, and the integration for evolving into a machine learning and artificial intelligence scenario to further automate irrigation scheduling and predict with more accuracy on water stress under evolving climatic scenarios.
Data-driven irrigation management while implementing real-time decision-making through SFT/CSA is a powerful tool and strategy to address groundwater depletion, to evaluate climate variability, and to promote agricultural sustainability in transboundary arid ecosystems. Drought frequency, heat extremes, intensification of climate change and water competition will demand investments in smart irrigation technologies, hands-on farmer training, and cross-border collaboration will be crucial to ensure resilient food production systems and long-term sustainability of shared groundwater resources.
Author Contributions
Conceptualization, A.G-O. and J.M. R-Z; methodology, A.G-O, R.H and V.M. S-A; software, J.M. R-Z and V.H. E-C.; validation, A. G-O, L.C. B-P, R.H., and F.A. V-G; formal analysis, A. G-O, C.M. S-A, C.B. and R.H; investigation, A. G-O, L.C. B-P, V.M. S-A.; resources, A.G-O.; data curation, A.G-O, V.M.S-A., L.C.B-P; writing—original draft preparation, A.G-O.; writing—review and editing, A.G.O., L.C.B-P, V.M.S-A, C.B., A.F., F.A.V-G, J.M.H., W.L.H., L.C.A-C, R.H., I. A-B; visualization, A.G-R., C.B., L.C.B-P.; supervision, A-G-O.; project administration, A.G-O.; funding acquisition, A.G-O. All authors have read and agreed to the published version of the manuscript.
Funding
This research received external funding from the landowner of the research site for the installation of the computer center where digital data were hosted, as well as for Internet connections, and for soil sensors acquisition.
Data Availability Statement
Meteorological data was gathered from the local climate station at the Rancho El Regalo, as well as the soil moisture, soil temperature and soil salinity data were collected from the installed sensors at the same location and downloaded from the following site: http://tablero-agroia.iinia.center:8080/dashboards.
Acknowledgments
Publication of this manuscript was supported by Maria T. Aragonez-Levario, owner of the property where the research was carried out. We appreciate her support and guidance during the field work. Any use of trade, firm, or product names is for descriptive purposes only and does not imply endorsement by the U.S. Government.
Conflicts of Interest
The authors declare no conflict of interest. The property owner had no role in the design of the study; in the collection, analyses, or interpretation of data; in the writing of the manuscript, or in the decision to publish the results.
References
- SIAP, ‘Datos Abiertos Estadística de Producción Agrícola’, Servicio de Información Agroalimentaria y Pesquera.
- E. Mokari, Z. Samani, R. Heerema, and F. Ward, ‘Evaluation of long-term climate change impact on the growing season and water use of mature pecan in Lower Rio Grande Valley’, Agric. Water Manag., vol. 252, pp. 1–6, Mar. 2021. [CrossRef]
- Z. Samani, S. Bawazir, R. Skaggs, J. Longworth, A. Piñon, and V. Tran, ‘A simple irrigation scheduling approach for pecans’, Agric. Water Manag., vol. 98, no. 4, pp. 661–664, Feb. 2011. [CrossRef]
- Z. Samani, ‘ESTIMATING SOLAR RADIATION AND EVAPOTRANSPIRATION USING MINIMUM CLIMATOLOGICAL DATA’, 2000.
- G. H. Hargreaves, Z. A. Samani, and A. Abstract, ‘Reference Crop Evapotranspiration from Temperature’, 1985.
- S. Miyamoto, ‘Consumptive Water Use of Irrigated Pecans’, 1983.
- Z. Samani, A. Cheraghi, and L. Willardson, ‘WATER MOVEMENT IN HORIZONTALLY LAYERED SOILS’.
- W. L. Hargrove et al., ‘The future of water in a desert river basin facing climate change and competing demands: A holistic approach to water sustainability in arid and semi-arid regions’, J. Hydrol. Reg. Stud., vol. 46, Apr. 2023. [CrossRef]
- A. Granados-Olivas et al., ‘Groundwater Prospecting Using a Multi-Technique Framework in the Lower Casas Grandes Basin, Chihuahua, México’, Water (Basel)., vol. 15, no. 9, p. 1673, Apr. 2023. [CrossRef]
- C. I. Romero Gameros, A. Granados Olivas, O. F. Ibáñez Hernández, and M. Herrera Mercado, ‘Evolución piezométrica del acuífero Palomas-Guadalupe Victoria (0812) en la cuenca baja del río Casas Grandes, Ascensión, Chihuahua, México’, TECNOCIENCIA Chihuahua, vol. 15, no. 2, pp. 62–75, Sep. 2021. [CrossRef]
- Granados-Olivas and R. Corral-Diaz, ‘Fracture trace and alignment analysis for groundwater characterization of a non-karst arid environment in the Chihuahuan Desert, Mexico’, IAHS-AISH Publication, no. 278, 2003.
- Rawling Geoffrey, ‘Water level trend analysis: Mimbres Basin, New Mexico’, New Mexico Bureau of Geology and Mineral Resources, pp. 1–3, Nov. 2021, Accessed: Apr. 07, 2024. [Online]. Available: https://geoinfo.nmt.edu/geoscience/research/home.cfml?id=96.
- 2024 CONAGUA, ‘Monitor de Sequia en México (MSM)’.
- NOAA National Centers for Environmental Information, ‘North America Drought Monitor’.
- NOAA, ‘National Integrated Drought Information System’.
- L. Gu et al., ‘Flash drought impacts on global ecosystems amplified by extreme heat’, Nat. Geosci., vol. 18, no. 8, pp. 709–715, Aug. 2025. [CrossRef]
- CONAGUA, ‘Estadísticas del Agua en México’, Mexico City, 2021.
- CONAGUA, ‘Estadísticas del Agua en México’, Mexico City, 2021.
- W. L. Hargrove et al., ‘The future of water in a desert river basin facing climate change and competing demands: A holistic approach to water sustainability in arid and semi-arid regions’, J. Hydrol. Reg. Stud., vol. 46, Apr. 2023. [CrossRef]
- W. L. Hargrove and J. M. Heyman, ‘“Borders” as a metaphor in implementing large-scale, holistic water sustainability research’, J. Soil Water Conserv., vol. 79, no. 2, pp. 23A-26A, Mar. 2024. [CrossRef]
- de Fraiture and D. Wichelns, ‘Satisfying future water demands for agriculture’, Agric. Water Manag., vol. 97, no. 4, pp. 502–511, Apr. 2010. [CrossRef]
- Z. Samani, S. Bawazir, R. Skaggs, J. Longworth, A. Piñon, and V. Tran, ‘A simple irrigation scheduling approach for pecans’, Agric. Water Manag., vol. 98, no. 4, pp. 661–664, Feb. 2011. [CrossRef]
- G. Adamides et al., ‘Smart farming techniques for climate change adaptation in Cyprus’, Atmosphere (Basel)., vol. 11, no. 6, Jun. 2020. [CrossRef]
- U. Sarkar, G. Bannerjee, S. Das, and I. Ghosh, ‘Artificial Intelligence in Agriculture: A Literature Survey’, 2018. [Online]. Available: www.ijsrcsams.com.
- CONAGUA, ‘ACTUALIZACIÓN DE LA DISPONIBILIDAD MEDIA ANUAL DE EL ACUIFERO PALOMAS-GUADALUPE VICTORIA (08-12), ESTADO DE CHIHUAHUA’, 2024. Accessed: Apr. 18, 2024. [Online]. Available: https://sigagis.conagua.gob.mx/gas1/Edos_Acuiferos_18/chihuahua/DR_0812.pdf.
- E. Garcia, ‘Modificaciones al sistema de clasificacion climatica de Koppen’, Instituto de Geografía Universidad Nacional Autónoma de México , vol. 1, no. 6, pp. 1–97, 2004, Accessed: Apr. 18, 2024. [Online]. Available: http://www.publicaciones.igg.unam.mx/index.php/ig/catalog/view/83/82/251-1.
- G. Aguilar-Gutiérrez, ‘Why inequality declined in Mexico? Analysis with Gini, Mehran and Piesch Indexes, 2000-20121’, Economia, Sociedad y Territorio., vol. XVI, no. 52, pp. 557–590, 2016, Accessed: Jul. 29, 2024. [Online]. Available: chrome-extension://efaidnbhttps://www.scielo.org.mx/pdf/est/v16n52/2448-6183-est-16-52-00557.pdf.
- INEGI, ‘Census of Population and Housing (CPV) 2020’.
- A. F. B. , & N. J. A. B. Puyol, ‘ Water availability in Mexico’s future.’, Ciencia 44(8), 2007.
- 2024 CONAGUA, ‘Base de datos del REPDA’, https://www.gob.mx/conagua/acciones-y-programas/consulta-la-base-de-datos-del-repda.
- R. Sanchez et al., ‘Binational reflections on pathways to groundwater security in the Mexico-United States borderlands’.
- Rawling Geoffrey, ‘Water level trend analysis: Mimbres Basin, New Mexico’, New Mexico Bureau of Geology and Mineral Resources, pp. 1–3, Nov. 2021, Accessed: Apr. 07, 2024. [Online]. Available: https://geoinfo.nmt.edu/geoscience/research/home.cfml?id=96.
- R. Sanchez, V. Lopez, and G. Eckstein, ‘Identifying and characterizing transboundary aquifers along the Mexico–US border: An initial assessment’, J. Hydrol. (Amst)., vol. 535, pp. 101–119, Apr. 2016. [CrossRef]
- E. Garcia, ‘Modificaciones al sistema de clasificacion climatica de Koppen’, Instituto de Geografía Universidad Nacional Autónoma de México , vol. 1, no. 6, pp. 1–97, 2004, Accessed: Apr. 18, 2024. [Online]. Available: http://www.publicaciones.igg.unam.mx/index.php/ig/catalog/view/83/82/251-1.
- Z. Samani, ‘ESTIMATING SOLAR RADIATION AND EVAPOTRANSPIRATION USING MINIMUM CLIMATOLOGICAL DATA’, 2000. Accessed: Mar. 31, 2024. [Online]. Available: https://ascelibrary.org/doi/abs/10.1061/(ASCE)0733-9437(2000)126:4(265).
- R. G. . Allen, Crop evapotranspiration : guidelines for computing crop water requirements. F.A.O., 2000.
- J. Hrisko, ‘Capacitive Soil Moisture Sensor Theory, Calibration, and Testing’, 2020. Accessed: Aug. 16, 2024. [Online]. Available: chrome-extension://efaidnbhttps://static1.squarespace.com/static/59b037304c0dbfb092fbe894/t/5f02675438bdf707c8e35042/1593993282390/capacitive_soil_moisture_sensors_joshua_hrisko.pdf.
Figure 1.
Location of the Palomas-Guadalupe Victoria Aquifer (0812) and specific sample data site in the study area.
Figure 1.
Location of the Palomas-Guadalupe Victoria Aquifer (0812) and specific sample data site in the study area.
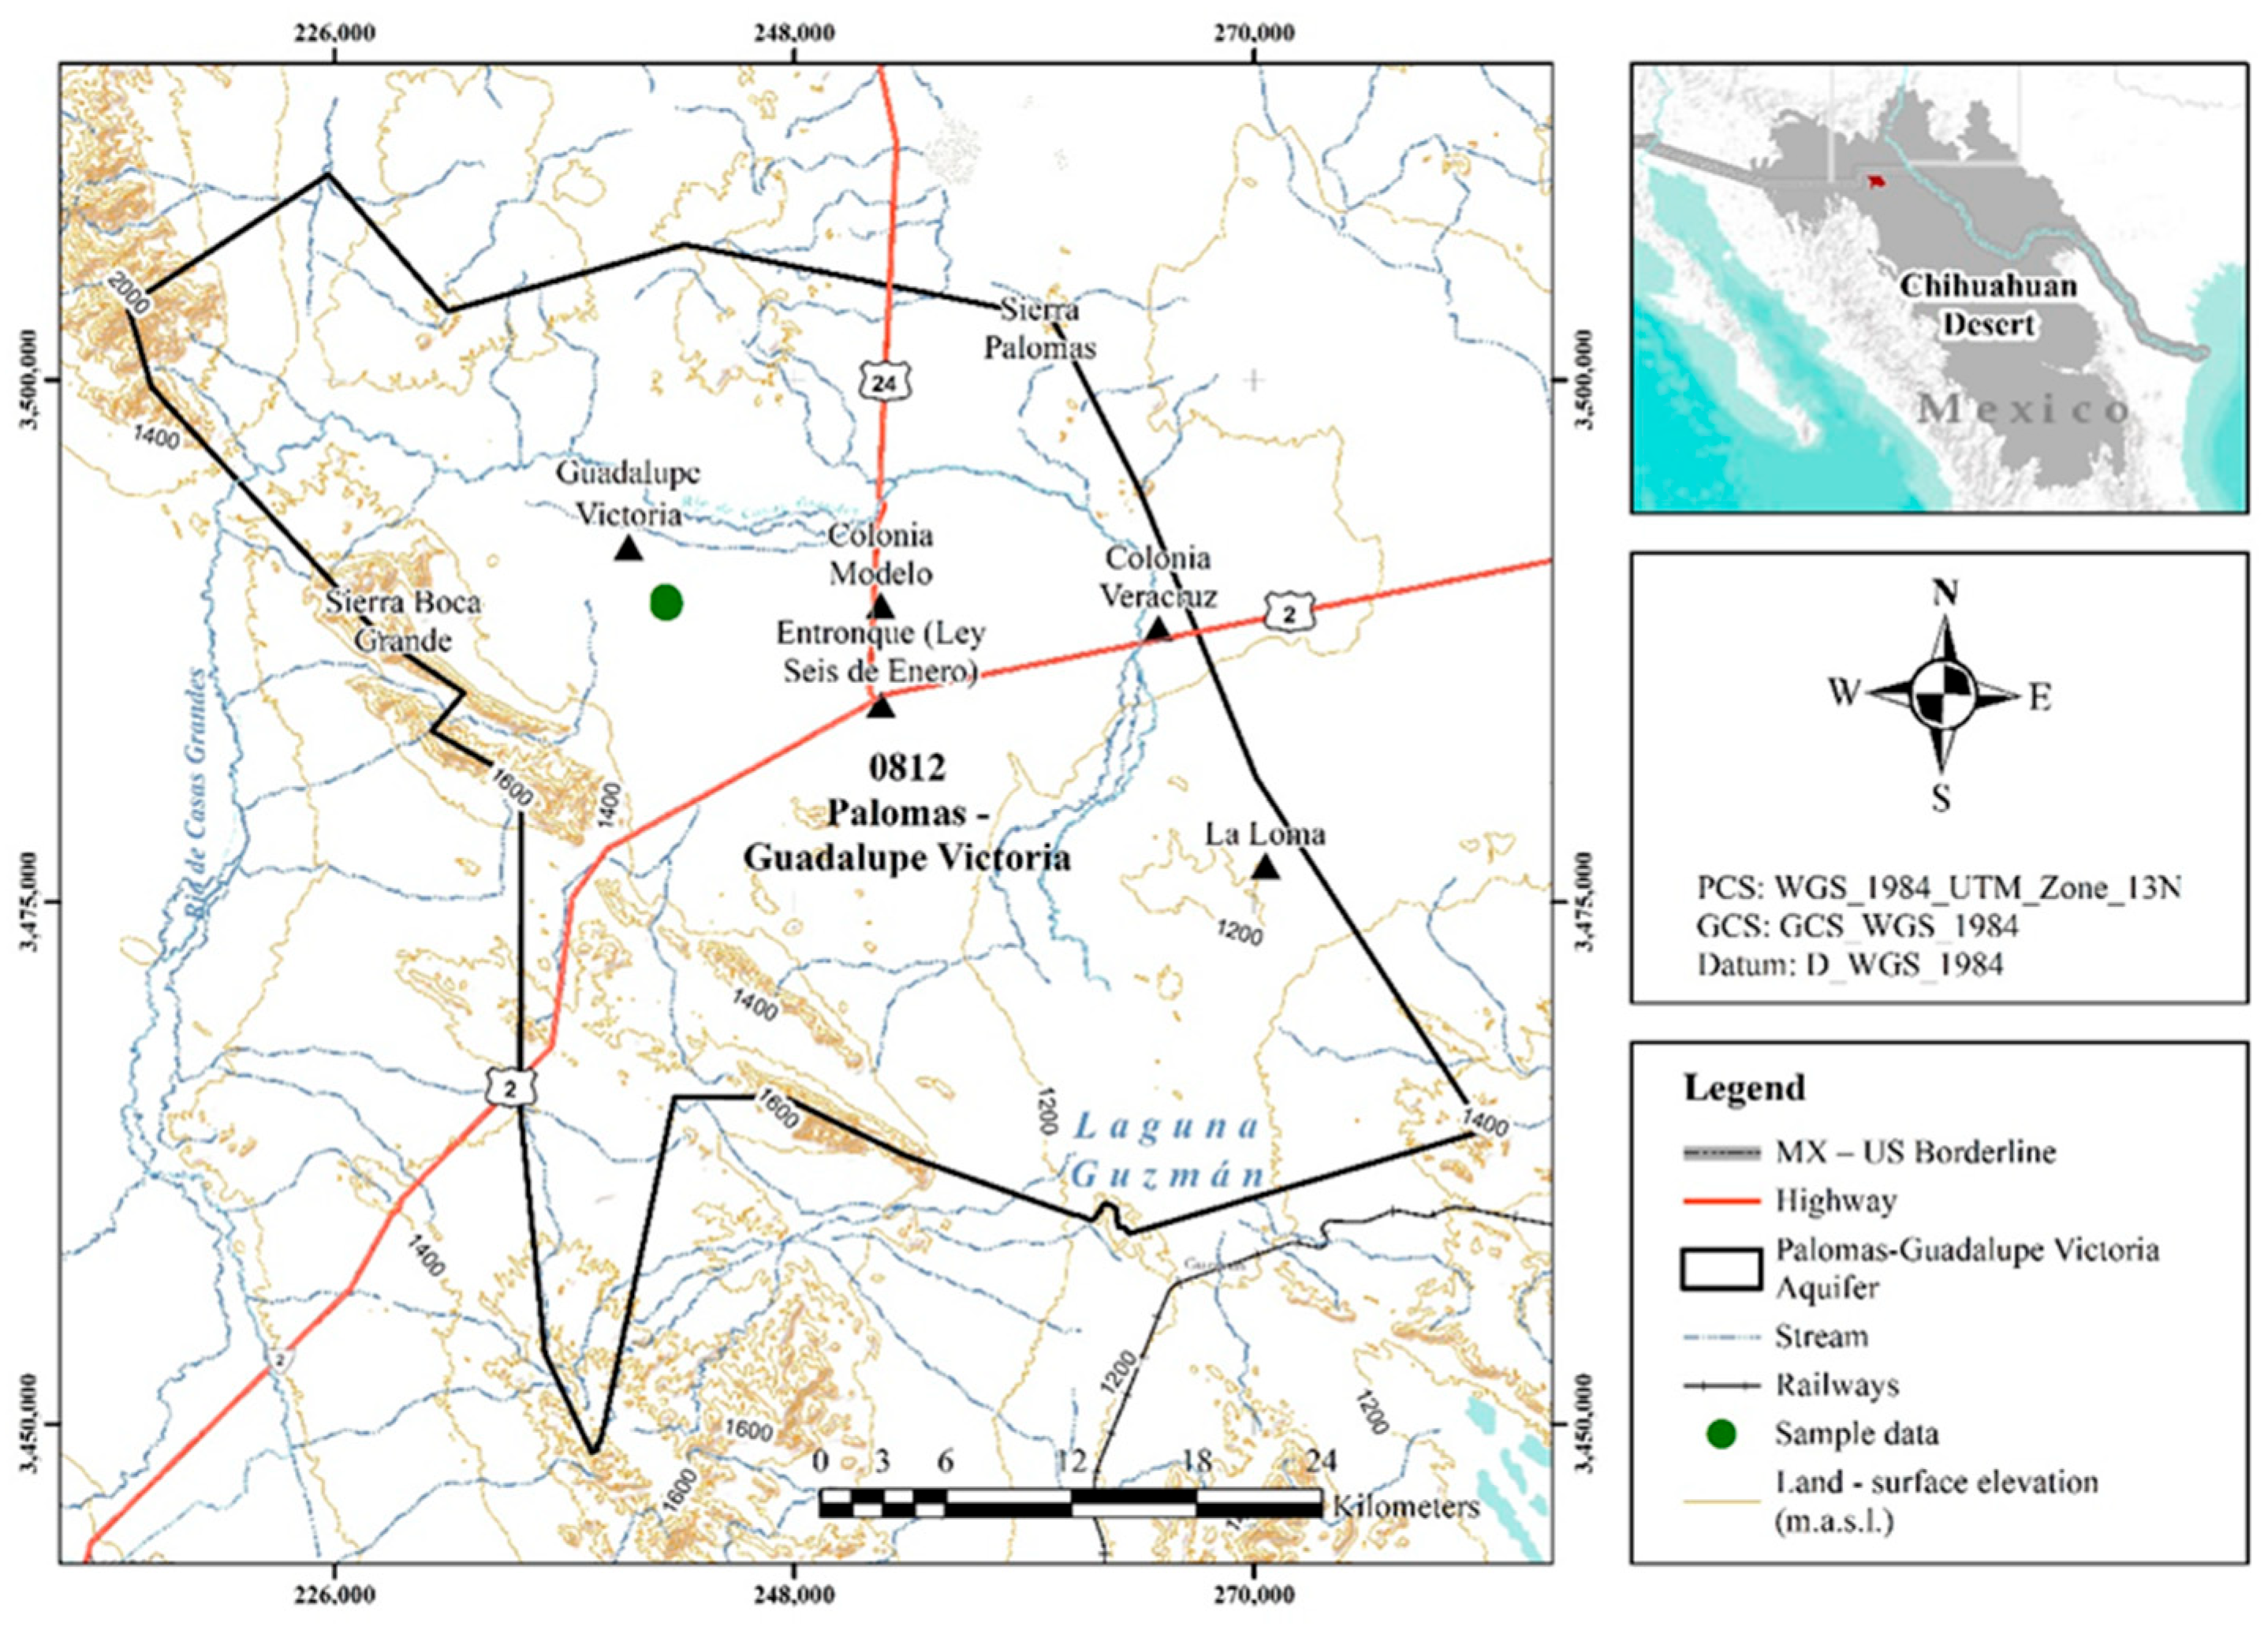
Figure 2.
RER weather station with temperatures registered during the monitoring period from January 2021 to December 2025.
Figure 2.
RER weather station with temperatures registered during the monitoring period from January 2021 to December 2025.
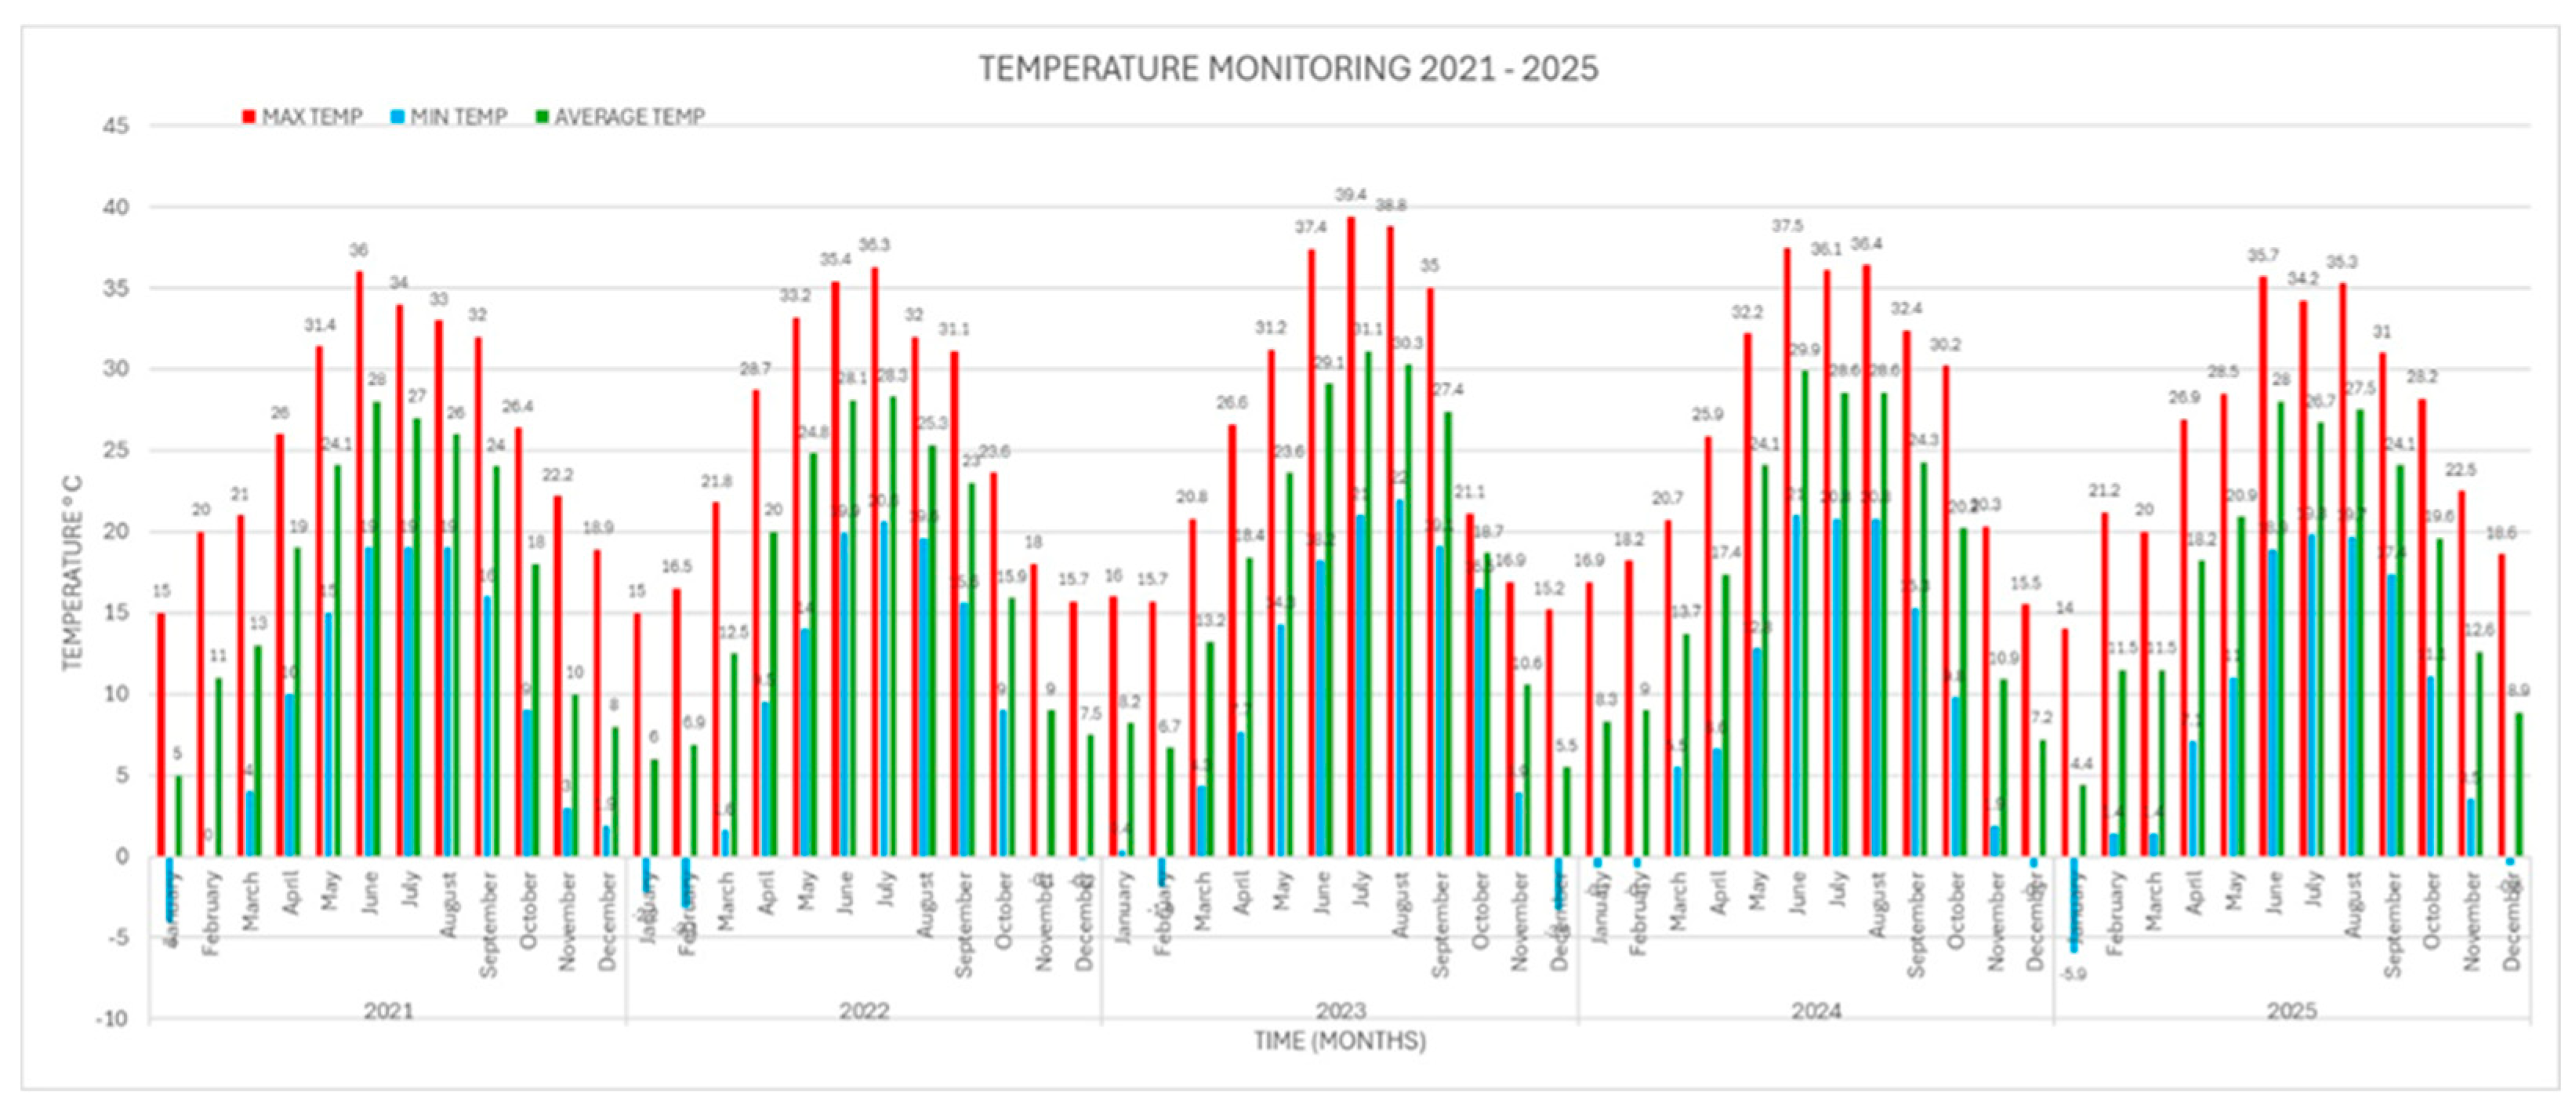
Figure 3.
Linear relationship between sensor reverse voltage and soil volumetric water content.
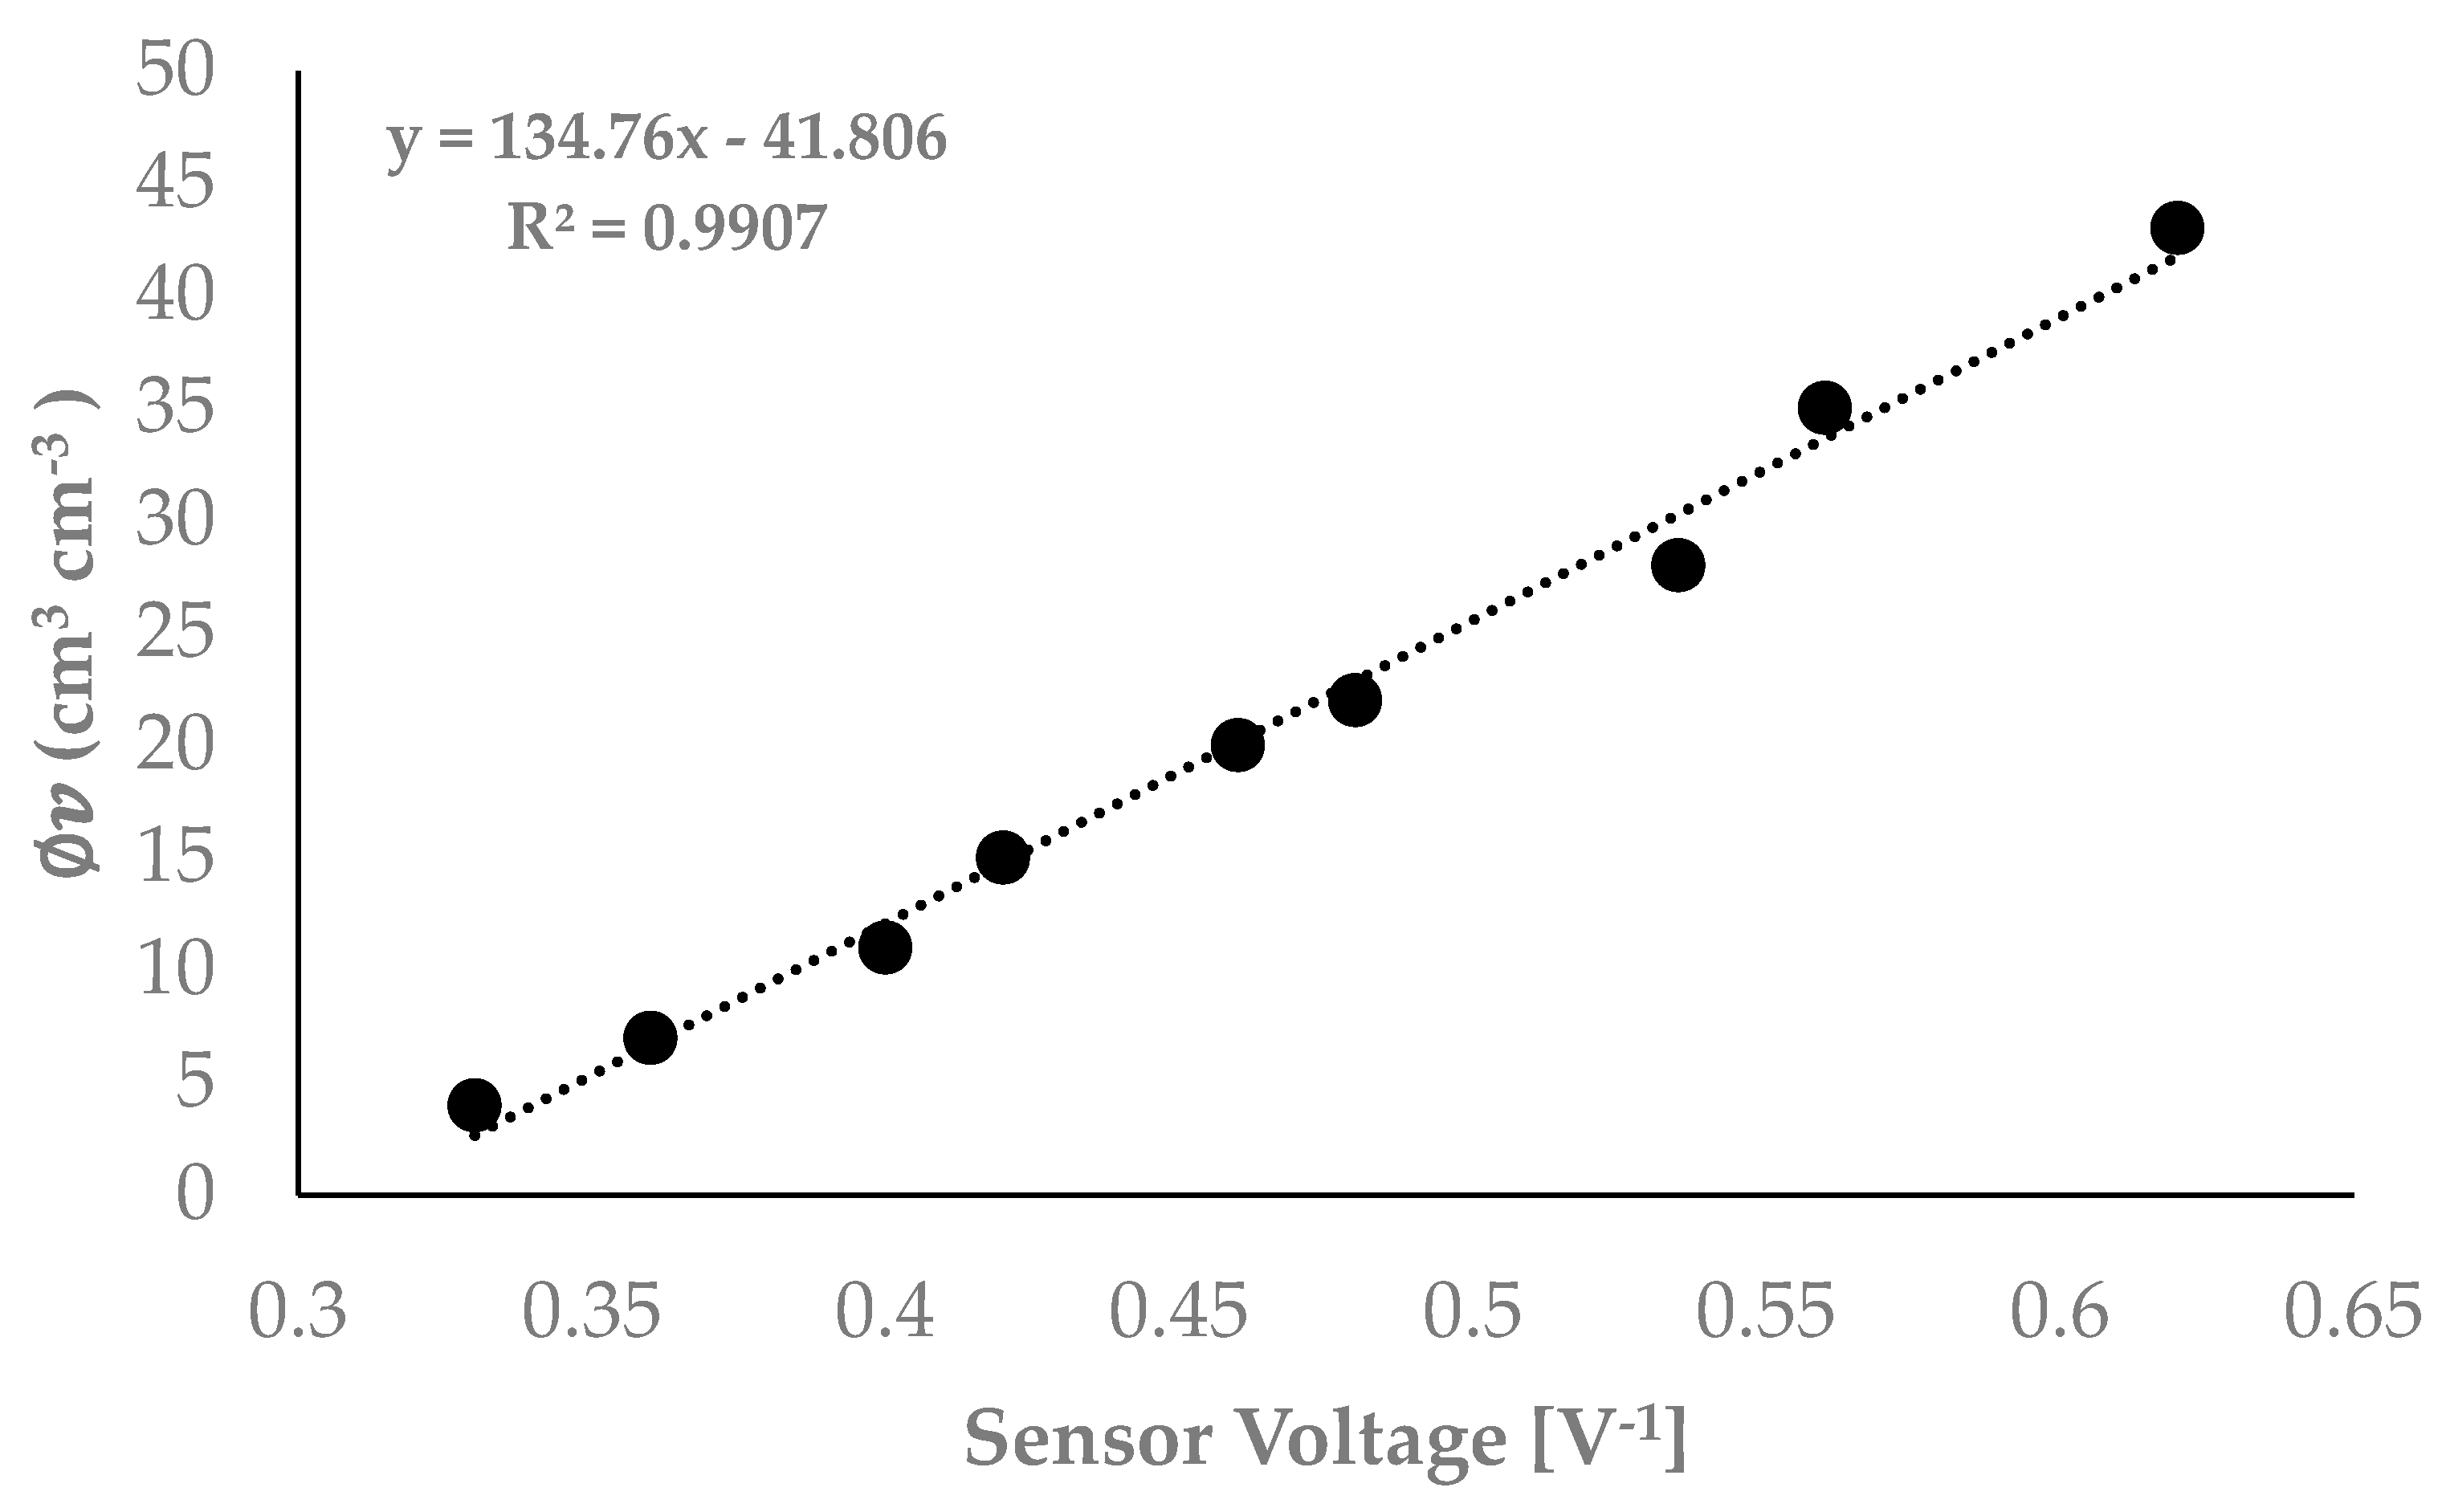
Figure 4.
Percentage of soil humidity (Y axis) and irrigation frequency (X axis) are compared between traditional furrow and microsprinkler irrigation, with Saturation Point (SP), Field Capacity (FC), and Permanent Wilting Point (PWP) expressed as percentages of soil humidity for a sandy loam texture. The brown zigzag line represents a more frequent but lower-volume irrigation schedule to sustain FC.
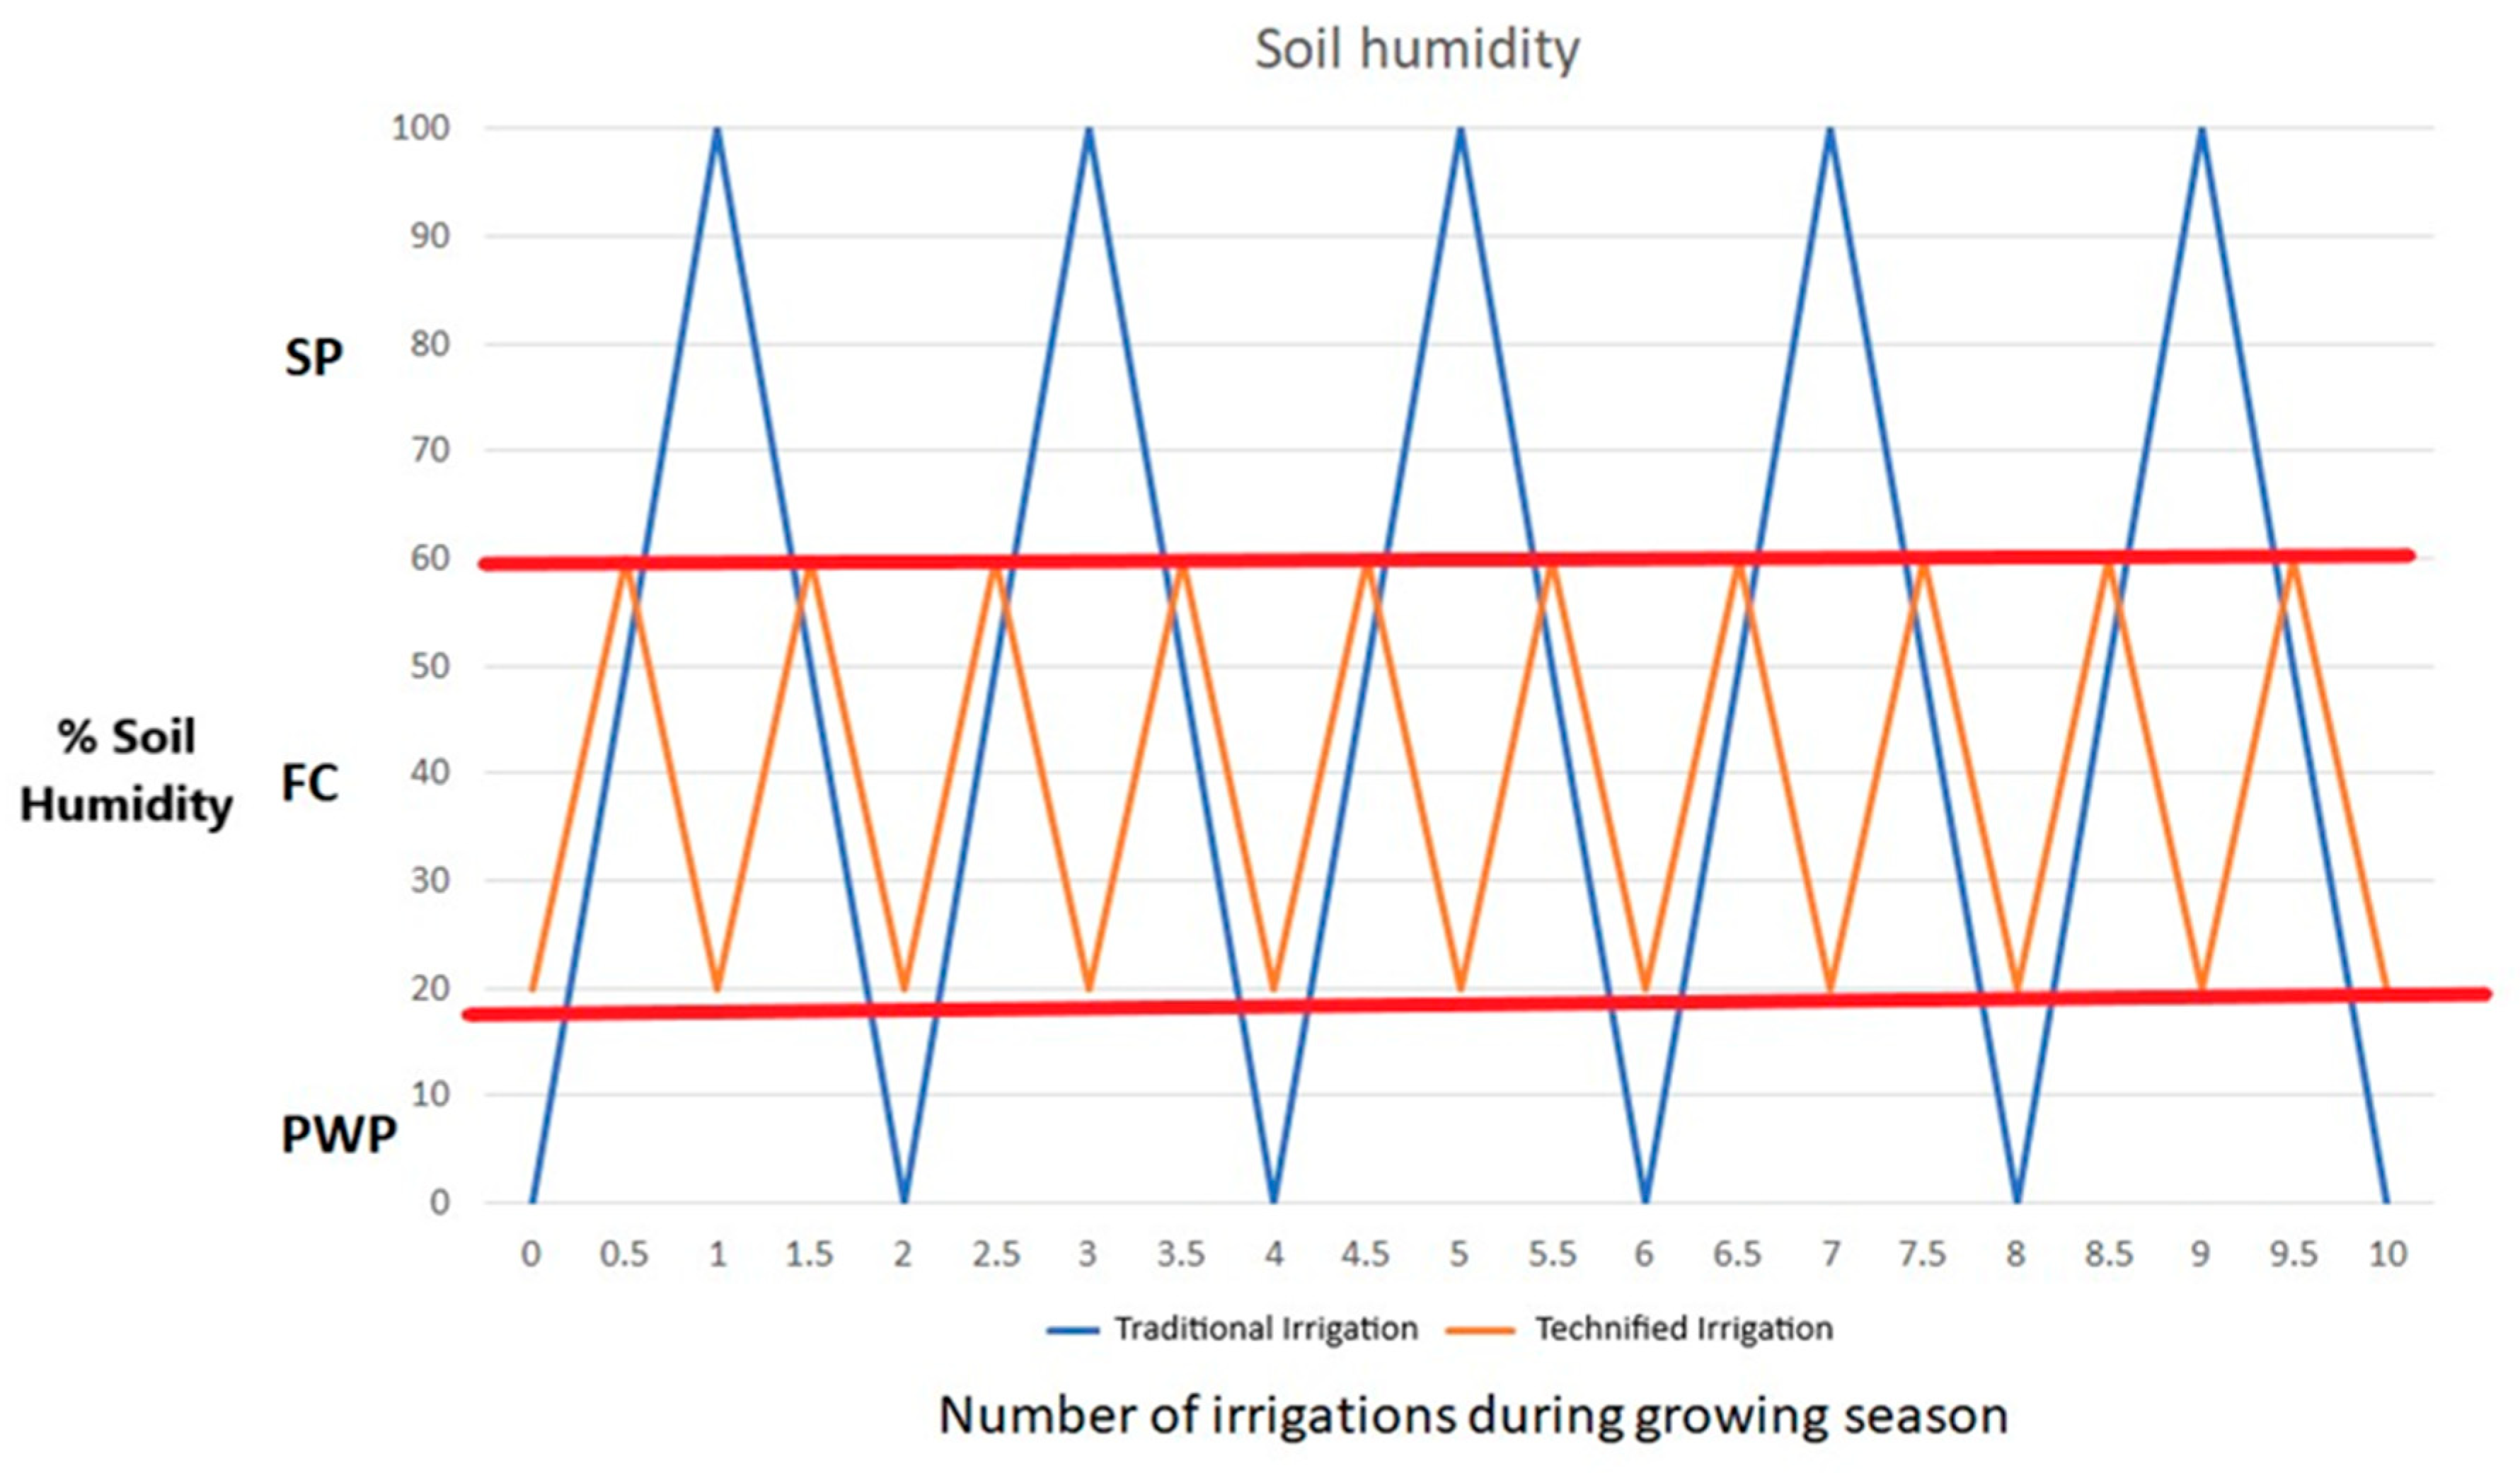
Figure 5.
Trend estimated between reference evapotranspiration (ETo) and crop evapotranspiration (ETc) for the year 2024.
Figure 5.
Trend estimated between reference evapotranspiration (ETo) and crop evapotranspiration (ETc) for the year 2024.

Figure 6.
Estimation and projection of the crop coefficient (Kc).
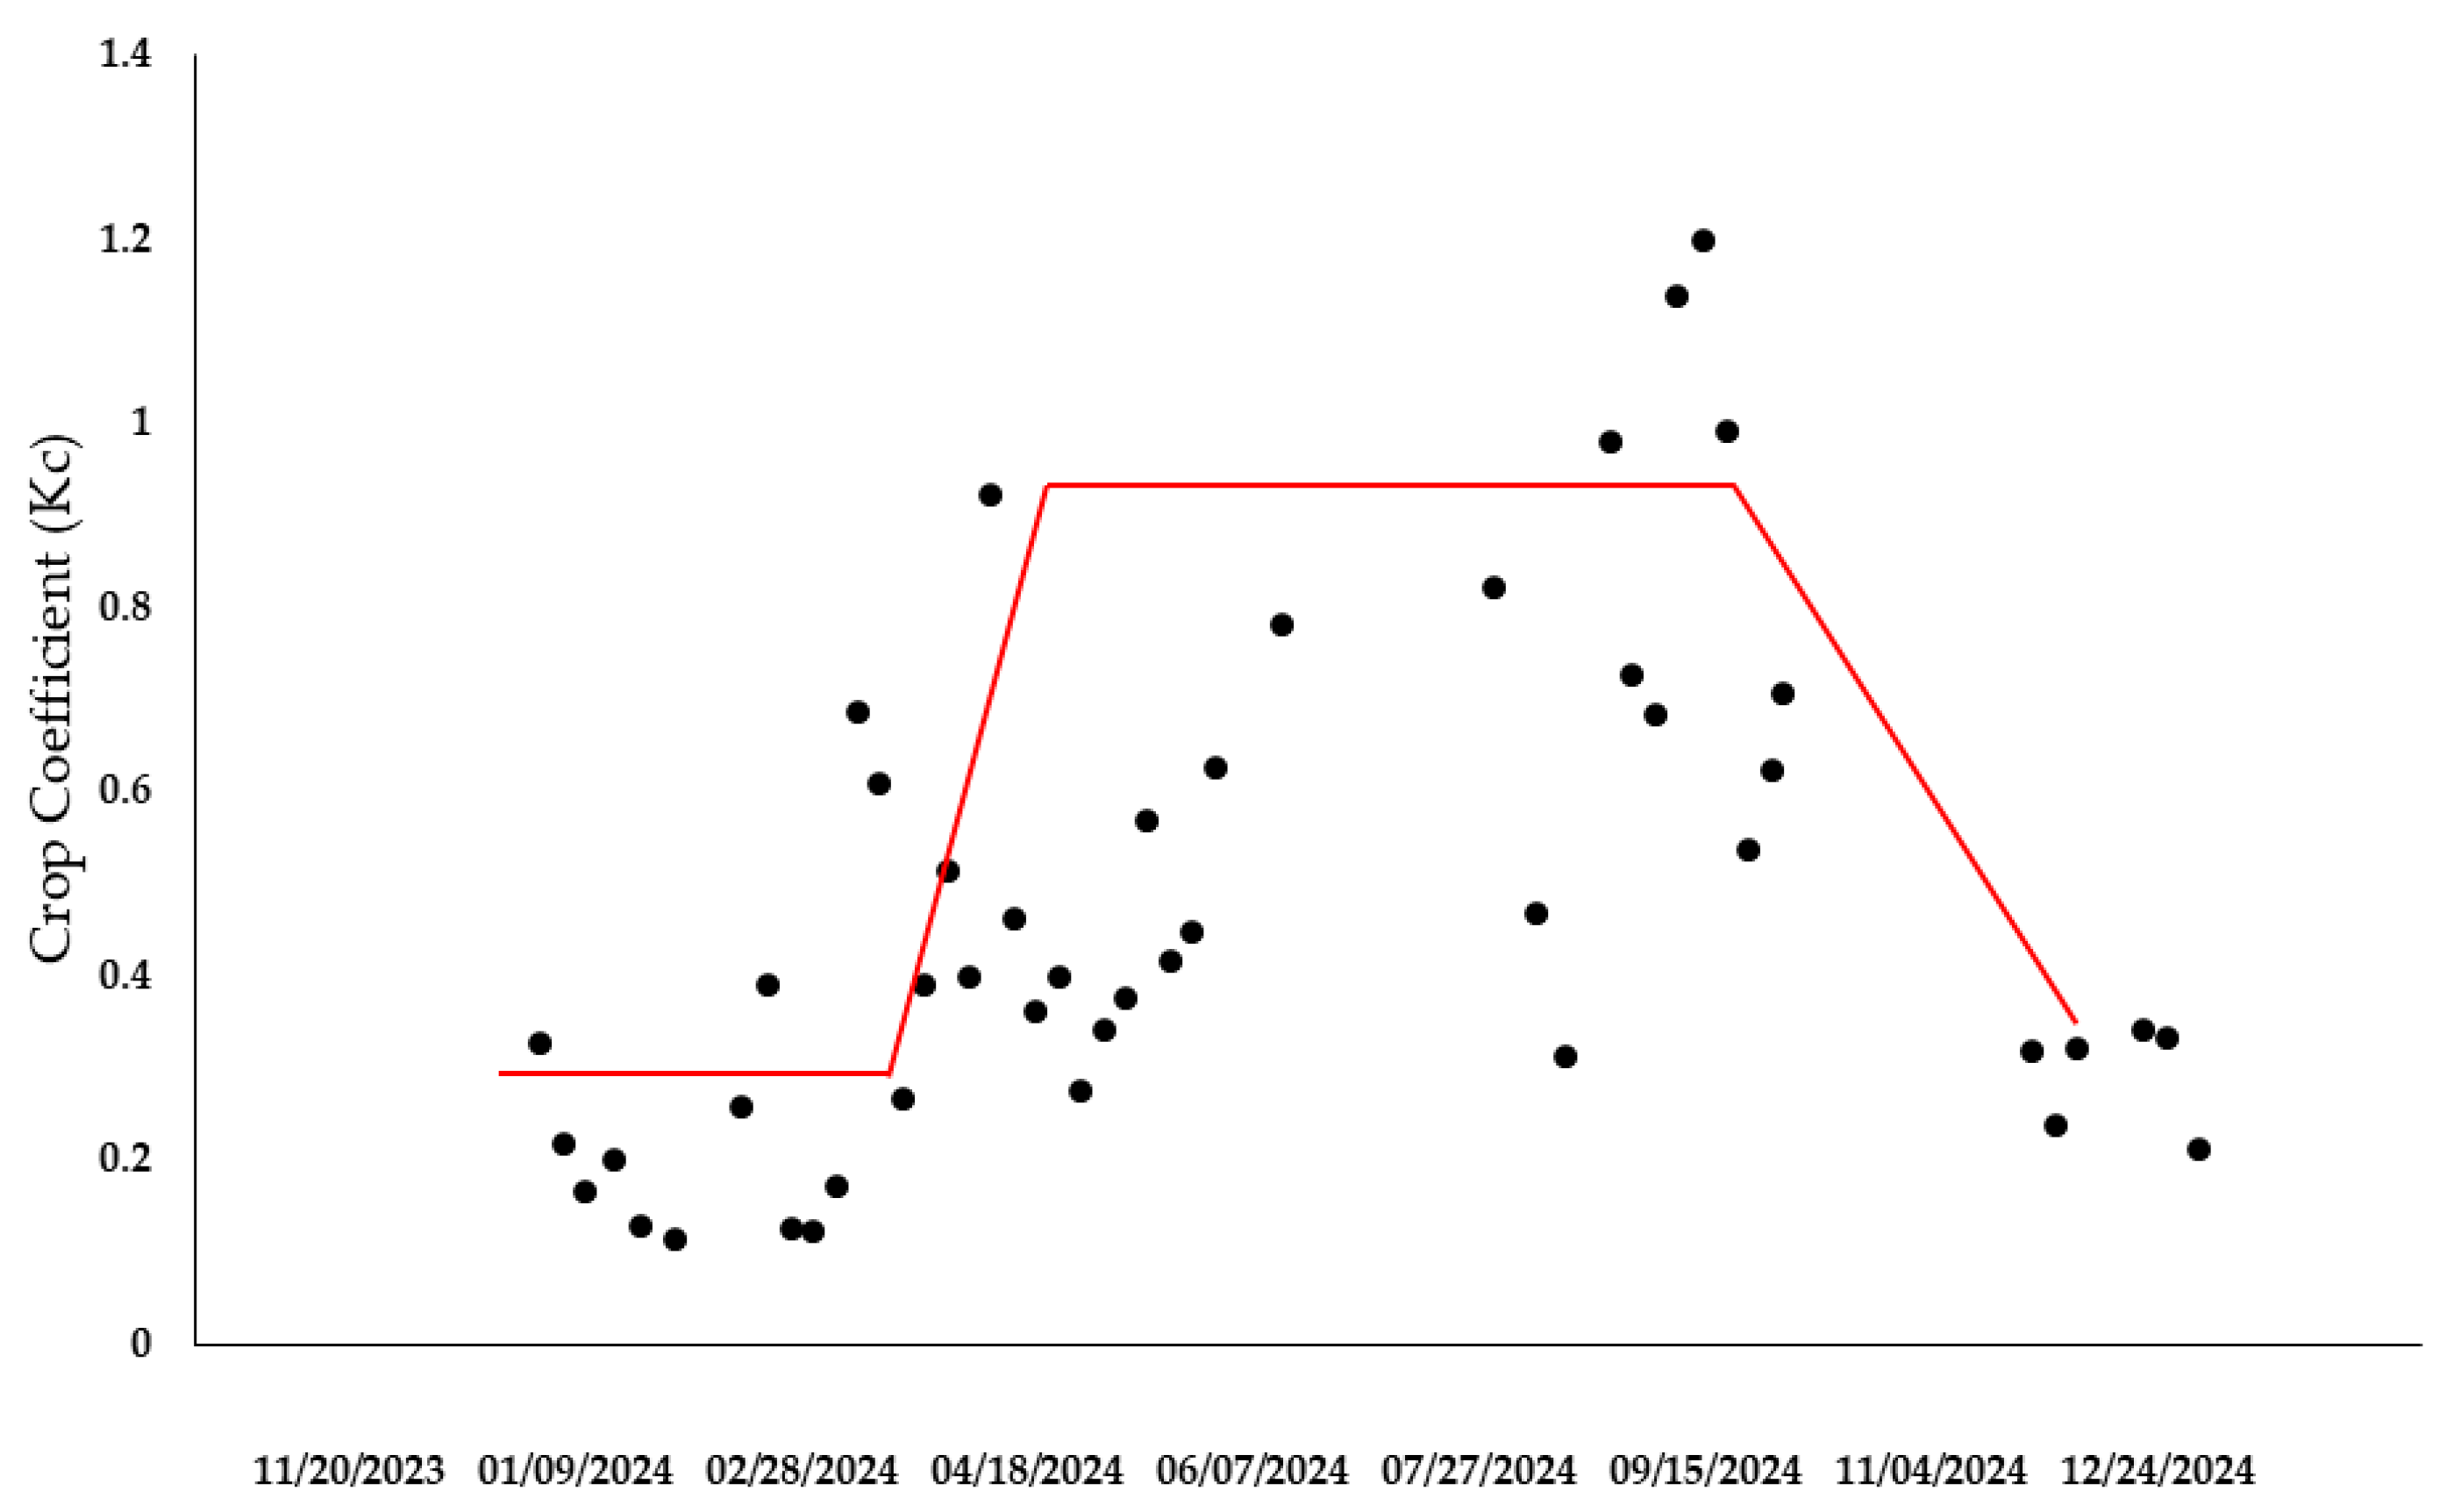
Figure 7.
Real-time monitoring is shown on an IoT board, with an irrigation schedule indicating an increase in soil moisture percentage after irrigation.
Figure 7.
Real-time monitoring is shown on an IoT board, with an irrigation schedule indicating an increase in soil moisture percentage after irrigation.

Table 1.
Pecan Kc and irrigation schedule.
| Schedule | Days/Irr# | Pecan Kc | Traditional depth of irrigation (cm) | Net irrigation under SFA/CSA (cm) | Water savings (cm) |
| March 15 | 1/1 | 0.30 | 12 | 7 | 5 |
| April 15 | 30/2 | 0.53 | 12 | 7 | 5 |
| April 30 | 45/3 | 0.68 | 12 | 7 | 5 |
| May 15 | 60/4 | 0.79 | 15 | 9 | 6 |
| May 30 | 75/5 | 0.86 | 15 | 9 | 6 |
| June 15 | 90/6 | 0.92 | 15 | 9 | 6 |
| June 30 | 105/7 | 0.92 | 15 | 9 | 6 |
| July 15 | 120/8 | 0.92 | 15 | 9 | 6 |
| July 30 | 135/9 | 0.92 | 15 | 9 | 6 |
| August 15 | 150/10 | 0.92 | 15 | 9 | 6 |
| August 30 | 165/11 | 0.92 | 15 | 9 | 6 |
| September 15 | 180/12 | 0.60 | 12 | 7 | 5 |
| September 30 | 195/13 | 0.50 | 12 | 7 | 5 |
| October 15 | 210/14 | 0.40 | 12 | 7 | 5 |
| October 30 | 225/15 | 0.30 | 12 | 7 | 5 |
| November 15 | 240/16 | 0.30 | 12 | 7 | 5 |
| Total | 240/16 | 216 | 128 | 88 (59% reduction) |
|
Disclaimer/Publisher’s Note: The statements, opinions and data contained in all publications are solely those of the individual author(s) and contributor(s) and not of MDPI and/or the editor(s). MDPI and/or the editor(s) disclaim responsibility for any injury to people or property resulting from any ideas, methods, instructions or products referred to in the content. |
© 2026 by the authors. Licensee MDPI, Basel, Switzerland. This article is an open access article distributed under the terms and conditions of the Creative Commons Attribution (CC BY) license (http://creativecommons.org/licenses/by/4.0/).
Copyright: This open access article is published under a Creative Commons CC BY 4.0 license, which permit the free download, distribution, and reuse, provided that the author and preprint are cited in any reuse.


