Submitted:
02 February 2026
Posted:
02 February 2026
You are already at the latest version
Abstract
Fe₂O₃ nanoparticles reinforced in a polymethyl methacrylate (PMMA) matrix structure were synthesized by the melting method. Fe₂O₃ was added in an amount of 2.5% by weight. Mixing times of 6 and 12 minutes were used, and materials with different homogenization properties were produced. In the final section, optimized binary nanocomposites were characterized by x-ray diffraction (XRD) and scanning electron microscopy (SEM), revealing the strong interaction of the PMMA matrix with nanometal particles. Differential thermal analysis (DTA) was used to determine the thermal behavior of Fe₂O₃-reinforced PMMA nanocomposite. Activation energies of thermal degradation were calculated by using the Kissinger, Takhor, and Augis-Bennett methods. The increasing of the mixing time in the extruder also contributed to material homogenization. In addition, the Fe₂O₃ supplement lowered the polymer degradation temperature and increased the activation energy. Depending on the increasing mixing time, a decrease was observed in the maximum mass loss temperature (Tx) of the samples.
Keywords:
Poly(methyl methacrylate)
; Fe₂O₃ nanoparticles
; thermal degradation
; degradation kinetics
; nanocomposites
; activation energy
1. Introduction
Hybrid nanocomposites of polymers containing various inorganic fillers or additives have received great attention due to their advanced mechanical, thermal, electrical properties, lower cost, ease of molding, lightness, and potential in a wide range of technological applications [1,2,3,4,5,6]. Polymer nanocomposites with high thermal conductivity and high dielectric constant are extremely necessary due to their various applications in the electrical and electronics industries, including voltage control, sensors, actuators, embedded capacitors, electromagnetic protection and new energy storage devices [7]. Therefore, issues such as heat removal and mechanical stability are of prime importance which must be improved in order to maximize the performance of various polymers in the electronics industry [8].
The incorporation of nanoparticles in a polymer matrix alters, as expected, the mechanical, thermal and other characteristics of the polymer [9]. Rocha et al. investigated the thermal properties of maghemit-Poly(methyl methacrylate) (PMMA) nanocomposite. They reported that increasing maghemite content also increased the thermal stability of the nanocomposite compared to pure PMMA. They also showed that the electron density in the maghemite nanoparticle is not homogeneous, and low electron density volumes are radical scavengers during PMMA degradation acting as thermal stabilizers [10]. Dallas et al. prepared polymer/magnetic nanoparticle composites in their study and investigated the thermal properties of the obtained nanocomposite. They reported that an increase in the glass transition temperature was observed after the addition of nanoparticles [11].
The polymorphic nature of iron oxides is well-known. Iron oxides and their nanoparticles are ubiquitous in the environment and have been investigated due to their properties and functions in both natural and engineered systems [12]. Laachacci et al. examined the thermal properties of PMMA which is associated with PMMA, titanium oxide and iron oxide (Fe2O3) nanoparticles of 5%, 10%, 15% and 20% by weight, and observed an increase in the thermal stability as the amount of oxide increased [13]. Barandiaran et al. to obtain a good dispersion of Fe2O3 magnetic nanoparticles, they modified the nanoparticles with silane using APTS. They reported that the nanocomposite obtained by combining the modified nanoparticles with PMMA transformed into a more homogeneous structure [14]. Aymonier et al. the degradation of the PMMA composite containing 0.0005% Pd by volume has been delayed by more than 75 °C and its optical and thermal properties were protected from deterioration [15]. These studies clearly show that interactions between polymers and additives can play a critical role for determining the properties of nanocomposites [5].
The elimination of heat produced by micro and nanoelectronic devices during the operation of electronic elements is a major problem. To control the heat generated in the system easily, polymeric materials having thermal conductivity are needed to dissipate the existing heat.
In our previous study, the effect of mixing time on the thermal stability and activation energies of NiO/PMMA nanocomposites was investigated. The addition of NiO nanoparticles facilitated earlier decomposition by lowering both the initial temperature and activation energy compared to pure PMMA. These findings indicate that PMMA undergoes positive changes in its thermal decomposition and kinetic energies after forming a nanocomposite with metal oxides [16].
The crucial point in obtaining nanosize materials is to prevent particles from aggregation [17]. Therefore, mixing time is important to ensure the distribution of particles in the matrix [18]. Another important choice for nanoparticle added composite materials is the reinforcement particle ratio. For example, Sun et al. investigated the mechanical behavior of epoxy reinforced nanoparticles of 4% Fe2O3 [19]. Naguib et al. investigated the effect of 3% Fe2O3 coated particles on the mechanical properties of the epoxy matrix [20]. Maleki et al. produced 5%, 10%, 15% and 20% Fe2O3 reinforcement particles and polymer matrix composites [21]. In this study, the reinforcement particle ratios in the literature were examined and the 2.5% reinforcement particle ratio was chosen as a sufficient reinforcement particle ratio to monitor the effect of mixing time. Different mixing times were applied in the preparation of the samples with the selected reinforcement particle ratio. Thus, the effect of the obtained homogenization amount on the thermal behavior of the material was determined. Unlike the literature, it was aimed to examine the changes in structural and thermal properties as a result of mixing Fe2O3 nanoparticles in the PMMA structure for different periods of 6 and 12 minutes. For this purpose, the results of the experiment obtained by x-ray diffractions (XRD), scanning electron microscope (SEM) images and thermogravimetric analysis of the samples obtained after different mixing times were examined. The data obtained from the thermograms of nanocomposites at different heating rates were analyzed with Kissinger, Takhor and Augis-Bennett methods. The current study describes novel nanocomposites polymer film reinforced with Fe2O3 mixed nanoparticles at 2,5 weight percentage using melting methods and characterized by thermal analysis methods.
2. Materials and Methods
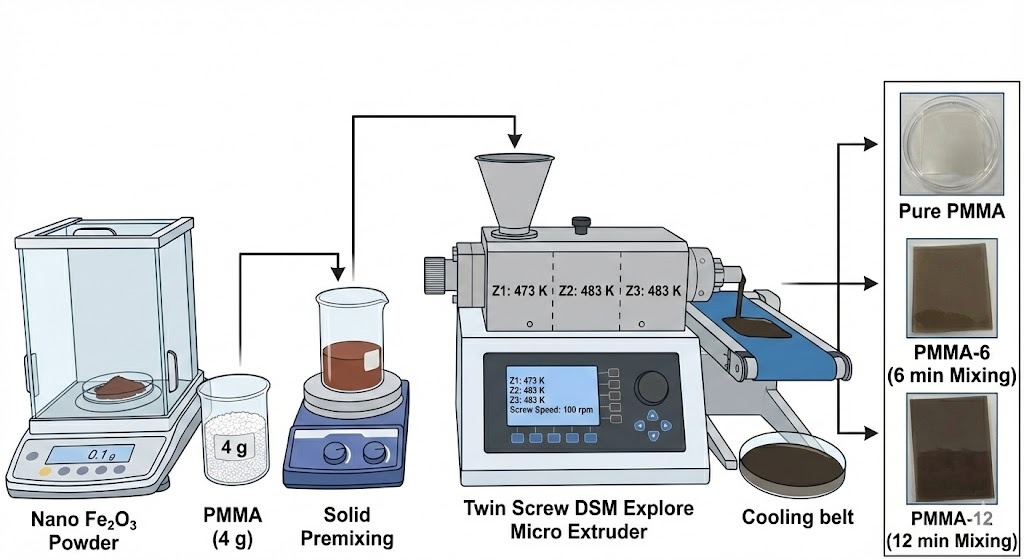
Poly(methyl methacrylate)-(M.W.=35000 g/mol) was purchased from Acros Organics. Nano Fe2O3 was purchased from Sigma-Aldrich (Germany) with 1309-37-1 CAS number. All chemical reagents were used in analytical purity. Pure PMMA and Fe2O3 reinforced PMMA matrix nanocomposites were synthesized using the melting method [22]. Twin screw DSM explore micro extruder was used in the synthesis of nanocomposite by melting method [23]. The optimum temperature for PMMA was determined as 473, 483 and 483 K for the three regions in the cylinder, respectively. These temperatures have been found by determining an appropriate temperature value between the glass transition temperatures and melting points of the polymers and using the literature. The polymer (4 g) and metal oxide (0.1 g) were premixed. Transferred into the feeding unit of the ready twin-screw extruder. After the materials were processed in 2 different mixing times, 6 to 12 minutes, nanocomposites were obtained in the form of a film. In nanocomposite production, the extruder control temperatures vary according to the polymers and the temperature value was around 473-483 K and the speed was 100 rpm in the processes related to PMMA polymer. The resulting samples were defined as PMMA (undoped), PMMA-6 (6 minutes of mixing) and PMMA-12 (12 minutes of mixing). The schematic flow diagram of the entire experimental procedure, which involves the preparation of pure PMMA and Fe₂O₃-doped nanocomposite samples mixed for different durations using the melt compounding method, is presented in Figure 1.
Structural changes and phase analysis of samples after certain mixing times were measured in the Bruker Advance D8 XRD device using CuKα radiation (λ = 0.154056 nm) at a step speed of 0.013° in the range of 2θ = 5°-80°. The microstructures of the nano Fe2O3/PMMA nanocomposites were characterized using a Jeol 6064 LV SEM at an acceleration voltage of 10 kV. In differential thermal analysis-thermogravimetric (DTA-TG) measurements Hitachi Exstar SII 7300 model device was used and the weight of powder samples was between 10-20 mg which were placed in an aluminum pan exposed to nitrogen gas at different heating rates up to 1000 K from room temperature [24].
3. Results And Discussions
3.1. XRD Characterization
The X-ray pattern of PMMA shows three broad peaks at 2θ = 13.52, 29.61 and 42.22 which shows the semi crystalline structure of the PMMA particles. The pattern exhibits typical amorphous nature of the nanocomposite material. From these patterns of the nanocomposites it is realized that Fe2O3 loading did not affect the structural characteristics of PMMA which was due to the fact that TiO2 was mixed physically [25]. XRD results of Fe2O3 powder and other samples in nano dimensions which were used during the experiments are shown in Figure 2. XRD patterns of PMMA, PMMA-6, PMMA-12, and Fe2O3 powder were examined, the patterns of polymer structure and Fe2O3 powder combined in nanocomposite PMMA-6 and PMMA-12 samples gave similar peaks at 6 points at the same angles. The XRD patterns of the PMMA sample are similar to the PMMA-6 and PMMA-12 samples. This situation determines that Fe2O3 powders containing nanoparticles are distributed within the polymer matrix and both components exist within the structure. Figure 2 shows the XRD pattern for PMMA peaks at 2θ and relative intensities obtained for the polymer match with the JCPDS Card no. 13-0835 file, identifying it as PMMA. It is compatible with the XRD patterns of Fe2O3 and the standard JCPDS Card no. 04-0755.
3.2. Morphology Characterization
The distribution of Fe2O3 nanoparticles in the PMMA matrix was investigated under SEM. Figure 3 shows SEM micrographs of sections of samples at the same magnification rates and Fe2O3 particles scattered in the PMMA matrix in case of doped Fe2O3 . In Figure 3 (b), the distribution structure of Fe2O3 nanoparticles in PMMA-6 sample is not homogeneous enough. It is possible to see the agglomeration that occurs in the structure. In Figure 3 (c) the increase in the mixing time is seen to allow more homogeneous dispersion of Fe2O3 reinforcement particles. It is clear that the agglomeration for the PMMA-12 sample decreased. In addition, since no gaps are defined at the interfaces of the PMMA matrix forming the nanocomposite and the Fe2O3 reinforcement particle, it can be seen that there are strong interfaces. Thus, each Fe2O3 nanoparticle was completely encapsulated by a thin layer of PMMA polymer producing multiple interfaces. Therefore, Fe2O3 nanoparticles appear to be strongly embedded in PMMA to form a compact interface structure reflecting the improvement of thermal properties.
3.3. Differential Thermal Analysis
The DTA results demonstrated that the PMMA, PMMA-6, and PMMA-12 nanocomposite samples exhibited endothermic behaviour (see Figure 4). As the heating rate increased, the onset temperature of polymer decomposition shifted to higher values due to thermal lag. The pure PMMA sample exhibited a distinct endothermic peak at approximately 680 K. Similar thermal decomposition profiles were observed for the PMMA-6 and PMMA-12 nanocomposites, thus confirming the presence of analogous decomposition mechanisms.
The glass transition temperature of a polymer is important for characterization as it determines the macroscopic performance of the polymer [26]. Glass transition temperature is the temperature at which the increased molecular mobility leads to significant changes in the thermal properties of the amorphous structure. In other words, the temperature of starting of the thermal disintegration has been proven to be the glass transition temperature [6]. At above the glass transition temperature, the polymer tends to expand isotropically [27]. The glass transition temperature ( based on the DTA curves given in Figure 3) was found to be about 380 K for pure PMMA. Approximate temperature values are given in the literature [28].
Upon examination of the graph, it was observed that the Tx temperatures of the nanocomposite decreased between 3 and 5 K for a constant heating rate, as indicated by the data obtained from DTA analysis. At the rate of 5 K/min temperature increase, the temperatures of PMMA, PMMA-6 and PMMA-12 samples were recorded as 651K, 648K and 646K respectively. The same trend occurred for the other heating rates. Another thing that stands out in DTA curves was the stabilization disorder at the initial temperature of degradation. The more clearly occurring reaction initiation mechanism for PMMA-6 sample came out to be more stable for the PMMA-12 sample. The cause of this instability, which occurred independent of the heating rate was the effect of supplementary nanoparticles on the polymer structure. When the concentration of metal oxide concentrated in certain regions (as a result of accumulation) did not disperse equally to the entire composite, it caused different thermal effects within the entire composite under the heat effect and probably caused distortion in a way that affected subsequent processes. It is inevitable that this process will slightly cause mass loss. This agglomeration is the cause of the deviations in the curves obtained from the samples under different heating rates. The data calculated as a result of DTA analysis is shown in Table 1.
An examination of the Tx temperatures in relation to the heating rate revealed a direct correlation between the reaction peak temperature and the values of 651, 661, 670, and 676 K, respectively, at rates of 5, 10, 15, and 20 K/min for the PMMA sample. Furthermore, a temperature increase rate of 651 K/min was observed for PMMA, PMMA-6, and PMMA-12 samples at a rate of 5 K/min. This phenomenon is consistent across a range of temperature increase rates.
3.4. Thermal Activation Energies
The activation energies of the decomposition calculated from the DTA curves are based on the mass losses in the different decomposition regions during the decomposition process. Accordingly, a series of experiments were performed at various heating rates and E was obtained from the slope of an ln linear isoconversion plot. Figure 5 shows the graph of ln(- ln(1-φ (T))-lnβ for the samples calculated according to the Ozawa formula [29]. The value of the Avrami Parameter was calculated by using the Ozawa equation.
The values obtained from the peaks in the DTA curve and the Avrami parameter for these samples were found to be approximately 1. Avrami Parameter values were 1.10 for PMMA, 1.15 for PMMA-6 and 1.10 for PMMA-12. This value indicates superficial nucleation and one-dimensional growth.
The Kissinger method is a useful technique for evaluating average degradation energy in weight loss. The graph of 1000/Tx versus ln(β/Tx2) obtained from DTA measurements for PMMA, PMMA-6, and PMMA-12 is given in Figure 6. The gradient of the calculated accuracy for each sample provides the activation energy [30]. The values of the experimental results are presented in Table 2.
Activation energies of conversions occurring at an increased rate of 5, 10, 15, and 20 K/min for PMMA, PMMA-6, and PMMA-12 samples were compared. According to the Kissinger technique, a value of 189 kJ/mol was obtained for PMMA, while 166 kJ/mol was found for the PMMA-6 sample and 209 kJ/mol for the PMMA-12 sample. This results in an increase in mixing time increasing the thermal stabilization of the composite. It is seen that thermal stabilization increases with the increase of homogenization of the mixing process. When the increase in particle ratio in the PMMA composite provides a more homogeneous reinforcement particle distribution, the distance between the particles decreases, forming a tight binding. Thus, the produced nanocomposite becomes denser and more stable. Therefore, the transfer of heat from one surface to the other surface of the related nanocomposite films becomes quite easy. In this case, it is possible to form thermally more efficient conductive pathways [31].
According to the Takhor Formula, PMMA was calculated as 200 kJ/mol for PMMA, 177 kJ/mol for PMMA-6 sample and 220 kJ/mol for PMMA-12 sample when considering conversions occurring in 5, 10, 15 and 20 K/min increase ratio for PMMA-6 and PMMA-12 samples. While activation energy decreased slightly for the PMMA-6 sample, the activation energy of the PMMA-12 sample was higher than the other two samples. According to Takhor formula, lnβ-1000/Tx graph of PMMA, PMMA-6 and PMMA-12 samples is given in Figure 7. This result coincides with the calculation made by Kissinger method and is attributed to the inability to achieve a homogeneous distribution in the polymer. Homogenization ensures that the heat absorbed by nanoparticles is evenly distributed in the polymer. The agglomeration of the structure indicates that oxide particles together create more thermal instability.
According to the Augis-Bennett Formula, ln(β/(Tx-T0))-1000/Tx graph is drawn for PMMA, PMMA-6 and PMMA-12 samples. When the activation energies obtained by this method were compared, it was calculated as 162 kJ/mol for PMMA sample while it increased to 198 kJ/mol for PMMA-6 sample and 251 kJ/mol for PMMA-12 sample. Here, like Kissinger and Takhor methods, the energy activation level of the PMMA-6 and PMMA-12 samples showed similar trends. In the same way as Kissinger and Takhor method, the activation energy value of the PMMA-12 sample was higher than the other two samples. According to the Augis-Bennett Formula, the graph of the calculated values for each of the three samples is given in Figure 8.
The results of the calculations made with Kissinger, Takhor and Augis-Bennett methods were similar. The values calculated by these methods are given in Table 2.
3.5. Thermogravimetric Analysis
Thermogravimetric measurements calculated the different slopes seen at the degradation initial temperatures of the samples at an increased rate of 10K/min and the effect of the additive on the initial degradation amount was examined. Changes in thermal degradation temperatures were examined for the K and L points shown in Figure 9. Mass loss quantities were calculated by taking varying values depending on temperature. Table 3 shows mass loss values for PMMA, PMMA-6, and PMMA-12 samples. All samples decreased the amount of mass loss by around 1% at point K. At L point, for the PMMA sample increased to 8.32%, 12.03% for PMMA-6 sample, and 12.35% for PMMA-12 sample. At this point, the amount of mass change in samples with reinforced particles was higher. It is also seen that the mixing time accelerates the thermal degradation process. Aygahoglu et al. investigated the thermal conductivity of iron oxide powders at low temperatures and found that the thermal conductivity coefficient of the samples was affected by the temperature change, depending on the content and size of the Fe2O3 particles [32].
TG thermograms of PMMA, PMMA-6 and PMMA-12 nanocomposites were performed. Table 3 shows T5, T30, T50, T80, Tx and residue values of PMMA, PMMA-6 and PMMA-12 nanocomposites. T5, T30, T50 and T80 value was the temperature indicating that the analyzed sample has degraded at x wt% amount [33]. The temperatures at which the maximum mass loss (Tx) of pure PMMA, PMMA-6 and PMMA-12 occurred were 661 K, 660 K and 659 K respectively. When the maximum decomposition temperatures of PMMA nanocomposites were examined, the maximum decrease occurred for nanocomposite containing PMMA-12. With nano Fe2O3 reinforced pure PMMA, a decrease occurred in T5, T30, T50, T80 and Tx temperatures. In addition, temperature decreases were observed for the same T5, T30, T50, T80 and Tx values with the increasing mixing time. On the other hand, there was an increase in the residue values depending on the mixing time.
The thermal stability of PMMA was affected by the amount of Fe2O3 added to the matrix and the mixing time in nanocomposite synthesis atmosphere, due to the enhanced interface interactions between PMMA and Fe2O3 particle.
This result indicates that PMMA degradation is accelerated by the presence of Fe2O3 nanoparticles. The reason for the acceleration is that Fe2O3 nanoparticles tend to disrupt the random chain polymer structure. Fe2O3 is restricted to adhesion between particles and PMMA molecules and to their mobility due to the fact that polymer chains are connected to inorganic particles [34]. A small amount of iron oxide has reportedly created such an acceleration in the thermal decomposition of organics [5,35]
4. Conclusions
In this study, the effects of Fe2O3 nanoparticles reinforced to PMMA matrix on the behavior of composites were investigated. In addition to the effects of extrusion time on composite behavior during composite production, the thermal stability levels of the composite were compared with different activation calculations. In the microstructure photographs, it was observed that nano-sized Fe2O3 reinforcement particles caused agglomeration. It was determined that as the mixing time increased, agglomeration decreased and homogenization increased. This can be considered as the direct effect of restriction of the mobility of polymer chains on the thermal-oxidative degradation mechanism. In the XRD analysis, the same results were obtained with the XRD cards given for PMMA and Fe2O3. The peaks of the materials constituting the composition were detected in PMMA-6 and PMMA-12 samples. This indicates that Fe2O3 powders containing nanoparticles are dispersed in the polymer matrix and both components are present in the structure. For all samples, the Avrami parameters calculated with the Ozawa equation were found to be approximately “1”. This result is indicative of superficial nucleation and one-dimensional growth. The mixing time in extrusion and the dispersion behavior of the mixed fillers affected the thermal properties of the PMMA matrix. With the increase of mixing time, a more homogeneous structure was obtained and this reduced the initial mass loss temperature. There are two mass loss regimes from PMMA. In the former, the weight loss is controlled by the chemical degradation process, while in the latter it occurs by the effect of partial degradation (bubble transport or diffusion) on the softened PMMA. Here, the idea that Fe2O3 influences bubble formation and diffusion mechanisms is more logical.
Author Contributions
Experimental design: A.U. and M.E.; Data analysis: A.U.; Data curation: A.U.; Writing—original draft: A.U.; Writing—review & editing: M.E.; Supervision: A.U. and M.E. All authors have read and agreed to the published version of the manuscript.
Funding
This study received no external funding.
Institutional Review Board Statement
Not applicable.
Data Availability Statement
The original contributions presented in this study are included in the article. Further inquiries can be directed to the corresponding author.
Conflicts of Interest
On behalf of all authors, the corresponding author states that there is no conflict of interest.
Abbreviations
The following abbreviations are used in this manuscript:
| Symbol | Meaning |
| APTS | (3-Aminopropyl) triethoxysilane |
| DTA | Differential thermal analysis |
| JCPDS | Joint Committee on Powder Diffraction Standards Card No |
| K | The amount of substance remaining in the K region |
| L | The amount of substance remaining in the L region |
| M.W. | Molecular Weight |
| PMMA | Poly(methyl methacrylate) |
| PMMA-6 | Nanocomposite with 2.5% reinforcement particle ratio prepared by mixing for 6 minutes |
| PMMA-12 | Nanocomposite with 2.5% reinforcement particle ratio prepared by mixing for 12 minutes |
| Residue | Remaining substance as a percentage |
| SEM | Scanning electron microscope |
| TG | Initial amount of substance |
| XRD | X-ray diffractions |
| A | Calculation of the area under the thermal graph training |
| β | Heating Rate |
| Tx | The maximum mass loss temperatures |
References
- Hazim, A.; Abduljalil, H.M.; Hashim, A. Design of PMMA doped with inorganic materials as promising structures for optoelectronics applications. Trans. Electr. Electron. Mater. 2021, 22, 851–868.
- Çankaya, N.; Beşci, G. Synthesis, characterization, thermal properties and reactivity ratios of methacrylate copolymers including methoxy group. J. Fac. Eng. Archit. Gazi Univ. 2018, 33(3), 1155–1170.
- Ul-Haq, Y.; Murtaza, I.; Mazhar, S.; Ullah, R.; Iqbal, M.; Ul-Huq, Z.; Qarni, A.A.; Amin, S. Dielectric, thermal and mechanical properties of hybrid PMMA/RGO/Fe₂O₃ nanocomposites fabricated by in-situ polymerization. Ceram. Int. 2020, 46, 5828–5840.
- Khokhar, D.; Jadoun, S.; Arif, R.; Jabin, S. Functionalization of conducting polymers and their applications in optoelectronics. Polym. Plast. Technol. Mater. 2021, 60, 465–487.
- Alsaad, A.M.; Al-Bataineh, Q.M.; Ahmad, A.A.; Jum’h, I.; Alaqtash, N.; Bani-Salameh, A.A. Optical properties of transparent PMMA-PS/ZnO NPs polymeric nanocomposite films: UV-shielding applications. Mater. Res. Express 2019, 6, 126446.
- Lee, J.K.Y.; Chen, N.; Peng, S.; Li, L.; Tian, L.; Thakor, N.; Ramakrishna, S. Polymer-based composites by electrospinning: Preparation & functionalization with nanocarbons. Prog. Polym. Sci. 2018, 86, 40–84.
- Bafna, M.; Sain, N.; Khandelwal, A.; Deeba, F.; Gupta, A.K. Study of refractive index and dispersion behavior of KMnO₄ doped poly(methyl methacrylate) (PMMA) composites. Mater. Today Proc. 2022, 66, 3481–3486.
- Agarwal, K.; Prasad, M.; Katiyar, M.; Jaiswal, R.; Kumar, S.; Prasad, N.E. Study of electromagnetic and thermal properties of fabricated NiFe₂O₄/polyurethane nanocomposites. J. Appl. Polym. Sci. 2020, 137(27),.
- Mosleh, A.T.; Yousef, T.A.; Khairy, M.; Ferjani, H.; Almuhana, A.R.Y.; Zahran, H.Y.; Rahman, A.E.; Essam, O.A.; Abdelnasser, M.I.; Abdelbaset, S.A.; Yahi, I.S.; Kamoun, E.A. Multifunctional prospects of PMMA/Fe₂O₃@NiO nanocomposite membranes: Advanced optical, dielectric, and photocatalytic properties for electronic, optoelectronic devices, and environmental applications. J. Sol-Gel Sci. Technol. 2025, 116, 778–797.
- Rocha, M.V.J.; de Carvalho, H.W.P.; Sarmento, V.H.; Craievich, A.F.; Ramalho, T.C. Thermal and structural characterization of maghemite-PMMA nanocomposite obtained by in-situ polymerization. Polym. Compos. 2016, 37, 51–58.
- Dallas, P.; Georgakilas, V.; Niarchos, D.; Komninou, P.; Kehagias, T.; Petridis, D. Thermal properties of polymer/magnetic nanoparticle composite films. Nanotechnology 2006, 17, 2046–2054.
- Singh, B.P.; Kumar, A.; Areizaga-Martinez, H.I.; Vega-Olivencia, C.A.; Tomar, M.S. Structural, optical, and dielectric studies of NiO/PMMA nanocomposite films prepared by solution casting. Indian J. Pure Appl. Phys. 2017, 55, 722–729.
- Laachachi, A.; Cochez, M.; Ferriol, M.; Lopez-Cuesta, J.M.; Leroy, E. Mechanical and thermal properties of polypropylene/metal oxide composite materials. Mater. Lett. 2005, 59, 36–39.
- Barandiaran, I.; Cappelletti, A.; Strumia, M.; Eceiza, A.; Kortaberria, G. Generation of nanocomposites based on (PMMA-b-PCL)-grafted Fe₂O₃ nanoparticles and PS-b-PCL block copolymer. Eur. Polym. J. 2014, 58, 226–232.
- Aymonier, C.; Bortzmeyer, D.; Thomann, R.; Mülhaupt, R. Poly(methyl methacrylate)/palladium nanocomposites: Synthesis and characterization of morphological, thermomechanical and thermal properties. Chem. Mater. 2003, 15, 4874–4878.
- Ulutas, A. NiO/PMMA Nanokompozitlerinin Termal Kararlılığı ve Aktivasyon Enerjileri Üzerine Karıştırma Süresinin Etkisi. J. Compos. Sci. 2025, 9(10), 557.
- Rahman, M.M.; Khan, K.H.; Parvez, M.M.H.; Irizarry, N.; Uddin, M.N. Polymer Nanocomposites with Optimized Nanoparticle Dispersion and Enhanced Functionalities for Industrial Applications. Processes 2025, 13(4), 994.
- Rishi, K.; Narayanan, V.; Beaucage, G.; McGlasson, A.; Kuppa, V.; Ilavsky, J.; Rackaitis, M. A thermal model to describe kinetic dispersion in rubber nanocomposites: The effect of mixing time on dispersion. Polymer 2019, 175, 272–282.
- Sun, T.; Fan, H.; Wang, Z.; Liu, X.; Wu, Z. Modified nano Fe2O3-epoxy composite with enhanced mechanical properties. Mater. Des. 2015, 87, 10–16.
- Naguib, H.M.; Ahmed, M.A.; Abo-Shanab, Z.L. Studying the loading impact of silane grafted Fe₂O₃ nanoparticles on mechanical characteristics of epoxy matrix. Egypt. J. Petrol. 2019, 28, 27–34.
- Khosravi Maleki, F.; Nasution, M.K.M.; Gok, M.S.; Arab Maleki, V. An experimental investigation on mechanical properties of Fe₂O₃ microparticles reinforced polypropylene. J. Mater. Res. Technol. 2022, 16, 229–237.
- Katea, M.B.; Aboiad, A.K.; Al-Alawy, I.T. Synthesis and characterization of PMMA-based nanocomposites doped with Bi₂O₃, MoO₃, B₂O₃, SiO₂, Na₂O and Fe₂O₃ for gamma radiation shielding. Appl. Radiat. Isot. 2025, 226, 11252.
- Cho, Y.-M.; Kim, J.-H.; Choi, J.-H.; Kim, J.-C.; Cho, S.-M.; Park, S.-W.; Kwak, H.W.; Choi, I.-G. Physicochemical characteristics of lignin-g-PMMA/PLA blend via atom transfer radical polymerization depending on the structural difference of organosolv lignin. Int. J. Biol. Macromol. 2023, 226, 279–290.
- Li, S.; Meng Lin, M.; Toprak, M.S.; Kim, D.K.; Muhammed, M. Nanocomposites of Polymer and Inorganic Nanoparticles for Optical and Magnetic Applications. Nano Rev. 2010, 1, 5214.
- Hashem, M.; Rez, M.F.; Fouad, H.; Elsarnagawy, T.; Elsharawy, M.A.; Umar, A.; Assery, M.; Ansari, S.G. Influence of titanium oxide nanoparticles on the physical and thermomechanical behavior of poly(methyl methacrylate) (PMMA): A denture base resin. Sci. Adv. Mater. 2017, 9(6), 938–944.
- Ayanoğlu, Z.G.; Doğan, M. Characterization and Thermal Kinetic Analysis of PMMA/Modified-MWCNT Nanocomposites. Diam. Relat. Mater. 2020, 108, 107950.
- Campo, E.A. Polymeric Materials and Properties. In Selection of Polymeric Materials; Elsevier: Amsterdam, The Netherlands, 2008; pp. 1–39.
- C. E. Porter and F.D. Blum, Thermal Characterization of PMMA Thin Films Using Modulated Differential Scanning Calorimetry, Macromolecules, 2000 33, 7016-7020.
- Ozawa, T. Kinetic Analysis of Derivative Curves in Thermal Analysis. J. Therm. Anal. 1970, 2, 301–324.
- Kissinger, H.E. Variation of Peak Temperature with Heating Rate in Differential Thermal Analysis. J. Res. Natl. Bur. Stand. (1934) 1956, 57, 217.
- Ul-Haq, Y.; Murtaza, I.; Mazhar, S.; Ullah, R.; Iqbal, M.; Zeeshan-ul-Huq; Qarni, A.A.; Amin, S. Dielectric, Thermal and Mechanical Properties of Hybrid PMMA/RGO/Fe2O3 Nanocomposites Fabricated by in-Situ Polymerization. Ceram. Int. 2020, 46, 5828–5840.
- Aygahoğlu, A.; Döner, N.; Pargan, A.R. Hematite particles’ radiative properties within the ultraviolet–visible spectrum and thermal properties at low temperatures. J. Fac. Eng. Archit. Gazi Univ. 2020, 36(1), 191–200.
- Yanmaz, E.; Doğan, M.; Turhan, Y. Effect of sodium dodecyl sulfate on thermal properties of polyvinyl alcohol (PVA)/modified single-walled carbon nanotube (SWCNT) nanocomposites. Diam. Relat. Mater. 2021, 115, 108359.
- Hu, Y.-H.; Chen, C.-Y.; Wang, C.-C. Viscoelastic properties and thermal degradation kinetics of silica/PMMA nanocomposites. Polym. Degrad. Stab. 2004, 84(3), 545–553.
- Imai, T.; Matsui, T.; Fujii, Y.; Nakai, T.; Tanaka, S. Oxidation catalyst of iron oxide suppressing dioxin formation in polyethylene combustion. J. Mater. Cycles Waste Manage. 2001, 3, 103–109.
Figure 1.
Schematic representation of the synthesis process of pure PMMA and Fe₂O₃-reinforced PMMA nanocomposites using the melt mixing method.
Figure 1.
Schematic representation of the synthesis process of pure PMMA and Fe₂O₃-reinforced PMMA nanocomposites using the melt mixing method.
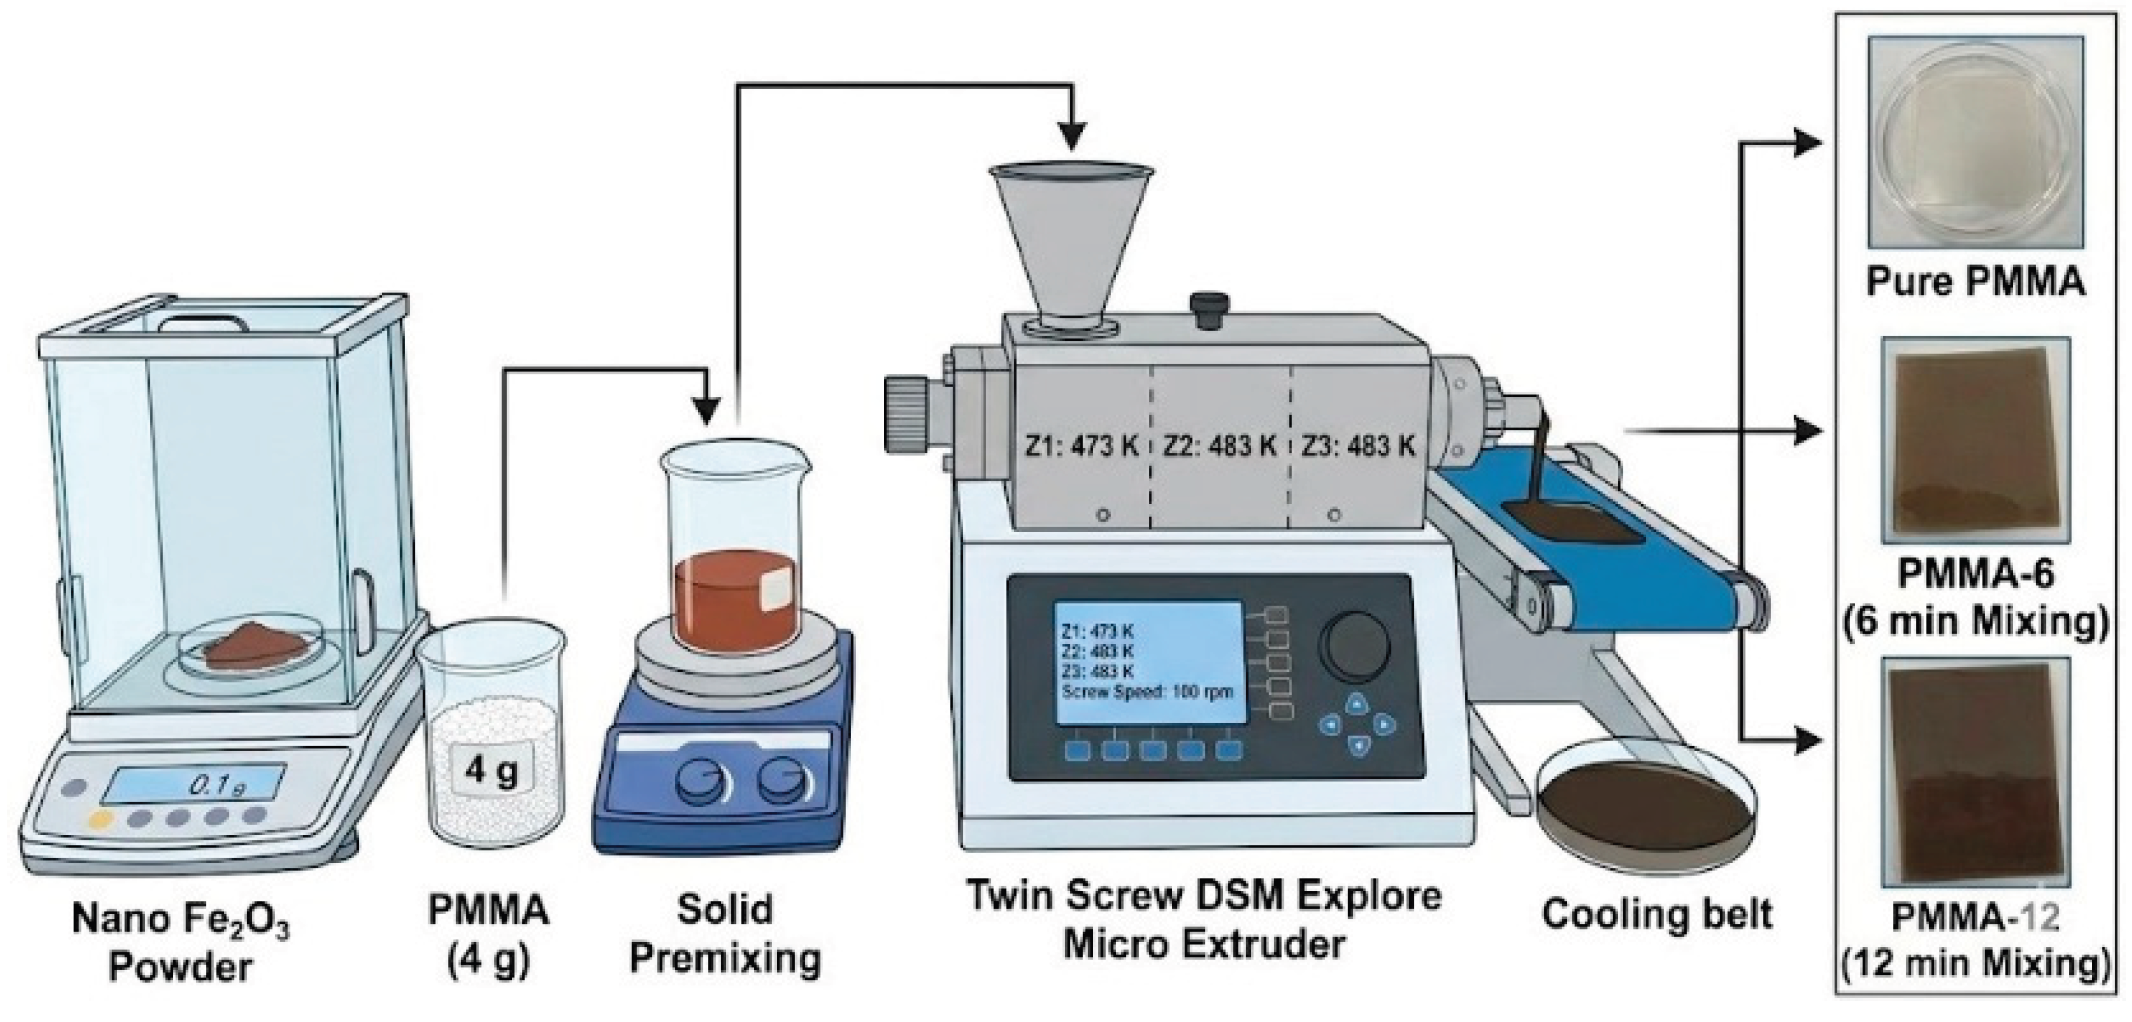
Figure 2.
XRD patterns for nano Fe2O3, PMMA, PMMA-6 and PMMA-12 samples.
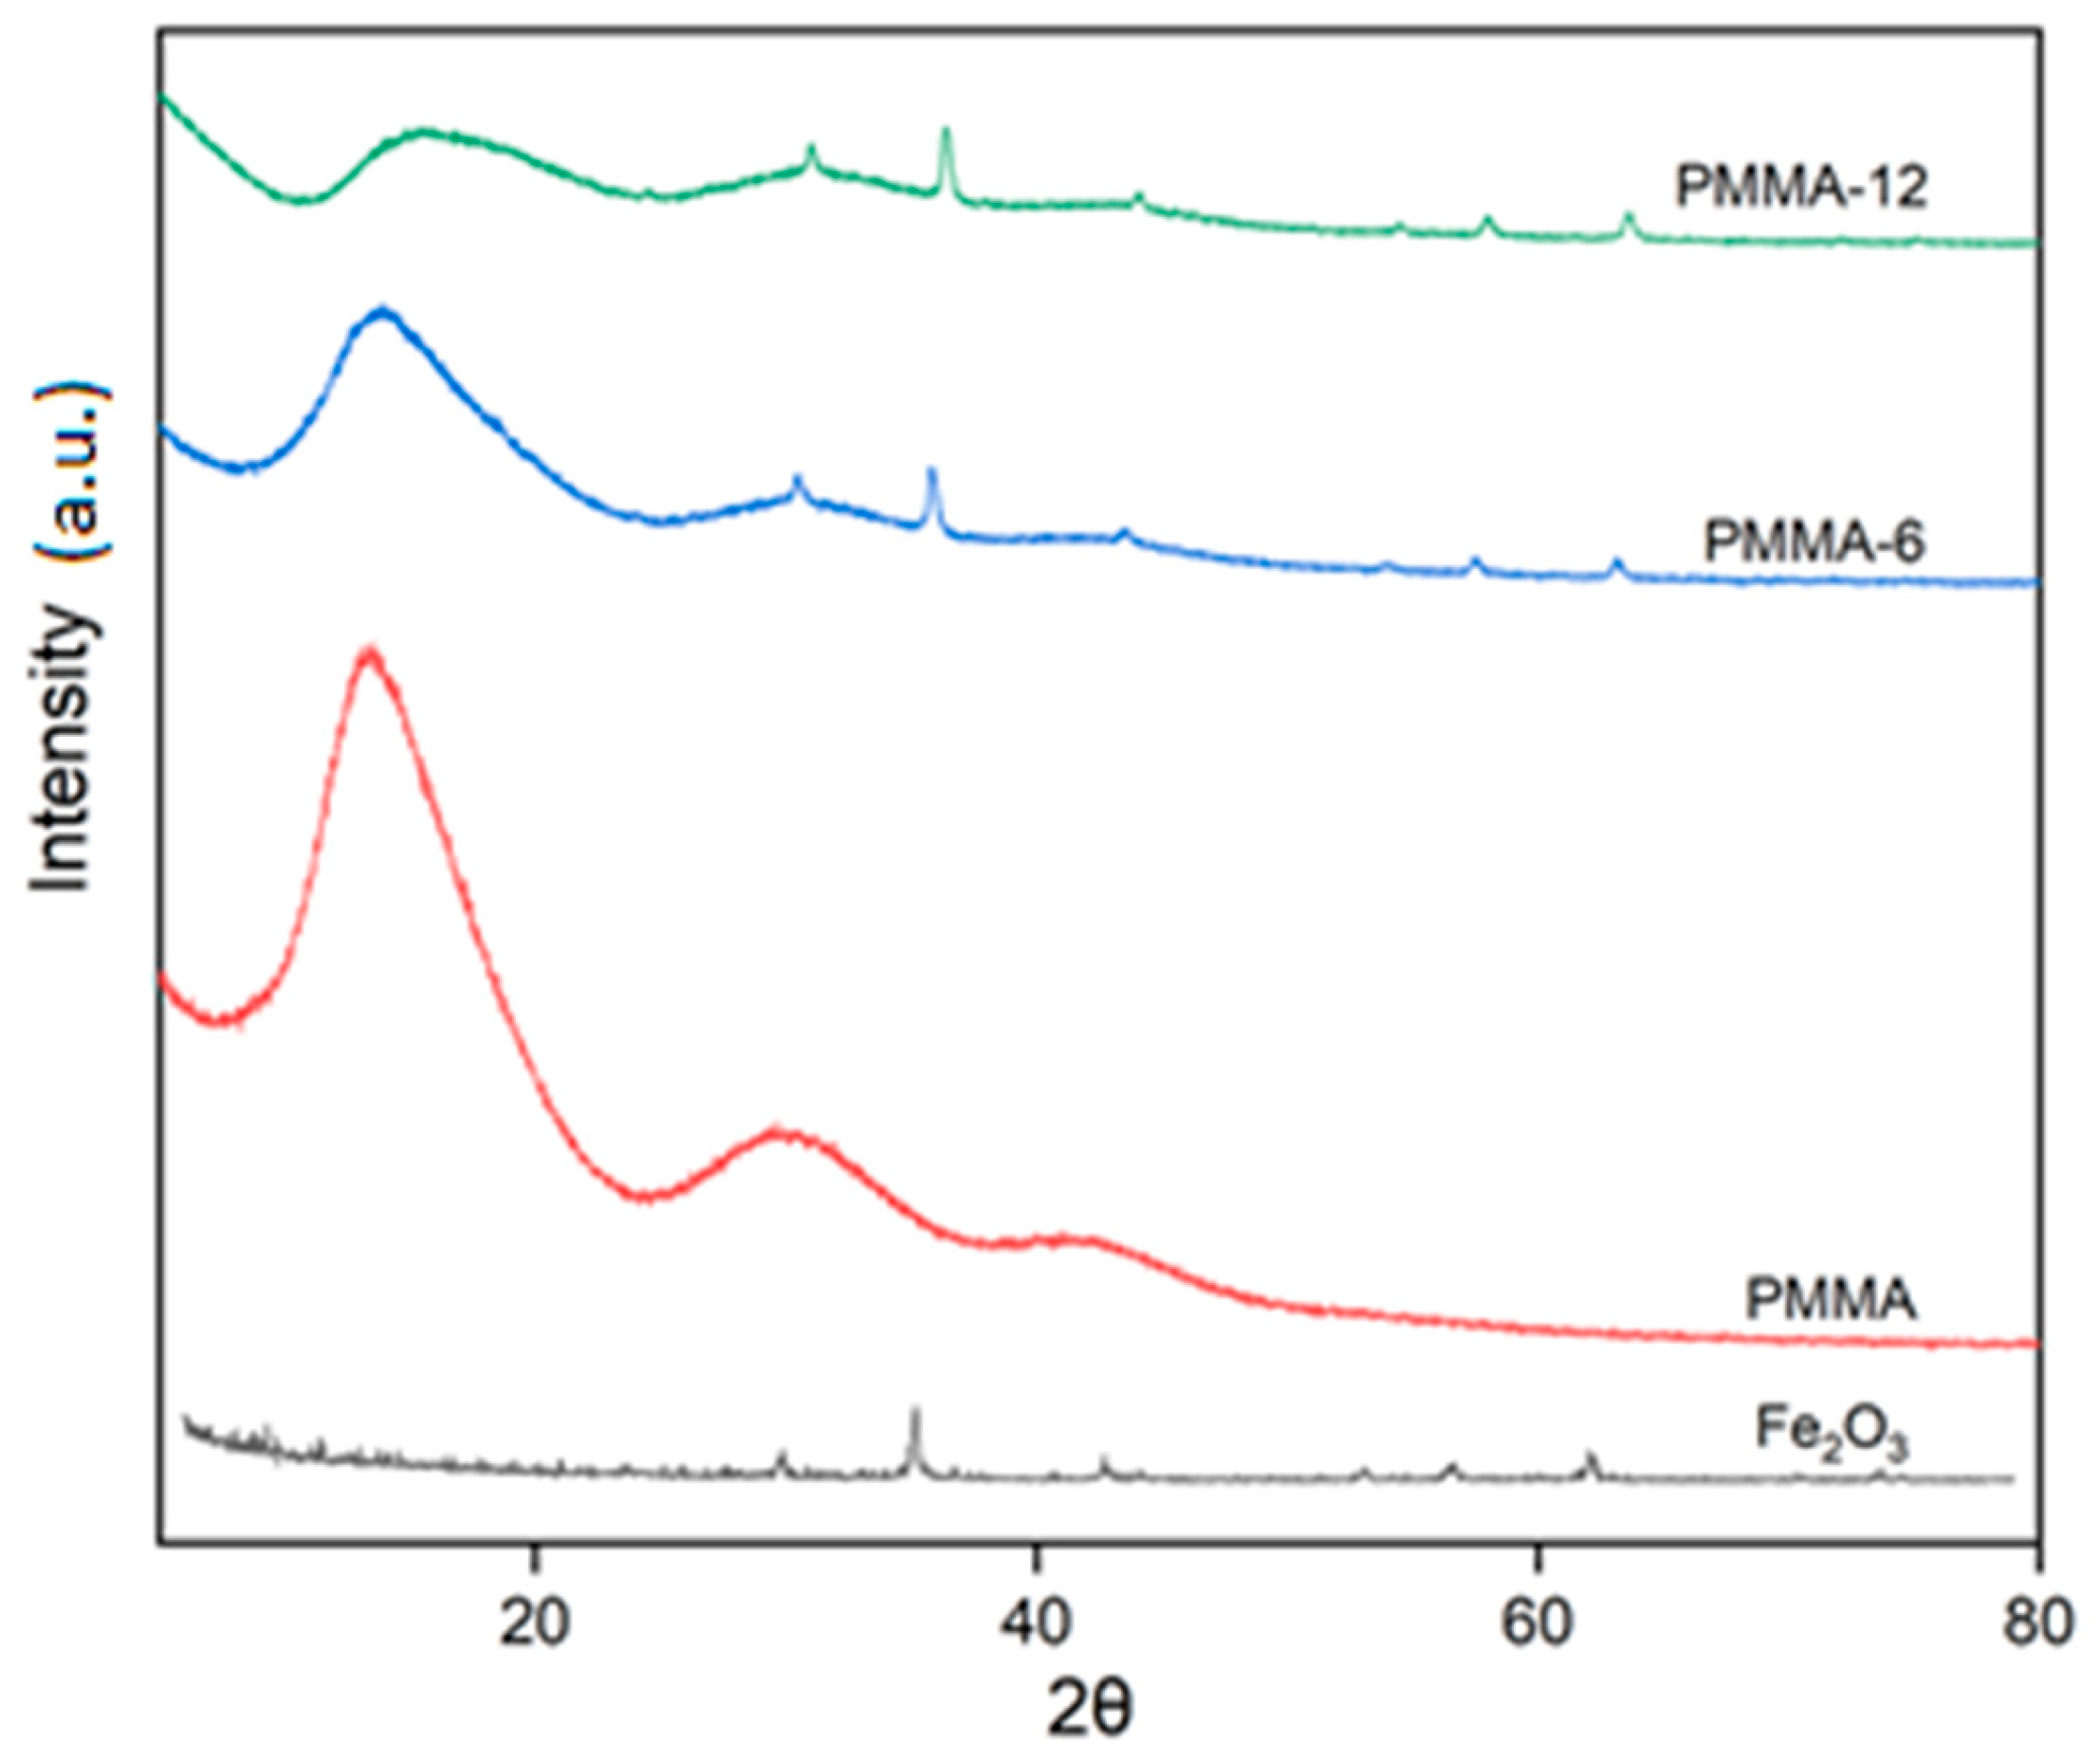
Figure 3.
SEM micrographs of (a) pure PMMA, (b) PMMA-6, (c) PMMA-12.
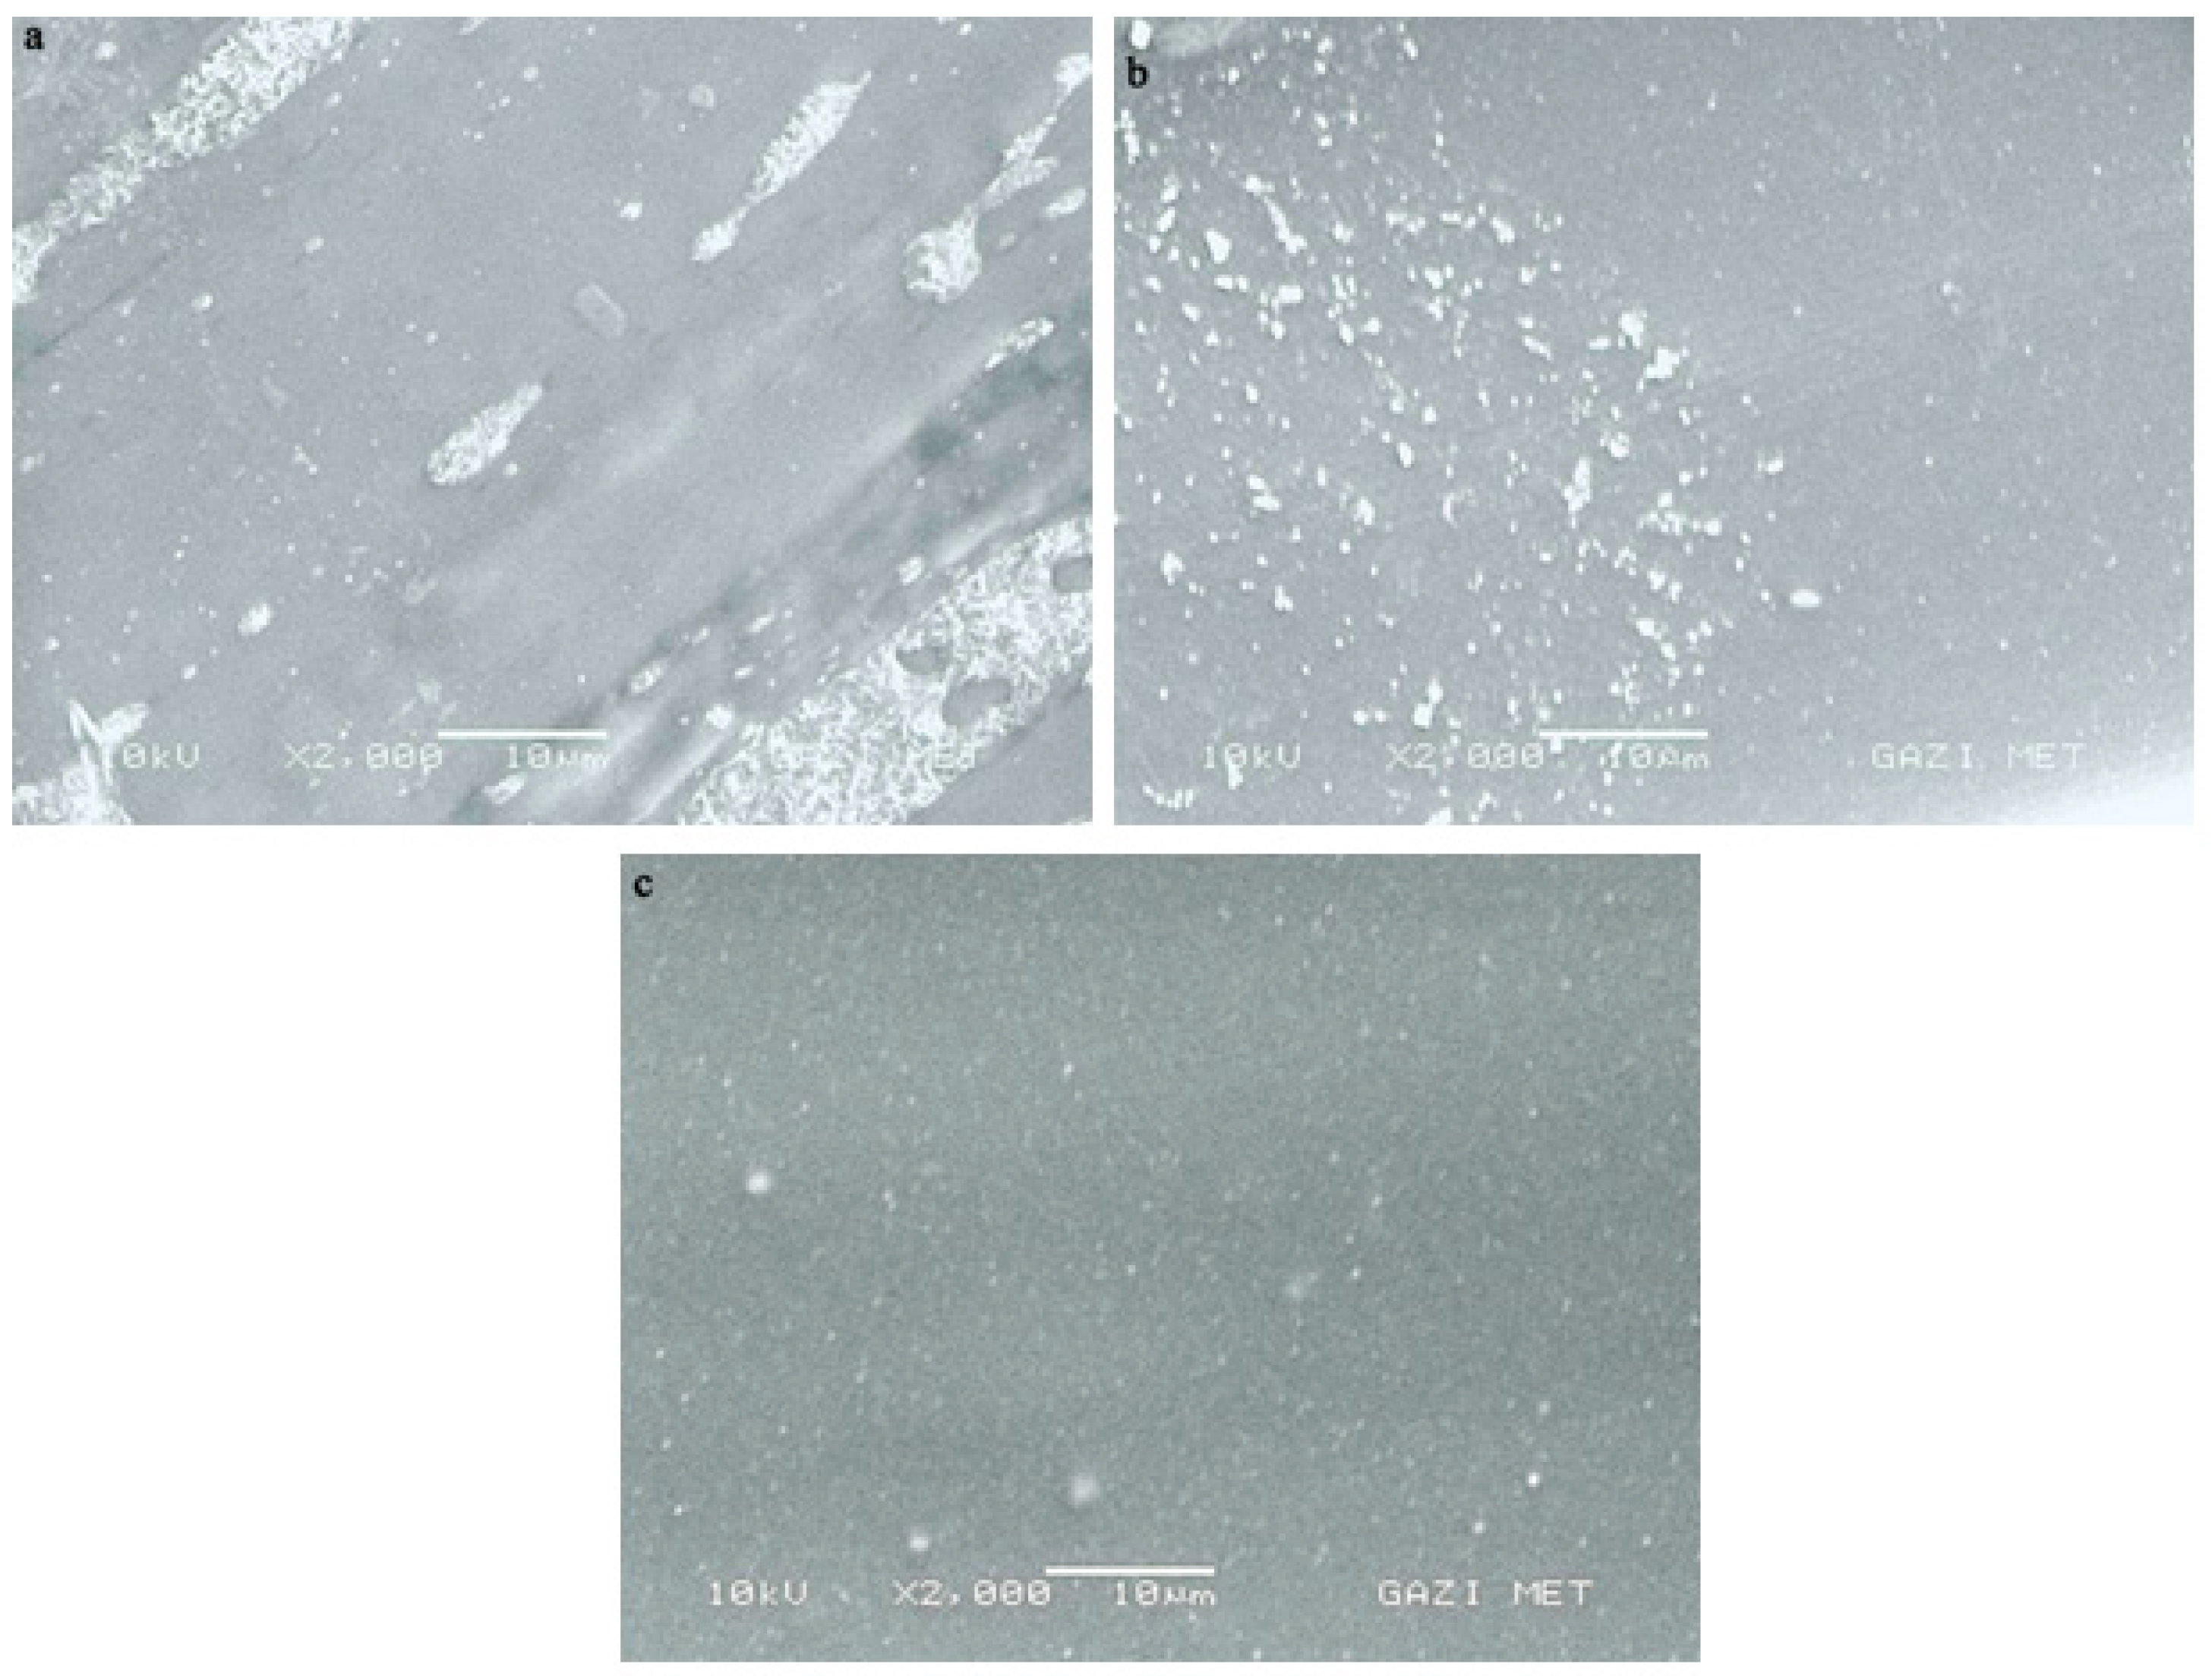
Figure 4.
DTA graphics of the samples (a) PMMA, (b) PMMA-6 and (c) PMMA-12.
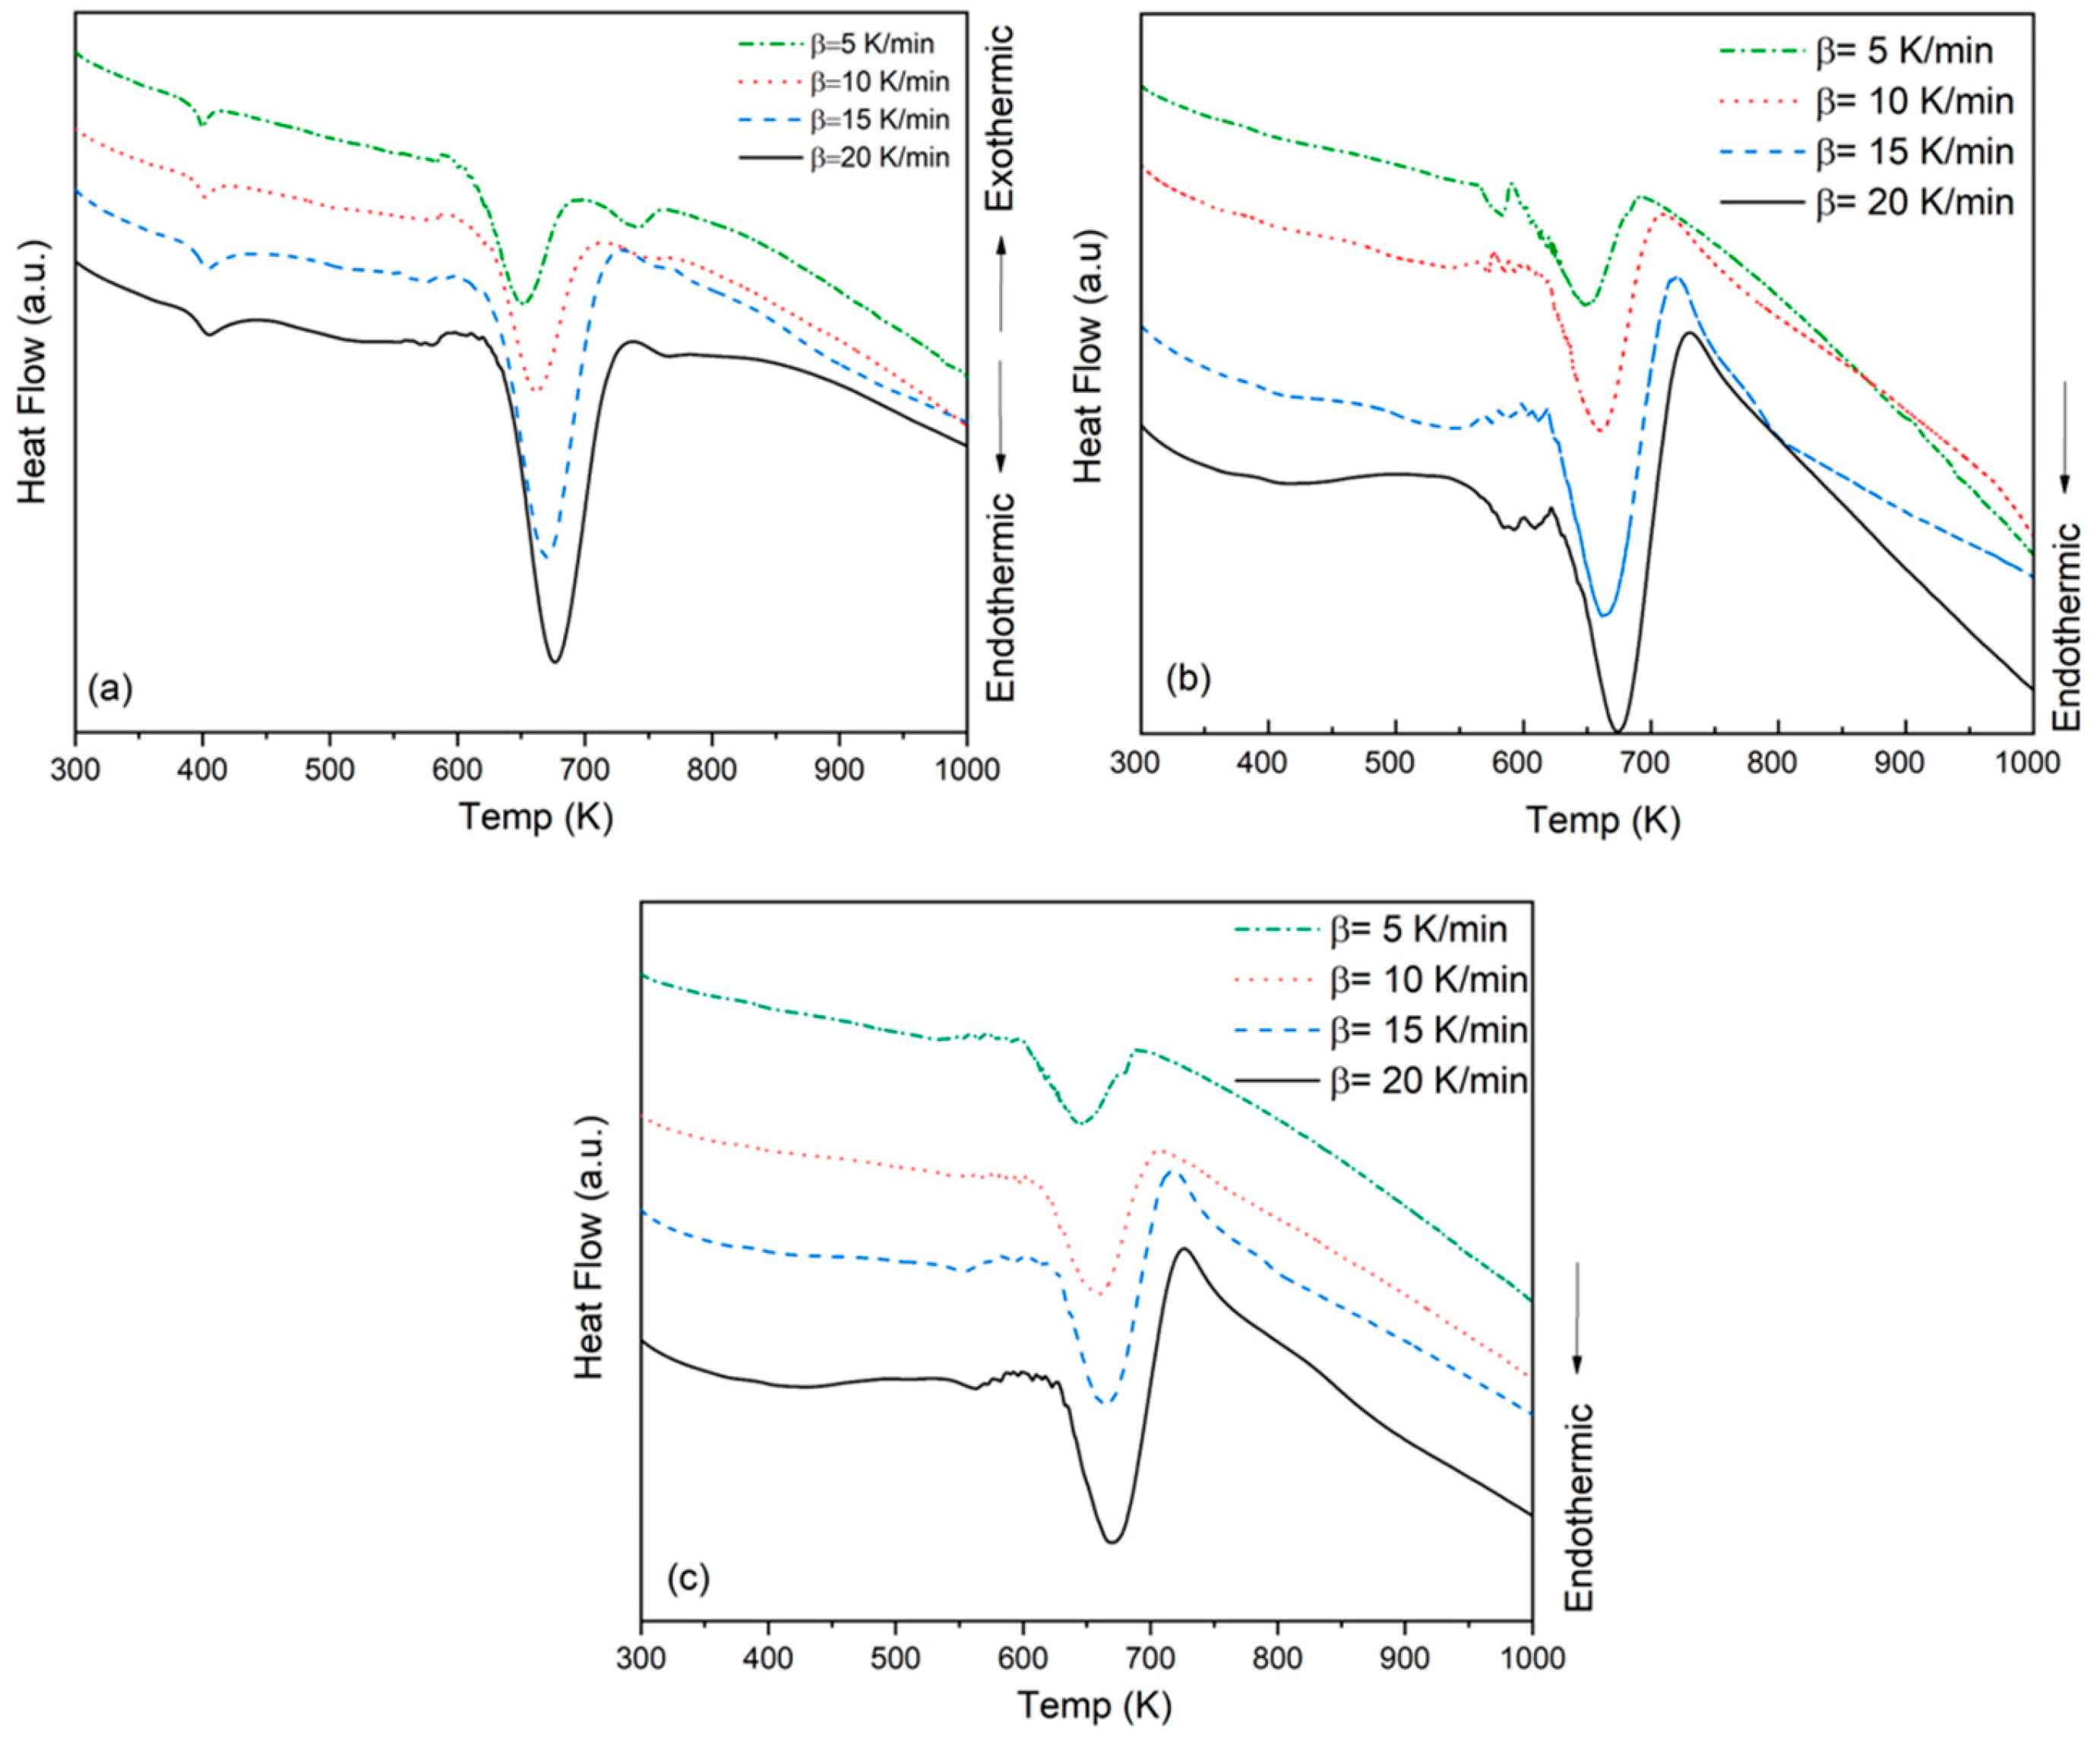
Figure 5.
Ozawa plots for PMMA, PMMA-6 and PMMA-12 samples.
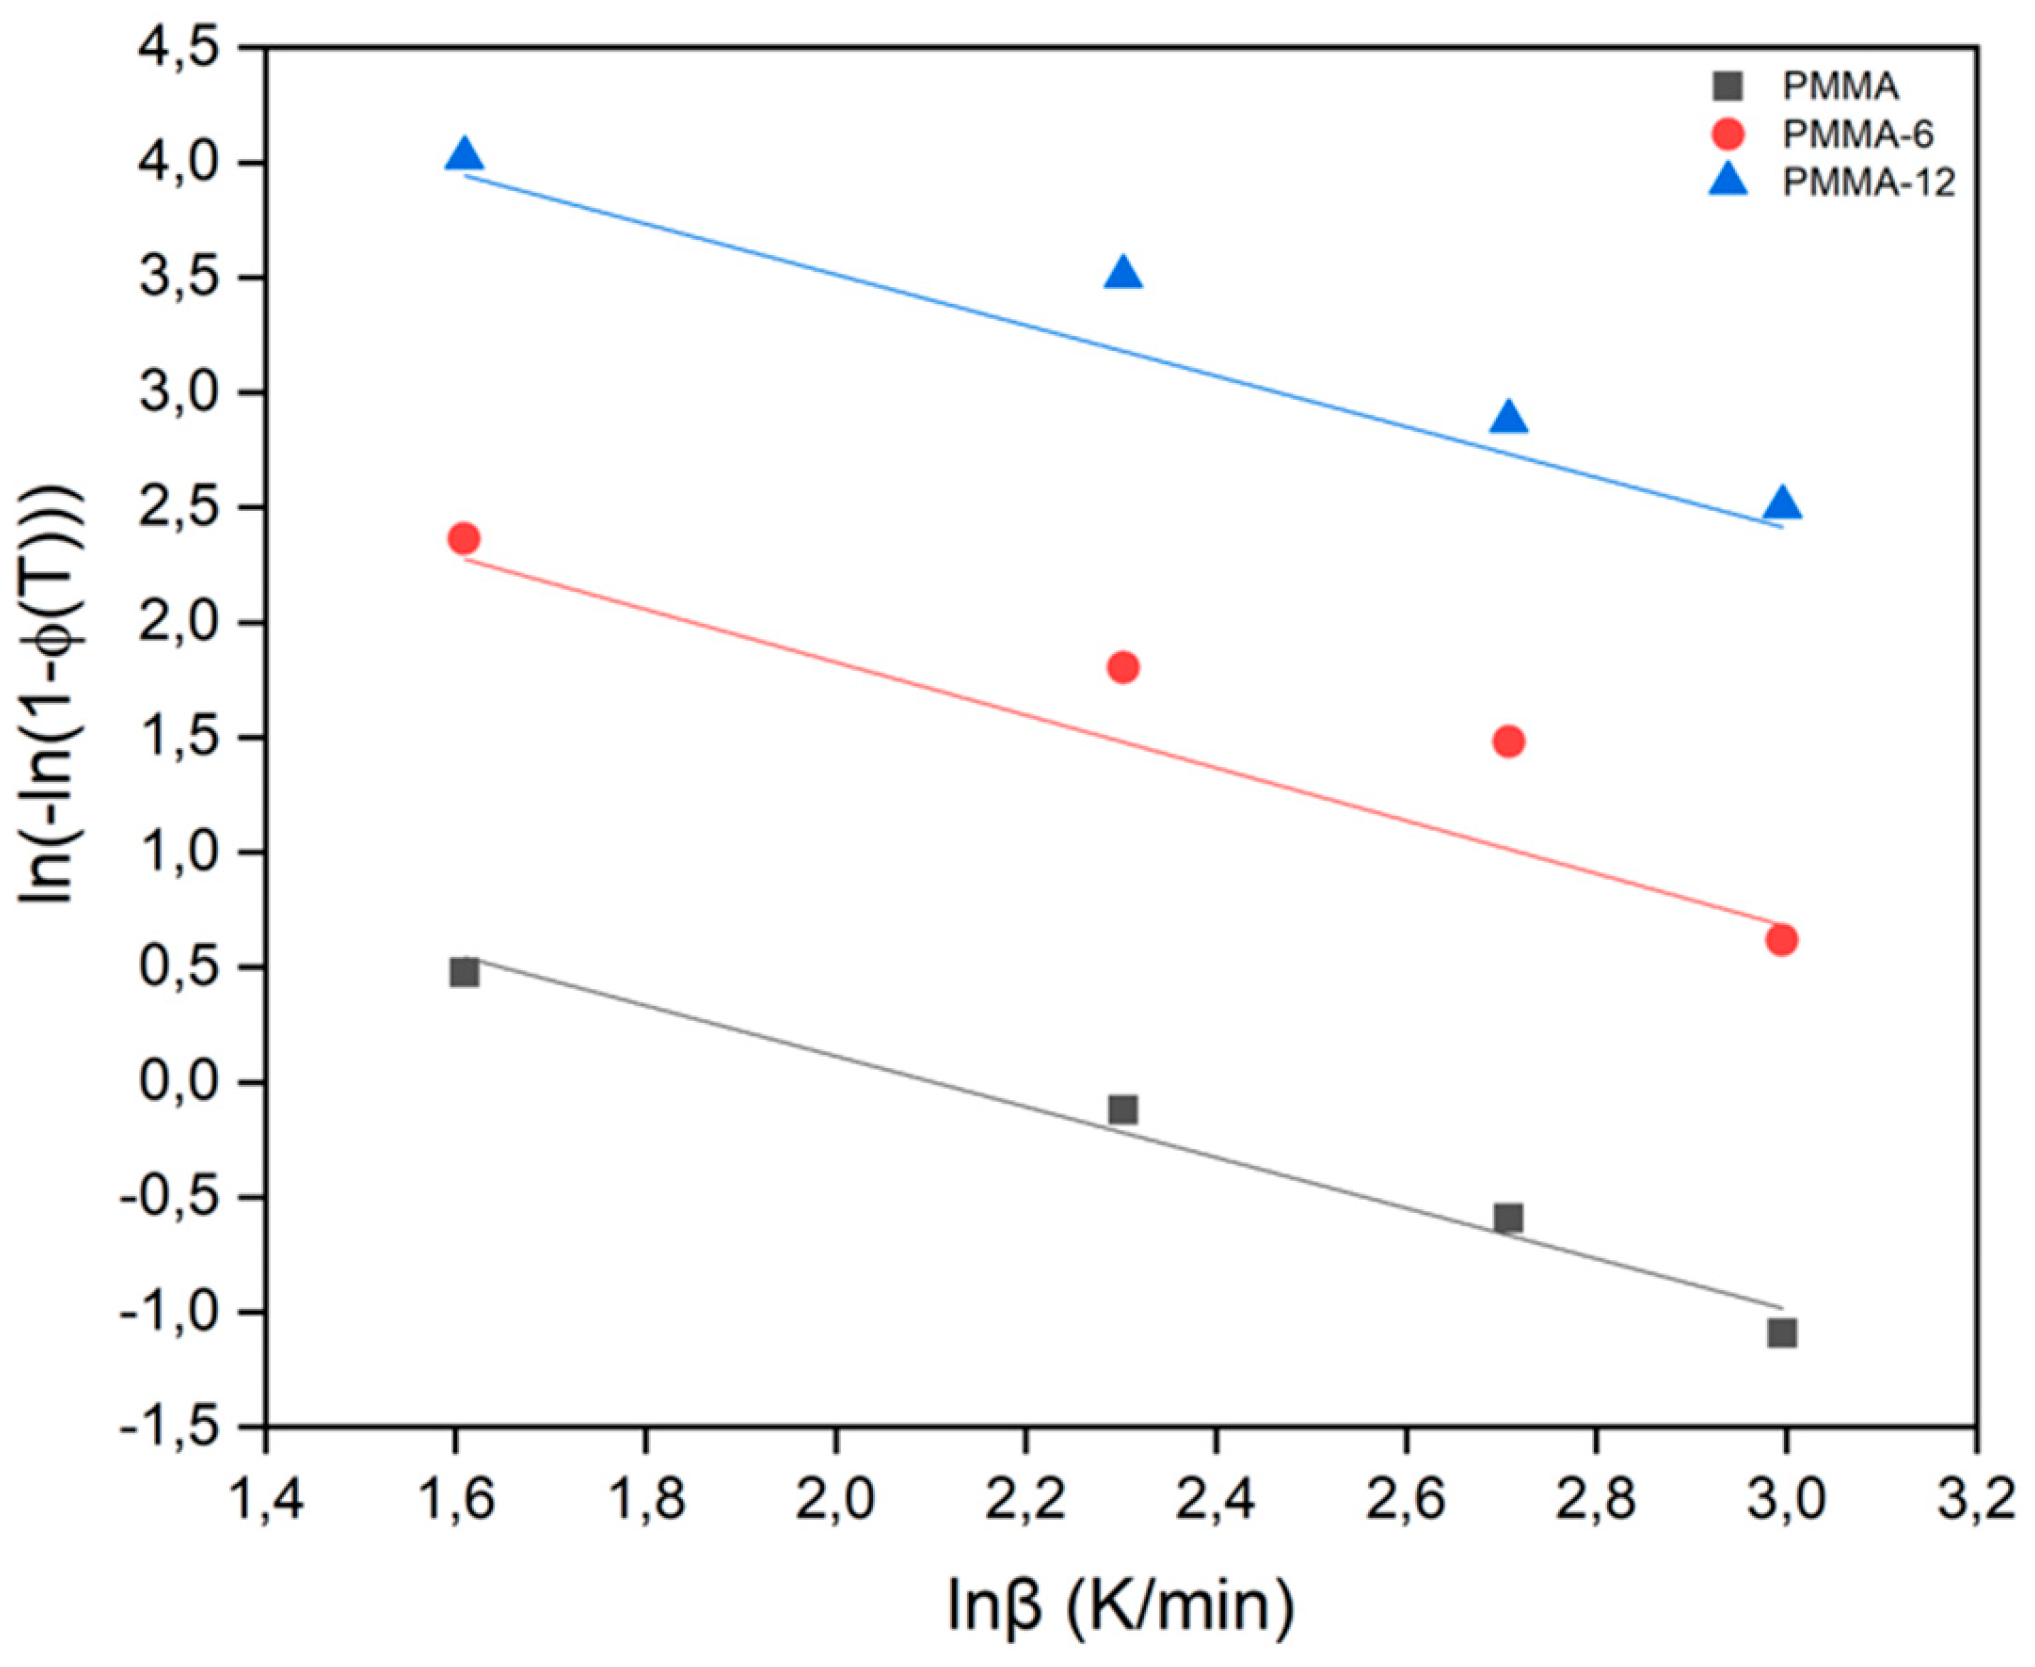
Figure 6.
ln(β/Tx2)-1000/Tx plot for PMMA, PMMA-6 and PMMA-12 samples according to Kissinger Formula.
Figure 6.
ln(β/Tx2)-1000/Tx plot for PMMA, PMMA-6 and PMMA-12 samples according to Kissinger Formula.
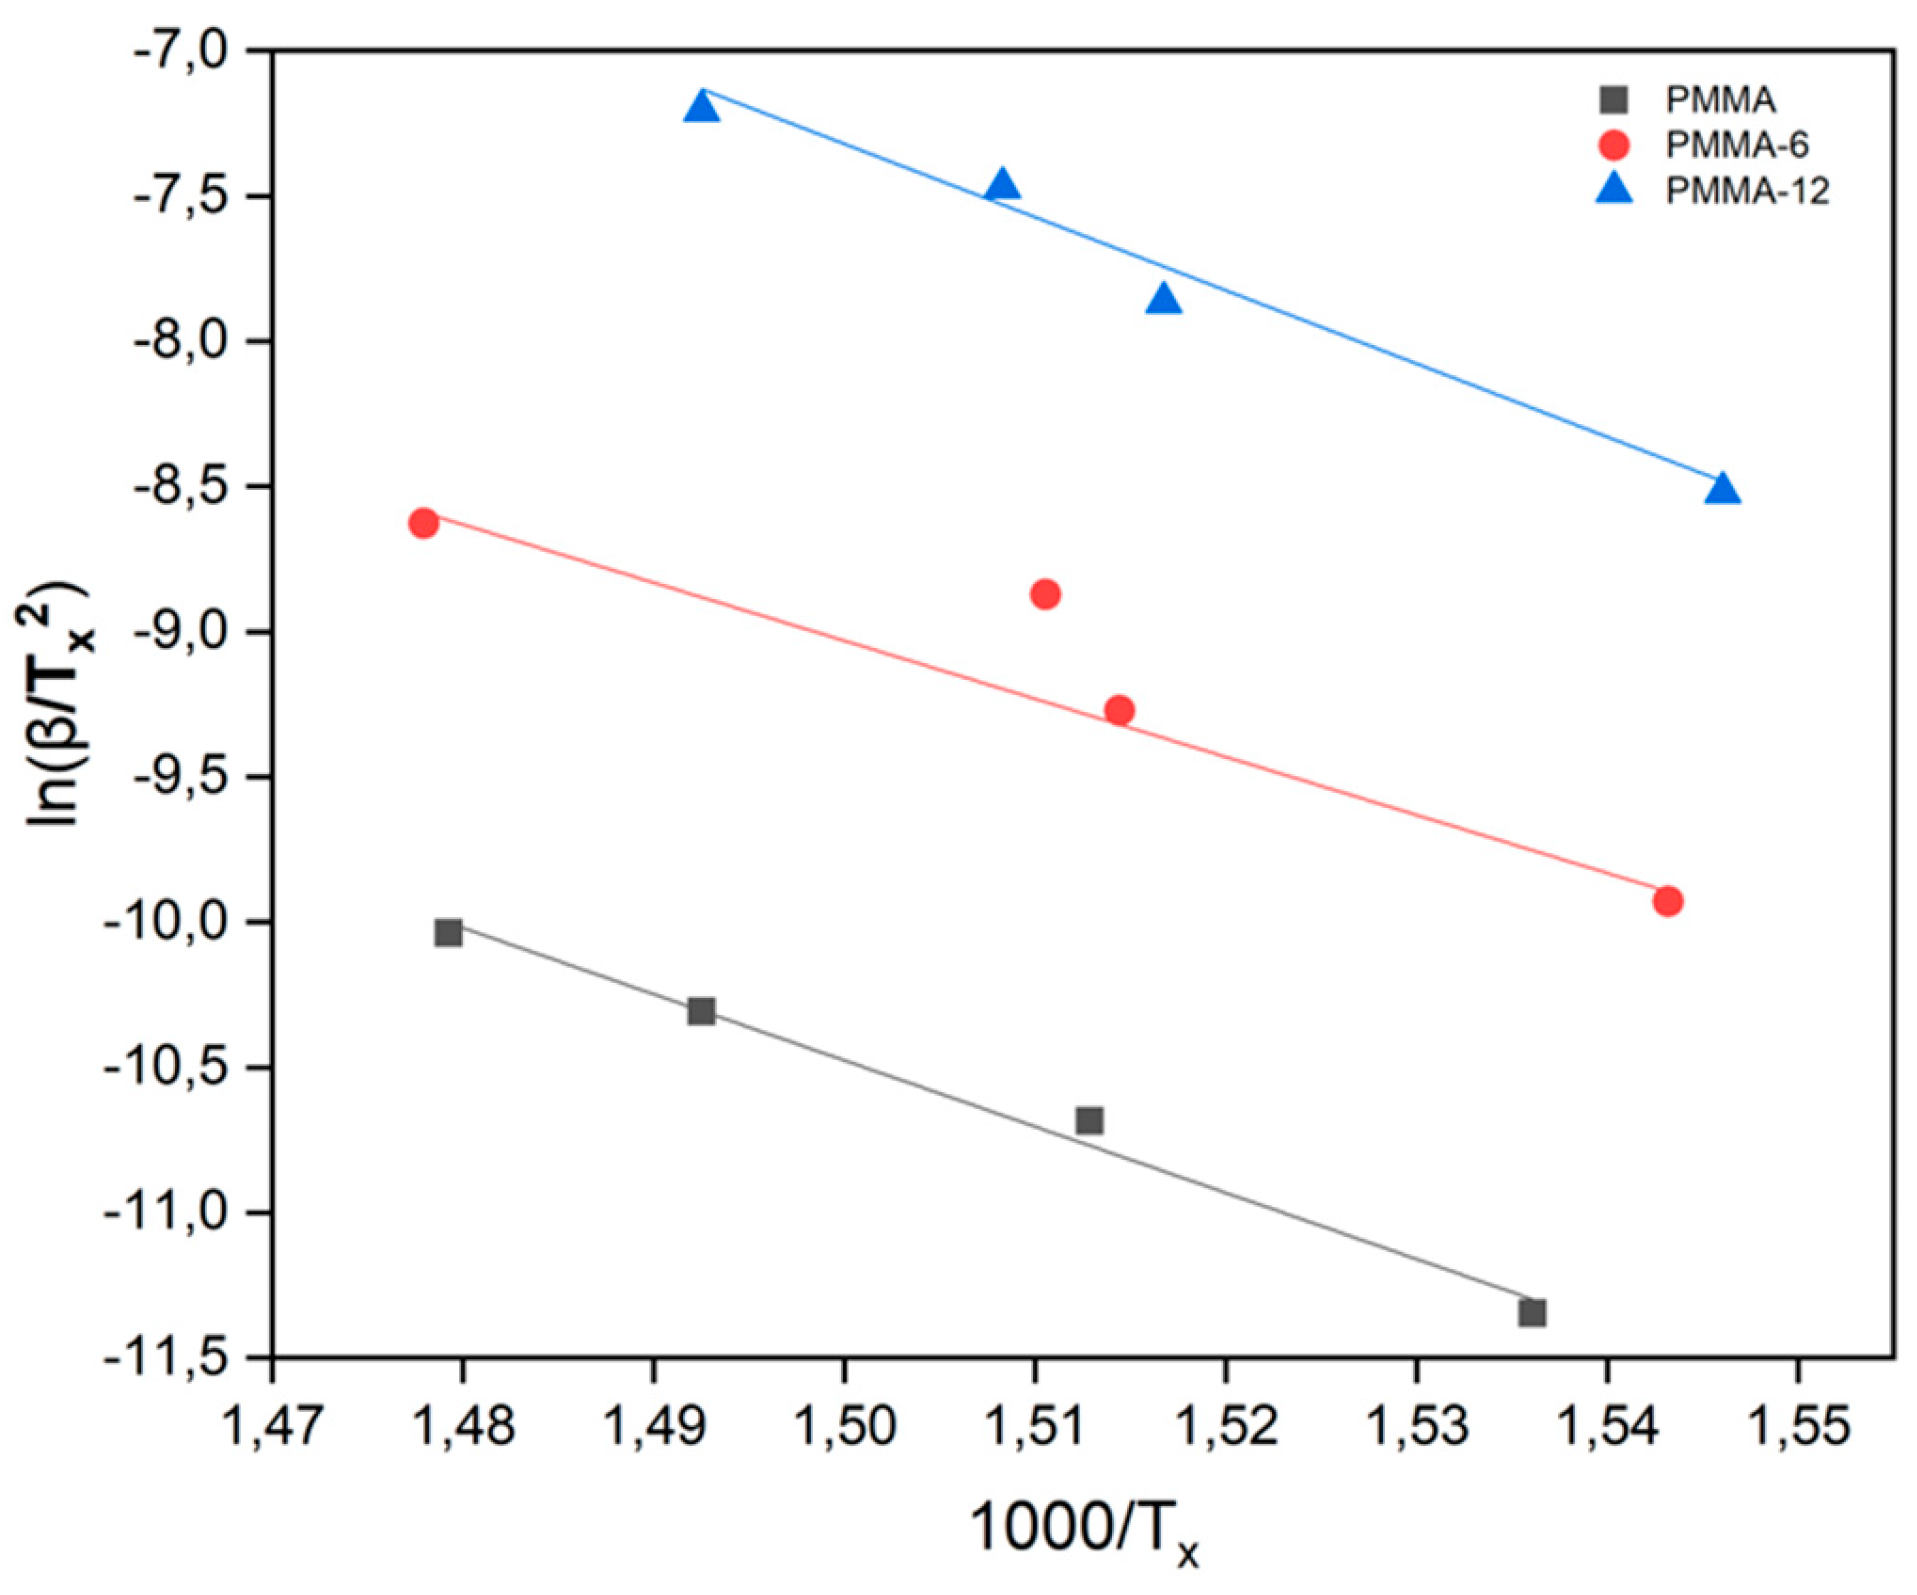
Figure 7.
lnβ-1000/Tx graph for PMMA, PMMA-6, and PMMA-12 samples according to Takhor Formula.
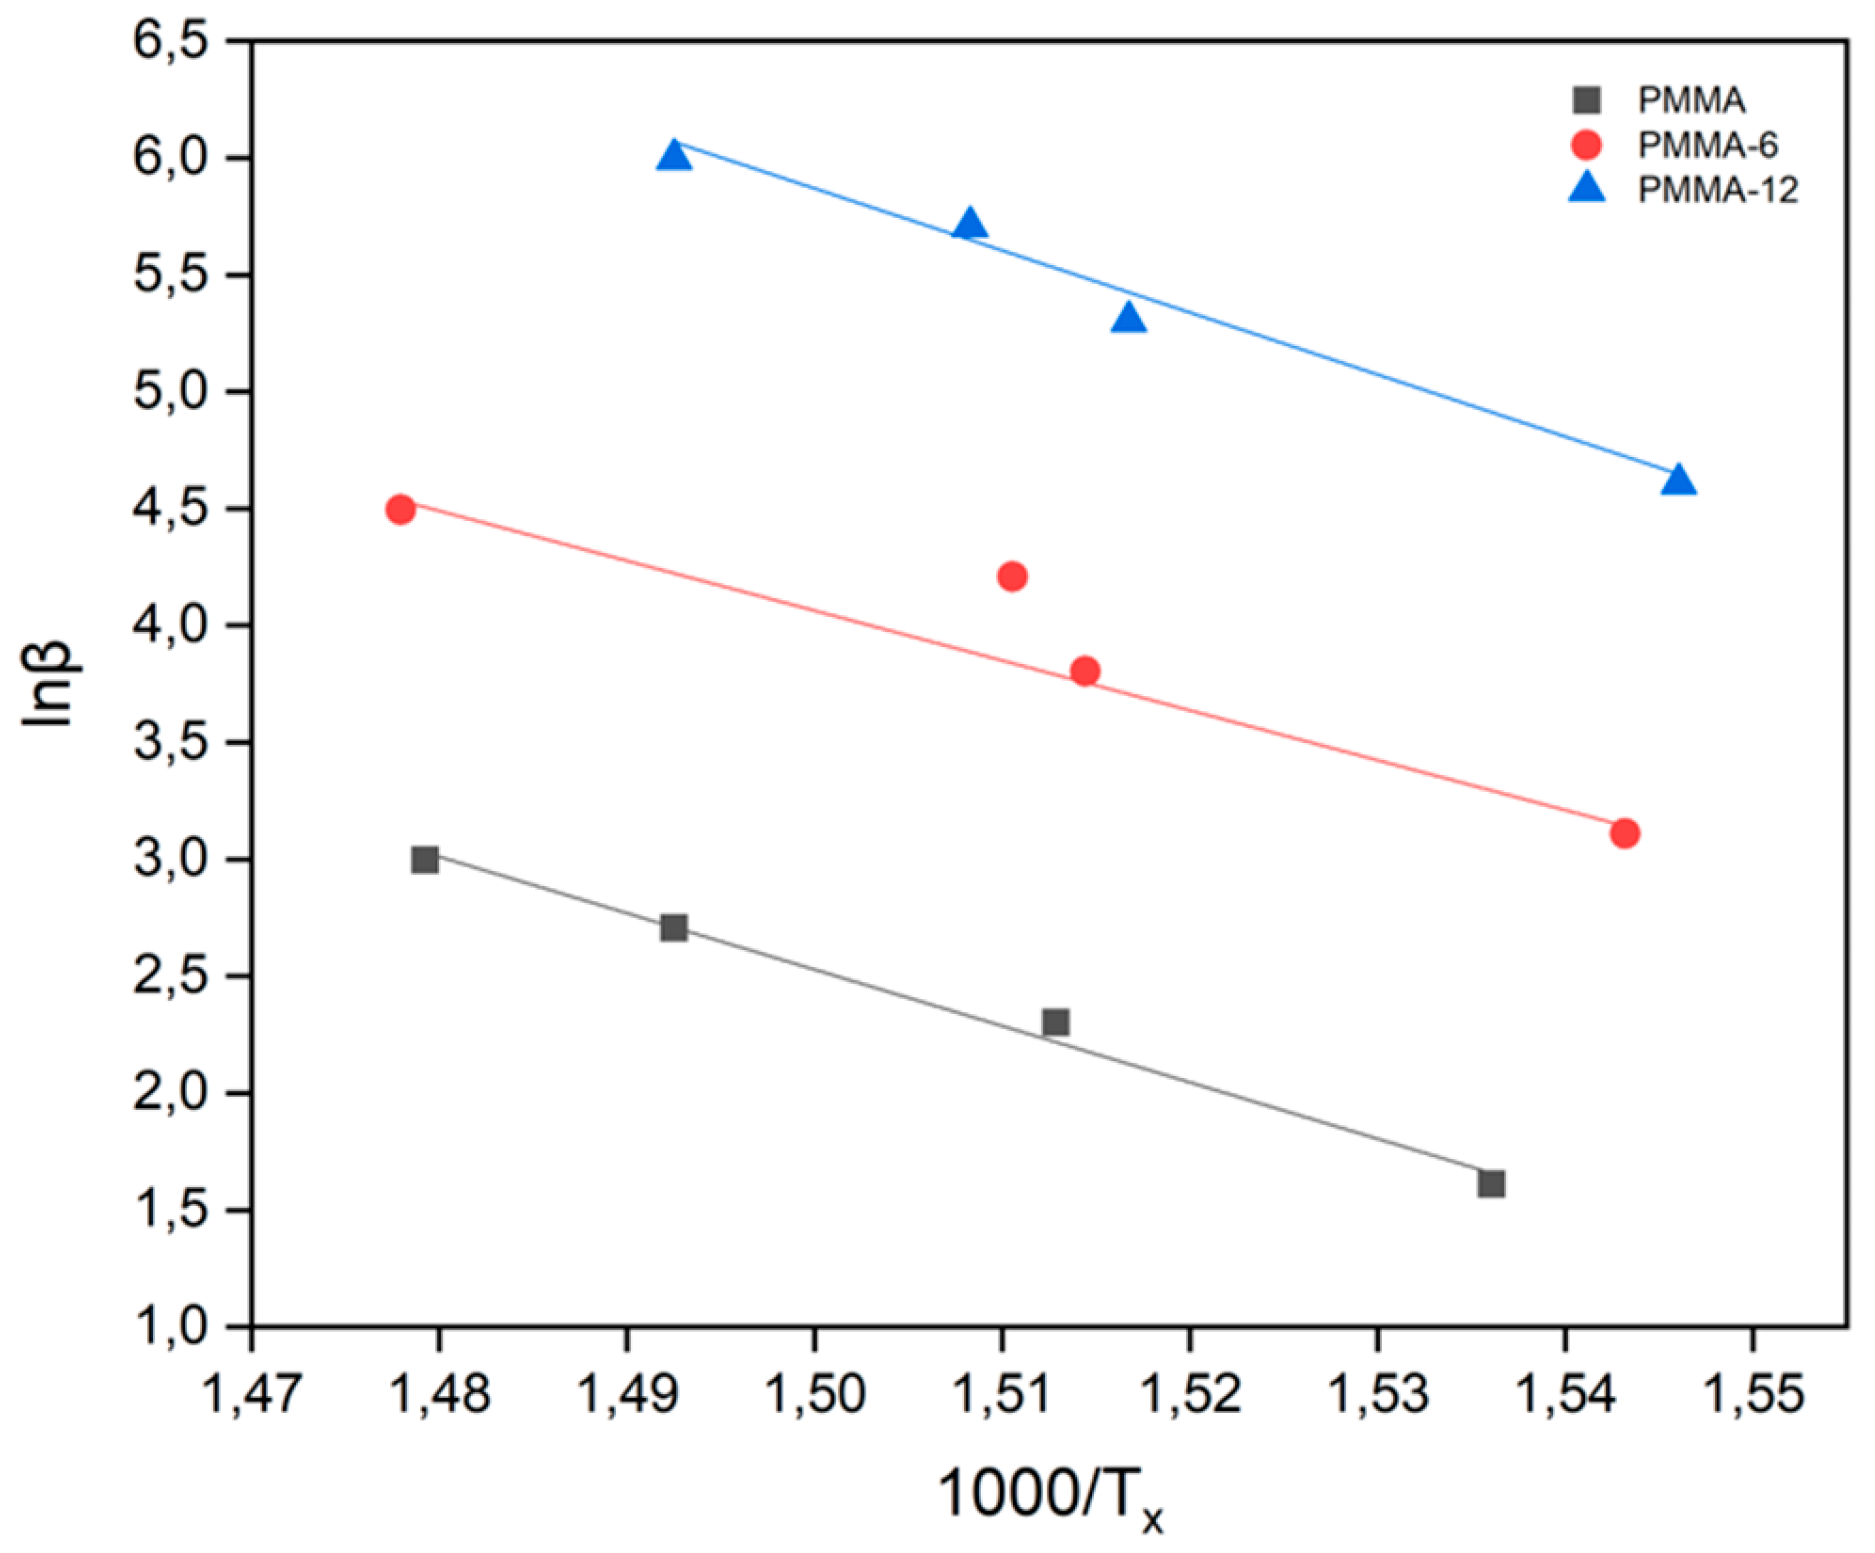
Figure 8.
ln(β/Tx-To)-1000/Tx chart for samples according to Augis-Bennett Formula.
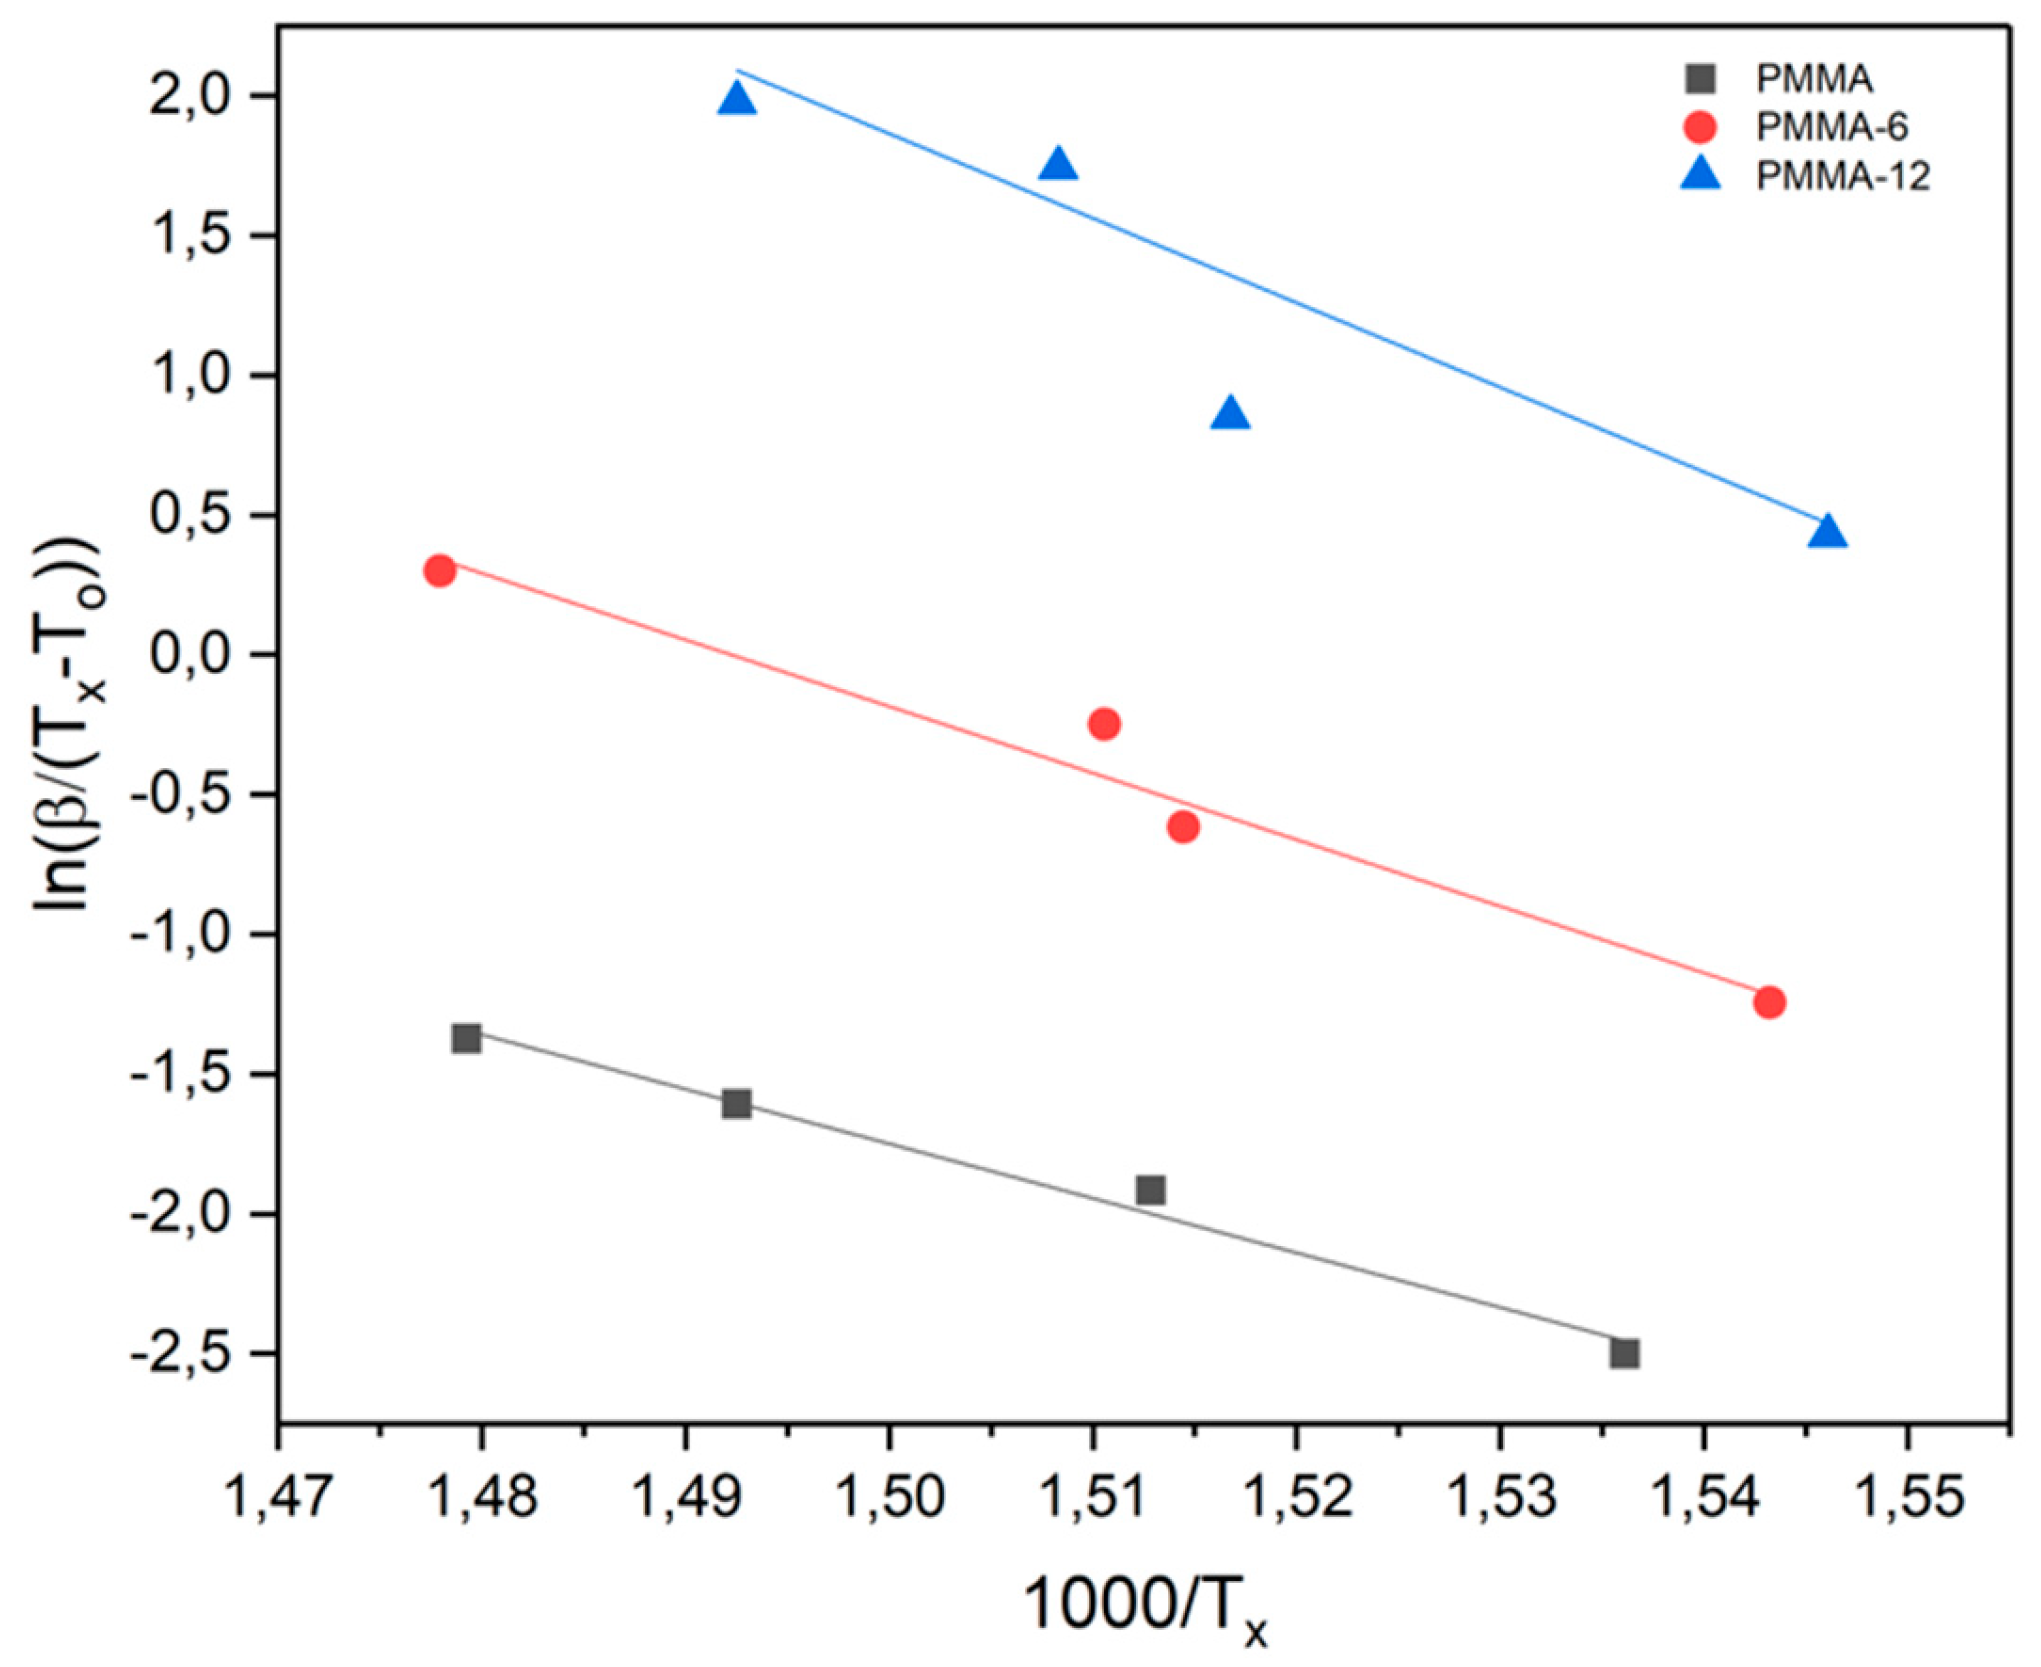
Figure 9.
Temperature/TG graphs showing mass loss of samples.
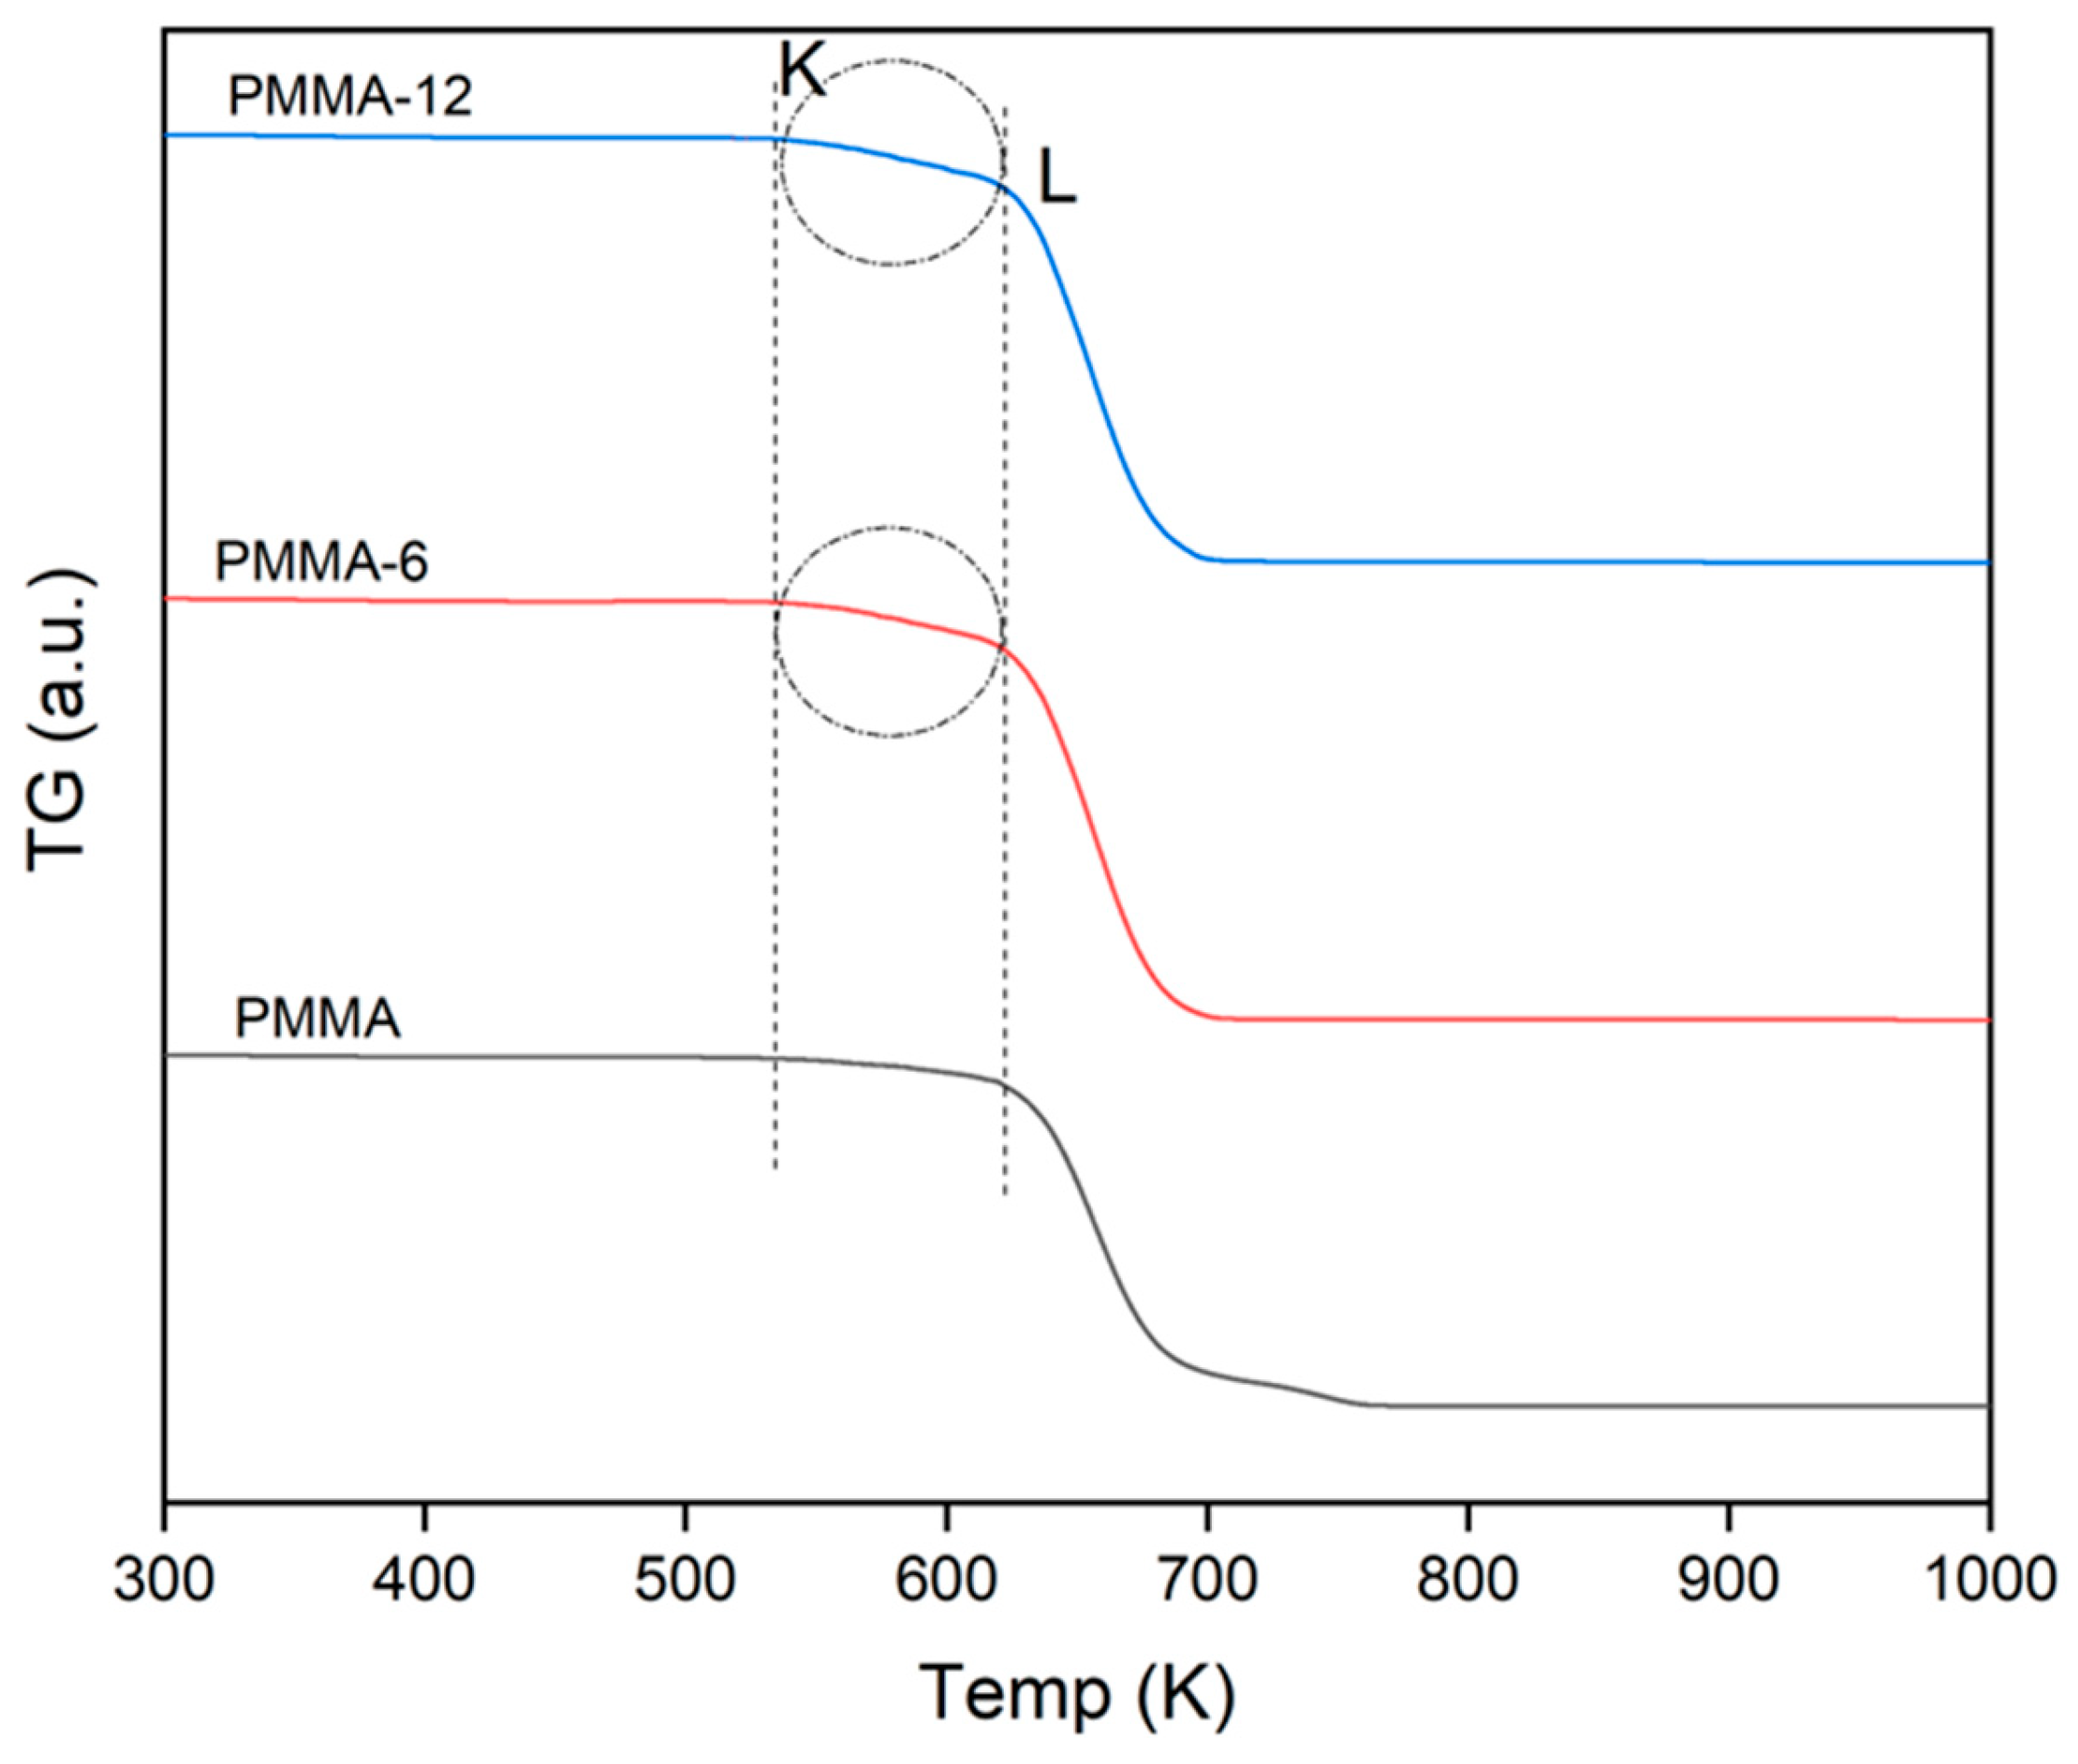

Table 1.
The values for the samples were calculated as a result of DTA analysis.
| SAMPLES |
β (K/min) |
TO (K) |
TX (K) |
A |
| PMMA | 5 | 590 | 651 | 266 |
| 10 | 593 | 661 | 279 | |
| 15 | 595 | 670 | 311 | |
| 20 | 597 | 676 | 281 | |
| PMMA-6 | 5 | 556 | 648 | 372 |
| 10 | 562 | 660 | 323 | |
| 15 | 560 | 662 | 323 | |
| 20 | 598 | 676 | 289 | |
| PMMA-12 | 5 | 594 | 646 | 337 |
| 10 | 590 | 659 | 306 | |
| 15 | 620 | 663 | 274 | |
| 20 | 625 | 670 | 249 |
Table 2.
Activation energies calculated from the values of the samples as a result of DTA analysis.
| Samples | Avrami Parameter | Kissinger Method (Kj/Mol) |
Takhor Method (Kj/Mol) |
Augis-Bennett Method (Kj/Mol) |
| PMMA | 1 | 189 | 200 | 162 |
| PMMA-6 | 1 | 166 | 177 | 198 |
| PMMA-12 | 1 | 209 | 220 | 251 |
Table 3.
Mass loss values for PMMA, PMMA-6 and PMMA-12 samples.
| Samples |
TG (µg) |
K (µg) |
L (µg) |
T5 (K) |
T30 (K) |
T50 (K) |
T80 (K) |
TX |
Residue % |
| PMMA | 11.19 | 11.08 | 10.26 | 601 | 647 | 658 | 682 | 661 | 0.42 |
| PMMA-6 | 13.01 | 12.89 | 11.45 | 582 | 641 | 653 | 671 | 660 | 0.90 |
| PMMA-12 | 13.32 | 13.19 | 11.68 | 578 | 640 | 653 | 671 | 659 | 1.43 |
Disclaimer/Publisher’s Note: The statements, opinions and data contained in all publications are solely those of the individual author(s) and contributor(s) and not of MDPI and/or the editor(s). MDPI and/or the editor(s) disclaim responsibility for any injury to people or property resulting from any ideas, methods, instructions or products referred to in the content. |
© 2026 by the authors. Licensee MDPI, Basel, Switzerland. This article is an open access article distributed under the terms and conditions of the Creative Commons Attribution (CC BY) license.
Copyright: This open access article is published under a Creative Commons CC BY 4.0 license, which permit the free download, distribution, and reuse, provided that the author and preprint are cited in any reuse.


