Submitted:
01 February 2026
Posted:
03 February 2026
You are already at the latest version
Abstract
The assessment of groundwater quality in selected wells of Al Madinah El-Munawwarah region, Saudi Arabia, employed geochemical methods to identify main controlling factors. Key physicochemical parameters, including total dissolved solids (TDS), electrical conductivity (EC), pH, total hardness (TH), and major ion concentrations, were evaluated. The results indicate that several parameters exceed permissible limits established by Gulf and international standards, reflecting highly saline conditions that could adversely affect drinking water safety and agricultural practices. Elevated nitrate levels and other contaminants suggest combined influences of geological processes and anthropogenic activities such as mineral leaching and agricultural runoff. Correlations among various ions reveal complex interactions driven by both natural and human factors, notably a moderate correlation between nitrate and sewage indicators in the basaltic aquifer. Heavy metals in groundwater were classified into two groups: those within permissible limits (Ag, Ba, Be, Cd, Cr, Cu, Hg, Mn, Ni, Pb, Sb, and U) and those exceeding recommended limits (Zn, Al, As, Se, and Tl). Elevated metal concentrations are primarily attributed to water–rock interactions and the fertilizer use in surrounding agricultural areas. These findings highlight the urgent need for continuous monitoring and proactive groundwater to ensure sustainable and safe use of water resources.
Keywords:
groundwater quality
; geochemistry
; physicochemical parameters
; heavy metals
; Al Madinah El-Munawwarah
1. Introduction
Groundwater is a vital resource in Saudi Arabia, particularly in arid to semi-arid regions facing rapid population growth, urbanization, and industrial expansion [1,2]. Shallow aquifers occur mainly in wadis and coastal areas, while deep sedimentary aquifers serve as major reservoirs [3,4]. Assessment of groundwater quality typically focuses on key cations, anions, and heavy metals [5,6,7,8,9,10,11,12].
Al-Madinah Al-Munawwarah (abbreviated as Al Madinah in the present paper), an important pilgrimage city, experiences increasing water demand for domestic and agricultural purposes. Local aquifers, composed of fractured Precambrian rocks and sedimentary formations, are exploited to meet these needs [13,14,15,16]. The region suffers from water scarcity due to high temperatures, low rainfall, and excessive groundwater extraction [5,14,15,16]. Harrat Rahat, a basaltic volcanic exposure covering the southeastern section of the Al Madinah area, consists mainly of basalt and andesite from the Tertiary–Quaternary periods. Fracturing associated with the Red Sea formation facilitated groundwater movement. Basaltic flows and cones indicate past volcanic activity, with the last eruption recorded in 1256 AD [13].
Physicochemical parameters such as pH, TDS, EC, total hardness, and ion concentrations (Ca2+, Mg2+, Na+, K+, NH4+, Cl−, HCO3−, NO3−, SO42−, F−) are critical in evaluating water suitability for drinking and agriculture. High TDS levels indicate elevated dissolved salts, making water unpalatable and unsuitable for drinking while also causing salinity stress that negatively affects soil and plant growth. pH influences nutrient availability and microbial activity in soils, with extreme acidity or alkalinity posing risks to agriculture and human health. Elevated nitrate and heavy metal concentrations can result from both natural geochemical processes and anthropogenic activities, including mineral leaching and fertilizer use.
Heavy metals (HMs) pose serious environmental and health risks as they leach from igneous and metamorphic rocks into groundwater, particularly in mineralized and mining regions [17,18,19,20,21]. Although some metals such as copper and zinc are essential at low concentrations, elevated levels can cause chronic health effects, including kidney toxicity. Consequently, strict drinking-water limits for heavy metals, including uranium, have been established by World Health Organization (WHO) and the U.S. Environmental Protection Agency (EPA).
In western Saudi Arabia, especially at Al Madinah area, growing attention to groundwater quality reflects its importance for agricultural development [22,23,24,25,26]. The presence of old copper and zinc mines increases the risk of heavy-metal contamination, emphasizing the need for comprehensive geochemical assessment of groundwater quality in comparison with WHO, EPA and Gulf Standards Organization (GSO) standards.
This study evaluates groundwater quality in wells from Al Madinah region through analysis of key physicochemical parameters, major ions, and heavy metals. The study provides data to support groundwater management strategies and inform local authorities in line with Saudi Arabia’s Vision 2030. The study addresses the following key research questions: (1) how physicochemical parameters and major ions define the groundwater geochemical signature and influence its suitability for domestic and agricultural use; (2) how heavy metal distributions reveal pollution sources, pathways, and their impacts on groundwater usability for human consumption; (3) how interactions between natural hydrogeological processes and anthropogenic activities modify groundwater quality and can be quantitatively modeled; and (4) whether groundwater exhibits natural contamination and the implications for water management and safe use in drinking and irrigation.
2. Geology of the Study Area
Al Madinah is located approximately 400 km northeast of Mecca and about 150 km east of the Red Sea (Figure 1a), covering an area of around 589 km2, of which 99 km2 is urbanized. The city is considered an oasis surrounded by mountains, interspersed with volcanic fields which sometimes partially encircle it. The valleys and flood channels converge into this oasis, and the region includes cultivated lands and areas suitable for agriculture, depending on the soil characteristics and the availability of water resources. Most parts of Al Madinah are situated on Quaternary formation that extends southward, bordered by basalt and andesite formations, known locally as “Harrat” (Figure 1b). The Quaternary formation consists of sand, silt, and clay, primarily derived from the weathering of rocks transported to the valleys from ancient volcanic formations and Precambrian strata. Figure 1 illustrates the geological map of Al Madinah region, which can be classified into the following rock groups:
2.1. Precambrian Rocks
Precambrian rocks in the Al Madinah region are divided into two groups, namely Al Ays Group and Furayh Group. Al Ays Group occupies the northern and southwestern parts of the Al Madinah area and consists of older volcanic rocks (690 – 800 million years old), including andesite, dacite, trachyte, and rhyolite (Figure 1b). These rocks are intersected by numerous intrusive igneous formations and are overlain in the southern part by the Furayh Group, with sandy and basaltic rocks covering them in the northeastern part. The Al Ays Group comprises two main formations: the Farshah Formation, which consists of andesite and clastic volcanic rocks, and the Urayfi Formation, composed of felsic clastic volcanic rocks interbedded with tuff and rhyolite, along with transported sedimentary rocks. The rocks of the Furayh Group are positioned unconformably over the Al Ays Group. The lower section is made up of volcanic rocks, which include andesite, basalt, volcanic breccia, and tuff, located in the southwestern corner of the geological map (Figure 1b). These rocks display foliation and fractures in multiple directions. (Figure 2a,b). The upper section comprises sandstone and conglomerate with nearly rounded grains, along with thin layers of greywacke with medium- to fine-grained textures bound together by a calcareous matrix. Petrographically, dacite primarily consists of plagioclase with the presence of quartz. In contrast, rhyolite is formed from a combination of potassium feldspar, quartz, and plagioclase, along with biotite and hornblende (Figure 2c,d).
2.2. Plutonic Rocks
The older rock groups were intruded by igneous bodies, including alkali granites, monzogranites, and gabbro. These rocks mainly occur in the western part of Al Madinah (Figure 1b). Dark-colored veins and dykes, ranging from less than a meter to several meters in thickness, occur in these rocks. They sometimes appear as large, embedded masses or as felsic and mafic dykes (Figure 3a–b).
Petrographically, granite is composed of quartz, potassium feldspar, biotite, and plagioclase (Figure 3c). Small amounts of hornblende are also present in some sections. Potassium feldspar occurs as microcline and perthite, occasionally exhibiting a myrmekitic texture (Figure 3d), formed when quartz grows within plagioclase and extends into adjacent feldspar. Gabbro is composed of pyroxene and plagioclase, with minor amounts of iron oxides (Figure 3e,f).
Figure 3.
(a) Alkali granite in contact with older andesite rocks. (b) Intrusions of mafic and felsic dikes within monzogranite in Jabal Ad Dulu. Microscopic images of (c) alkali granite under crossed Nicols, (d) alkali granite under crossed Nicols showing the myrmekitic texture, (e, f) gabbro under plane polarized light and crossed Nicols, respectively. (g) Field image showing the occurrence of Harrat Rahat rocks in the southern part of Al Madinah. (h) Microscopic image of basalt under crossed Nicols.
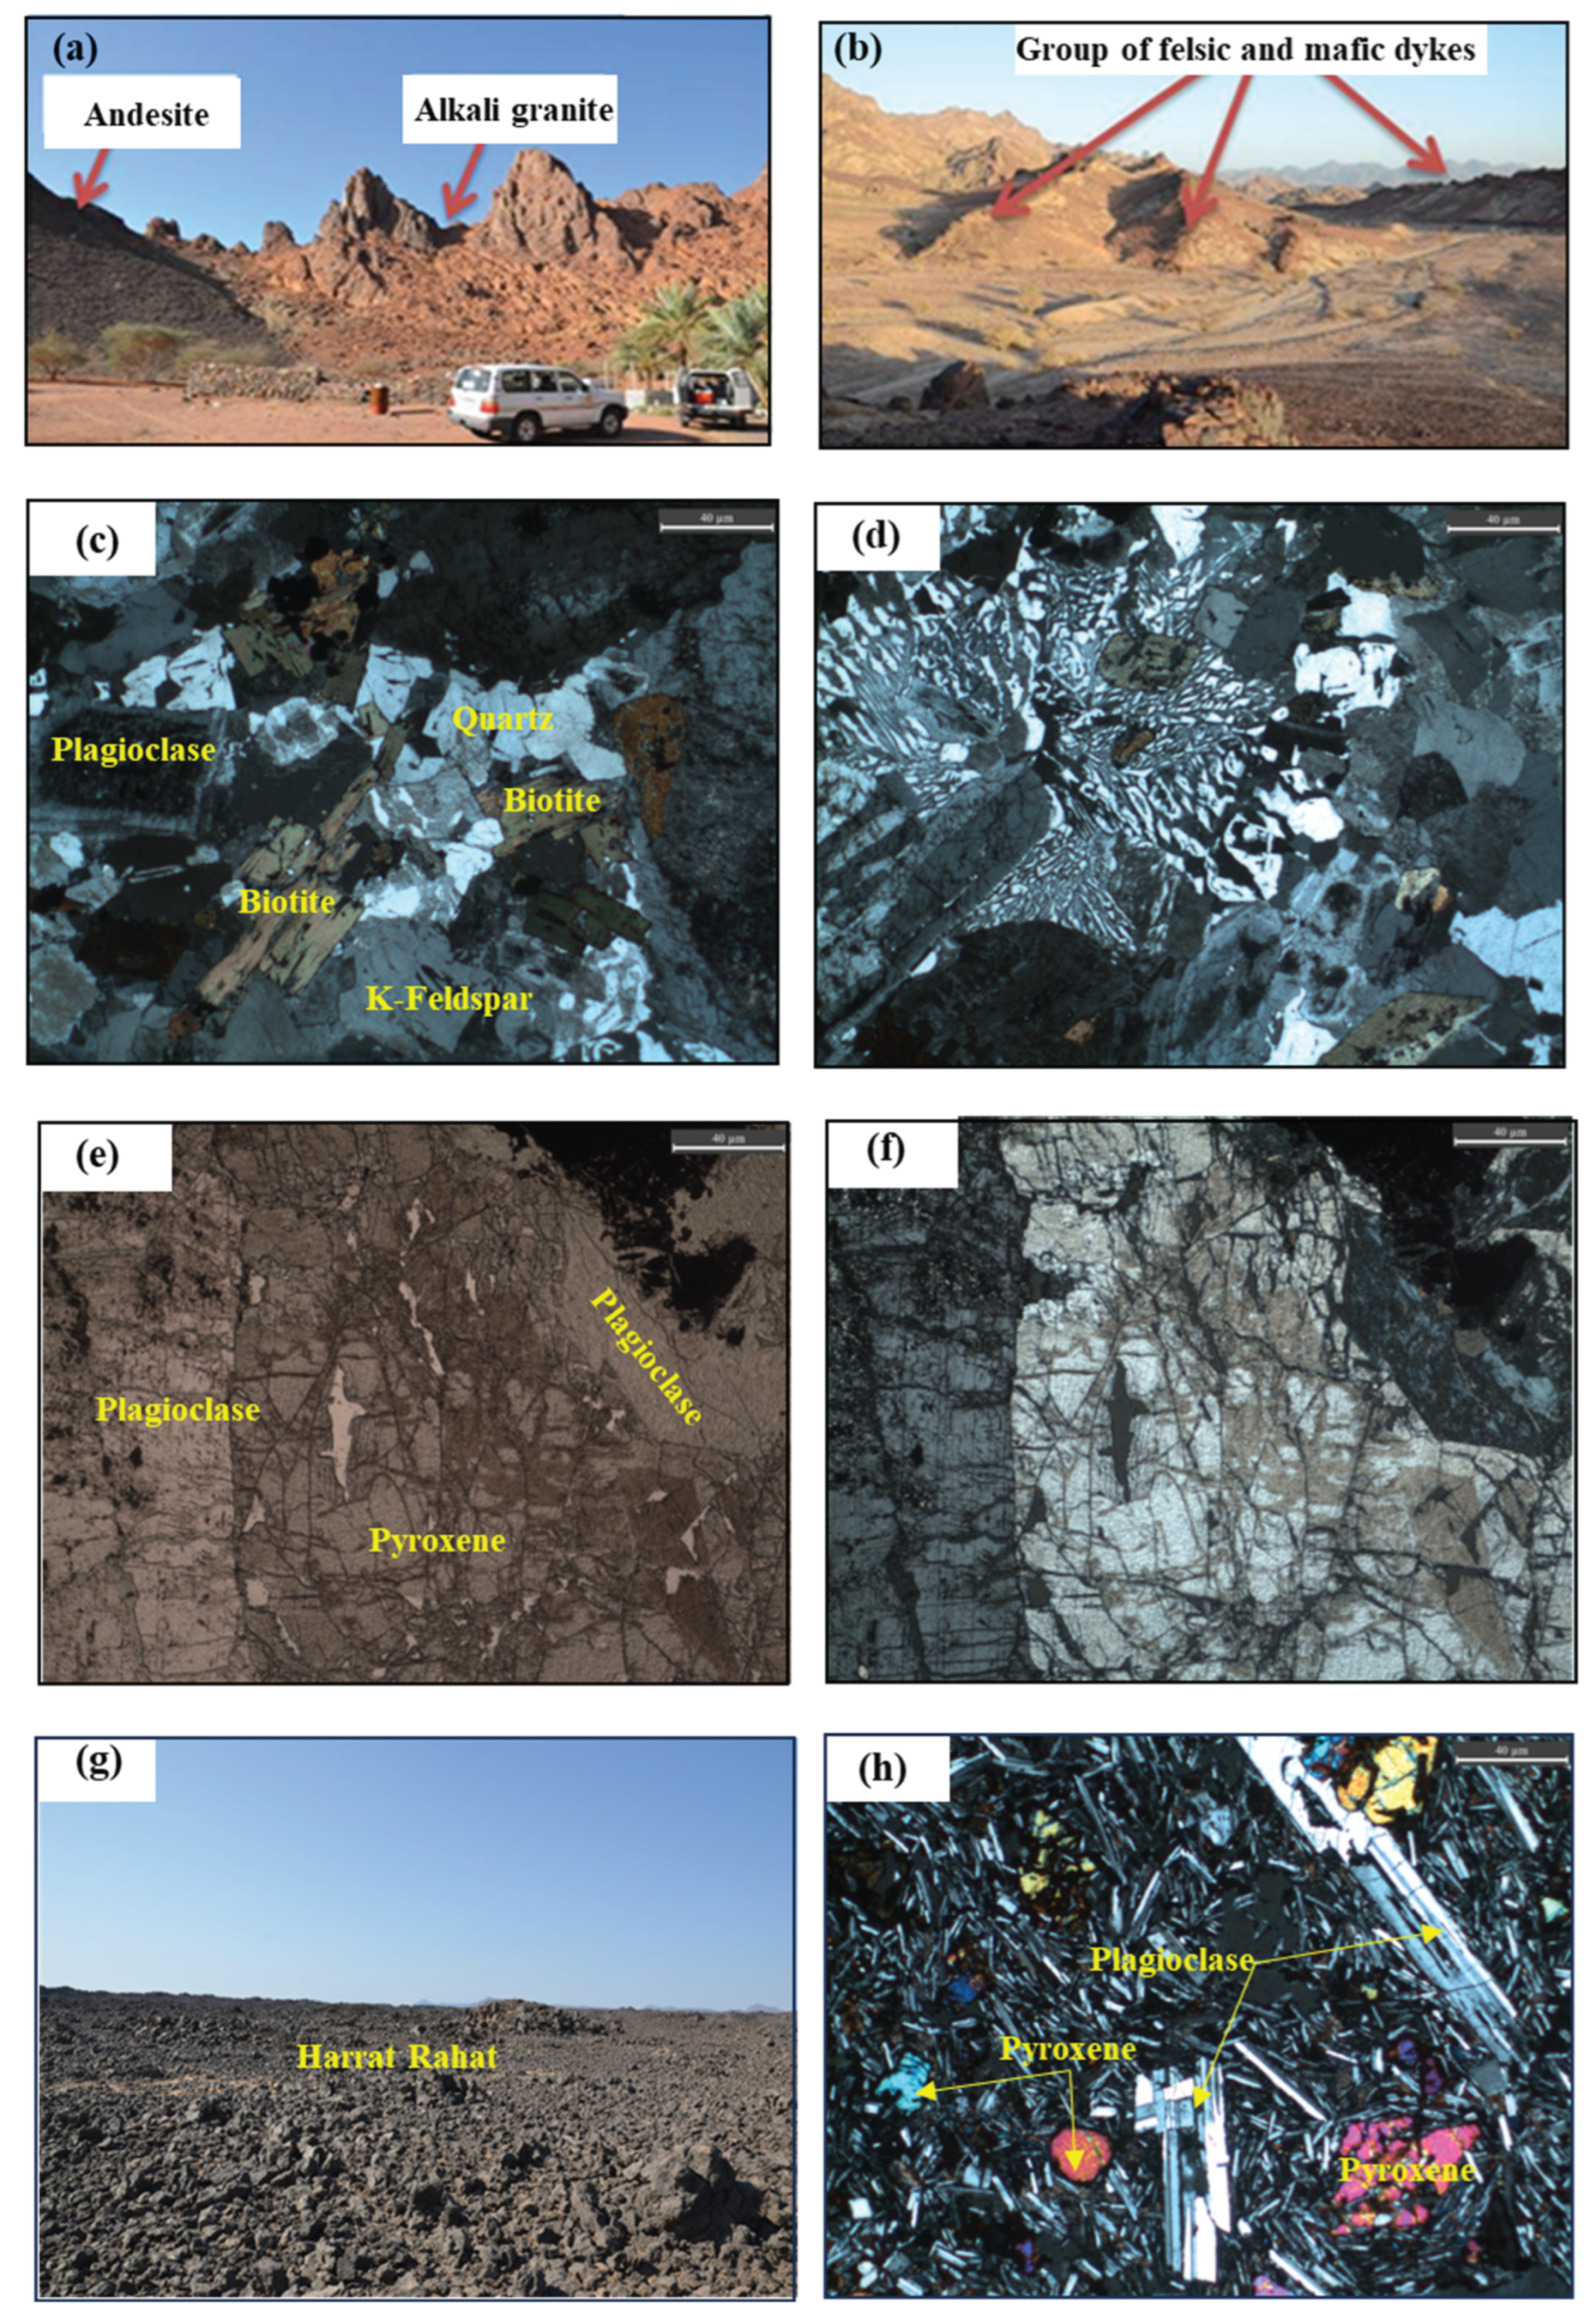
2.3. Recent Volcanics (Harrat)
The volcanic lava surrounding Al Madinah dating to the Tertiary and Quaternary periods and primarily consists of basalt (Figure 3g). This region, known as Harrat Rahat, is the most extensive around Al Madinah, situated between Al Madinah to the north and Wadi Fatima near Mecca to the south, covering an area of approximately 20,000 km2. Harrat Rahat contains over 700 volcanic craters and cones. Petrographically, basalt mainly consists of clinopyroxene and plagioclase and exhibits a porphyritic texture with plagioclase phenocrysts (Figure 3h). Plagioclase typically appears as laths or small crystals, often composed of labradorite or bytownite. Augite is the most common form of pyroxene, present in varying amounts. Weathering products may include clay and iron oxides.
2.4. Recent Sediments
Erosion and weathering of rocks have produced large quantities of gravel of varying sizes, as well as coarse and fine sands, silt, and clay, which have been deposited in valleys and low-lying areas. Notably, the source of these recent sediments is not only the surrounding highlands and mountains adjacent to Al Madinah, but also distant areas from which materials are transported through a network of seasonal valleys draining into the Al Madinah Basin.
3. Hydrogeological Setting
Generally, the hydrogeological region can be divided into two main zones: the volcanic Harrat (Harrat Rahat), composed of basaltic rocks, which forms the basaltic aquifer, and the surrounding valleys where groundwater occurs in Quaternary alluvial deposits, forming the alluvial aquifer.
3.1. Basaltic Aquifer
The water-bearing rocks consist of basaltic lava flows and buried alluvial deposits. The recent lavas have relatively higher permeability due to their high porosity. The permeability zones in the Harrat Rahat are formed by vesicular voids, vertical fractures, and the boundaries between successive lava flows, as well as volcanic pipes and weathering zones. Due to the significant variation in the physical properties of these rocks regarding groundwater movement and storage, the aquifer characteristics range from confined to semi-confined and unconfined. The lower aquifer formations in the Harrat Rahat generally rest on impermeable Precambrian rocks, while in other areas, they lie on layers of marl and clay resulting from basalt weathering.
Previous studies have indicated the existence of buried valleys beneath the Harrat, particularly along its western and eastern edges, containing alluvial deposits with thicknesses exceeding 50 meters [27], which were buried due to successive volcanic flows. The average transmissivity value in the Harrat Rahat is about 260 m2/day, while the average storage coefficient is 3 x 10⁻³ [28]. Subsurface flow from surrounding areas is the primary source of recharge for the aquifers in the Harrat Rahat, in addition to infiltration from rainfall and runoff that flows over the Harrat region. The annual recharge from rainfall in the Al Madinah-Harrat region ranges between 7 and 4.6 mm [28]. The depth of the piezometric surface in some wells penetrating the Harrat Rahat varies from 12 m at the edges to over 150 m within the Harrat, with an overall average water level of 61 m.
3.2. Alluvial Aquifer
Groundwater occurs in Quaternary alluvial deposits within various valleys, where sediments form interbedded layers of sand, gravel, and clay, with permeability varying according to clay content. Floodplain deposits occur as terrace-like benches along valley margins and consist mainly of clayey sand formed by surface water flow, with surrounding rocks representing the primary sediment source. The average transmissivity of the water-bearing alluvial deposits is approximately 242 m2/day, while the average storage coefficient is 2 x 10⁻² [28]. Recharge is mainly derived from subsurface inflow from surrounding areas, in addition to infiltration from rainfall and surface runoff.
4. Materials and Methods
During field investigations in the study area, groundwater samples were collected from various regions, including the Harrat Rahat aquifer and the alluvial deposits in different valleys. A total of 20 groundwater samples were collected from private and Ministry of Water and Electricity wells in the Harrat Rahat aquifer, and 24 samples from Quaternary alluvial deposits (Figure 1b). All chemical analyses for the determination of major anions, cations and trace elements were conducted at the laboratories of the Saudi Geological Survey. The accuracy of the chemical analyses was evaluated using ionic balance calculations, with analytical errors ranging between 2 and 5%.
The analytical methods employed for the assessment involved various techniques and instruments. For the determination of Ca2+, Mg2+, Na+, K+ and Fe2+, flame atomic absorption spectrometry (FAAS) was utilized, as outlined by the American Public Health Association (APHA). Ammonium (NH4) levels were measured through spectrophotometry using indophenol blue or the Nessler reaction with a photometer (MPM 1500). Silica (SiO2) was analyzed by spectrophotometry using ammonium molybdate. Chloride (Cl−) was determined by DPD colorimetry with a Mettler DL25, while fluoride (F−) concentrations were measured using an ion-selective electrode connected to a microprocessor (PMX 2000). Bicarbonate (HCO3−) was determined by potentiometric titration using a pH electrode on the Mettler DL25. Nitrate (NO3−) concentrations were determined either by electrode or spectrophotometry using the brucine method. Sulfate (SO42−) was analyzed by potentiometry using barium perchlorate or by gravimetric methods with a photometer (MPM 1500). Phosphate (PO43−) was measured via spectrophotometry with ammonium molybdate on the same photometer. Electrometry was applied to measure pH with the Mettler DL25. Total dissolved solids (TDS) were determined by filtration and evaporation using a Mettler Toledo or via evaporation residue at 110 °C. Conductivity measurements were taken using a microprocessor meter (LF 196). The geochemical data obtained for major ions and physicochemical parameters of groundwater in the study area are detailed in Supplementary (1). 27 heavy metals were analyzed with Inductively Coupled Plasma Mass Spectrometry (ICP-MS) using the PERKN ELMER DRC II methodology, as referenced in the SGS Manual of Chemical Procedures (Supplementary 2).
Due to the elevated concentrations of Ca2+ and Mg2+ compared to Na+ and K+, as well as bicarbonate (HCO3−) and sulfate (SO42−) anions, it was necessary to identify and assess the implications of the dissolution and precipitation of carbonate minerals such as calcite and dolomite, along with other minerals such as gypsum, anhydrite, and halite. Therefore, saturation indices for these minerals were calculated using the FREEQE geochemical model (2001), along with the partial pressure of carbon dioxide (PCO2), which is significantly influenced by water temperature and pH. For this reason, both variables were measured in the field to avoid changes caused by sample storage.
To evaluate the extent of rock-water interaction as a source of elements in the groundwater of the study area, 14 rock samples were collected from bedrock exposures in the vicinity of selected groundwater wells to compare the chemical composition of the associated rocks and water. These samples were sent to ACME Analytical Laboratories in Vancouver, Canada, for geochemical analysis. The major element analysis was conducted using X-Ray Fluorescence (XRF), achieving an accuracy of ±0.01 wt%. Trace elements were analyzed using the inductively coupled plasma mass spectrometry (ICP-MS), with detection limits ranging from 0.01 ppm to 1 ppm. The obtained geochemical data are presented in Supplementary (3).
5. Results and Discussions
5.1. Physicochemical Parameters and Major Ions Concentrations of Groundwater
Piper’s trilinear diagram was used to classify the hydrochemical facies of groundwater based on dominant ion composition [29]. The majority of the analyzed samples are located within the sodium-chloride and calcium-sulfate water types (Figure 4), indicating a strong influence of evaporite mineral dissolution, particularly halite and gypsum, which contributes to elevated groundwater salinity. The dominance of sodium and chloride ions, together with calcium and sulfate, reflects the high evaporation rates typical of arid regions. The high concentrations of these ions, combined with the limited occurrence of bicarbonate-rich facies, suggests minimal recent freshwater recharge and reduced interaction with carbonate minerals. Overall, the Piper diagram indicates that shallow groundwater in the study area is primarily controlled by evaporation, evaporite dissolution, and ion exchange processes, resulting in chemically evolved water with high salinity. This hydrochemical classification highlights potential limitations for the use of this groundwater for drinking and irrigation purposes.
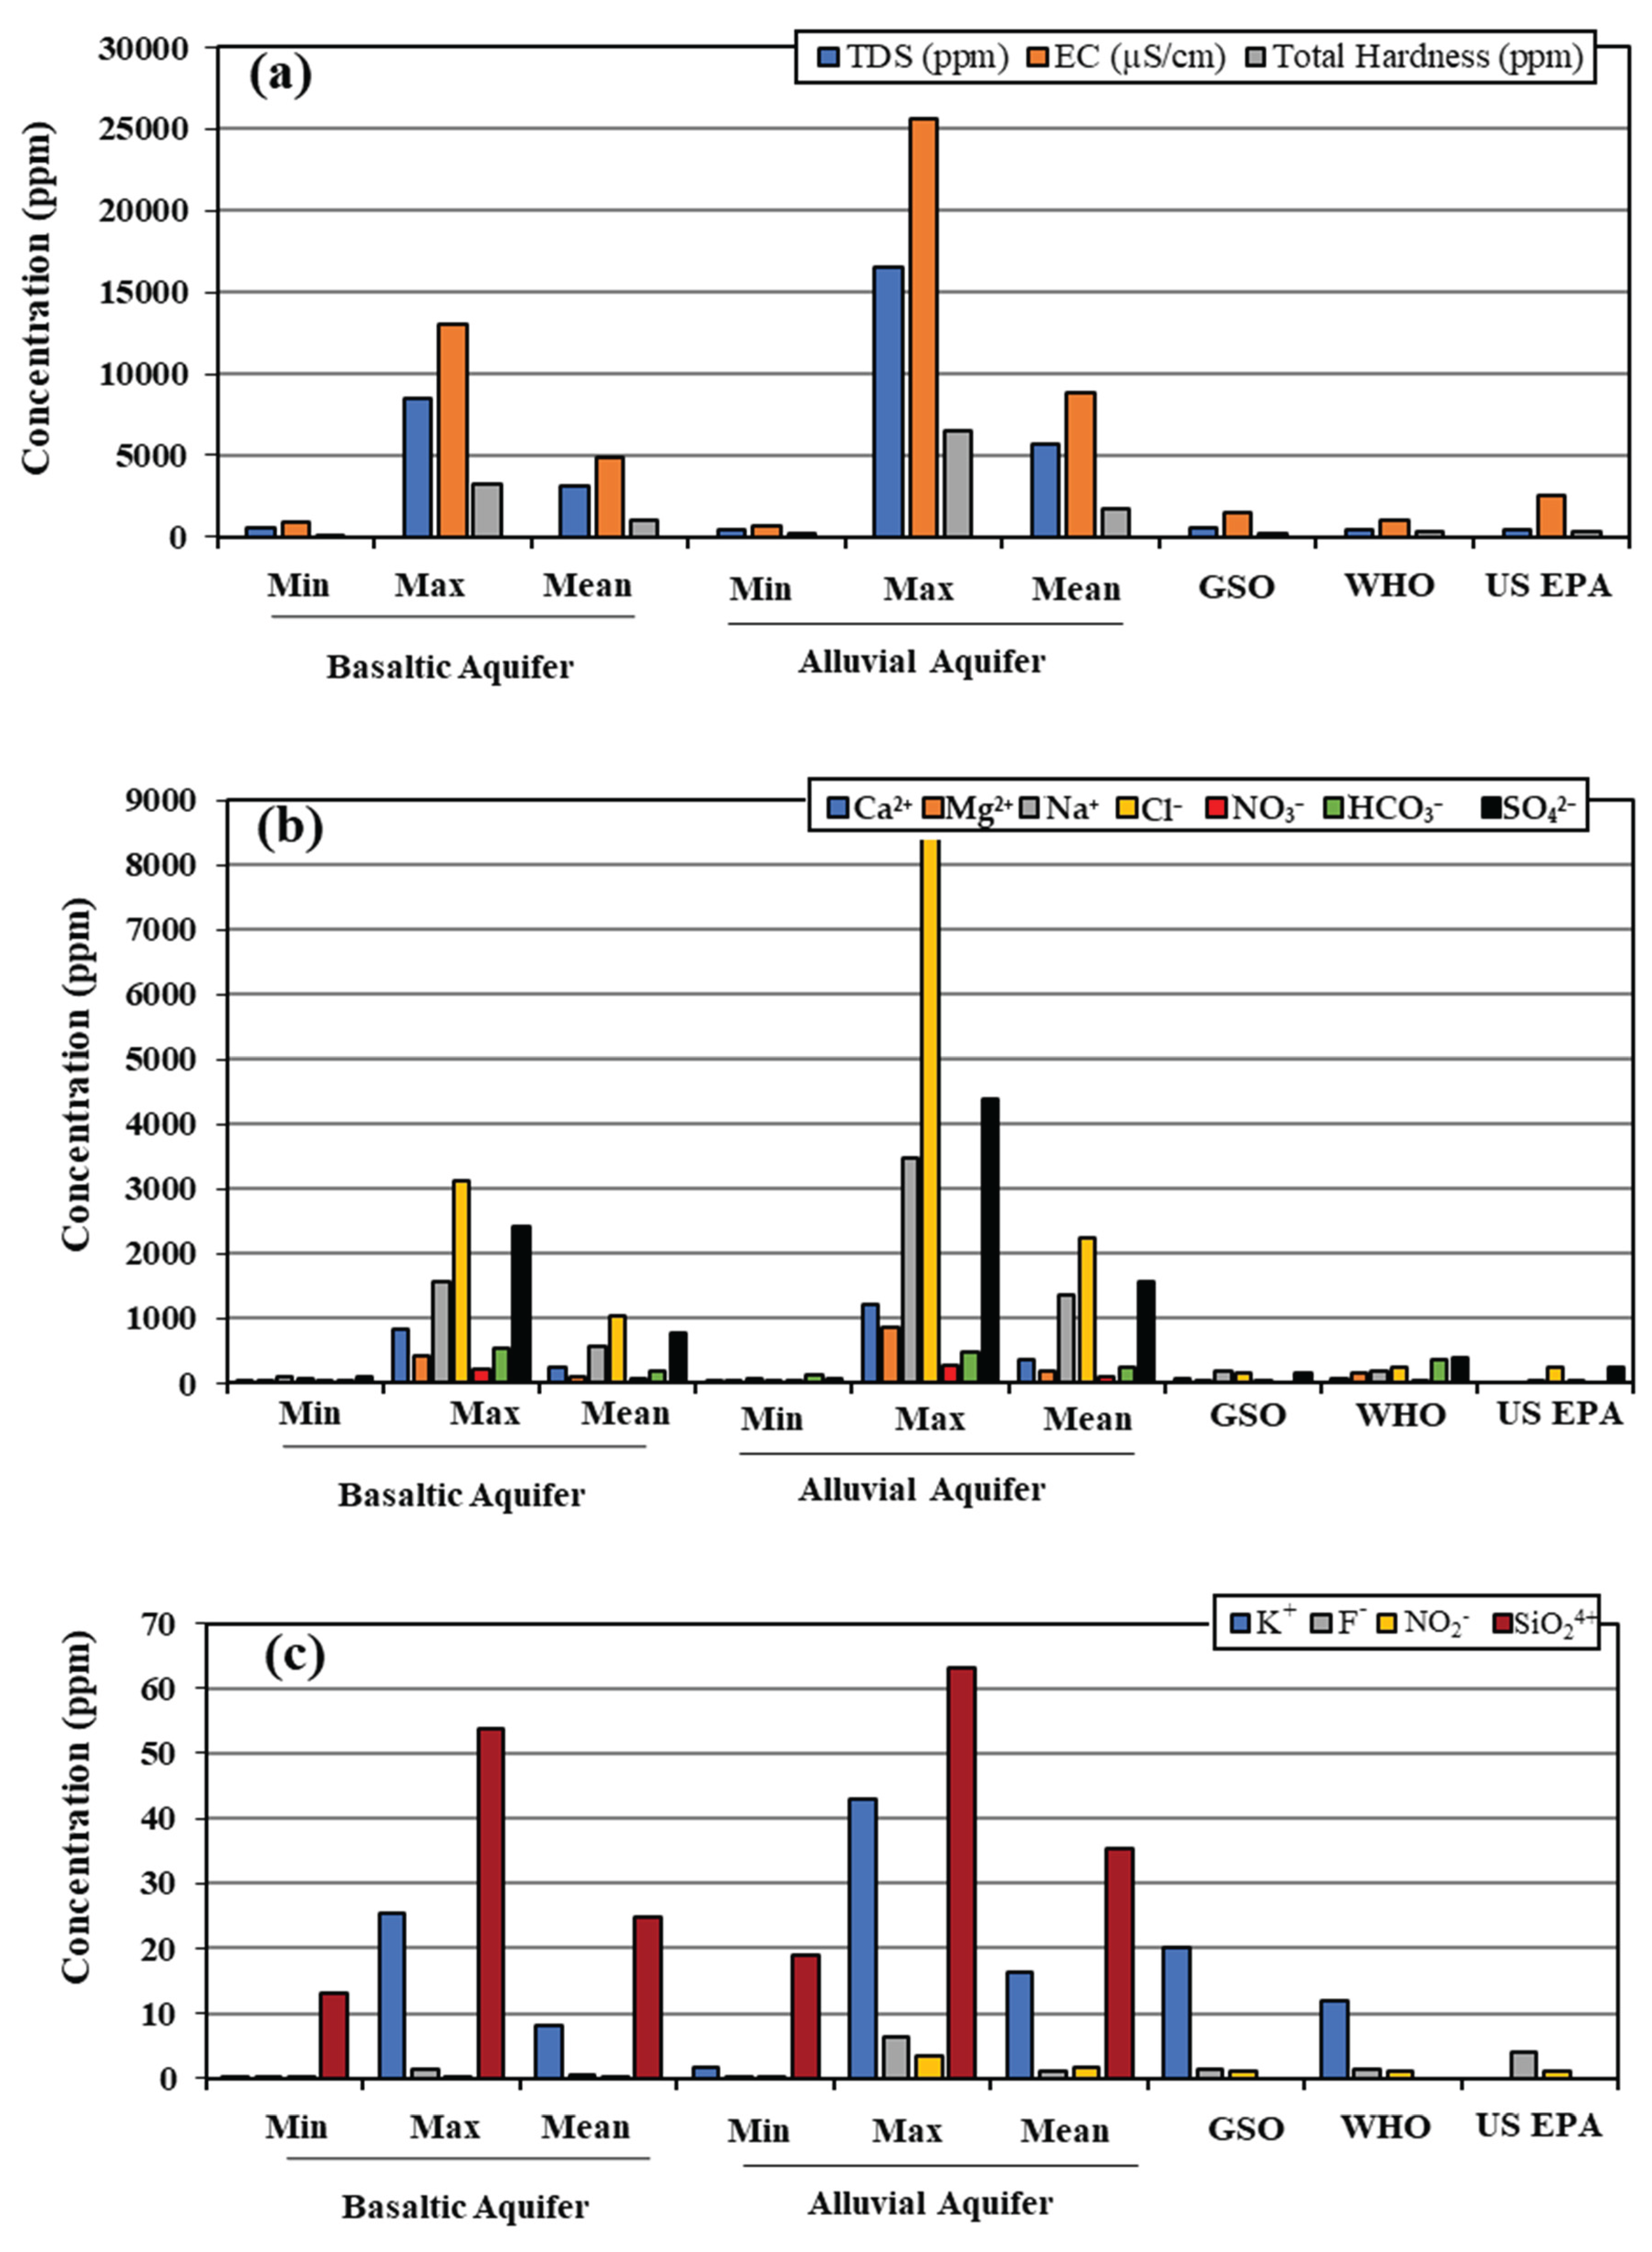
The total dissolved solids (TDS), electrical conductivity (EC), and total hardness (TH) values show a wide range in both basaltic and alluvial aquifers. However, the alluvial aquifer exhibits higher values, exceeding the maximum salinity limits recommended by international standards, including GSO [30], WHO [31], and the US EPA [32] (Figure 5a). Elevated TDS and EC levels indicate increased salinity, which may adversely affect agricultural activities and reduce the suitability of groundwater for drinking purposes. Such high concentrations may reflect natural geochemical processes, such as mineral leaching in geologically heterogeneous formations, or anthropogenic influences including agricultural runoff, industrial effluents, and urban contamination, ultimately leading to groundwater quality deterioration. Furthermore, elevated TH values typically indicate higher concentrations of calcium and magnesium ions, commonly associated with groundwater interaction with limestone or other mineral-rich lithologies.
The chemical analysis of major ions (Ca2+, Mg2+, Na+, Cl−, NO3−, HCO3−, and SO42−) (Table 1; Figure 5b) indicates that the alluvial aquifer contains significantly higher ion concentrations, exceeding the permissible limits established by GSO, WHO, and the US EPA. In addition, chloride concentrations in both the basaltic and alluvial aquifers exceed international guideline values. Potassium (K+) and fluoride (F−) concentrations in both aquifers (Table 1; Figure 5c) remain below the maximum limits recommended by GSO. Nitrate (NO3−) concentrations in the basaltic aquifer fall within the acceptable limits defined by GSO, WHO, and the US EPA, whereas elevated nitrate levels are observed in the alluvial aquifer. The physical parameters of groundwater samples from both aquifers show that pH values fall within the recommended range (6.0–8.5), indicating that the groundwater is generally neutral to slightly alkaline. According to GSO, WHO, and US EPA standards, this pH range suggests that the groundwater is suitable for human consumption. However, several major ions, including Ca2+, Mg2+, Na+, Cl−, HCO3−, SO42−, and NO3−, exceed the maximum acceptable limits in both aquifers. These elevated concentrations raise concerns regarding groundwater quality and highlight the need for further assessment and management to mitigate potential health risks. It can be concluded that while the pH is acceptable, the elevated levels of specific ions warrant caution regarding the overall safety and suitability of the groundwater for consumption.
Figure 5.
(a) Variation in electrical conductivity (EC), total dissolved solids (TDS), and total hardness (TH) between the basaltic and alluvial aquifers. (b) Variation in major ion concentrations across the two aquifers. (c) Variation in minor ion concentrations in the two aquifers, compared to Gulf and international standards.
Elevated calcium concentrations can adversely affect renal function, leading to hypercalciuria and alkaline urine, which may promote kidney stone formation. Crystalline calcium carbonate can also increase gastric alkalinity and stimulate acidic gastric secretions, potentially counteracting elevated stomach pH. Excess sodium (Na+) in blood plasma may cause dehydration, mild hand tremors, excessive nervousness, involuntary muscle movements, anxiety, impaired concentration, and in severe cases, coma. High chloride (Cl−) concentrations in drinking water can be associated with various health issues, including cardiovascular disorders, respiratory problems, skin and hair conditions, dental weakness, miscarriages, and an increased risk of cancer. Elevated sulfate (SO42−) levels may induce dehydration through repeated diarrhea, particularly in children. Additionally, the activity of sulfate-reducing bacteria can produce hydrogen sulfide gas (H2S), which may cause dizziness, headaches, and, in extreme cases, can be fatal at very high concentrations. If sulfate levels exceed permissible limits, alternative water sources or treatment methods such as distillation or reverse osmosis are recommended. Finally, high nitrate (NO3−) concentrations in drinking water can lead to methemoglobinemia in infants, a condition characterized by cyanosis, and in severe cases may result in brain damage or death due to oxygen deprivation.
5.2. Heavy Metals Concentrations
A total of 27 heavy metals (HMs) were analyzed in groundwater, with detailed results presented in the Supplementary (2). Table 2 offers a statistical summary of the HM concentrations in both basaltic and alluvial aquifers, compared to the permissible limits established by GSO, WHO, and US EPA. Figure 6 illustrates the variations in HM concentrations across the two aquifers. Some HM concentrations from the two aquifers, including Ag, Ba, Be, Cd, Cr, Cu, Hg, Mn, Ni, Pb, Sb, U, and Zn, were found to be within safe limits for groundwater use (Figure 6a). However, certain metals exceeded the permissible limits; for instance, zinc (Zn) in the alluvial well (SW81), surpassed the thresholds set by GSO, WHO, and US EPA (Figure 6c).
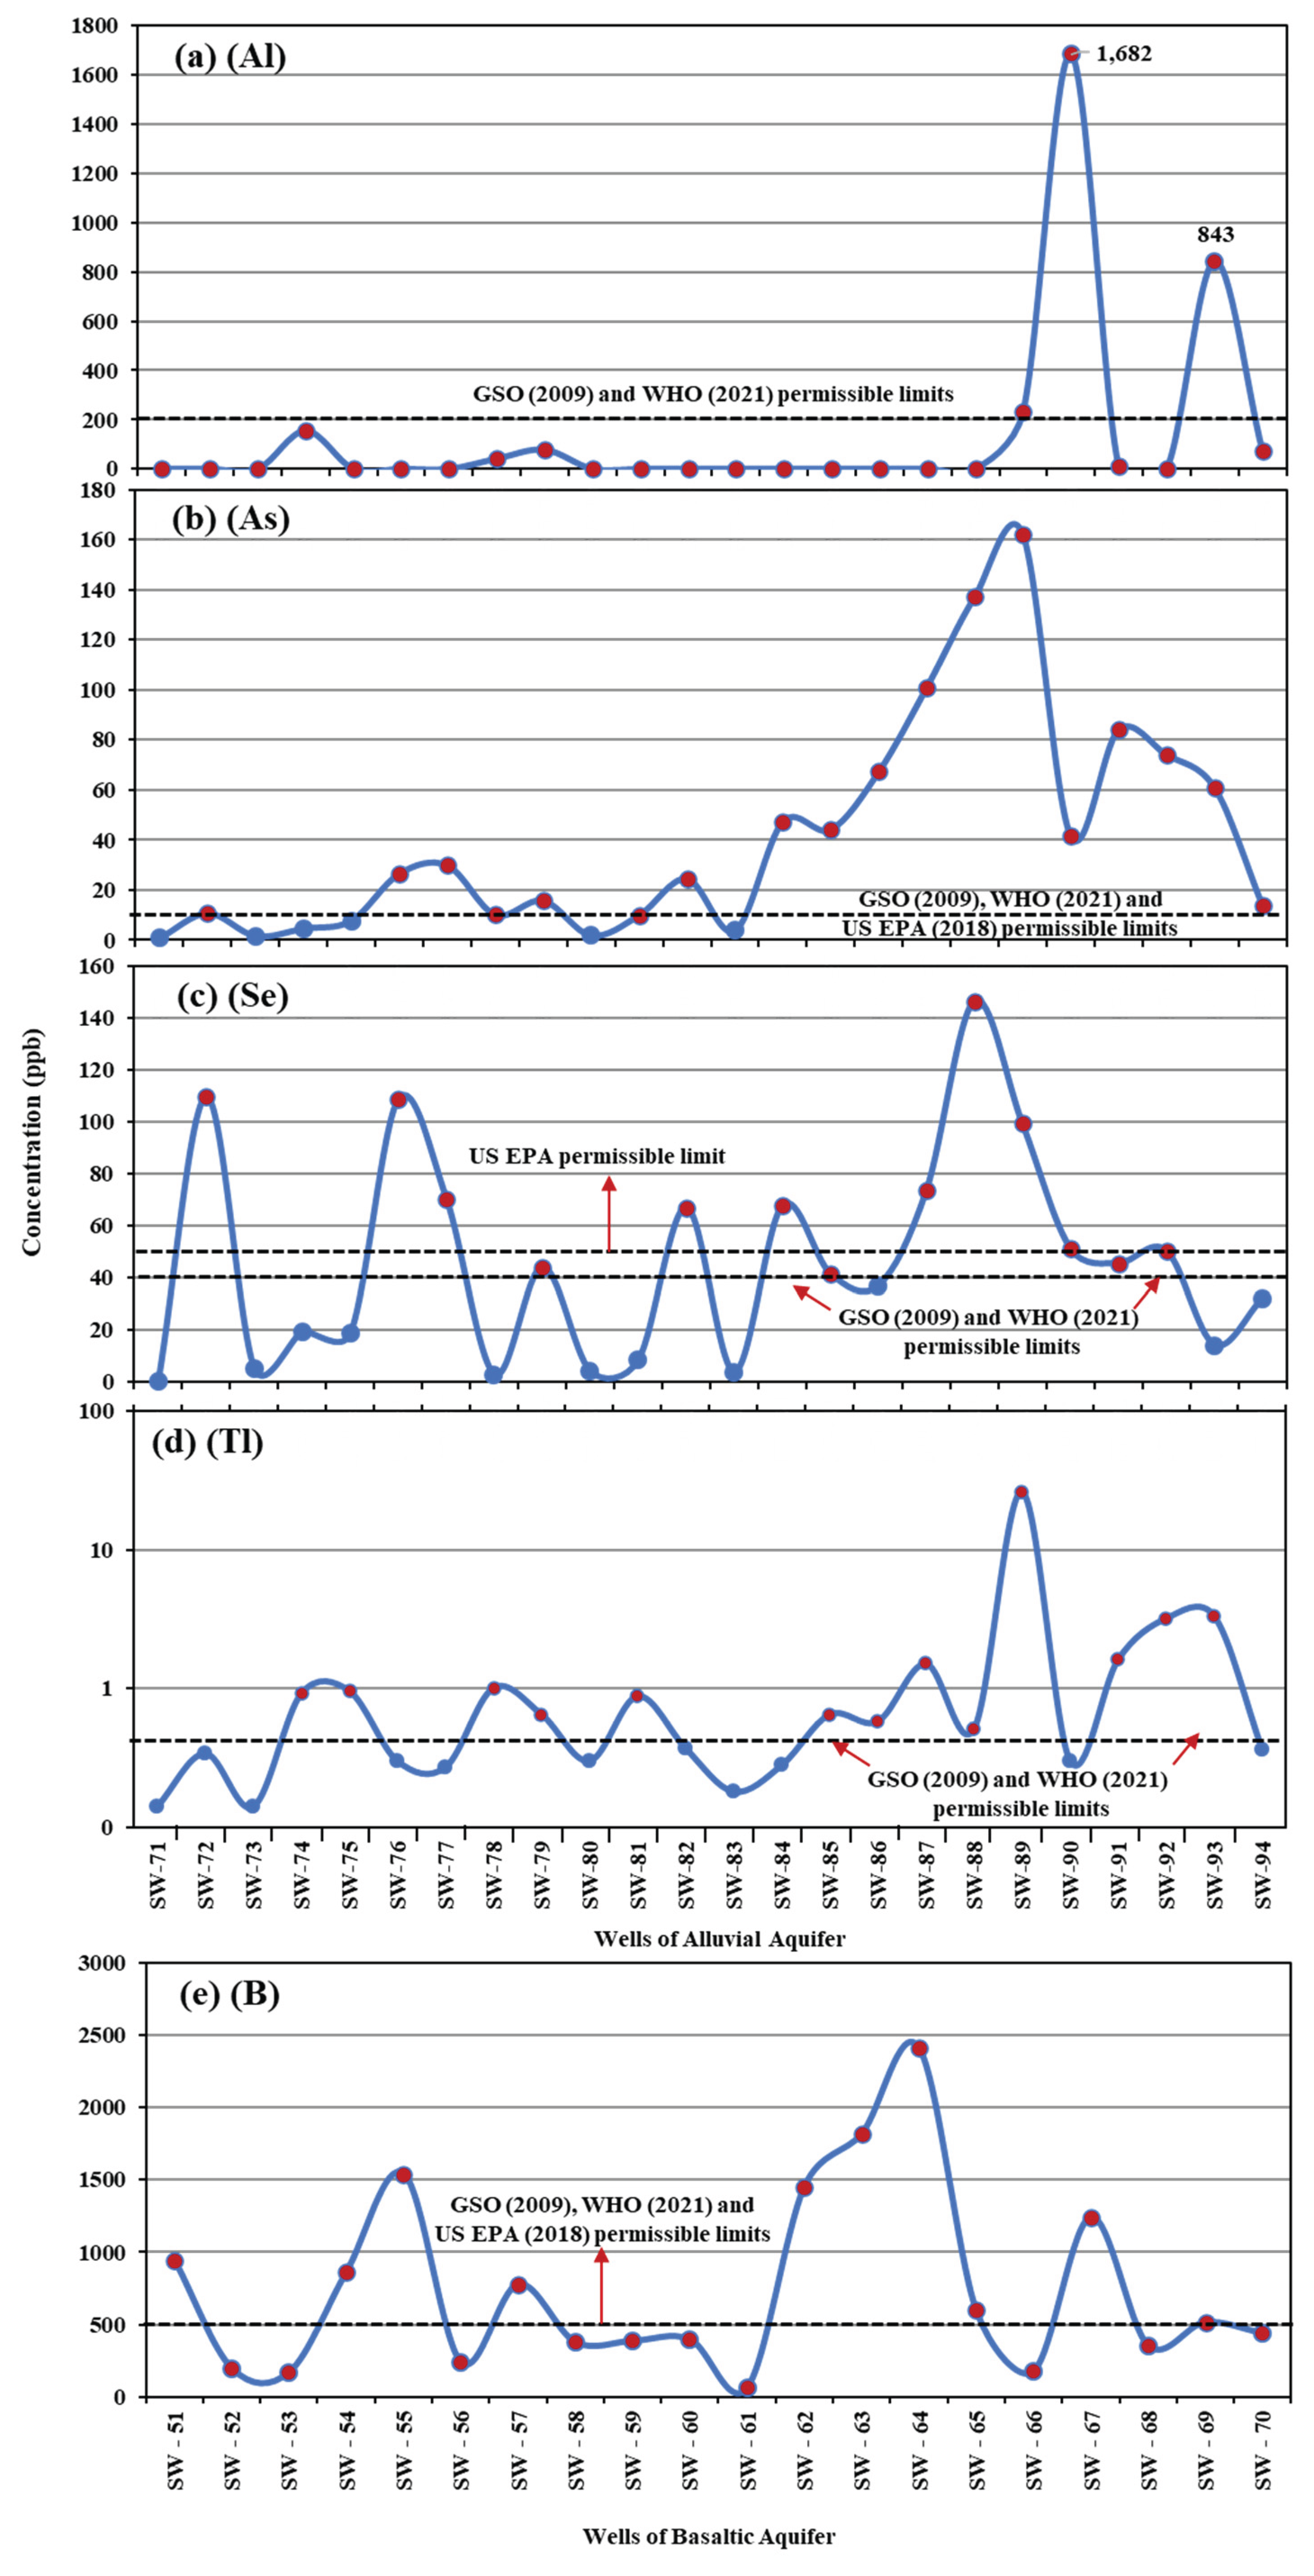
Data in Figure 6b indicate that the alluvial aquifer exhibits relatively higher aluminum (Al) concentrations, particularly in wells SW90 and SW93, which exceed the permissible limits set by GSO and WHO (Figure 7a). All basaltic wells show arsenic (As) concentrations below the permissible limits established by GSO, WHO and US EPA. Conversely, several alluvial wells display elevated concentrations of arsenic (As), selenium (Se), and thallium (Tl) exceeding the permissible limits of GSO and WHO (Figure 7b–d), likely due to the interaction of groundwater with various rock and mineral types composing the alluvial deposits, whereas the basaltic aquifer is derived from a more uniform rock type. Furthermore, all alluvial wells report boron (B) levels within the permissible limits of GSO, WHO, and US EPA, while the majority of basaltic wells exceed these international boron limits (Figure 7e).
Heavy metals (HMs) in the study area can be broadly classified into two categories: 1) Metals with concentrations below permissible limits, including Ag, Ba, Be, Cd, Cr, Cu, Hg, Mn, Ni, Pb, Sb and U; 2) Metals with concentrations exceeding permissible limits in at least one sample, including Zn, Al, As, Se and Tl. Elevated concentrations are primarily attributed to local interactions between water and specific rocks, such as granite and felsite, which are naturally rich in these elements. Rainfall and groundwater percolation facilitate the leaching of these elements into the aquifer. Increases in arsenic and zinc concentrations may also be linked to agricultural activities, as numerous farms in the area use fertilizers; phosphate fertilizers may contain arsenic up to 1200 mg/kg and nitrogenous fertilizers up to 120 mg/kg [33]. Continuous irrigation processes wash soil particles, increasing the concentration of these metals in groundwater. Many basaltic aquifer wells show elevated boron concentrations, likely resulting from boron released from the Harrat basalts formed during past volcanic activity.
From a health perspective, high arsenic (As) concentrations can cause severe human health issues, affecting the heart, nervous system, skin, lungs, and kidneys. Other organisms interact with arsenic in various ways; some die, while others experience growth difficulties or inability to reproduce. Environmental areas affected by arsenic have shown a marked reduction in biodiversity. High levels of aluminum are linked to neurotoxicity and may contribute to Alzheimer’s disease and other cognitive impairments. Elevated Se concentrations can result in selenosis, with symptoms including gastrointestinal disturbances, hair loss, and neurological problems. Exposure to Tl can result in serious health effects, including hair loss, nerve damage, and potential damage to organs like the kidneys and liver. Elevated boron levels can be toxic to plants, affecting growth and crop yields, particularly in sensitive species.

Table 2.
Statistical summary of heavy metal concentrations in groundwater samples (ppb).
|
Elements |
Basaltic Aquifer (20 samples) |
Alluvial Aquifer (24 samples) |
Standards | ||||||
|---|---|---|---|---|---|---|---|---|---|
| Min | Max | Mean | Min | Max | Mean | GSO (2009) |
WHO (2021) |
US EPA (2018) |
|
| Ag | 0.2 | 0.5 | 0.3 | 0.1 | 1.2 | 0.4 | 100 | 100 | 100 |
| Al | 0.4 | 36 | 8.5 | 1.1 | 1682 | 437 | 200 | 200 | * |
| As | 0.4 | 7.5 | 1.7 | 1.7 | 162 | 46 | 10 | 10 | 10 |
| B | 60.9 | 2412 | 737 | 13 | 622 | 255 | 500 | 500 | 500 |
| Ba | 2.3 | 125 | 38 | 11 | 210 | 66 | 700 | 700 | 200 |
| Be | <0.5 | <0.5 | <0.5 | 0.5 | 8.7 | 1.66 | 4 | 4 | 4 |
| Bi | <0.1 | <0.1 | <0.1 | 0.1 | 0.24 | 0.11 | * | * | * |
| Br | 50 | 6887 | 2522 | 231 | 19,687 | 5719 | * | * | * |
| Cd | 0.1 | 0.3 | 0.12 | 0.1 | 1.99 | 0.45 | 3 | 3 | 5 |
| Cr | 0.3 | 33.7 | 7.0 | 0.3 | 39 | 10.8 | 50 | 50 | 100 |
| Cs | 0.1 | 5.96 | 0.83 | 0.1 | 22 | 2.47 | * | * | * |
| Cu | 0.2 | 17.8 | 6.9 | 0.4 | 13 | 5.7 | 2000 | 2000 | 1300 |
| Hg | 0.2 | 7.5 | 1.8 | 0.1 | 4.7 | 1.2 | 6 | 6 | 2 |
| I | 16 | 826 | 236 | 99 | 1455 | 400 | * | * | * |
| Li | 0.4 | 490 | 94 | 1.7 | 251 | 65 | * | * | * |
| Mn | 0.1 | 90.3 | 16 | 0.6 | 65 | 13 | 400 | 400 | 50 |
| Ni | 1.0 | 5.3 | 1.29 | 0.1 | 375 | 5.4 | 20 | 20 | 100 |
| Pb | <0.1 | <0.1 | <0.1 | 0.26 | 40 | 4.8 | 10 | 10 | 15 |
| Rb | 0.1 | 18.7 | 6.4 | 0.3 | 16 | 7.2 | * | * | * |
| Sb | 0.5 | 1.23 | 0.57 | 0.5 | 26 | 3.7 | 5 | 5 | 6 |
| Se | 0.4 | 90.0 | 18.7 | 2.9 | 147 | 51 | 40 | 40 | 50 |
| Sn | <0.1 | <0.1 | <0.1 | 0.1 | 11 | 1.2 | * | * | * |
| Sr | 61 | 18,563 | 5458 | 584 | 25,275 | 7713 | * | * | * |
| Ta | 0.1 | 0.27 | 0.12 | 0.1 | 3.6 | 0.53 | * | * | * |
| Tl | 0.1 | 0.4 | 0.2 | 0.1 | 26 | 2.9 | 0.5 | 0.5 | 0.5 |
| U | 0.2 | 12.4 | 1.9 | 0.6 | 37 | 6.9 | 30 | 30 | 30 |
| Zn | 0.2 | 1125 | 97 | 1.2 | 5124 | 454 | 3000 | 3000 | 5000 |
(GSO) Gulf Standards organization, (WHO) (World Health Organization), (US EPA) United States Environmental Protection Agency, * Unspecified.
Figure 6.
(a, b) Variations in heavy metal (HM) concentrations in the two groundwater aquifers. (c) Distribution of zinc concentrations in wells of the alluvial aquifer.
Figure 6.
(a, b) Variations in heavy metal (HM) concentrations in the two groundwater aquifers. (c) Distribution of zinc concentrations in wells of the alluvial aquifer.
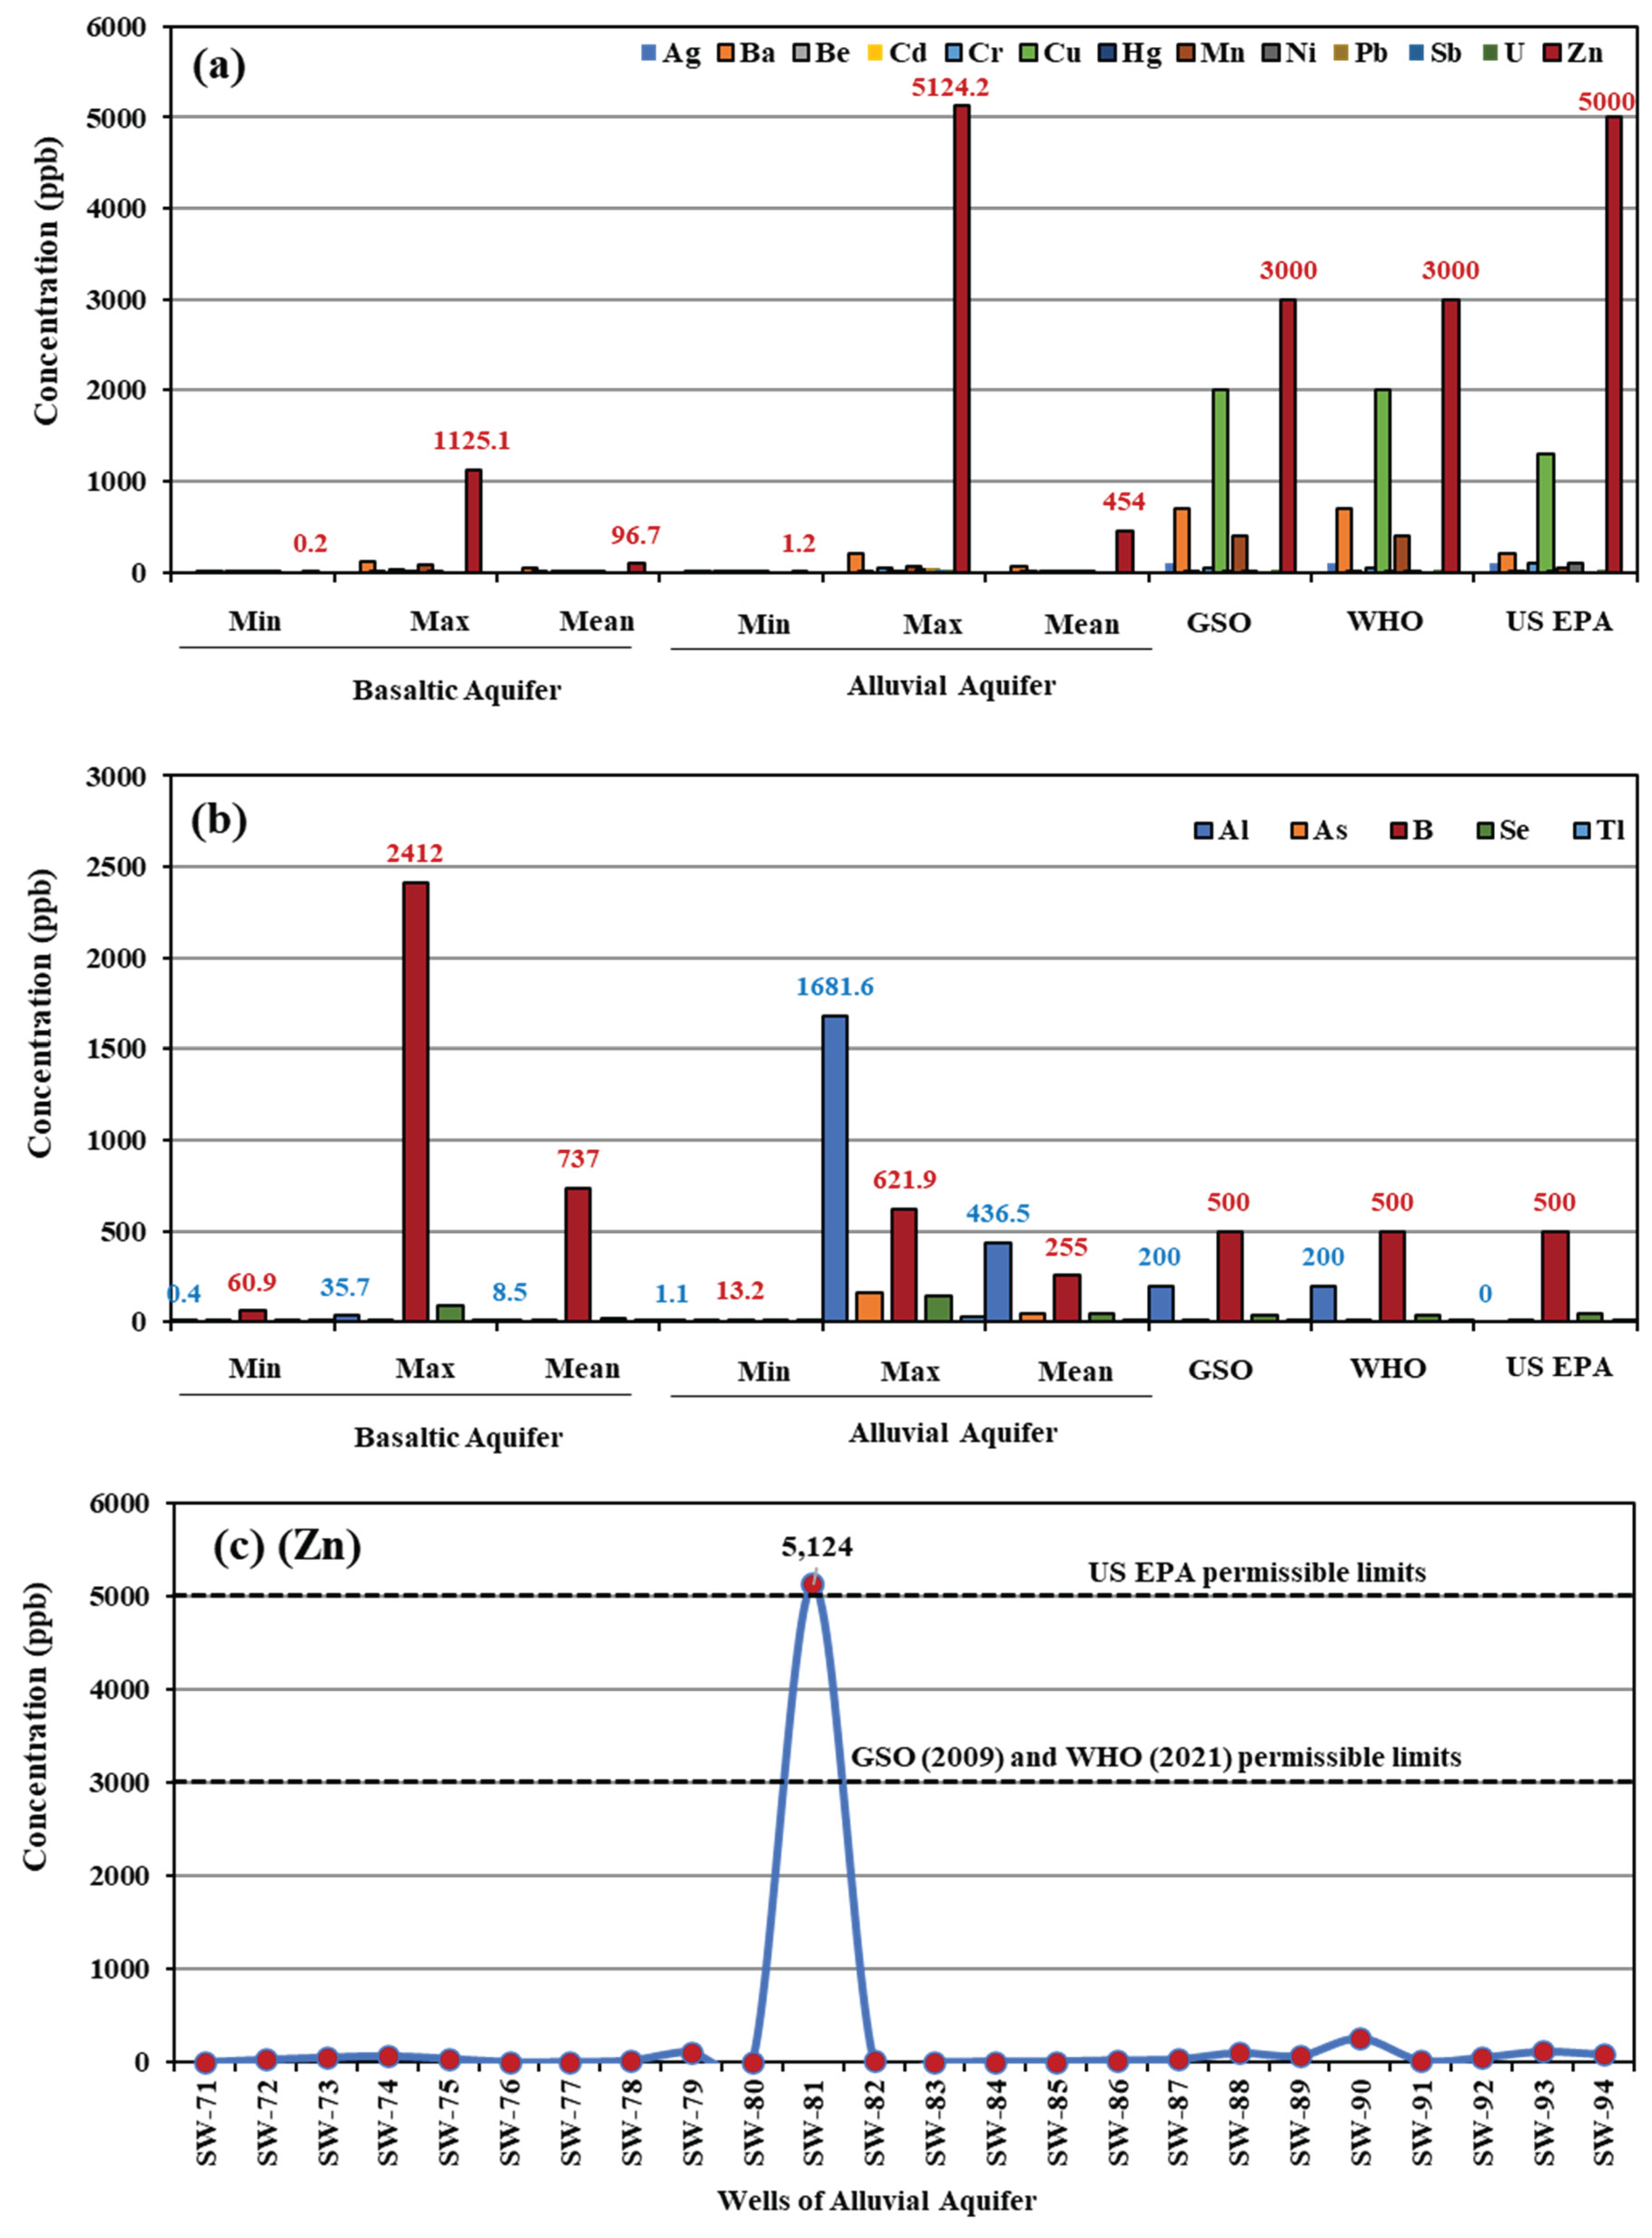
Figure 7.
Variations in the concentrations of (a) aluminum, (b) arsenic, (c) selenium, (d) thallium in wells of the alluvial aquifer, and (e) boron in wells of the basaltic aquifer.
Figure 7.
Variations in the concentrations of (a) aluminum, (b) arsenic, (c) selenium, (d) thallium in wells of the alluvial aquifer, and (e) boron in wells of the basaltic aquifer.
5.3. Sources and Processes Affecting Groundwater Quality
5.3.1. Dissolution and Precipitation of Minerals
Table 1 shows the saturation indices of anhydrite, gypsum, calcite, dolomite, and halite. These indices indicate that most waters are supersaturated with respect to calcite (CaCO3) and dolomite [CaMg(CO3)2], while only a few waters are supersaturated with gypsum (CaSO4·2H2O) and anhydrite (CaSO4), suggesting a potential for the precipitation of these minerals (Figure 8). In contrast, the groundwater is undersaturated with respect to halite (NaCl), suggesting that it still has the capacity to dissolve this salt if present. Most data points plot below the zero saturation index line, indicating that groundwater does not significantly precipitate or dissolve these minerals. Therefore, the minerals calcite, dolomite, gypsum, and anhydrite are secondary minerals whose dissolution and precipitation processes influence groundwater chemistry by adding or reducing ions like Ca2+, Mg2+, SO42−, and HCO3−, alongside contributions from the chemical weathering of silicate minerals, collectively contributing to the overall hydrogeochemical evolution of the groundwater. These saturation index results are consistent with the observed major ion chemistry and confirm that carbonate and sulfate mineral equilibria play a central role in controlling groundwater composition.
5.3.2. Contribution of Nitrate
The main sources of nitrate in groundwater include: (1) application of chemical and animal fertilizers rich in nitrates, (2) atmospheric nitrate deposition due to the oxidation of nitrogen gas by oxygen in the atmosphere, and (3) oxidation of ammonia (NH4) and nitrite (NO2) into nitrate. These oxidation processes can be represented by two equations:
NH4 + 1.5 O2 → NO2 + H2O + 2H+ (1)
NO2 + 0.5 O2 → NO3 (2)
The first source is considered a major contributor to the increase in nitrate content in groundwater owing to continuous use of nitrate-rich chemical fertilizers and animal manure in the agricultural areas of western and northwestern Al Madinah. In contrast, the contributions of sources (2) and (3) are limited due to the generally low concentrations of ammonia and nitrite in groundwater (Table 1).
Chemical analyses indicate that nitrate concentrations in groundwater from the basaltic aquifer range from 4 to 228 ppm, with an average value of 77 ppm. In the alluvial aquifer, nitrate concentrations range from 4 to 270 ppm, with an average of 99 ppm (Table 1). These values exceed the maximum permissible limits of 50 ppm set by GSO (2009) and 10 ppm established by WHO and the US EPA.
To assess potential influence of sewage leakage on groundwater nitrate levels, the U.S. Environmental Protection Agency [34] identifies chloride and nitrate as key indicators of sewage contamination. In the basaltic aquifer, a moderate positive correlation (r = 0.298, Table 3) suggests a partial contribution from sewage sources. In contrast, the alluvial aquifer exhibits a weak negative correlation (r = -0.023, Table 4), indicating a limited influence from sewage contamination. On the other hand, moderate to strong significant positive correlations between Cl− and SO42− in both basaltic and alluvial aquifers (r = 0.422 and 0.659, respectively) may reflect contributions from sewage effluents, industrial discharges, and natural geochemical processes such as mineral weathering.
Additionally, positive correlations between K+, Na+, Mg2+, and NO3− in the basaltic aquifer suggest the influence of agricultural fertilizers, whereas weaker correlations observed in the alluvial aquifer imply comparatively lower agricultural impacts. The correlations between TDS and various ions (Ca2+, Mg2+, Na+, K+, Cl−, HCO3−, NO3−, SO42−, F−, and TH) provide valuable insights into groundwater geochemical evolution. Elevated TDS values likely result from a combination of mineral dissolution, agricultural runoff, industrial discharges, and possible sewage contamination. Finally, positive correlations between SO42− and Ca2+, Mg2+, Na+, and K+ highlight influences from both natural geological processes and anthropogenic activities.
5.3.3. Rock-Water Interactions
The sources of major and trace elements in groundwater, including heavy metals, are diverse. Rock–water interaction represents a primary mechanism controlling the release of these elements, as rocks undergo prolonged chemical weathering driven by factors such as acidic precipitation, oxygenated surface waters, and chemically active hydrothermal fluids. These processes promote the mobilization of elements from rocks into groundwater and, in some cases, the transfer of elements from water into rocks through adsorption and mineral precipitation. The interaction between rocks and water depends on the physicochemical conditions available at the rock–water interface, such as acidity, temperature, oxygen levels, and the chemical composition of the rocks and groundwater.
In addition to geogenic sources, groundwater chemistry may also be influenced by anthropogenic inputs, primarily associated with industrial, agricultural, and domestic discharges, as well as mining activities and mineral processing. To evaluate the contribution of rock–water interaction as a source of elements in the groundwater of the study area, representative rock samples were collected in the vicinity of selected groundwater wells (Supplementary 3). These samples were analyzed and compared with the chemical composition of their associated groundwater. Table 5 shows the average concentrations of selected elements and heavy metals in both rock samples and their associated waters.
Figure 9 illustrates the relationship between these average concentrations. The observed positive correlations indicate that increases in elemental concentrations in the rocks are accompanied by corresponding increases in groundwater, and vice versa. This relationship strongly suggests that chemical weathering of local rocks constitutes the dominant source of dissolved elements in groundwater within the study area. It is noteworthy that if external sources such as wastewater or industrial effluents exerted a significant influence, the elemental relationships would be expected to deviate from this trend, potentially displaying inverse or anomalously elevated concentrations in groundwater relative to the host rock
The chemical evolution of groundwater quality in crystalline igneous rocks is primarily controlled by the chemical weathering of minerals within the rock matrix and is strongly influenced by water acidity and the presence of carbon dioxide gas. Mineral weathering is largely governed by the activity of hydrogen ions (H+), which are generated through the dissociation of carbonic acid (H2CO3), as illustrated by the following reactions:
H2O + CO2(g) ↔ CO2(aq) + H2O
H2O + CO2(aq) ↔ H2CO3
H2CO3 ↔ H+ + HCO3
The hydrogen ions (H+) play a key role in the chemical weathering of silicate minerals by enhancing the ability of groundwater to dissolve and mobilize components from minerals present in the rock matrix and alluvial deposits. In the Harrat Rahat and Al Madinah region, the dominant rock type is olivine basalt, composed mainly of forsterite (Mg2SiO4), diopside (MgCaSi2O6), augite (CaMgFe(SiO3)2), and calcic plagioclase (CaAl2Si3O8), the chemical weathering of silicate minerals such as forsterite, diopside, and augite can be represented by the following equations:
Mg2SiO4 + 4CO2 + 4H2O ⇌ 2Mg2+ + 4HCO3− + H4SiO4
MgCaSi2O6 + 4CO2 + 6H2O ⇌ 2Mg2+ + 2Ca2+ + 4HCO3− + 2H4SiO4
CaMgFe(SiO3)2 + 4CO2 + 6H2O ⇌ Ca2+ + Mg2+ + Fe2+ + 4HCO3− + 2H4SiO4
These reactions demonstrate that the chemical weathering of basaltic minerals releases significant amounts of Ca2+, Mg2+, Fe2+, and HCO3− into groundwater, thereby modifying its chemical composition and influencing overall groundwater quality.
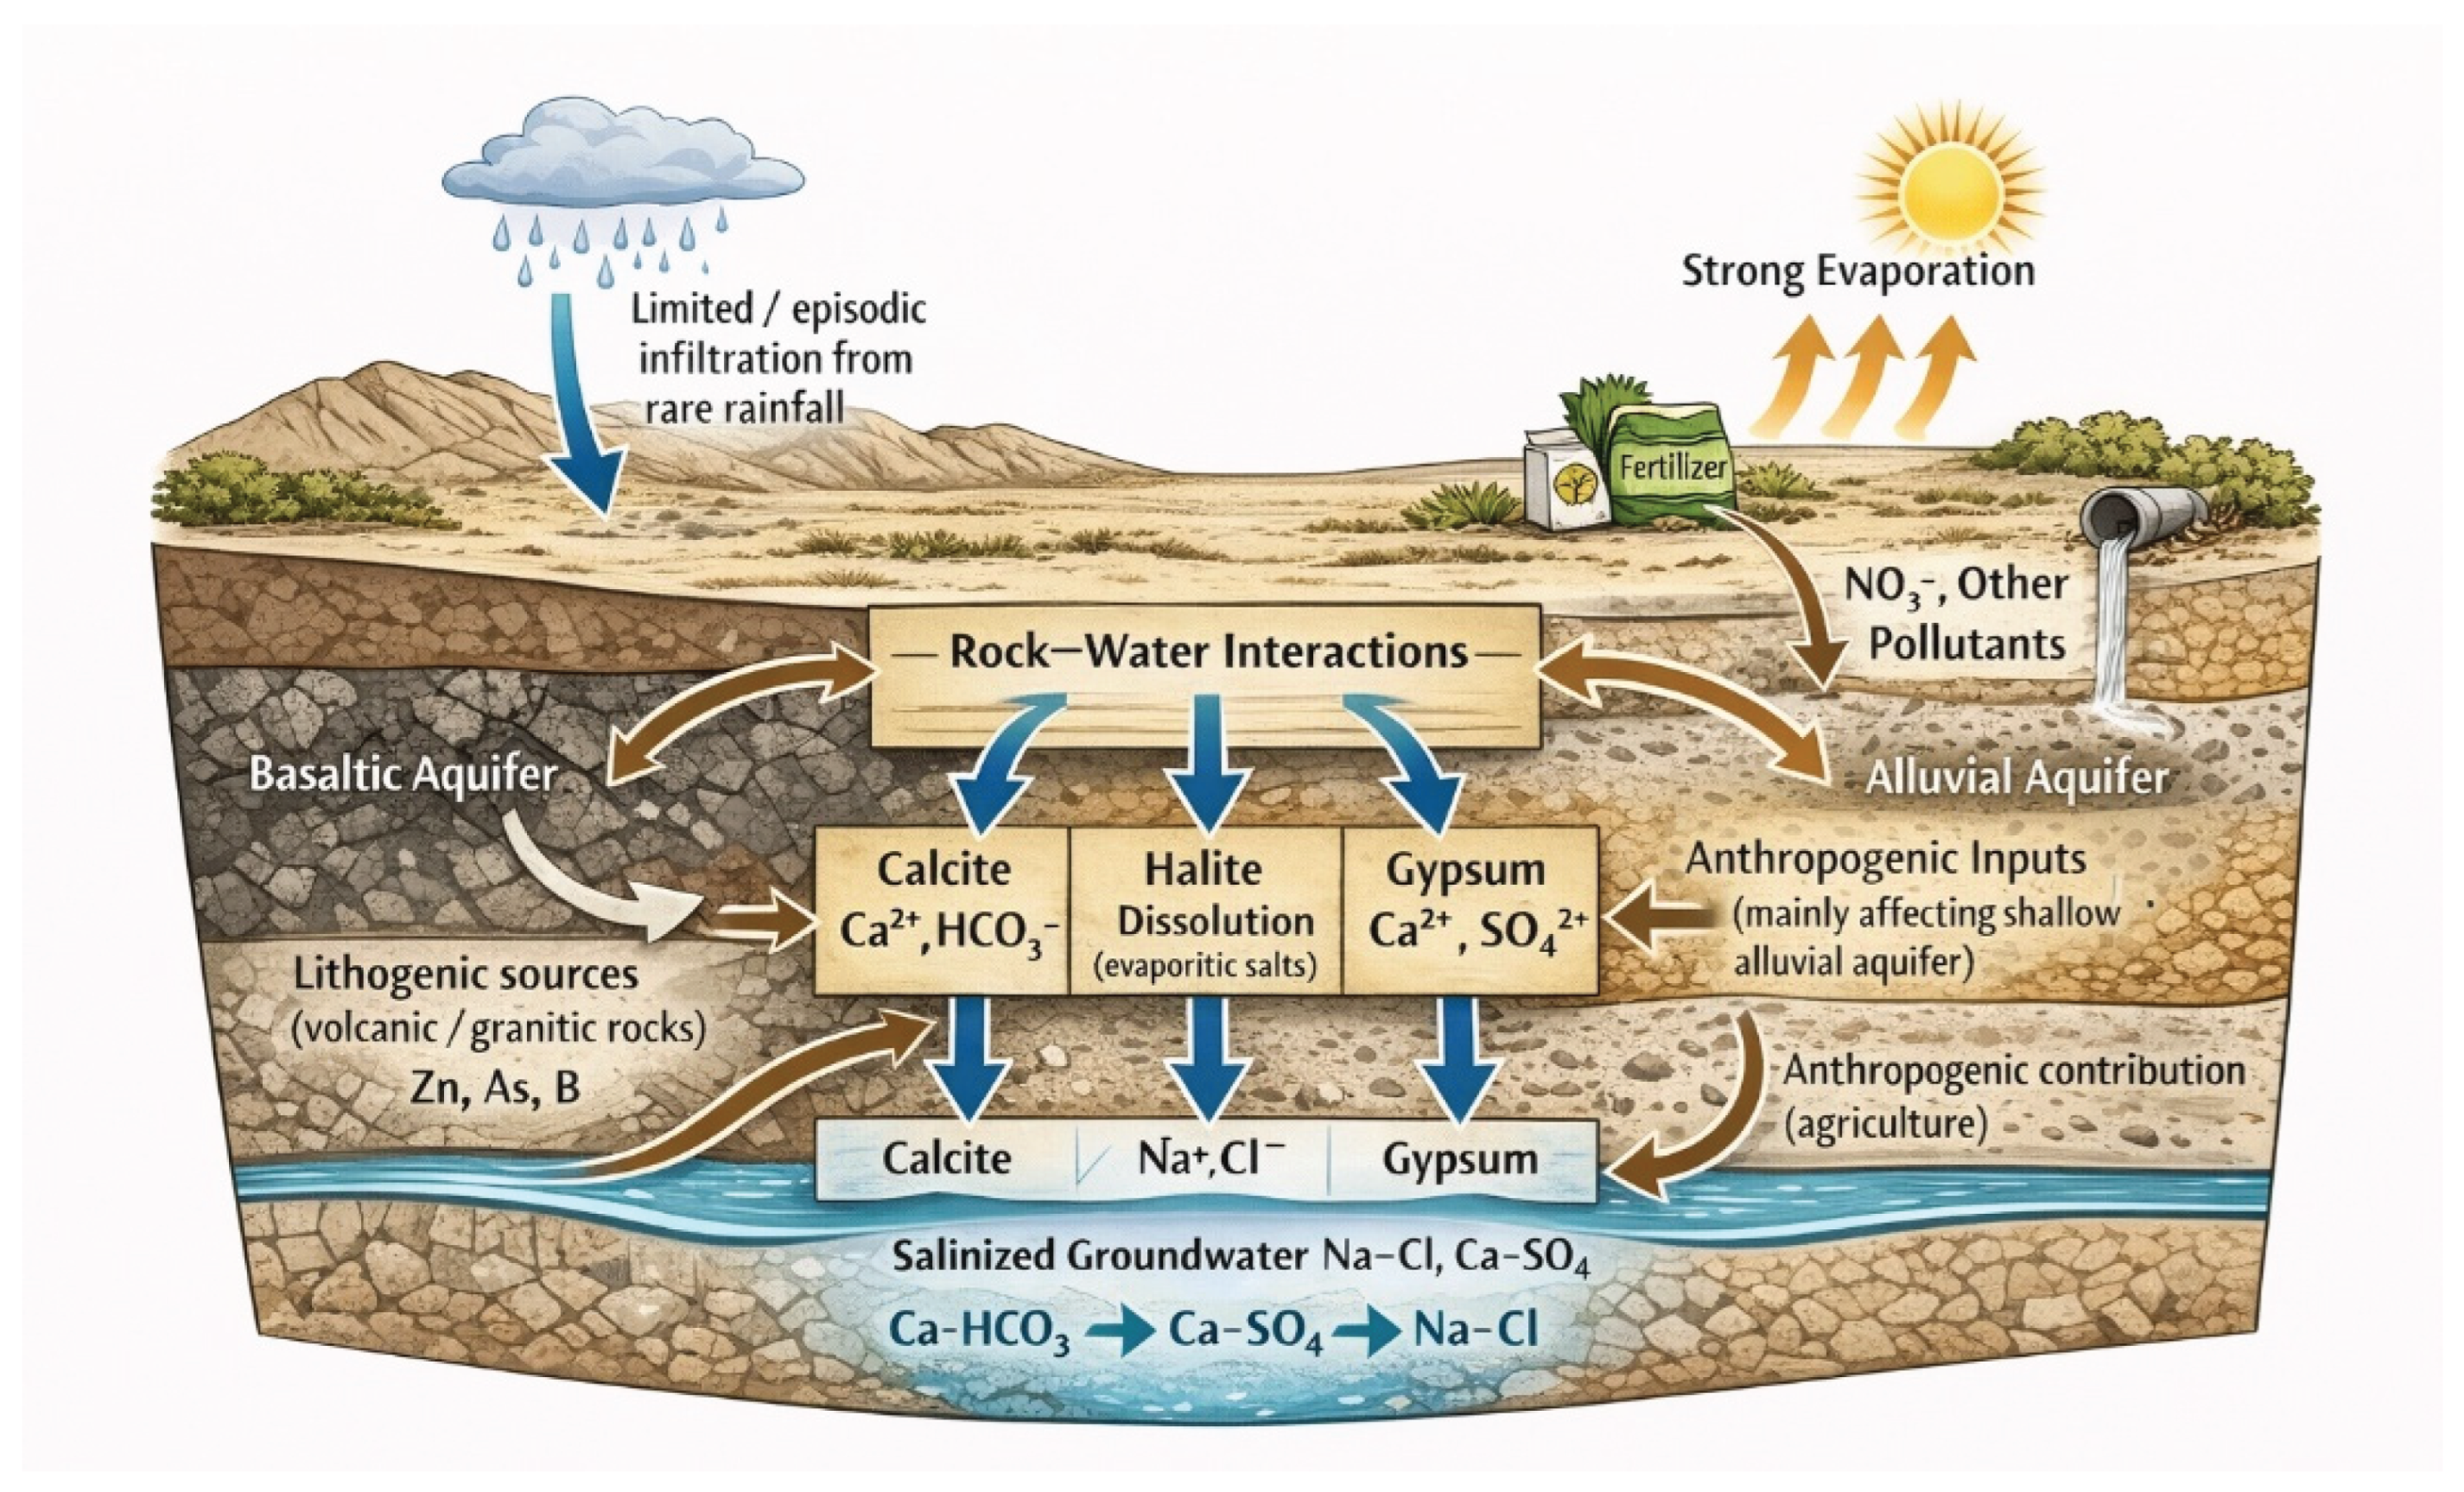
5.4. Conceptual Hydrogeochemical Model
Based on the integration of geological setting, hydrochemical data, saturation index calculations, correlation analysis, and rock–water interaction results, a conceptual hydrogeochemical model is proposed to explain the evolution and quality of groundwater in the Al Madinah region (Figure 10).
Groundwater recharge in the study area is primarily derived from limited rainfall and surface runoff infiltrating through fractured basaltic lava flows and Quaternary alluvial deposits. The study area is characterized by arid climatic conditions, where rainfall is infrequent, short-lived, and highly episodic. As a result, sustained surface water flow is absent, and runoff events occur only sporadically during rare intense storms, without forming permanent drainage networks. Additionally, the high permeability of fractured basaltic lava flows and coarse alluvial deposits promotes rapid infiltration of precipitation, limiting surface runoff and enhancing diffuse recharge mechanisms. Consequently, groundwater recharge is dominated by limited, episodic infiltration rather than continuous surface water flow, which explains the absence of surface hydrological features and reinforces the dominance of subsurface-controlled hydrogeochemical processes in the study area. In the basaltic aquifer, groundwater movement is mainly controlled by vesicles, fractures, weathered zones, and interflow boundaries between successive lava flows. In contrast, groundwater within the alluvial aquifer flows through interbedded layers of sand, gravel, and clay, resulting in longer residence times and enhanced hydrogeochemical evolution.
As recharge water percolates through the subsurface, intensive rock–water interactions occur. The chemical weathering of silicate minerals within basaltic rocks contributes Ca2+, Mg2+, Na+, HCO3−, and SiO24+ to groundwater. However, the hydrochemical composition is strongly governed by carbonate and sulfate mineral equilibria, which play a central role in controlling groundwater chemistry. Saturation index calculations indicate that groundwater is predominantly supersaturated with respect to calcite and dolomite, suggesting active precipitation and buffering of Ca2+, Mg2+, and HCO3− concentrations. In contrast, partial saturation or near-equilibrium conditions with respect to gypsum and anhydrite indicate ongoing dissolution–precipitation processes that regulate sulfate and calcium levels in the groundwater system. The hydrochemical evolution from Ca–HCO3 to Ca–SO4 and finally to Na–Cl facies reflect increasing groundwater residence time, enhanced rock–water interaction, and evaporation effects, consistent with Piper diagram interpretations (Figure 10).
Groundwater remains undersaturated with respect to halite, indicating continued dissolution potential and explaining the widespread enrichment of Na+ and Cl− ions, particularly in the alluvial aquifer. These processes, combined with strong evaporation under arid climatic conditions, lead to progressive salinization and the development of chemically evolved groundwater dominated by sodium–chloride and calcium–sulfate facies.
Anthropogenic inputs further modify groundwater chemistry, especially in agricultural areas. Elevated concentrations of nitrate, potassium, zinc, and arsenic reflect the influence of fertilizer application, irrigation return flow, and localized sewage leakage. These impacts are more pronounced in the alluvial aquifer due to its higher permeability, longer groundwater residence time, and greater exposure to surface-derived contaminants.
Heavy metal concentrations are largely controlled by lithological composition and mineral dissolution, particularly from granitic, felsitic, and volcanic rocks, with additional contributions from agricultural activities. Volcanic rocks in the Harrat region contribute to elevated boron levels in the basaltic aquifer, while alluvial sediments facilitate the accumulation of trace metals through adsorption and prolonged water–sediment interaction.
Overall, the conceptual model illustrates that groundwater quality in the Harrat Rahat–Al Madinah region results from the combined effects of climate-driven evaporation, carbonate and sulfate mineral equilibria, silicate weathering, and anthropogenic activities. These interacting processes explain the observed spatial variations in groundwater chemistry and provide a robust framework for understanding groundwater evolution, vulnerability, and management challenges in arid volcanic terrains.
Figure 10.
Conceptual hydrogeochemical model illustrating evolution and quality of groundwater in the Harrat Rahat–Al Madinah region.
Figure 10.
Conceptual hydrogeochemical model illustrating evolution and quality of groundwater in the Harrat Rahat–Al Madinah region.
6. Conclusions
The Al Madinah region is characterized by arid climate with limited surface water resources; consequently, groundwater represents the primary source of water in the area. To assess its suitability for drinking, domestic, and irrigation purposes, the chemical characteristics of groundwater from the basaltic aquifer of Harrat Rahat and the alluvial aquifer in the northwestern part of Harrat Rahat were investigated.
A total of 44 water samples were collected from different wells and analyzed for pH, total dissolved solids (TDS), electrical conductivity (EC), total hardness (TH), Ca2+, Mg2+, Na+, K+, NH4−, Cl−, HCO3−, NO3− and SO42−, and F−. Based on the Piper diagram classification, groundwater samples are predominantly classified within the sodium–chloride and calcium–sulfate water types. This distribution indicates a strong influence from the dissolution of evaporite minerals, particularly halite and gypsum, which contributes to elevated salinity levels in groundwater.
The study reveals that EC, TDS, and TH in both basaltic and alluvial aquifers exceed international and Gulf standards, indicating highly saline conditions that limit the suitability of groundwater for drinking and agricultural use. Elevated nitrate concentrations and other chemical constituents suggest the combined influence of natural geological processes and anthropogenic activities, including mineral leaching and agricultural runoff. Correlations among various ions reveal complex hydrochemical interactions controlled by both natural and human-induced factors. In the basaltic aquifer, a moderate correlation between nitrate and sewage-related indicators points to localized contamination, whereas weak correlations in the alluvial aquifer indicate minimal influence from sewage sources. Strong relationships among ions such as chloride, sulfate, potassium, sodium, magnesium, and nitrate further highlight the impact of agricultural and industrial activities on groundwater quality.
Heavy metals in the studied groundwater can be categorized into two groups: 1) metals like Ag, Ba, Be, Cd, Cr, Cu, Hg, Mn, Ni, Pb, Sb, and U, which occur within permissible limits; and 2) metals such as Zn, Al, As, Se, and Tl which exceed allowable limits in at least one sample. Elevated concentrations of these metals are primarily attributed to water–rock interactions, particularly the leaching of granite and felsite rocks that release trace elements into the groundwater. Agricultural practices, especially the use of fertilizers, also contribute to increased arsenic and zinc concentrations, as some fertilizers contain appreciable amounts of these elements. Furthermore, the elevated boron levels in the basaltic aquifer are likely due to boron released from basalts formed during past volcanic activity in the Harrat region. Overall, the findings emphasize the need for continuous groundwater quality monitoring and the implementation of effective management strategies to mitigate contamination risks and ensure the sustainable use of groundwater resources in the Al Madinah region.
Supplementary Materials
The following supporting information can be downloaded at the website of this paper posted on Preprints.org, Table S1: Detailed major ions and physicochemical parameters of the groundwater in the basaltic and alluvial aquifers; Table S2: Detailed chemical analysis results of heavy metals in the groundwater of the basaltic and alluvial aquifers; Table S3: Chemical analysis results of some elements in adjacent rocks.
Author Contributions
Methodology, H.A.E.-N., Y.D. and A.S.; Formal analysis, H.A.E.-N. and Y.D.; Investigation, H.A.E.-N., Y.D. and A.S.; Resources, H.A.E.-N., Y.D. and A.S.; Data curation, Y.D.; Writing—original draft, H.A.E.-N., Y.D. and A.S.; Writing—review and editing, H.A.E.-N., Y.D. and A.S.; Visualization, H.A.E.-N. and Y.D.; Supervision, H.A.E.-N.; Project administration, A.S.; Funding acquisition, H.A.E.-N. All authors have read and agreed to the published version of the manuscript.
Funding
This research work was funded by the Deanship of Scientific Research (DSR) at King Abdulaziz University, Jeddah, Saudi Arabia under grant no. (IPP: 1151-145-2025).
Data Availability Statement
The data presented in this study is contained within the article and supplementary materials.
Acknowledgments
This research work was funded by the Deanship of Scientific Research (DSR) at King Abdulaziz University, Jeddah, Saudi Arabia under grant no. (IPP: 1151-145-2025). The authors, therefore, acknowledge with thanks DSR for technical and financial support.
Conflicts of Interest
The authors declare no conflicts of interest. The funders had no role in the design of the study; in the collection, analyses, or interpretation of data; in the writing of the manuscript; or in the decision to publish the results.
References
- Abderrahman, W.A.; Rasheeduddin, M.; Al-Harazin, I.M.; Esuflebbe, M.; Eqnaibi, B.S. Impacts of management practices on groundwater conditions in the Eastern Province, Saudi Arabia. Hydrogeol. J. 1995, 3, 32–41. [CrossRef]
- AlSubih, M.; Kumari, M.; Mallick, J.; Ramakrishnan, R.; Islam, S.; Singh, C.K. Time series trend analysis of rainfall in last five decades and its quantification in Aseer Region of Saudi Arabia. Arab. J. Geosci. 2021, 14, 519. [CrossRef]
- Al-Shaibani, A.M. Hydrogeology and hydrochemistry of a shallow alluvial aquifer, western Saudi Arabia. Hydrogeol. J. 2008, 16, 155–165. [CrossRef]
- Mallick, J.; Singh, C.K.; AlMesfer, M.K.; Singh, V.P.; Alsubih, M. Groundwater quality studies in the Kingdom of Saudi Arabia: Prevalent research and management dimensions. Water 2021, 13, 1266. [CrossRef]
- El Maghraby, M.; Bamousa, A.O. Evaluation of groundwater quality for drinking and irrigation purposes using physicochemical parameters at Salilah area, Madinah Munawarah District, Saudi Arabia. J. Taibah Univ. Sci. 2021, 15, 695–709. [CrossRef]
- Bamousa, A.O.; El Maghraby, M. Groundwater characterization and quality assessment, and sources of pollution in Madinah, Saudi Arabia. Arab. J. Geosci. 2016, 9, 536. [CrossRef]
- Alghamdi, A.G.; Aly, A.A.; Aldhumri, S.A.; Al-Barakaha, F.N. Hydrochemical and quality assessment of groundwater resources in Al-madinah city, western Saudi Arabia. Sustainability 2020, 12, 3106. [CrossRef]
- Alfaifi, H.; El-Sorogy, A.S.; Qaysi, S.; Kahal, A.; Almadani, S.; Alshehri, F.; Zaidi, F.K. Evaluation of heavy metal contamination and groundwater quality along the Red Sea coast, southern Saudi Arabia. Mar. Poll. Bull. 2021, 163, 111975. [CrossRef]
- Alshehri, F.; Almadani, S.; El-Sorogy, A.S.; Alwaqdani, E.; Alfaifi, H.; Alharbi, T. Influence of seawater intrusion and heavy metals contamination on groundwater quality, Red Sea coast, Saudi Arabia. Mar. Bull. 2021, 165, 112094. [CrossRef]
- Alharbi, T.; Abdelrahman, K.; El-Sorogy, A.S.; Ibrahim, E. Identification of groundwater potential zones in the Rabigh-Yanbu area on the western coast of Saudi Arabia using remote sensing (RS) and geographic information system (GIS). Front. Earth Sci. 2023, 11, 1131200. [CrossRef]
- Alharbi, T.; Abdelrahman, K.; El-Sorogy, A.S.; Ibrahim, E. Contamination and health risk assessment of groundwater along the Red Sea coast, Northwest Saudi Arabia. Mar. Pollut. Bull. 2023, 192, 115080. [PubMed]. [CrossRef]
- Ibrahim, E.; Abdelrahman, K.; Alharbi, T.; El-Sorogy, A.S. Delineation of seawater intrusion in the Yanbu industrial area, northwest Saudi Arabia, using geoelectric resistivity sounding survey. J. King Saud Univ.—Sci. 2024, 36, 103110. [CrossRef]
- El Maghraby, M.M. Hydrogeochemicals characterization of groundwater aquifer in Al-Madinah Al-Munawarah City, Saudi Arabia. Arab. J. Geosci. 2015, 8, 4191–4206. [CrossRef]
- Sharaf, M.A.M. Major elements hydrochemistry and groundwater quality of Wadi Fatimah, west central Arabian Shield, Saudi Arabia. Arab. J. Geosci. 2013, 6, 2633–2653. [CrossRef]
- Niyazi, B. Groundwater assessment for sustainable development in the Wadi Al-Hamd Basin, Al-Madinah Al-Munawarah, KSA. J. Afr. Earth Sci. 2024, 215, 105289. [CrossRef]
- Masoud, M.; El Osta, M.; Al-Amri, N.; Niyazi, B.; Alqarawy, A.; Rashed, M. Groundwater Characteristics’ Assessment for Productivity Planning in Al-Madinah Al-Munawarah Province, KSA. Hydrology 2024, 11, 99. [CrossRef]
- Thornton, I. Applied environmental geochemistry. London, Academic Press, 1983, 501p.
- Osmond, J. K., Cowart, J. B. The theory and uses of natural uranium isotopic variations in hydrology. Atomic Energy review 1976, 14.
- Brugge, D., Buchner, V. Health effects of uranium: new research findings. Rev. Environ. Health 2011, 26, 231–249. [CrossRef]
- Mansouri, R.W.; Al-Shaibani, A.M.; Makkawi, M.H.; Tawabini, B.S. Groundwater quality assessment of northern Harrat Rahat Aquifer, Saudi Arabia. Hydrogeol J 2022, 30, 2433–2457. [CrossRef]
- Abd El-Naby, H.H.; Dawood, Y.H.; Sabtan, A.A. Uranium Isotopic Fractionation and Hydrogeochemical Controls in Groundwater of the Jabal Sayid–Mahd Adhab Region, Western Saudi Arabia. Minerals 2026, 16, 25. [CrossRef]
- Al-Bassam, A.M.; Al-Rumikhani, Y.A. Integrated hydrochemical method of water quality assessment for irrigation in arid areas: application to the Jilh aquifer, Saudi Arabia. J Afr Earth Sci 2003, 36, 345–356. [CrossRef]
- El Maghraby, M.M. Salinization of groundwater at the Quba area, Al Madinah Al Munawarah, Saudi Arabia. Proceed of the 6th Int Conf On Geochem Alex Univ Egypt, 15–16 September 2004, 309–318.
- Subyani, A.M. Use of chloride-mass balance and environmental isotopes for evaluation of groundwater recharge in the alluvial aquifer Wadi Tharad western Saudi Arabia. Environ Geol 2004, 46, 741–749. [CrossRef]
- Abderrahman, W.A. Water management in ArRiyadh. Int J Water Resour Dev 2006, 22, 281. [CrossRef]
- Al-Sefry, S.A.; Sen, Z. Groundwater rise problem and risk evaluation in major cities of arid lands—Jeddah case in Kingdom of Saudi Arabia. Water Resour Manag 2006, 20, 91–108. [CrossRef]
- Italconsult. Detailed Investigation of the Madina Region. In Final Report: Thermatic Report Number 5 and 7; Saudi Arabian Ministry of Agriculture and Water: Riyadh, Saudi Arabia, 1979. [Google Scholar].
- Bayumi, T.H. Groundwater Resources of the Northern Part of Harrat Rahat Plateau, Saudi Arabia. Ph.D. Thesis, King Abdulaziz University, Jeddah, Saudi Arabia, 1992. (Unpublished).
- Piper, A.M.A. Graphic Procedure in the Geochemical Interpretation of Water Analysis; Ground Water Notes, 12; U.S. Geological Survey: Reston, VA, USA, 1953, 63p.
- GSO (Gulf Standards organization). The second international workshop on guided-self organization, August 18-20. Max Planck Institute for Mathematics in the Sciences, 2009. http://www.mis.mpg.de/calendar/conferences/2009/gs09.html.
- World Health Organization. A global overview of national regulations and standards for drinking-water quality. Geneva, Switzerland, 2021.
- Agency, U.S.E.P., Water, O. Edition of the Drinking Water Standards and Health Advisories Tables. EPA 822-F-18-001. Office of Water, U.S. Environmental Protection Agency, Washington, DC. March 2018.
- Adriano, D.C. Biogeochemistry of trace metals, Lewis Publications, Boca Raton, Fla, 1992, 528 p.
- U.S. Environmental Protection Agency. Guidelines for Water Reuse. EPA/625/R-04/108. Washington, DC, 2004.
Figure 1.
Geological map of the study area.
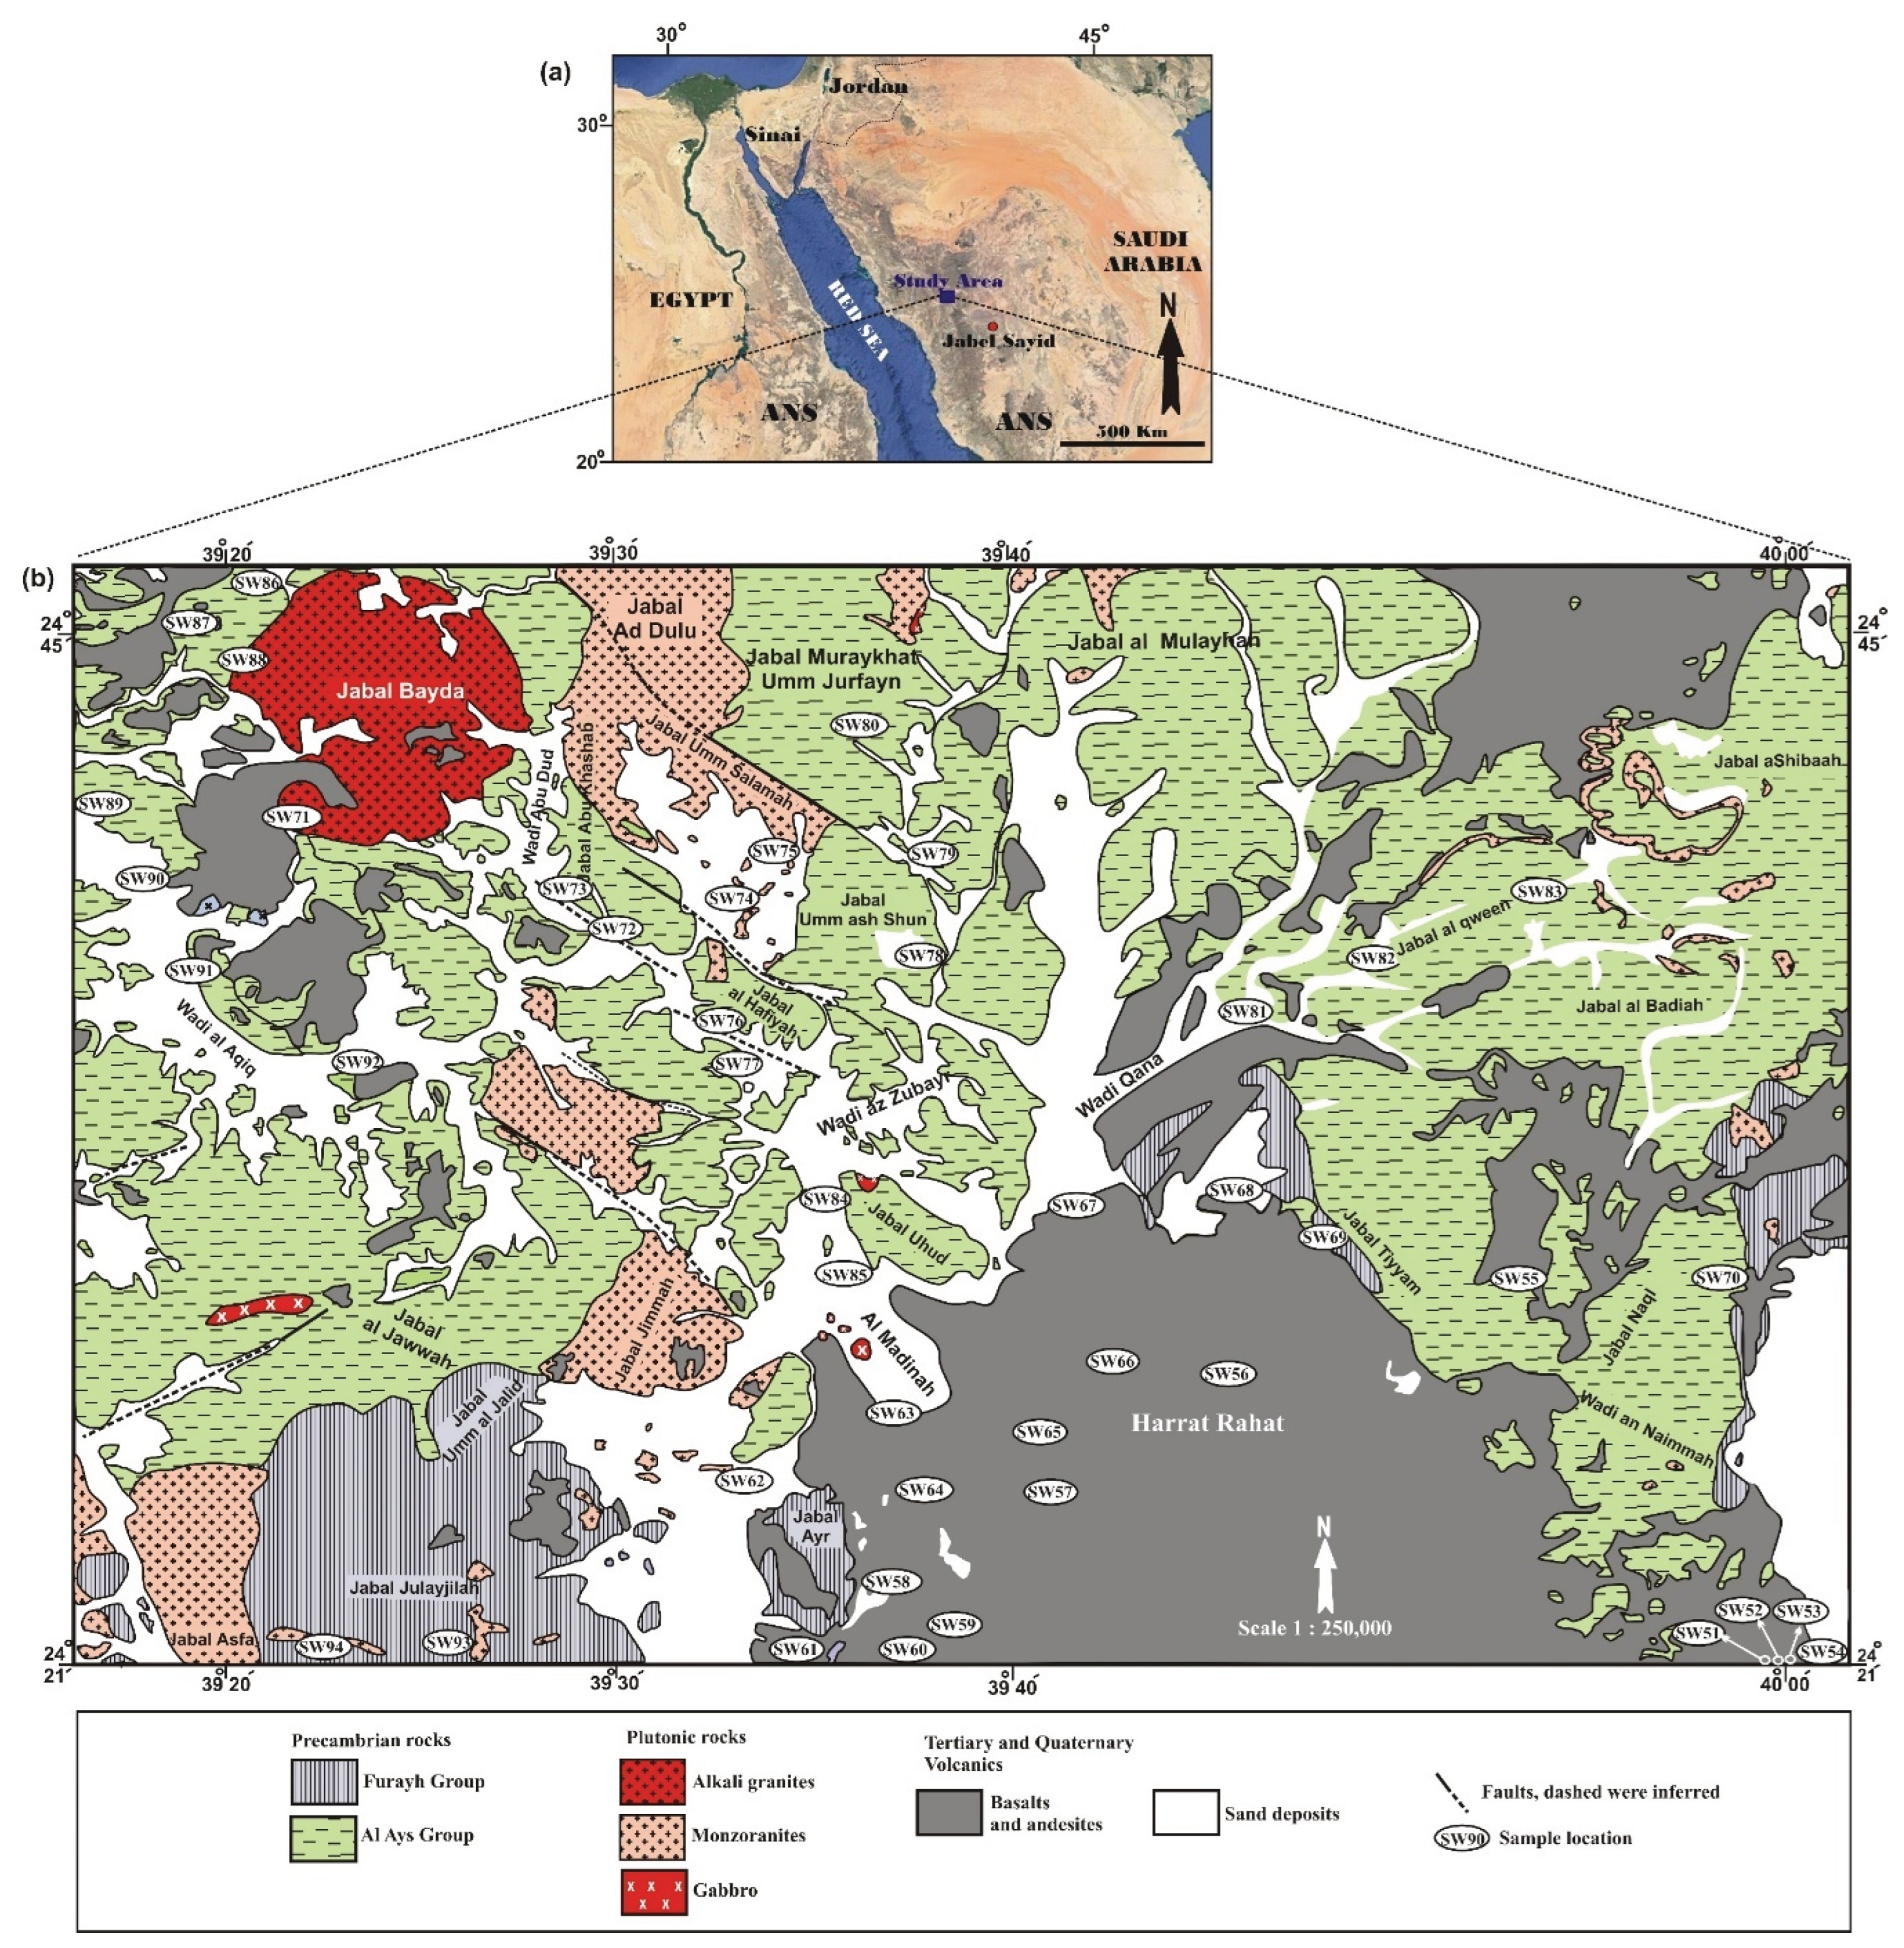
Figure 2.
(a) Fractures with various orientations in andesite rocks. (b) Foliation in older metamorphosed volcanic rocks. (c) Microscopic image of dacite under crossed Nicols. (d) Microscopic images of rhyolite under the plane polarized light.
Figure 2.
(a) Fractures with various orientations in andesite rocks. (b) Foliation in older metamorphosed volcanic rocks. (c) Microscopic image of dacite under crossed Nicols. (d) Microscopic images of rhyolite under the plane polarized light.
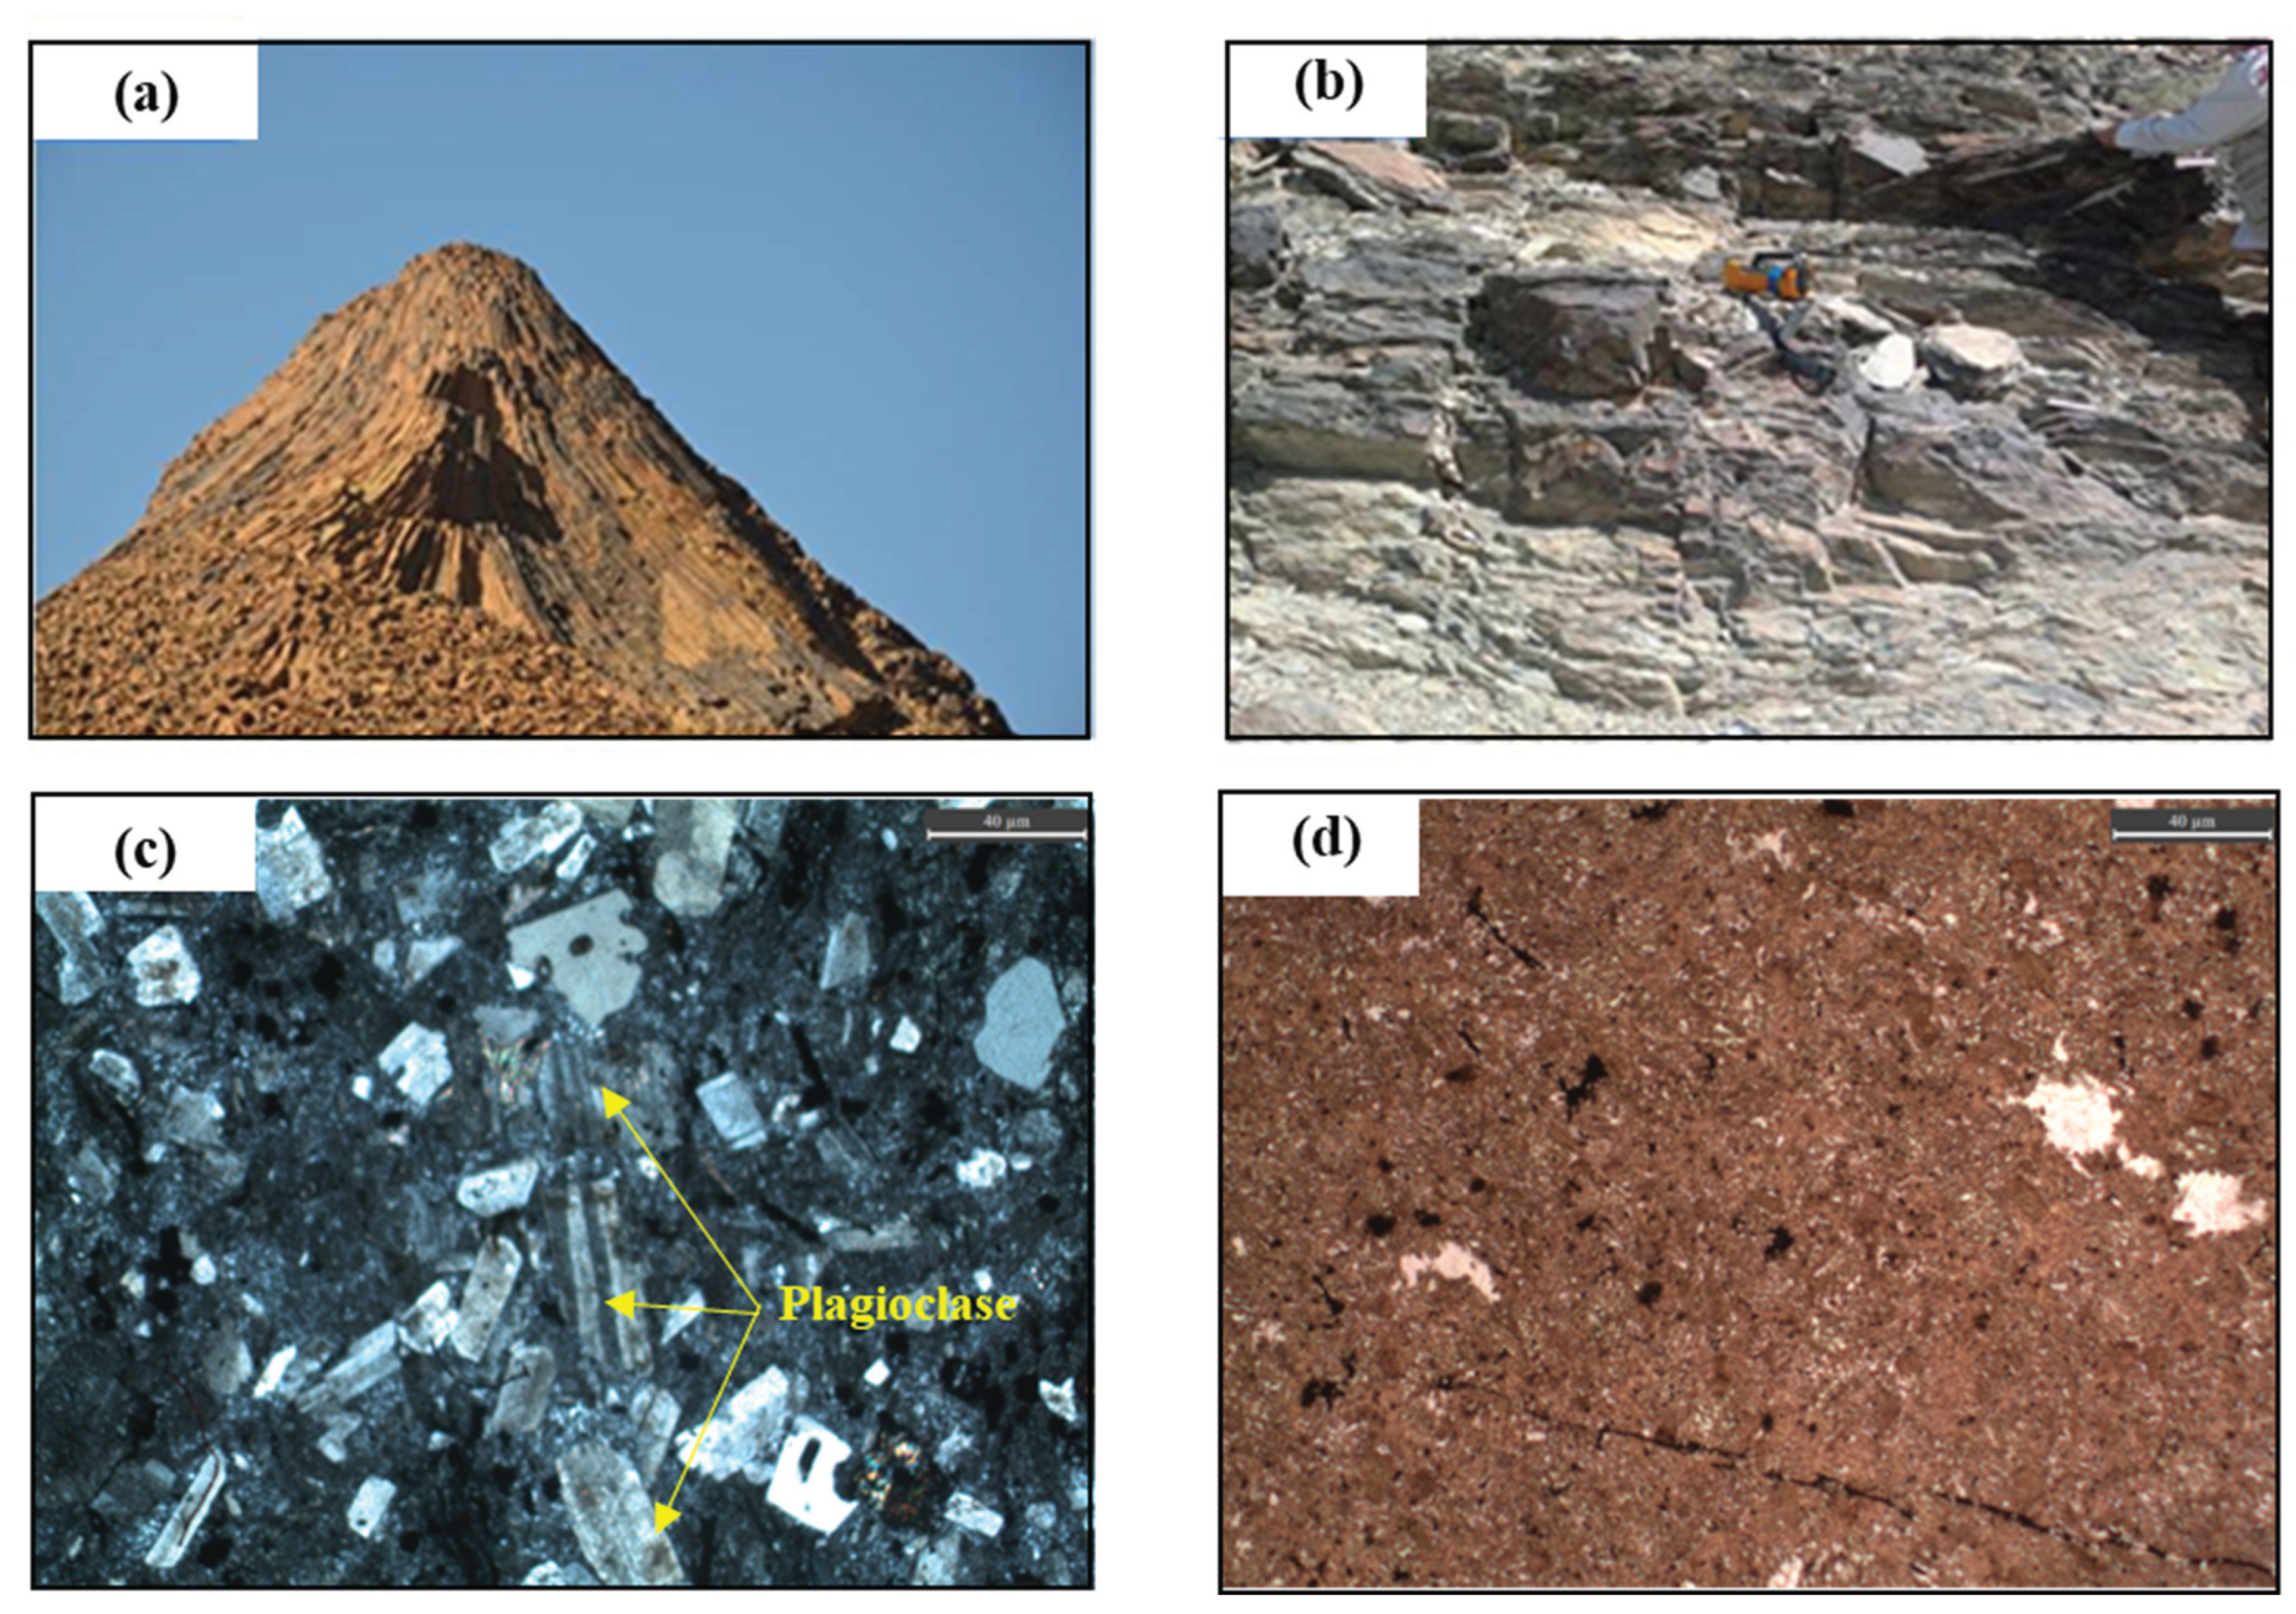
Figure 4.
Piper diagram showing the relative compositions of major cations and anions in groundwater from Al Madinah region.
Figure 4.
Piper diagram showing the relative compositions of major cations and anions in groundwater from Al Madinah region.
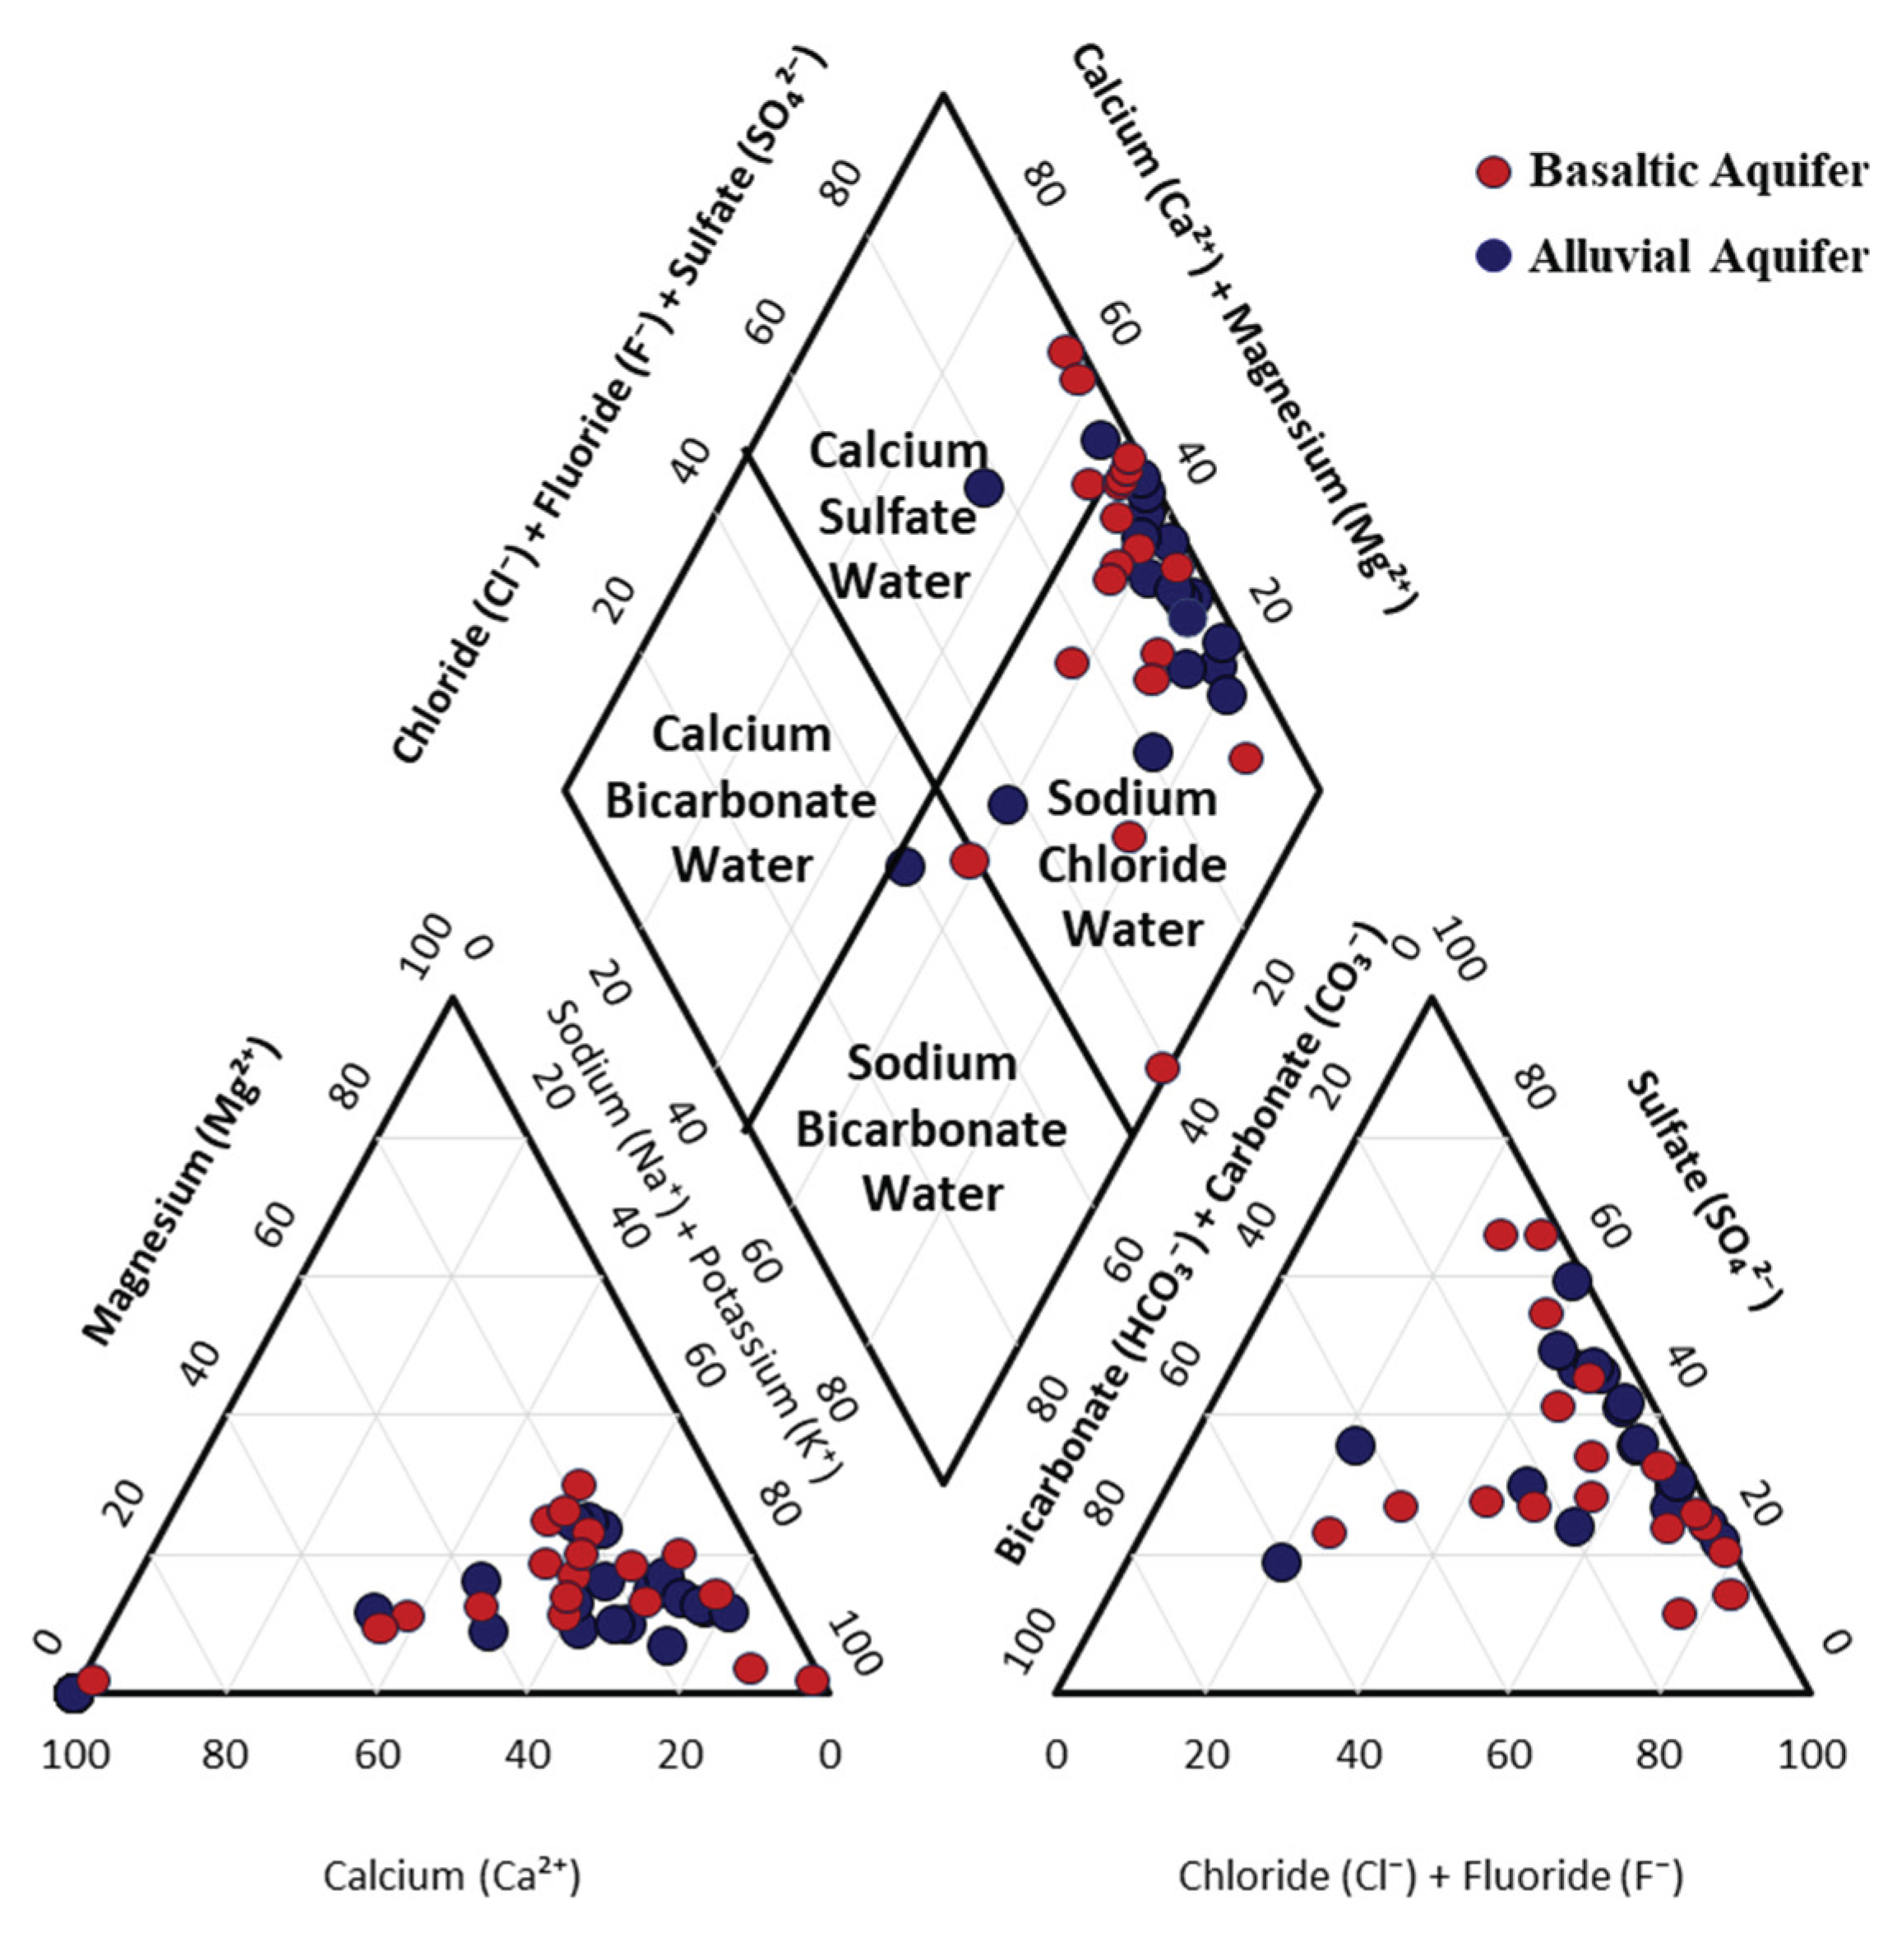
Figure 8.
Saturation indices of anhydrite, gypsum, calcite, dolomite, and halite in groundwater samples.
Figure 8.
Saturation indices of anhydrite, gypsum, calcite, dolomite, and halite in groundwater samples.
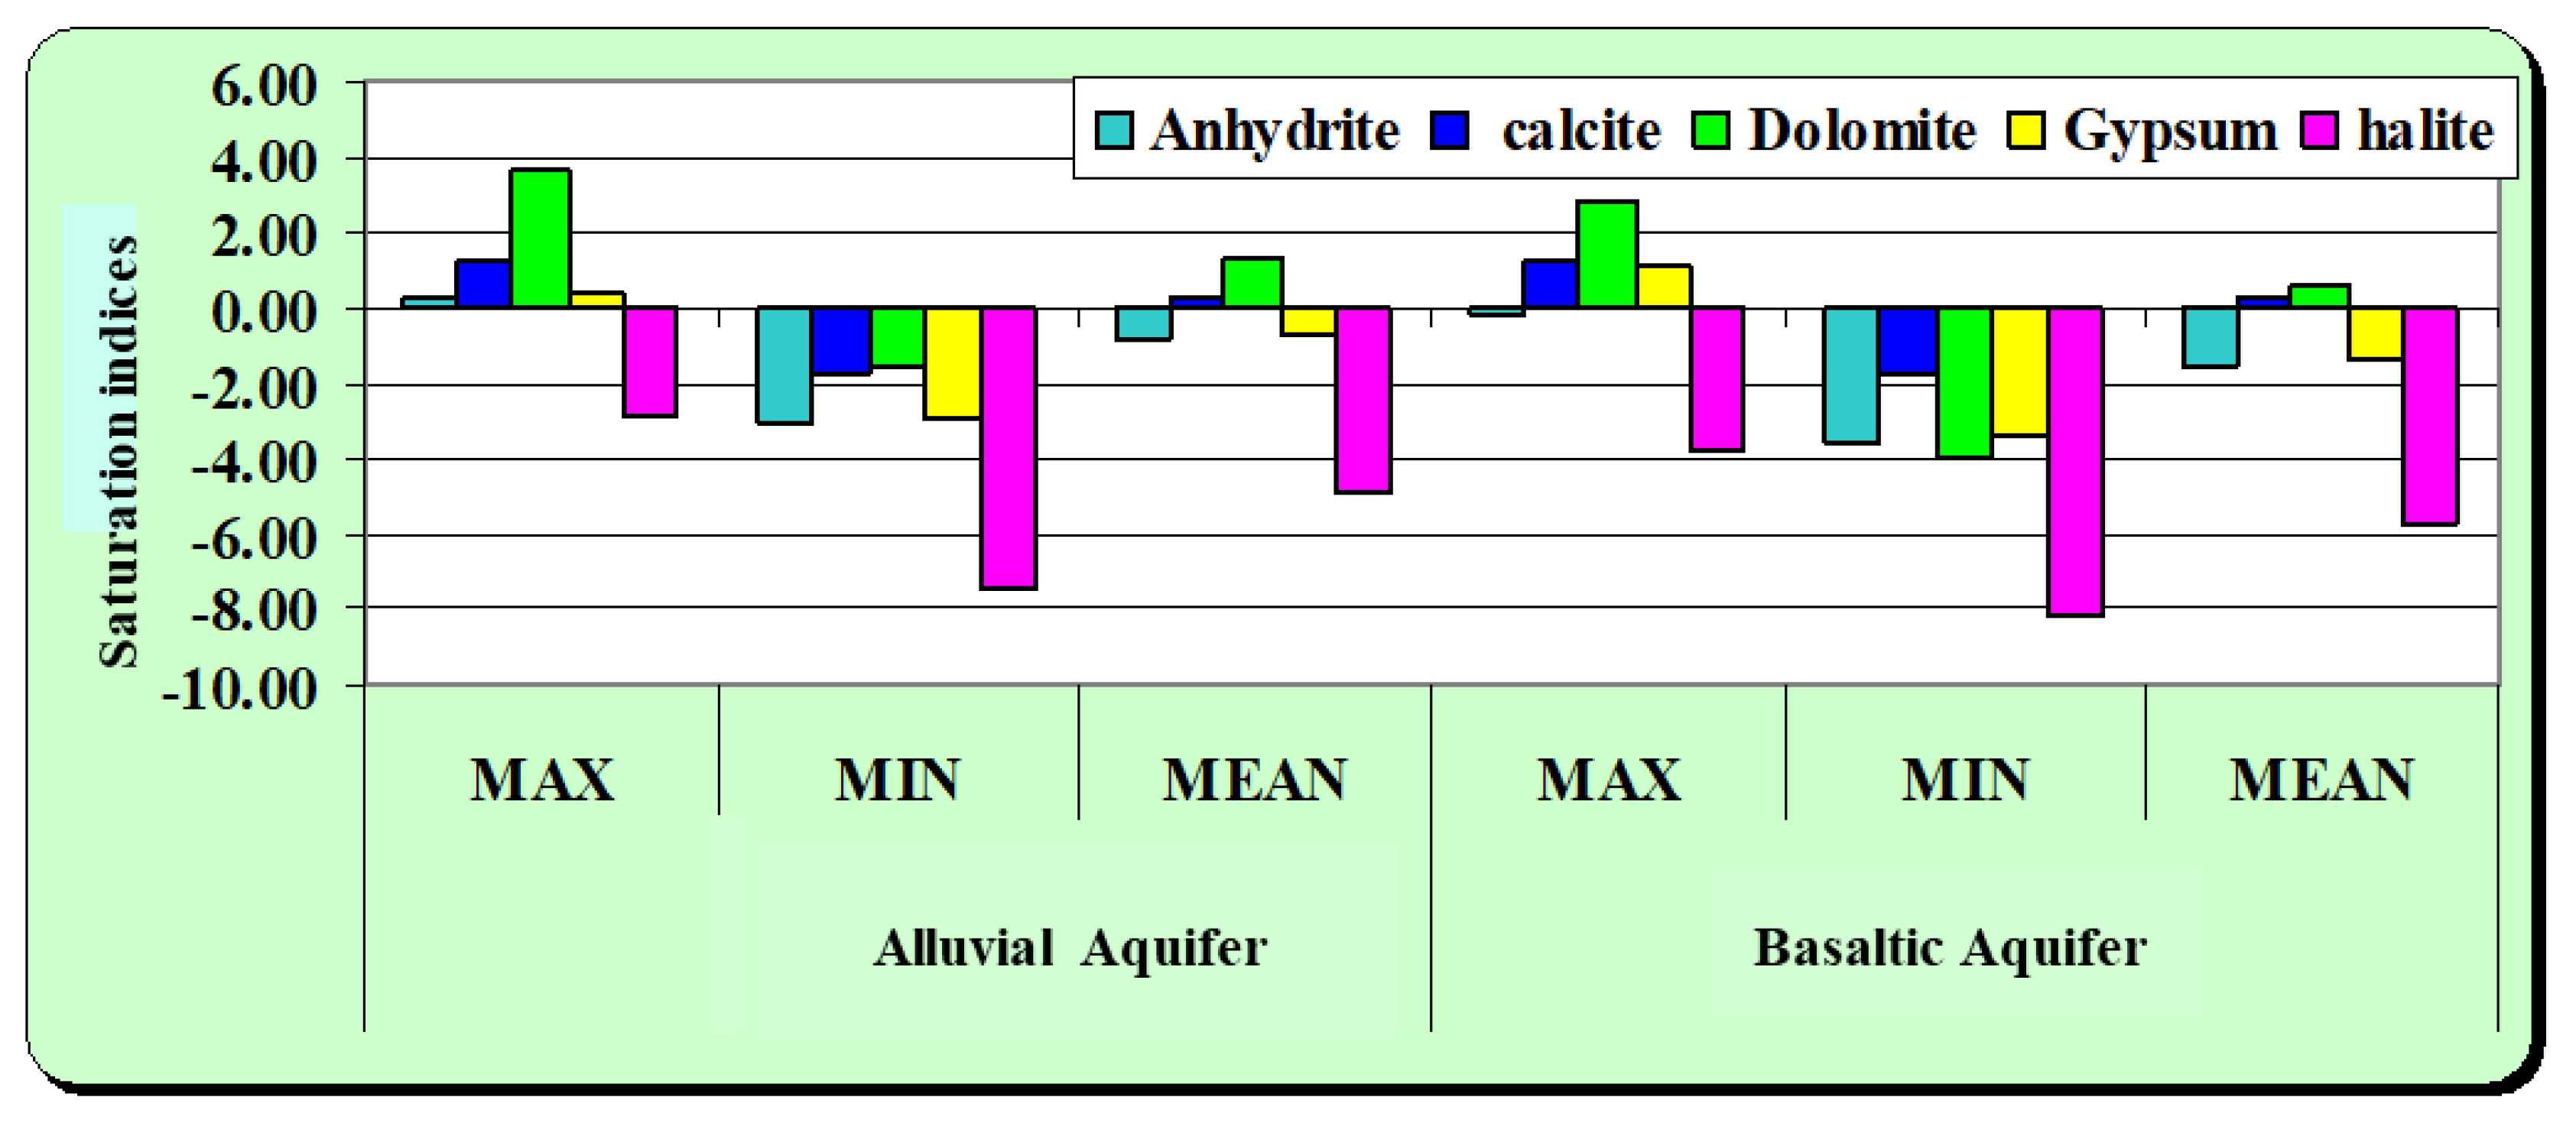
Figure 9.
Relationship between the average concentrations of selected elements in groundwater and adjacent rocks.
Figure 9.
Relationship between the average concentrations of selected elements in groundwater and adjacent rocks.
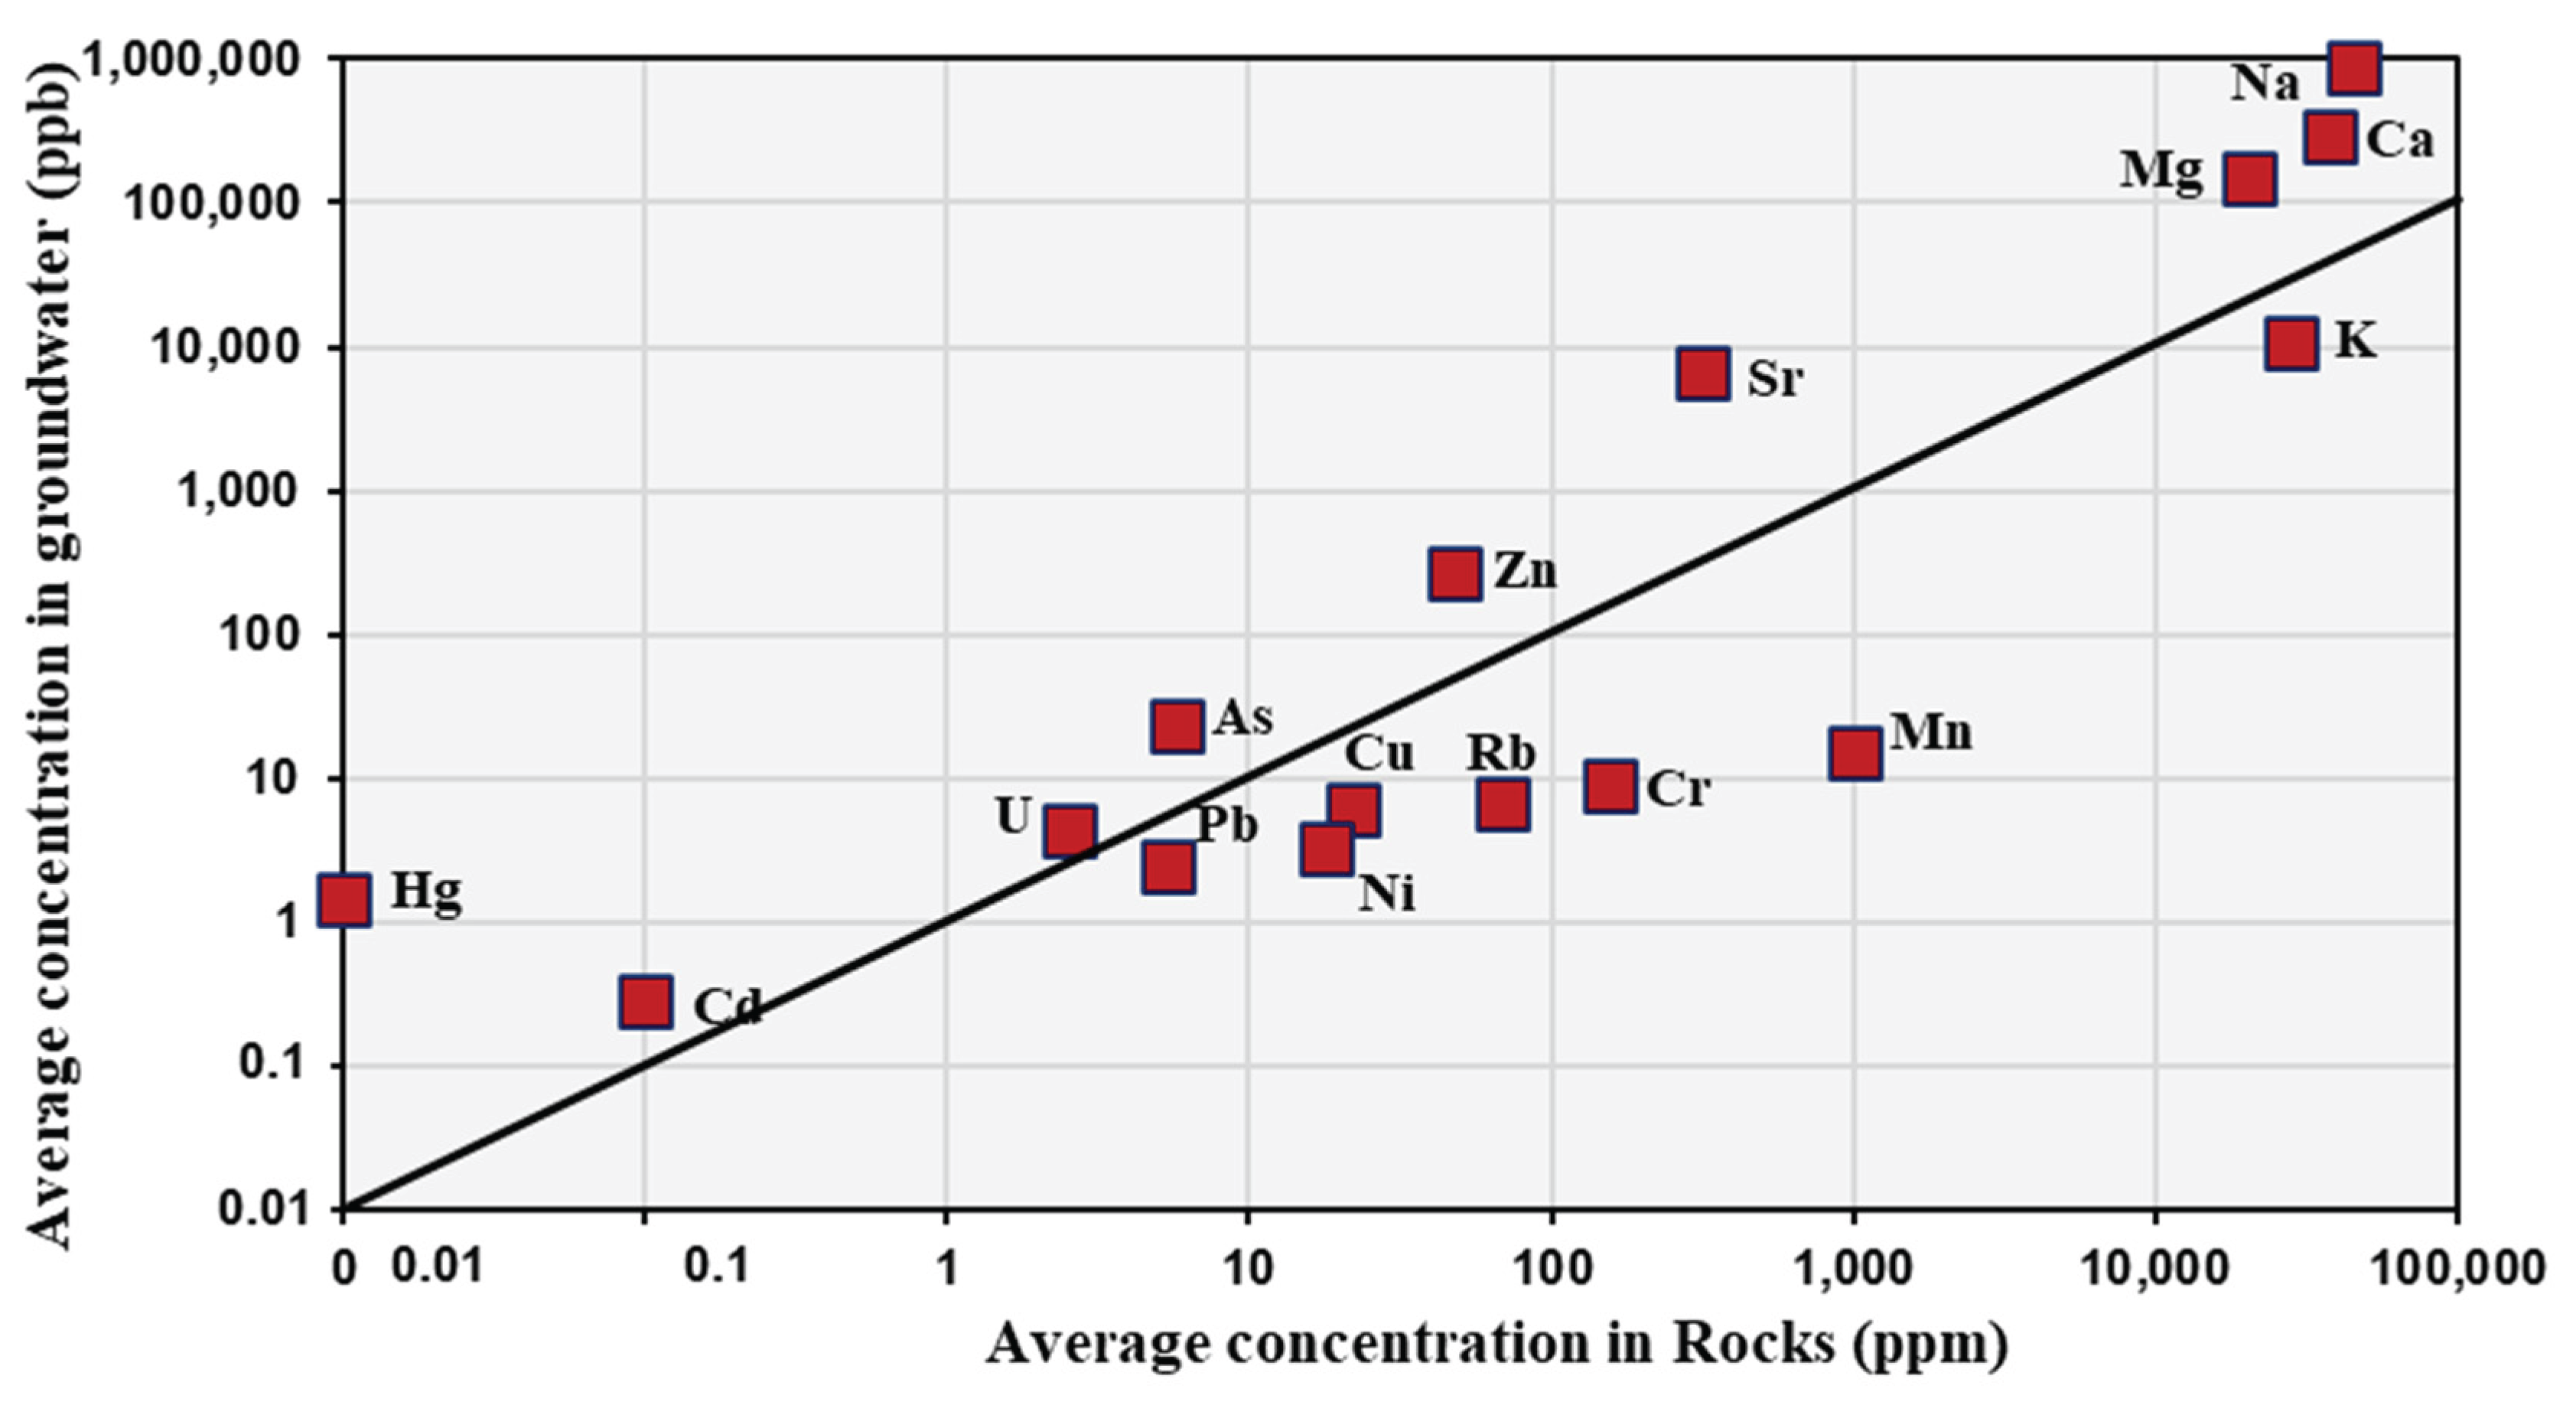
Table 1.
Major ions and physicochemical parameters of groundwater in the study area (ppm).
|
Elements |
Basaltic Aquifer (20 samples) |
Alluvial Aquifer (24 samples) |
Standards | ||||||
|---|---|---|---|---|---|---|---|---|---|
| Min | Max | Mean | Min | Max | Mean | GSO (2009) |
WHO (2021) |
US EPA (2018) |
|
| Na+ | 109 | 1562 | 572 | 78 | 3492 | 1369 | 200 | 200 | 20 |
| K+ | 0.2 | 25 | 8 | 1.8 | 43 | 16 | 20 | 12 | * |
| Ca+ | 2.8 | 840 | 260 | 46 | 1207 | 360 | 75 | 75 | * |
| Mg2+ | 0.6 | 413 | 95 | 7.5 | 854 | 201 | 50 | 150 | * |
| Fe2+ | <0.10 | <0.10 | <0.10 | <0.10 | <0.10 | <0.10 | 0.3 | 1 | 0.3 |
| NH4− | <0.04 | <0.04 | <0.04 | 0.09 | 2.02 | 1.04 | 1.5 | 1.5 | * |
| Cl− | 75 | 3135 | 1025 | 43 | 8460 | 2243 | 150 | 250 | 250 |
| HCO3− | 34 | 536 | 181 | 135 | 475 | 244 | * | 150-350 | * |
| NO3− | 4 | 228 | 77 | 4 | 270 | 99 | 50 | 10 | 10 |
| SO42− | 95 | 2430 | 771 | 57 | 4400 | 1576 | 150 | 400 | 250 |
| F− | 0.15 | 1.39 | 0.43 | 0.05 | 6.39 | 1.2 | 1.5 | 1.5 | 4 |
| NO2− | 0.07 | 0.09 | 0.08 | 0.03 | 3.3 | 1.7 | 1 | 1 | 1 |
| PO43− | <0.09 | <0.09 | <0.09 | <0.09 | <0.09 | <0.09 | * | 0.3 | 1.5 |
| SiO24− | 13 | 54 | 25 | 19 | 63 | 35 | * | * | * |
| TDS (ppm) | 586 | 8480 | 3169 | 482 | 16,500 | 5733 | 600 | 500 | 500 |
| EC (µS/cm) | 903 | 13,080 | 4882 | 741 | 25,600 | 8832 | 1500 | 1000 | 2500 |
| pH | 6.5 | 7.9 | 7.4 | 7.2 | 8.2 | 7.6 | 6.5-8.5 | 6.0-8.5 | 6.50-8.5 |
| TH | 9.5 | 3258 | 1038 | 170 | 6526 | 1725 | 200 | 300 | 300 |
| PCO2 | -3.51 | -0.92 | -2.25 | -3.35 | -1.62 | -2.42 | |||
| SI (Halite) | -8.14 | -3.77 | -5.76 | -7.5 | -2.91 | -4.86 | |||
| SI (gypsum) | -3.38 | 1.08 | -1.32 | -2.93 | 0.42 | -0.69 | |||
| SI (Calcite) | -1.74 | 1.24 | 0.28 | -0.74 | 1.78 | 0.72 | |||
| SI (Anhydrite) | -3.56 | -0.18 | -1.53 | -3.12 | 0.25 | -0.84 | |||
| SI (Dolomite) | -4 | 2.8 | 0.56 | -1.58 | 3.62 | -1.58 | |||
(GSO) Gulf Standards organization; (WHO) World Health Organization; (US EPA) United States Environmental Protection Agency; * Unspecified, (SI) Saturation index.
Table 3.
Spearman’s rank correlation matrix showing the relationships among variables measured in groundwater from the basaltic aquifer.
Table 3.
Spearman’s rank correlation matrix showing the relationships among variables measured in groundwater from the basaltic aquifer.
| Ca2+ | Mg2+ | Na+ | K+ | Cl− | HCO3− | NO3− | SO42− | F− | SiO24− | TDS | EC | Ph | TH | |
|---|---|---|---|---|---|---|---|---|---|---|---|---|---|---|
| Ca2+ | 1 | |||||||||||||
| Mg2+ | 0.470* | 1 | ||||||||||||
| Na+ | 0.605** | 0.877** | 1 | |||||||||||
| K+ | 0.398 | 0.761** | 0.702** | 1 | ||||||||||
| Cl− | 0.671** | 0.825** | 0.883** | 0.577** | 1 | |||||||||
| HCO3− | -0.149 | 0.137 | 0.251 | 0.089 | -0.120 | 1 | ||||||||
| NO3− | 0.346 | 0.618** | 0.503* | 0.715** | 0.298 | 0.090 | 1 | |||||||
| SO42− | 0.766** | 0.588** | 0.672** | 0.598** | 0.442 | 0.265 | 0.700** | 1 | ||||||
| F− | 0.221 | 0.213 | 0.334 | 0.142 | 0.343 | 0.305 | -0.090 | 0.085 | 1 | |||||
| SiO24− | -0.310 | 0.187 | 0.136 | 0.142 | -0.071 | 0.630** | 0.173 | 0.000 | -0.110 | 1 | ||||
| TDS | 0.781** | 0.859** | 0.956** | 0.670** | 0.944** | 0.057 | 0.489* | 0.704** | 0.322 | -0.010 | 1 | |||
| EC | 0.782** | 0.859** | 0.956** | 0.670** | 0.943** | 0.058 | 0.488* | 0.705** | 0.323 | -0.012 | 1.000** | 1 | ||
| Ph | -0.540* | -0.572** | -0.569** | -0.310 | -0.603** | 0.104 | -0.388 | -0.468* | -0.084 | 0.140 | -0.629** | -0.628** | 1 | |
| TH | 0.896** | 0.813** | 0.840** | 0.645** | 0.858** | -0.030 | 0.539* | 0.801** | 0.253 | -0.110 | 0.947** | 0.947** | -0.644** | 1 |
** Indicates significance at the 0.01 level; * Indicates significance at the 0.05 level.
Table 4.
Spearman’s rank correlation matrix showing the relationships among variables measured in groundwater from the alluvial aquifer.
Table 4.
Spearman’s rank correlation matrix showing the relationships among variables measured in groundwater from the alluvial aquifer.
| Ca2+ | Mg2+ | Na+ | K+ | Cl− | HCO3− | NO3− | SO42− | F− | SiO24− | TDS | EC | Ph | TH | |
|---|---|---|---|---|---|---|---|---|---|---|---|---|---|---|
| Ca2+ | 1 | |||||||||||||
| Mg2+ | 0.891** | 1 | ||||||||||||
| Na+ | 0.727** | 0.850** | 1 | |||||||||||
| K+ | 0.586** | 0.802** | 0.868** | 1 | ||||||||||
| Cl− | 0.852** | 0.964** | 0.913** | 0.859** | 1 | |||||||||
| HCO3− | -0.060 | 0.105 | 0.324 | 0.459* | 0.118 | 1 | ||||||||
| NO3− | 0.289 | 0.052 | -0.045 | -0.240 | -0.032 | -0.404 | 1 | |||||||
| SO42− | 0.703** | 0.673** | 0.844** | 0.560** | 0.659** | 0.293 | 0.220 | 1 | ||||||
| F− | -0.364 | -0.442* | -0.440* | -0.456* | -0.459* | -0.093 | -0.121 | -0.293 | 1 | |||||
| SiO24− | -0.015 | -0.039 | -0.071 | -0.039 | -0.049 | 0.017 | 0.160 | -0.060 | 0.423* | 1 | ||||
| TDS | 0.846** | 0.941** | 0.971** | 0.859** | 0.976** | 0.208 | 0.016 | 0.796** | -0.466* | -0.070 | 1 | |||
| EC | 0.847** | 0.942** | 0.970** | 0.858** | 0.977** | 0.206 | 0.017 | 0.795** | -0.465* | -0.070 | 1.000** | 1 | ||
| Ph | -0.593** | -0.422* | -0.268 | -0.248 | -0.332 | -0.233 | -0.008 | -0.407* | 0.075 | -0.129 | -0.347 | -0.347 | 1 | |
| Th | 0.967** | 0.977** | 0.817** | 0.724** | 0.939** | 0.031 | 0.164 | 0.706** | -0.418* | -0.029 | 0.923** | 0.924** | -0.513* | 1 |
** Indicates significance at the 0.01 level; * Indicates significance at the 0.05 level.
Table 5.
Average concentrations of selected elements in groundwater and adjacent rocks near the wells.
Table 5.
Average concentrations of selected elements in groundwater and adjacent rocks near the wells.
| Elements | Groundwater (ppb) | Rocks (ppm) |
|---|---|---|
| Ca | 289,479 | 37,664 |
| Mg | 146,557 | 20,521 |
| Na | 883,564 | 44,964 |
| K | 10,650 | 28,050 |
| Mn | 16 | 1.01 |
| Cr | 8.90 | 157 |
| Rb | 6.8 | 68.8 |
| Sr | 6585 | 318 |
| U | 4.4 | 2.5 |
| Cu | 6.3 | 21.9 |
| Pb | 2.4 | 5.4 |
| Zn | 275 | 47 |
| Ni | 3.3 | 18 |
| As | 24 | 5.8 |
| Cd | 0.3 | 0.1 |
| Hg | 1.5 | 0.01 |
Disclaimer/Publisher’s Note: The statements, opinions and data contained in all publications are solely those of the individual author(s) and contributor(s) and not of MDPI and/or the editor(s). MDPI and/or the editor(s) disclaim responsibility for any injury to people or property resulting from any ideas, methods, instructions or products referred to in the content. |
© 2026 by the authors. Licensee MDPI, Basel, Switzerland. This article is an open access article distributed under the terms and conditions of the Creative Commons Attribution (CC BY) license (http://creativecommons.org/licenses/by/4.0/).
Copyright: This open access article is published under a Creative Commons CC BY 4.0 license, which permit the free download, distribution, and reuse, provided that the author and preprint are cited in any reuse.


