Submitted:
30 January 2026
Posted:
30 January 2026
You are already at the latest version
Abstract
This study evaluates the rooftop solar photovoltaic (PV) potential at the building level in the tourism-rich districts of Northern Khyber Pakhtunkhwa (KPK), Pakistan, using advanced geospatial analysis to support renewable energy planning. By combining the Area Solar Radiation tool with detailed building footprint data, the study identified solar energy potential and prioritized areas for PV system installations. Results show that approximately 35% of the 1.29 million buildings analyzed are suitable for solar panels, with energy generation capacity varying by building size and district. Spatial analysis further highlighted Union Councils (UCs) where over 50% of buildings are solar suitable, enabling precise targeting of renewable energy initiatives. The study underscores the importance of integrating local geographical and socio-economic data to enhance the feasibility and scalability of solar energy solutions in rural and urban settings, and can be used to guide policy prioritization and funding decisions. This research demonstrates how geospatial analysis and open data can drive localized clean energy adoption, directly contributing to Sustainable Development Goal 7 by advancing affordable and sustainable energy solutions.
Keywords:
rooftop solar photovoltaic
; geospatial analysis
; renewable energy planning
; area solar radiation tool
; building footprint data
; solar energy potential
; spatial analysis
; sustainable development goal 7
1. Introduction
Electricity powers every aspect of modern life, from lighting homes and operating machinery to enabling communication, medical advancements, and research (Armaroli & Balzani, 2011). As we advance into the digital age, understanding its pivotal role is essential for shaping a sustainable, technologically driven future. Beyond daily necessities like communication, healthcare, and education, electricity also drives commercial operations and supports tourism, especially in remote areas. Reliable electricity is vital for economic growth in these sectors.
Electricity production depends on a variety of sources, and each source has environmental impacts (Oschman, 2015). Traditionally, fossil fuels like coal, oil, and natural gas, along with hydropower, have been used due to their abundant availability and high energy output. Hydropower, while being a relatively cleaner energy source, comes with its challenges. It is expensive to develop and requires extensive public consultation and community engagement to ensure its feasibility and acceptance; Fossil fuel sources, on the other hand, have negative environmental impacts (Bach, 1981), releasing substantial amounts of greenhouse gases and contributing heavily to climate change and environmental degradation. Nuclear power is a low-emission alternative but raises safety concerns (Khaleel et al., 2025) and challenges related to nuclear waste management (Addo, Kabo-bah, Diawuo, Debrah, & Kulriya, 2023). As the awareness of greenhouse gas emissions and environmental damage grows, the push for cleaner and more sustainable alternatives, such as renewable energy sources, becomes increasingly imperative for a greener and healthier planet.
Recently, the focus has shifted toward renewable energy sources such as wind power, solar power, geothermal energy, and biomass for a greener future (Sayed et al., 2021). Among these, solar power stands out as the fastest-growing renewable source globally (IEA, 2024), offering a scalable solution that enables decentralized energy production. This approach reduces transmission losses and interruptions while enhancing grid resilience (ENVERUS, 2025; Oshilalu, Kolawole, & Taiwo, 2024). Thus, with its unique advantages, solar power emerges as a promising solution to promote sustainable energy practices, encouraging environmental stewardship and paving the way for a cleaner, decentralized, and resilient energy landscape.
Solar energy holds immense potential for generating electricity. Solar panels harness the abundant sunlight (Lewis, 2016), converting it into clean electricity without emitting any harmful pollutants or greenhouse gases. This renewable energy empowers individuals and communities to participate in electricity generation, fostering energy independence and reducing carbon footprints (Stephens, 2019).
There are two primary methods for harnessing solar energy: solar rooftop panels and Solar parks. Solar rooftop panels are installed on commercial, industrial, or residential buildings, allowing localized electricity production (Vijayan et al., 2023). This localized generation not only reduces transmission losses but also empowers property owners to become active contributors to the energy grid, fostering energy self-sufficiency and potentially lowering electricity bills. Additionally, solar rooftop installations utilize existing infrastructure, optimizing land use and minimizing the environmental impact.
In contrast, solar parks are large-scale installations dedicated solely to solar energy generation (Turney & Fthenakis, 2011). Solar parks can take advantage of economies of scale, making them cost-effective for utilities and energy providers. However, they may require significant land availability and might encounter challenges in land acquisition and public acceptance. While both solar rooftop panels and solar parks contribute to the growth of renewable energy, solar rooftop installations stand out for their distributed and accessible nature, making them an appealing option to drive sustainable electricity generation while leveraging existing urban spaces.
Having a solar system doesn’t guarantee zero electricity bills (Kumar Sahu, 2015), as various factors can contribute to unexpectedly high costs. For example, during winter, increased consumption from electric heating and hot water systems can impact overall usage. On average, solar can reduce bills by 40% to 70%, depending on self-consumption and usage patterns.
To maximize benefits, it is crucial to ensure proper installation and sizing of the solar system (Watson et al., 2018). Moreover, diagnosing solar system issues requires monitoring and understanding of real-world performance. Factors like solar panel orientation, tilt, and shading greatly affect solar output (Yunus Khan et al., 2019). While the ideal orientation is South-facing in the Northern hemisphere (Gharakhani Siraki & Pillay, 2012), practical constraints might lead to East and West-facing panels. Partial shading can impact system performance, and it is essential to detect and address any shading issues.
During energy crises, developing countries face many difficulties, ranging from power shortages to complex power distribution issues. The geographical obstacles, such as landslides and harsh weather, hinder the establishment of reliable electricity infrastructure. Also, domestic insurgents and acts of terrorism further disrupt power generation and distribution. As demand surges due to population growth and industrial development, the need for electricity increases, whereas the cost of installing or expanding plants continues to escalate. This confluence of factors places immense pressure on developing countries, underscoring the urgent need for sustainable and diversified energy solutions to alleviate the burden and foster economic growth and environmental preservation.
Globally, electricity demand is increasing rapidly alongside population growth. Dense populations in clusters of buildings require powerful and continuous electricity transmission lines that can provide electricity regularly(Mohsin, Abbas, Zhang, Ikram, & Iqbal, 2019). There is a growing body of literature that recognizes the importance of solar panels in generating electricity (Sampaio & González, 2017). Solar panel installation is the globally adopted activity for utilizing renewable energy for electricity production. Countries like Australia, China, Germany, Japan, Spain, and Italy are promoting rooftop solar panel installations to harness renewable sources from the sun (Kumar Sahu, 2015).
Countries like Pakistan are particularly challenged in meeting this growing energy demand while striving to reduce carbon emissions (Yousuf, Ghumman, Hashmi, & Kamal, 2014). The deployment of PV systems is therefore vital for Pakistan to reach its ambitious goal of generating 30% of electricity from renewable sources by 2030 (Shah & Solangi, 2019). Currently, non-hydro renewable resources (wind, solar, biogases) account for only approximately 4.8% of Pakistan’s electricity generation (Government of Pakistan, 2025), necessitating a significant acceleration in solar deployment to meet climate goals. Recent reports confirm a rapid solar boom driven by high tariffs and frequent outages, but a robust, localized planning framework remains underdeveloped. To date, most energy planning for solar in Pakistan has occurred at the national or regional scale, relying on generalized isolation data. A significant research gap persists in bridging this macro-level planning with granular, building-level technical assessments. Localized studies are necessary to provide accurate, actionable data for municipal planning and targeted investment.
In the tourism-rich districts of Khyber Pakhtunkhwa, the need for sustainable, decentralized energy solutions is even more pressing, given the frequent geographical barriers and security challenges that hinder conventional electricity transmission. The present research addresses this gap by providing a high-resolution, building-level assessment of solar PV potential across KPK’s tourism districts. Specifically, this study has two specific objectives: 1) to estimate solar radiation potential using the Area Solar Radiation tool with a building-level focus, and 2) to identify and prioritize the union councils (the smallest administrative unit of local government) within KPK that are best suited for large-scale solar PV deployment. This research provides a starting point for understanding solar potential at the smallest administrative levels (Union Council), a pre-investment framework that complements, rather than duplicates, existing high-resolution rooftop PV studies. This is not intended to accurately calculate solar potential at the individual building level rather introduces UC level prioritization framework, translating technical solar potential estimates into actionable planning units aligned with Pakistan’s administrative and governance structure.
2. Materials and Methods
2.1. Study Area
The research focuses on assessing building-level and Unicion Council-level solar PV potential across nine districts in the Khyber Pakhtunkhwa (KPK) province of Pakistan: Swat, Buner, Batagram, Shangla, Torghar, Haripur, Swabi, Abbottabad, and Mansehra. This geographically diverse area is defined by rugged terrain and extensive mountainous landscapes, which severely complicate the construction and maintenance of conventional electricity transmission lines (Bhutto, Bazmi, & Zahedi, 2012). Consequently, many communities face chronic power deficiencies and frequent outages, making the region an ideal and high-priority case study for decentralized, localized energy solutions. The inherent challenges of providing reliable grid power due to the difficult terrain directly justify the large-scale assessment of rooftop PV potential as a sustainable alternative (Scott et al., 2023; Yadav, Davies, & Sarkodie, 2019).
2.2. Data
To estimate solar photovoltaic potential at the building level, we utilized several data sources:
1) The Shuttle Radar Topography Mission (SRTM) 30-meter DEM, obtained from the USGS (Mercuri, 2005) in January 2023, was used to model terrain.
2) Microsoft Bing’s building footprint dataset, covering over 1.2 billion buildings globally (Gonzales, 2023), provided essential information on building rooftops available in the study area. The GeoAI-extracted building footprints were utilized as provided; however, their completeness across all remote parts of the study area is acknowledged as a potential limitation.
3) National and regional boundaries, including district and sub-district (tehsil), and union council boundaries, were downloaded in geodatabase format from the Humanitarian Data Exchange.
2.3. Geospatial Methods
We began by utilizing a Digital Elevation Model (DEM) with a 30-meter spatial resolution as presented in Figure 1. The DEM data was crucial in understanding the terrain, especially the shadow effects caused by mountains and uneven landscapes. A high-resolution Digital Surface Model (DSM) was unavailable for the entire study area. To model the vertical dimension of buildings, a synthetic DSM was constructed by modifying the DEM in pixels corresponding to the locations identified by the Microsoft Bing building footprint dataset. Figure 1 provides a flow diagram of all the steps.
Due to the absence of building-specific height data across the study area and to maintain computational feasibility at this large geographic scale, a uniform height adjustment was applied to all building footprints. Specifically, 5 m was added to the DEM values for each building pixel. This conservative adjustment assumes that residential buildings in the study are predominantly single-story, with an average height of approximately 4 m, and includes an additional 1 me to account for rooftop features (e.g., solar panels) and minor structural variability. While this approach may underestimates building heights for the limited number of multi-story structures that may exist, it provides a pragmatic, transparent, and reproducible approximation appropriate for large-area spatial modeling. There are also no readily available official statistics reporting the exact percentage of one-story buildings in northern Khyber Pakhtunkhwa; however, national and provincial housing structure data indicate that multi-story residential buildings constitute a very small proportion of total housing in KP (less than 4% of multi-story residential struc-tures nationally occur in KP) and that rural housing in Pakistan is dominated by simple low-rise brick or traditional constructions. Based on these patterns, we infer that the overwhelming majority (>90%) of residential structures in rural northern KPK are likely single-story homes”. (Pakistan Bureau of Statistics, Economic Census Report 2023).
Efforts to estimate solar radiation using GIS began in the late 2000s. Tools like the Photovoltaic Geographical Information System (PVGIS) and Solar3D now make it possible to calculate solar radiation for any location globally. Although these tools exist to calculate solar radiation potential for specific points, performing this calculation over large areas requires handling extensive datasets and significant processing power. To address this challenge, we utilized Esri’s Area Solar Radiation tool, which efficiently processes and analyzes solar radiation data across wide spatial extents of our study area. The Area Solar Radiation tool calculates sun hours, representing the duration (in hours) of direct solar irradiation at each grid cell in the DEM on the summer and winter solstice. This approach ensures that PV systems installed in the study area can operate year-round based on clear-sky assumption and without adjusting shading effects, however, it provides power generation estimates as indicative of UC values, suitable for planning and prioritization, not engineering design. Areas meeting this requirement were classified as viable for rooftop PV installations on individual buildings. The installation of panels on horizontal or optimally tilted surfaces are not considered for individual buildings, however, constant 30° tilt angle was assumed and implemented for all PV panels. Solar radiation in watt-hours per square meter (Wh/m^2), converted to kilowatt-hours per square meter (kWh/m^2/year). To accurately assign solar radiation values to over 1.2 million building footprints, a fishnet grid was generated, breaking down the raster data into polygons matching pixel sizes. Since building footprints often extend over multiple pixels, precise distribution of solar radiation values based on the proportion of each building’s rooftop covering the fishnet polygons was needed. Solar radiation values for every 12 months were transferred to the respective fishnet grids using pixel centroids.
Next, we merged the fishnet layer with the building footprint layer to ensure that the polygons inherited solar radiation values correspond to the area of the building they covered. In other words, for buildings that span multiple fishnet polygons, we calculated solar radiation proportionally, ensuring that the values reflected the actual rooftop area. Finally, we aggregated these values across the entire building footprint to provide an accurate estimate of the total solar radiation for each building.
To make the results more relatable to the local context, the building sizes were converted into ‘marlas,’ a local unit of measurement (1 marla = 25.2929 sq. meters). We then translated the solar radiation values from “kWh/m^2” into electricity units, assuming a scenario where solar panels cover the entire building’s rooftop or footprint area. This step allowed us to estimate the potential electricity generation for each building. Buildings capable of generating more than 750units of electricity annually were classified as eligible for solar panel installation. This threshold was chosen to identify buildings with sufficient solar potential to make rooftop PV installations economically viable. In Pakistan, average household electricity consumption is relatively low compared to many developed countries. An annual generation of ~750 kWh can offset a noticeable portion of household electricity demand, particularly in small to medium-sized residences. Also, we categorized buildings based on their size/area (1-5 marlas, 6-10 marlas, 11-15 marlas, 16-20 marlas, and >21 marlas) to serve as proxies for low, middle, and upper-class households. These categories were chosen for analytical groupings based on the representation of building size distribution, interpretability and planning relevance and as proxy to structural capacity. Finally, each building was spatially joined with its corresponding administrative boundary, including union councils. This integration not only helped in pinpointing building locations but also facilitated community-level analysis, contributing to our assessment of solar photovoltaic potential at the local level.
To visualize and communicate the distribution of suitable buildings for solar panel installation within each union council, a key variable termed “total suitable building” was employed. To render the data on the maps in a comprehensible manner, standard deviation classification was applied. This classification scheme segregated the data into six distinct classes, each represented by a unique shade or color. This approach helped to effectively communicate the variations in the number of suitable buildings across different areas, enabling viewers to discern patterns and trends in the distribution of these buildings within the union councils. The maps in this study were prepared using ESRI’s GIS Program (ESRI, 2019).
3. Results
Table 1 summarizes the distribution of 1,290,654 building footprints in relation to the potential electric units generated by solar panels across various building area categories. The data is organized into five ranges of the electric units in kWh and five building area categories that are expressed in marlas. Each category of building area is reported by the number of footprints and their corresponding percentage of the row total, providing a view of how building size correlates with solar energy generation potential.
The data shows a significant concentration of smaller buildings (1-5 marlas), comprising 66.4% of the total, with mid-sized buildings (6-10 marlas) at 19.1% and larger buildings (11-15 marlas and above) contributing smaller fractions (6.9% for 11-15 marlas, 3.1% for 16-20 marlas, and 4.6% for >21 marlas).
In the case of potential electric units generated by solar panels, 38% of the total buildings have a potential of less than 500 units.
In the lowest per marla unit value category (<500), most of the buildings (99.9% out of category total: 490,744) are small, falling in the 1-5 marla range.
Table 1 provides an in-depth look at the potential electric output from solar panels across various building areas in Marlas, revealing key patterns in energy generation across size categories. Smaller buildings, particularly those within the 1-5 marla range, overwhelmingly produce less than 500 kWh/year, accounting for 99.9% of such units, while larger buildings (21 marlas or more) contribute more prominently to higher energy brackets. A significant number of buildings in the 6-10 marla range yield between 500 and 749 kWh/year, indicating a high energy potential among medium-sized structures. Notably, buildings larger than 15 marlas display the highest efficiency in energy production, with most generating over 1,250 kWh/year. This pattern underscores that larger building areas are crucial for maximizing solar potential and suggests they should be prioritized in solar energy strategies for optimal output. This table, therefore, not only quantifies energy distribution but also highlights the critical correlation between building size and energy potential, offering insights for targeted solar initiatives.
Table 2 presents the distribution of solar energy potential across districts by categorizing buildings based on their yearly electric unit generation. Districts like Swabi and Mansehra show the highest counts of buildings with the potential for solar power generation, particularly with a significant number in the <500 kWh category. Swabi leads with 121,722 buildings producing less than 500 units, which accounts for 45.8% of this energy bracket, indicating a high concentration of lower-output solar units. Conversely, districts like Torghar and Batagram have fewer buildings overall, with a marked proportion generating less than 500 units, suggesting a more limited solar power base.
Importantly, this table reveals that while certain districts like Swabi dominate in quantity for low-range units, larger solar capacity (over 1250 kWh) is spread more evenly, with districts such as Swat and Abbottabad showing strong potential for generating higher energy levels. These findings emphasize both the variation in solar power potential across regions and the opportunity to target specific districts for efficient solar scaling, especially in those with higher energy outputs. This information provides a foundation for making strategic decisions on solar panel deployment to maximize renewable energy yield across districts.
Figure 2 illustrates the distribution of suitable buildings for solar panel installation within various union councils in the study area. This map categorizes the union councils into six distinct shades, ranging from less than 10% to greater than 49%, based on the percentage of buildings conducive to solar panel installation. This visual representation offers a clear and concise overview of the spatial distribution of solar potential across the region.
The category with color Blackberry, indicated by a deep purple color on the map, the standard deviation value is greater than -2.5. Within these areas, the percentage of eligible buildings suitable for solar panel installation is notably low, falling at less than or equal to 10.98%. This indicates that solar panel suitability is quite limited in these regions. There are only 2 union councils in this category, emphasizing that a very small proportion of buildings within these areas are considered suitable for solar installation.
The Aster Purple color category, represented by a lighter shade of purple, encompasses union councils with standard deviation values ranging from -2.5 to -1.5. In these areas, the percentage of eligible buildings suitable for solar panels falls between 10.98% and 20.66%. This suggests that solar panel suitability is somewhat improved compared to the “Blackberry” category but still remains relatively low. There are 16 union councils in this category, indicating that a somewhat larger proportion of buildings in these areas are suitable for solar panel installation.
The Lilac Dust category, depicted by a pale lilac color, includes union councils with standard deviation values of -1.5 to -0.5. Within this category, the percentage of eligible buildings suitable for solar panels ranges from 20.66% to 30.33%. This signifies that these union councils have a more significant proportion of buildings suitable for solar panel installation. A total of 83 union councils fall into this category, highlighting that a substantial portion of buildings in these areas are suitable for solar panel installation.
“Yucca Yellow” category includes union councils with standard deviation values ranging from -0.5 to 0.5. In these regions, the percentage of eligible buildings suitable for solar panels ranges from 30.33% to 40.01%. This indicates a notable improvement in solar panel suitability compared to previous categories. There are 110 union councils in this category, signifying that a substantial portion of buildings in these areas are suitable for solar panel installation.
The “Fern Green” category, represented by a green shade, has standard deviation values of 0.5 to 1.5. Within this category, the percentage of eligible buildings suitable for solar panels ranges from 40.01% to 49.69%. This represents a considerably high level of solar panel suitability. There are 93 union councils in this category, indicating that a significant proportion of buildings in these areas are highly suitable for solar panel installation.
The “Lotus Pond Green” category, with a standard deviation of 1.5 or above, includes union councils where the percentage of eligible buildings suitable for solar panels is equal to or greater than 49.69%. This category signifies the highest level of solar panel suitability within the study area. There are 15 union councils in this category, highlighting that these areas offer optimal conditions for solar panel installation, with a vast majority of buildings considered highly suitable.
Table 3 summarizes the statistical analysis of solar potential, electricity consumption, per marla electricity units, and building area derived from the dataset. The dataset comprises 1,289,140 observations.
4. Discussion
Our primary objective was to estimate solar radiation potential within the study area, which we successfully achieved through the utilization of the Area Solar Radiation tool. This analysis provided a comprehensive understanding of solar energy availability across various regions, forming a crucial foundation for informed decision-making regarding renewable energy initiatives. Secondly, we aimed to identify priority areas, specifically union councils, where the deployment of solar PV systems could be most advantageous. Through the meticulous evaluation of standard deviation values and the percentage of suitable buildings for solar panel installation, we have not only identified these priority areas but have also categorized them based on their suitability, ensuring that our research objectives have been effectively met.
The key findings of this research show the significance of geospatial analysis in identifying the solar potential to identify the buildings suitable for solar panel installations. We discovered that approximately one-third (35%) of the total buildings within the study area are preferable and capable of generating suitable electricity through solar panels. This highlights the crucial importance of conducting thorough research to identify eligible buildings, as not all structures are suitable for solar panel installation. The potential benefits of solar energy might seem appealing to residents; our assessments revealed the need for comprehensive geospatial research to ensure the feasibility and success of solar panel deployments, especially in mountainous regions. Rushing into installation without proper analysis can result in substantial financial losses. These findings serve as a valuable reminder of the complexities involved in harnessing solar energy effectively and sustainably.
The size of buildings plays a pivotal role in the context of solar panel installations, underlining the importance of comprehensive research and assessment, especially when considering the different classes of society: lower class, middle class, and upper class. In the absence of specific socioeconomic data, our study categorizes buildings based on size, offering a practical approach. Buildings ranging from 1 to 5 marlas are categorized as lower class, those between 6 to 15 marlas as middle class, and structures exceeding 15 marlas as upper class. The different thresholds (marlas, or power generation (i.e., 750 kWh) could be adopted depending on policy goals, economic assumptions, or future integration of detailed PV system parameters.
Our findings reveal that out of a total of 857,432 lower-class buildings, 150,484 are suitable for solar panel installation. Similarly, within the middle-class category of 334,894 buildings, 220,354 are identified as suitable for panel installation, while among the upper-class buildings totaling 98,328, a significant 85,014 are found suitable for panel installation.
If we assess affordability based on building size, for lower-class individuals, approximately 17% of their buildings are suitable for solar panel installation, emphasizing the need for careful consideration and research to prevent financial losses in this segment. In contrast, around 65% of middle-class buildings are suitable, indicating a more favorable situation. Remarkably, the upper class stands out with approximately 86% of their buildings being suitable for solar panel installation, presenting an opportunity for them to harness solar energy effectively.
This disparity highlights a significant societal divide in terms of solar energy access based on building size and class. It is upon policymakers and government authorities to address these disparities. For the lower class, where suitable buildings are fewer, any initiatives to promote solar panel adoption should be accompanied by research to safeguard against financial setbacks. Meanwhile, the middle and upper classes, with a higher proportion of suitable buildings, present a substantial opportunity for promoting sustainable solar energy adoption.
This research aligns prominently with Sustainable Development Goal 7 (SDG 7), which is “Affordable and Clean Energy.” This goal urges the need to ensure access to affordable, reliable, sustainable, and modern energy for all. SDG 7 seeks to tackle energy-related challenges, including increasing the share of renewable energy in the global energy mix. This research addresses this challenge by assessing and prioritizing areas for the deployment of solar PV systems. By identifying buildings that are suitable for solar panel installation, it facilitates the transition towards cleaner and more sustainable energy sources.
Energy affordability is a key aspect of SDG 7. By categorizing buildings based on size and socioeconomic status, this study highlights the disparities in solar panel suitability and affordability across different segments of society. This information is crucial for policymakers and governments to formulate targeted strategies that ensure equitable access to clean energy benefits, aligning with SDG 7’s aim of providing universal access to affordable, reliable, and modern energy services.
The results obtained at the Union Council level through the research hold immense potential for targeted campaigns and initiatives. By identifying areas with a high percentage of suitable buildings for solar panel installation, the data can be used to launch awareness and adoption campaigns. These campaigns can specifically target regions where solar energy adoption is most viable, maximizing their impact and ensuring that communities in these areas are well-informed about the benefits of solar power. Moreover, such data-driven campaigns can also encourage local governments and organizations to allocate resources effectively, ultimately accelerating the transition towards clean and sustainable energy solutions.
Figure 2 and Figure 3, and Figure 4 identify the regions that can be targeted. Within Figure 2, the Standard Deviation (SD) ranges from -0.50 to greater than 1.50, signifying areas where 30% to over 50% of buildings are suitable for solar panel installation. These three SD classes have 218 Union Councils (UCs) out of a total of 319 UCs, making them prime candidates for targeted campaigns. Notably, 15 UCs boast over 50% suitability, while 93 UCs fall within the 40% to 49% suitability range, all of which present promising opportunities for solar adoption initiatives. This information should encourage the government and policymakers to take proactive steps.
Figure 3.
Scenario 1: Suitable and Non-Suitable Buildings Overlaid on Hill Shade and the Percentage of Suitable Buildings (≥750 Units) by Union Council.
Figure 3.
Scenario 1: Suitable and Non-Suitable Buildings Overlaid on Hill Shade and the Percentage of Suitable Buildings (≥750 Units) by Union Council.
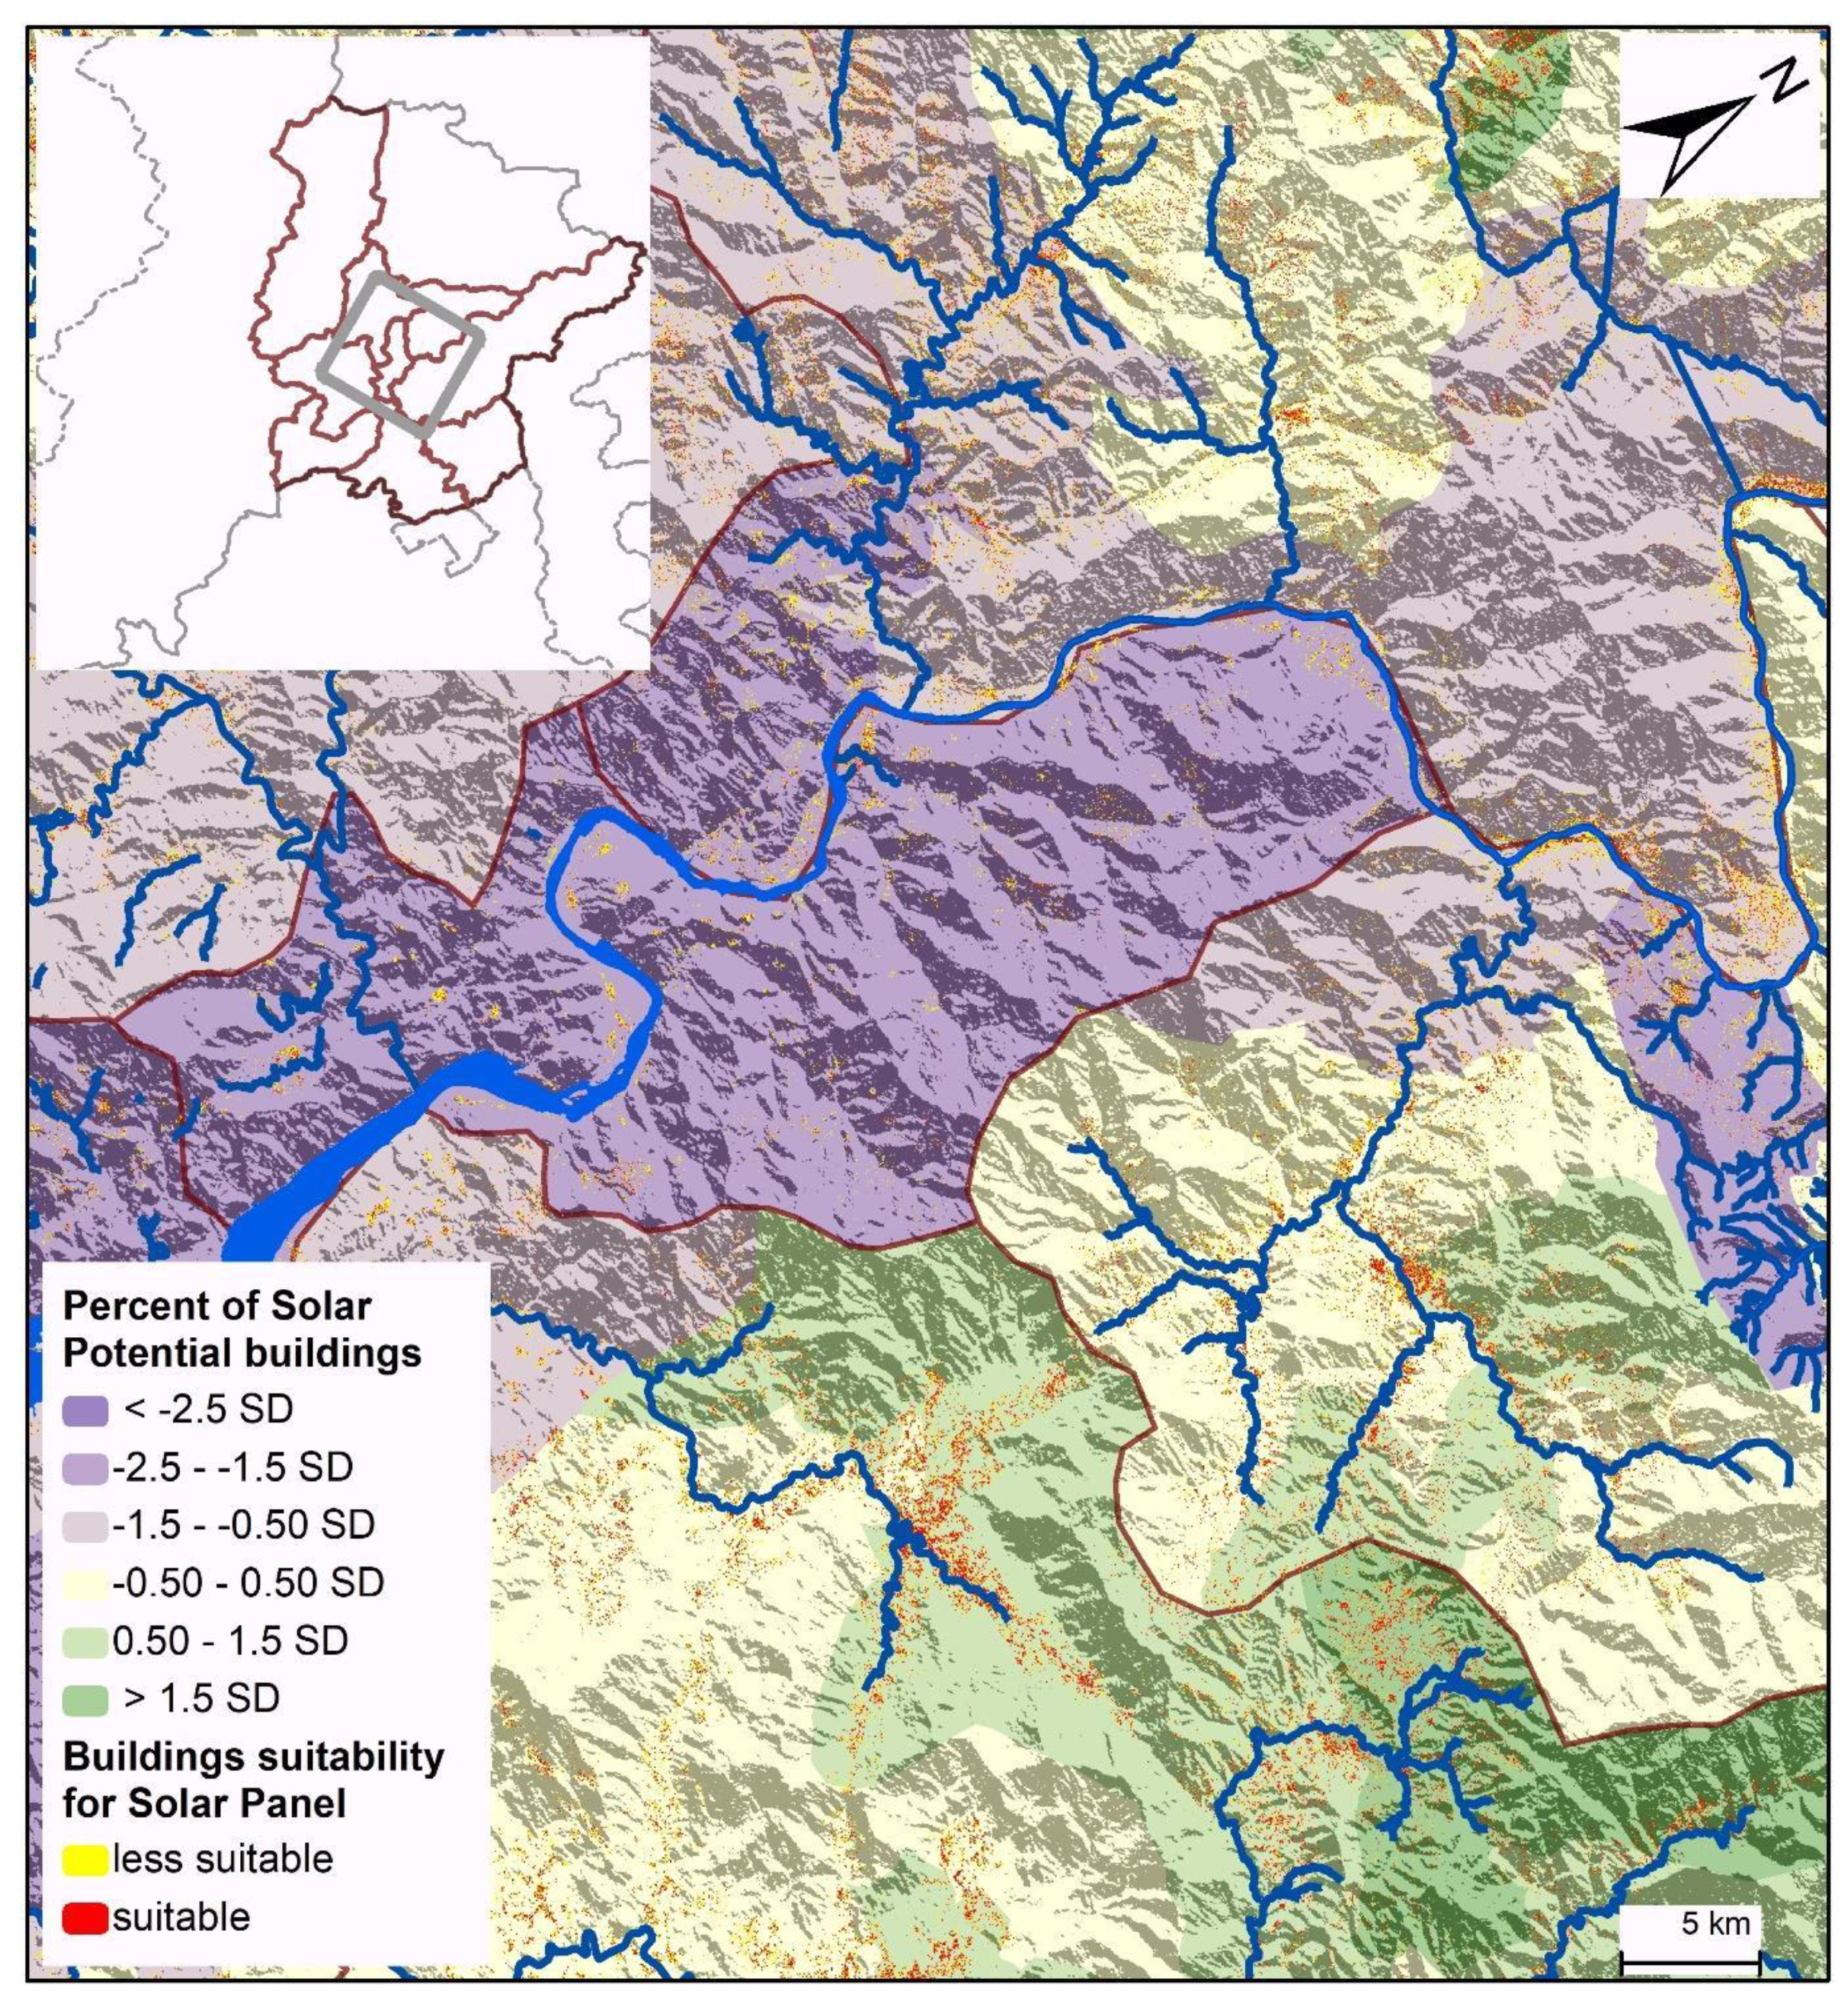
Figure 4.
Scenario 2: Suitable and Non-Suitable Buildings Overlaid on Hill Shade and the Percentage of Suitable Buildings (≥750 Units) by Union Council.
Figure 4.
Scenario 2: Suitable and Non-Suitable Buildings Overlaid on Hill Shade and the Percentage of Suitable Buildings (≥750 Units) by Union Council.
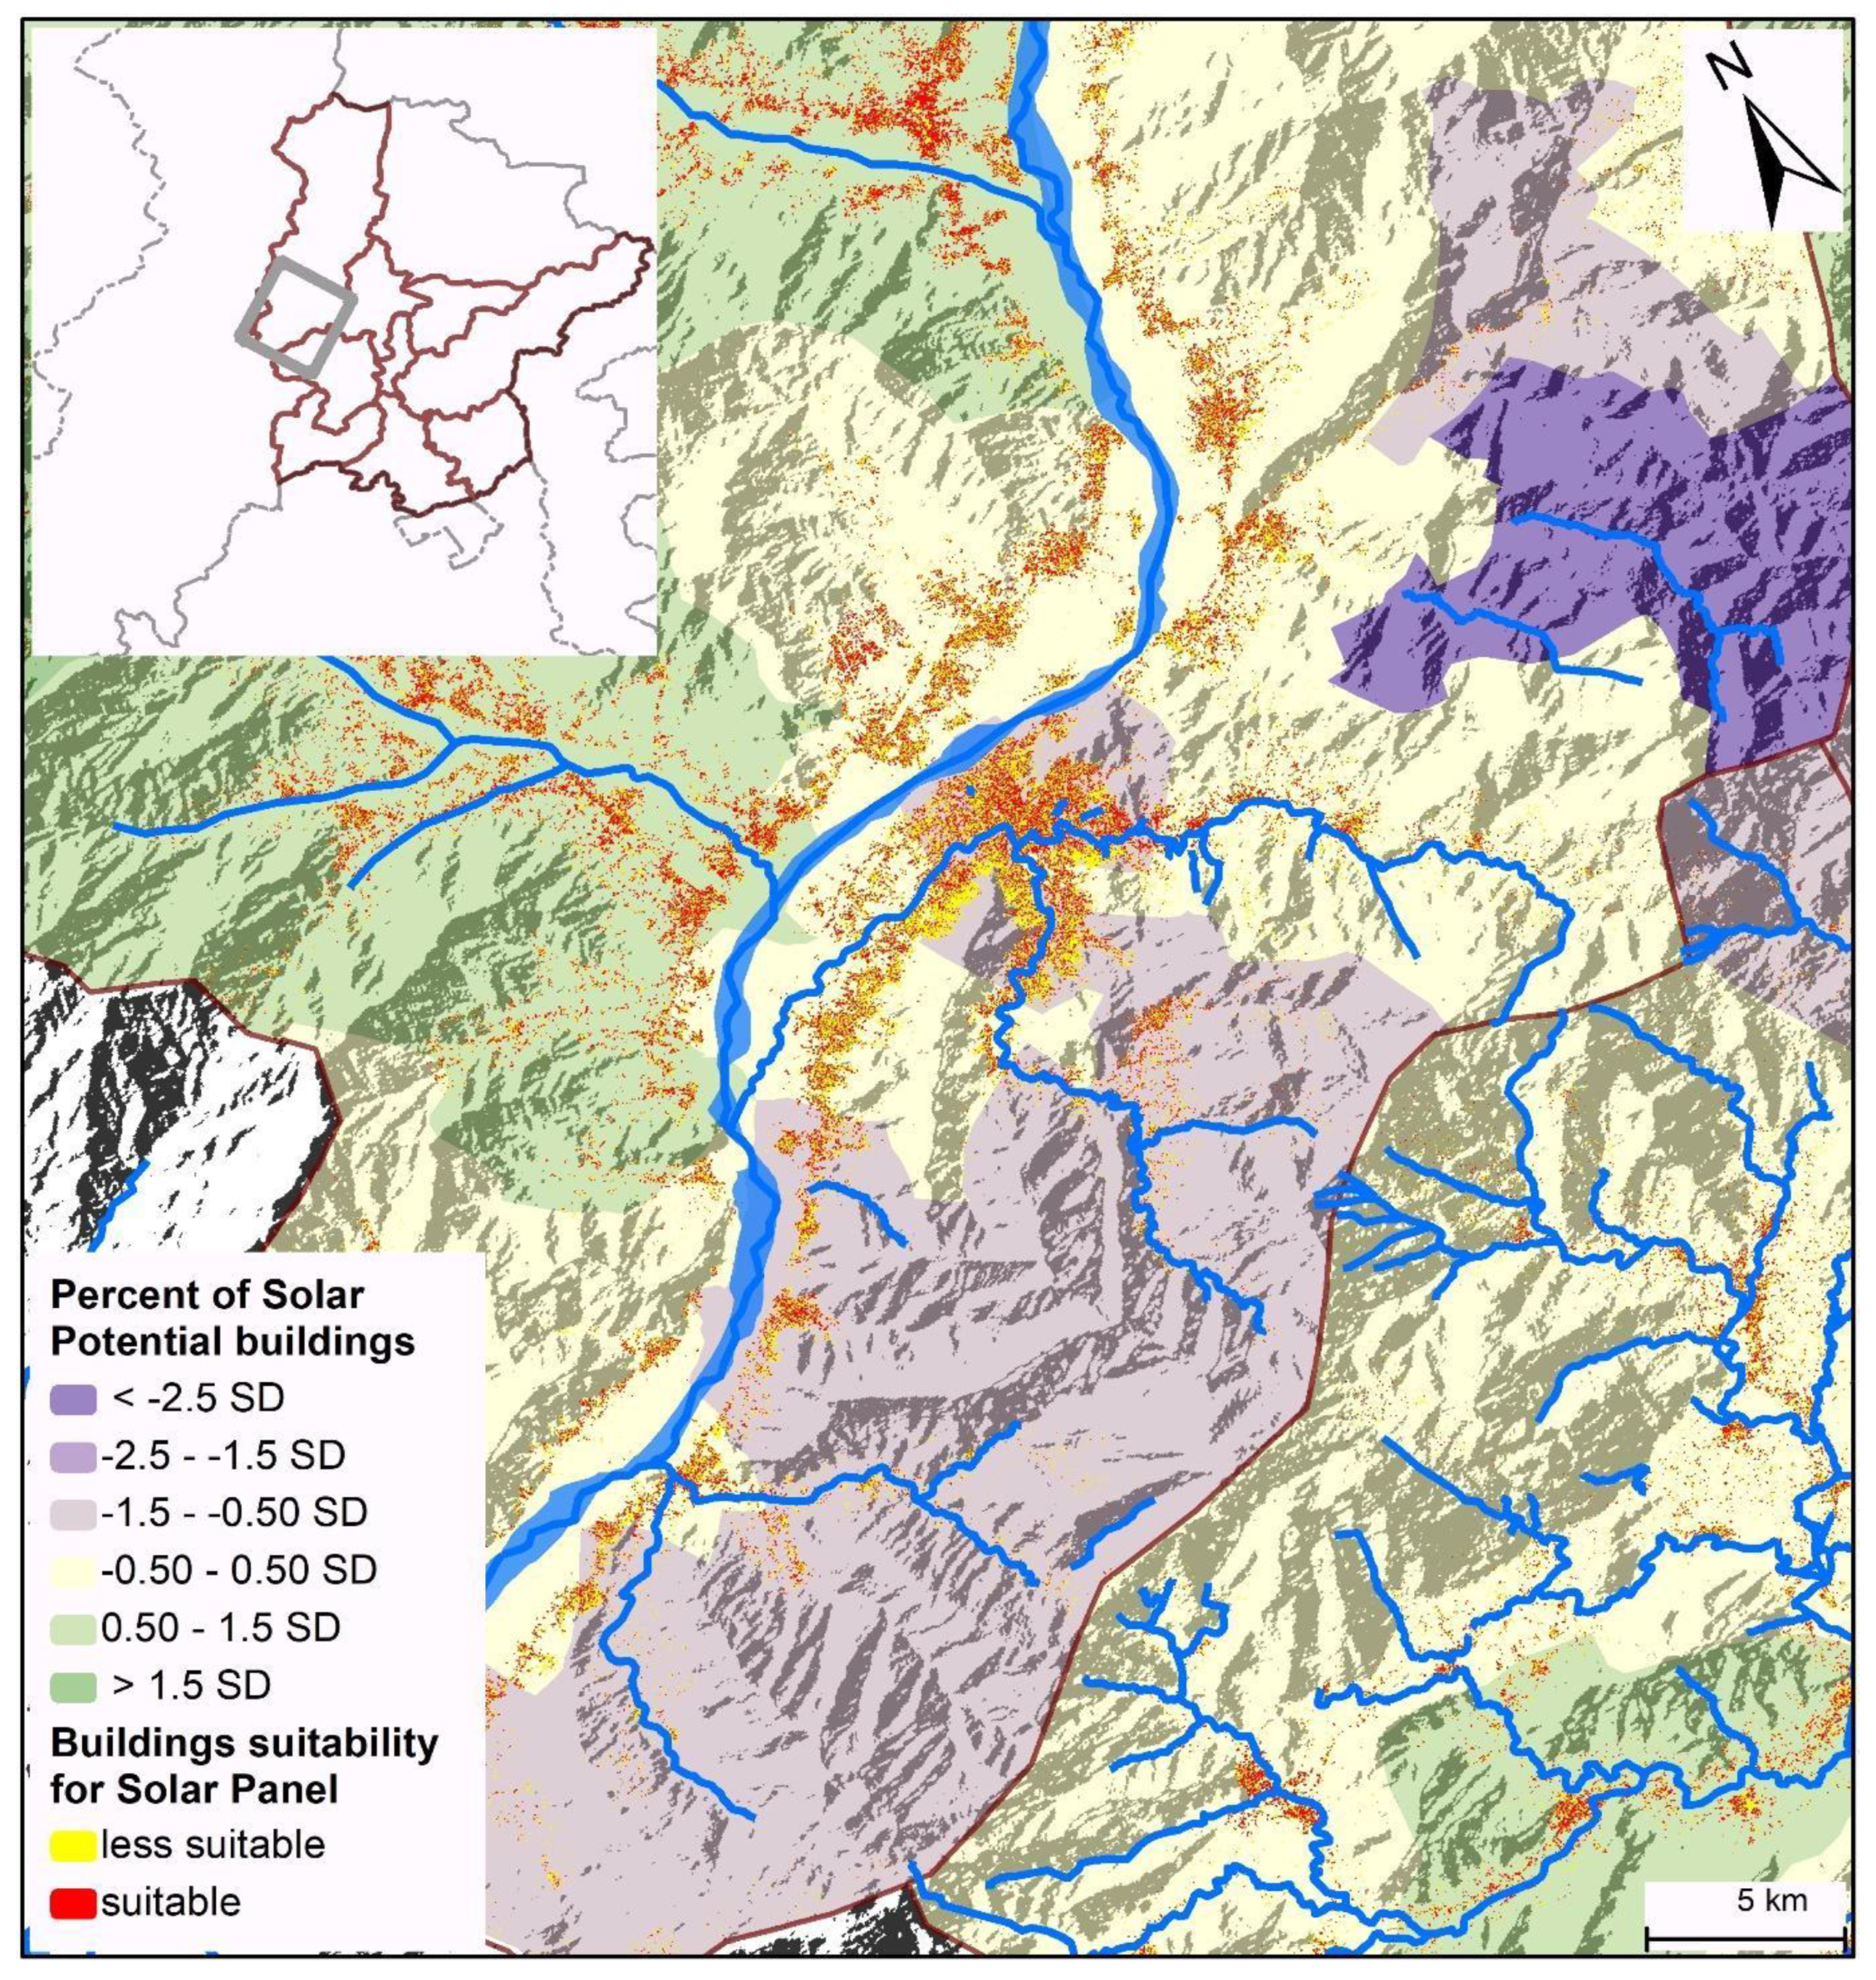
Abbottabad district, located in the southeast corner of the study area, emerges as a standout with nearly all its UCs exhibiting over 30% building suitability. The southwest regions of Swat and Mansehra district also offer potential targets, along with the southeast of Haripur district, and the northwest of Shangla district. In the Battagram district, there are UCs with suitable buildings for solar panel installation. However, it’s worth noting that districts near the Tarbela Dam, likely due to their valley-like terrain surrounded by mountains, have fewer suitable buildings. Regions like the Swabi district, Tordher district, and the northern part of the Haripur district are affected. These findings underscore the importance of location-specific strategies for promoting solar energy adoption, ensuring that regions with higher suitability are prioritized while addressing challenges in less suitable areas.
For buildings that might not have enough sunlight for solar panels on their own, it may still be possible to benefit from solar power. If the neighboring building has more potential for solar panels, they can work together. That building can put up solar panels and then share the extra electricity with other buildings nearby. This way, even houses that can’t have their own panels can still use clean and green solar energy. It’s a way for more houses to harness solar power, even if they can’t do it alone.
Unlike many rooftop solar studies that focus on small urban areas using high-resolution LiDAR or DSM data, both in Pakistan (e.g., Islamabad case study using Open Buildings/GIS (Muhammad Muzmmil, Hussain, & Hanif, 2024), and deep learning rooftop PV potential in Islamabad (Lodhi et al., 2024) and internationally (Cenky, Bendik, Janiga, & Lazarenko, 2024; Lodhi, Tan, Li, Khan, & Naeem, 2025), this research develops and demonstrates a scalable, open-data-driven geospatial workflow capable of evaluating over 1.29 million buildings across a large, topographically complex region. The study integrates DEM-based solar radiation modeling, building footprint overlays, fishnet-based area weighting, and administrative aggregation to enable solar potential assessment in data-constrained environments, an approach rarely implemented at this spatial and computational scale in existing literature. Additionally, rather than producing only building-level outputs, this study introduces a UC-level prioritization framework, translating technical solar potential estimates into actionable planning units aligned with Pakistan’s administrative and governance structure. This multi-scale linkage between rooftop analysis and local decision-making distinguishes the study from prior work that remains largely technical or site-specific.
Limitations
In the context of this study, a comparison between LiDAR and DEM data was conducted to evaluate their effectiveness for shadow analysis. The results highlighted the superior accuracy of LiDAR data in providing detailed information about terrain and elevation, which is crucial for assessing solar potential. However, one challenge encountered was that the DEM data lacked detailed information on certain buildings or structures. To address this, a workaround was implemented by adding a 5m value to the pixels under buildings in the DEM data, artificially increasing their height to compensate for the missing elevation details. This adjustment allowed for more accurate subsequent analysis. During the calculation of solar radiation values, the consideration of rainy and cloudy days was not explicitly included. On average, there are 250-300 sunny days per year based on the geographic regions from low altitudes to mountainous areas. This omission may lead to slight discrepancies in the estimated solar radiation values, as these weather conditions can affect the amount of sunlight received. To mitigate this limitation, it is suggested to incorporate the average number of rainy and cloudy days in the calculation process. By determining the ratio of rainy or cloudy days to the total number of days, the average yearly values can be adjusted accordingly. This adjustment will account for the variations in solar radiation due to different weather patterns, resulting in more precise estimates.
One potential limitation arises from the building footprint data obtained from Microsoft Bing, specifically regarding the accuracy of building classifications. It was observed that in some cases, multiple buildings with connecting blocks were classified as single separate buildings. This classification error could lead to inaccuracies in the analysis, particularly when assessing the eligibility and potential of individual buildings. The use of 30 m resolution of DEM also introduces spatial generalization, especially for small rooftops; however, the analysis is intended to guide policy prioritization and funding decisions, rather than final system sizing. Further validation and cross-referencing of the building data, including the number of floors for multi-story buildings, residential and commercial categories from alternative sources, could help mitigate this limitation and enhance the overall accuracy of the analysis.
Other limitations in the analysis include the potential impact of tree shade and snow cover on solar radiation estimates. Tree canopies can block sunlight, reducing the available solar radiation on rooftops, especially during specific times of the year when trees are fully leafed. Similarly, snow covers on rooftops or the surrounding terrain can reflect sunlight, potentially altering the total amount of solar radiation received. The panel counts, horizontal or optimally titled surface modeling, system efficiency, and detailed rooftop geometry are also excluded in this study. These factors were not explicitly accounted for in the analysis, and their inclusion in future studies could further refine solar potential estimates.
5. Conclusion
This study highlights the critical role of geospatial analysis in evaluating the potential of rooftop solar photovoltaic systems across Northern Khyber Pakhtunkhwa’s tourism districts. Approximately one-third of the buildings in the study area are suitable for solar panel installations, with significant spatial and socioeconomic disparities influencing solar potential. Larger and upper-class buildings showed higher suitability, while small and lower-class buildings require targeted support to ensure equitable access. The findings emphasize the importance of prioritizing solar installations in regions with higher potential, such as the Union Councils (UC) with over 50% suitability. Policymakers are encouraged to develop data-driven strategies, including community-level awareness campaigns and financial support for underserved populations, to foster widespread adoption of solar energy. Future work should incorporate advanced datasets, such as LiDAR or DSM, and account for weather variability to enhance solar potential assessments. These efforts will further align with global sustainability goals, addressing energy equity and environmental stewardship.
Author Contributions
Conceptualization, Abdul Sattar Sheikh, Rizwan Shahid, Abdullah Shah, Aseer Ul Haq, and Tayyab Shah; methodology, Abdul Sattar Sheikh, Tayyab Shah, Aseer Ul Haq, and Abdullah Shah; discussion and brainstorming, Abdul Sattar Sheikh, Tayyab Shah, Aseer Ul Haq, and Abdullah Shah; software, Abdul Sattar Sheikh; validation, Rizwan Shahid, Abdullah Shah, Aseer Ul Haq, and Tayyab Shah; formal analysis, Abdul Sattar Sheikh and Tayyab Shah; investigation, Abdul Sattar Sheikh, Rizwan Shahid, Abdullah Shah, Aseer Ul Haq, and Tayyab Shah; resources, Abdul Sattar Sheikh and Tayyab Shah; data curation, Abdul Sattar Sheikh, Abdullah Shah, and Aseer Ul Haq; writing—original draft preparation, Abdul Sattar Sheikh; writing—review & editing, Abdul Sattar Sheikh, Rizwan Shahid, Abdullah Shah, Aseer Ul Haq, and Tayyab Shah; visualization, Abdul Sattar Sheikh, Tayyab Shah, and Rizwan Shahid; supervision, Tayyab Shah; project administration, Tayyab Shah; funding acquisition, not applicable. All authors have read and agreed to the published version of the manuscript.
Funding
This research received no external funding.
Acknowledgments
The authors would like to acknowledge the valuable discussions and administrative support received during this research.
Conflicts of Interest
The authors declare no conflicts of interest.
References
- Addo, E.K.; Kabo-bah, A.T.; Diawuo, F.A.; Debrah, S.K.; Kulriya, P.K. The Role of Nuclear Energy in Reducing Greenhouse Gas (GHG) Emissions and Energy Security: A Systematic Review. International Journal of Energy Research 2023 2023, 1–31. [Google Scholar] [CrossRef]
- Armaroli, N.; Balzani, V. Towards an electricity-powered world. Energy & Environmental Science 2011, 4(9), 3193. [Google Scholar] [CrossRef]
- Bach, W. Fossil fuel resources and their impacts on environment and climate. International Journal of Hydrogen Energy 1981, 6(2), 185–201. [Google Scholar] [CrossRef]
- Bhutto, A.W.; Bazmi, A.A.; Zahedi, G. Greener energy: issues and challenges for Pakistan-hydel power prospective. Renewable and sustainable energy reviews 2012, 16(5), 2732–2746. [Google Scholar] [CrossRef]
- Cenky, M.; Bendik, J.; Janiga, P.; Lazarenko, I. Urban-Scale Rooftop Photovoltaic Potential Estimation Using Open-Source Software and Public GIS Datasets. Smart Cities Retrieved from. 2024, 7(6), 3962–3982. [Google Scholar] [CrossRef]
- ENVERUS. 2025 Trends: Renewable energy and solar research report . MADRID, Spain, 2025. Available online: https://to.ratedpower.com/trends-report-25.
- ESRI. ArcGIS desktop: release 10.7.1; Environmental Systems Research Institute: Redlands, CA, 2019. [Google Scholar]
- Gharakhani Siraki, A.; Pillay, P. Study of optimum tilt angles for solar panels in different latitudes for urban applications. Solar Energy 2012, 86(6), 1920–1928. [Google Scholar] [CrossRef]
- Gonzales, J.J. Building-Level Comparison of Microsoft and Google Open Building Footprints Datasets (Short Paper) . Paper presented at the 12th International Conference on Geographic Information Science (GIScience 2023), Leeds, UK; 2023. [Google Scholar]
- Government of Pakistan. Highlights: Pakistan Economic Survey 2024-25 . Retrieved from Islamabad, Pakistan, 2025. Available online: https://www.finance.gov.pk/survey_2025.html?utm_source=chatgpt.com.
- IEA. Renewables 2024: Analysis and Forecast to 2030; Retrieved from Paris, France, 2024; Available online: https://iea.blob.core.windows.net/assets/17033b62-07a5-4144-8dd0-651cdb6caa24/Renewables2024.pdf.
- Khaleel, M.; Yusupov, Z.; Rekik, S.; Kılıç, H.; Nassar, Y.F.; El-Khozondar, H.J.; Ahmed, A.A. Harnessing nuclear power for sustainable electricity generation and achieving zero emissions. Energy Exploration & Exploitation 2025, 43(3), 1126–1148. [Google Scholar] [CrossRef]
- Kumar Sahu, B. A study on global solar PV energy developments and policies with special focus on the top ten solar PV power producing countries. Renewable and sustainable energy reviews 43 2015, 621–634. [Google Scholar] [CrossRef]
- Lewis, N.S. Research opportunities to advance solar energy utilization. Science 2016, 351(6271), aad1920. [Google Scholar] [CrossRef]
- Lodhi, M.K.; Tan, Y.; Li, Y.; Khan, M.N.; Naeem, S. Deep Learning Ensemble and Multi-Criteria GIS for High-Fidelity Rooftop Solar Potential Mapping. Journal of Geovisualization and Spatial Analysis 2025, 9(2), 38. [Google Scholar] [CrossRef]
- Lodhi, M.K.; Tan, Y.; Wang, X.; Masum, S.M.; Nouman, K.M.; Ullah, N. Harnessing rooftop solar photovoltaic potential in Islamabad, Pakistan: A remote sensing and deep learning approach. Energy 304 2024, 132256. [Google Scholar] [CrossRef]
- Mercuri, P.A. Shuttle Radar Topography mission accuracy assessment and evaluation for hydrologic modeling . Purdue University, West Lafayette, IN. 2005. Available online: https://www.proquest.com/openview/b2b2c4f4885883464411128c11492129/1?pq-origsite=gscholar&cbl=18750&diss=y.
- Mohsin, M.; Abbas, Q.; Zhang, J.; Ikram, M.; Iqbal, N. Integrated effect of energy consumption, economic development, and population growth on CO 2 based environmental degradation: a case of transport sector. Environmental Science and Pollution Research 26 2019, 32824–32835. [Google Scholar] [CrossRef] [PubMed]
- Muhammad Muzmmil, S.; Hussain, A.; Hanif, H. Assessment of Rooftop Potential for Solar Energy and Rainwater Harvesting in Islamabad: A Geospatial Approach towards Sustainable Urban Development. International Journal of Innovations in Science & Technology 2024, 6(6), 97–112. [Google Scholar]
- Oschman, J.L. Energy medicine: The scientific basis; Elsevier Health Sciences, 2015. [Google Scholar]
- Oshilalu, A.Z.; Kolawole, M.I.; Taiwo, O. Innovative solar energy integration for efficient grid electricity management and advanced electronics applications. International Journal of Science and Research Archive 2024, 13(02), 2931–2950. [Google Scholar] [CrossRef]
- Sampaio, P.G.V.; González, M.O.A. Photovoltaic solar energy: Conceptual framework. Renewable and sustainable energy reviews 74 2017, 590–601. [Google Scholar] [CrossRef]
- Sayed, E.T.; Wilberforce, T.; Elsaid, K.; Rabaia, M.K.H.; Abdelkareem, M.A.; Chae, K.-J.; Olabi, A.G. A critical review on environmental impacts of renewable energy systems and mitigation strategies: Wind, hydro, biomass and geothermal. Science of The Total Environment 766 2021, 144505. [Google Scholar] [CrossRef]
- Scott, C.A.; Khaling, S.; Shrestha, P.P.; Riera, F.S.; Choden, K.; Singh, K. Renewable electricity production in mountain regions: toward a people-centered energy transition agenda. Mountain Research and Development 2023, 43(1), A1–A8. [Google Scholar] [CrossRef]
- Shah, S.A.A.; Solangi, Y.A. A sustainable solution for electricity crisis in Pakistan: opportunities, barriers, and policy implications for 100% renewable energy. Environ Sci Pollut Res Int 2019, 26(29), 29687–29703. [Google Scholar] [CrossRef]
- Stephens, J.C. Energy Democracy: Redistributing Power to the People Through Renewable Transformation. Environment: Science and Policy for Sustainable Development 2019, 61(2), 4–13. [Google Scholar] [CrossRef]
- Turney, D.; Fthenakis, V. Environmental impacts from the installation and operation of large-scale solar power plants. Renewable and sustainable energy reviews 2011, 15(6), 3261–3270. [Google Scholar] [CrossRef]
- Vijayan, D.S.; Koda, E.; Sivasuriyan, A.; Winkler, J.; Devarajan, P.; Kumar, R.S.; Vaverková, M.D. Advancements in solar panel technology in civil engineering for revolutionizing renewable energy solutions—a review. Energies 2023, 16(18), 6579. [Google Scholar] [CrossRef]
- Watson, S.; Bian, D.; Sahraei, N.; Winter, A.G.; Buonassisi, T.; Peters, I.M. Advantages of operation flexibility and load sizing for PV-powered system design. Solar Energy 162 2018, 132–139. [Google Scholar] [CrossRef]
- Yadav, P.; Davies, P.J.; Sarkodie, S.A. The prospects of decentralised solar energy home systems in rural communities: User experience, determinants, and impact of free solar power on the energy poverty cycle. Energy Strategy Reviews 26 2019, 100424. [Google Scholar] [CrossRef]
- Yousuf, I.; Ghumman, A.R.; Hashmi, H.N.; Kamal, M.A. Carbon emissions from power sector in Pakistan and opportunities to mitigate those. Renewable and sustainable energy reviews 34 2014, 71–77. [Google Scholar] [CrossRef]
- Yunus Khan, T.M.; Soudagar, M.E.M.; Kanchan, M.; Afzal, A.; Banapurmath, N.R.; Akram, N.; Shahapurkar, K. Optimum location and influence of tilt angle on performance of solar PV panels. Journal of Thermal Analysis and Calorimetry 2019, 141(1), 511–532. [Google Scholar] [CrossRef]
Figure 1.
Workflow diagram.
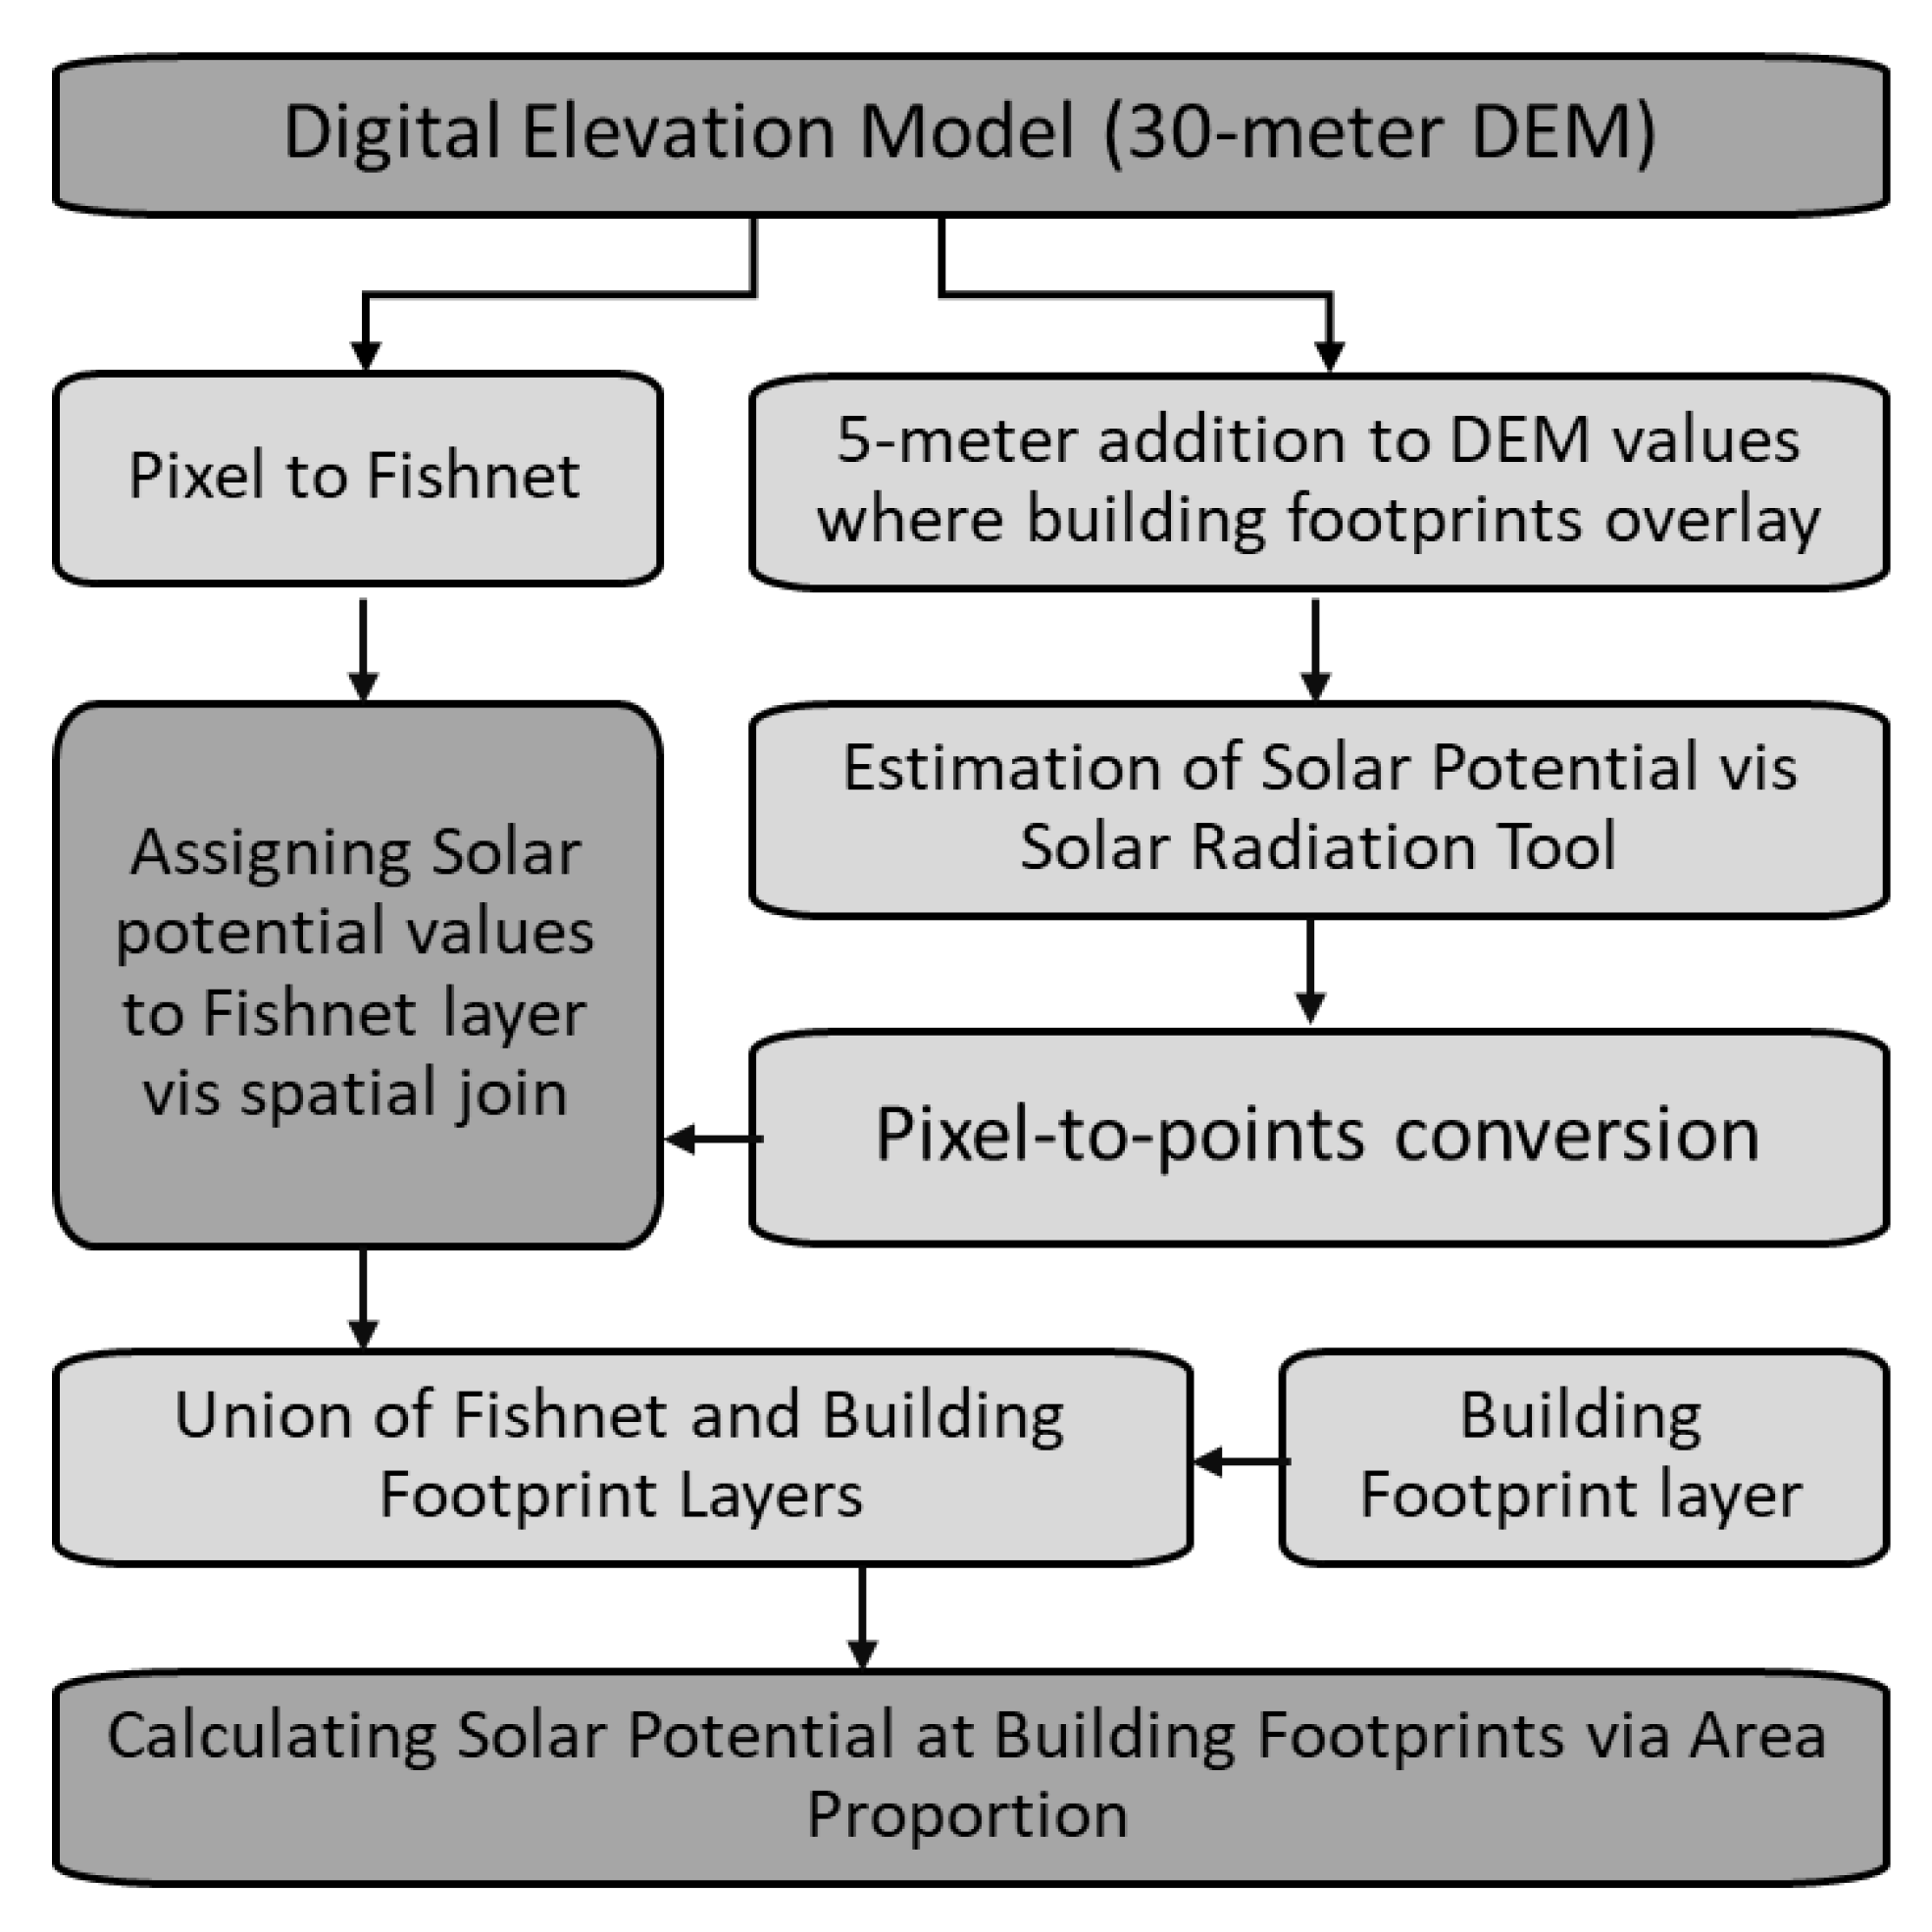
Figure 2.
Mapping the Percentage of Suitable Buildings (≥750 Units) by Union Council.
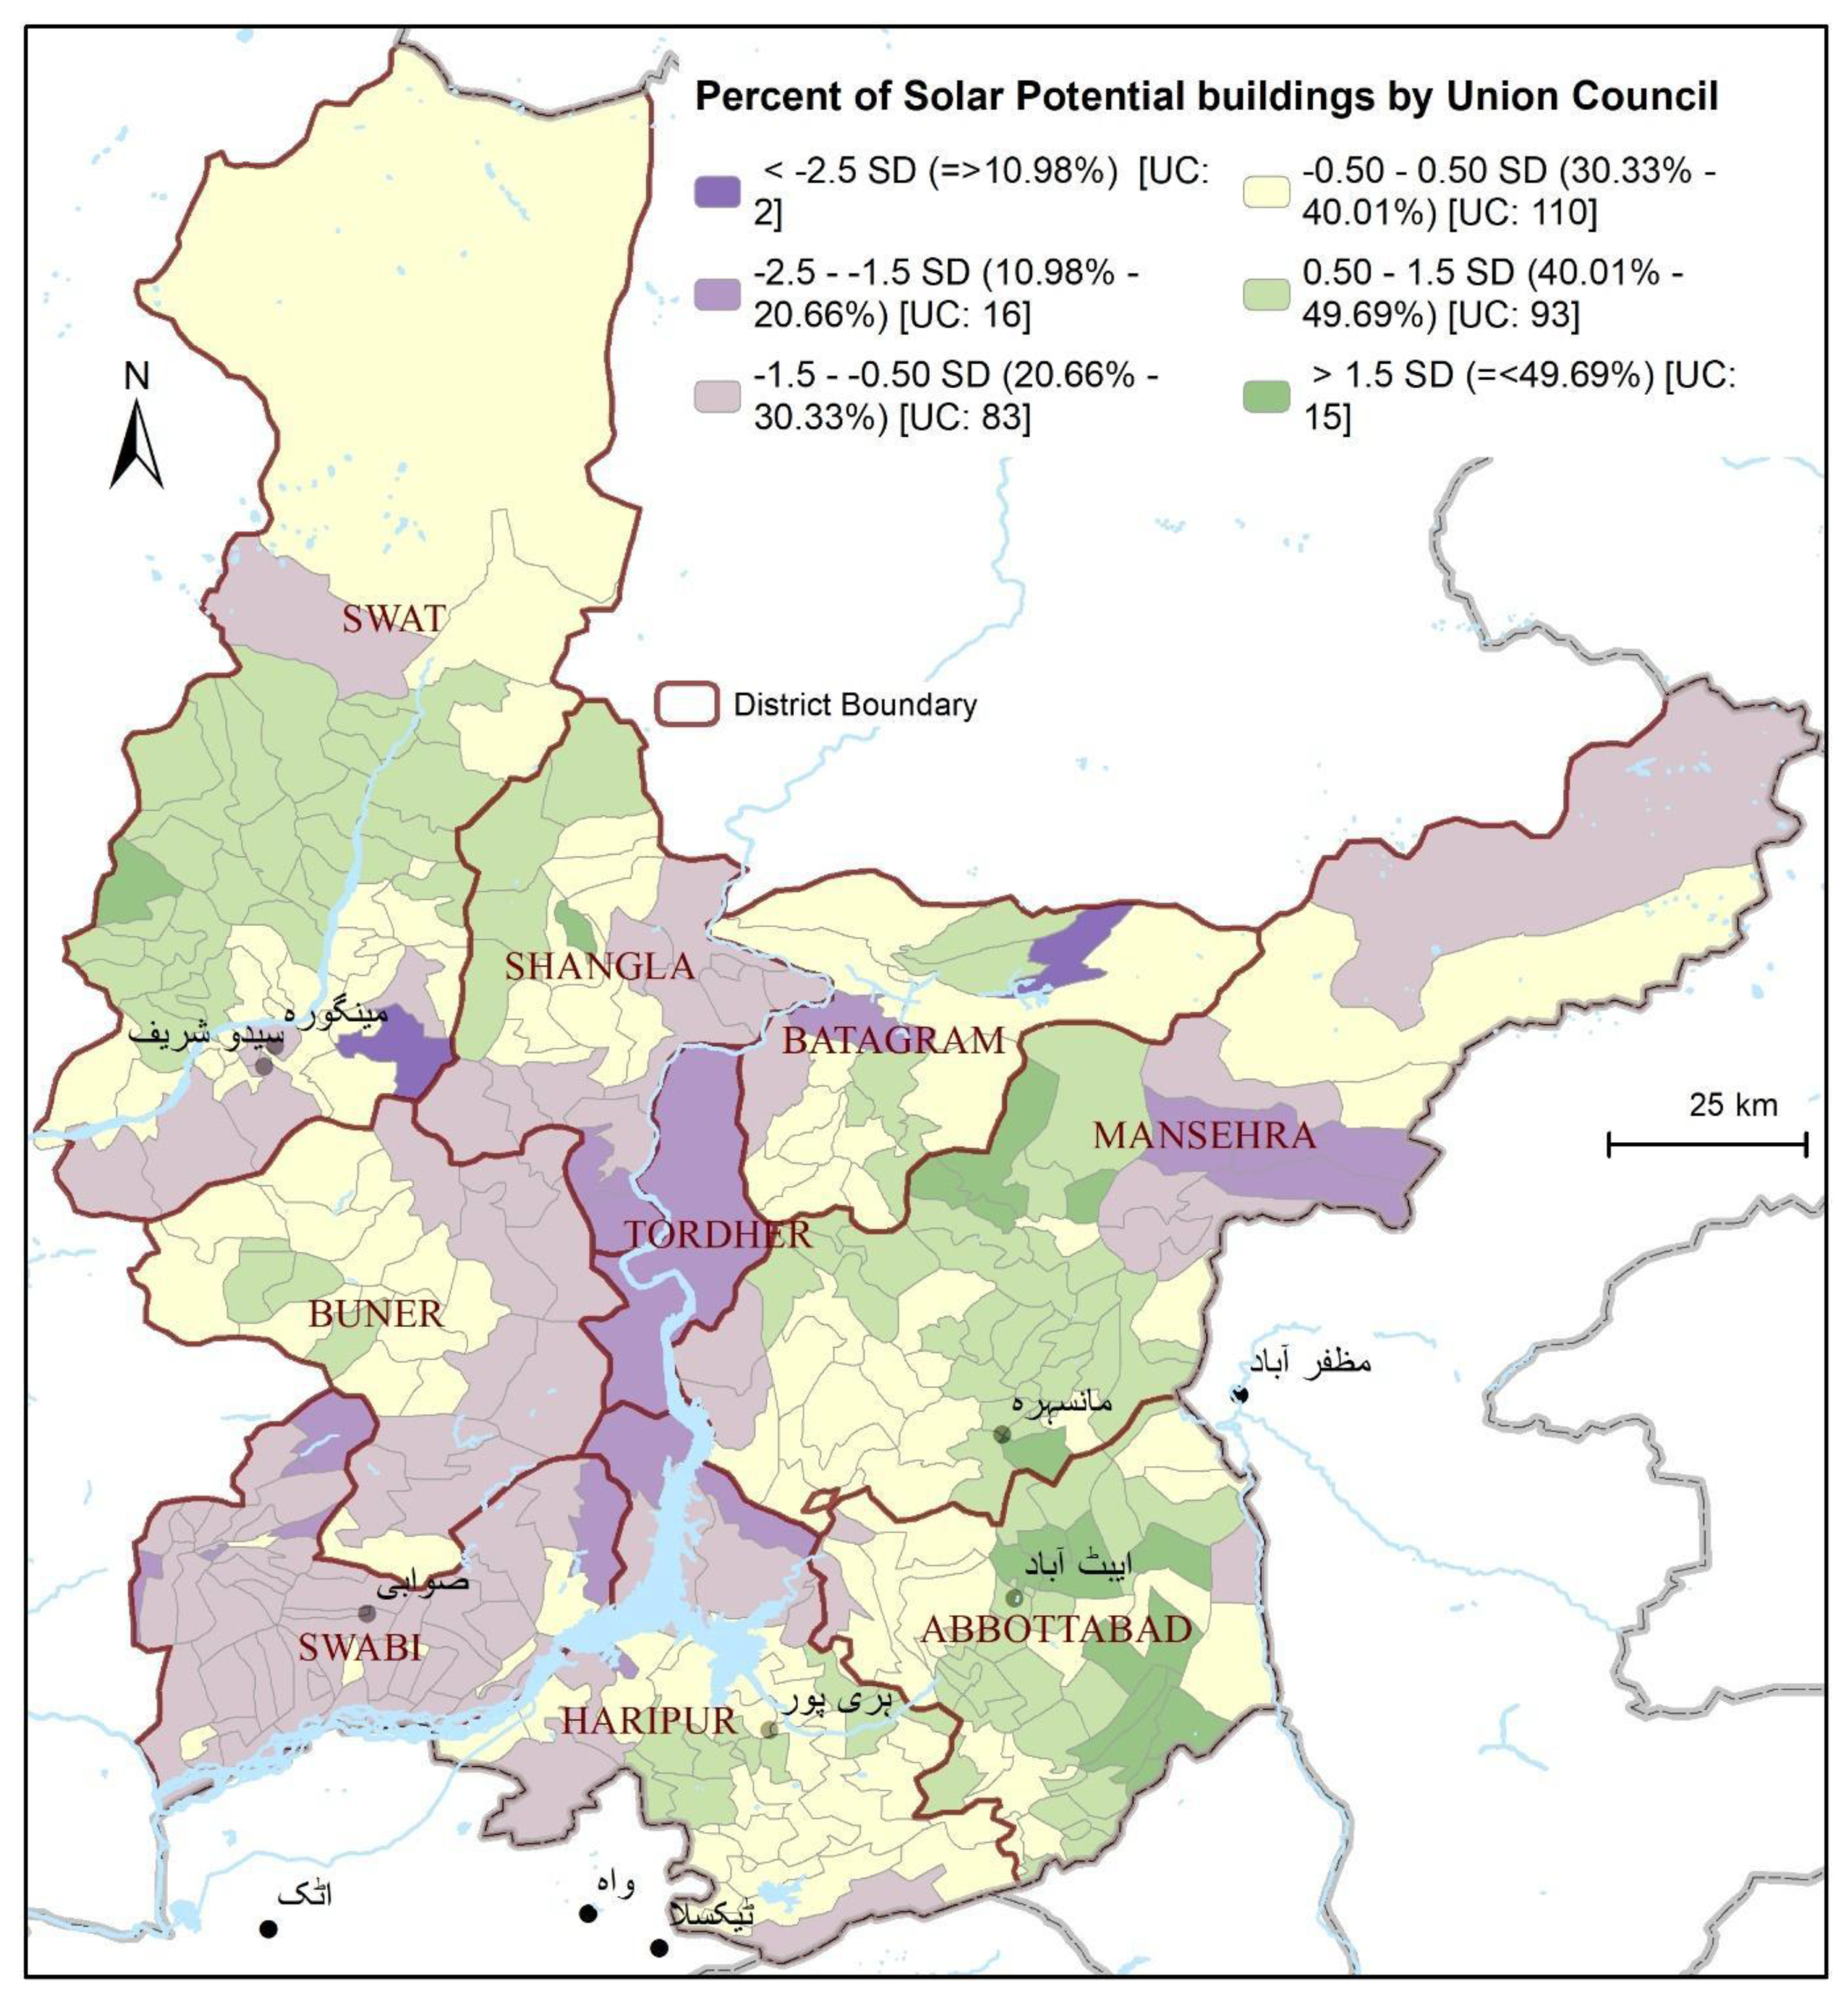

Table 1.
Distribution of potential electric units generated by solar panels across building areas in Marlas.
Table 1.
Distribution of potential electric units generated by solar panels across building areas in Marlas.
| Range of Electric Units (in kWh) | Building Area Categories (in Marla) with Number of BFPs (% of Row Total) | Total BFPs (% of Column Total) |
||||
|---|---|---|---|---|---|---|
| 1-5 Marlas | 6-10 Marlas | 11-15 Marlas | 16-20 Marlas | >21 Marlas | ||
| <500 units | 490,160 (99.9) | 249 (0.1) | 1 (0.0) | 0 | 334 (0.1) | 490,744 (38.0) |
| 500-749 units | 216,788 (63.0) | 111,583 (32.4) | 2,707 (0.8) | 68 (0.1) | 12,912 (3.8) | 344,058 (26.7) |
| 750-999 units | 121,507 (63.6) | 45,531 (23.8) | 20,048 (10.5) | 346 (0.2) | 3,540 (1.9) | 190,972 (14.8) |
| 1000-1250 units | 28,854 (13.7) | 79,787 (38.0) | 50,634 (24.1) | 20,880 (9.9) | 29,713 (14.2) | 209,868 (16.3) |
| >1250 units | 123 (0.2) | 9,283 (16.9) | 15,071 (27.4) | 18,210 (33.1) | 12,325 (22.4) | 55,012 (4.3) |
| Total | 857,432 (66.4) | 246,433 (19.1) | 88,461 (6.9) | 39,504 (3.1) | 58,824 (4.6) | 1,290,654 |
Table 2.
Distribution of buildings (number and percent of district total) by yearly electric unit ranges (in kWh) by Districts.
Table 2.
Distribution of buildings (number and percent of district total) by yearly electric unit ranges (in kWh) by Districts.
| District | Yealy Electric Units Range (in kWh) and Number of BFPs (% of Row Total) | ||||||
|---|---|---|---|---|---|---|---|
| <500 Units | 500-749 Units | 750-999 Units | 1000-1250 Units | >1250 Units | BFPs (Count) | BFPs (% of Column) |
|
| Abbottabad | 48,326 (28.6) | 44,241 (26.2) | 29,218 (17.3) | 35,079 (20.8) | 12,092 (7.2) | 168,956 | 13.1% |
| Batagram | 20,270 (37.6) | 14,693 (27.3) | 8,592 (15.9) | 8,108 (15) | 2,252 (4.2) | 53,915 | 4.2% |
| Buner | 42,197 (40.9) | 26,424 (25.6) | 14,420 (14) | 16,286 (15.8) | 3,829 (3.7) | 103,156 | 8.0% |
| Haripur | 58,947 (36.8) | 44,840 (28) | 24,377 (15.2) | 26,967 (16.8) | 5,258 (3.3) | 160,389 | 12.4% |
| Mansehra | 72,845 (32.9) | 57,376 (25.9) | 37,285 (16.8) | 41,837 (18.9) | 12,143 (5.5) | 221,486 | 17.2% |
| Shangla | 31,240 (41.1) | 21,538 (28.3) | 10,511 (13.8) | 10,200 (13.4) | 2,492 (3.3) | 75,981 | 5.9% |
| Swabi | 121,722 (45.8) | 75,975 (28.6) | 33,241 (12.5) | 31,318 (11.8) | 3,568 (1.3) | 265,824 | 20.6% |
| Swat | 87,890 (38.5) | 55,799 (24.5) | 32,021 (14.0) | 39,266 (17.2) | 13,221 (5.8) | 228,197 | 17.7% |
| Torghar | 7,307 (57.3) | 3,172 (24.9) | 1,307 (10.3) | 807 (6.3) | 157 (1.2) | 12,750 | 1.0% |
| Total | 490,744 (38.0) | 344,058 (26.7) | 190,972 (14.8) | 209,868 (16.3) | 55,012 (4.3) | 1,290,654 | |
Table 3.
Statistical Summary of Solar Potential, Yearly Electricity Units, and Building Area for 1,289,140 Buildings.
Table 3.
Statistical Summary of Solar Potential, Yearly Electricity Units, and Building Area for 1,289,140 Buildings.
| Statistic | Solar Potential (Yearly Sum in KWh/m^2) | Electricity Units (Yearly Sum) | Per Marla Electricity Units | Building Area (in Meters) |
|---|---|---|---|---|
| Mean | 198 | 5,989 | 655 | |
| SE of Mean | 0 | 8 | 0 | |
| Median | 180 | 2,718 | 630 | |
| Std. Dev. | 141 | 9,434 | 338 | |
| Range | 1,106 | 162,257 | 1,755 | |
| Min | 20 | 71 | 70 | |
| Max | 1,126 | 162,328 | 1,825 | |
| Percentiles | 10 | 62 | 306 | 227 |
| 20 | 82 | 541 | 304 | - |
| 25 | 95 | 714 | 349 | - |
| 30 | 108 | 940 | 401 | - |
| 40 | 142 | 1,616 | 525 | - |
| 50 | 180 | 2,718 | 630 | - |
| 60 | 209 | 4,456 | 699 | - |
| 70 | 241 | 6,049 | 886 | - |
| 75 | 257 | 6,992 | 947 | - |
| 80 | 274 | 8,176 | 1,005 | - |
| 90 | 319 | 15,630 | 1,136 | - |
| 95 | 374 | 23,499 | 1,232 | - |
Disclaimer/Publisher’s Note: The statements, opinions and data contained in all publications are solely those of the individual author(s) and contributor(s) and not of MDPI and/or the editor(s). MDPI and/or the editor(s) disclaim responsibility for any injury to people or property resulting from any ideas, methods, instructions or products referred to in the content. |
© 2026 by the authors. Licensee MDPI, Basel, Switzerland. This article is an open access article distributed under the terms and conditions of the Creative Commons Attribution (CC BY) license.
Copyright: This open access article is published under a Creative Commons CC BY 4.0 license, which permit the free download, distribution, and reuse, provided that the author and preprint are cited in any reuse.


