Submitted:
30 January 2026
Posted:
30 January 2026
You are already at the latest version
Abstract
Global urbanization redirects attention toward the sensory quality of the built environment as a decisive factor in public health and psychological resilience. In automated retail, façades function as sensory interfaces to mitigate the psychological alienation and sensory deprivation inherent in automated nodes. This study offers an initial empirical investigation of AI-generated biophilic façade designs based on WELL Building Standard for automated retail environments using a multimodal evaluation framework. To evaluate the effectiveness of biophilic interventions in these settings, this study pursued three specific objectives: (1) to utilize a curated series of architectural façade variations with calibrated biophilic complexity derived from an environment-based AI generative framework, (2) to quantify subconscious responses represented by gaze patterns and behavioral indicators elicited by these configurations, and (3) to analyze the correlation and potential divergence between implicit physiological responses and explicit conscious aesthetic appraisals. The multimodal experiment involving 30 participants integrated eye-tracking, facial expression analysis, and Semantic Differential scales. AOI-based visual attention analysis indicated that biophilic complexity, particularly the integration of organic patterns and natural materials, significantly enhanced subconscious visual interest and sustained engagement within specific design zones. The findings unveiled a complexity-aesthetic paradox where subconscious physiological and behavioral indicators exhibited peak engagement with high-complexity patterns while conscious aesthetic preference favored material-driven structural clarity. Statistical verification via repeated measures correlation analysis revealed a lack of significant linear association between instinctive physiological engagement and explicit aesthetic appraisal, highlighting a notable divergence between implicit and explicit responses. Thus, while individuals are instinctively attracted to AI-generated complexity, psychological comfort remains rooted in material authenticity. This research provides a scientific foundation for health-conscious retail design by recommending a material-first strategy with pattern as an enhancement.
Keywords:
WELL building standard
; biophilic design
; generative AI
; eye-tracking
; facial expression analysis
; façade design
; automated retail
1. Introduction
The acceleration of global urbanization has fundamentally redirected the human habitat toward the built environment, where contemporary populations spend approximately 90% of their lives [1]. Therefore, the quality of architectural interfaces and transitional spaces is a decisive factor in public health and long-term psychological resilience [2,3]. To address the challenges of increasingly sterile urban landscapes, the WELL Building Standard (v2) offers a rigorous, evidence-based framework prioritizing human wellness through deliberate design interventions [4]. Within the WELL taxonomy, particularly the Mind, Light, and Materials concepts, biophilic design involves the strategic integration of natural elements and organic analogues to serve as a vital mechanism for mitigating physiological stress and facilitating cognitive restoration [5,6]. Although biophilic principles are increasingly prevalent in general architectural practice [7], their empirical performance within specialized commercial typologies, such as automated retail hubs, warrants further systematic investigation [8,9].
The retail sector, currently characterized by the emergence of automated retail stores, presents a unique set of environmental challenges [10]. These automated retail environments are technology-mediated commercial spaces that utilize integrated systems—such as computer vision, sensor fusion, and AI-driven platforms—to facilitate transactions and manage inventory without the physical presence of human staff. By replacing human social interaction with automated technological interfaces, these spaces often prioritize operational efficiency, sometimes at the expense of sensory wellness [11]. In such contexts, the building façade functions as more than a physical envelope; it acts as the primary sensory interface between the consumer and the automated environment, fundamentally shaping initial attraction and overall brand perception [12,13]. The existing literature suggests that automated retail environments often lack the perceptual warmth found in traditional spaces, leading to increased visual fatigue or a sense of psychological alienation among users [14]. Consequently, applying WELL-based biophilic façade strategies offers a potential pathway to humanize these automated nodes and restore environmental vitality [15,16].
The effectiveness of biophilic design has traditionally been evaluated using retrospective self-reporting methods, most notably the Semantic Differential (SD) scale, which captures essential conscious psychological assessments and aesthetic preferences [17]. To provide a more robust understanding of environmental perception, it is increasingly common to augment these subjective insights with objective, high-resolution multimodal biometric data [18,19]. This integrated approach allows researchers to cross-validate explicit semantic evaluations with implicit physiological markers, such as eye-tracking and facial expression analysis [20,21]. Eye-tracking facilitates the quantification of attentional allocation through metrics like Dwell Time (DT) and Revisit Count [22]. Simultaneously, facial expression recognition (FER) enables the detection of pre-conscious emotional valence by decoding specific Action Units (AUs) [23,24]. Such multimodal synthesis is particularly vital when evaluating AI-generated biophilic façades, as the high visual complexity of organic algorithmic patterns may trigger subconscious physiological responses that differ from, yet complement, conscious aesthetic judgments [25,26]. The systematic investigation of statistical correlations between implicit behavioral markers and explicit appraisals remains essential for determining the empirical divergence between distinct sensory processing layers.
Within this evaluative context, the Environment-Based Design (EBD) theory was adopted as a methodological framework. EBD provides a rigorous methodological framework for addressing ill-defined design problems, specifically the complex, often unpredictable interaction between human psychological requirements and environmental stressors [27]. In automated retail settings, where sensory deprivation and psychological alienation are prevalent, EBD enables a systematic transition from identified environmental constraints to targeted design solutions through an environment-human-design feedback loop [28]. By leveraging this theory, the present study moved beyond intuitive design, utilizing a structured logic to bridge the gap between subconscious human needs and the calibrated biophilic parameters utilized in our established AI-generative framework [16].
Building upon this foundation, the primary aim of this research was to evaluate the physiological and behavioral efficacy of AI-generated biophilic façades within automated retail environments. By implementing a cross-modal statistical framework, the study sought to verify whether the instinctive attraction to complex biophilic textures aligns with conscious aesthetic judgment or if these evaluative channels demonstrate perceptual divergence during the appraisal of architectural façades. To achieve this, the study pursued three specific objectives: (1) to utilize a curated series of architectural façade variations with calibrated levels of biophilic complexity derived from a previously established environment-based AI generative framework [15,16], (2) to quantify subconscious responses represented by gaze patterns and behavioral indicators elicited by these configurations, (3) to analyze the correlation and potential divergence between these implicit physiological responses and explicit conscious aesthetic appraisals.
The following Research Questions (RQs) guided the investigation:
RQ1. How do biophilic façade variations informed by the WELL Building Standard influence the distribution and characteristics of visual attention measured by eye-tracking compared to a control façade configuration?
RQ2. How do implicit physiological responses reflected in facial expression indicators of engagement and cognitive effort vary across different biophilic façade design conditions?
RQ3. To what extent do implicit physiological responses correspond with or diverge from explicit aesthetic appraisals during the evaluation of biophilic façade designs?
2. Literature Review
2.1. The WELL Building Standard and Biophilic Integration
The WELL Building Standard, as an advancement of the human-centric architectural standards, provides a rigorous and evidence-based framework for optimizing the health and well-being of occupants [1,4]. Unlike traditional green building certifications that prioritize resource efficiency, the WELL standard emphasizes the longitudinal health outcomes of buildings’ occupants through the concept of salutogenic design [7,27]. Within this taxonomy, biophilic design is situated as a primary strategy to enhance psychological health and physiological recovery, particularly through the Mind concept [8,29]. It proposes that the built environment should systematically facilitate a reconnection between humans and natural processes to mitigate urban stress [5,30]. Recent critical reviews underscore that while WELL provides the necessary guidelines, the empirical validation of specific biophilic interventions remains essential to quantify their actual restorative potential across diverse architectural typologies [9,31].
2.2. Computational Design Synthesis via EBD and Generative AI
The synthesis of sophisticated biophilic façades follows primarily the recursive logic of EBD to bridge the gap between abstract health requirements and concrete architectural form [29,32]. This design is anchored by the Recursive Object Model (ROM). As a specialized knowledge representation tool, ROM effectively structures the intricate interactions between environmental stressors and human psychological needs. The operational process of EBD relies on a continuous three-stage recursive cycle. Initially, environmental analysis defines the boundaries of the design problem. Subsequently, conflict identification reveals discrepancies between environmental constraints and human perceptions. Finally, solution generation resolves these identified conflicts through targeted design interventions [28,32].
In our established research framework, this approach translates WELL-based health criteria into quantifiable formal parameters, such as materiality, pattern density, and visual complexity [16]. These parameters constitute the logical foundation for subsequent generative processes. By leveraging the computational power of Generative AI, these EBD-derived variables are mapped into high-fidelity biophilic analogues that align with innate human sensory predispositions. This synthesis process facilitates the efficient generation of organic patterns with high visual intricacy, offering a distinctive approach to formal exploration alongside traditional design methods. However, the high degree of complexity inherent in AI-generated outputs necessitates a more rigorous approach to evaluation [33]. Recent evidence suggests that AI-synthesized content often exhibits subtle emotional and structural discrepancies compared to authentic stimuli, requiring specialized biometric frameworks to identify the effects of these fabricated patterns on human perception and trust [34]. While EBD ensures the logical rigor of the design derivation, empirical validation through multimodal biometric analysis remains essential to verify whether these visual configurations effectively foster psychological comfort and cognitive restoration in automated commercial settings.
2.3. Objective Metrics for Architectural Perception and Eye-Tracking
Multimodal biometrics, which provides a high-resolution map of human-environment interaction, drives the shift toward objective measurement in environmental psychology [12,18]. Eye-tracking technology serves as a reliable proxy for visual attention and information acquisition because it bypasses the cognitive filters inherent in retrospective self-reporting [14,19]. According to the methodological standards established by Holmqvist and Andersson, metrics such as Dwell Time (DT) and Revisit Count are fundamental for quantifying the visual interest and attentional engagement of specific façade elements [22,35]. Current empirical studies have demonstrated that specific architectural attributes, including shape, color, and pattern complexity, directly modulate visitors’ visual preferences and attentional allocation [30,36]. Furthermore, combining eye-movement analysis with subjective assessment tools allows for a comprehensive triangulation of data, which reveals the underlying relationship between spatial elements and perceived visual quality [17,37].
2.4. Facial Behavioral Markers and Pre-Conscious Processing
While attentional metrics identify the focus of observation, facial expression recognition provides essential data regarding the emotional valence and cognitive depth associated with architectural stimuli [20,21]. This analytical approach is grounded in the structural muscular modeling of the face and the decoding of specific action units [38]. In particular, the application of automated facial expression analysis has proven effective in revealing how viewers subconsciously process the 'emotional authenticity' of AI-generated media, providing dual indicators of physiological response and perceived credibility [34]. Recent research utilizing neurophysiological sensors and virtual reality environments suggests that complex organic geometries trigger distinct signatures of psychological comfort that traditional surveys often fail to detect [32,39]. Behavioral markers, such as specific head orientations or micro-expressions, including Lip Suck, are increasingly recognized as indicators of heightened pre-conscious cognitive processing in response to biophilic textures. This mapping of human response is critical for identifying the discrepancy between involuntary physiological attraction and conscious aesthetic judgment. Furthermore, recent advancements in multi-modal affective analysis have demonstrated that the integration of facial markers and gaze patterns provides a high-resolution lens for deciphering complex subconscious states, such as trust and engagement, in technology-mediated environments [40].
2.5. Subjective Evaluation Using Semantic Differential Scale
The Semantic Differential (SD) technique remains a cornerstone in environmental psychology for quantifying the affective meaning of physical spaces [18]. Originally conceptualized by Osgood, this psychometric method allows researchers to translate nuanced psychological perceptions into measurable bipolar scales. Within architectural research, the SD scale has been extensively applied to assess visual quality, aesthetic preference, and the atmospheric characteristics of building facades [36]. Recent studies have successfully integrated eye-tracking data with SD evaluations to analyze the perceptual effects of traditional blocks and complex urban streetscapes [18,41]. In the specific context of biophilic design, this method provides a critical subjective baseline for evaluating dimensions such as perceived naturalness, restorative potential, and visual vibrancy. By utilizing a curated set of adjective pairs, researchers can identify formal attributes of a facade that most effectively shift observer perception toward favorable psychological poles. Consequently, the SD scale serves as an essential explicit measure to cross-validate the implicit physiological responses captured through biometric sensors. Such a cross-validation relies on sophisticated correlation techniques to accurately detect the presence of perceptual decoupling in human-environment interaction.
3. Methodology
3.1. Research Framework and Experiment Design
This study employed a multimodal experimental design grounded in the EBD framework to investigate the influence of AI-generated biophilic façade variations on visual attention and emotional responses in automated retail contexts. As illustrated in Figure 1, the research framework followed a three-stage EBD process encompassing environmental analysis, reasoning and inference, and generation, evaluation, and feedback, enabling a structured integration of design logic, generative modeling, and human-centered assessment.
In EBD Stage 1, the environmental analysis was conducted to identify key challenges associated with automated retail environments, including limited social interaction, potential sensory deprivation, and elevated psychological stress. To address these issues from a health-oriented perspective, relevant WELL Building Standard criteria, particularly those related to mental well-being and biophilic design, were reviewed and synthesized. This stage established the environmental and theoretical basis for subsequent visual dimension mapping, ensuring that design variables were grounded in both contextual needs and established health principles. Recent findings have supported this focus on environmental context, showing that the specific context in which information is processed significantly modulates the emotional responses captured via facial expression analysis [42].
EBD Stage 2 focused on reasoning and inference using a Recursive Object Model (ROM) to translate environmental requirements into design-operational variables. Based on the literature review, WELL standard mapping, and case study analysis, three core visual dimensions (color, material, and pattern) were identified as primary façade design variables. These dimensions were embedded into a directional prompt vocabulary composed of core design elements, descriptive modifiers, and WELL-integrative labels. This structured prompt system guided AI-based façade generation using Stable Diffusion XL with ControlNet, allowing targeted local regeneration while maintaining geometric consistency across images. To ensure methodological rigor, a prior validation process combining perceptual similarity control (LPIPS) and expert-guided evaluation was applied, resulting in the selection of eight façade stimuli representing distinct combinations of the extracted visual dimensions.
In EBD Stage 3, the generated façade stimuli were evaluated through a multimodal assessment framework integrating objective and subjective measures. Visual attention was captured using eye-tracking metrics, including revisit count, dwell time (DT), fixation count (FC), and fixation duration (FD). Emotional responses were assessed through facial behavior indicators derived from facial expression analysis, while subjective appraisal was collected using a semantic differential (SD) scale to capture participants’ conscious aesthetic evaluations. The results of these evaluations informed an exploratory refinement phase, forming an EBD feedback loop that supports iterative reflection on the relationship between design variables, perceptual responses, and evaluation outcomes.
3.2. Participants
Participants for this study were recruited through digital announcements distributed across university online communities and professional social networks. Initially, 48 volunteers provided informed electronic consent according to the ethical protocols approved by the Institutional Review Board (Approval No. 1040395-202510-01). The inclusion criteria specified that the participants had to be between 18 and 50 years of age with normal or corrected vision of at least 0.8 to ensure high-quality eye-tracking data collection.
A power analysis conducted using G*Power 3.1.9.7 determined that a minimum sample of 27 was necessary to achieve a statistical power of 0.85 based on an effect size of 0.20 and a significance level of 0.05 for eight repeated measures. To account for potential data loss and technical challenges associated with remote online testing, the initial recruitment was expanded to 48 individuals. Following a rigorous data quality screening within the iMotions platform, which excluded records with incomplete gaze trajectories or insufficient facial illumination, a final cohort of 30 participants was retained for the analysis. This final group consisted of 15 males and 15 females. Age was divided into ranges, with the vast majority of the sample (86.7%) belonging to the 18- to 25-year-old category, representing a tech-savvy demographic that frequently utilizes automated retail environments.
3.3. Experimental Stimuli
The stimuli were developed by integrating EBD methodology with generative artificial intelligence, as established in our preliminary research [16,27]. Building upon these established AI generative strategies, the simulation process utilized the Stable Diffusion XL (SDXL) model in conjunction with the ControlNet Depth model to ensure precise structural fidelity to the original architectural form. This procedure began with a high-resolution photograph of an existing automated retail storefront, which served as the control condition designated as I1. Seven experimental variations were then synthesized by systematically modulating three biophilic design parameters, i.e., materiality, pattern density, and color organicism, derived from the WELL Building Standard.
The ControlNet Depth model was specifically employed to extract the spatial depth of the storefront, allowing for the application of complex organic textures while maintaining the original building proportions and spatial depth. The generative procedure involved applying specific prompt frameworks to modify the façade attributes, resulting in a gradient of biophilic complexity. These variations included isolated modifications, such as color only (I2), material only (I3), and pattern only (I4), alongside integrated configurations including color and material (I5), color and pattern (I6), material and pattern (I7), and a comprehensive synthesis of all three elements (I8).
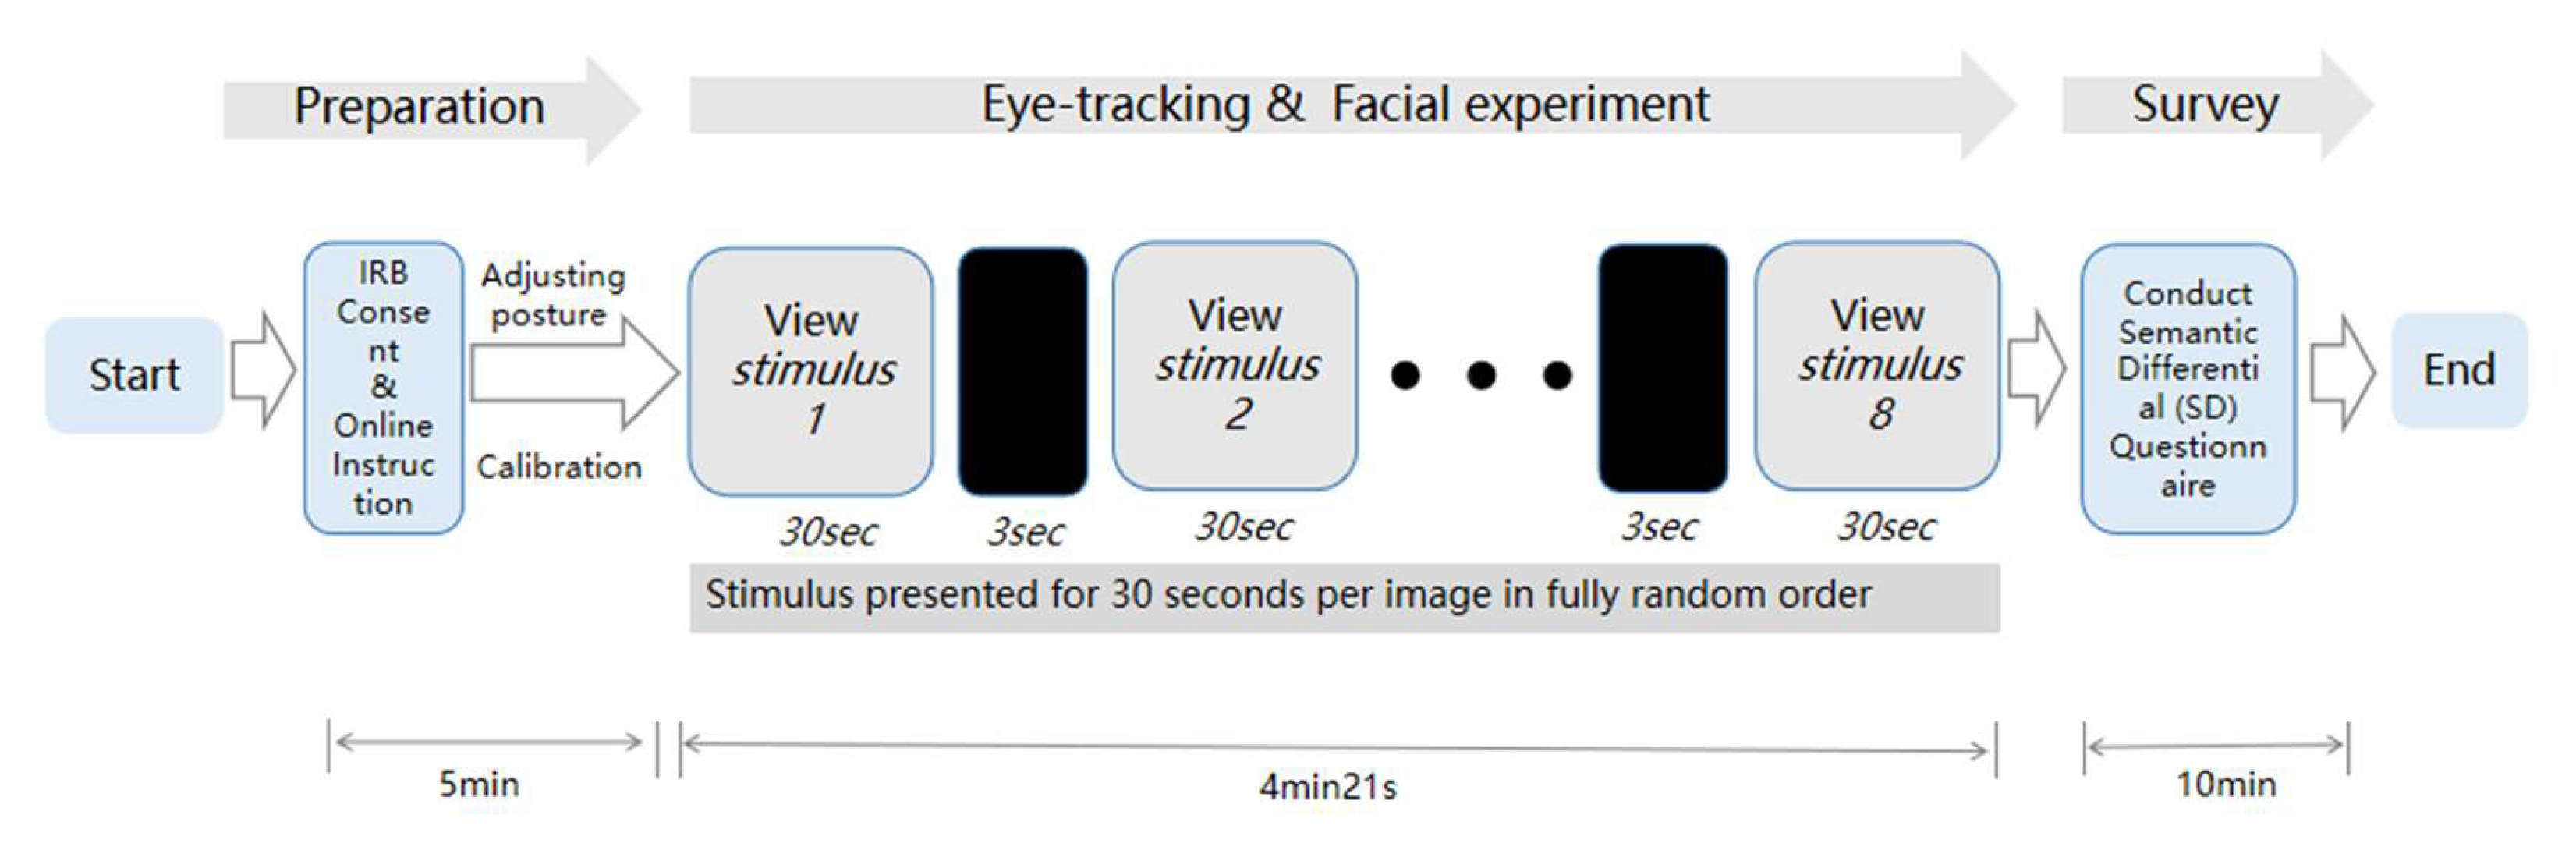
All eight images were standardized to a resolution of 1125 by 844 pixels to ensure visual consistency. Each stimulus was presented for a fixed duration of 30 seconds, separated by a 3-second black screen interval to prevent visual carryover effects. These stimuli, including the design ID, stimulus type, and corresponding images, are presented in Figure 2.
3.4. Experiment Setup and Procedure
3.4.1. Experiment Environment and Setup
The investigation was conducted utilizing a remote webcam in strict accordance with the approved IRB protocol. Participants completed the study individually in a naturalistic online environment using their own desktop computers equipped with high-definition webcams. As illustrated in Figure 3, volunteers maintained a stable and upright posture, facing the monitor directly at a viewing distance of approximately 50-60 cm [43]. The webcam, positioned above the display, facilitated the simultaneous recording of gaze trajectories and facial behavioral markers through the iMotions Online platform. A minimum camera resolution of 720p was required to ensure the precision of gaze tracking and facial marker extraction.
Prior to the formal stimuli presentation, participants received comprehensive online instructions regarding posture adjustment, screen alignment, and lighting optimization to prevent backlighting interference. A rigorous 13-point calibration procedure was implemented to map individual ocular characteristics to the screen coordinates. The entire experimental procedure was non-invasive and required no additional wearable sensors or peripheral devices, complying with the ethical standards for human subject research approved by the IRB. After the image viewing task, a questionnaire was administered to capture conscious perceptions.
3.4.2. Experiment Procedure
The experimental protocol followed a structured five-stage sequence with a total duration of approximately 25 to 30 minutes per participant.
- Preparation and Informed Consent: Participants initially accessed the study via a secure web link. They were presented with a digital briefing regarding the research objectives and data privacy measures. In accordance with the approved IRB protocol, participants provided their informed electronic consent before proceeding to the technical setup.
- System Calibration: After adjusting their seating position and lighting, participants completed the 13-point calibration process to ensure eye-tracking precision. Only participants who met the minimum accuracy threshold were permitted to continue to the stimulus phase.
- Stimuli Presentation: The eight biophilic façade variations were presented in a randomized order to eliminate sequence bias. Each image was displayed for a fixed duration of 30 seconds, interspersed with a 3-second black screen interval to reset visual fixation. During this period, iMotions synchronously captured subconscious physiological markers.
- Subjective Evaluation (SD Survey): Immediately following the final stimulus, participants completed a Semantic Differential scale questionnaire. They evaluated each façade design based on 10 bipolar adjective pairs to capture their conscious aesthetic and psychological assessments.
- Reward and Exit: Upon successful completion of the survey, participants were directed to the exit screen. As an incentive for their participation, a mobile gift icon valued at 10,000 KRW was distributed to the provided contact information within 24 hours of the session.
Figure 4.
Overview of the experimental procedure.
3.5. Data Quality Control and Pre-Processing
To ensure the precision of the multimodal biometric analysis, a rigorous data screening protocol was applied to the raw signals captured from the 48 initial participants. Each trial was evaluated against three specific quality thresholds established for remote eye-tracking and facial behavioral analysis. First, the gaze tracking accuracy was required to be within 1.3 visual degrees to maintain the spatial validity of the Areas of Interest (AOI). Second, a minimum data completion rate of 90% was mandated for both gaze trajectories and facial expression streams to ensure the temporal continuity of the behavioral responses. Finally, the synchronization of multimodal data was verified through the iMotions WebET system to confirm that physiological reactions were accurately mapped to the corresponding design stimuli.
The study implemented a 13-point calibration procedure before the formal trials to optimize the webcam-based acquisition. Following the application of these technical criteria, 18 participants were excluded due to signal instability or calibration failure, resulting in a refined final analysis sample of 30 participants . This screening process guaranteed that the subsequent inferential statistics were conducted on high-fidelity data, mitigating the noise inherent in remote experimental settings.
3.6. Eye-Tracking Metrics and AOIs Definition
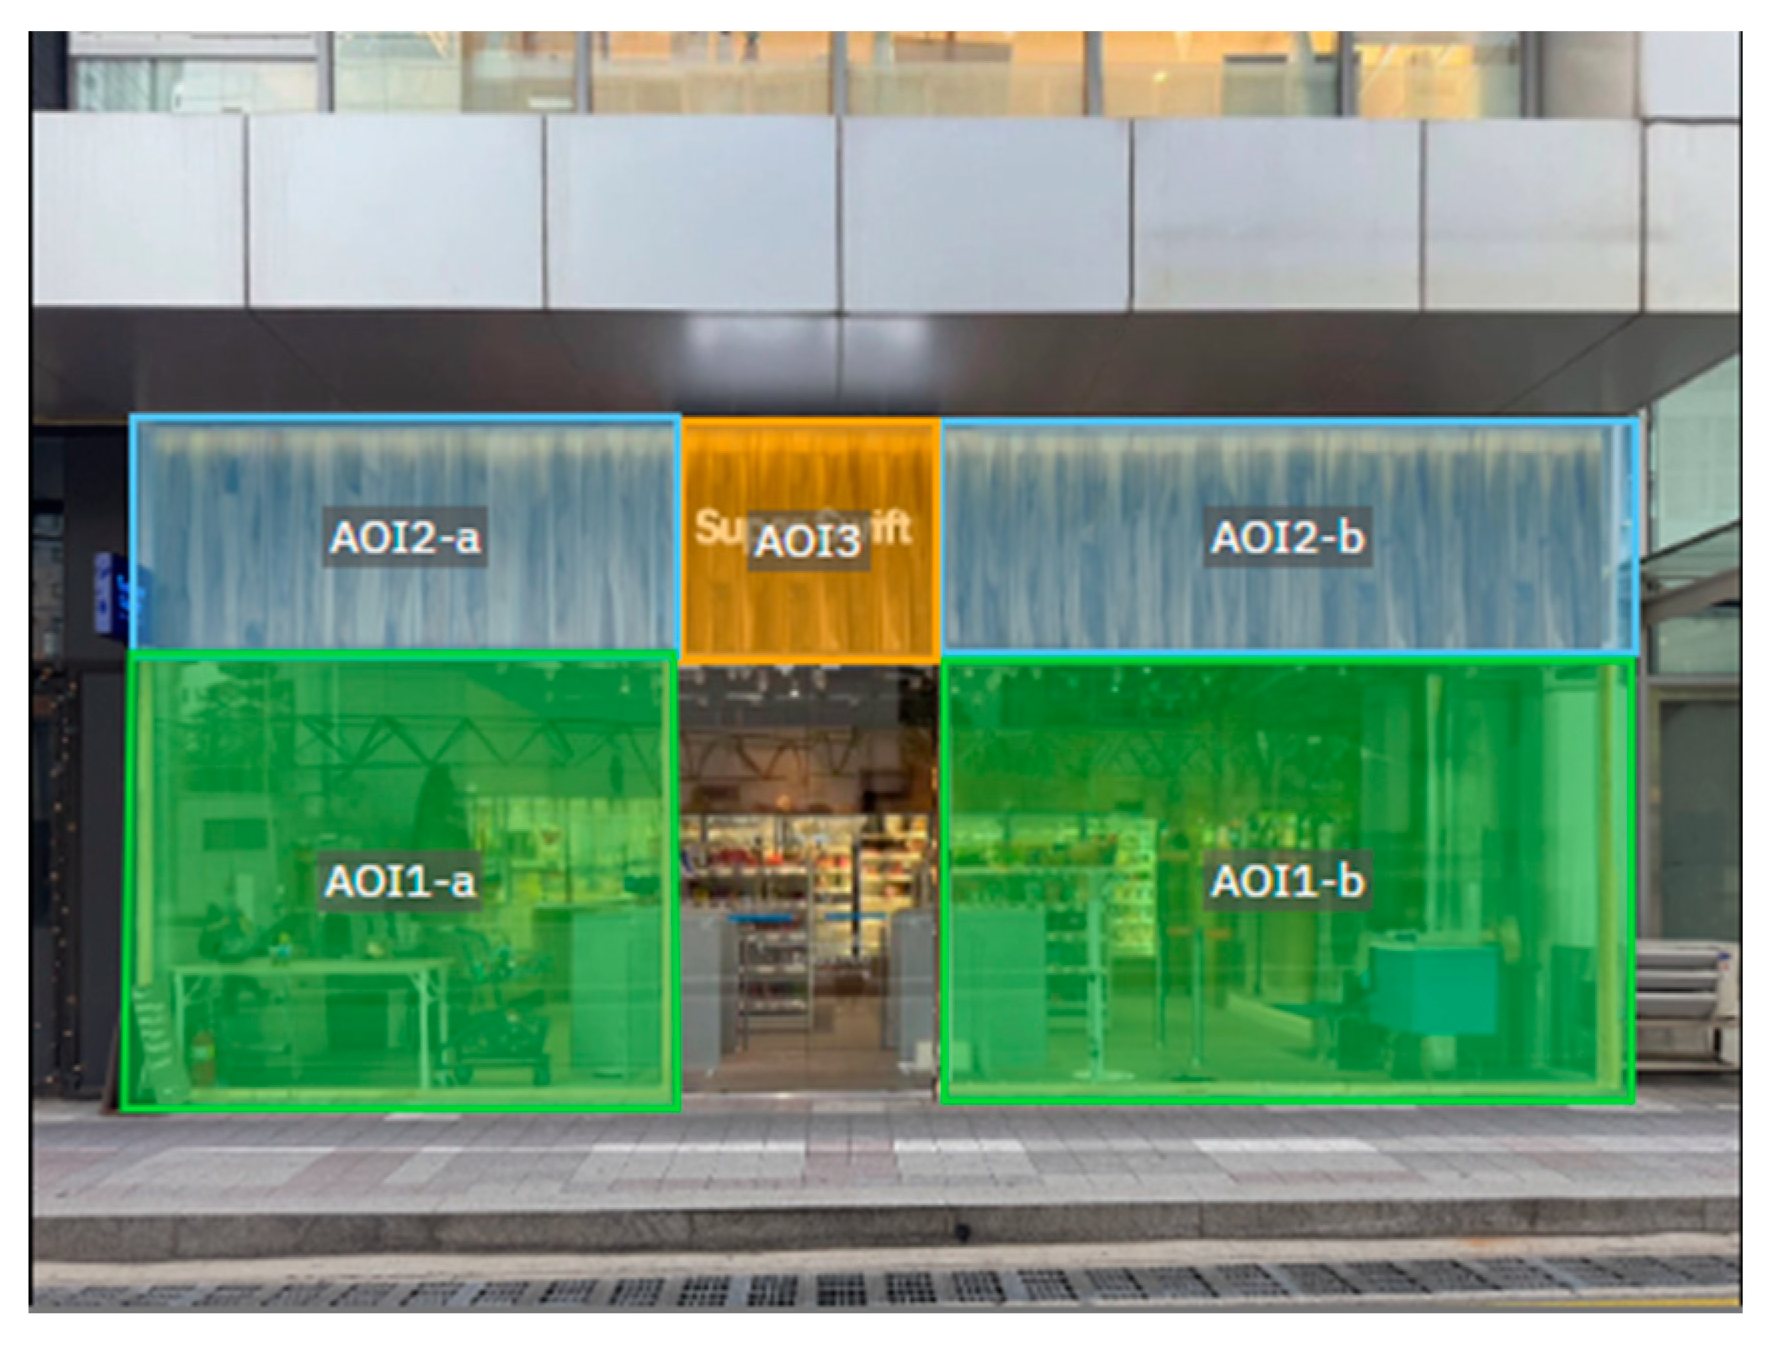
To facilitate a structured evaluation of visual attention across the biophilic variations, the storefront façades were partitioned into three functionally and geometrically distinct Areas of Interest (AOIs). These three AOIs allowed for a detailed analysis of how AI-generated features modulate visual engagement across different architectural components:
Glass Façade AOI (AOI 1): This zone encompassed the glass surfaces located on both sides of the central entrance. Due to the symmetrical layout of the façade, this AOI consisted of two distinct segments (identified as 1a and 1b during data collection), which were consolidated for the final analysis to evaluate the holistic effect of biophilic patterns applied to the transparent interface.
Signage Sides AOI (AOI 2): This area comprised the façade sections flanking the main signage. It measured the secondary visual attraction elicited by biophilic interventions around the store's identity zone. Like AOI 1, this region was recorded as two lateral segments (identified as 2a and 2b) and subsequently merged to represent the combined visual load on the signage periphery.
Signage Area AOI (AOI 3): This zone focused exclusively on the main signage area. Analyzing this AOI revealed the extent to which biophilic designs on the surrounding façade either complement or compete with the brand identity for the viewer's attention.
Within these AOIs, four primary eye-tracking metrics were extracted to quantify visual engagement:
Dwell Time (ms): The total duration of all fixations and saccades within a specific AOI, representing the overall attentional investment.
Fixation Count: The total number of fixations within an AOI, indicating the level of visual processing and information extraction.
Revisit Count: The number of times a participant's gaze returned to an AOI after looking away, serving as an indicator of sustained visual interest or cognitive re-engagement.
Fixation Duration (ms): The average length of individual fixations, reflecting the depth of cognitive processing and the visual complexity of the stimulus.

Table 1.
Definitions and settings of the Area of Interest (AOI).
| AOI Name | Physical Coverage | Stimulus with coloring AOIs |
|---|---|---|
| Façade_AOI | Building façade, featuring texture, material, and patterns |
 |
3.7. Facial Expression Markers and Behavioral Indicators
Subconscious behavioral markers, specifically head orientation (Yaw) and the activation of Lip Suck, Nose Wrinkle, and Lid Tightening, were extracted to evaluate pre-conscious cognitive processing. The selection of these biometric markers aligns with contemporary multi-modal frameworks that utilize synchronized physiological data to quantify implicit human-technology interactions [40]. Within this framework, each specific indicator was selected for its capacity to reveal distinct layers of environmental perception:
Yaw (Head Orientation): This metric served as a direct indicator of postural engagement and visual curiosity. In the context of architectural interfaces, subtle adjustments in head orientation reflect an involuntary intent to explore spatial details and complex organic textures, signaling an instinctive attraction to the stimuli.
Lip Suck: In facial behavioral analysis, the activation of Lip Suck is increasingly recognized as a marker of cognitive effort and pre-conscious evaluative processing. It indicates that the viewer is deeply engaged in decoding the visual complexity of the biophilic patterns, reflecting an automatic physiological response to environmental information.
Lid Tightening and Nose Wrinkle: These markers are associated with perceptual scrutiny and concentrated focus. They facilitate the identification of a transition from passive viewing to active sensory decoding, particularly when participants encounter highly intricate AI-generated designs that demand greater cognitive activation.
The synchronization of these implicit markers allows for a high-resolution mapping of the user experience beyond conscious verbal reporting.
3.8. Subjective Evaluation: SD Scale and Validation
Immediately following the biometric recording, participants completed a Semantic Differential (SD) questionnaire to provide conscious aesthetic evaluations. The scale comprised ten adjective pairs reflecting the dimensions of the WELL Mind concept and architectural perception. To ensure scientific rigor, the reliability and validity of the instrument were tested. The analysis yielded Cronbach’s alpha of 0.960 and a KMO value of 0.944, with a highly significant Bartlett’s test result (p < 0.001), confirming that the subjective data provided a stable baseline for comparison. The adjective pairs are presented in Table 2.
3.9. Data Processing and Statistical Analysis
Statistical analyses were performed using SPSS version 27.0 and Python. Four primary metrics for the eye tracking component were Revisit Count, Fixation Duration, Dwell Time, and Fixation Count. Gaze data were rescaled using min-max normalization into a standardized zero-to-one interval to facilitate a descriptive analysis of visual attention distribution. Furthermore, these values were mapped to a 0 to 100 scale for radar chart visualization to enhance legibility and allow for a consistent comparison of design features across the metrics.
Physiological and behavioral responses were assessed using four specific markers, Yaw, Lip Suck, Nose Wrinkle, and Lid Tightening. These indicators were recorded synchronously via the iMotions platform to capture subconscious cognitive and emotional arousal levels. For the subjective evaluation, the internal reliability of the ten adjective pairs on the Semantic Differential scale was verified using Cronbach’s alpha coefficients. Descriptive statistics, including mean values and standard deviations, were calculated for each psychological dimension to establish the conscious perception level of the control configuration.
To assess the efficacy of the biophilic façade variations, a univariate general linear model with a repeated measures design was utilized for the facial behavioral markers and subjective data streams. In addition, repeated measures correlation analysis performed via Python-based statistical scripts was conducted to quantify the relationship between implicit physiological markers and explicit psychological evaluations. This approach was specifically chosen to account for individual-level variability by controlling for between-subject differences inherent in repeated exposure designs, thereby isolating within-subject effects across stimulus conditions. Greenhouse-Geisser corrections were applied to adjust the degrees of freedom when the sphericity assumption was violated. Post-hoc comparisons with Bonferroni adjustments were conducted to identify significant differences between specific stimulus pairs. Statistical significance was maintained at a p-value of less than 0.05, while the magnitude of the correlation coefficients was qualitatively interpreted based on the effect size conventions established by Cohen [44].
4. Results
4.1. Visual Attention Analysis: Heatmap Visualization and Eye-Tracking Metrics
To characterize the distribution of visual attention across the eight façade stimuli, a combined analysis of heatmap visualization and quantitative descriptive metrics was performed. This approach evaluates both the spatial allocation of attention and the intensity of cognitive engagement.
4.1.1. Heatmap Qualitative Analysis
The heatmap visualization provides a qualitative overview of attentional clusters across the façade surfaces. As illustrated in Figure 5 (Heatmap Matrix), distinct attentional patterns emerged among the various design schemes. The composite designs, particularly Image I8 and Image I7, alongside the Control (I1), exhibited concentrated high-intensity hot zones focused primarily on the central decorative and biophilic elements. These patterns suggest a high degree of visual consensus among participants when processing complex biophilic patterns. Conversely, the heatmaps for Image I3 (Material only) and Image I4 (Pattern only) showed more dispersed and lower-intensity gaze distributions, indicating a lack of stable visual anchors in simplified design configurations.
4.1.2. AOI-Based Quantitative Metrics and Attentional Distribution
To provide an in-depth evaluation of visual engagement, four eye-tracking metrics were analyzed across three segmented Areas of Interest (AOIs), as summarized in Table 3 and visualized in Figure 6. This AOI-based approach facilitates a precise understanding of how biophilic interventions modulate attentional capture and processing depth within specific architectural components.
(1) AOI-based Attentional Capture and Visual Recurrence. The distribution of visual interest, characterized by Dwell Time (DT) and Revisit Count (RC), revealed a significant spatial shift in attention. In the Control (I1), visual engagement with the glass façade (AOI 1) was minimal, with a Control DT of 6,332.79 ms. However, the introduction of AI-generated biophilic patterns elicited a powerful visual pull toward this zone. As shown in Table 3, Image I4 (Pattern only) and I7 (Pattern + Material) recorded the highest levels of engagement in AOI 1. I4 reached a peak DT of 17,099.09 ms, representing a 170% increase over the Control (I1). The expansion of the radar area in Figure 6a along the RC and DT axes statistically validated that organic patterns possess a superior capacity to anchor and re-engage observer attention within the primary design interface.
In AOI 2 (Signage Sides), color-based interventions (I2 and I5) expanded the participants' visual search area. Image I2 (Color only) achieved the maximum DT of 12,079.43 ms, while I5 (Color + Material) reached the peak RC of 6.95. This radiating effect is evident in Figure 6b, where color-dominant schemes show a significant outward protrusion. This suggests that color served as a potent tool for extending the visual field toward the signage periphery.
(2) AOI-Based Processing Depth and Cognitive Immersion. The depth of cognitive processing was analyzed through Fixation Duration (FD) and Fixation Count (FC). While the Control (I1) exhibited deep but localized focus in AOI 3 (Signage Area) with an FD of 1,478.86 ms, the biophilic façades redistributed this immersion.
A critical finding for AOI 3 was the Visual Competition effect. While Image I3 (Material only) effectively enhanced signage visibility with a DT of 12,164.36 ms and an FC of 14.52, the most complex composite design, I8 (Full Composite), caused a severe drop in functional engagement with a DT of only 2,638.83 ms. This indicates that excessive complexity can mask brand identity. Conversely, for AOI 1, I7 (Pattern + Material) maintained high processing intensity with an FD of 958.50 ms. These values suggest that the synthesis of tactile textures and complex patterns elicited visual fascination. This finding aligns with the Environment-Based Design (EBD) premise that biophilic complexity, when strategically applied, enhances sensory engagement without necessarily increasing cognitive fatigue.
The radar charts in Figure 6 provide a geometric representation of the attentional signature for each design variation.
Figure 6a (AOI 1): The dramatic expansion of I4 (Pattern only) and I7 (Pattern + Material) across the RC, FC, and DT axes illustrates the dominant role of pattern-based complexity in activating glass surfaces. Control (I1) is restricted primarily to the FD axis, which indicates long fixations on a void interface rather than active exploration.
Figure 6b (AOI 2): The chart shows a more balanced expansion where I2 (Color only) and I5 (Color + Material) occupy the largest areas. This demonstrates that biophilic design can successfully transition attention from the façade center to the identity periphery.
Figure 6c (AOI 3): The significant contraction of I8 (Full Composite) into a minimal area, contrasted with the robust expansion of I3 (Material only), highlights the threshold of biophilic complexity. It suggests that while biophilic attributes are generally beneficial, a material-first approach is most effective for preserving the visibility of functional signage in high-traffic retail environments.
4.2. Physiological and Behavioral Responses: Facial and Postural Analysis
4.2.1. Descriptive Statistics
A preliminary descriptive analysis was conducted to characterize physiological and behavioral manifestations across the eight façade stimuli. The results, summarized in Table 4 and visualized via the mean score comparisons in Figure 7, revealed a clear numerical gradient where composite biophilic schemes elicited higher behavioral engagement compared to the control and single element configurations. Specifically, Image I7 (Pattern + Material) triggered the most pronounced responses, reaching peak mean values for both postural engagement (Yaw: 1.015 ± 1.700) and cognitive evaluative markers (Lip Suck: 5.147 ± 10.485). This was followed by the pattern-only scheme (I4), suggesting that the presence of intricate organic textures served as a primary driver for heightened visual exploration. In contrast, the Control design (I1) recorded the lowest postural activity, with a mean Yaw value of only 0.457.
Consistent with the stochastic nature of physiological signals, the standard deviations across all behavioral metrics remained relatively high, often exceeding the mean values. This phenomenon stems from the inherent diversity in individual baseline expressiveness and physiological reactivity to visual stimuli. To provide a robust visualization of the central tendency and the precision of the mean estimates across the eight design configurations, the Standard Error of the Mean (SEM) was utilized for error bars in Figure 7[45]. This approach facilitates a clearer interpretation of the distinct behavioral shifts elicited by different biophilic treatments while acknowledging the underlying population variance.
The observed surge in Yaw and Lip Suck values in high complexity schemes like I7 and I4 indicated a deeper level of cognitive processing. Specifically, the elevated Yaw values suggested that intricate organic textures effectively sustained prolonged visual exploration, potentially preventing the rapid attentional decay often observed with plain architectural surfaces. Furthermore, the prominence of the Lip Suck marker in the I7 configuration reflected an intensified pre-conscious cognitive appraisal, where participants transitioned from passive viewing to an active engagement with the visual complexity of the façade. Notably, the relatively compact SEM intervals, despite high underlying variance, empirically supported the physiological appeal of fractal-like patterns, which in this study refer to AI-generated façade features characterized by multi-scale visual variation, irregular yet coherent pattern repetition, and organic material cues that resemble the perceptual structure of natural environments rather than literal fractal geometry in automated retail environments.
4.2.2. Inferential Statistical Analysis of Physiological and Behavioral Responses
To maintain consistency with the within-subjects design, a repeated-measures analysis of variance (RM-ANOVA) was performed to investigate the effect of the eight stimuli on four physiological and behavioral markers. Prior to the inferential testing, Mauchly’s test was employed to evaluate the sphericity assumption. The results indicated that all markers significantly violated this assumption (p < .05), necessitating the application of Greenhouse-Geisser corrections to adjust the degrees of freedom for more robust results.
As summarized in Table 5, the RM-ANOVA revealed significant main effects for two key metrics: Yaw(head orientation) and Lip Suck(cognitive engagement). According to Cohen’s (1992) criteria, these values represent medium-to-large effect sizes [44]. In contrast, while Lid Tighten and Nose Wrinkle exhibited distinct numerical trends, they did not reach statistical significance after correction, as all p-values exceeded 0.05. This suggests that while biophilic generative patterns significantly altered postural exploration and cognitive appraisal depth, they did not trigger intense sensory discomfort or avoidance responses.
Comprehensive post hoc pairwise comparisons, utilizing the Bonferroni adjustment, were conducted to identify specific differences between stimuli (Table 6). The results demonstrated that Stimulus I7 (Pattern + Material) elicited significantly higher Yaw activity compared to the Control I1 (mean difference = 0.558, ), indicating that the integration of AI-generated textures and material properties maximized subconscious visual exploration. Although the main effect of Lip Suck was statistically significant in the repeated measures ANOVA , the conservative nature of the Bonferroni adjustment yielded no specific significant pairs. Nevertheless, the elevated mean scores for I7 and I4 suggest a heightened state of cognitive appraisal when participants encountered complex biophilic patterns.
Collectively, these physiological findings indicated that AI-driven biophilic schemes, particularly those integrating intricate patterns and materials, attained a level of pre-attentive engagement that effectively shifted behavioral responses toward active exploration. While the subjective SD scale highlighted the aesthetic advantage of simpler material textures represented by I3, the physiological markers revealed a subconscious fascination with the visual complexity of I7. This divergence provides empirical evidence for a physiological attraction to intricate biophilic designs, a response that may bypass conscious aesthetic judgments in automated retail environments [46].
4.3. Subjective Perception Results: SD Scale Analysis
4.3.1. Descriptive Analysis
Before conducting inferential analysis, descriptive statistics were computed to describe the participants’ overall evaluations of the eight façade design stimuli across ten perceptual dimensions. As illustrated in the perceptual profiles in Figure 8, the design stimuli exhibited distinct evaluative patterns. Composite schemes that integrate multiple visual attributes, specifically I8 (Color + Material + Pattern), generally achieved higher mean scores on positive perceptual dimensions, including Aesthetic, Vibrant, Pleasant, and Restorative. In contrast, the Control design (I1) consistently demonstrated the lowest mean scores across most dimensions, particularly regarding evaluative and affective attributes, such as Ugly versus Aesthetic and Dull versus Vibrant.
The variability of the data differed significantly across dimensions. Attributes associated with affective response, such as Unsettling and Stress-inducing, showed relatively larger standard deviations, which suggests substantial inter-individual differences in emotional perception. In contrast, perceptual attributes related to spatial form and clarity, including Closed versus Transparent and Conflicting versus Harmonious, displayed lower variability, reflecting a more consistent evaluative logic among the participants. Overall, these descriptive findings revealed clear perceptual differences between the stimuli, providing a robust basis for the subsequent statistical testing of differences between images.
4.3.2. Inferential Statistical Analysis of SD Evaluation
To strictly align with the within-subjects experimental design, a repeated measures analysis of variance (RM-ANOVA) was performed to investigate the differences in evaluations across the ten bipolar perceptual dimensions. Prior to the main analysis, Mauchly’s test was employed to assess the sphericity assumption. The results indicated that the assumption was violated for all dimensions with p-values below 0.001, necessitating the adoption of Greenhouse-Geisser corrections to adjust the degrees of freedom for more robust inferential testing.
As summarized in Table 7, the RM-ANOVA revealed significant main effects for six out of the ten perceptual dimensions. These included Ugly versus Aesthetic , Artificial versus Natural, Unsettling versus Calming, Dull versus Vibrant , Unpleasant versus Pleasant , and Stress-inducing versus Restorative . According to the criteria defined by Cohen (1992), the partial eta squared values represented moderate to large effect sizes [44]. Conversely, dimensions such as Visually Uncomfortable, Conflicting, Closed, and Dim did not reach statistical significance, as all p-values exceeded 0.05. This suggests that while biophilic generative patterns significantly altered affective and aesthetic appraisals, certain spatial cognitive attributes remained relatively consistent across the stimuli.
Comprehensive post-hoc pairwise comparisons utilizing the Bonferroni adjustment were conducted to identify specific differences between stimuli, as presented in Table 8. The results demonstrated a consistent trend where the Control design (I1) received the lowest scores across all significantly different dimensions, aligning it with the negative poles of the scales. In contrast, AI-generated biophilic schemes, particularly Stimulus I3 (Material only), demonstrated a significant capacity to shift perceptions toward positive poles. Specifically, I3 was rated as significantly more aesthetic (p=0.008) and significantly more vibrant (p=0.007) than the Control. In the Stress-inducing versus Restorative dimension, both I3 (p=0.001) and I5 (p=0.009) achieved significantly higher scores than Control, emphasizing their restorative potential in automated retail environments. Although the main effect of the Artificial versus Natural dimension was significant, no specific AI stimulus demonstrated a statistical advantage over the Control. However, I3 was perceived as significantly more natural than the pattern-only design I4. , suggesting that material textures are more effective than graphic patterns in conveying naturalistic attributes.
Collectively, the SD results indicated that AI-generated biophilic schemes consistently shifted spatial appraisal toward more favorable aesthetic and affective poles compared to the Control. While the stimuli maintained high uniformity across fundamental cognitive attributes, the significant divergence identified in positive affective dimensions emphasized AI's capacity to induce desirable architectural experiences. Specifically, the moderate effect sizes across aesthetic, vibrant, and restorative dimensions highlighted the competitive potential of material-driven AI variations in enhancing the environmental quality of automated retail settings.
4.4. Multimodal Correlation Analysis: Bridging Implicit and Explicit Responses
To further investigate the internal consistency between participants' instinctive physiological reactions and their conscious aesthetic evaluations, a repeated measures correlation () analysis was performed. This method was selected to effectively control for individual control variances and focus on the common intra-individual patterns across the eight AI-generated design stimuli. The analysis involved 240 observations (30 subjects × 8 stimuli), resulting in a robust statistical power with df = 209.
4.4.1. Visualizing Global Correlation Patterns
A 4×10 cross-correlation matrix was constructed, mapping four physiological markers (Yaw, Lip_Suck, Nose_Wrinkle, Lid_Tightening) against ten subjective dimensions of the SD scale. To objectively represent the effect sizes, the heatmap scale was fixed between [-0.5, 0.5], following Cohen’s guidelines for interpreting correlation strength [44]. Specifically, the magnitude of the correlation coefficients was interpreted as follows: |r| < 0.10 as negligible, 0.10 ≤|r| < 0.30 as small, 0.30 ≤ |r| < 0.50 as medium, and |r|≥ 0.50 as large [44].
As illustrated in Figure 9, the heatmap exhibited a predominantly low-saturation color profile. The correlation coefficients across all 40 attribute pairs fluctuated within a narrow range (−0.045 to 0.134), with no significant clusters or high-intensity nodes observed. This global distribution indicated that all investigated associations fell strictly within the negligible to small categories. This visual trend provided the first layer of evidence for a functional dissociation between the two processing channels.
4.4.2. Representative Correlation Pairs and Significance Testing
To examine the specific associations between key biophilic design effects and physiological engagement, ten representative pairs were extracted for detailed statistical scrutiny. The results, including rrm values, p-values, and 95% confidence intervals (CI), are summarized in Table 9.
According to the results presented in Table 9, none of the correlation pairs reached statistical significance at the 0.05 level. ,This lack of statistical significance is evidenced by the fact that the 95% confidence intervals for all correlation coefficients include zero, spanning from negative lower bounds to positive upper bounds. Consequently, these results provide robust statistical support for failing to reject the null hypothesis regarding the presence of a linear relationship between the examined implicit and explicit variables.
Moreover, the effect sizes for most pairs were remarkably small, with rrm values ranging from -0.011 to 0.134. In accordance with the criteria established in Section 3.9, these values demonstrated that even the most prominent associations remained within the negligible to small range. This pattern was even for the strongest association observed between postural engagement and perceived restorativeness. This specific relationship yielded a p-value of .052 and remained above the threshold required for statistical significance. These findings suggest that while AI-generated biophilic stimuli effectively modulated physiological states, such physiological fluctuations did not translate into predictable linear changes in subjective appraisal. Consequently, these results empirically validated the divergence between implicit and explicit sensory processing systems within the context of spatial experience.
4.4.3. Analysis of Perceptual Divergence in Design Evaluation
The comprehensive lack of statistical significance across all tested dimensions confirmed a notable divergence between instinctive physiological engagement and explicit aesthetic appraisal. While specific design stimuli elicited distinct variations in physiological fascination and subconscious engagement, these internal fluctuations failed to linearly predict conscious psychological judgments. This observation highlights a clear misalignment between implicit and explicit responses within the experience of AI-generated biophilic environments.
Such a discrepancy suggests that the instinctive attraction, triggered by complex biophilic patterns and the subsequent conscious evaluations, represents distinct and non-correlated dimensions of architectural perception. This divergence implies that the immediate physiological response of an individual does not necessarily dictate their formal aesthetic preference. Consequently, the capacity of AI-generated spatial designs to capture physiological attention does not automatically guarantee a corresponding increase in subjective satisfaction, highlighting the intricate and non-linear nature of human-environment interaction. These findings provide a critical empirical basis for understanding how individuals process complex, AI-generated visual information through parallel sensory channels, reinforcing the necessity of a multi-layered approach in design-science evaluation.
4.5. Summary of Multimodal Findings: Subconscious Attraction vs. Conscious Evaluation
The integration of subjective appraisals and physiological responses unveiled a multifaceted reaction to AI-generated biophilic façade designs. This research identified a pattern of divergence, here referred to as perceptual decoupling, between explicit evaluations derived from the Semantic Differential scale and implicit behavioral metrics captured through biometric tracking. Although originally conceptualized in cognitive neuroscience to describe the functional dissociation between external sensory input and internal cognitive states, this study adopted the term is adopted in a descriptive and contextual manner to characterize the observed incongruity between involuntary physiological engagement and conscious aesthetic judgment. This integrative summary provided a structured basis for addressing the three research questions rather than asserting a definitive cognitive mechanism.
Addressing RQ1, biometric observations suggested that biophilic façade variations derived from the WELL Building Standard shape distinct patterns of visual attention when descriptively examined in comparison with the Control configuration. While eye-tracking metrics, such as Dwell Time and Fixation Count, did not demonstrate statistically differentiated trends across all stimuli, the significant main effect observed for Yaw, together with the peak mean value recorded for Image I7 at 1.015, indicates heightened postural engagement in conditions of increased biophilic complexity. Furthermore, the elevated Revisit Counts observed for color-integrated designs, such as I2 and I5, suggested a tendency toward recurrent visual exploration, reflecting a form of subconscious attentional attraction within the spatial environment.
Regarding RQ2, the analysis of facial behavioral markers demonstrated that increased biophilic complexity corresponds with variations in implicit physiological responses linked to cognitive engagement. The significant main effect identified for Lip Suck, with the highest mean score observed in the composite scheme I7 (M = 5.147), reflected an intensified state of pre-conscious evaluative processing rather than a conscious judgment. Moreover, the observed variations in Nose Wrinkle and Lid Tightening across design conditions indicated shifts in emotional and cognitive activation levels, suggesting a transition from passive viewing toward deeper affective involvement. Taken together, these findings revealed that AI-generated biophilic complexity modulates the depth and intensity of subconscious information processing, consistent with the second research question.
Finally, RQ3 examined the relationship between implicit psychological attraction and explicit conscious judgment. The results showed a consistent divergence rather than a direct correspondence between physiological engagement and psychological preference. While implicit physiological indicators showed peak engagement with the intricate textures of Images I7 and I8, explicit perceptual appraisals were associated with a clear preference for the structural clarity of Image I3, which emphasized material authenticity. Specifically, I3 achieved significantly higher scores in multiple aesthetic dimensions relative to the Control configuration. This pattern implies that instinctive attraction to visual complexity does not necessarily translate into conscious aesthetic approval, as perceptual legibility and psychological ease appear to play a dominant role in explicit evaluation. Rather than confirming a direct functional correspondence, the findings supported the presence of a perceptual divergence during environmental appraisal, consistent with RQ3.
5. Discussion
5.1. The Mechanism of Biophilic Complexity in Subconscious Visual Interest Recurrence
The findings from the physiological tracking suggest that AI-generated schemes with specific biophilic attributes, particularly the integration of color and natural materials (I2 and I5), tend to function as salient drivers of involuntary visual interest recurrence, as reflected by Revisit Count patterns. This phenomenon can be explained through the lens of fractal fluency theory, which posits that the human visual system is evolutionarily adapted to process the fractal geometries prevalent in nature [30]. The visual recurrence observed in I5 and I2 appears to emulate aspects of these natural structures, thereby supporting sustained re-engagement and mitigating the rapid attentional decay observed in the Control design (I1). The elevated Lip Suck scores further indicated that such complexity may trigger an intensified state of pre-conscious cognitive appraisal, wherein physiological and behavioral indicators reflect an implicit engagement in decoding visual richness. Notably, the absence of a strong statistical association between these physiological markers and subjective ratings suggests that this decoding process may operate partially independently from conscious evaluative judgment, rather than being directly governed by explicit appraisal.
5.2. Material Authenticity vs. Graphic Complexity: The Source of Aesthetic Preference
In contrast to the physiological fascination with complex composite designs, the subjective evaluation revealed a notable conscious preference for the material-driven design of Stimulus I3. While complex configurations (such as I7 and I8) provided a higher level of sustained engagement (Dwell Time), I3 was perceived as more aesthetic and restorative. This discrepancy indicates that although complex patterns may facilitate prolonged visual exploration, material authenticity is a dominant contributor to psychological comfort and perceived naturalness. [41]. The modest correlation coefficients obtained in the multimodal analysis further supported the relative independence of these two responses, indicating that gaze-based engagement metrics do not reliably predict perceived aesthetic quality. From an evolutionary perspective, the legibility of natural materials, such as wood and stone, may foster a sense of perceptual safety, whereas highly intricate AI-generated patterns can, under certain conditions, increase visual demand or induce mild cognitive strain at the conscious level.
5.3. Interpreting the Empirical Divergence Between Implicit and Explicit Responses
The observed divergence between instinctive physiological engagement and explicit aesthetic appraisal provides empirical evidence of a misalignment between different evaluative channels. [47]. This research examined this phenomenon through correlation-based analysis, where the generally weak associations between physiological and behavioral indicators and subjective ratings suggested a non-linear relationship rather than a direct correspondence. Critically, this study did not aim to identify a specific neurocognitive mechanism; instead, it focused on a consistent empirical dissociation at the behavioral level to elucidate the phenomenological divergence between different layers of architectural perception rather than the underlying neurocognitive mechanisms.
Focusing on the empirically observed divergence between implicit and explicit evaluative channels, the findings indicated that, within the context of AI-driven biophilic façade design, bottom-up physiological responses to visual complexity do not necessarily translate directly into top-down aesthetic judgments. This pattern reflects the coexistence of parallel processing tendencies in which instinctive sensory attraction and reflective cognitive evaluation follow distinct trajectories within the design-evaluation process. Such an empirical divergence implies that the physiological state of an individual does not serve as a reliable linear predictor of formal aesthetic preference.
The fact that the 95% confidence intervals in the correlation analysis encompassed zero underscores the lack of significant linear correlation between these modalities. This observation aligns with established findings in synthetic media appraisal, where involuntary physiological engagement can coexist alongside independent conscious assessments of credibility or preference [34]. Recognizing this complexity-aesthetic divergence is critical for architectural design research, as it suggests that maximizing physiological attraction alone does not automatically guarantee subjective satisfaction. By anchoring these findings within the Environment-Based Design (EBD) framework, this study highlights the necessity of multi-layered assessment strategies to capture the discrepancy between instinctive response and conscious favor.
5.4. Design Recommendations for Automated Retail Environments
Based on multimodal findings, several design strategies can be proposed for the development of biophilic automated retail interfaces. First, to enhance environmental vitality and attract consumer interest, designers should utilize AI algorithms to generate moderate levels of fractal or visual complexity, leveraging color as a key driver of visual re-engagement. However, to bridge the perceptual gap and ensure consumer comfort, these patterns should be integrated with authentic material textures instead of being used as isolated graphic elements. Second, the sustained engagement observed in I7 and the high visual interest recurrence associated with I5, together with the elevated aesthetic ratings of I3, suggest that a material-first strategy, with pattern serving as a secondary enhancement, may offer a balanced approach to aligning subconscious engagement with conscious preference. These recommendations account for the empirically observed divergence between fascination and favor, highlighting the need to treat physiological engagement and aesthetic satisfaction as complementary but distinct performance dimensions in AI-assisted architectural design.
6. Conclusions
6.1. Principal Findings and Summary
This study offers an initial empirical investigation of AI-generated biophilic façade designs for automated retail environments using a multimodal evaluation framework. Through the integration of eye-tracking observations, facial behavioral analysis, and subjective evaluations, the research identified a consistent divergence between implicit physiological engagement and explicit aesthetic appraisal. The implementation of repeated measures correlation analysis provided quantitative confirmation of this phenomenon, revealing no significant linear relationship between biometric engagement and psychological preference across all investigated dimensions. The results confirmed that biophilic complexity, particularly the integration of color and materials (I2 and I5), functions as a powerful driver of visual interest recurrence (Revisit Count) and deep cognitive processing (RQ1 and RQ2). However, the discovery of the Complexity-Aesthetic Paradox revealed that conscious preference favors material-driven designs (I3) that provide higher structural clarity and perceptual safety (RQ3).
6.2. Theoretical and Practical Contributions
The primary contribution of this research lies in empirically clarifying the conditions under which divergence between implicit physiological engagement and explicit evaluative judgments in architectural façade assessment may be observed without strict cognitive or functional separation. By identifying a consistent discrepancy between implicit physiological indicators derived from eye-tracking and facial expression analysis and explicit semantic differential evaluations, this study advances a design-oriented understanding of how biophilic façade interventions are differentially reflected across behavioral and self-reported measurement modalities. This work further contributes to the empirical operationalization of EBD by illustrating its effectiveness as a guiding framework for integrating AI-generated design variables with multimodal evaluative data.
Specifically, the statistical correlation analysis confirmed a comprehensive lack of linear association between psychological appraisals and facial behavioral markers, including Yaw and Lip Suck. Furthermore, the descriptive misalignment between high-engagement eye-tracking patterns observed in complex designs and the superior aesthetic preference for structural clarity underscores a functional gap in sensory processing.
From a practical perspective, the results offer a scientific foundation for utilizing generative AI in retail design. The findings emphasize that capturing physiological attention through intricate AI-generated patterns does not inherently translate into subjective aesthetic approval. This distinction is critical for designers to avoid a complexity-aesthetic paradox because effective biophilic design must balance the subconscious drive for visual fascination with the conscious requirement for perceptual legibility and psychological ease.
6.3. Limitations and Future Research
Despite the rigorous multimodal design, several limitations should be acknowledged. First, the experimental stimuli consisted of static two-dimensional renderings, which may not fully capture the dynamic and multisensory experience of a real-world automated retail environment. Future studies could employ virtual reality (VR) or field experiments to evaluate biophilic responses in immersive 3D contexts. Second, the sample size of thirty participants, while statistically sufficient for a repeated measures design, may limit the generalizability of the findings to broader demographic groups. Future research should investigate the influence of cultural backgrounds and personal environmental sensitivity on the perceptual gap identified in this study.
Third, physiological data collected via a remote online platform rather than in a laboratory presented certain constraints in terms of data precision and sampling frequency. The observed variability in Revisit Count may be partially attributed to the inherent variability in participants' webcam quality and calibration environments. Furthermore, the platform provided data for each stimulus primarily in an aggregated format, which restricted access to high-granularity raw data for individual participants. This data limitation hindered the execution of certain individual-level inferential statistics for gaze metrics, thereby shifting the analytical focus toward AOI-based descriptive engagement trends.
Fourth, while this study aligned with specific WELL Building Standard concepts, such as Mind and Materials, the interventions were primarily restricted to visual biophilic elements. The current stimuli did not account for other multisensory dimensions prioritized by WELL principles, such as acoustic quality or thermal comfort. Future research should integrate a broader spectrum of environmental stimuli, including soundscapes and other sensory factors, to provide a more holistic evaluation of human response to automated retail environments.
Finally, longitudinal studies are needed to determine whether the observed subconscious attraction toward AI-generated biophilic complexity sustains its effectiveness over prolonged or repeated exposure. Future investigations using high-precision stationary eye trackers in controlled laboratory settings could further refine the AOI-based descriptive patterns underlying architectural cognition.
Funding
This research was supported by the 2023 Research Fund of the Catholic University of Korea and the National Research Foundation of Korea.
Institutional Review Board Statement
The study was approved by the Institutional Review Board of The Catholic University of Korea (Approval No. 1040395-202510-01).
Data Availability Statement
The data presented in this study are available from the corresponding author upon reasonable request.
Conflicts of Interest
The authors declare no conflicts of interest.
References
- International WELL Building Institute. The WELL Building Standard v2. International WELL Building Institute. Httpswww.Wellcertified.Comcertificationv2. 2020. [Google Scholar]
- Marberry, S.O.; Guenther, R.; Berry, L.L. Advancing Human Health, Safety, and Well-Being with Healthy Buildings. J Hosp Manag Health Policy 2022, 6, 18–18. [Google Scholar] [CrossRef]
- Zhang, Z.; Zhuo, K.; Wei, W.; Li, F.; Yin, J.; Xu, L. Emotional Responses to the Visual Patterns of Urban Streets: Evidence from Physiological and Subjective Indicators. IJERPH 2021, 18, 9677. [Google Scholar] [CrossRef]
- Kokatnur, T.; Faris, F.; Gunay, B.; O’Brien, W.; Azar, E. The WELL Building Standard: A Literature Review and Bibliometric Analysis of a Nascent Field. Journal of Building Engineering 2025, 103, 112121. [Google Scholar] [CrossRef]
- Kellert, S.R.; Heerwagen, J.H.; Mador, M.L. Biophilic Design: The Theory, Science and Practice of Bringing Buildings to Life; John Wiley & Sons: Hoboken, NJ, USA, 2008; p. 5. [Google Scholar]
- Ulrich, R.S. Aesthetic and Affective Response to Natural Environment. In Behavior and the Natural Environment; Altman, I., Wohlwill, J.F., Eds.; Springer US: Boston, MA, 1983; pp. 85–125. ISBN 978-1-4613-3541-2. [Google Scholar]
- Ryan, C.O.; Browning, W.D.; Clancy, J.O.; Andrews, S.L.; Kallianpurkar, N.B. BIOPHILIC DESIGN PATTERNS: Emerging Nature-Based Parameters for Health and Well-Being in the Built Environment. ArchNet-IJAR 2014, 8, 62. [Google Scholar] [CrossRef]
- Tekin, B.H.; Izmir Tunahan, G.; Disci, Z.N.; Ozer, H.S. Biophilic Design in the Built Environment: Trends, Gaps and Future Directions. Buildings 2025, 15, 2516. [Google Scholar] [CrossRef]
- Tabassum, R. R.; Park, J. Development of a Building Evaluation Framework for Biophilic Design in Architecture; Buildings, 2024. [Google Scholar]
- Zare, G.; Faizi, M.; Baharvand, M.; Masnavi, M. A Review of Biophilic Design Conception Implementation in Architecture. JDBE 2021, 21, 16–36. [Google Scholar] [CrossRef]
- Nam, Y.; Lee, S.; Lee, H. Consumer Preferences for Unmanned Stores: A Choice Experiment Study. Journal of Retailing and Consumer Services 2025, 82, 104061. [Google Scholar] [CrossRef]
- Majid, Z.K. Exterior Façade Design and Its Impact on Boosting Business and Attracting Customers in Retail Sectors. Journal of Design, Business & Society 2022, 8, 69–86. [Google Scholar] [CrossRef]
- Kim, N. Capturing Initial Gaze Attraction in Branded Spaces Through VR Eye-Tracking Technology. International Journal of Human–Computer Interaction 2024, 1–14. [Google Scholar] [CrossRef]
- Kim, N.; Lee, H. Assessing Consumer Attention and Arousal Using Eye-Tracking Technology in Virtual Retail Environment. Front. Psychol. 2021, 12, 665658. [Google Scholar] [CrossRef] [PubMed]
- Yun, J.; Chen, J.; Li, Y.; Kim, N. Visual Attention and Emotional Response to Biophilic Design in Unmanned Stores: A Pilot Study Using Multimodal Biometric and Semantic Differential Methods. In Proceedings of the 2024 Autumn Conference of the Korean Institute of Interior Design 2024, 26, 395–400. [Google Scholar]
- Yun, J.; Kim, N. Environment-Based Prompt Framework for AI-Generated Façade Design. Journal of Integrated Design and Process Science 2025. [Google Scholar]
- Maria, C.; Hollander, J.B. Urban Façades and Human Stress: Evaluating Façades’ Texture and Layout. Building Research & Information 2025, 53, 1039–1057. [Google Scholar] [CrossRef]
- Li, Z.; Sun, X.; Zhao, S.; Zuo, H. Integrating Eye-Movement Analysis and the Semantic Differential Method to Analyze the Visual Effect of a Traditional Commercial Block in Hefei, China. Frontiers of Architectural Research 2021, 10, 317–331. [Google Scholar] [CrossRef]
- Kim, J.; Kim, N. Quantifying Emotions in Architectural Environments Using Biometrics. Applied Sciences 2022, 12, 9998. [Google Scholar] [CrossRef]
- Lu, Z.; Pesarakli, H. Seeing Is Believing: Using Eye-Tracking Devices in Environmental Research. HERD 2023, 16, 15–52. [Google Scholar] [CrossRef]
- Ullah, S.; Ou, J.; Xie, Y.; Tian, W. Facial Expression Recognition (FER) Survey: A Vision, Architectural Elements, and Future Directions. PeerJ Computer Science 2024, 10, e2024. [Google Scholar] [CrossRef]
- Holmqvist, K.; Andersson, R. Eye Tracking: A Comprehensive Guide to Methods, Paradigms and Measures. 2017, 3(5). [Google Scholar]
- Alturki, B.; Yafooz, W.M.S.; Alsaeedi, A. Advances in Facial Emotion Recognition: A Comprehensive Review. In Proceedings of the 2025 1st International Conference on Computational Intelligence Approaches and Applications (ICCIAA), Amman, Jordan, April 28 2025; IEEE; pp. 1–7. [Google Scholar]
- Essa, I.A. Analysis, Interpretation and Synthesis of Facial Expressions. In Massachusetts Institute of Technology; MA, USA: Cambridge, 1995. [Google Scholar]
- Bedon, C.; Mattei, S. Facial Expression-Based Experimental Analysis of Human Reactions and Psychological Comfort on Glass Structures in Buildings. Buildings 2021, 11, 204. [Google Scholar] [CrossRef]
- Kim, N.; Gero, J.S. Neurophysiological Responses to Biophilic Design: A Pilot Experiment Using VR and EEG. In Design Computing and Cognition’22; Gero, J.S., Ed.; Springer International Publishing: Cham, 2023; pp. 235–253. ISBN 978-3-031-20417-3. [Google Scholar]
- Zeng, Y. Environment-Based Design (EBD): A Methodology for Transdisciplinary Design+. JID 2015, 19, 5–24. [Google Scholar] [CrossRef]
- Zeng, Y.; Cheng, G.D. On the Logic of Design. Design Studies 1991, 12, 137–141. [Google Scholar] [CrossRef]
- Kellert, S.R.; Calabrese, E.F. The PracTice of BioPhilic Design; Terrapin Bright Green LLC: NY, USA, 2015. [Google Scholar]
- Zhong, W.; Schröder, T.; Bekkering, J. Biophilic Design in Architecture and Its Contributions to Health, Well-Being, and Sustainability: A Critical Review. Frontiers of Architectural Research 2022, 11, 114–141. [Google Scholar] [CrossRef]
- Browning, W.D.; Ryan, C.O.; Clancy, J.O. 14 Patterns of Biophilic Design: Improving Health and Well-Being in the Built Environment; Terrapin Bright Green LLC: NY, USA, 2014. [Google Scholar]
- Zeng, Y. Environment-Based Design (EBD). In Proceedings of the, Washington, DC, USA, January 1 2011; ASMEDC; Volume 9, pp. 237–250. [Google Scholar]
- Coburn, A.; Kardan, O.; Kotabe, H.; Steinberg, J.; Hout, M.C.; Robbins, A.; MacDonald, J.; Hayn-Leichsenring, G.; Berman, M.G. Psychological Responses to Natural Patterns in Architecture. Journal of Environmental Psychology 2019, 62, 133–145. [Google Scholar] [CrossRef]
- Lee, J.; John, K.K. Detecting Deepfakes Through Emotion?: Facial Expression and Emotional Contagion as Dual Indicators of Deepfake Credibility. Applied Cognitive Psychology 2025, 39, e70141. [Google Scholar] [CrossRef]
- Wang, X.; Che, B.; Zhu, R. Eye-Tracking and Psychological Analysis: The Impact of Building Shape on Visitor Visual Preference. Buildings 2024, 14, 2733. [Google Scholar] [CrossRef]
- Wang, Z.; Shen, M.; Huang, Y. Combining Eye-Tracking Technology and Subjective Evaluation to Determine Building Facade Color Combinations and Visual Quality. Applied Sciences 2024, 14, 8227. [Google Scholar] [CrossRef]
- Zamani, M.; Kheirollahi, M.; Vafaee, F. Evaluating the Impact of Architectural Space on Human Emotions Using Biometrics Data.
- Macruz, A.; Bueno, E.; Sol, G.; Vega, J.; Palmieri, R.; Zhao, B. Designing for Well-Being: Using Facial Micro-Expression Analysis and EEG Biosensor to Evaluate Human Responses to 2D Biophilically-Driven Geometries. Frontiers of Architectural Research 2024, 13, 219–234. [Google Scholar] [CrossRef]
- Jung, D.; Kim, D.I.; Kim, N. Bringing Nature into Hospital Architecture: Machine Learning-Based EEG Analysis of the Biophilia Effect in Virtual Reality. Journal of Environmental Psychology 2023, 89, 102033. [Google Scholar] [CrossRef]
- Roman, D.; Follese, H.; Schotz, J.; Wang, S.; Mell, J.; Lighthall, N. Deciphering Trust: Multi-Modal Affective Analysis in Dynamic Decision-Making Games. [CrossRef]
- Fu, H.; Wang, P.; Zhou, J.; Zhang, S.; Li, Y. Investigating Influence of Visual Elements of Arcade Buildings and Streetscapes on Place Identity Using Eye-Tracking and Semantic Differential Methods. Buildings 2023, 13, 1580. [Google Scholar] [CrossRef]
- Jun, J.; Lazic, M.; Woodruff, E. The Influence of Conscientiousness and Context on the Emotional Response during Understanding. Front. Psychol. 2025, 16, 1589709. [Google Scholar] [CrossRef] [PubMed]
- Yun, J.; Kim, N. Biophilic Building Envelopes in Urban Infrastructure: Visual Attention and Subjective Evaluation of Façade Design of Power and Energy Facilities. JKIID 2025, 34, 40–54. [Google Scholar] [CrossRef]
- Cohen, J. A Power Primer. Psychol. Bull 1992, 112, 155–159. [Google Scholar] [CrossRef]
- Cumming, G.; Fidler, F.; Vaux, D.L. Error Bars in Experimental Biology. The Journal of Cell Biology 2007, 177, 7–11. [Google Scholar] [CrossRef] [PubMed]
- Makram, A.; Abou Ouf, T. Biomimetic and Biophilic Design as an Approach to Innovative Sustainable Architectural Design. In Proceedings of the AR-UP, 2019. [Google Scholar]
- Schooler, J.W.; Smallwood, J.; Christoff, K.; Handy, T.C.; Reichle, E.D.; Sayette, M.A. Meta-Awareness, Perceptual Decoupling and the Wandering Mind. Trends in Cognitive Sciences 2011, S1364661311000878. [Google Scholar] [CrossRef]
Figure 1.
EBD-driven research framework for AI-generated biophilic façade evaluation.
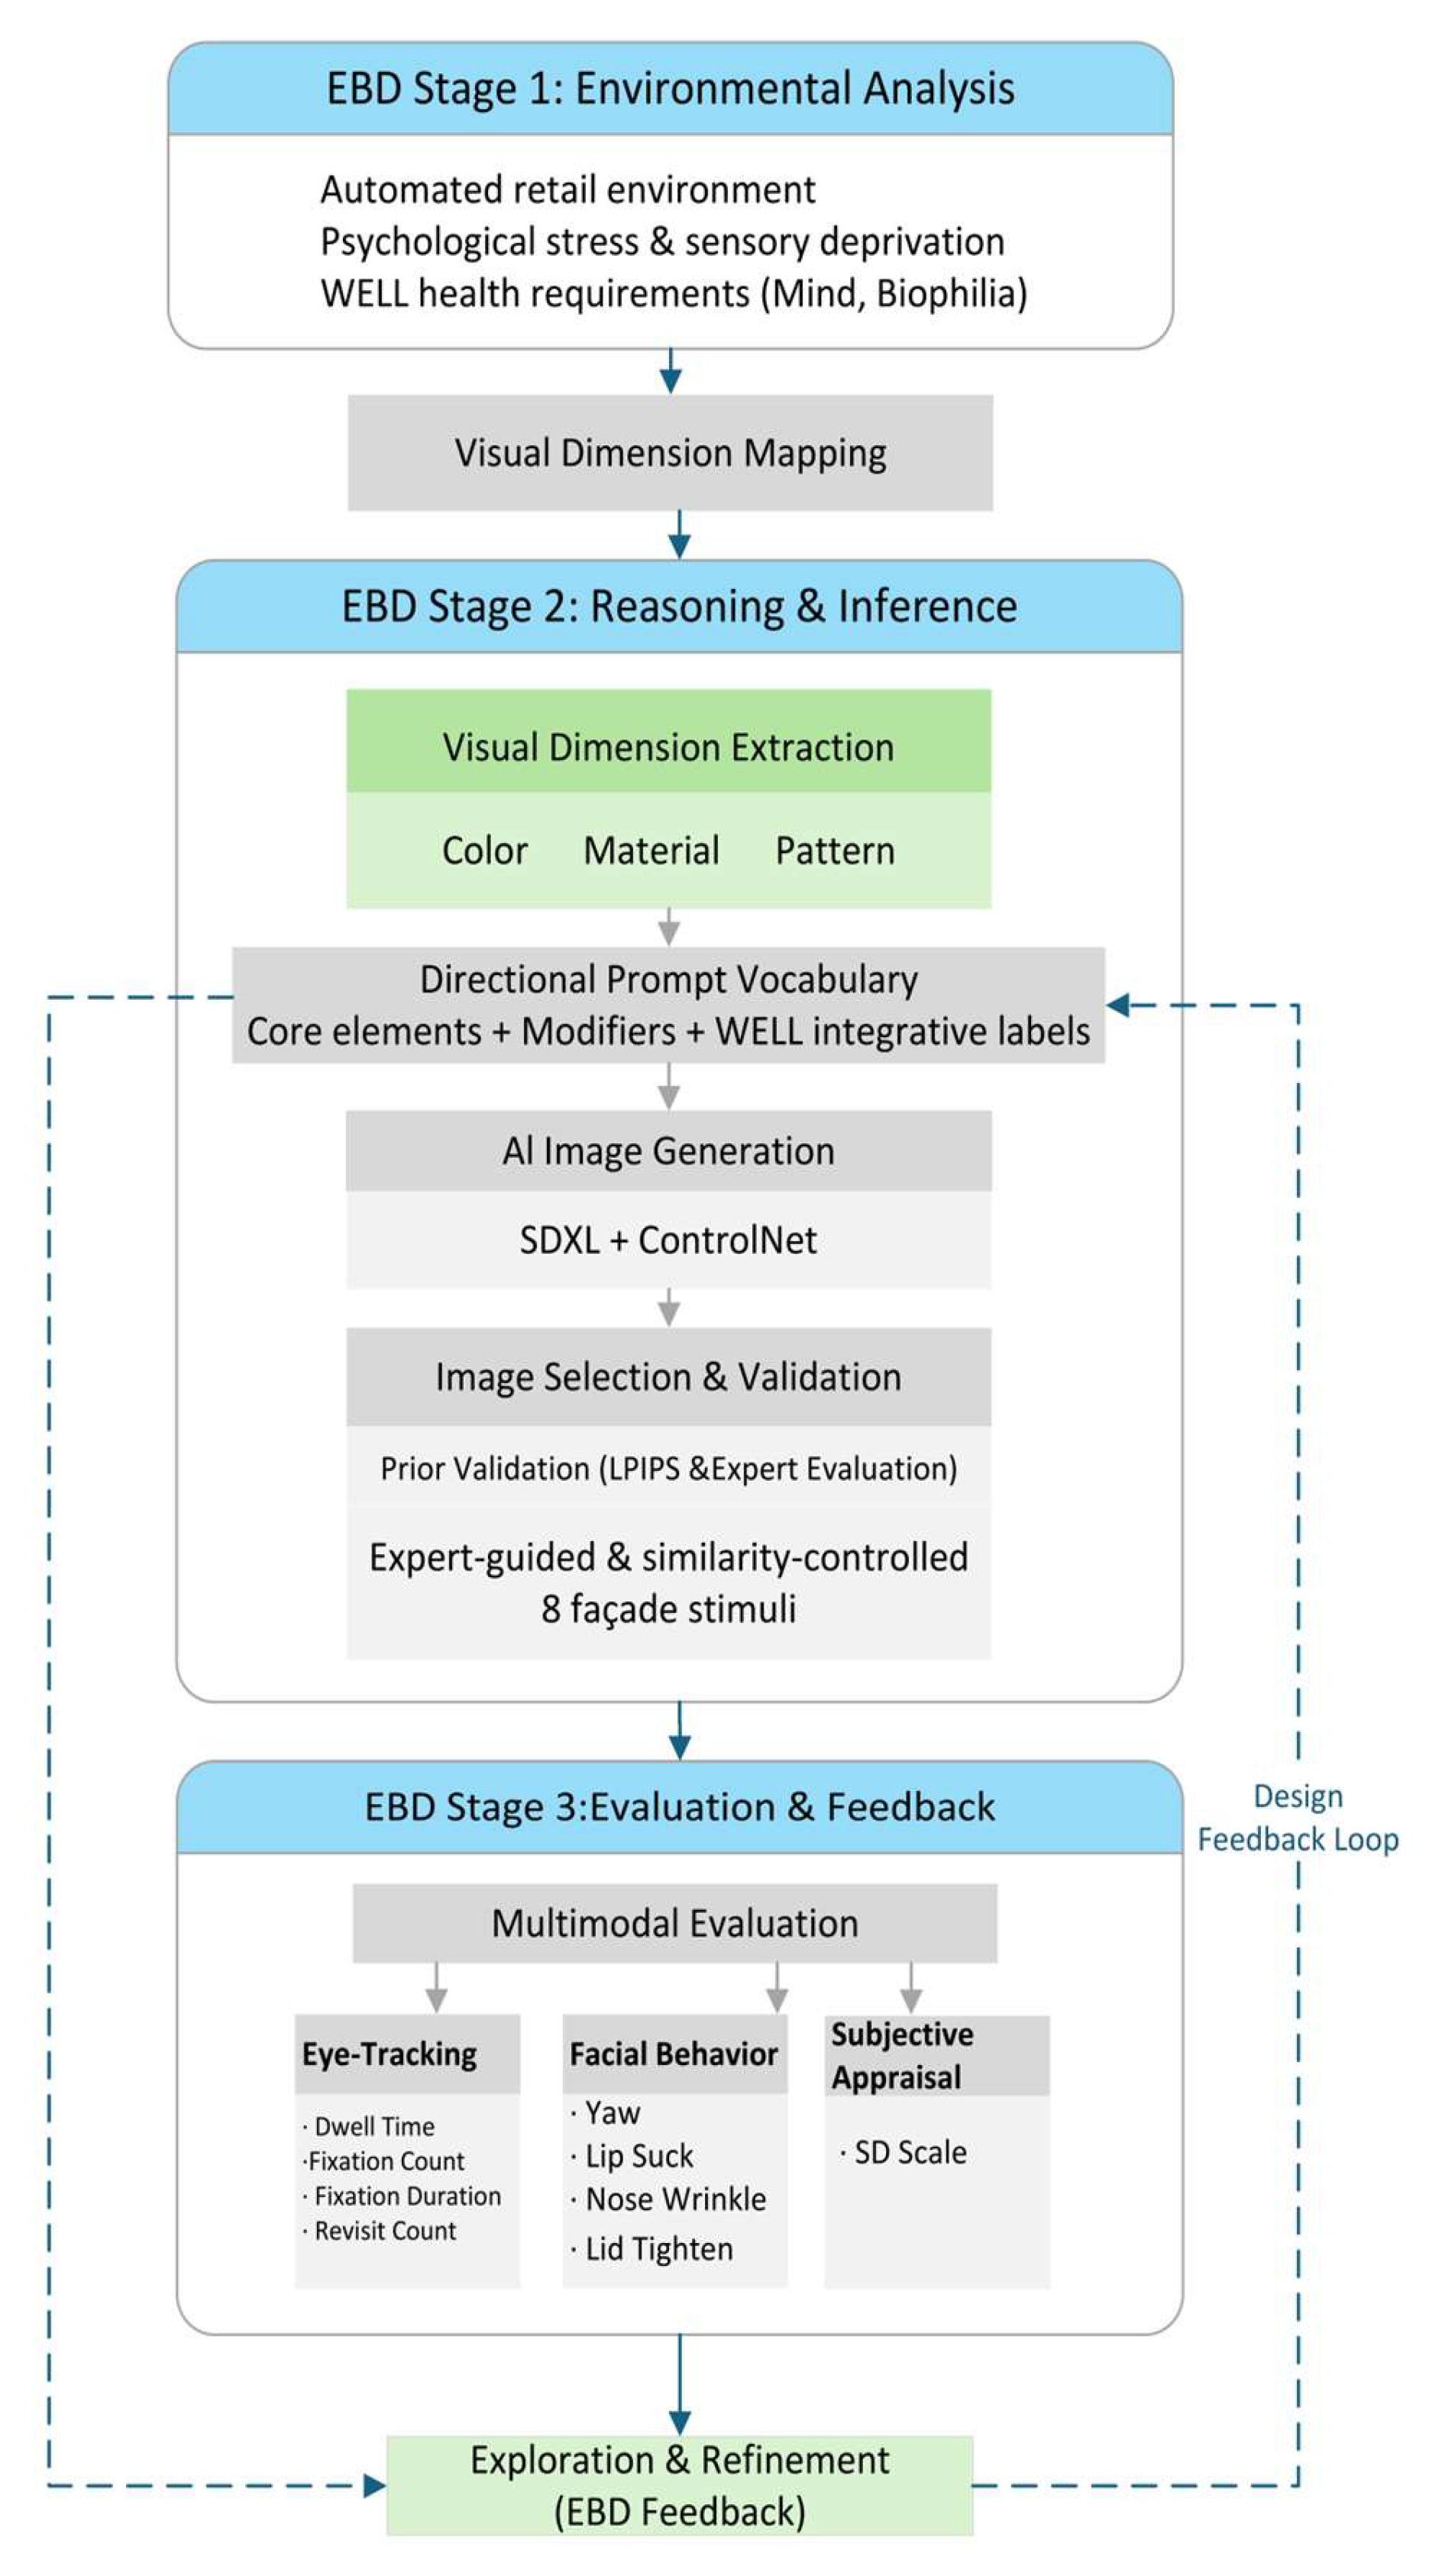
Figure 2.
Design conditions for experimental stimuli.
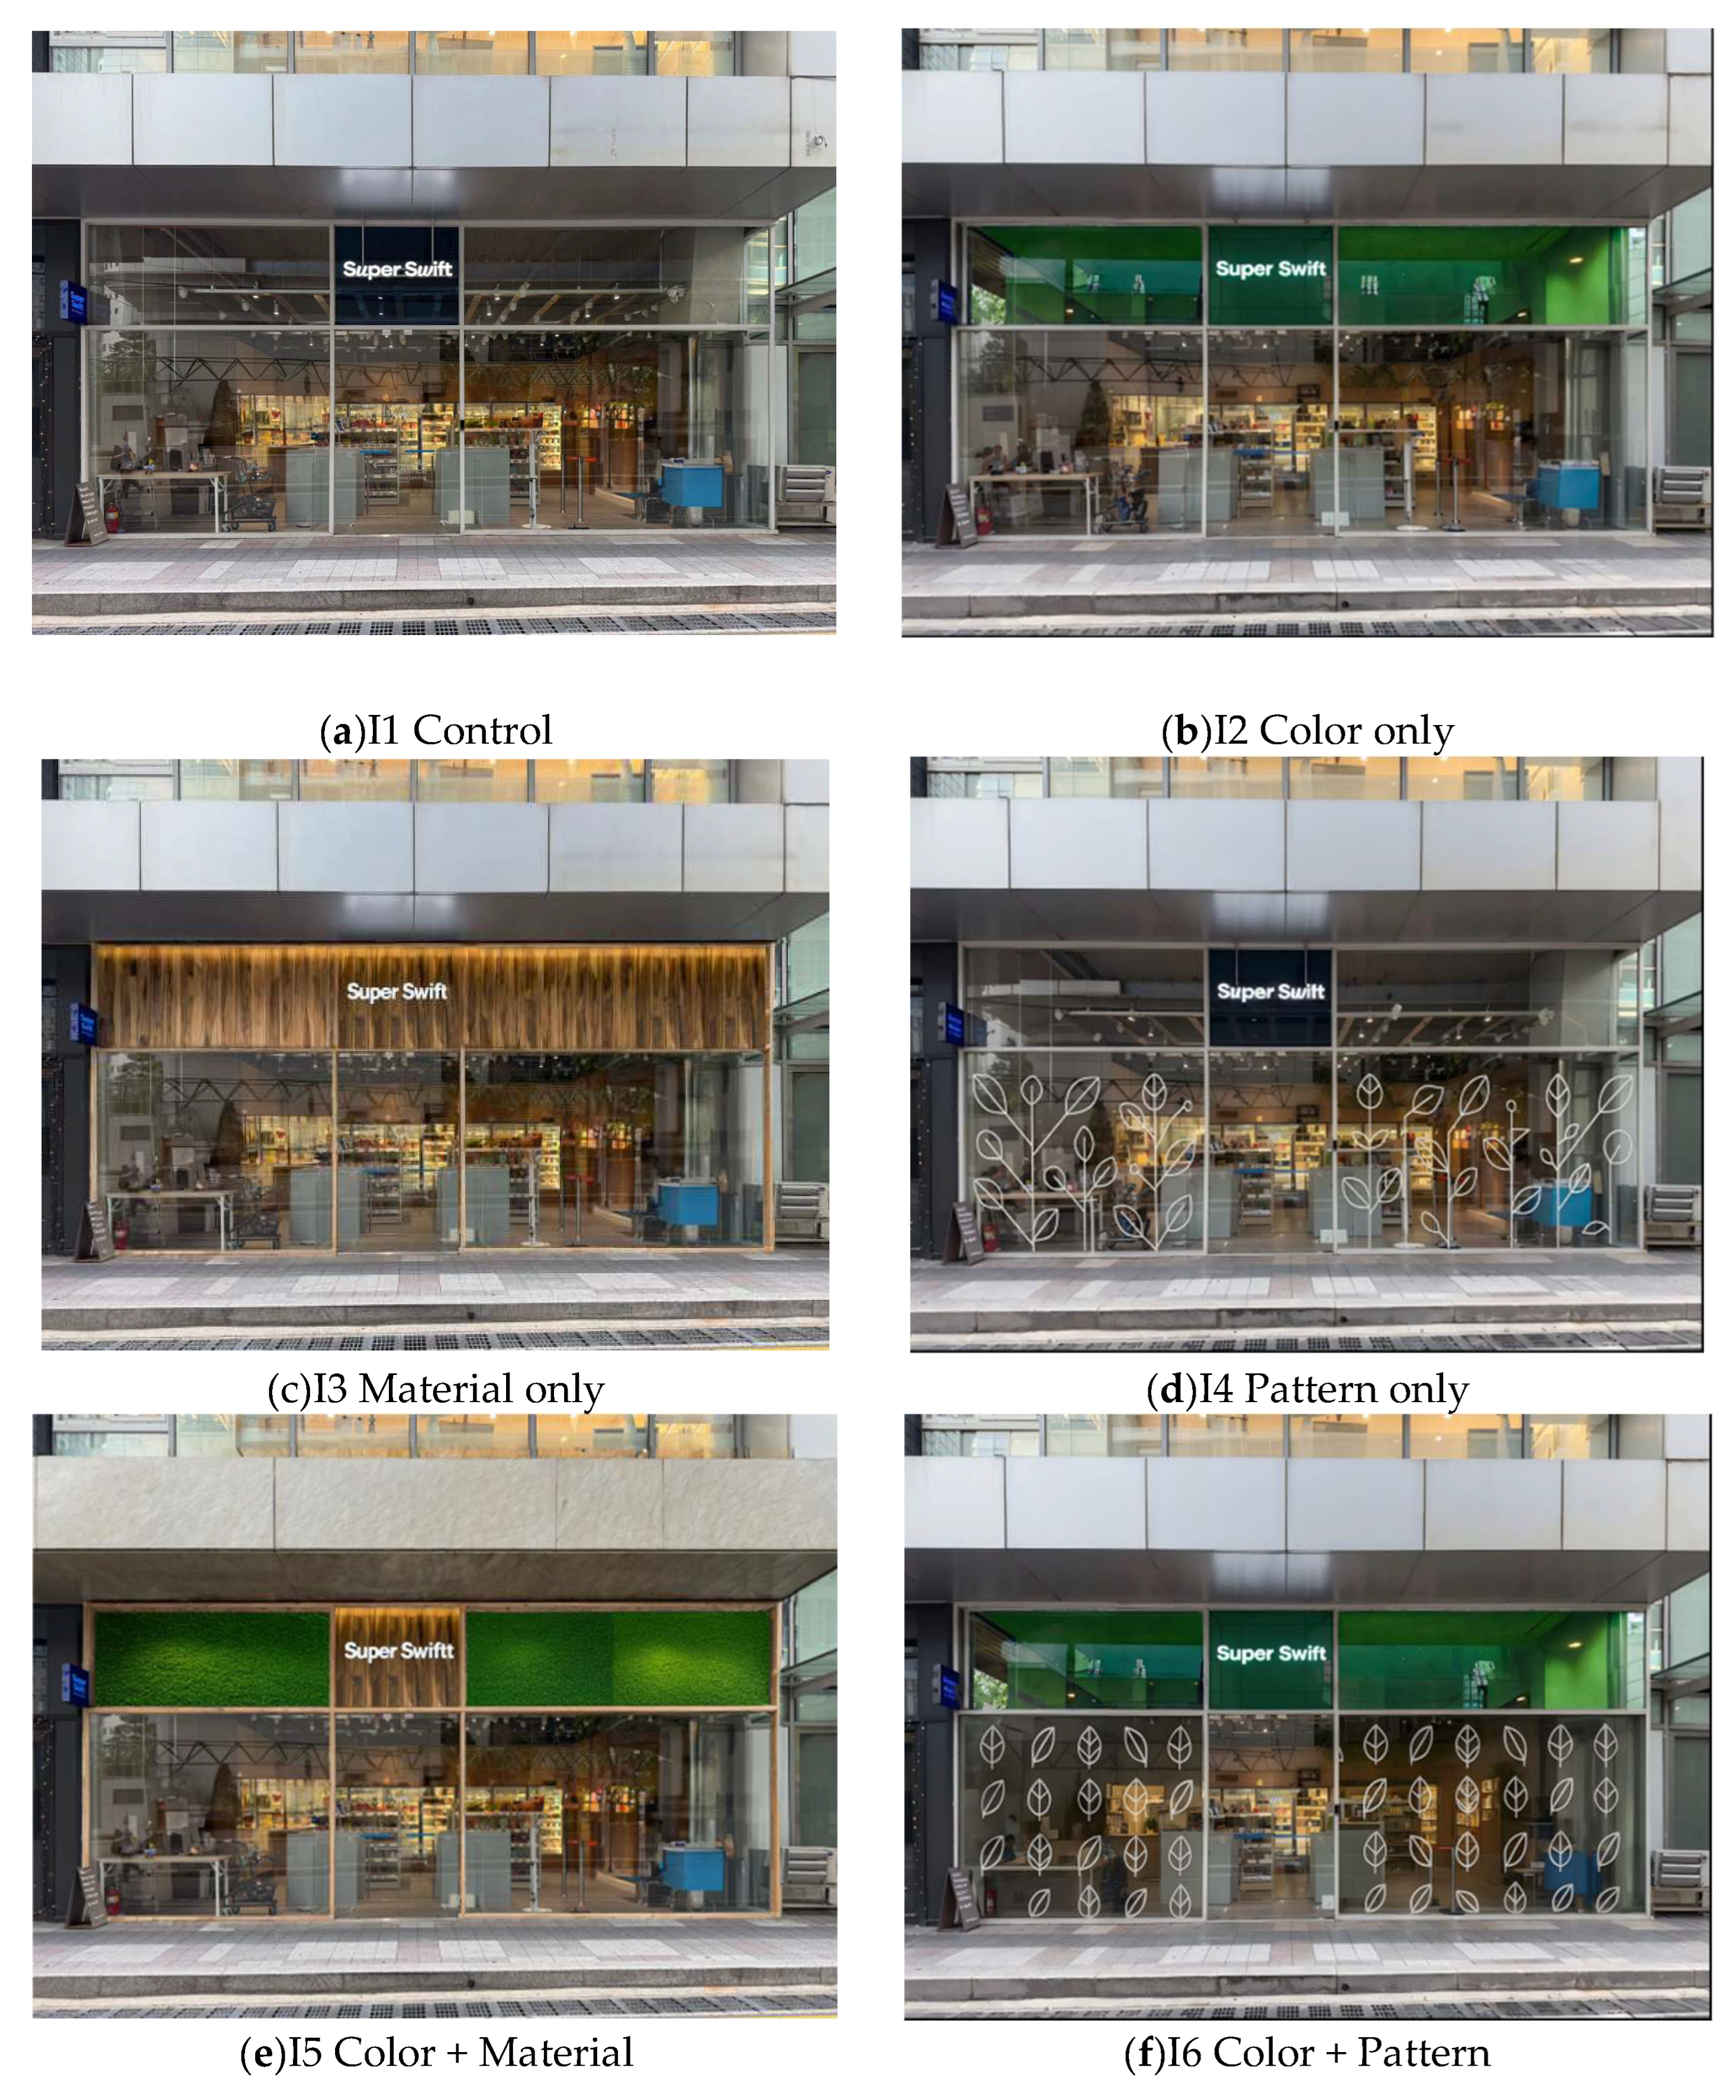
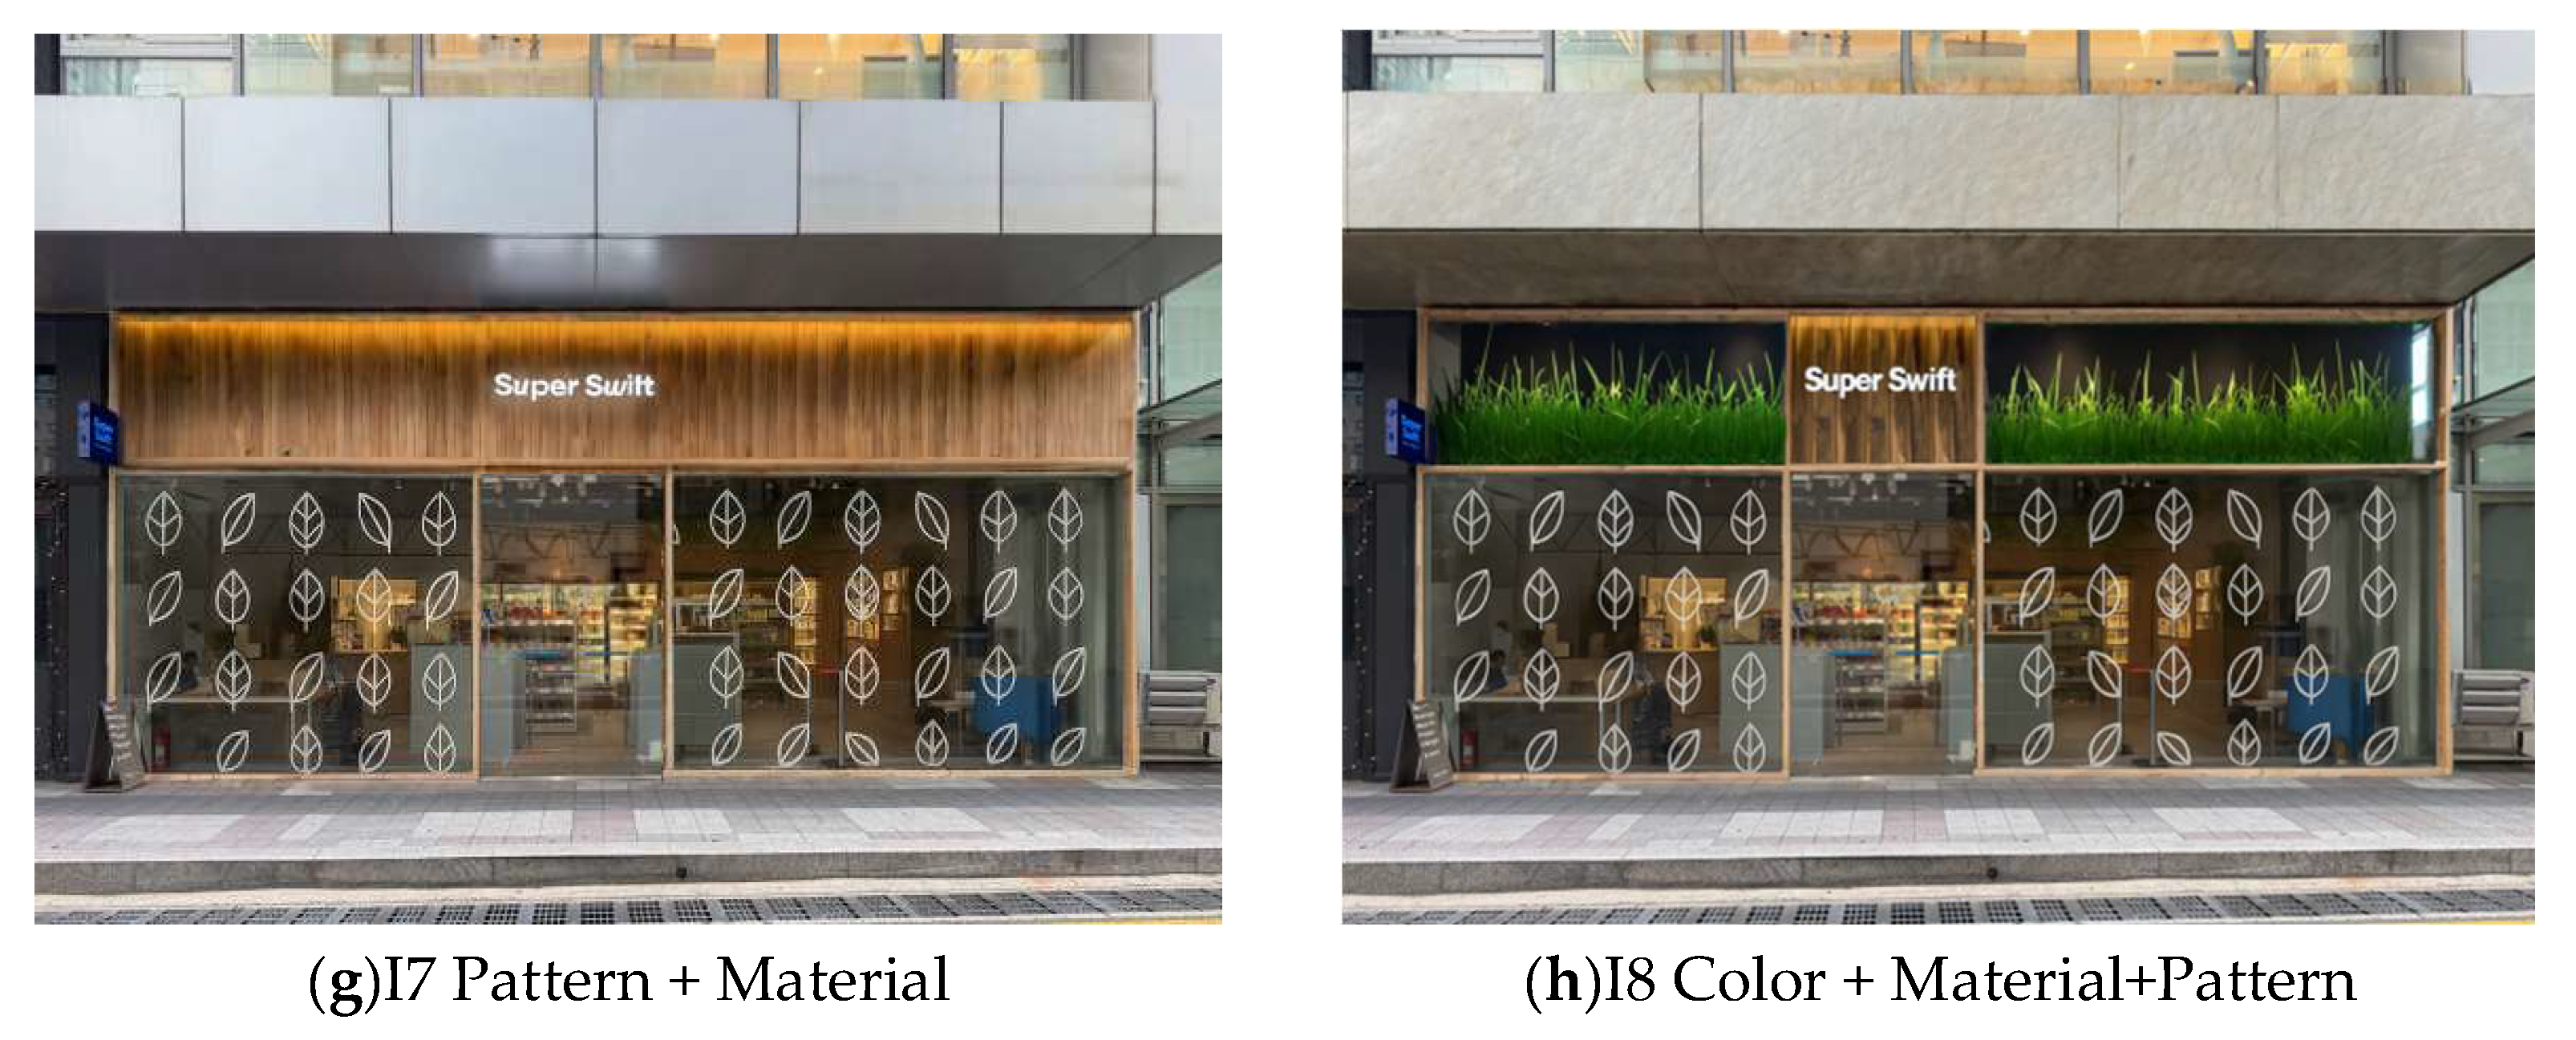
Figure 3.
Remote Experimental Setup and Multimodal Data Acquisition Interface.
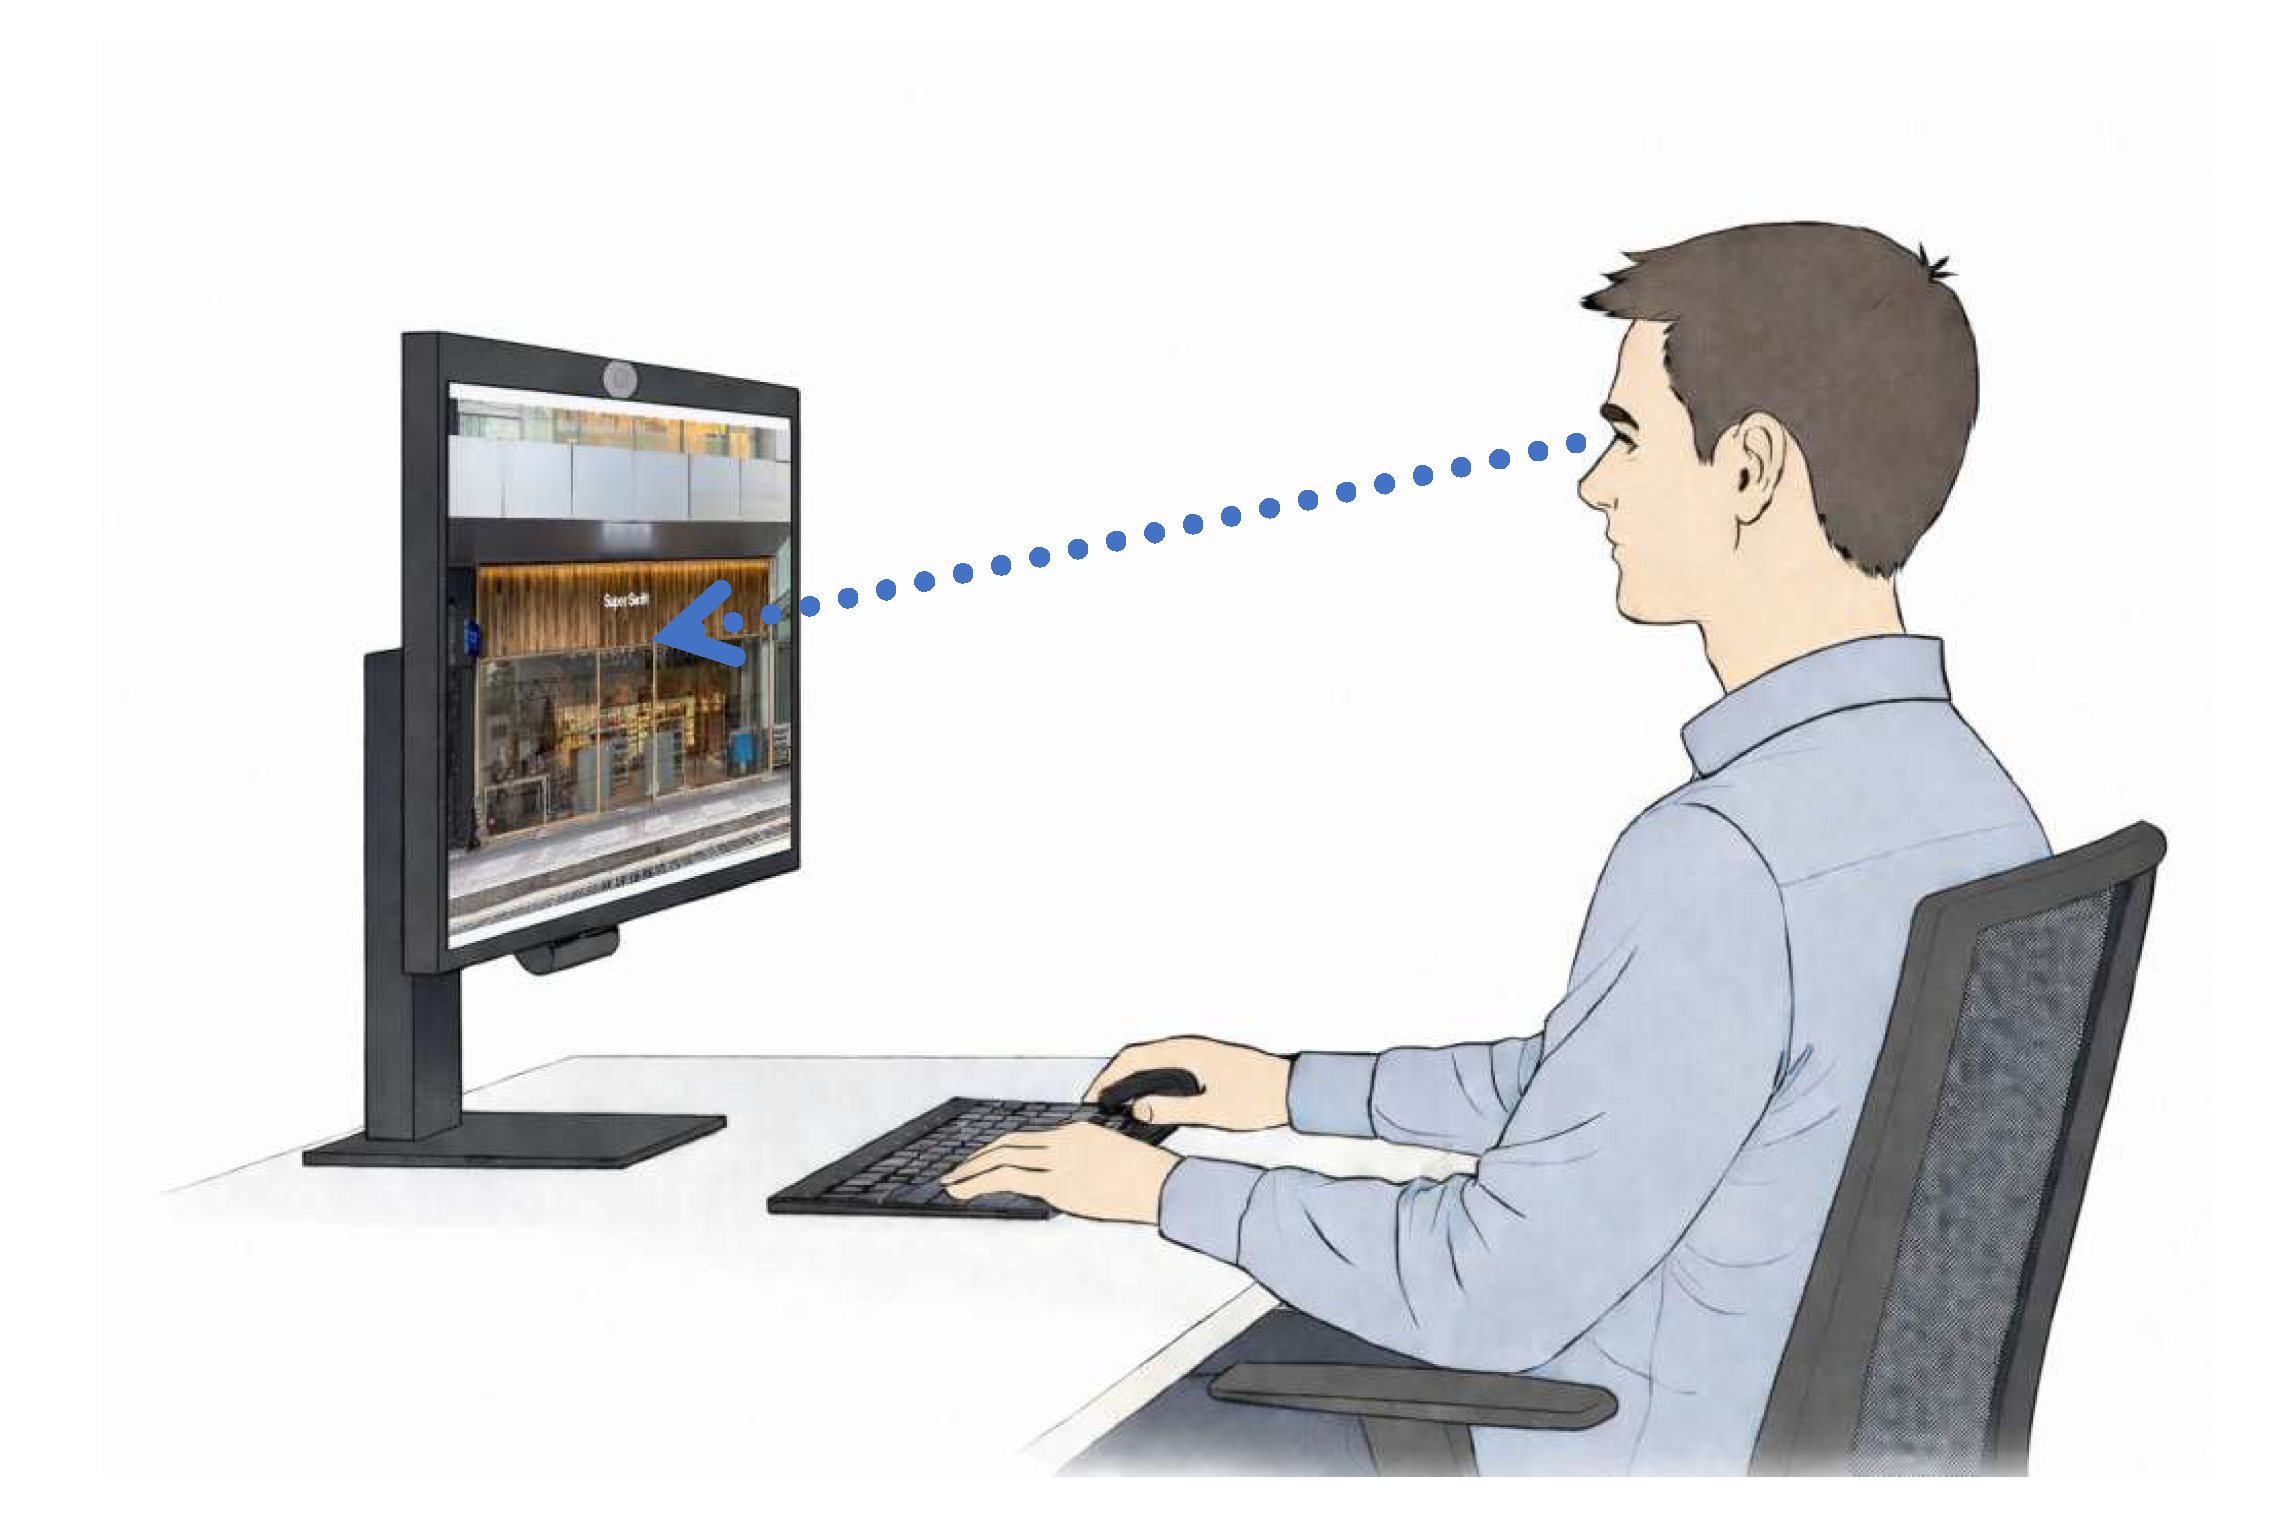
Figure 5.
Heatmaps from eye tracking.
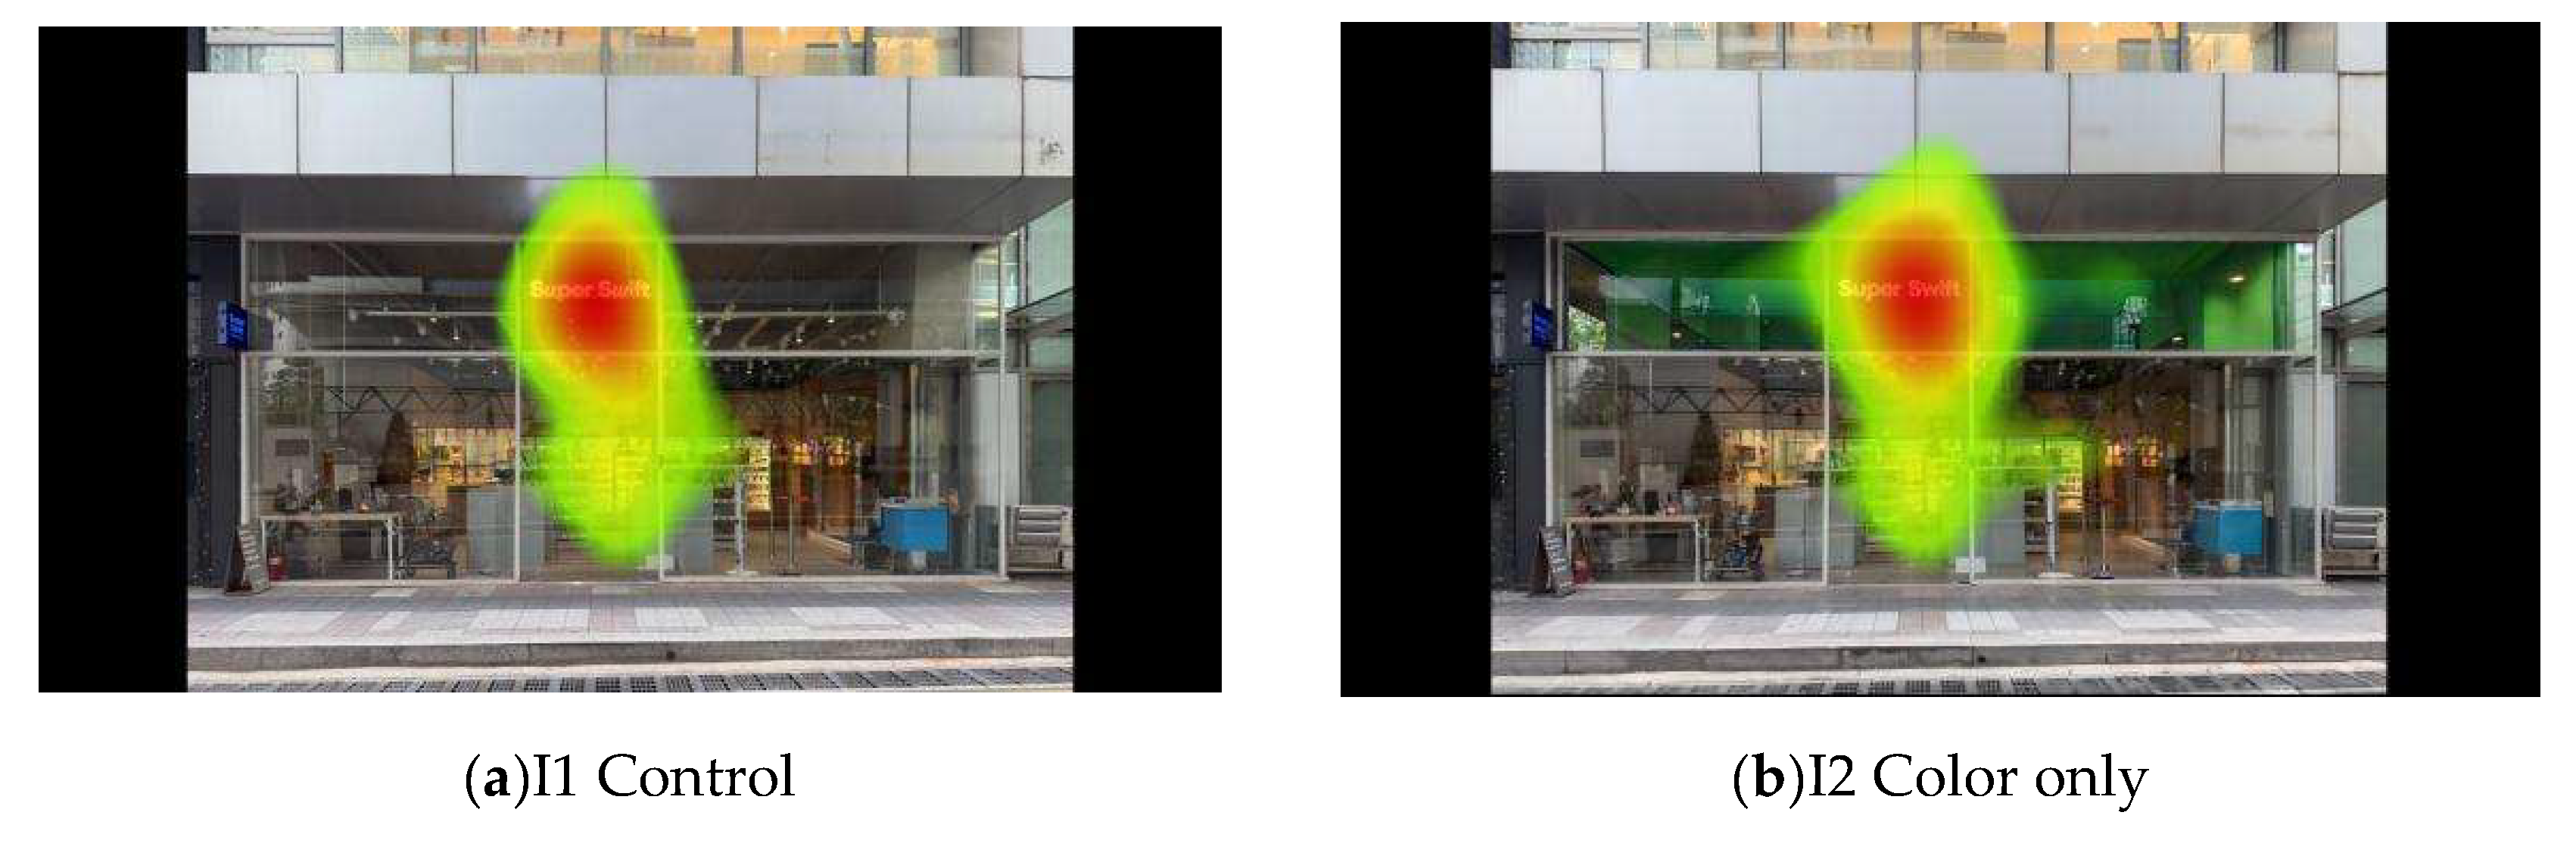
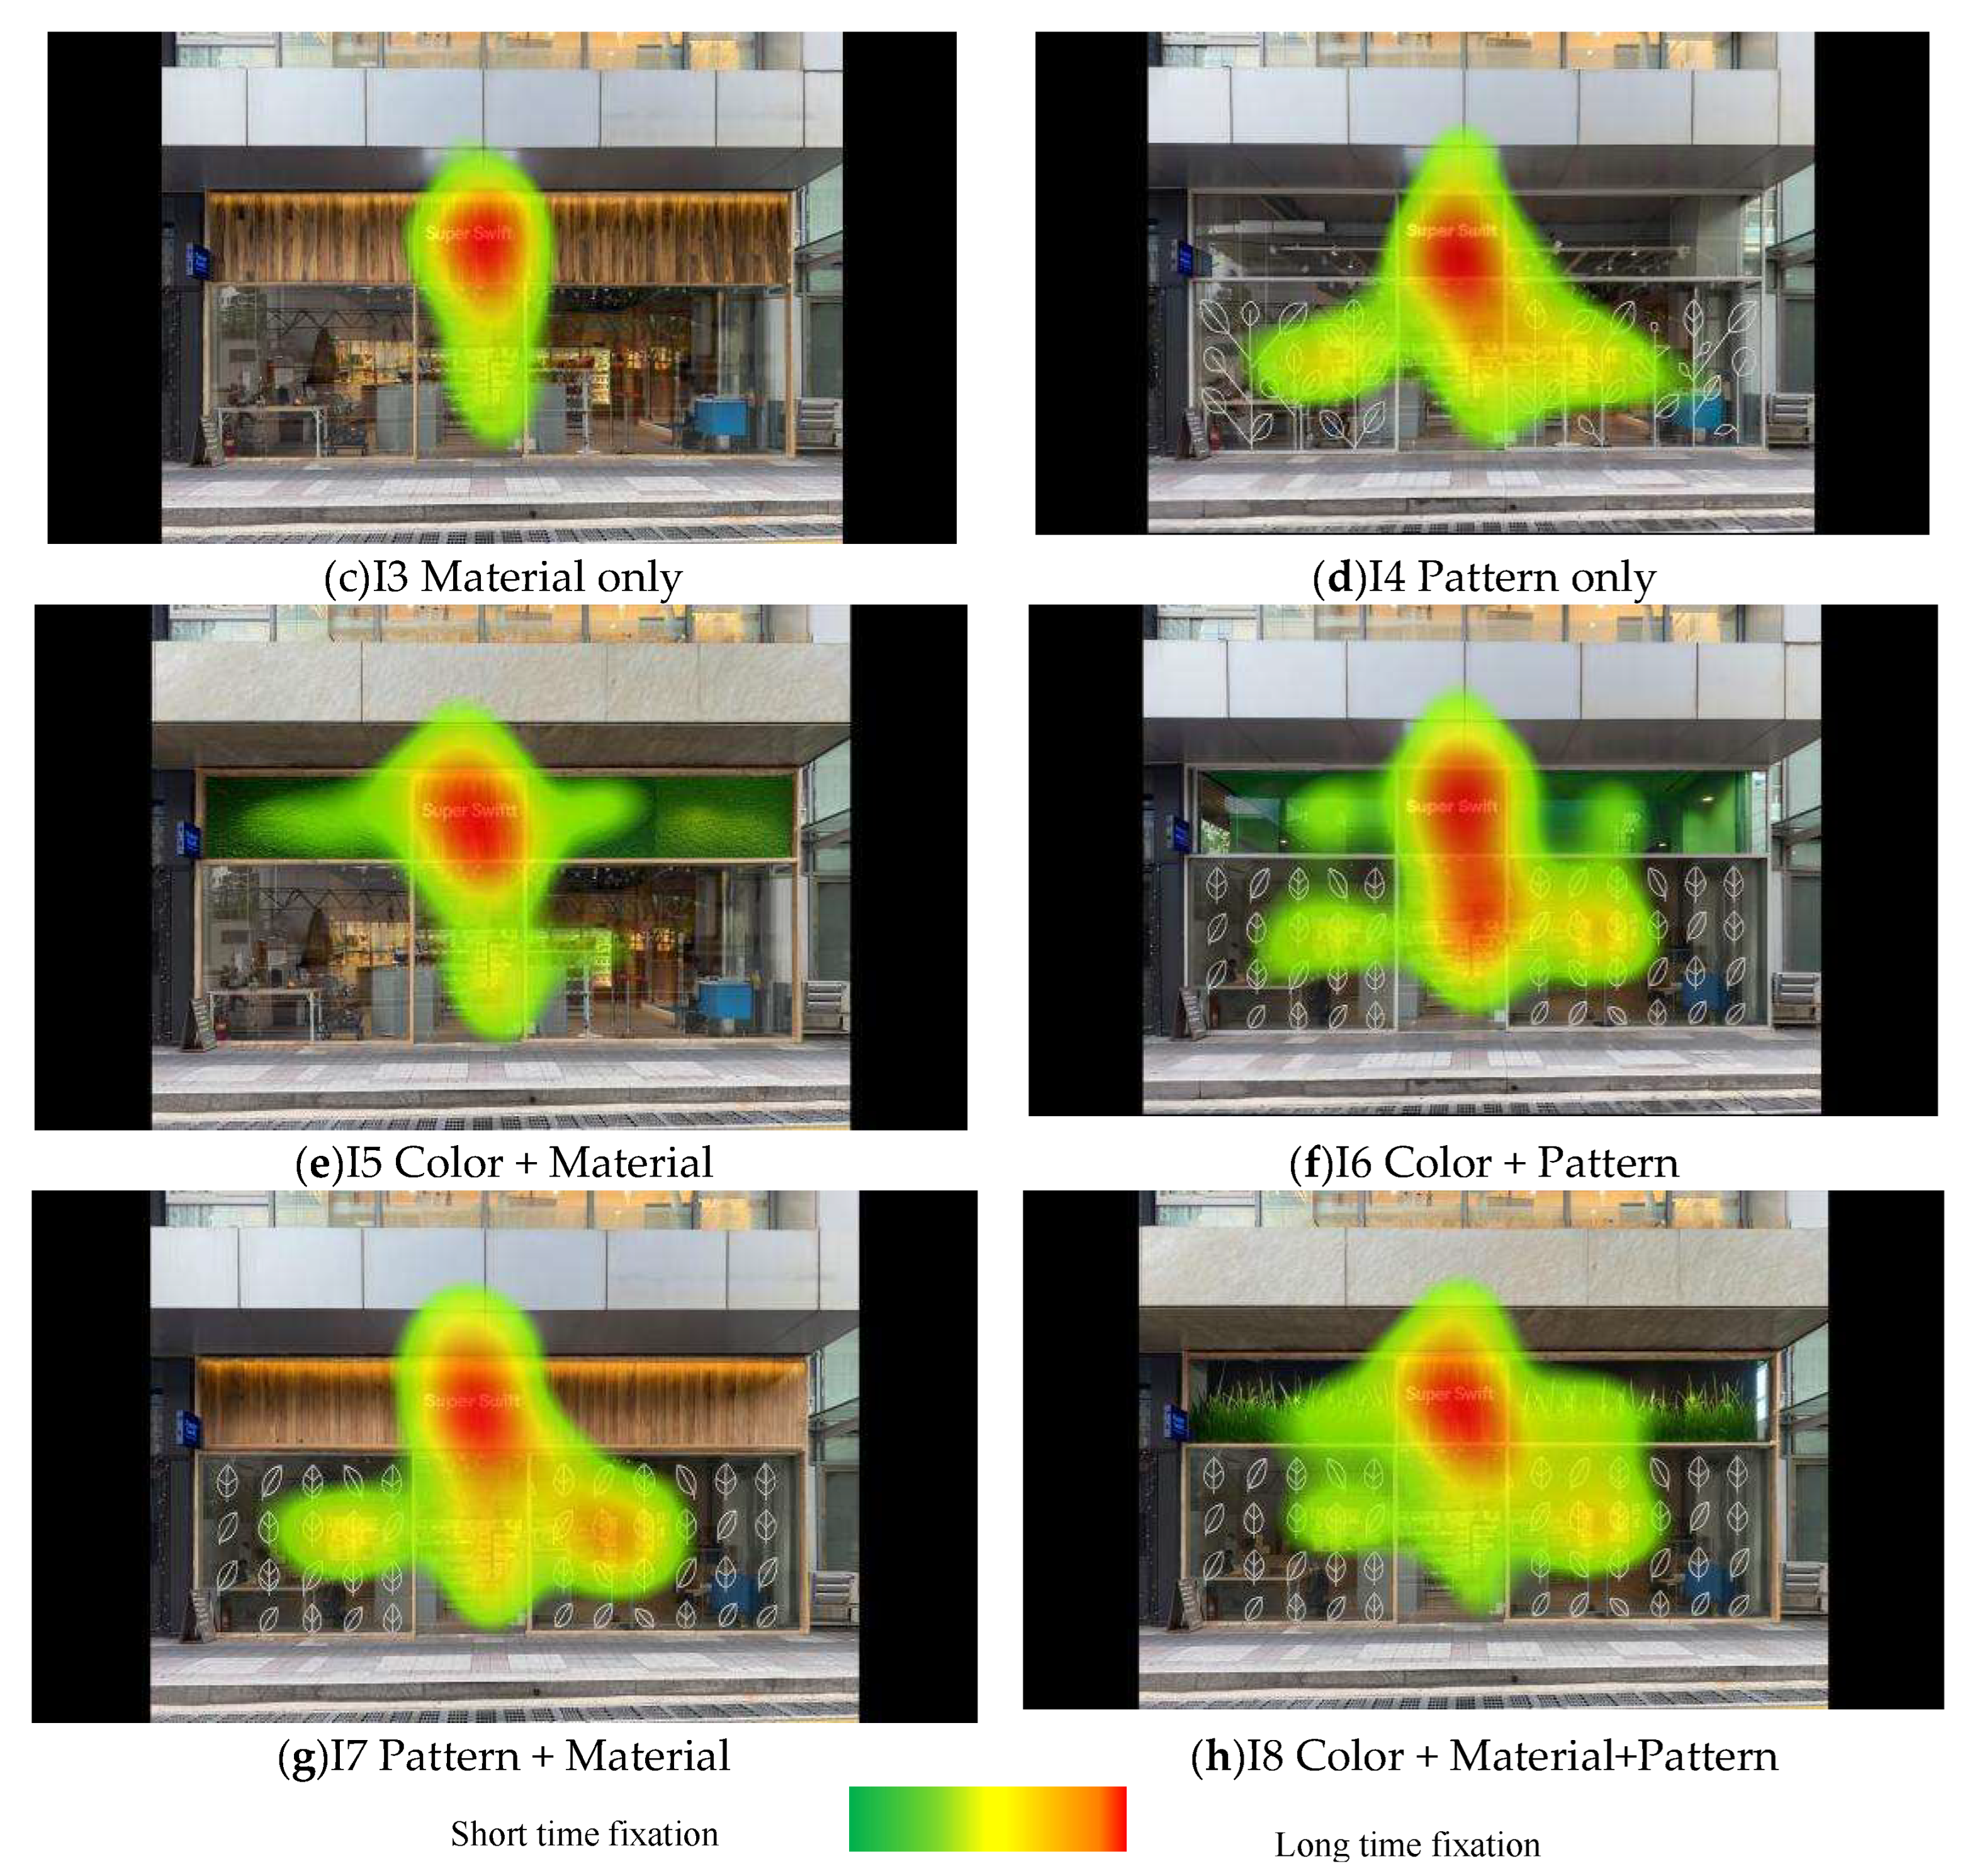
Figure 6.
Comparative analysis of normalized eye-tracking metrics across segmented Areas of Interest (AOIs) for the eight biophilic façade variations: (a) AOI 1 (Glass Façade); (b) AOI 2 (Signage Sides); (c) AOI 3 (Signage Area).
Figure 6.
Comparative analysis of normalized eye-tracking metrics across segmented Areas of Interest (AOIs) for the eight biophilic façade variations: (a) AOI 1 (Glass Façade); (b) AOI 2 (Signage Sides); (c) AOI 3 (Signage Area).
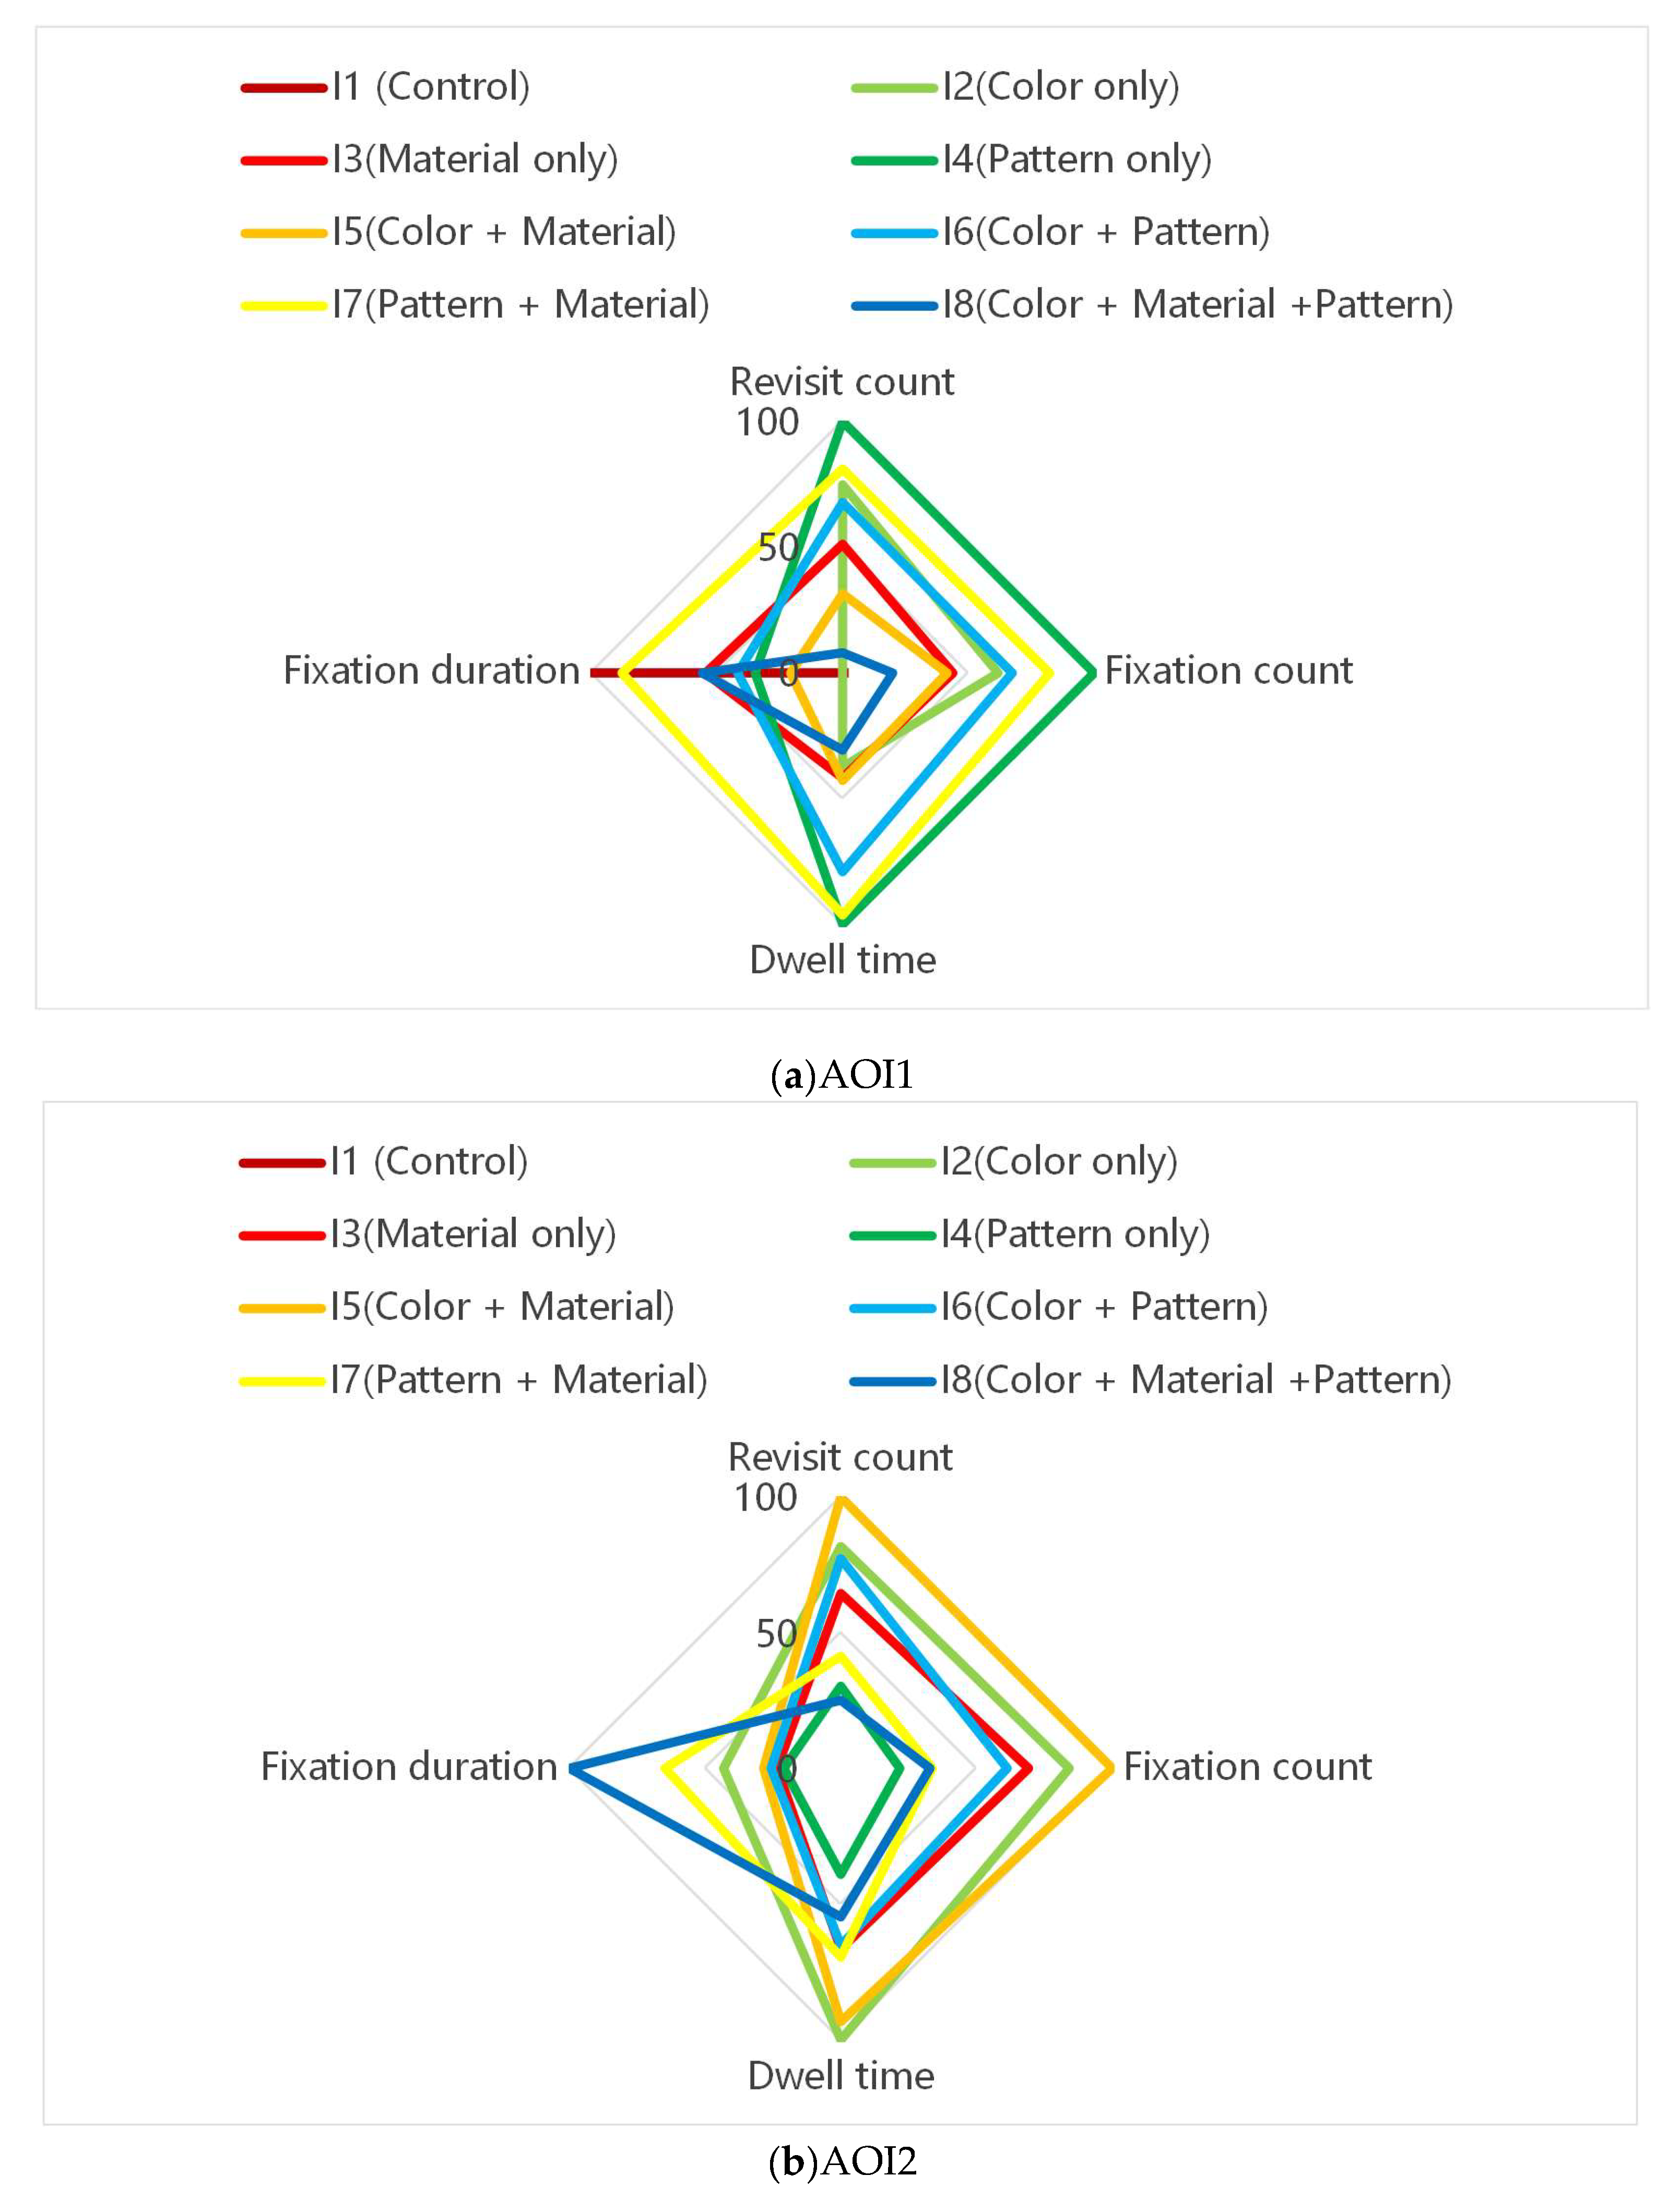
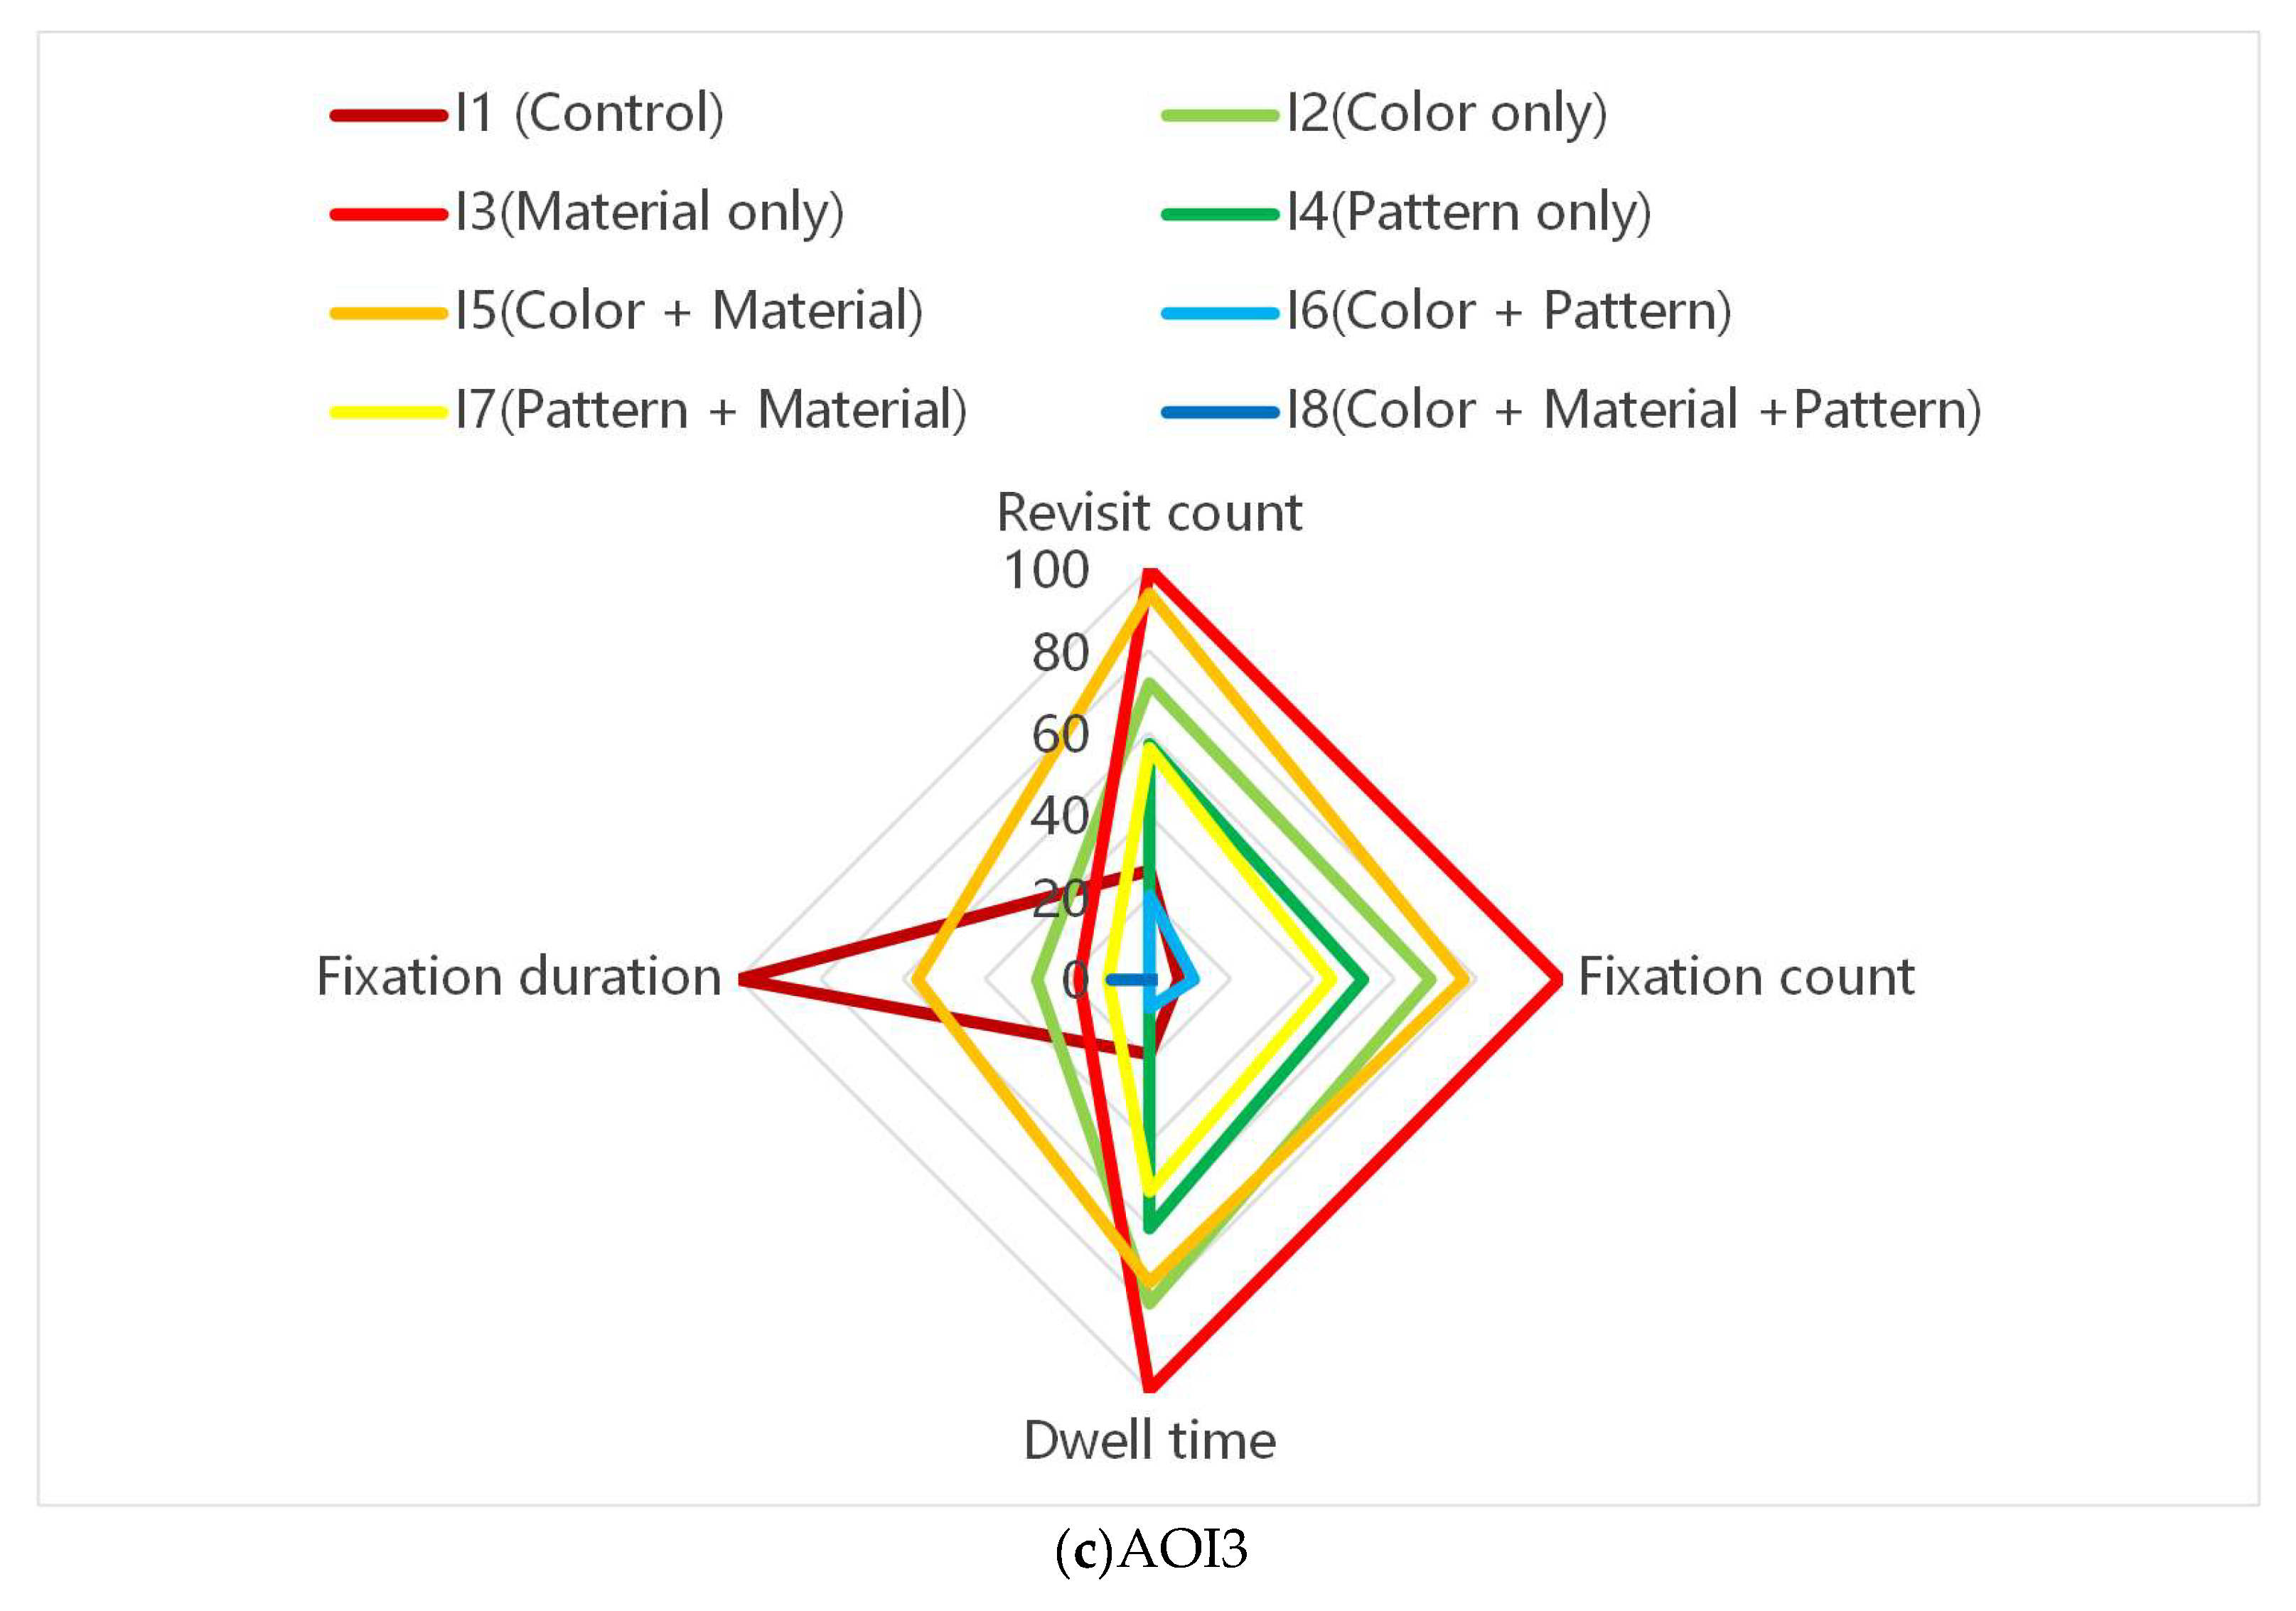
Figure 7.
Mean scores of physiological and behavioral markers (Yaw, Lip Suck, Nose Wrinkle, and Lid Tighten) across eight design stimuli. Error bars represent the standard error of the mean (SEM).
Figure 7.
Mean scores of physiological and behavioral markers (Yaw, Lip Suck, Nose Wrinkle, and Lid Tighten) across eight design stimuli. Error bars represent the standard error of the mean (SEM).
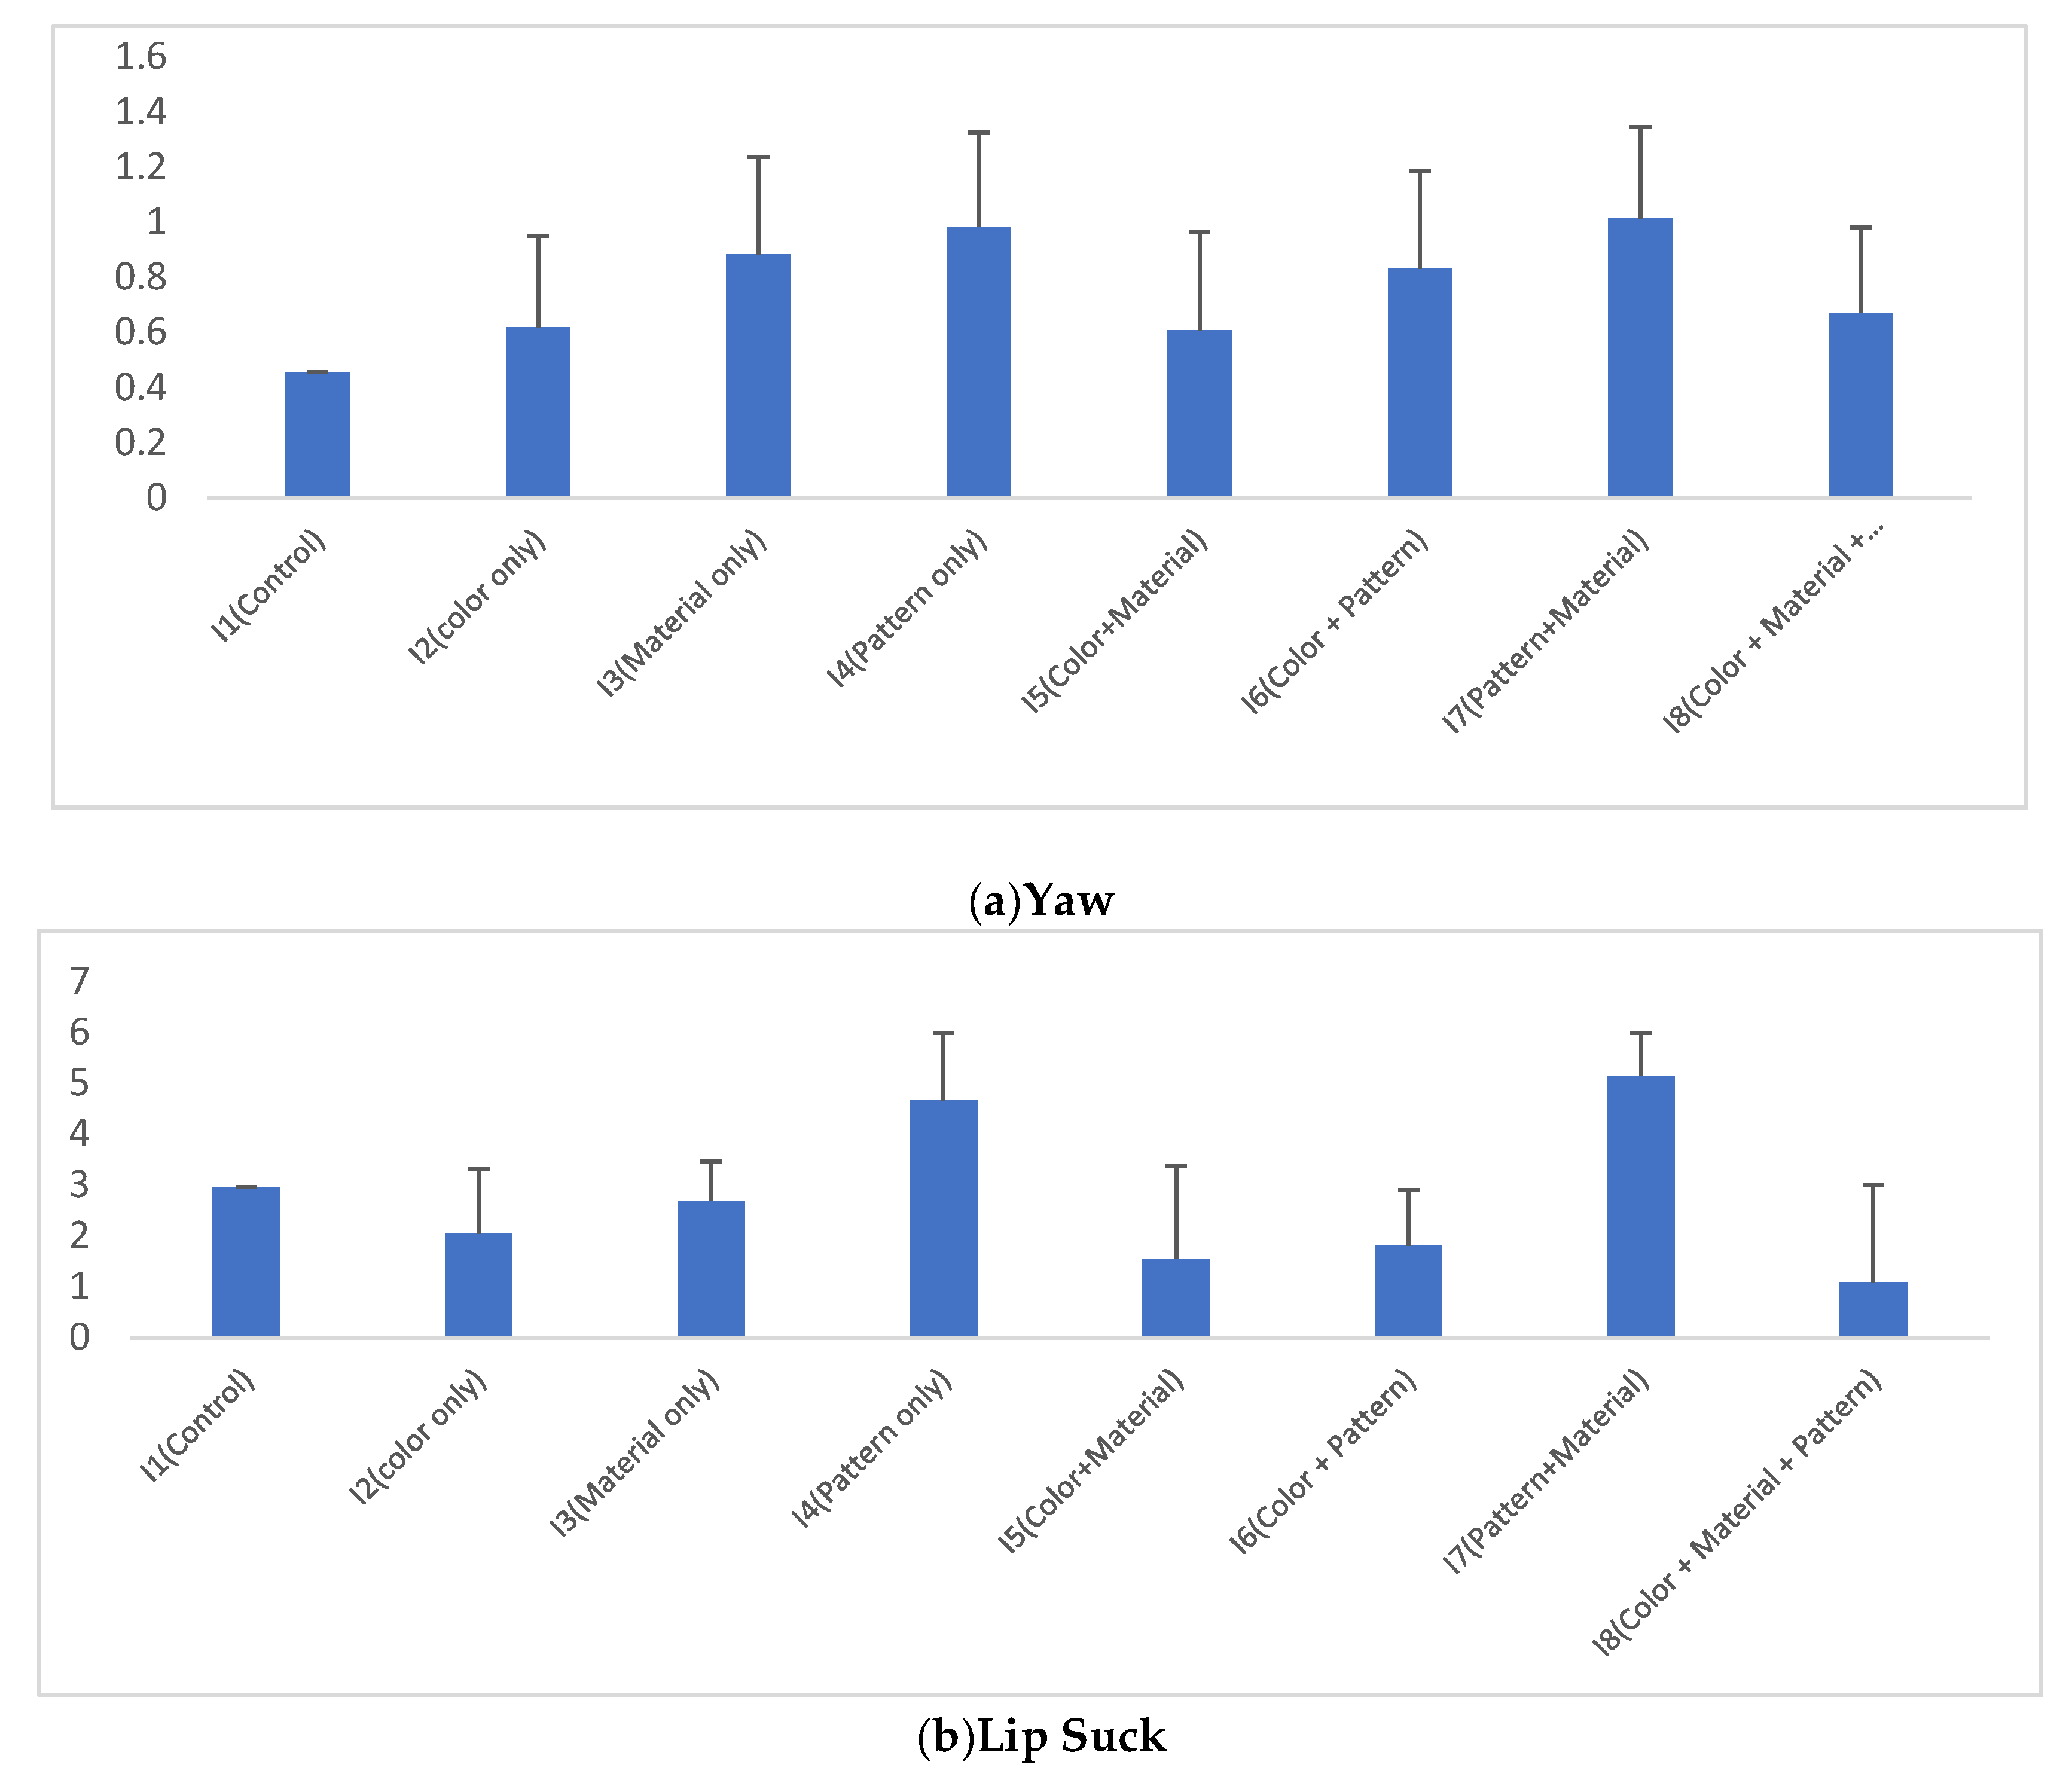
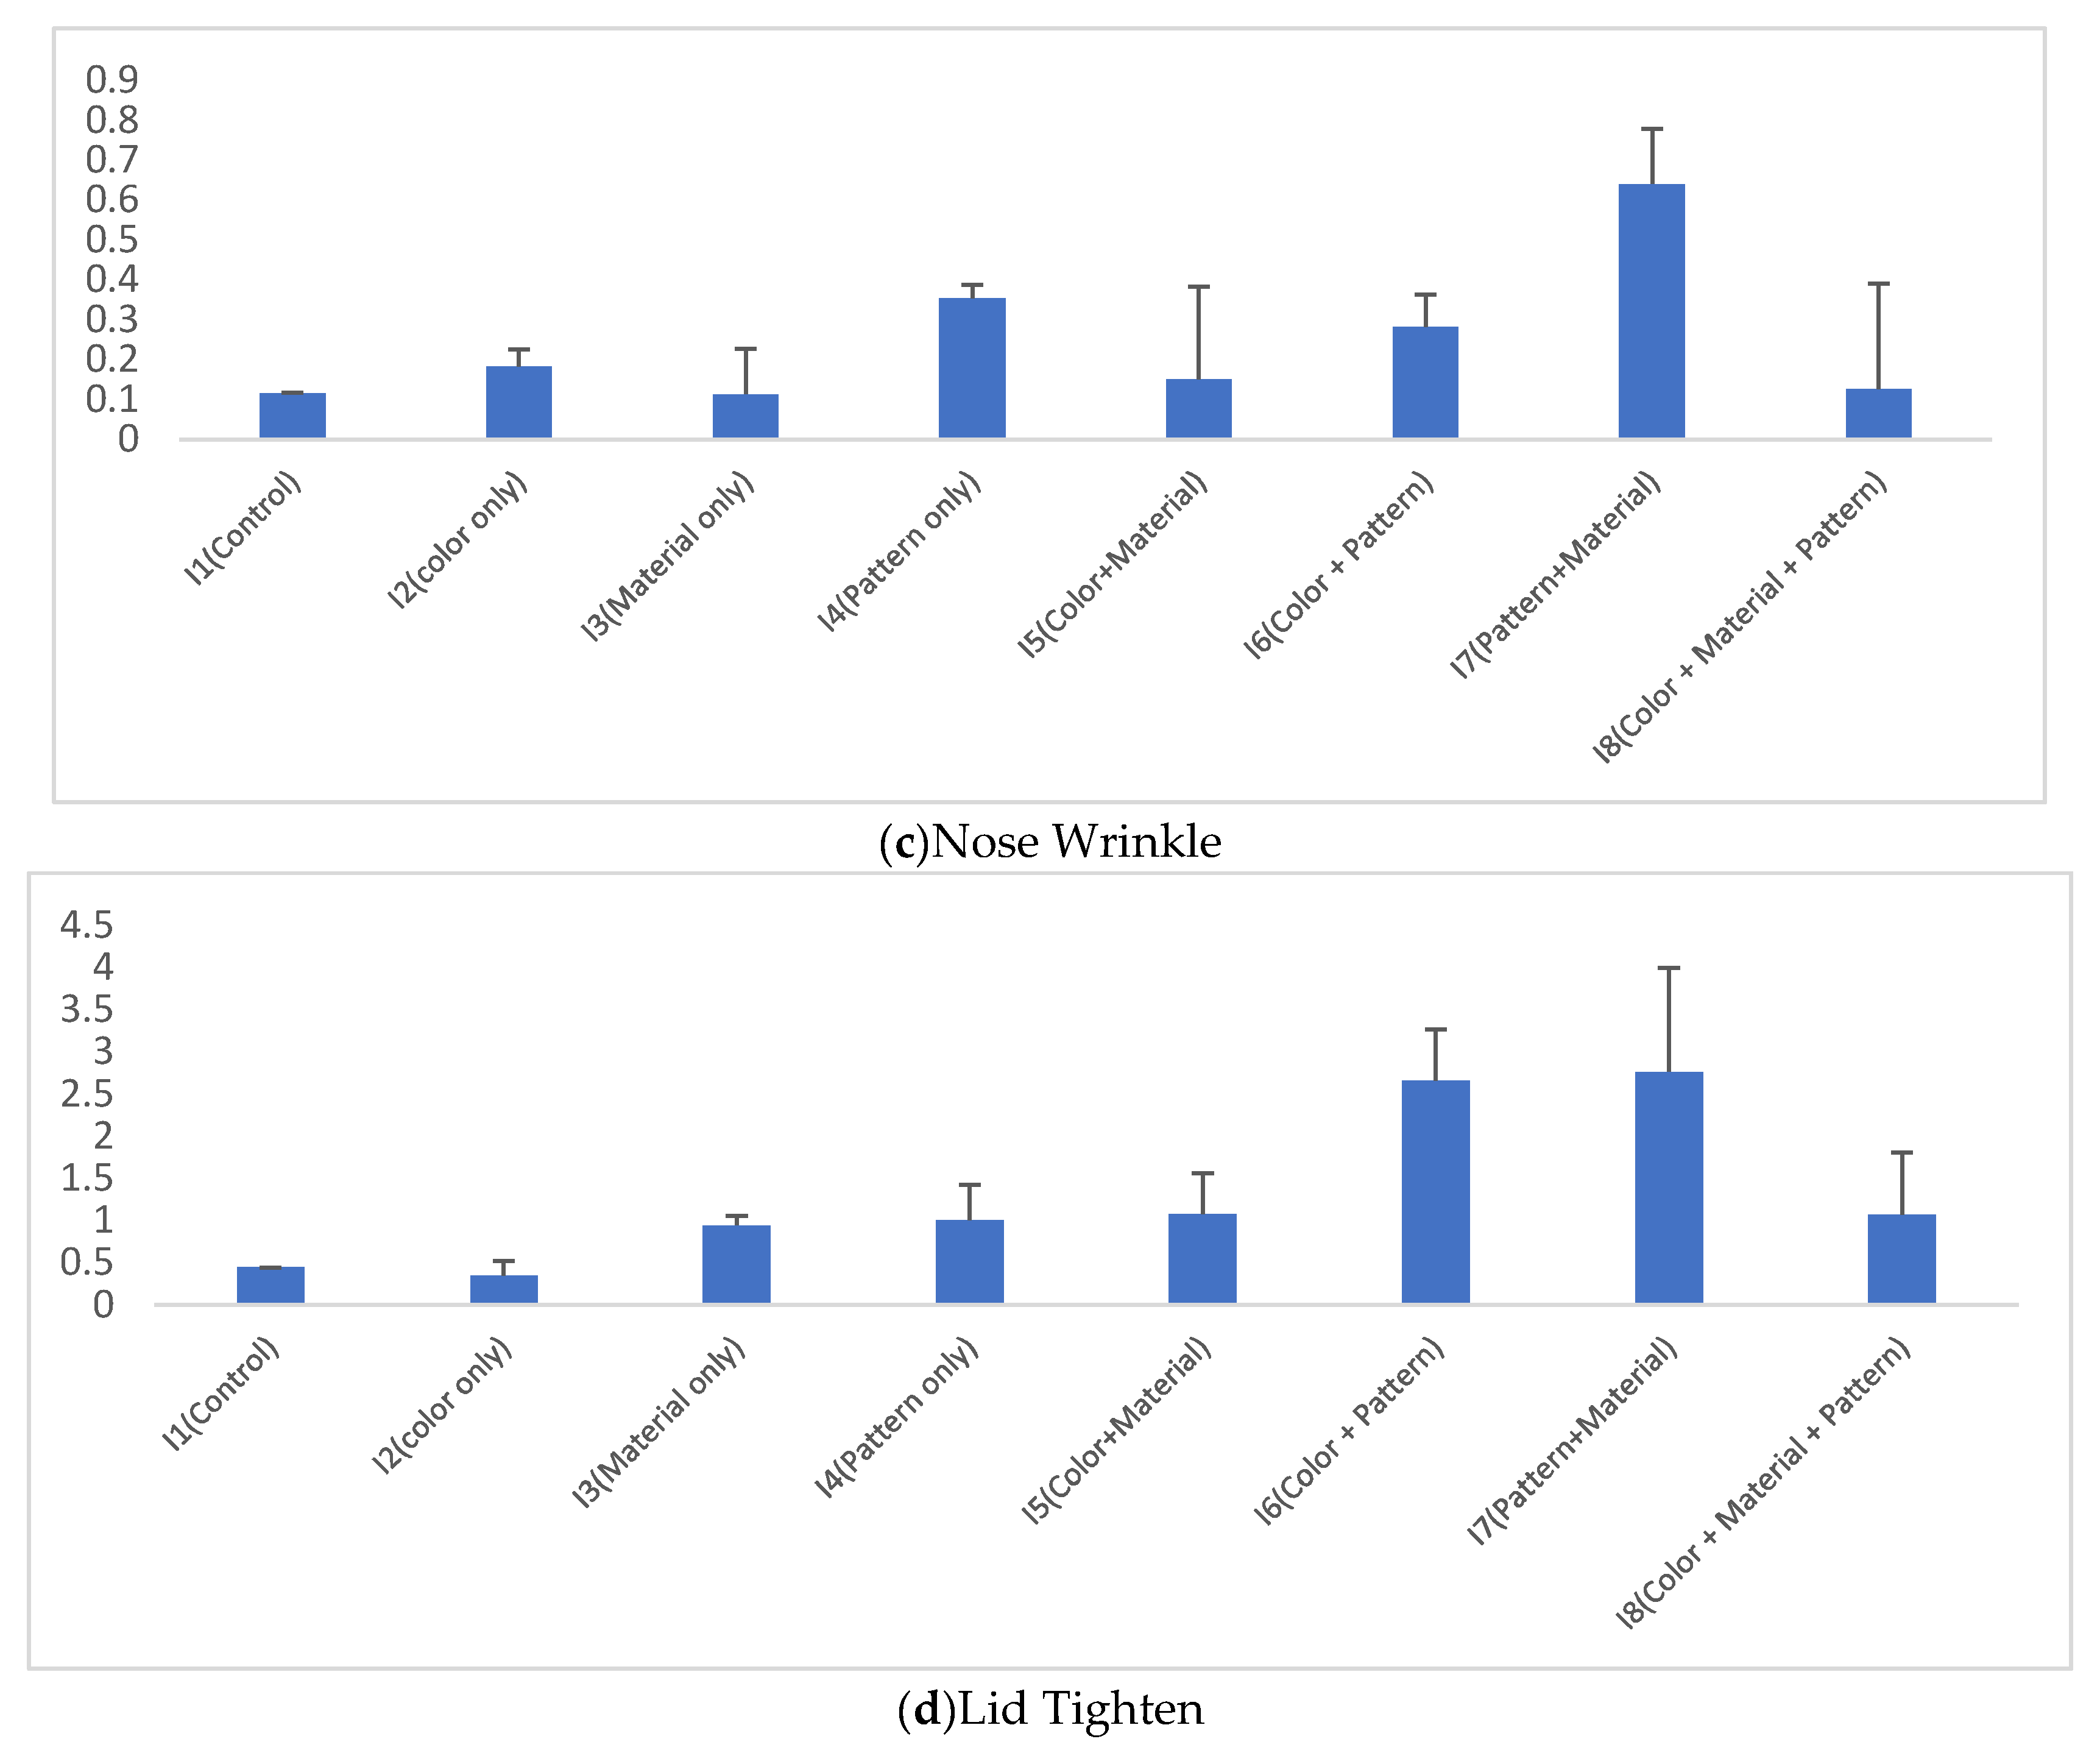
Figure 8.
Mean scores and standard deviations (SD) of the Semantic Differential (SD) evaluations across ten perceptual dimensions for the eight façade design stimuli.
Figure 8.
Mean scores and standard deviations (SD) of the Semantic Differential (SD) evaluations across ten perceptual dimensions for the eight façade design stimuli.
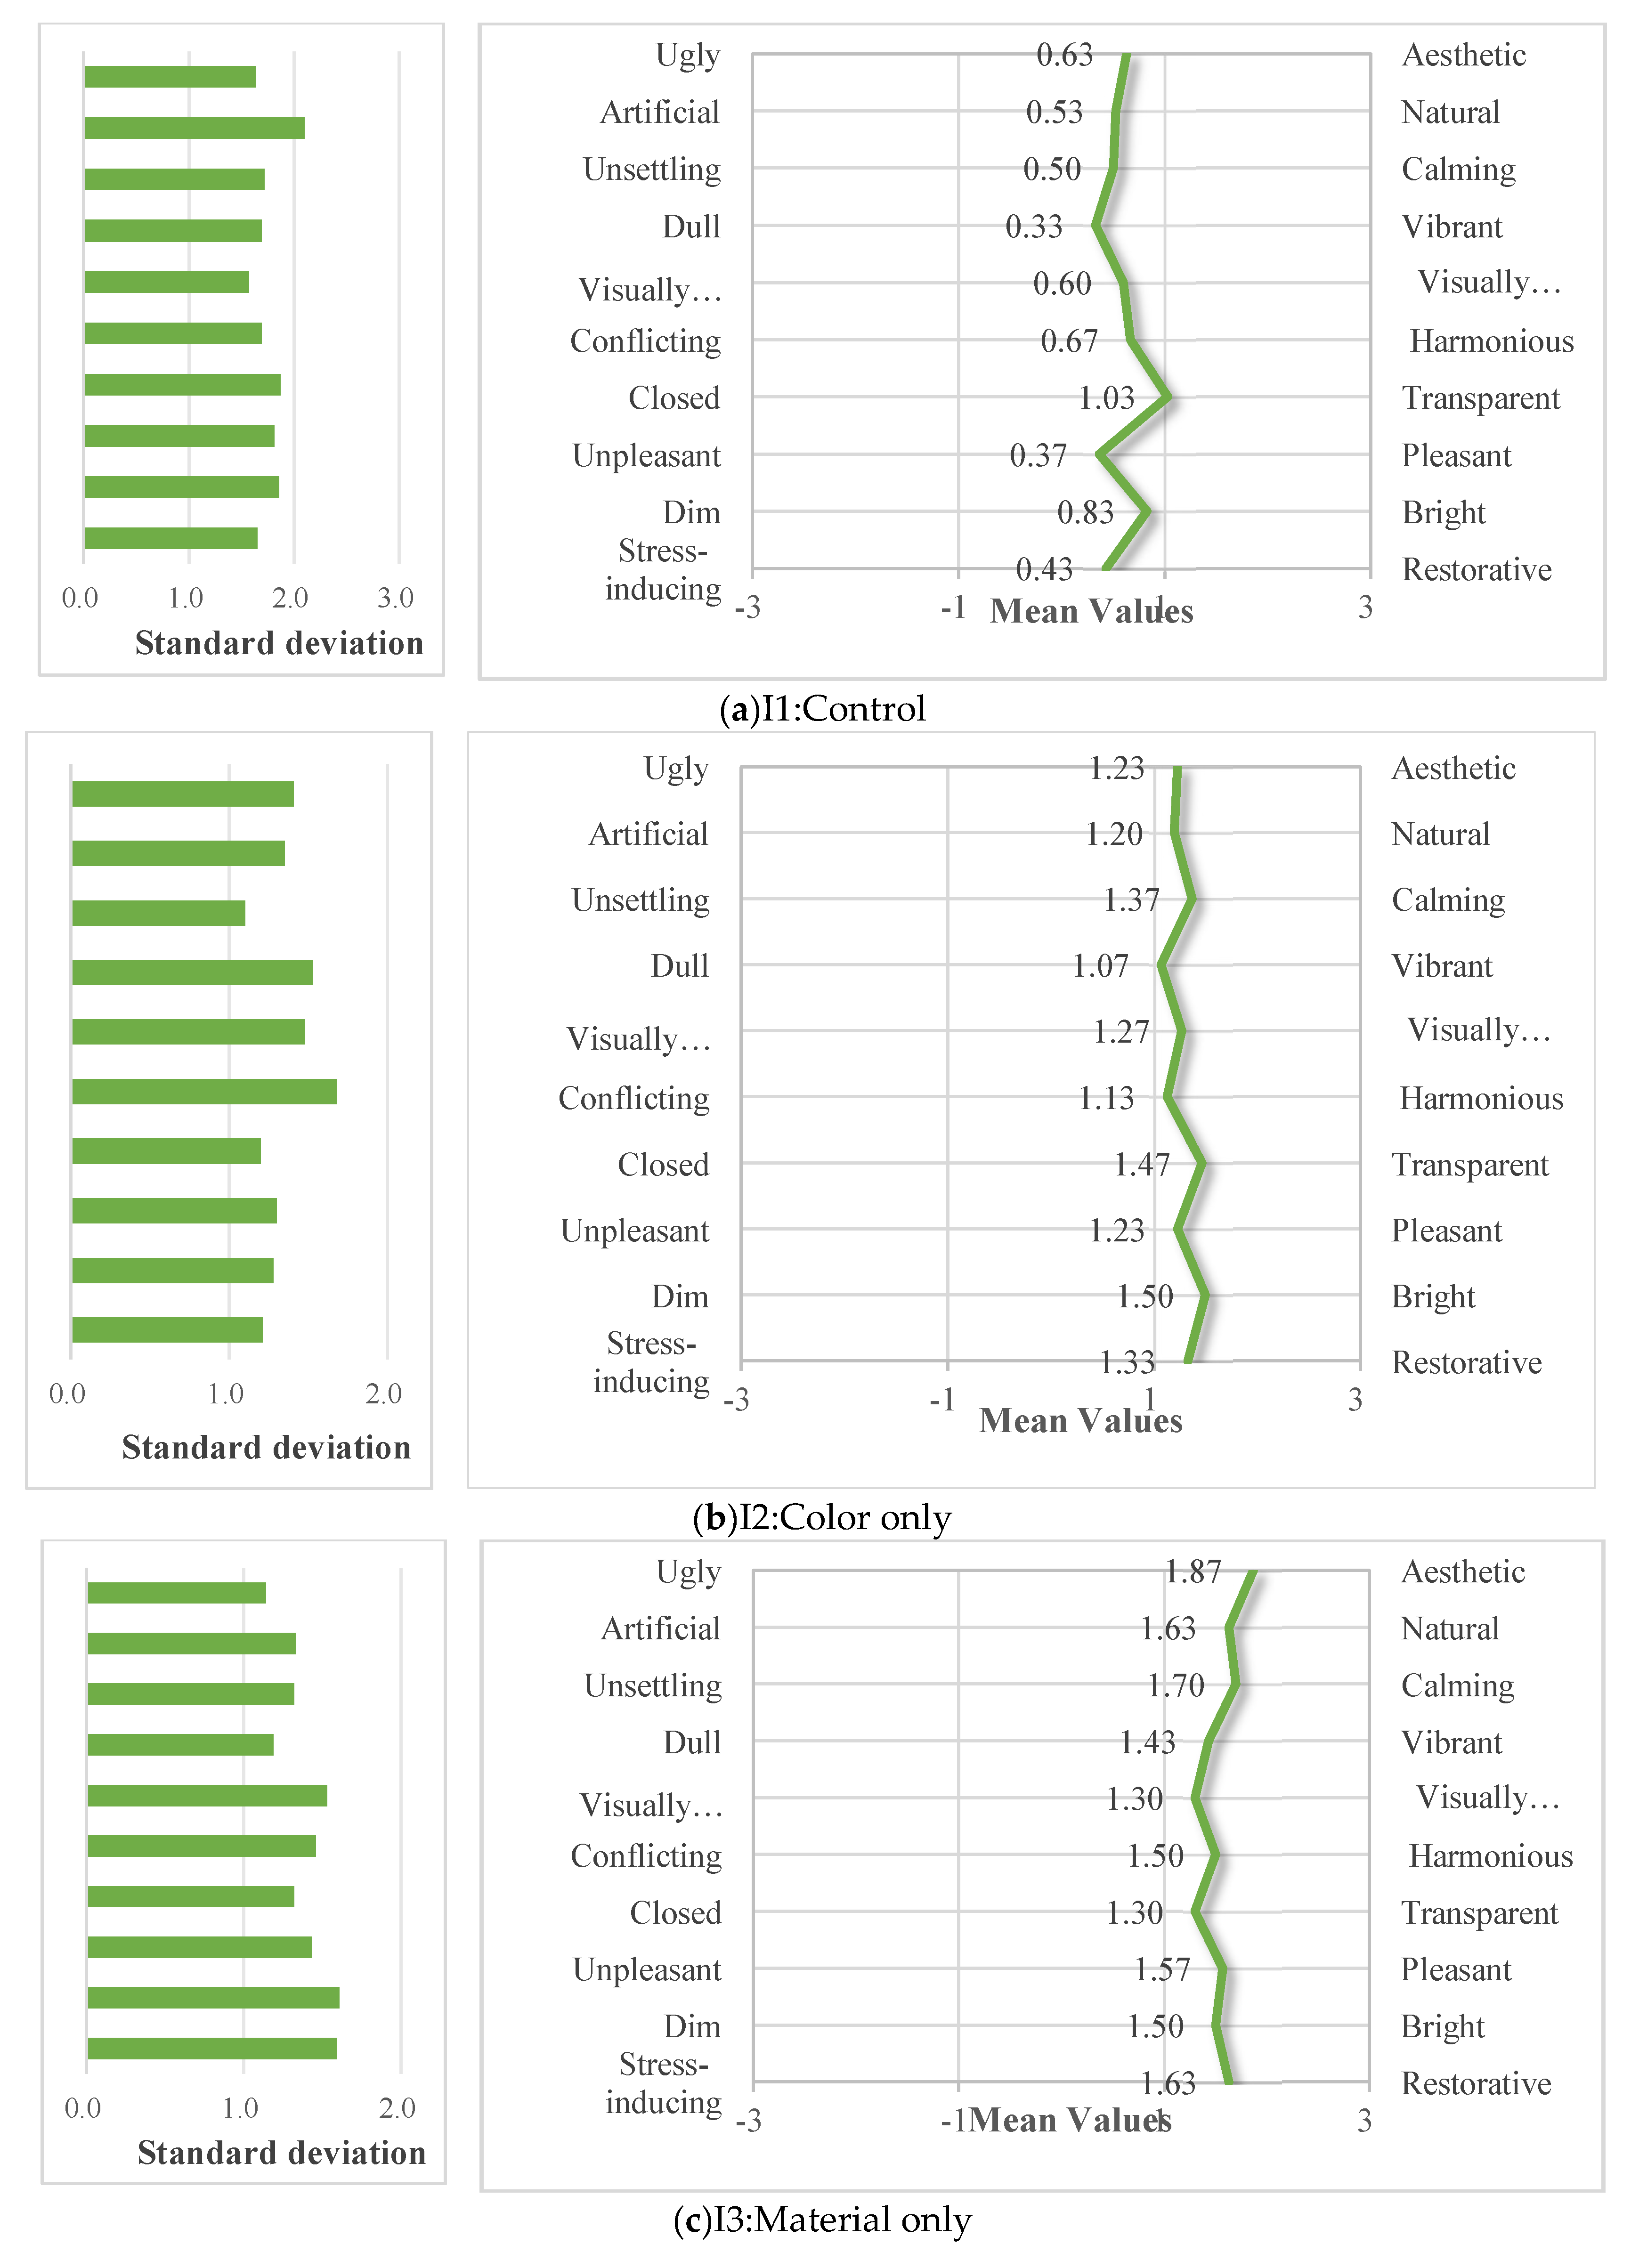
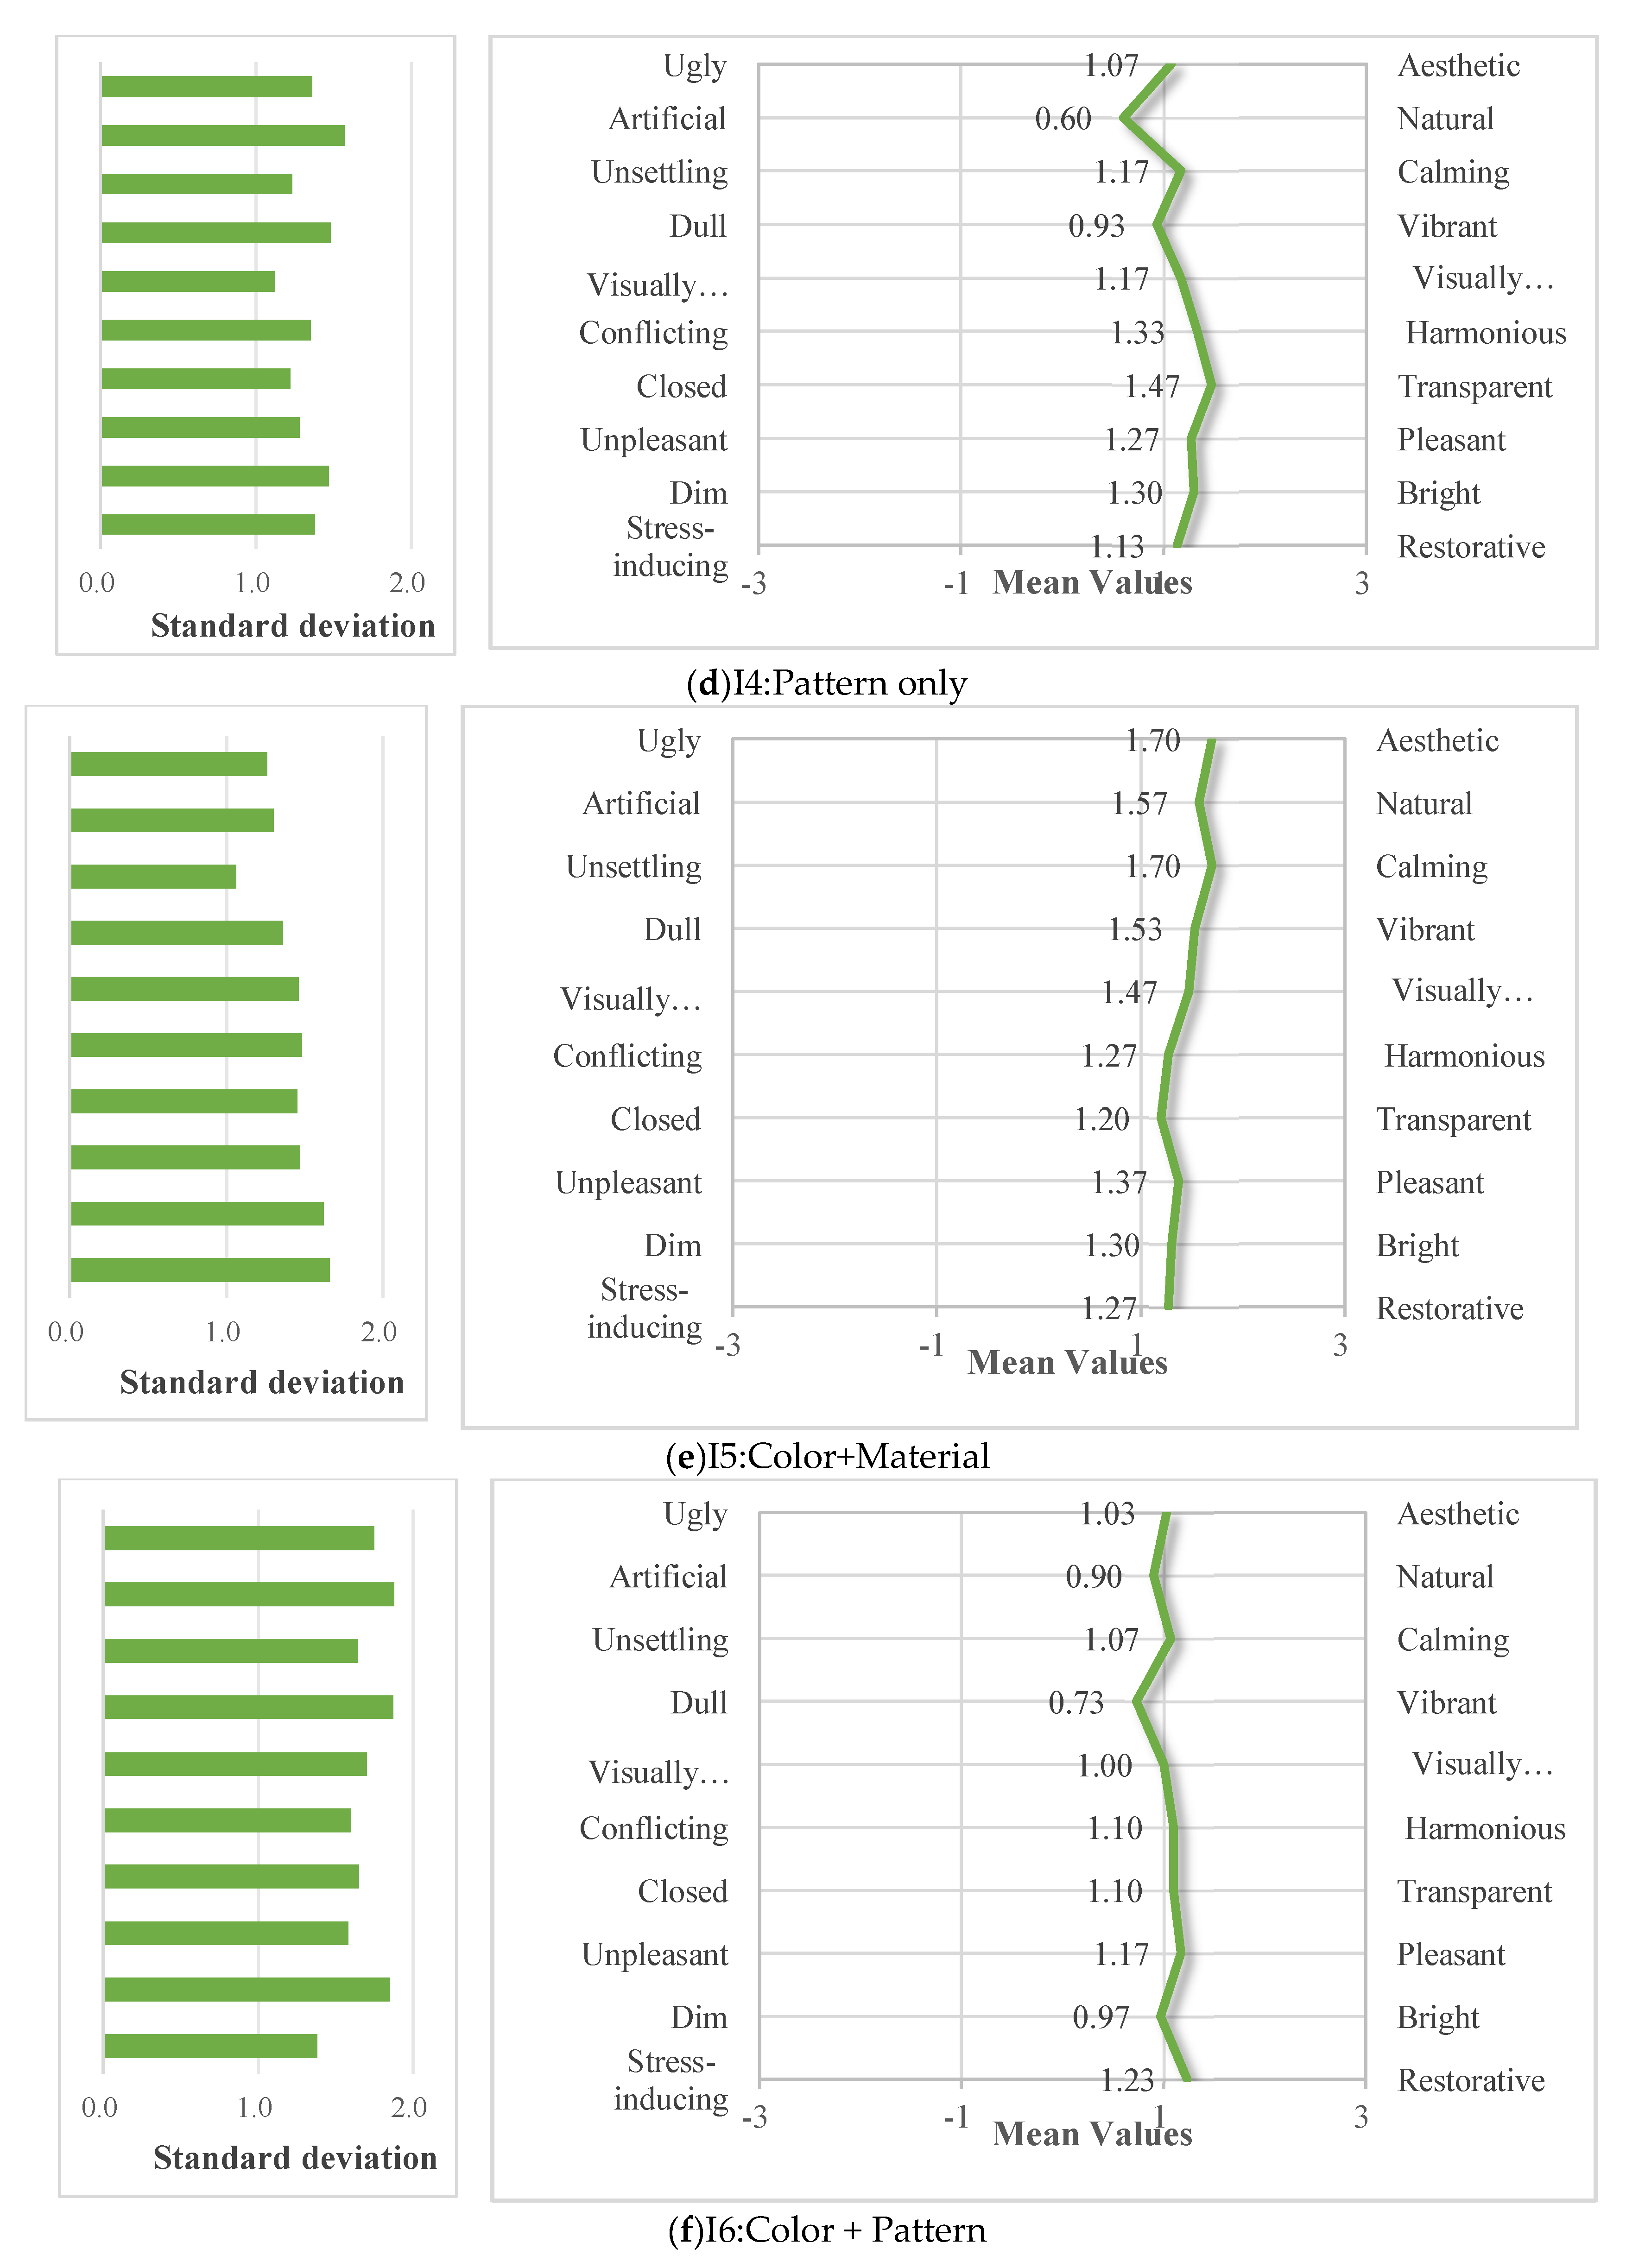
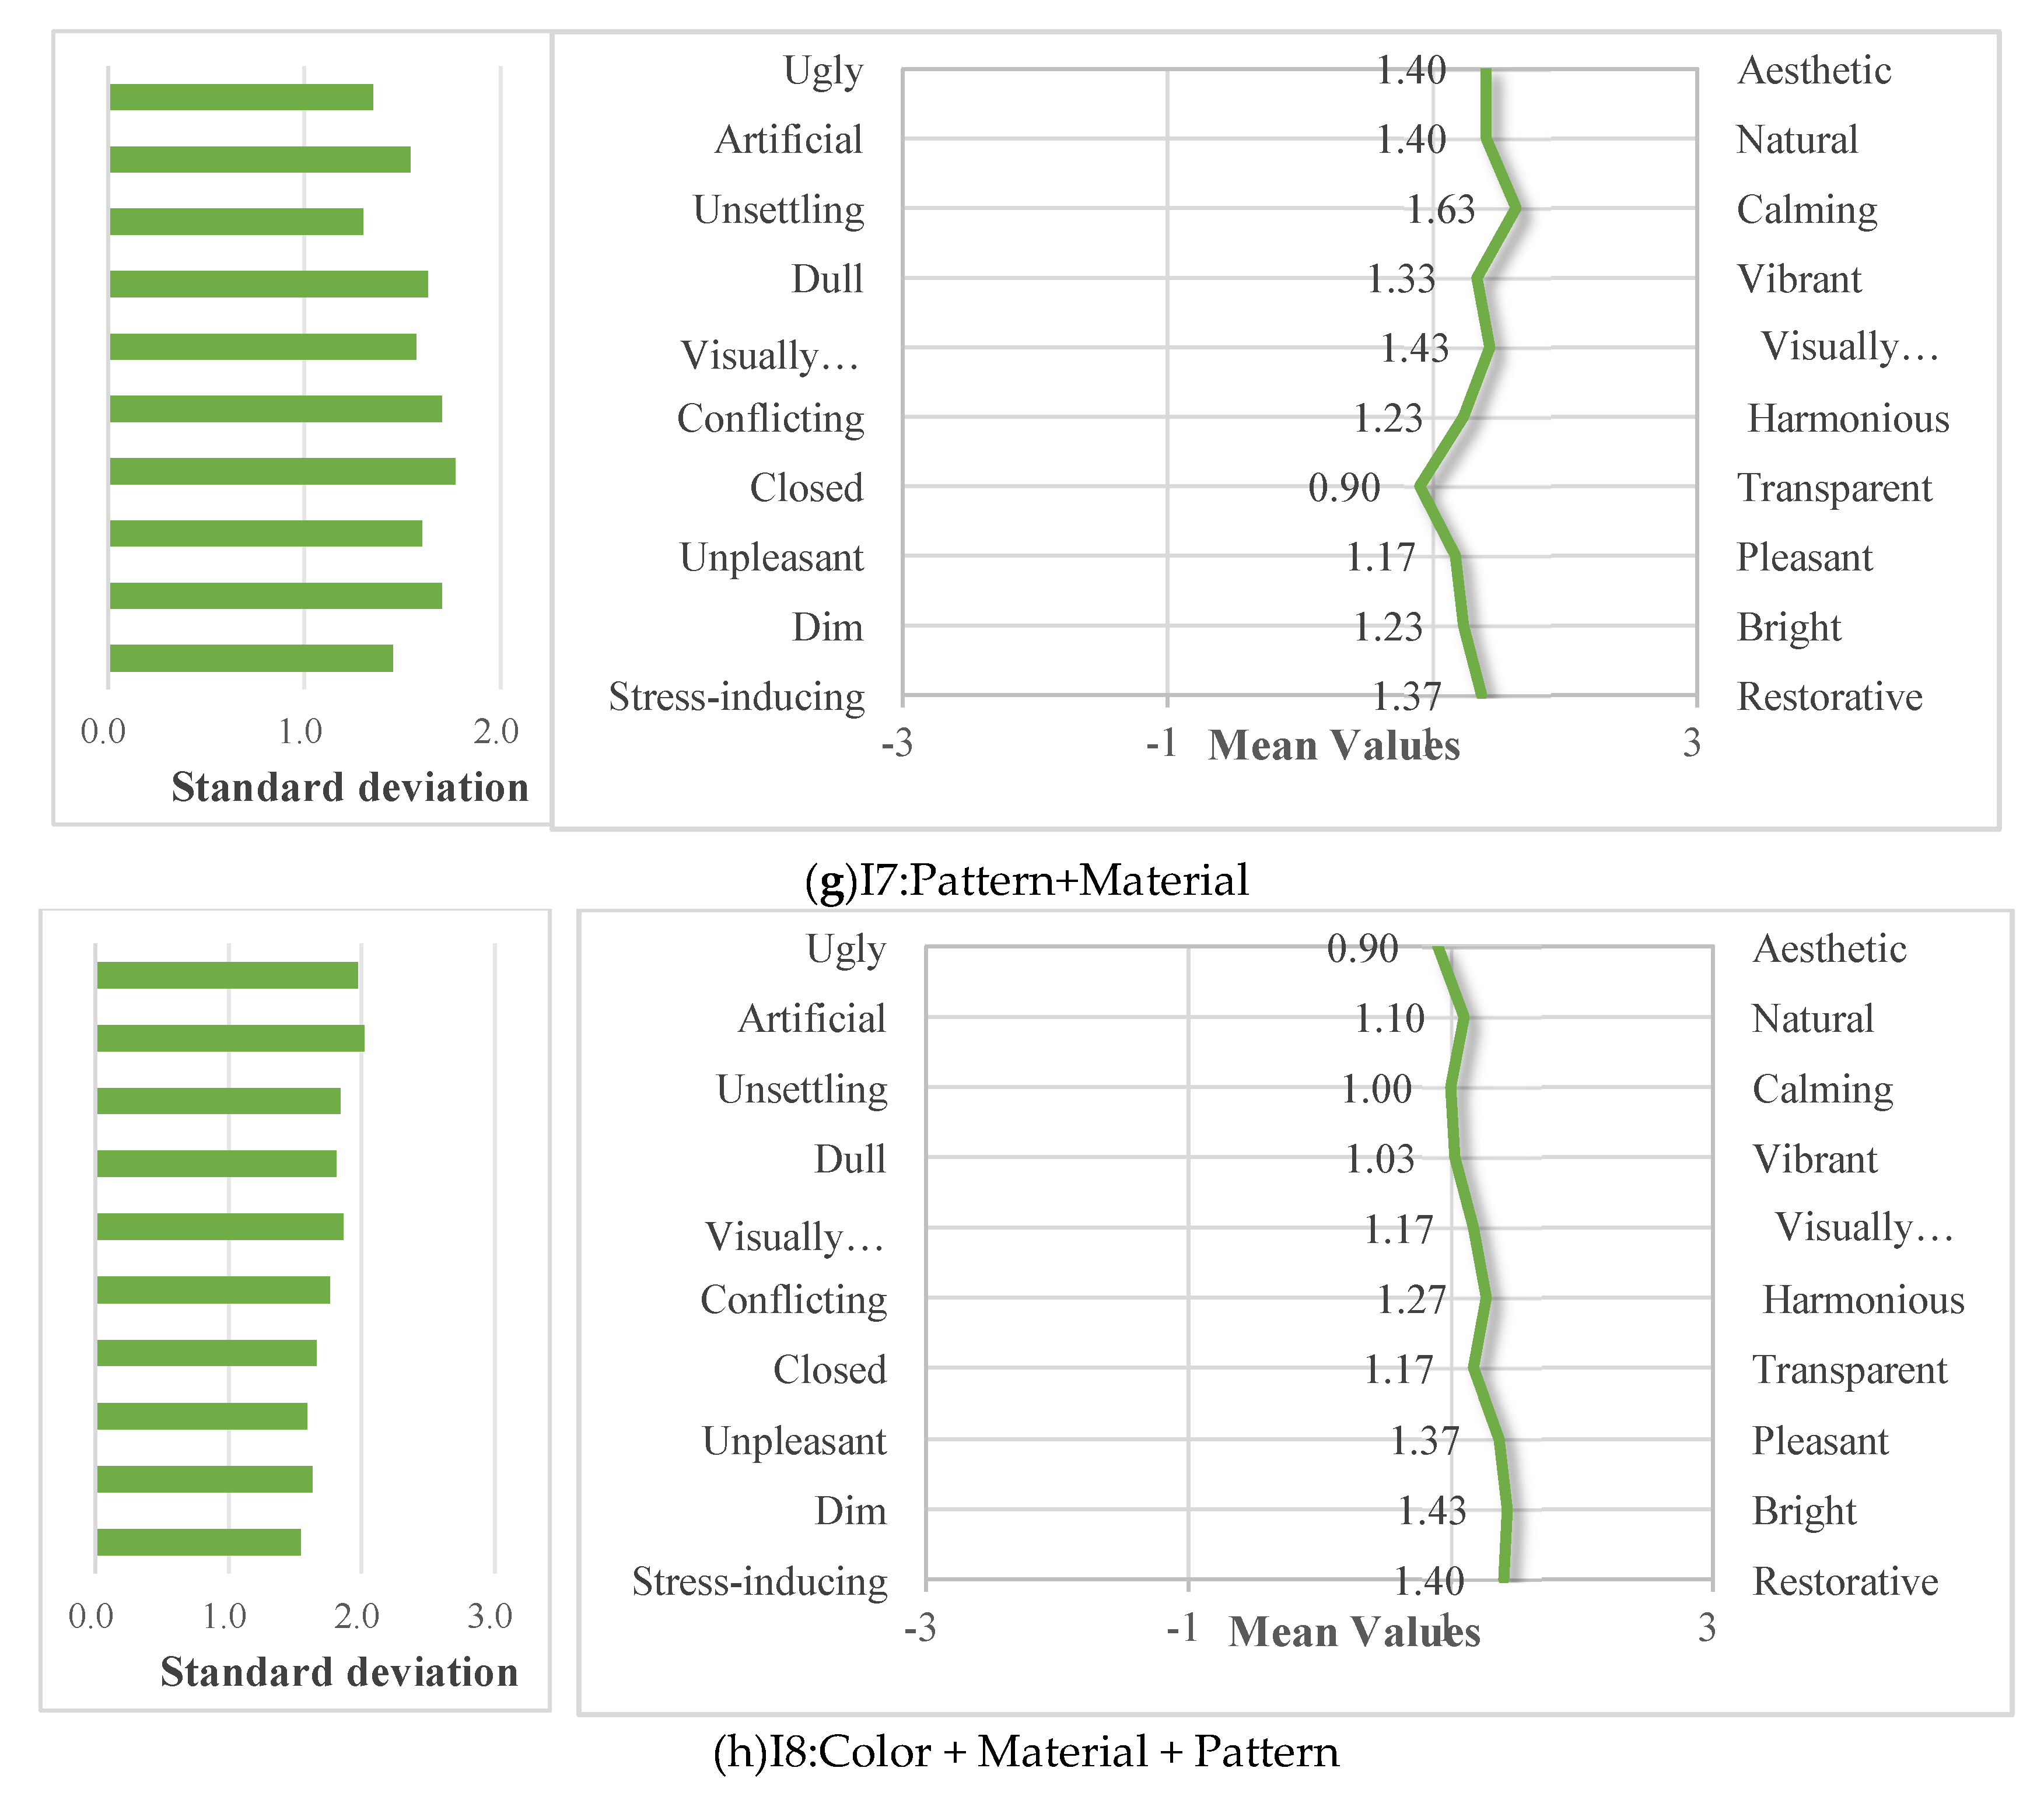
Figure 9.
Figure 9. Repeated measures correlation matrix between implicit physiological markers and explicit subjective dimensions (fixed scale: [-0.5, 0.5]).
Figure 9.
Figure 9. Repeated measures correlation matrix between implicit physiological markers and explicit subjective dimensions (fixed scale: [-0.5, 0.5]).
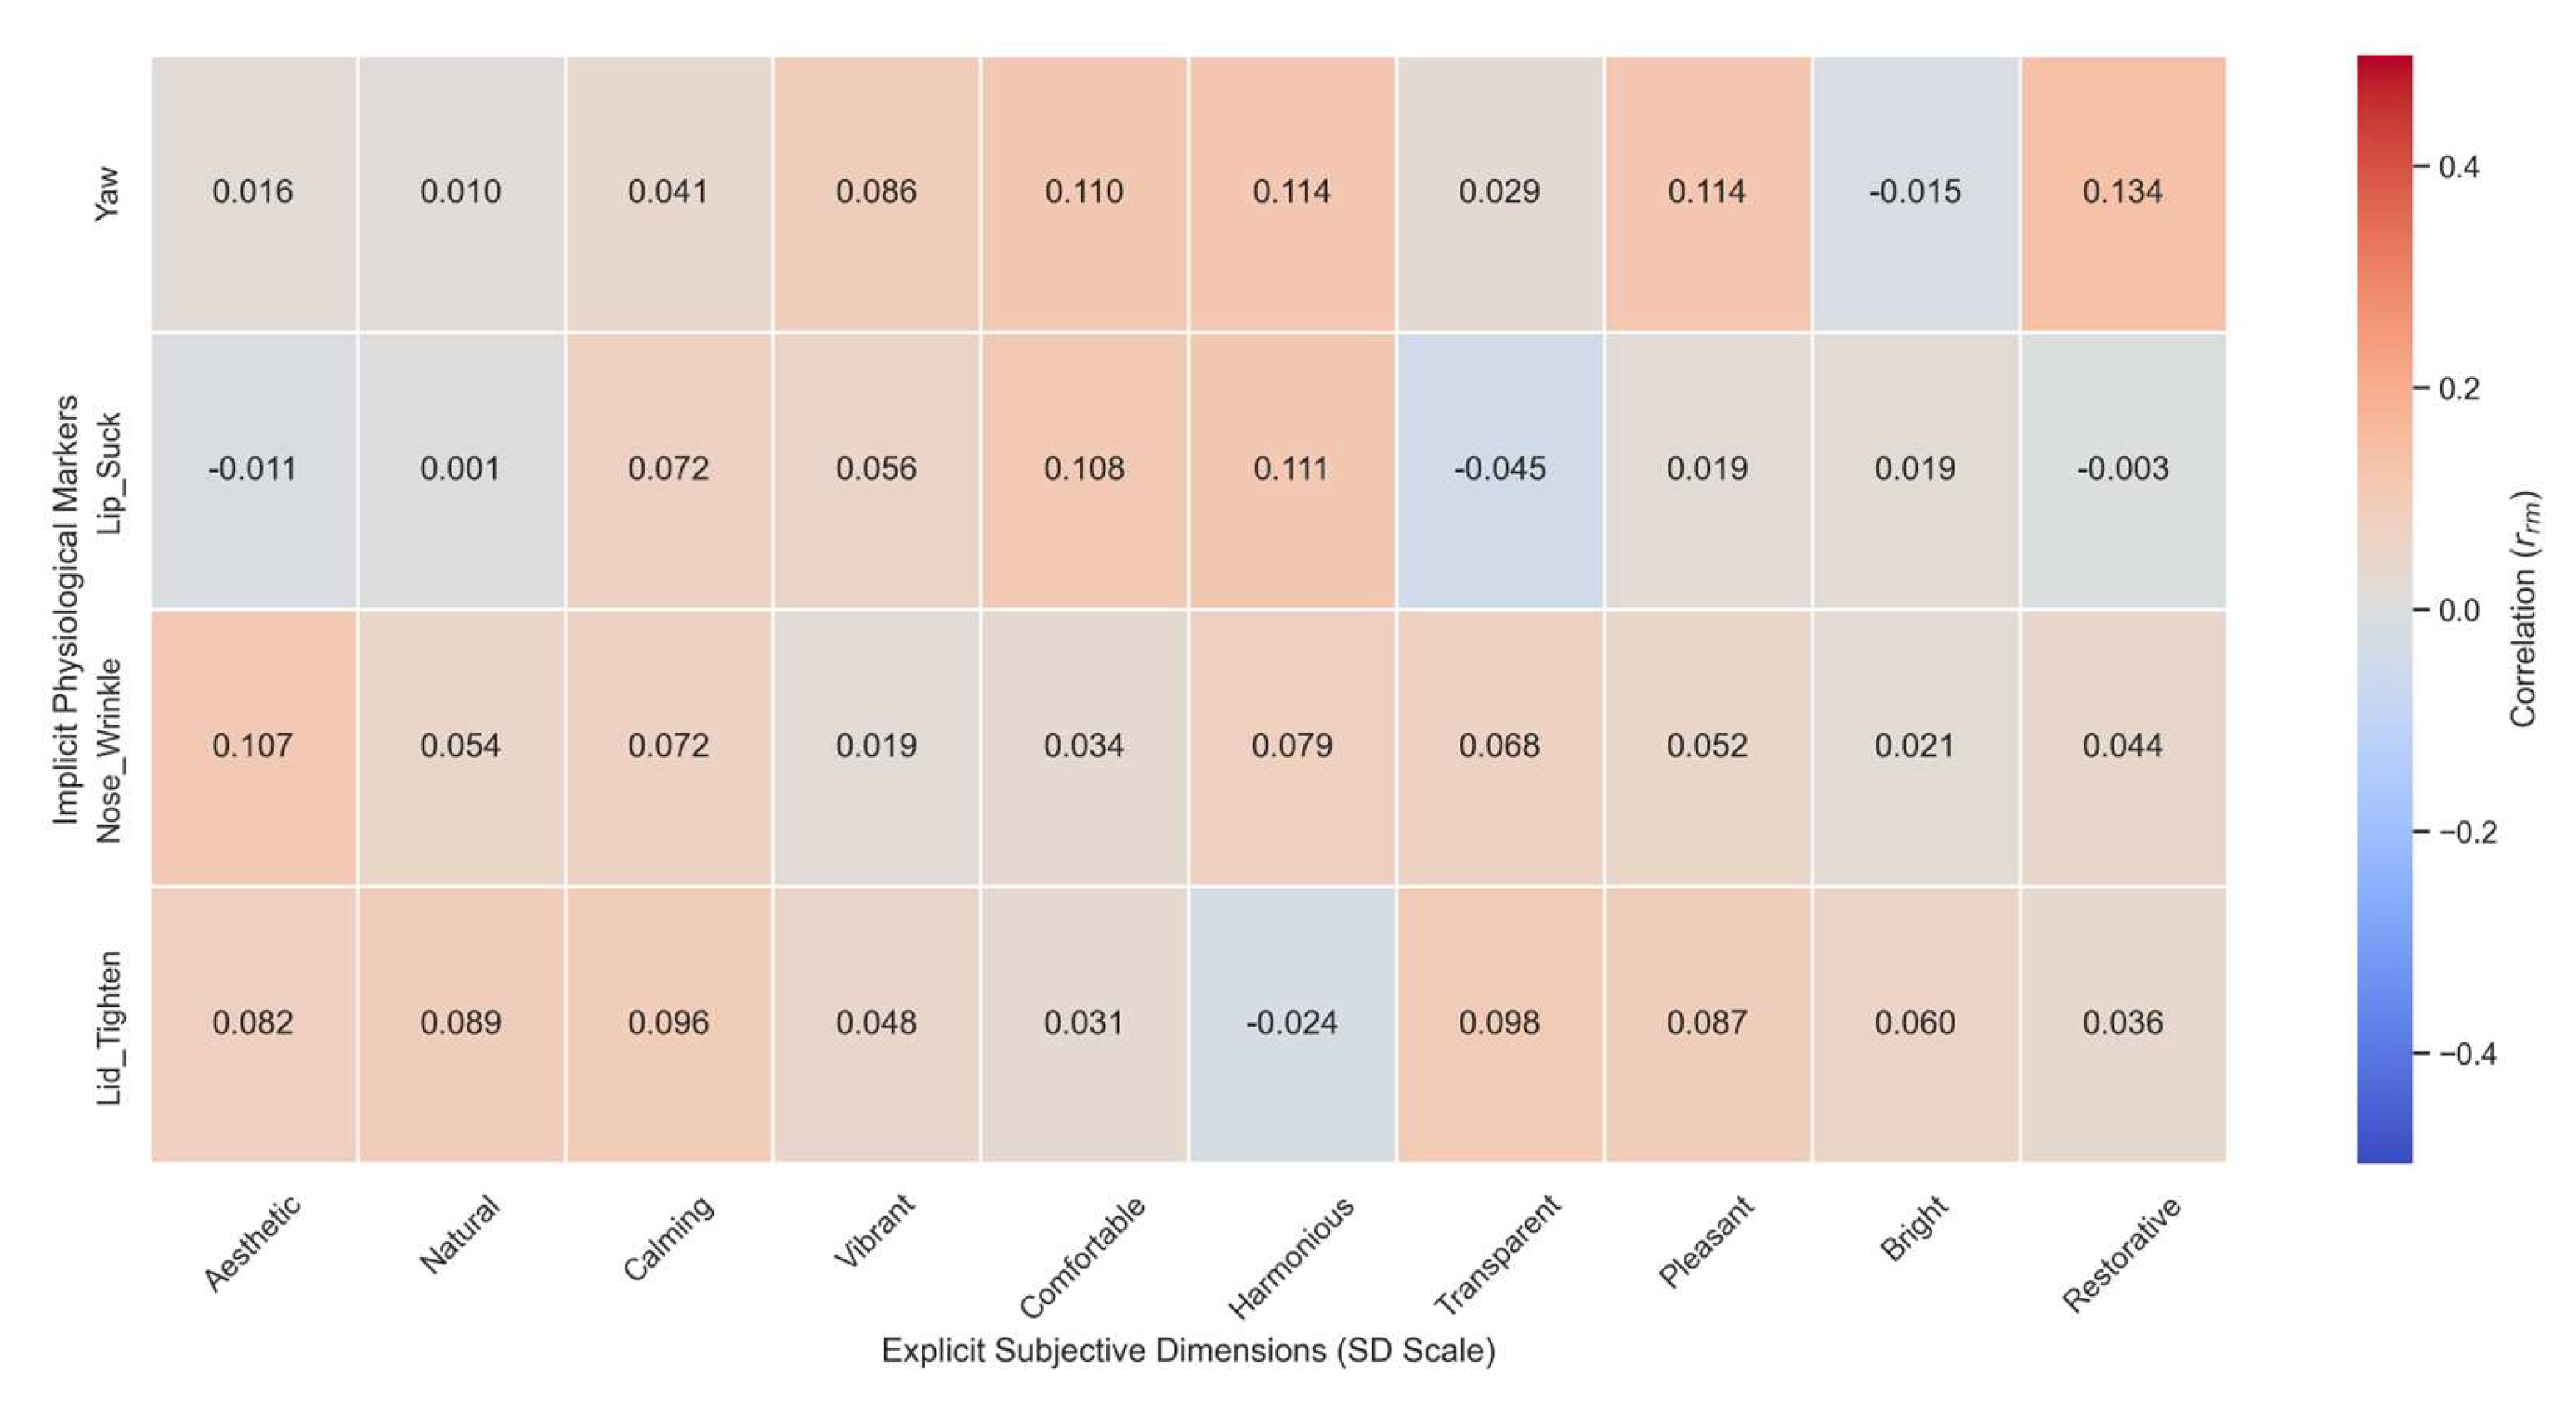
Table 2.
Adjective pairs and psychological meanings in the SD scale.
| NO. | Adjective Pair (Negative versus Positive) |
Psychological Meaning |
|---|---|---|
| 1 | Ugly - Aesthetic | Overall visual attractiveness and formal beauty of the façade |
| 2 | Artificial - Natural | Perceived degree of material authenticity and organicism. |
| 3 | Unsettling - Calming | The capacity of the design to induce relaxation or psychological peace |
| 4 | Dull - Vibrant | Level of visual vitality and perceived energy of the environment |
| 5 | Visually Uncomfortable -Comfortable | Subjective assessment of ocular comfort and sensory ease |
| 6 | Conflicting - Harmonious | Perceived integration and balance among various design elements |
| 7 | Closed - Transparent | Psychological openness and perceived spatial accessibility |
| 8 | Unpleasant -Pleasant | General affective valence and emotional satisfaction with the design |
| 9 | Dim - Bright | Perception of environmental luminosity and visual clarity |
| 10 | Stress-inducing - Restorative | The effectiveness of the design in facilitating mental recovery |
Table 3.
Summary table of eye-tracking quantitative indicators.
| AOI | Design ID | Stimulus Type | Dwell time (ms) | Fixation duration (ms) | Fixation count | Revisit count |
|---|---|---|---|---|---|---|
| AOI 1 | I1 | Control | 6,332.79 | 1,025.09 | 11.03 | 4.17 |
| I2 | Color only | 10,364.71 | 482.32 | 23 | 8.09 | |
| I3 | Material only | 10,831.81 | 778.18 | 19.52 | 6.85 | |
| I4 | Pattern only | 17,099.09 | 670.95 | 30.39 | 9.41 | |
| I5 | Color + Material | 10,939.76 | 594.35 | 19.08 | 5.82 | |
| I6 | Color + Pattern | 14,847.90 | 708.91 | 24.09 | 7.72 | |
| I7 | Pattern + Material | 16,699.75 | 958.5 | 26.97 | 8.42 | |
| I8 | Color + Material +Pattern | 9,638.96 | 785.41 | 14.89 | 4.59 | |
| AOI 2 | I1 | Control | 2,591.93 | 411.09 | 6.46 | 2.5 |
| I2 | Color only | 12,079.43 | 922.12 | 17.32 | 6.14 | |
| I3 | Material only | 8,899.23 | 689.26 | 15.39 | 5.37 | |
| I4 | Pattern only | 6,292.60 | 659.08 | 9.27 | 3.85 | |
| I5 | Color + Material | 11,441.87 | 747.54 | 19.36 | 6.95 | |
| I6 | Color + Pattern | 8,771.44 | 714.87 | 14.37 | 5.94 | |
| I7 | Pattern + Material | 9,181.31 | 1,177.19 | 10.81 | 4.34 | |
| I8 | Color + Material +Pattern | 7,778.44 | 1,594.19 | 10.7 | 3.62 | |
| AOI 3 | I1 | Control | 4,366.01 | 1,478.86 | 3.83 | 2.07 |
| I2 | Color only | 10,154.36 | 1,068.86 | 10.9 | 4.47 | |
| I3 | Material only | 12,164.36 | 1,011.04 | 14.52 | 5.93 | |
| I4 | Pattern only | 8,407.73 | 914.31 | 9 | 3.69 | |
| I5 | Color + Material | 9,668.86 | 1,234.03 | 11.83 | 5.62 | |
| I6 | Color + Pattern | 3,292.50 | 914.36 | 4.25 | 1.75 | |
| I7 | Pattern + Material | 7,549.25 | 970.91 | 8.11 | 3.64 | |
| I8 | Color + Material +Pattern | 2,638.83 | 966.53 | 3 | 0.67 |
Table 4.
Facial expression descriptive statistics
| Design ID | Stimulus Type | Yaw (Mean ± SD) | Lip Suck (Mean ± SD) | Nose Wrinkle (Mean ± SD) | Lid Tighten (Mean ± SD) |
|---|---|---|---|---|---|
| I1 | Control | 0.457 ± 1.811 | 2.961 ± 6.931 | 0.117 ± 0.236 | 0.447 ± 0.964 |
| I2 | Color only | 0.620 ± 1.935 | 2.055 ± 4.281 | 0.183 ± 0.617 | 0.347 ± 0.597 |
| I3 | Material only | 0.885 ± 1.867 | 2.695 ± 7.266 | 0.114 ± 0.180 | 0.948 ± 2.283 |
| I4 | Pattern only | 0.985 ± 1.956 | 4.671 ± 10.049 | 0.355 ± 1.268 | 1.006 ± 2.638 |
| I5 | Color + Material | 0.609 ± 1.936 | 1.551 ± 6.040 | 0.151 ± 0.437 | 1.081 ± 3.310 |
| I6 | Color + Pattern | 0.832 ± 1.811 | 1.809 ± 4.698 | 0.283 ± 0.758 | 2.662 ± 6.748 |
| I7 | Pattern + Material | 1.015 ± 1.700 | 5.147 ± 10.485 | 0.641 ± 1.447 | 2.766 ± 4.012 |
| I8 | Color + Material + Pattern | 0.671 ± 1.917 | 1.092 ± 2.582 | 0.127 ± 0.249 | 1.074 ± 3.466 |
Table 5.
Results of repeated measures ANOVA on facial expressions.
| Metric | Source | SS | df | MS | F | p-value | ηₚ² |
|---|---|---|---|---|---|---|---|
| Yaw | Design | 8.352 | 4.586 | 1.821 | 3.492 | 0.007** | 0.107 |
| Error | 69.368 | 132.995 | 0.522 | ||||
| Lip Suck | Design | 451.193 | 4.059 | 111.154 | 2.687 | 0.034* | 0.085 |
| Error | 4869.514 | 117.716 | 41.367 | ||||
| Nose Wrinkle | Design | 6.921 | 2.732 | 2.534 | 2.218 | 0.098 | 0.071 |
| Error | 90.479 | 79.22 | 1.142 | ||||
| Lid Tighten | Design | 178.42 | 3.568 | 50.002 | 2.218 | 0.079 | 0.071 |
| Error | 2332.605 | 103.479 | 22.542 |
Note. All values were adjusted using the Greenhouse–Geisser correction due to violation of the sphericity assumption (p < .05).* p < .05, ** p < .01.
Table 6.
Post-hoc Pairwise Comparisons of Significant Physiological and Behavioral Metrics.
| Metric | Significant Pair (I vs. J) | Mean Diff. (I-J) | Std. Error | p-value | 95% CI Lower | 95% CI Upper |
|---|---|---|---|---|---|---|
| Yaw | I7 (Pattern+Material) vs. I1 (Control) | 0.558 | 0.156 | 0.034* | 0.023 | 1.093 |
| Lip Suck | I7 (Pattern+Material) vs. I3 (Material only) | 1.865 | 0.542 | 0.042* | 0.065 | 3.665 |
Note. * p < .05, ** p < .01.
Table 7.
Results of repeated measures ANOVA on SD scales
| Perceptual Dimension (Negative—Positive) | Source | SS | df | MS | F | p-value | |
|---|---|---|---|---|---|---|---|
| Ugly—Aesthetic | Design | 35.563 | 4.547 | 7.82 | 3.326 | 0.009** | 0.103 |
| Error | 310.062 | 131.875 | 2.351 | ||||
| Artificial—Natural | Design | 36.333 | 4.177 | 8.698 | 2.975 | 0.020* | 0.093 |
| Error | 354.167 | 121.144 | 2.924 | ||||
| Unsettling—Calming | Design | 36.867 | 4.193 | 8.791 | 4.339 | 0.002** | 0.13 |
| Error | 246.383 | 121.611 | 2.026 | ||||
| Dull—Vibrant | Design | 32.667 | 5.12 | 6.38 | 3.463 | 0.005** | 0.107 |
| Error | 273.583 | 148.491 | 1.842 | ||||
| Visual Discomfort.—Comfort. | Design | 16.117 | 4.474 | 3.602 | 1.832 | 0.119 | 0.059 |
| Error | 255.133 | 129.757 | 1.966 | ||||
| Conflicting—Harmonious | Design | 12.462 | 4.435 | 2.81 | 1.584 | 0.177 | 0.052 |
| Error | 228.162 | 128.611 | 1.774 | ||||
| Closed—Transparent | Design | 8.429 | 4.641 | 1.816 | 0.936 | 0.455 | 0.031 |
| Error | 261.196 | 134.587 | 1.941 | ||||
| Unpleasant—Pleasant | Design | 26.729 | 4.142 | 6.454 | 3.181 | 0.015* | 0.099 |
| Error | 243.646 | 120.104 | 2.029 | ||||
| Dim—Bright | Design | 12.517 | 4.102 | 3.052 | 1.185 | 0.321 | 0.039 |
| Error | 306.233 | 118.95 | 2.574 | ||||
| Stress-inducing—Restorative | Design | 25.983 | 4.043 | 6.426 | 3.297 | 0.013* | 0.102 |
| Error | 228.517 | 117.259 | 1.949 |
Note. All values were adjusted using the Greenhouse–Geisser correction due to violation of the sphericity assumption.* p < .05, ** p < .01.
Table 8.
Comprehensive Summary of Significant Pairwise Comparisons
| Dimension | Significant Pair (I vs. J) | Mean Diff. (I−J) | Std. Error | p-value | 95% CI Lower | 95% CI Upper |
|---|---|---|---|---|---|---|
| Ugly—Aesthetic | I3(Material only) vs. I1(Control) | 1.233 | 0.298 | 0.008** | 0.208 | 2.259 |
| Artificial—Natural | I3(Material only) vs. I4(Pattern only) | 1.033 | 0.265 | 0.015* | 0.123 | 1.944 |
| Unsettling—Calming | I5(Color + Material) vs. I1(Control) | 1.2 | 0.293 | 0.009** | 0.191 | 2.209 |
| I2(Color only) vs. I1(Control) | 0.867 | 0.238 | 0.030* | 0.046 | 1.687 | |
| I3(Material only) vs. I1(Control) | 1.2 | 0.33 | 0.030* | 0.065 | 2.335 | |
| Dull—Vibrant | I3(Material only) vs. I1(Control) | 1.1 | 0.264 | 0.007** | 0.191 | 2.009 |
Note. * p < .05, ** p < .01.
Table 9.
Repeated measures correlations between selected physiological markers and representative subjective dimensions (df = 209).
Table 9.
Repeated measures correlations between selected physiological markers and representative subjective dimensions (df = 209).
| Physiological Marker | Subjective Dimension | p-value | 95% CI Lower | 95% CI Upper | |
|---|---|---|---|---|---|
| Yaw | Ugly — Aesthetic | 0.016 | 0.821 | -0.119 | 0.15 |
| Artificial — Natural | 0.01 | 0.881 | -0.125 | 0.145 | |
| Dull — Vibrant | 0.086 | 0.212 | -0.049 | 0.218 | |
| Visual Discomfort. — Comfort | 0.11 | 0.113 | -0.026 | 0.241 | |
| Stress-inducing — Restorative | 0.134 | 0.052 | -0.001 | 0.264 | |
| Lip_Suck | Ugly — Aesthetic | -0.011 | 0.877 | -0.145 | 0.124 |
| Artificial — Natural | 0.001 | 0.986 | -0.134 | 0.136 | |
| Dull — Vibrant | 0.056 | 0.419 | -0.079 | 0.189 | |
| Visual Discomfort — Comfort | 0.108 | 0.117 | -0.027 | 0.24 | |
| Stress-inducing — Restorative | -0.003 | 0.963 | -0.138 | 0.132 |
Note: = repeated measures correlation coefficient; CI = confidence interval; df = degrees of freedom. Statistical significance was set at p < .05. No correlations reached statistical significance in the current analysis. All correlations were calculated using the mean scores of the Semantic Differential (SD) scales.
Disclaimer/Publisher’s Note: The statements, opinions and data contained in all publications are solely those of the individual author(s) and contributor(s) and not of MDPI and/or the editor(s). MDPI and/or the editor(s) disclaim responsibility for any injury to people or property resulting from any ideas, methods, instructions or products referred to in the content. |
© 2026 by the authors. Licensee MDPI, Basel, Switzerland. This article is an open access article distributed under the terms and conditions of the Creative Commons Attribution (CC BY) license.
Copyright: This open access article is published under a Creative Commons CC BY 4.0 license, which permit the free download, distribution, and reuse, provided that the author and preprint are cited in any reuse.


