Submitted:
29 January 2026
Posted:
29 January 2026
You are already at the latest version
Abstract
Cannabinoids are of considerable current interest for use in pharmaceutical and non-medical consumer products. While there have been significant efforts to understand their chemical stability under ambient conditions, only sparse attention has been paid to characterizing their photostability. Here, we present UVA (365 nm) and UVB (280 nm) photolysis measurements of eight representative cannabinoids, including natural compounds (THC, CBD, THCA, CBDA), metabolites (THC-COOH, THC-OH), and synthetic analogues (JWH-018, MDMB-FUBINACA). Measurements were performed using a novel online-electrospray mass spectrometry (MS) approach, where online photolysis of cannabinoid solutions was conducted with laser light emit-ting diodes. MS detection was used to monitor precursor compound decay and photoproduct formation. Complementary results obtained via UV-Vis spectroscopy of photolysed cannabinoid solutions are also presented. For THC, CBD, THC-COOH, THC-OH, THCA and CBDA significant photodegradation was observed with 280 nm photolysis, both through the appearance of photoproducts detected by MS, and via time-dependent changes in the solution UV-Vis absorption profiles. In contrast, the synthetic cannabinoids (JWH-018 and MDMB-FUBINACA) showed negligible degradation with UVB photolysis, consistent with their relatively low absorbance propensity through the mid-UV region. No significant photodegradation was observed for UVA (365 nm) photolysis of any of the cannabinoids. The results presented here constitute the first directly comparable set of photolysis measurements for key phytocannabinoids.
Keywords:
cannabinoids
; photolysis
; UVA/UVB irradiation
; ESI-MS
; transformation products
1. Introduction
Cannabinoids are a class of bioactive chemical compounds that interact with the human endocannabinoid system, exhibiting pharmacological effects that range from psychoactivity to pain relief. These compounds originate either naturally from the Cannabis Sativa plant (phytocannabinoids), or can be produced in laboratories (synthetic cannabinoids) [1]. Cannabinoids have been extensively studied over recent years due to growing interest from the pharmaceutical industry, arising from the potential for developing therapeutic applications to treat nausea and epilepsy [2,3]. Commercially, they are also being increasingly incorporated into food, drink and cosmetic products [4,5,6]. Beyond these legal uses, synthetic cannabinoids represent one of the largest classes of new designer drugs, leading to their widescale adoption as custom-narcotics [7,8].
Given the growth of cannabinoid usage, it is critical to understand the factors that influence their intrinsic stability. This issue is of importance given that some cannabinoids are known to be inherently unstable and prone to degrade under various environmental conditions [9]. Degradation can occur through several pathways including heat, oxidation, hydrolysis, and light exposure, resulting in reduced functionality and also potential toxicological risks [10,11,12]. Understanding the degradation pathways of cannabinoids is therefore not only important for optimising manufacture and commercial storage procedures, but also for assessing any ecotoxicological risks that arise when cannabinoids are transferred from human consumers into the wider environment [13]. Both natural and synthetic cannabinoids have been detected in aquatic bodies across the globe, and are known to be incompletely transformed by waste-water systems [14,15,16,17].
In this work, we investigate the photostability of a group of representative cannabinoid molecules displayed in Scheme 1. In particular, we are interested in characterising the photoproducts that result following light exposure to enable assessment of the toxicity of transformation (photo-) products. There have been a small number of previous studies of cannabinoid photolysis, but these have been conducted on a small number of individual cannabinoids (THC. CBD and THCOOH) and there has been considerable diversity in both the light sources, photolysis wavelengths and the photoproduct detection methods employed [18,19,20,21]. It is therefore challenging to compare the results for different compounds and obtain a reliable overall picture of photostability of different natural and synthetic cannabinoids from the previous work. Furthermore, the previous studies have relied on off-line (manual) sampling following light-induced degradation or storage, an approach that is time-consuming and unsuited to deployment as part of a manufacturing process [22,23,24]. One key point of interest is the difference in photoproduct formation reported in studies of the important, isomeric cannabinoids, THC and CBD: THC was characterised as producing minimal photoproducts, while CBD displays a significantly larger number of photoproducts [25,26]. This is surprising given the similar chemical structures of THC and CBD and warrants further investigation.
Online-photolysis with mass spectrometric (MS) detection has been shown to be a facile and reproducible method for surveying photolysis chemistry [27,28,29,30,31], which has been used recently to investigate photolysis of a range of inorganic and organic compounds. Here, it is applied to analyse the photolysis propensity and photoproducts of the Scheme 1 cannabinoids. Single-wavelength laser light emitting diodes (LEDs) are used as photon sources, allowing us to investigate degradation in both the UVA (365 nm) and UVB (280 nm) at well-defined photoexcitation energies. By using this approach, we are able to obtain the first consistent set of measurements which are directly comparable for all the Scheme I cannabinoids.
2. Results
2.1. THC and CBD
Figure 1 displays the UV-Vis absorption spectrum of Δ9-tetrahydrocannabinol, THC, in methanol obtained between 210 - 460 nm. The spectrum was recorded using a 1x10⁻⁵ M solution of THC in methanol, which provides acceptable absorbance for this molecule. For THC, the UV-Vis spectrum displays three main absorption features, which are labelled I-III on Figure 1, with λmax values of 216, 228 and 276 nm, respectively. The spectrum agrees well with a previously reported spectrum. [32]
Photolysis at 280 nm of the same THC solution was then performed by irradiating the solution in the UV cuvette for photolysis times from 0-120 mins. UV-Vis spectra were recorded at regular intervals to identify any changes in the spectral profile. Upon irradiation, the Band I and II features decrease steadily in intensity as a function of photolysis time, indicating light-induced breakdown of THC. A new, broad band (IV) appears at longer wavelengths (λmax = 302 nm). This new feature, which is associated with photoproduct formation, likely comes from the formation of a relatively more conjugated product compared to the reactant. Figure S1 presents the changes in the absorbance intensity at selected absorption wavelengths as a function of photolysis time, clearly illustrating that absorbance at ~302 nm increases with irradiation time.
On-line photolysis with MS detection was then used to identify the THC photoproducts. For consistency with the UV-Vis photolysis experiments, a 1 x10⁻⁵ M THC in methanol solution was used for photolysis in the electrospray syringe. Figure 2a displays the THC electrospray ionisation mass spectra (ESI-MS) obtained prior to irradiation, with Figure 2b and Figure 2c showing the ESI-MS obtained after 30 mins of irradiation with 365 and 280 nm, respectively. The precursor ion, produced by deprotonation of THC, i.e. [THC–H]⁻ (m/z 313) is clearly visible prior to irradiation, with the [THC–H]⁻⋅THC dimer also prominent (m/z 627). At the solution concentration used here, dimer ions are common in ESI–MS [30,33], but we also note that cannabinoids are known to self-associate into species such as cannabisol and cannabitwinol [34,35,36].
Upon UVA-photolysis (365 nm), the precursor ion is largely unaffected (Figure 2b), showing no significant decline in intensity over 30 mins, and no significant photoproduct formation. This behaviour is consistent with the low absorbance of THC at wavelengths > 300 nm (Figure 1). In contrast, the [THC–H]⁻ ion decreases dramatically in intensity upon UVB-photolysis (280 nm), with a large number of photoproducts produced (Figure 2c). We note the intensity of the [THC–H]⁻⋅THC dimer ion also decreases upon photolysis. The most intense photoproduct ions observed are m/z 345, 375, 381, 393, and 511. (Several ions appear with additional +/- 1 or 2 m/z values, consistent with varying numbers of H atoms.) All of these intense product ions have m/z values greater than the precursor ion, and are therefore either produced from photolysis of an aggregate species present in solution prior to ESI [33], or via additive reactions of photoexcited THC. A full list of photoproduct ions is included in Table 1.
Higher collisional dissociation (HCD) was conducted on [THC–H]⁻ (Figure S2) to identify any potential ion-source fragment ions. The most intense HCD product ions observed were m/z 245, 191, 179 and 311. (We note that HCD has been performed on protonated analogues of cannabinoids previously [37,38,39,40]. Importantly, none of the [THC–H]⁻ HCD fragment ions coincide with the identified photoproduct ions, indicating that these are “true” photoproduct ions [41,42,43]. This was checked for all of the cannabinoids studied in this work, and no photoproduct ions reported coincide with HCD fragment ions.
Time-resolved photolysis MS (TRPMS) of THC at 280 nm was performed to provide further insight into the photolysis chemistry (Figure 3). In the Figure 3 data and in all of the TRPMS presented below, photolysis is initiated at t = 3 mins (to provide a clear baseline prior to photolysis), and a 1 min transit time exists for the photolyzed solution to travel into the MS. The results of photolysis are therefore evident above t = 4 mins. Figure 3a shows the time-dependent ion intensities associated with the [THC–H]⁻ precursor ion (m/z 313) and the five most intense photoproduct ions (m/z 381, 511, 375, 393, 345). The [THC–H]⁻ precursor ion intensity decreases smoothly from t = 4-17 mins, while the photoproduct ions increase. Notably, several of the photoproducts (m/z 345, 375 and 381) are intermediates, since they have photolysis profiles that peak around 14 minutes before declining up to 22 minutes when their intensities plateau. The other group of photoproduct ions, namely m/z 393, 511, rise steadily up to 22 mins, indicating that they are photolysis end-products. Figure 3b illustrates the TRPMS results for the group of five photoproducts with the next-highest ion intensities, i.e. m/z 407, 481, 509, 391, and 513. All of these lower-intensity photoproducts display end-product photolysis profiles.
Previous work on THC photolysis has identified limited photoproducts, with the aromatized derivative, cannabinol (CBN) has been reported as the only significant photoproduct [44]. In the current work, numerous other photoproduct ions have been identified, which warrant further study to achieve full, structural assignments. Focusing on the major photoproduct ions, m/z 345, 375, 381, and 511, we tentatively assign these as follows: m/z 345 represents addition of amu 32 to the precursor ion, and therefore likely represents photoactivated addition of either MeOH or O2 to THC (photoactivated addition of MeOH to CBD has been observed previously [25]; m/z 375 corresponds to the m/z value of the precursor ion of THC-COOH, which appears to be produced from THC via a photoactivated oxidation reaction; m/z 511 corresponds to loss of 116 amu from the dimer, consistent with aromatization of one THC moiety to CBN and associated loss of the phenol ring and butyl side chain. The m/z 381 fragment can be formed either via addition of amu 68 to the precursor ion or, more likely, through loss of 246 amu from the dimer. (Formation from m/z 627 likely occurs through a multistep process, resulting in eventual loss of the alkyl rings.) Tentative assigned photoproduct structures are given in Table S6.
We next present the comparable results for the THC isomer, cannabidiol CBD. Figure 4 presents the UV-Vis absorption spectrum (210-460 nm, in methanol) of CBD. (A solution of 1 x10⁻⁵ M was studied for consistency with the THC measurements.) The CBD spectrum is notably similar to that of THC (Figure 1), with three main absorption bands I-III with λmax values of 216, 232, 276 nm, respectively, and agrees well with a previously reported spectrum [32]. Photolysis at 280 nm was conducted on the CBD solution, with UV-Vis spectra recorded to monitor photolysis (Figure 4). Like THC, the Band I and II features decrease gradually upon irradiation, with a new, broad band appearing at longer wavelengths (λmax = 302 nm). Plots of the changes of the CBD absorbance intensity at selected UV-VIS wavelengths as a function of photolysis time are given in Figure S3. These confirm the similarity of the effects of 280 nm photolysis on the UV-Vis spectral profiles of THC and CBD. (Like THC, the UV-Vis spectrum of CBD is unaffected by 365 nm photolysis.)
CBD and THC are believed to remain in their precursor isomer form in neutral methanol, although they can interconvert under acidic or thermal perturbations [45,46,47]. While some heating occurs in our photolysis experiments [30], we assume that the isomers remain intact given the fact the overall band shape profiles are similar despite photolysis reducing the absorbance intensity. The highly similar UV-Vis absorption profiles (and photolysis behaviour) of CBD and THC can then be attributed to the two molecules possessing very similar chromophores.
To further investigate the nature of 280 nm photolysis of CBD, ESI-MS was conducted on photolyzed solutions of CBD, with results presented in Figure S4. Like THC, no significant CBD photolysis was evident for 365 nm excitation, but extensive 280 nm photolysis was seen. The major 280 nm photofragment ions observed are m/z 359, 345, 375, 363 and 389, with m/z 345 and 375 assigned as for THC, and m/z 359 likely corresponding to oxidation of the m/z 345 species accompanied by loss of 2H. (Oxidation and dehydrogenation is a common photo-initiated reaction for cannabinoids [18,20,21]. m/z 363 can be assigned to hydrolysis of the m/z 345 product, with m/z 389 corresponding to addition of a further O atom to m/z 375 species accompanied by loss of 2H. A full list of CBD photoproduct ions is included in Table 1. Tentative assigned photoproduct structures are given in Table S6.
Figure 5 presents the accompanying TRPMS of CBD, with Figure 5a showing the light-induced depletion of the [CBD–H]⁻ precursor ion (m/z 313), accompanied by the formation of the five most intense photoproducts, while Figure 5b displays the next highest ion intensity products (m/z 391, 407, 477, 479 and 481). Among the photoproducts, m/z 345 exhibits a profile consistent with its identification as an intermediate, with its intensity peaking at ~14 min before declining at longer times. The m/z 359 photoproduct peaks with the m/z 345 ion, but then displays a constant intensity. In contrast, the m/z 363, 375, and 389 ion intensities rise steadily across the photolysis period, plateauing to long photolysis times. All of these ions are stable end products, as are the less intense photoproducts of Figure 5b. Overall, the CBD TRPMS, like those of THC, indicate a mechanistic sequence in which the primary transient intermediate, m/z 345, feeds into a suite of stable higher-mass products.
Comparing the TRPMS results of THC and CBD, depletion of the precursor ion (m/z 313) occurs over a similar timescale (10-20 mins). However, THC photolysis leads to more intense transient intermediates (m/z 345 and 381) compared to CBD (m/z 345), and a different set of photoproducts are observed for the two molecules. These differences are significant enough to give us confidence that THC and CBD are not equilibrating to a common solution mixture under the conditions of our study.
Although the photolysis results are distinctive for THC and CBD, the molecules produce many common photoproducts (Table 1), albeit with intensity variation. For example, CBD has more intense product ions with values between m/z 479–513, an observation consistent with its known dimerization under UV exposure [20]. The most notable result to emerge from our comparative study is that it is clear that both THC and CBD produce numerous photoproducts following UVB excitation. This result challenges earlier photolysis studies of THC which identified only a single photolysis pathway [44]. Nonetheless, the overall similarity of their photolysis behavior is fully consistent with the broad similarity in their geometric and electronic structures.
2.2. The THC Metabolites (THCOOH and THCOH)
Figure 6 displays the UV-Vis absorption spectrum (210-460 nm) of the THC metabolite THCOOH in methanol. The spectrum is similar to the THC/CBD spectra, with bands assigned with λmax = 218 nm (band I), 230 nm (band II), and 280 nm (band III). Solution-phase 280 nm photolysis was performed from 0-120 mins, resulting in the band I and II features decreasing steadily in intensity up to 120 min, consistent with light-induced breakdown. A new, broad band again appeared at longer wavelengths with λmax at 302 nm and 354 nm (Bands IV and V). Figure S6 provides plots of the absorbance intensity changes at selected UV-VIS wavelengths as a function of photolysis time, showing that THCOOH degrades more rapidly for 280 nm photolysis than THC or CBD.
The ESI-MS obtained for a solution of THCOOH prior to irradiation and after 30 mins of irradiation with 280 and 365 nm LEDs are shown in Figure S7. The precursor ion [THCOOH–H]⁻ (m/z 343) is clearly visible prior to irradiation, with a strong [THCOOH–H]⁻⋅THCOOH dimer peak visible at m/z 687. No significant photolysis is observed for 365 nm irradiation (Figure S7b), consistent with THCOOH’s low absorption intensity at 365 nm (Figure 6). In contrast, UVB photolysis (280 nm) results in dramatic reduction of the precursor ion, accompanied by formation of numerous photoproducts (Figure S7c). The most intense photofragment ions are m/z 313, 331, 363 and 375. Table S2 provides a full list of THCOOH photofragment ions.
TRPMS results for THCOOH (280 nm) are presented in Figure 7, showing the photolysis profile of the [THCOOH–H]⁻ precursor, along with those of the 10, highest-intensity photoproducts. The [THCOOH–H]⁻ precursor ion (m/z 343) decreases gradually in intensity from 4-25 mins, with changes in the photoproduct ion intensity occurring up to 30 mins. The m/z 363 product is present prior to photolysis but then steadily increases in intensity as the precursor decays, eventually emerging as the major photoproduct. This likely indicates that it is present in the precursor solution as a result of ambient photolysis. m/z 375 is the second highest intensity photoproduct: It increases in intensity rapidly at earlier photolysis time, but then largely plateaus above t = 15 mins. The m/z 331 ion displays the profile of a reaction intermediate, as its intensity peaks around t = 13 mins. Other ions such as m/z 383, 557, and 625 increase in intensity steadily. The m/z 331 ion was observed previously in hydrolysis of aquatic samples of THCOOH by Boix et al [48], and assigned to a transformation product associated with loss of a methyl from the cyclohexanoate ring. In that study, m/z 375 was detected as a photolysis (simulated sunlight) product and corresponds to a +32 Da mass shift relative to the parent ion (m/z 343), consistent with dihydroxylation. The m/z 363 ion represents a +20 Da mass shift and can tentatively be assigned to mono-hydroxylation accompanied by additional hydrogen incorporation. We note that m/z 375 is also consistent with addition of methanol to the precursor, as for THC and CBD. Tentative assigned photoproduct structures are given in Table S6.
Figure 8 displays the UV-Vis absorption spectra (210-460 nm) of a second THC metabolite THC-OH. The spectrum is again similar to those of THC, CBD and THCOOH although the band II feature is relatively less intense. Features are assigned as follows with Bands I (λmax = 216 nm), II (λmax = 236 nm) and III (λmax = 264 nm). 280 nm photolysis was conducted on the THC-OH solution from 0-120 mins, with the resulting UV-Vis spectra displayed on Figure 8. Light-induced breakdown of THCOH is visible in the reduction of the Band I and II features, and the appearance of the new, broad longer wavelength bands with λmax at 304 nm and 344 nm (Bands IV and V). Figure S9 presents the changes in the absorbance intensity as a function of photolysis time at selected wavelengths.
Figure S10 shows the ESI-MS of [THCOH-H]- obtained prior to irradiation, and after 30 mins of irradiation with 280 and 365 nm. The precursor ion [THCOH–H]⁻ is visible at m/z 329, along with a strong dimer peak is again visible at m/z 659. For UVA photolysis (365 nm), the precursor ion intensity is unaffected and no photoproducts are evident (Figures S10b). In contrast, on UVB photolysis (280 nm), the precursor ion dramatically decreases in intensity, and a large number of photoproducts are evident (Figure S10c). Table S3 provides a full list of the photoproduct ions.
The TRPMS for 280 nm photolysis of [THCOH-H]- is displayed in Figure 9. At times > 4 mins, the precursor ion (m/z 329) intensity decreases steadily, concomitant with the formation of a group of photoproducts (m/z 361, 391, 407, 439, 423, 459, 525, and 529). The m/z 361 photoproduct is the dominant photoproduct through most of the photolysis time, peaking as an intermediate photoproduct around 17 mins, prior to the end products (e.g., m/z 361, 407, 423) reaching an equilibrium distribution with it at t = 30 mins. It corresponds to addition of 32 amu to the precursor and can therefore again be assigned as resulting from photoactivated addition of MeOH (or O2) to the cannabinoid. Overall, the ten most intense photoproducts eventually achieve similar product ion intensities, consistent with complex and highly branched photolysis pathways. Tentative assigned photo product structures are given in Table S6.
2.3. CBDA and THCA
The photolysis behavior of the carboxylated cannabinoids, tetrahydrocannabinolic acid (THCA) and cannabidiolic acid (CBDA), were investigated using the same approaches as for the cannabinoids and the metabolites. THCA and CBDA are the biosynthetic precursors of THC and CBD, and their additional carboxyl group has been suggested to influence photostability and overall stability under light/heat stress [22,49], so it is useful to fully characterize their photolysis. This pair of molecules are again isomeric.
Figure 10 displays the UV–Vis absorption spectrum of CBDA in methanol, showing three characteristic bands, with the strongest absorption band (I) peaking at λmax ≈ 224 nm, a medium-intensity band (II) at ~260, and a less intense band (III) at ~300 nm. The overall spectral profile is distinctive to those of the cannabinoids presented above due to the electronic influence of the additional aromatic carboxylic acid group. Upon irradiation with 280 nm light over 120 minutes, all three bands I-III gradually decreased in intensity, while a new broad (band IV) feature emerging to longer wavelengths (λmax ~ 330 nm), consistent with the production of more conjugated photoproducts. Figure S12 presents the changes in the absorbance intensity at selected wavelengths as a function of photolysis time, to complement these qualitative observations.
The ESI-MS of [CBDA-H]- obtained prior to irradiation, and after 30 mins of irradiation at 280 and 365 nm are shown in Figure 11. The precursor ion [CBDA–H]⁻ is visible at m/z 357, with a strong dimer peak is again visible at m/z 715. When CBDA was photolyzed at 365 nm, the [CBDA–H]⁻ precursor ion (m/z 357) was observed to remain as the dominant ion over the photolysis time (Figure 11, LHS), with the m/z 373, 389, and 403 ions appearing as low intensity photoproducts. For 280 nm photolysis, modest photolysis was observed, with the precursor ion intensity decreasing gradually over 30 minutes of photolysis, accompanied by the appearance of several fragment ions, with the m/z 373 fragment being the major photoproduct ion, along with m/z 389 and 403 (Figure 11, RHS). m/z 373 corresponds to addition of amu 16 to the precursor, so can be assigned to photoactivated addition of O to CBDA. Addition of amu 32 is again evident in production of the m/z 389 ion, indicating photoactivated addition of MeOH. m/z 403 can be assigned to addition of amu 32, plus addition of O with loss of 2H atoms. 280 nm occurs on the shoulder of Band II, so results in less effective 280 nm photodegradation than for cannabinoids studied above. The corresponding TRPMS of CBDA are shown in Figure S13 and S14 for 365 and 280 nm photolysis. Table S4 provides a full list of the CBDA photoproduct ions. Tentative assigned photoproduct structures are given in Table S6.
Figure 12 shows the absorption spectrum of THCA which was studied in acetonitrile due to poor solubility of the molecule in methanol. The spectrum is similar to that of CBDA, with a three-band profile (Band I (λmax ≈ 226 nm), band II (λmax ~274 nm), and band III (λmax ~308 nm)). Photolysis at 280 nm over 120 mins produced similar results to CBDA, with decreases in bands I, II and III and a low-intensity, long-wavelength feature emerging at around λmax = 342 nm (band IV) following irradiation. Figure S16 for THCA shows changes in the absorbance intensity at selected wavelengths as a function of photolysis time.
Figure 13 shows the ESI-MS of [THCA-H]- obtained prior to irradiation, and after 30 mins of irradiation at 280 and 365 nm. The precursor ion [THCA–H]⁻ is visible at m/z 357, with a strong dimer peak at m/z 715. Photolysis is evident upon 365 nm irradiation (Figure 13, LHS), visible via the decrease of the precursor ion and appearance of several, low-intensity photoproducts at m/z 371, 389, and 455. 280 nm irradiation also results in photolysis (Figure 13, RHS), with production of the m/z 371 fragment ion as the major photoproduct ion, along with m/z 389, 403 and 684. Like CBDA, the extent of 280 nm photolysis is again lower than for the cannabinoids studied above (Section 2.1 and Section 2.2), due to 280 nm excitation occurring in a region of relatively lower absorption intensity.
The corresponding TRPMS of THCA are given in Figures S17 and S18 for 280 and 365 nm photolysis, with Table S5 providing a full list of the photoproduct ions. Tentative assigned photoproduct structures are given in Table S6.
2.4. Synthetic Cannabinoids (JWH-018 and MDMB-FUBINACA)
Across all photolysis experiments, both JWH-018 and MDMB-FUBINACA displayed high photochemical stability, with no evidence of degradation under either 280 nm or 365 nm irradiation. For both molecules, the UV–Vis spectra (Figures S20 and S21) remained essentially unchanged over the full irradiation period, indicating no significant degradation at either 365 or 280 nm. The corresponding time-dependent absorbance plots (Figures S22 and S23) further confirmed this. Consistent with these measurements, ESI-MS (Figures S24 and S25) recorded before and after irradiation for both of the synthetic cannabinoids were effectively identical, with the precursor ions and their characteristic, collisional fragment ions displaying stable intensities and no photoproducts appearing. These results demonstrate that both JWH-018 and MDMB-FUBINACA are photostable at 365 and 280 nm, in distinct contrast to natural cannabinoids such as THC and CBD, which readily undergo oxidative and structural transformations under similar irradiation. The photostability of these molecules at these excitation energies can be directly traced to their low absorbances at these wavelengths (Figures S20 and S21).
3. Materials and Methods
General: Δ9-tetrahydrocannabinol (THC), 11-nor-9-carboxy-Δ9-tetrahydrocannabinol (THC-COOH-11), and 11-hydroxy-Δ9-tetrahydrocannabinol (THC-OH-11) standards were purchased from Cambridge Bioscience (Cambridge, UK). MDMB-FUBINACA, JWH-018, Cannabidiolic Acid (CBDA), Tetrahydrocannabinolic acid (2-COOH-THC), were purchased from Sigma Aldrich (Gillingham, UK). All samples were purchased as solutions in methanol except for MDMB-FUBINACA and Tetrahydrocannabinolic acid which were available only in acetonitrile. HPLC-grade methanol and acetonitrile were used to dilute the standards and were purchased from Fisher Scientific, Inc. (Pittsburgh, PA, USA).
UV-Vis Spectroscopy: Ultraviolet-visible (UV-Vis) spectroscopy measurements were recorded using a Genesys™ 180 Spectrophotometer (ThermoFisher Scientific) in double beam mode at a resolution of 2 nm measuring absorbance from 200 nm to 600 nm. The mounted T-Cube LED diode (part number: M280L6 and M365L2) illuminating light at a wavelength of 280 nm and 365 nm was purchased from Thorlabs (Ely, UK). A T-Cube power supply (part number: LEDD1B) was also purchased from the same supplier. For the UV-Vis photolysis experiment, all molecules were placed in a cuvette (with a cap on to prevent sample evaporation) with a 1 cm path length and approximately 3 mL volume of working solution. The samples were directly irradiated by the LED at different time intervals, using the full intensity (0.5 A for 280 nm and 1.0 A for 365 nm) of the diode. Recordings of the irradiated samples on a UV-Vis spectrometer for THC, CBD, THC-COOH, THC-OH, MDMB-FUBINACA, and JWH-018 were taken at time intervals of 0, 5, 10, 15, 30, 60, and 120 minutes. For 2-COOH-THC and CBDA, recordings were taken at time intervals of 0, 5, 10, 20, 40, 80, and 120 minutes after photolysis began. This was to optimise the data collection for the individual systems. Methanol was used as the blank (baseline) solvent for all samples except for MDMB-FUBINACA and THCA acid, where acetonitrile was used (all solution concentrations were 10-5 M). Solutions were stored in amber bottles to prevent photolysis from ambient light sources prior to experiments.
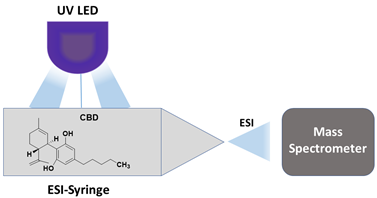
UV Photolysis with Online-Mass Spectrometry Detection: Experiments were conducted by allowing the LED light to fall on a custom-made quartz-glass syringe (6.82 mm diameter) which was built with a Luer lock tip to allow connection to the ESI needle. This is a modified technique of a similar method we have employed previously [27,30]. The ESI output was introduced into the commercial mass spectrometer as in normal operation, and ESI-MS recorded to probe solution photolysis. The quartz glass used for the syringe was transparent to both UVA and UVB light. The LED light sources used were 365 nm and 280 nm, with the LED being positioned between 10–20 mm from the syringe. MS obtained during photolysis (on spectra) were compared to MS obtained for identical solutions under dark conditions where the syringe was enclosed in a black box without LED irradiation. Solution concentration used was 1 x 10⁻⁵ M in either methanol or acetonitrile, dependent on the compound being studied and its solubility in these solvents. Mass spectra (full ion spectra acquisition) were recorded at various time intervals after photolysis as initiated by turning on the LED, to prevent cross-contamination and eliminate residual signals, the instrument was extensively washed with the appropriate solvent for a sufficient duration between each measurement. Each experiment was performed in triplicate to ensure reproducibility of the results.
Mass spectra were recorded using an amaZon SL Dual Funnel Ion Trap Mass Spectrometer (Bruker Daltonics, Germany) as described previously [42], with an electrospray ionization source using the following settings: A syringe-pump set to inject solution at 0.60 mL/hr, with an MS scan range of 50-800 m/z was recorded for scan time of 1 minute. MS tuning- For All, Trap- Enhanced resolution, ICC Target- 100000, Max. Accu Time- 200 ms, Average- 15. High-resolution mass spectrometry was performed on an Orbitrap™ Fusion Tribrid mass spectrometer (Thermo Fisher Scientific), with an electrospray ionization source using the following settings: Flow rate 3 μL/min; MS2 scan isolation mode, orbitrap; detector type, orbitrap; ion spray voltage (3500 V); RF lens (60%); normalized AGC target (100%); maximum injection time (100 ms); ion transfer tube temperature (280 °C); and vaporizer temperature (20 °C). For the MS scan in this instrument, the settings were as follows: detector type, Orbitrap; negative ion spray voltage (3200 V); RF lens (45%); normalized AGC target (100%); and maximum injection time (100 ms).
4. Conclusions
The photolysis profiles of a group of cannabinoids have been studied using a combination of UV-Vis spectroscopy and mass spectrometry, using excitation wavelengths in the UVA and UVB (365 and 280 nm). Inspection of the UV-Vis spectra as a function of photolysis time reveals that all six phytocannabinoids (THC, CBD, THCA, CBDA, THC-COOH, THC-OH), photodegrade with 280 nm excitation, whereas the synthetic cannabinoids (JWH-018, MDMB-FUBINACA) do not. None of the cannabinoids displayed significant photodegradation with 365 nm excitation, consistent with the molecules’ low absorbances at that photon energy. Based on precursor-ion half-lives (t₁/₂) derived from TRPMS measurements, THC-COOH photodegrades most rapidly (t₁/₂ ≈ 10 min), degrading ~1.3 times faster than THC (t₁/₂ ≈ 13 min). THC, CBD (t₁/₂ ≈ 15 min), and THC-OH (t₁/₂ ≈ 15.5 min) exhibit comparable longer, decay rates. In contrast, the acidic cannabinoids, THCA and CBDA, do not reach 50% decay within the experimental timeframe (t₁/₂ > 30 min), while no measurable photodegradation is observed for JWH-018 and MDMB-FUBINACA.
On-line photolysis coupled with time-resolved mass spectrometry was applied to determine the photoproducts of THC, CBD, THCA, CBDA, THC-COOH, THC-OH. We found that all of these cannabinoids display numerous photodegradation pathways, although photoactivated addition of methanol is dominant. Other common degradation pathways include aromatization, addition of oxygen, and addition/loss of H atoms. (H atom loss is a well-known photolytic breakdown pathway for phenol moieties [50,51]. While these general pathways were identified previously in separate photolysis studies of CBD and THCA, our study is the first to provide a comparable study for the set of key cannabinoids, and thus demonstrates the generality of the mechanisms. This insight will be valuable for subsequent toxicological analysis of the photoproducts. Furthermore, our TRPMS results provide direct mechanistic insight into the competing photolysis pathways, indicating that initial photoactivated addition of methanol commonly acts as an early step that feeds into the formation of multiple secondary photoproducts [25,52]. While structural assignments presented in the current work are tentative, it will be possible to perform further structural characterization via IRMPD spectroscopy linked to TRPMS in future work [33].
The results for THC and CBD merit further comment. Our results show distinct differences in the photoproduct ions generated on 280 nm photolysis for the two molecules, a result that is not in agreement with earlier results [25,44]. While a prior study of CBD had identified a mix of photoproducts, much earlier work on THC had identified only limited photoproduct formation [44]. The results obtained here are reasonable given the close geometric (and hence electronic) structures of the THC and CBD isomeric pair. Perhaps more interesting, it is notable that despite their similar structures, THC and CBD each produce a distinctive set of photoproducts, particularly in terms of the relative product intensities. This is interesting as it suggests that UV photodissociation of these systems could be used for structure verification [53,54].
The synthetic cannabinoids, JWH-018 and MDMB-FUBINACA displayed no significant photolysis under either UVA or UVB irradiation. The molecular structures of these synthetic cannabinoids are strikingly different from the phytocannabinoids, readily explaining the different photolysis behavior [7]. These differences are important, however, in an environmental context, since photostability is aligned with persistence in the natural environment, indicating that these synthetic cannabinoids will have long residence times in the natural environment [13,14,15,16]. Conversely, the extent of photostability also impacts on the viability of tracking cannabinoids through water systems, a valuable goal for law enforcement. Accurate tracking further requires reliable differentiation between closely related cannabinoid isomers, such as Δ8-THC and Δ9-THC, which has recently been demonstrated using advanced mass spectrometry supported by computational analysis [55]. Our work indicates that tracking natural cannabinoids such as THC will be more challenging than some synthetic cannabinoids [8,15].
Supplementary Materials
The following supporting information can be downloaded at the website of this paper posted on Preprints.org. Figure S1: Absorbance versus photolysis time measurements for THC obtained from UV–Vis absorption spectra; Figure S2: Higher collision-induced dissociation (HCD) curves for [THC–H]⁻ showing precursor ion dissociation and fragment ion production as a function of HCD energy. Figure S3: Absorbance versus photolysis time measurements for CBD obtained from UV–Vis absorption spectra. Figure S4: ESI-MS spectra of CBD recorded under 365 and 280 nm photolysis conditions; Figure S5: HCD curves for [CBD-H]⁻ showing precursor ion dissociation and fragment ion production as a function of HCD energy. Figure S6: Absorbance versus photolysis time measurements for THC-COOH obtained from UV–Vis absorption spectra; Figure S7: ESI-MS spectra of THC-COOH recorded under 365 and 280 nm photolysis conditions. Figure S8: HCD curves for [THC-COOH–H]⁻ showing precursor ion dissociation and fragment ion production as a function of HCD energy. Figure S9: Absorbance versus photolysis time measurements for THC-OH obtained from UV–Vis absorption spectra; Figure S10: ESI-MS spectra of THC-OH recorded under 365 and 280 nm photolysis conditions. Figure S11: HCD curves for [THC-OH–H]⁻ showing precursor ion dissociation and fragment ion production as a function of HCD energy. Figure S12: Absorbance versus photolysis time measurements for CBDA obtained from UV–Vis absorption spectra; Figures S13 and S14: Time-resolved photolysis mass spectrometry (TRPMS) data for CBDA recorded during 365 and 280 nm photolysis; Figure S15: HCD curves for [CBDA–H]⁻ showing precursor ion dissociation and fragment ion production as a function of HCD energy. Figure S16: Absorbance versus photolysis time measurements for THCA obtained from UV–Vis absorption spectra; Figures S17 and S18: Time-resolved photolysis mass spectrometry (TRPMS) data for THCA recorded during 365 and 280 nm photolysis; Figure S19: HCD curves for [THCA–H]⁻ showing precursor ion dissociation and fragment ion production as a function of HCD energy. Figure S20: UV–Vis absorption spectra monitoring photolysis of JWH-018 and MDMB-FUBINACA; Figure S21: Absorbance versus photolysis time measurements for JWH-018 and MDMB-FUBINACA. Figure S22: ESI-MS spectra of JWH-018 and MDMB-FUBINACA recorded under 365 and 280 nm photolysis conditions. Table S6: Tentative structural assignments of observed photolysis fragments formed during photolysis of THC, CBD, THC-COOH, THC-OH, CBDA, and THCA. Figure S23: Photograph of the quartz syringe photolysis apparatus used in the experiments; Figure S24: Photograph of the experimental setup used for UV photolysis. Figure S25: UV–Vis absorbance versus wavelength spectra recorded at 0 min for all cannabinoids studied.
Author Contributions
Conceptualization, C.E.H.D.; methodology, C.E.H.D., A.S. and K.O.U.; investigation, A.S., K.P.S., and K.O.U.; formal analysis, A.S. and K.O.U.; resources, C.E.H.D..; data curation, A.S..; writing—original draft preparation, A.S..; writing—review and editing, C.E.H.D., A.S, K.P.S., and K.O.U.; supervision, C.E.H.D. and K.O.U.; All authors have read and agreed to the published version of the manuscript.
Funding
This research received no external funding, and the APC was funded by MDPI.
Data Availability Statement
Data is available from the corresponding author upon request.
Acknowledgments
We thank Abigail Mortimer for constructing the quartz syringe used in the experiments. A.S. gratefully acknowledges the Department of Chemistry and Dr Tony Wild for providing a Wild Doctoral Scholarship. The York Centre of Excellence in Mass Spectrometry, used for the HRMS work, was created thanks to a major capital investment through Science City York, supported by Yorkshire Forward with funds from the Northern Way Initiative, and has more recently received additional support from the Engineering and Physical Sciences Research Council and Biotechnology and Biological Sciences Research Council. Way Initiative, and has more recently received additional support from the Engineering and Physical Sciences Research Council and Biotechnology and Biological Sciences Research Council.
Conflicts of Interest
The authors declare no conflicts of interest.
References
- D. Duczmal, A. Bazan-wozniak, K. Niedzielska, and R. Pietrzak, “Cannabinoids—Multifunctional Compounds, Applications and Challenges—Mini Review,” Molecules, vol. 29, p. 4923, 2024,. [CrossRef]
- Stith, S. S.; Li, X.; Orozco, J.; Lopez, V.; Brockelman, F.; Keeling, K.; Hall, B.; Vigil, J. M. The effectiveness of common cannabis products for treatment of nausea. J. Clin. Gastroenterol. 2022, vol. 56(no. 4), 331–338. [Google Scholar] [CrossRef]
- Urits, M. Borchart, M. Hasegawa, J. Kochanski, V. Orhurhu, and O. Viswanath, “An update of current cannabis-based pharmaceuticals in pain medicine,” Pain Ther., vol. 8, no. 1, pp. 41–51, 2019. [CrossRef]
- Rosenberg, E. C.; Tsien, R. W.; Whalley, B. J.; Devinsky, O. Cannabinoids and epilepsy. Neurotherapeutics 2015, vol. 12(no. 4), 747–768. [Google Scholar] [CrossRef] [PubMed]
- Kanabus, J.; Bryła, M.; Roszko, M.; Modrzewska, M.; Pierzgalski, A. Cannabinoids—characteristics and potential for use in food production. Molecules 2021, vol. 26(no. 21), 6723. [Google Scholar] [CrossRef]
- Kuzumi, A. Yoshizaki-Ogawa, T. Fukasawa, S. Sato, and A. Yoshizaki, “The potential role of cannabidiol in cosmetic dermatology: A literature review,” Am. J. Clin. Dermatol., vol. 25, no. 6, pp. 951–966, 2024. [CrossRef]
- Antoniou, T.; Juurlink, D. N. Synthetic cannabinoids. Can. Med. Assoc. J. 2014, vol. 186, E210. [Google Scholar] [CrossRef]
- Castiglioni, S.; Griffiths, P. Assessing Illicit Drugs in Wastewater: Advances in wastewater-Based Drug Epidemiology; Publications Office of the European Union: Luxembourg, 2016. [Google Scholar]
- Trofin, G.; Dabija, G.; Văireanu, D. I.; Filipescu, L. Long-term storage and cannabis oil stability. Rev. Chim. 2012, vol. 63, 293–297. [Google Scholar]
- García-Valverde, M. T.; Sánchez-Carnerero Callado, C.; Díaz-Liñán, M. C.; Sánchez de Medina, V.; Hidalgo-García, J.; Nadal, X.; Hanuš, L.; Ferreiro-Vera, C. Effect of temperature on the degradation of cannabinoids: From gas chromatography inlet to thermal treatments. Front. Chem. 2022, vol. 10, 1038729. [Google Scholar] [CrossRef]
- Moreno, S.; Trouten, A.; Richards-Waugh, L.; Quiñones, R. Photodegradation and stability of cannabinoids: Forensic and analytical implications. J. Forensic Sci. 2024, vol. 69, 905–918. [Google Scholar] [CrossRef]
- Kim, E.; Park, S.; Kinney, C.; Olejar, K.; Corredor-Perilla, C. Stability and degradation kinetics of cannabinoids under environmental stressors. Res. Sq. 2024, preprint. [Google Scholar]
- How, Z. T.; Gamal El-Din, M. A critical review on the detection, occurrence, fate, toxicity, and removal of cannabinoids in the water system and the environment. Environ. Pollut. 2021, vol. 268, 115642. [Google Scholar] [CrossRef]
- Apul, G.; Rowles, L. S.; Khalid, A.; Karanfil, T.; Richardson, S. D.; Saleh, N. B. Transformation potential of cannabinoids during their passage through engineered water treatment systems: A perspective. Environ. Int. 2020, vol. 137, 105586. [Google Scholar] [CrossRef] [PubMed]
- Selwe, K. P.; Sallach, J. B.; Dessent, C. E. H. Non-targeted screening of contaminants of emerging concern in the Glen Valley wastewater treatment plant, Botswana. Environ. Toxicol. Chem. 2024, vol. 43, 52–61. [Google Scholar] [CrossRef]
- Saleh, N. B.; Apul, O.; Karanfil, T. The Genesis of a Critical Environmental Concern: Cannabinoids in Our Water Systems. Environ. Sci. Technol. 2019, vol. 53, 1746–1747. [Google Scholar] [CrossRef]
- Milan, S.; Pedrazzi, M. R.; De Laurentiis, F.; Fanelli, F. P.; Castiglioni, S. Detection of eight cannabinoids and one tracer in wastewater and river water by SPE–UPLC–ESI–MS/MS. Water 2022, vol. 14(no. 4), 588. [Google Scholar] [CrossRef]
- B. J. Thomson, S. Hanna, A. Schwarzenberg, P. Kiani, D. Bizzotto, P. Kennepohl, A. Davies, M. Roggen, and G. M. Sammis,“CBD hydroxyquinone photo-isomerises to a highly reactive intermediate,” Sci. Rep., vol. 13, p. 6967, 2023. [CrossRef]
- Ahmed, R.; Zhou, Y.; Singh, P. Photodegradation of cannabidiol (CBD) and Δ⁹-THC in cannabis chemotypes. Photochem. Photobiol. Sci. 2024, vol. 23(no. 5), 1567–1578. [Google Scholar]
- Bini; Salerno, S.; Protti, S.; Pollastro, F.; Profumo, A.; Morini, L.; Merli, D. Photodegradation of cannabidiol (CBD) and Δ⁹-THC in cannabis plant material. Photochem. Photobiol. Sci. 2024, vol. 23, 1239–1249. [Google Scholar] [CrossRef] [PubMed]
- Patel, K.; Shah, D. UV light-induced transformations of minor cannabinoids: analytical and safety considerations. Cannabis Cannabinoid Res. 2023, vol. 8(no. 3), 234–243. [Google Scholar]
- Zamengo; Frison, M.; Greggio, M.; Frasson, L.; Sciarrone, R.; Franchini, S. Stability of cannabinoids in cannabis resin and cannabis preparations. Forensic Sci. Int. 2019, vol. 298, 400–409. [Google Scholar] [CrossRef]
- Taschwer, S.; Schmid, S.; Moosmann, M.; Knabl, S. Stability of Δ⁹-tetrahydrocannabinol in cannabis products under different storage and light conditions. Forensic Sci. Int. 2014, vol. 236, 73–79. [Google Scholar]
- Fairbairn, J. W.; Liebmann, J. A. The stability of cannabis and its preparations on storage. J. Pharm. Pharmacol. 1974, vol. 26(no. 9), 413–419. [Google Scholar] [CrossRef]
- Shani; Mechoulam, R. Photochemical reactions of cannabidiol in solution. Tetrahedron 1971, vol. 27, 559–565. [Google Scholar] [CrossRef]
- Munjal, M.; Garg, S. K.; Ranjan, R. K. Stability of Δ⁹-tetrahydrocannabinol in polymeric matrices. AAPS PharmSciTech 2006, vol. 7, E71. [Google Scholar] [CrossRef]
- Wong, N. G. K.; Rhodes, C.; Dessent, C. E. H. “Photodegradation of riboflavin under alkaline conditions: what can gas-phase photolysis tell us about what happens in solution?”. Molecules 2021, vol. 26(no. 19), 6009. [Google Scholar] [CrossRef]
- Insińska-Rak, M.; Prukała, D.; Golczak, A.; Fornal, E.; Sikorski, M. Riboflavin degradation products: combined photochemical and mass spectrometry approach. J. Photochem. Photobiol. A 2020, vol. 403, 112837. [Google Scholar] [CrossRef]
- Pahl, M.; Mayer, M.; Schneider, M.; Belder, D.; Asmis, K. R. Joining microfluidics with infrared photodissociation: online monitoring of isomeric flow-reaction intermediates. Anal. Chem. 2019, vol. 91, 3199–3203. [Google Scholar] [CrossRef] [PubMed]
- Cercola, R.; Wong, N. G. K.; Rhodes, C.; Olijnyk, L.; Mistry, N. S.; Hall, L. M.; Berenbeim, J. A.; Lynam, J. M.; Dessent, C. E. H. A one-pot mass spectrometry technique for characterizing solution- and gas-phase photochemical reactions by electrospray mass spectrometry. RSC Adv. 2021, vol. 11, 19500–19507. [Google Scholar] [CrossRef]
- Shiels, J.; Menti-Platten, M.; Bokosi, F. R. B.; Burns, B. R.; Keaveney, S. T.; Keller, P. A.; Barker, P. J.; Trevitt, A. J. A photoreactor-interfaced mass spectrometer: an online platform to monitor photochemical reactions. Anal. Chem. 2023, vol. 95, 15472–15476. [Google Scholar] [CrossRef] [PubMed]
- Ryu, R.; Islam, M. J.; Azad, M. O. K.; Go, E.-J.; Rahman, M. H.; Rana, M. S.; Lim, Y.-S.; Lim, J.-D. Conversion characteristics of some major cannabinoids from hemp (Cannabis sativa L.) raw materials by new rapid simultaneous analysis method. Molecules 2021, vol. 26(no. 14), 4113. [Google Scholar] [CrossRef]
- Wilson, S. A.; Alsalem, A.; Berden, G.; Oomens, J.; Dessent, C. E. H. Spectroscopic characterization of the photolysis of riboflavin (vitamin B2) via time-resolved mass spectrometry and IRMPD spectroscopy. J. Phys. Chem. A vol. 129(no. 23), 5082–5091, 2025. [CrossRef]
- Zulfiqar, F.; Navarro, I.; Ahmad, S.; Radwan, M. M.; Ali, Z.; Khan, I. A.; ElSohly, M. A. Cannabisol, a methylene-bridged Δ⁹-tetrahydrocannabinol dimer isolated from Cannabis sativa. Tetrahedron Lett. 2012, vol. 53, 3560–3562. [Google Scholar] [CrossRef] [PubMed]
- G. Chianese, S. Subramaniam, A. Basile, S. Gerosa, F. Pollastro, A. Profumo, L. De Petrocellis, and V. Di Marzo, “Cannabitwinol, a dimeric phytocannabinoid from hemp (Cannabis sativa L.),” J. Nat. Prod., vol. 83, pp. 2727–2736, 2020. [CrossRef]
- Stryker, Z.; Castillo-Arellano, J. I.; Cutler, S. J.; Wyatt, M. D.; León, F. Semi-synthesis of dimeric cannabidiol derivatives and evaluation of their affinity at neurological targets. J. Nat. Prod. vol. 88, 397–414, 2025. [CrossRef]
- Selwe, K. P.; Shaikh, A. S. A.; Uleanya, K. O.; Dessent, C. E. H. Fragmentation and isomerization pathways of natural and synthetic cannabinoids studied via higher collisional energy dissociation profiles. Molecules vol. 30, 717, 2025. [CrossRef]
- Fan, Y.; Zong, X.; Liu, J.; Ke, X.; Huang, Z.; Xu, Y. Development of a fragmentation pattern of synthetic cannabinoids based on electrospray ionization mass spectrometry in positive ion mode to screen synthetic cannabinoids in illicit products. J. Pharm. Biomed. Anal. 2021, vol. 193, 113723. [Google Scholar] [CrossRef]
- Sekuła, K.; Zuba, D.; Lorek, K. Analysis of fragmentation pathways of new-generation synthetic cannabinoids using electrospray ionization. J. Am. Soc. Mass Spectrom. 2018, vol. 29, 1941–1950. [Google Scholar] [CrossRef]
- Mahmoud, R.; Khajavinia, A.; Barzegar, S.; Purves, R. W.; LaPrairie, R. Establishment of tandem mass spectrometric fingerprint of the most common phytocannabinoids in electrospray ionization in positive ion mode. Rapid Commun. Mass Spectrom. vol. 39(no. 4), e9952, 2025. [CrossRef]
- Sereli, M. Investigating the photodegradation of organic sunscreens in the gas phase and in solution: towards natural alternatives as means of photoprotection. M.Sc. by Research Thesis, University of York, York, UK, 2022. Available online: https://etheses.whiterose.ac.uk/id/eprint/31107/.
- Cercola, R.; Matthews, E.; Dessent, C. E. H. Photoexcitation of adenosine 5′-triphosphate anions in vacuo: probing the influence of charge state on the UV photophysics of adenine. J. Phys. Chem. B 2017, vol. 121(no. 22), 5553–5561. [Google Scholar] [CrossRef]
- Wong, N. G. K.; Berenbeim, J. A.; Dessent, C. E. H. Direct observation of photochemical free radical production from the sunscreen 2-phenylbenzimidazole-5-sulfonic acid via laser-interfaced mass spectrometry. ChemPhotoChem 2019, vol. 3, 1231–1237. [Google Scholar] [CrossRef]
- Allwardt, J.; Cook, L. F.; Razdan, R. K. Photochemical degradation of Δ⁹-tetrahydrocannabinol. J. Pharm. Sci. 1972, vol. 61, 185–187. [Google Scholar]
- Marzullo, P.; Foschi, F.; Coppini, D. A.; Fanchini, F.; Magnani, L.; Rusconi, S.; Luzzani, M.; Passarella, D. Cannabidiol as the substrate in acid-catalyzed intramolecular cyclization. J. Nat. Prod. 2020, vol. 83, 2894–2901. [Google Scholar] [CrossRef] [PubMed]
- Golombek, P.; Müller, C.; Barthlott, I.; Sproll, C.; Lachenmeier, D. W. Conversion of cannabidiol (CBD) into psychotropic cannabinoids under acidic conditions: a review. Front. Pharmacol. 2020, vol. 11, 583275. [Google Scholar] [CrossRef]
- Bröcker, S.; Pragst, F. Isomerization of cannabidiol and Δ⁹-tetrahydrocannabinol during positive electrospray ionization: in-source H/D exchange by FI-QTOF-MS. Rapid Commun. Mass Spectrom. 2012, vol. 26, 1676–1686. [Google Scholar] [CrossRef]
- Boix, C.; Ibáñez, M.; Sancho, J. V.; Hernández, F. Photodegradation of the main THC metabolite (THC-COOH) in surface waters under UV and simulated sunlight. Chemosphere 2014, vol. 117, 203–210. [Google Scholar] [CrossRef]
- Zivovinovic, S.; Alder, R.; Allenspach, M. D.; Steuer, C.; Mahatthanatrakul, W.; Rattarom, R.; Liawruangrath, S.; Liawruangrath, B.; Pyne, S. G.; Korth, J.; Zuba, D.; Lorek, K. Determination of cannabinoids in Cannabis sativa L. samples by UHPLC–UV–MS: stability studies of acidic cannabinoids under thermal and UV stress. Anal. Bioanal. Chem. 2018, vol. 410, 6305–6316. [Google Scholar] [CrossRef]
- Tseng, C.-M.; Lee, Y.-T.; Ni, C.-K. H atom elimination from the πσ state in the photodissociation of phenol. J. Chem. Phys. 2004, 121, 2459–2461. [Google Scholar] [CrossRef]
- Iqbal and V. G. Stavros, Exploring the time scales of H-atom elimination from photoexcited indole and related heteroaromatics, J. Phys. Chem. A, 113, 8157–8163, 2009. [CrossRef]
- Seccamani, P.; Protti, S.; Pollastro, F.; Profumo, A.; Merli, D. Photochemistry of cannabidiol (CBD) revised: A combined preparative and spectrometric investigation. J. Nat. Prod. 2021, vol. 84, 2356–2366. [Google Scholar] [CrossRef]
- Matthews, E.; Dessent, C. E. H. Locating the proton in nicotinamide protomers via low-resolution UV action spectroscopy of electrosprayed solutions. J. Phys. Chem. A 2016, vol. 120, 9209–9216. [Google Scholar] [CrossRef] [PubMed]
- Hansen, C. S.; Blanksby, S. J.; Trevitt, A. J. Ultraviolet photodissociation action spectroscopy of gas-phase protonated quinoline and isoquinoline cations. Phys. Chem. Chem. Phys. 2015, vol. 17, 25882–25890. [Google Scholar] [CrossRef]
- Ke, X.; Chen, X.; Chen, X.; Wu, H.; Fan, Y.; Xu, Y.; Xu, J. Differentiating Δ8-THC and Δ9-THC isomers: Mass spectrometry analysis and computational explanation. Rapid Commun. Mass Spectrom. vol. 40(no. 5), e70011, 2025. [CrossRef] [PubMed]
Scheme 1.
Structures, chemical formulae and exact masses (parenthesis) of the cannabinoids studied in this work, namely a) Δ9-tetrahydrocannabinol (THC), b) cannabidiol (CBD), c) 11-nor-9-carboxy-Δ9-tetrahydrocannabinol (THCOOH), d) 11-hydroxy-Δ9-tetrahydrocannabinol (THCOH), e) Cannabidiolic Acid (CBDA), f) Tetrahydrocannabinolic acid (THCA), g) MDMB-FUBINACA, and h) JWH-018.

Figure 1.
Solution-phase UV-Vis absorption spectra of THC in MeOH obtained following irradiation at 280 nm over 0–120 mins.
Figure 1.
Solution-phase UV-Vis absorption spectra of THC in MeOH obtained following irradiation at 280 nm over 0–120 mins.
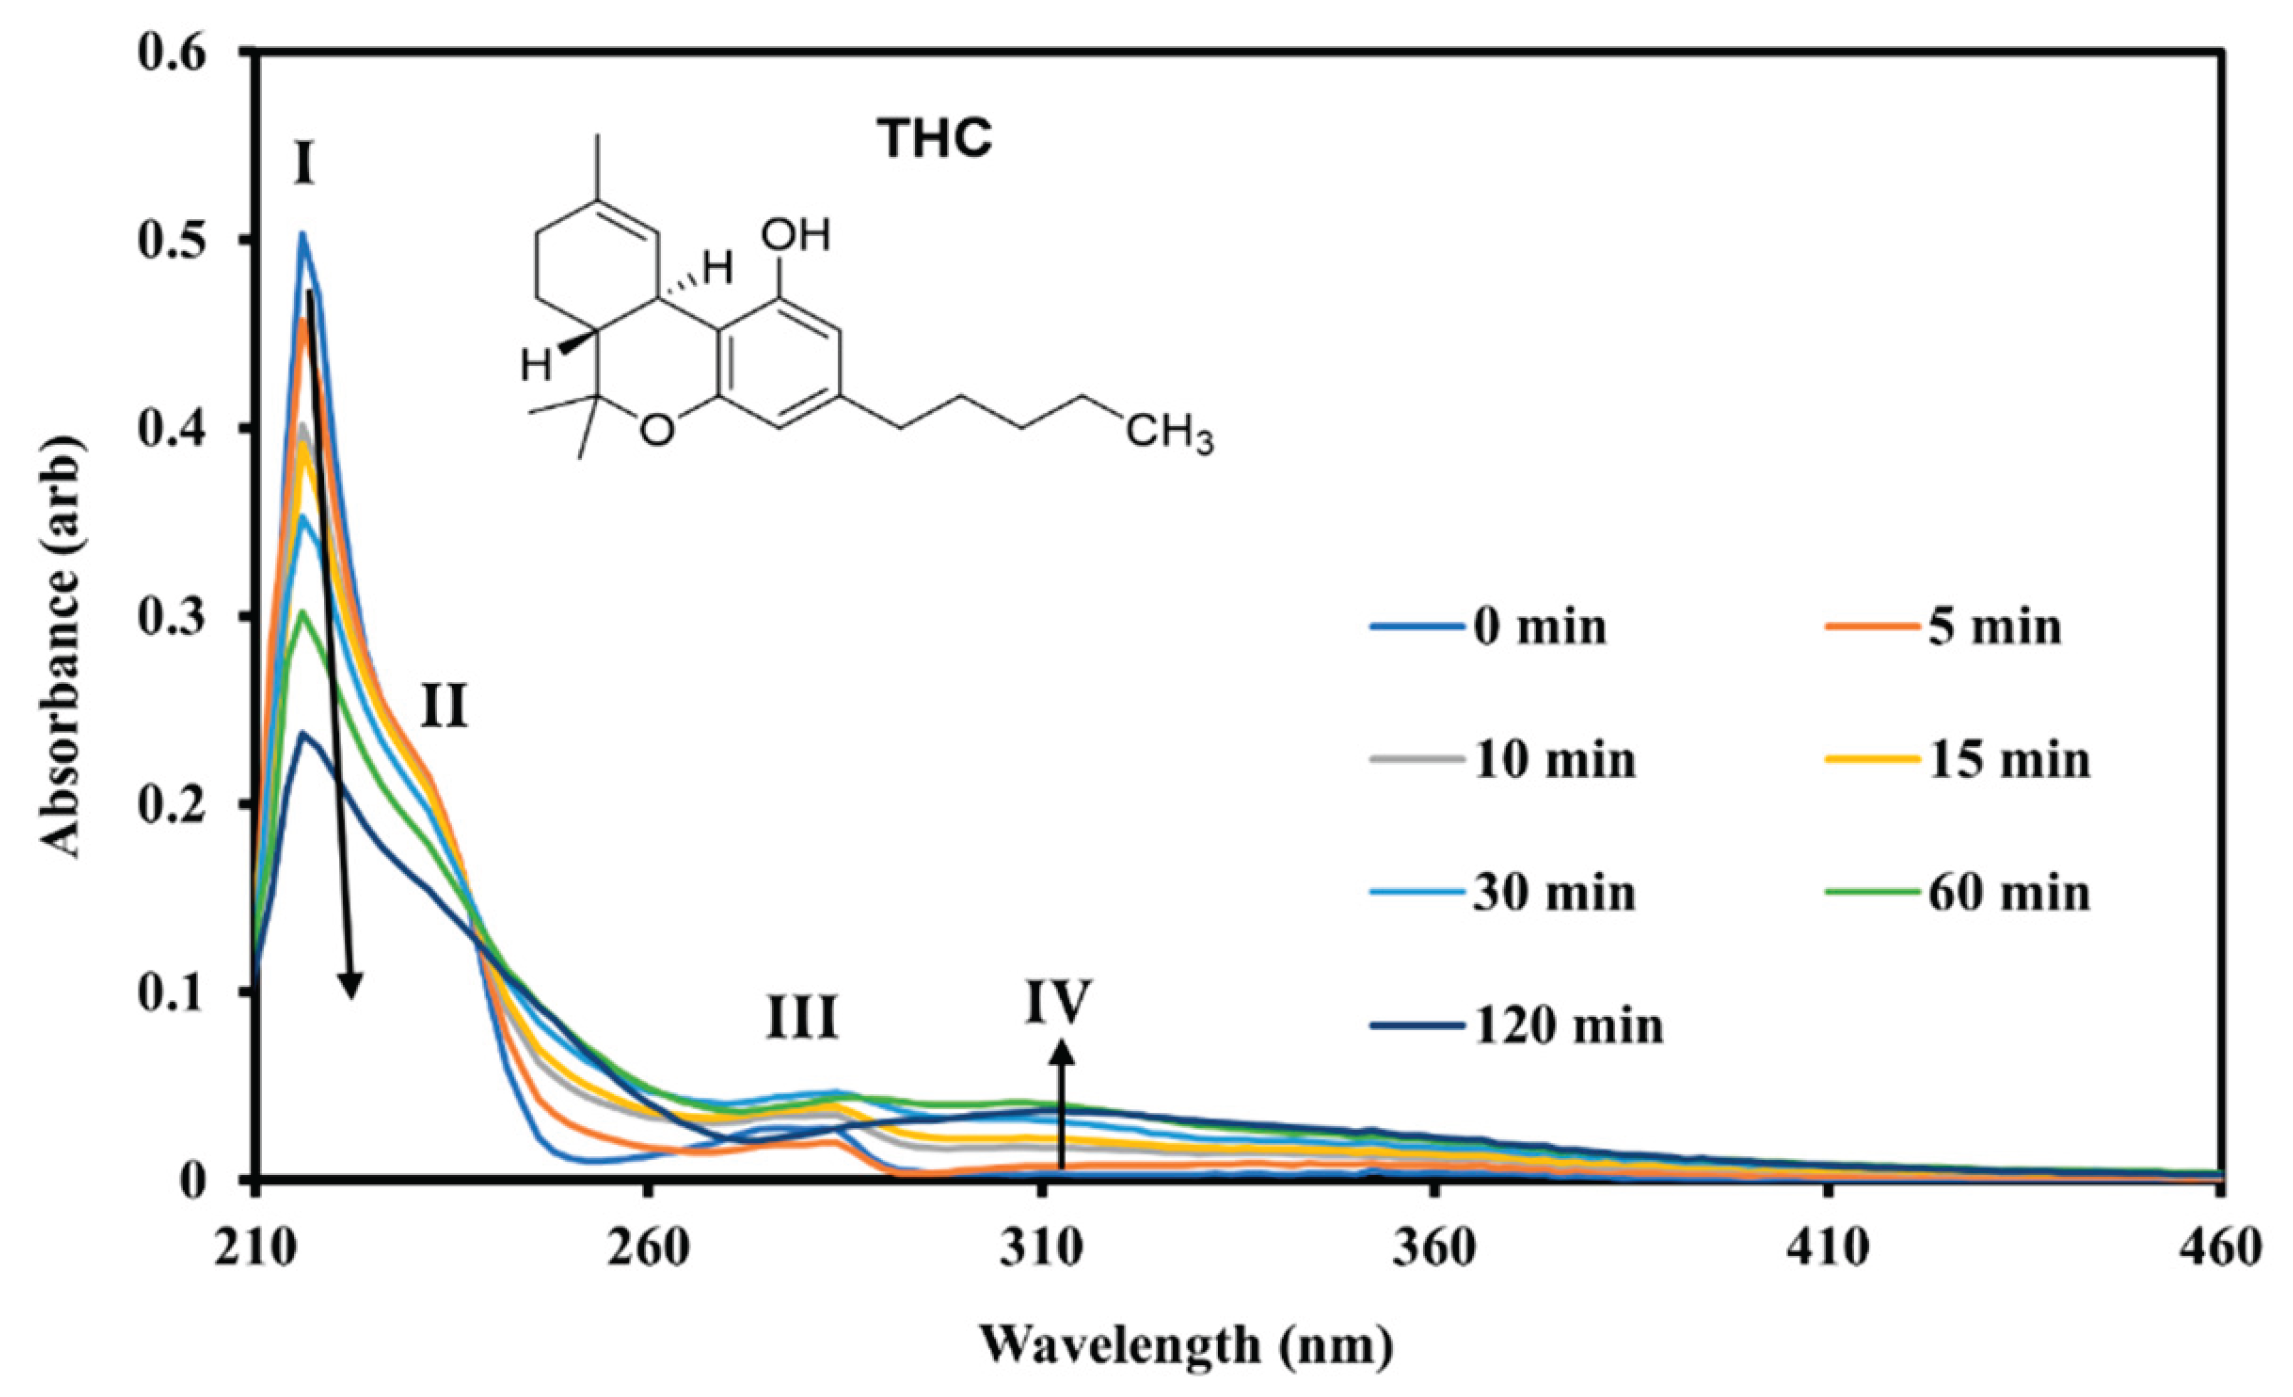
Figure 2.
(a) Photolysis OFF and (b-c) photolysis ON ESI MS of THC obtained in negative ion mode. (b) and (c) displays the ESI-MS obtained with 365 and 280 nm photolysis, respectively. The [THC–H]⁻ precursor ion is visible at m/z 313.
Figure 2.
(a) Photolysis OFF and (b-c) photolysis ON ESI MS of THC obtained in negative ion mode. (b) and (c) displays the ESI-MS obtained with 365 and 280 nm photolysis, respectively. The [THC–H]⁻ precursor ion is visible at m/z 313.
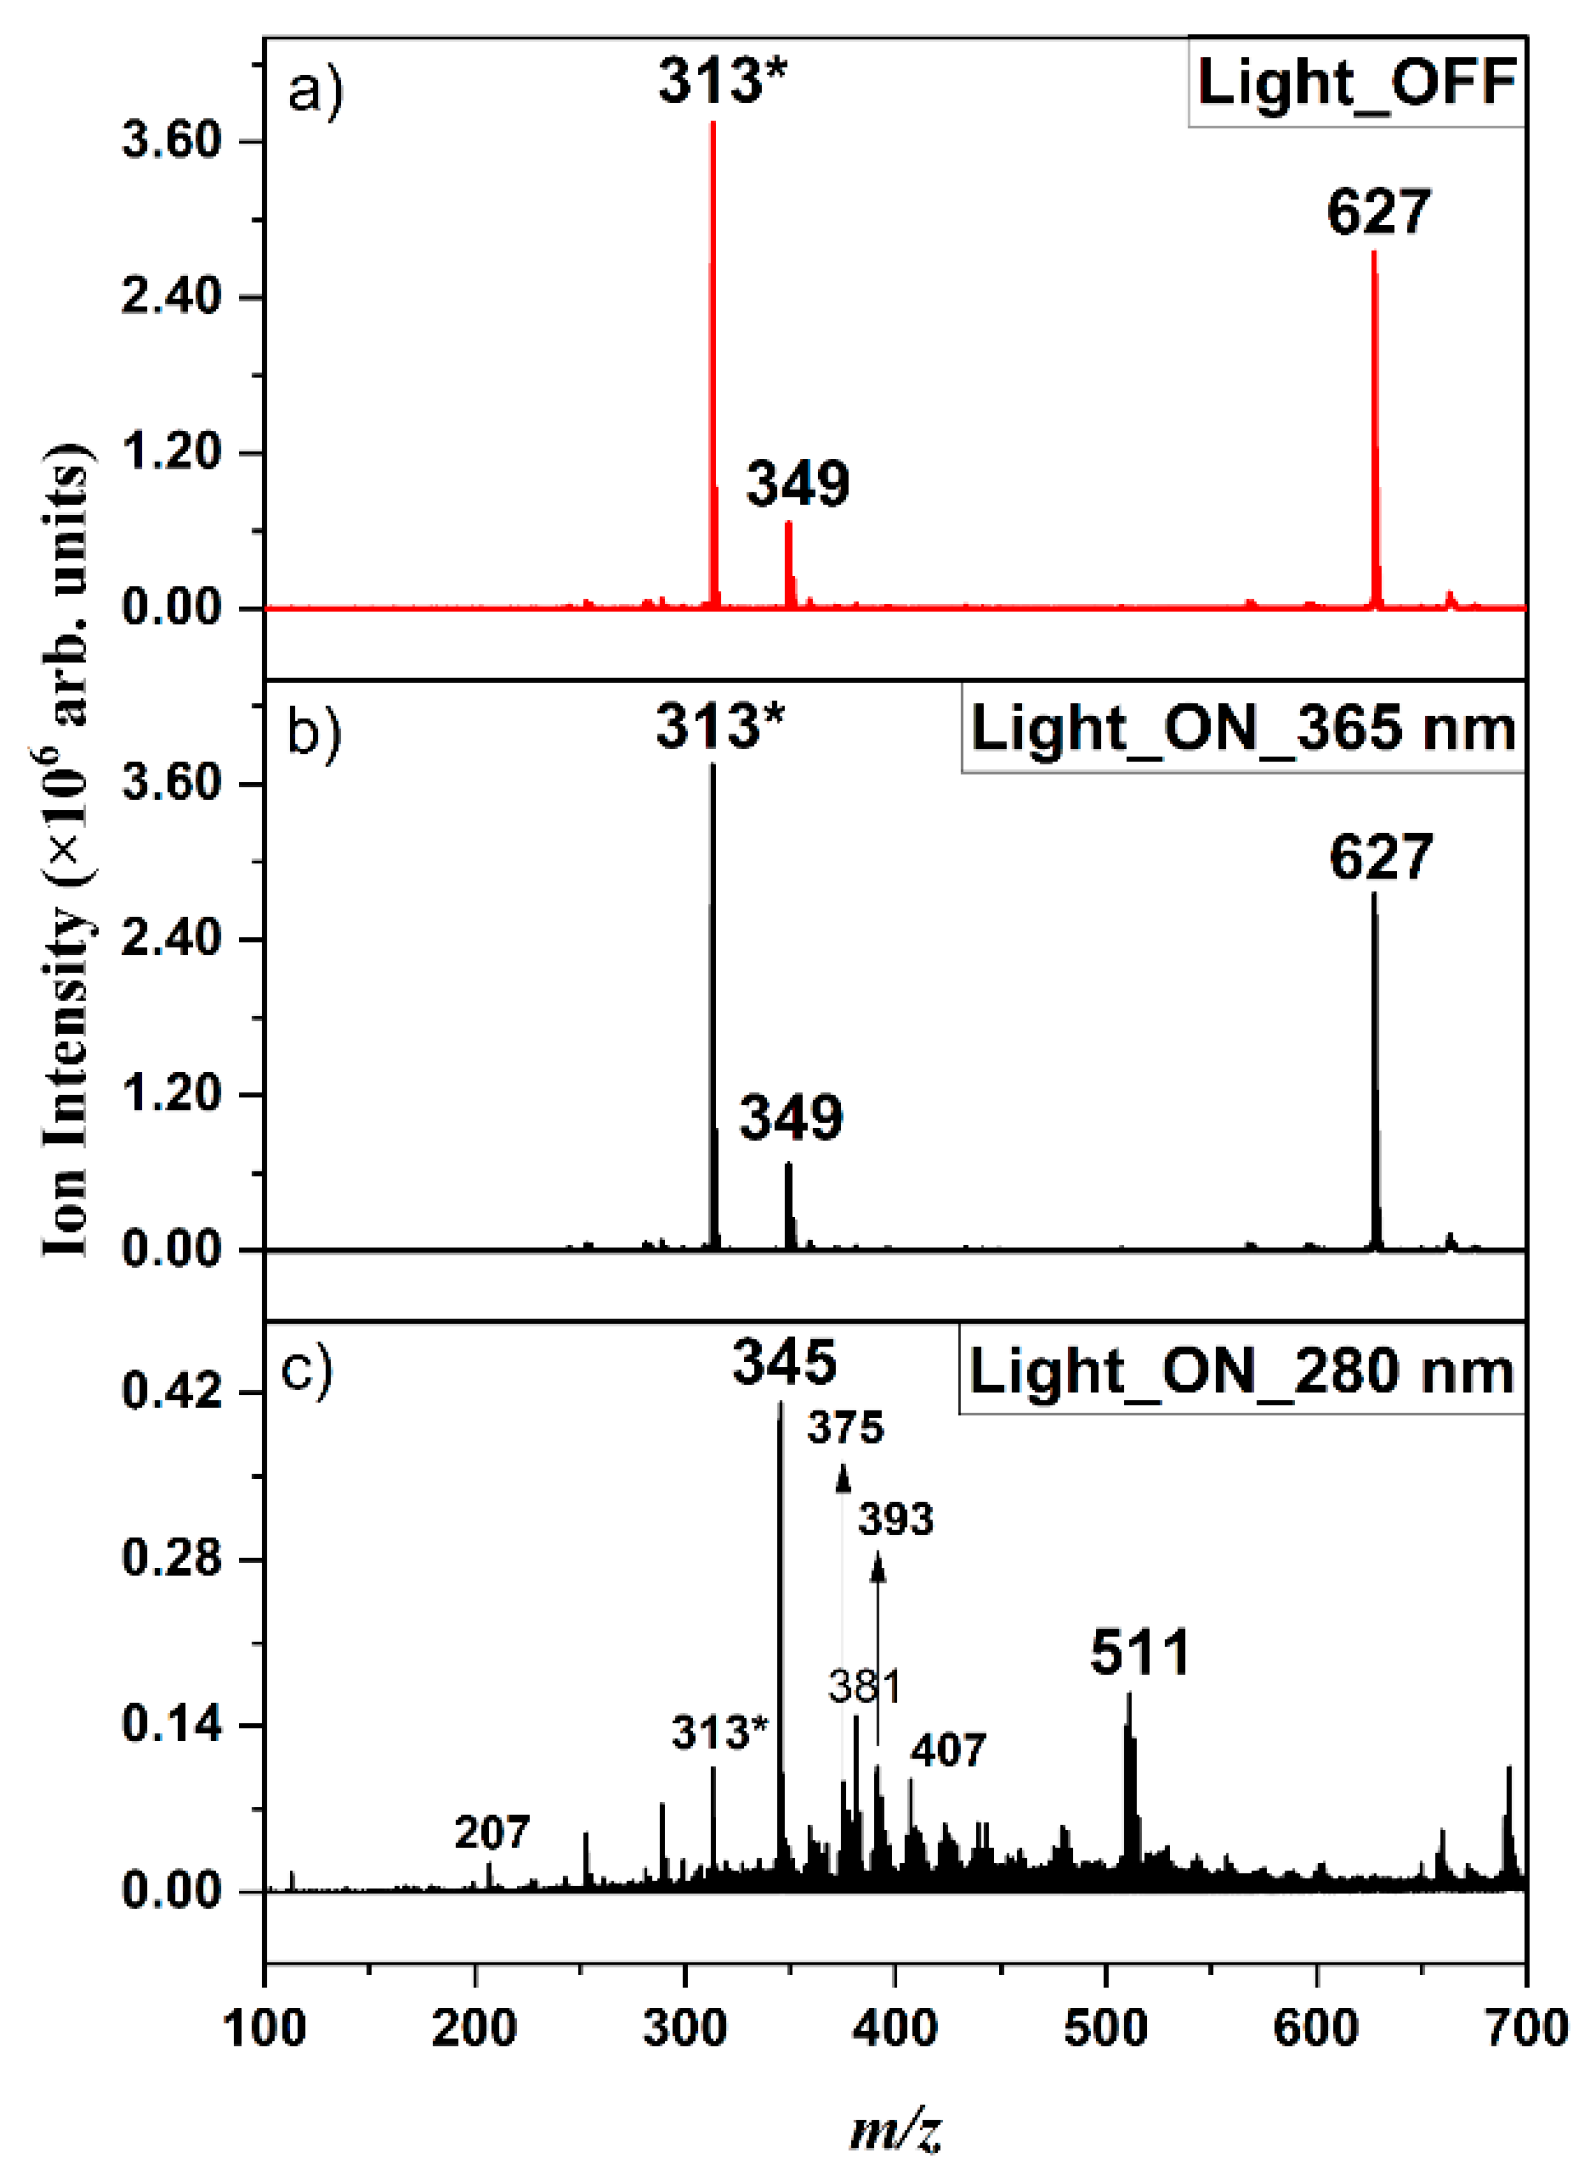
Figure 3.
ESI-MS ion intensities (negative ion mode) for 280 nm photolysis of solution-phase THC displayed as a function of time: a) Displays the ion intensities for the precursor ion, [THC–H]⁻, with the five most intense photoproduct ions, with b) showing the next five most intense photoproduct ions. Photolysis is initiated at t = 3 min and there is a 1 min lead time for the solution to reach the MS.
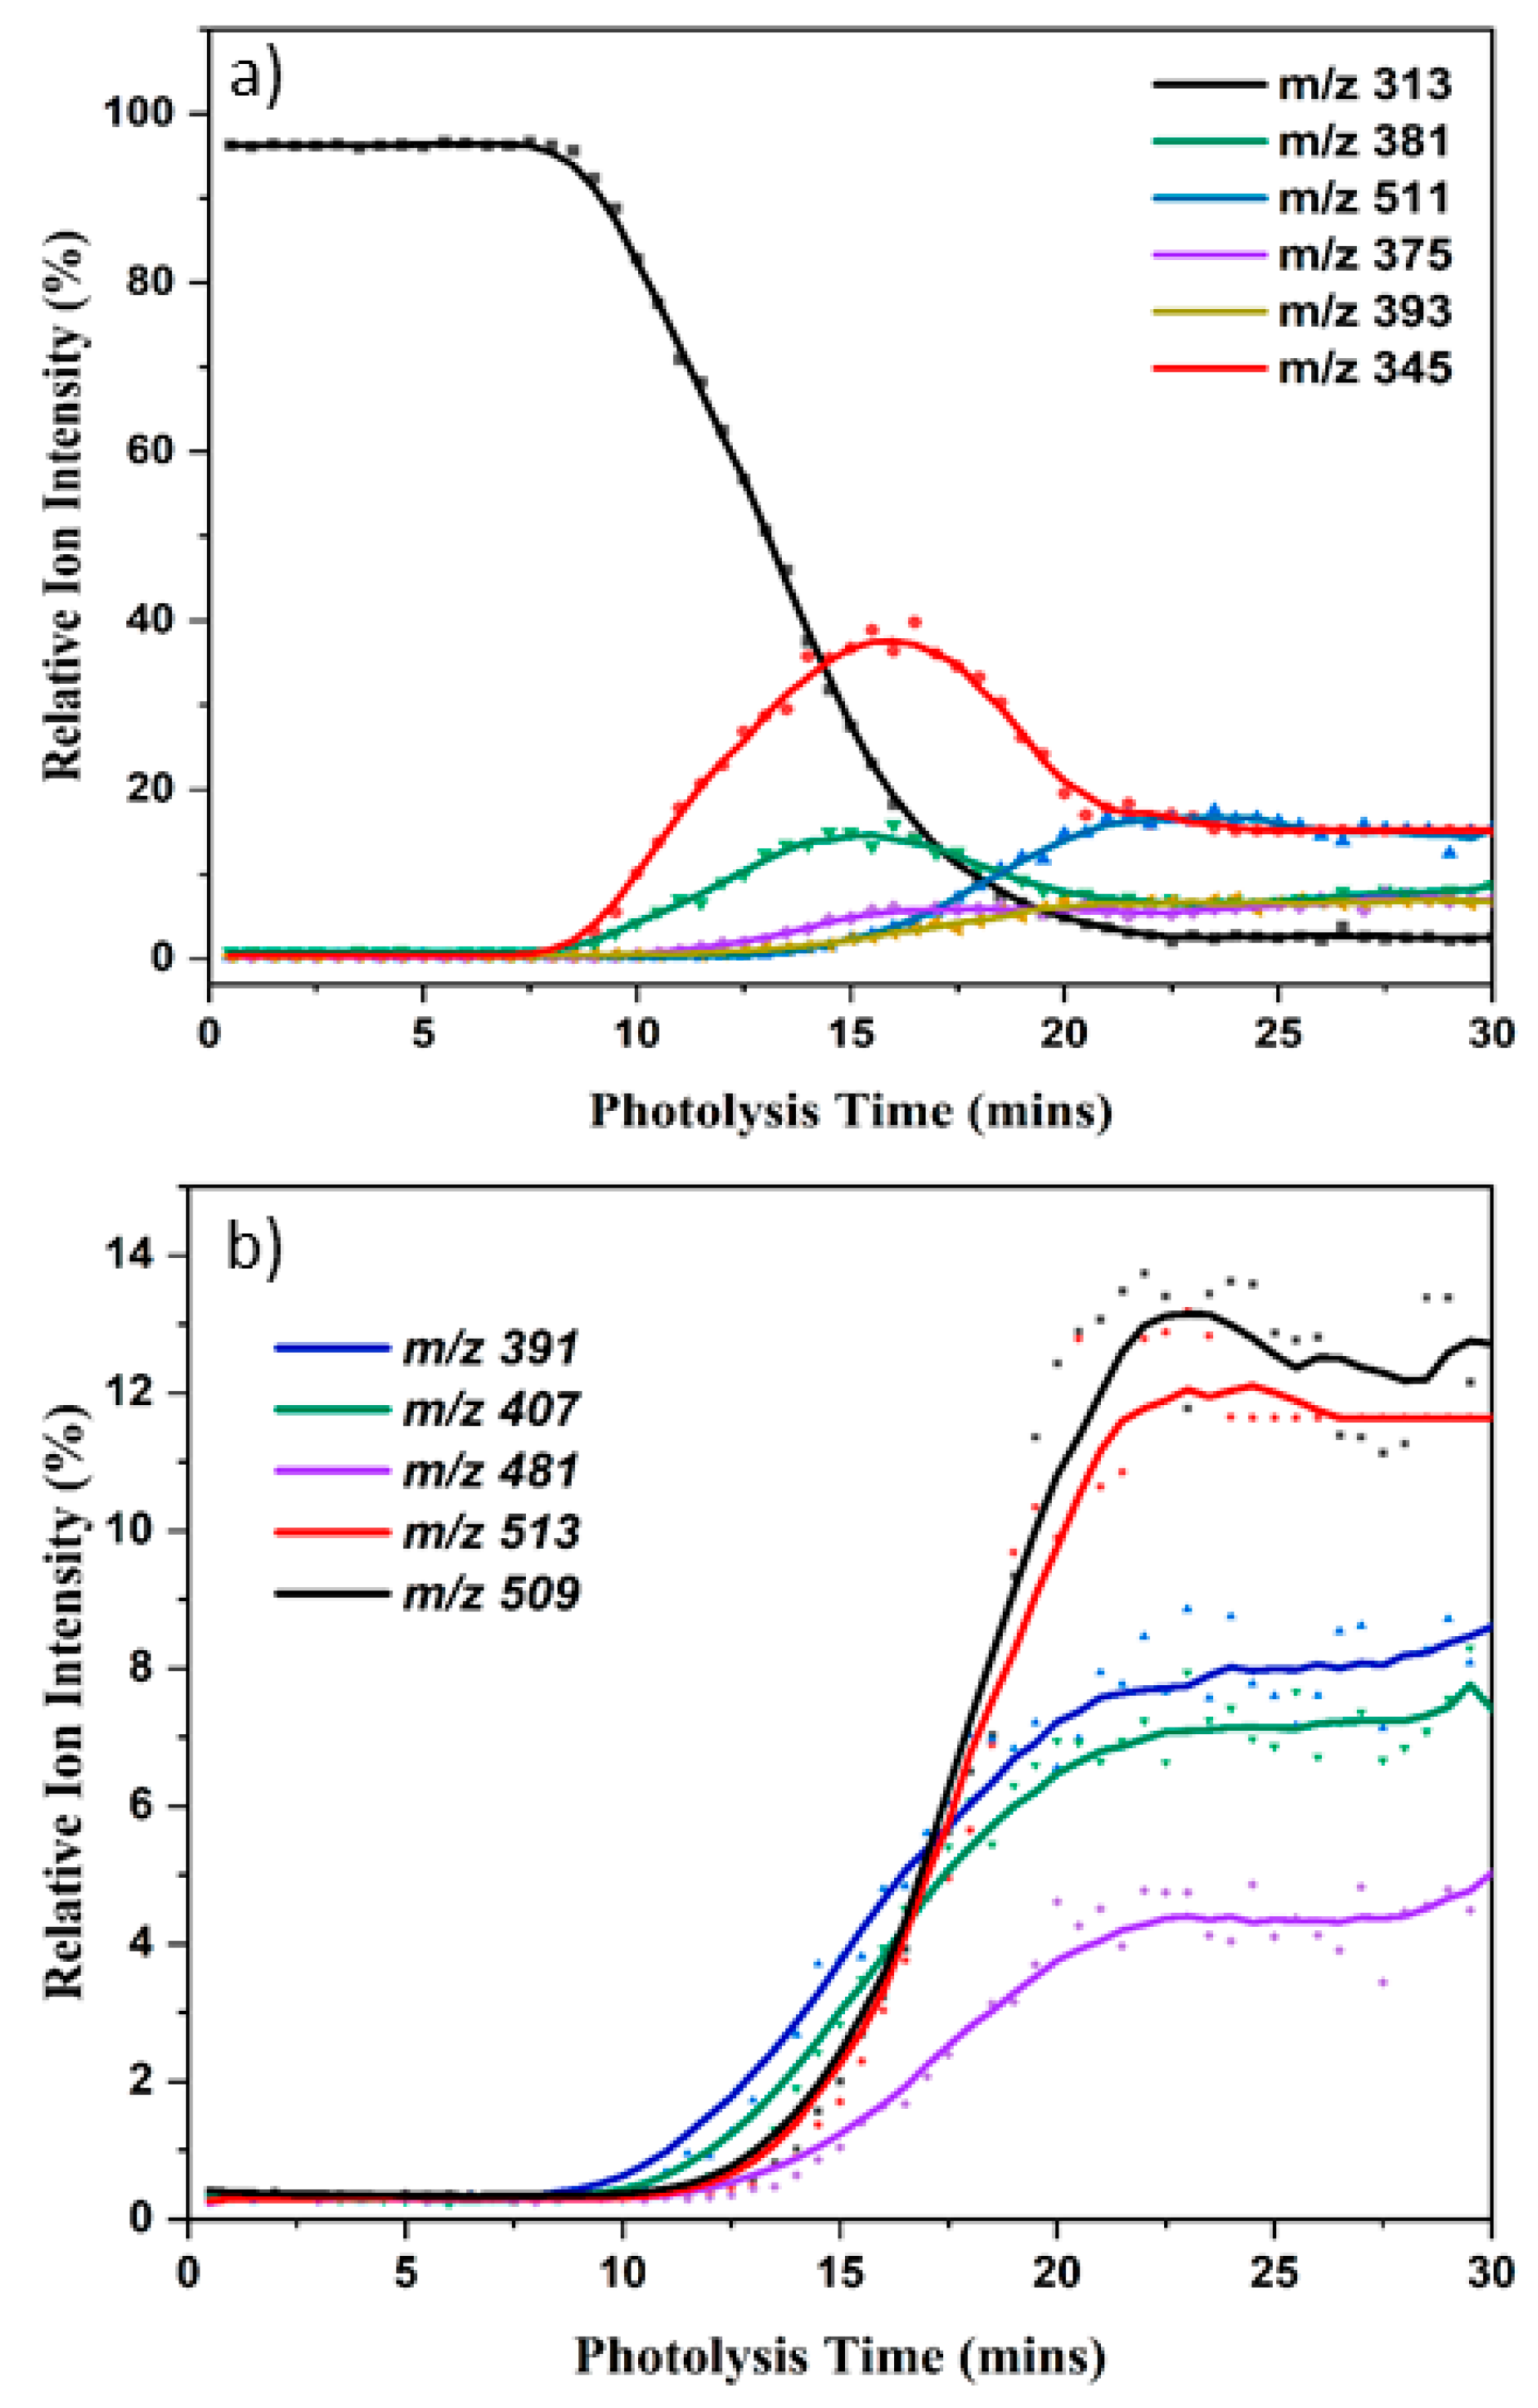
Figure 4.
Solution-phase UV–Vis absorption spectra of CBD in MeOH obtained following irradiation at 280 nm over 0–120 mins.
Figure 4.
Solution-phase UV–Vis absorption spectra of CBD in MeOH obtained following irradiation at 280 nm over 0–120 mins.
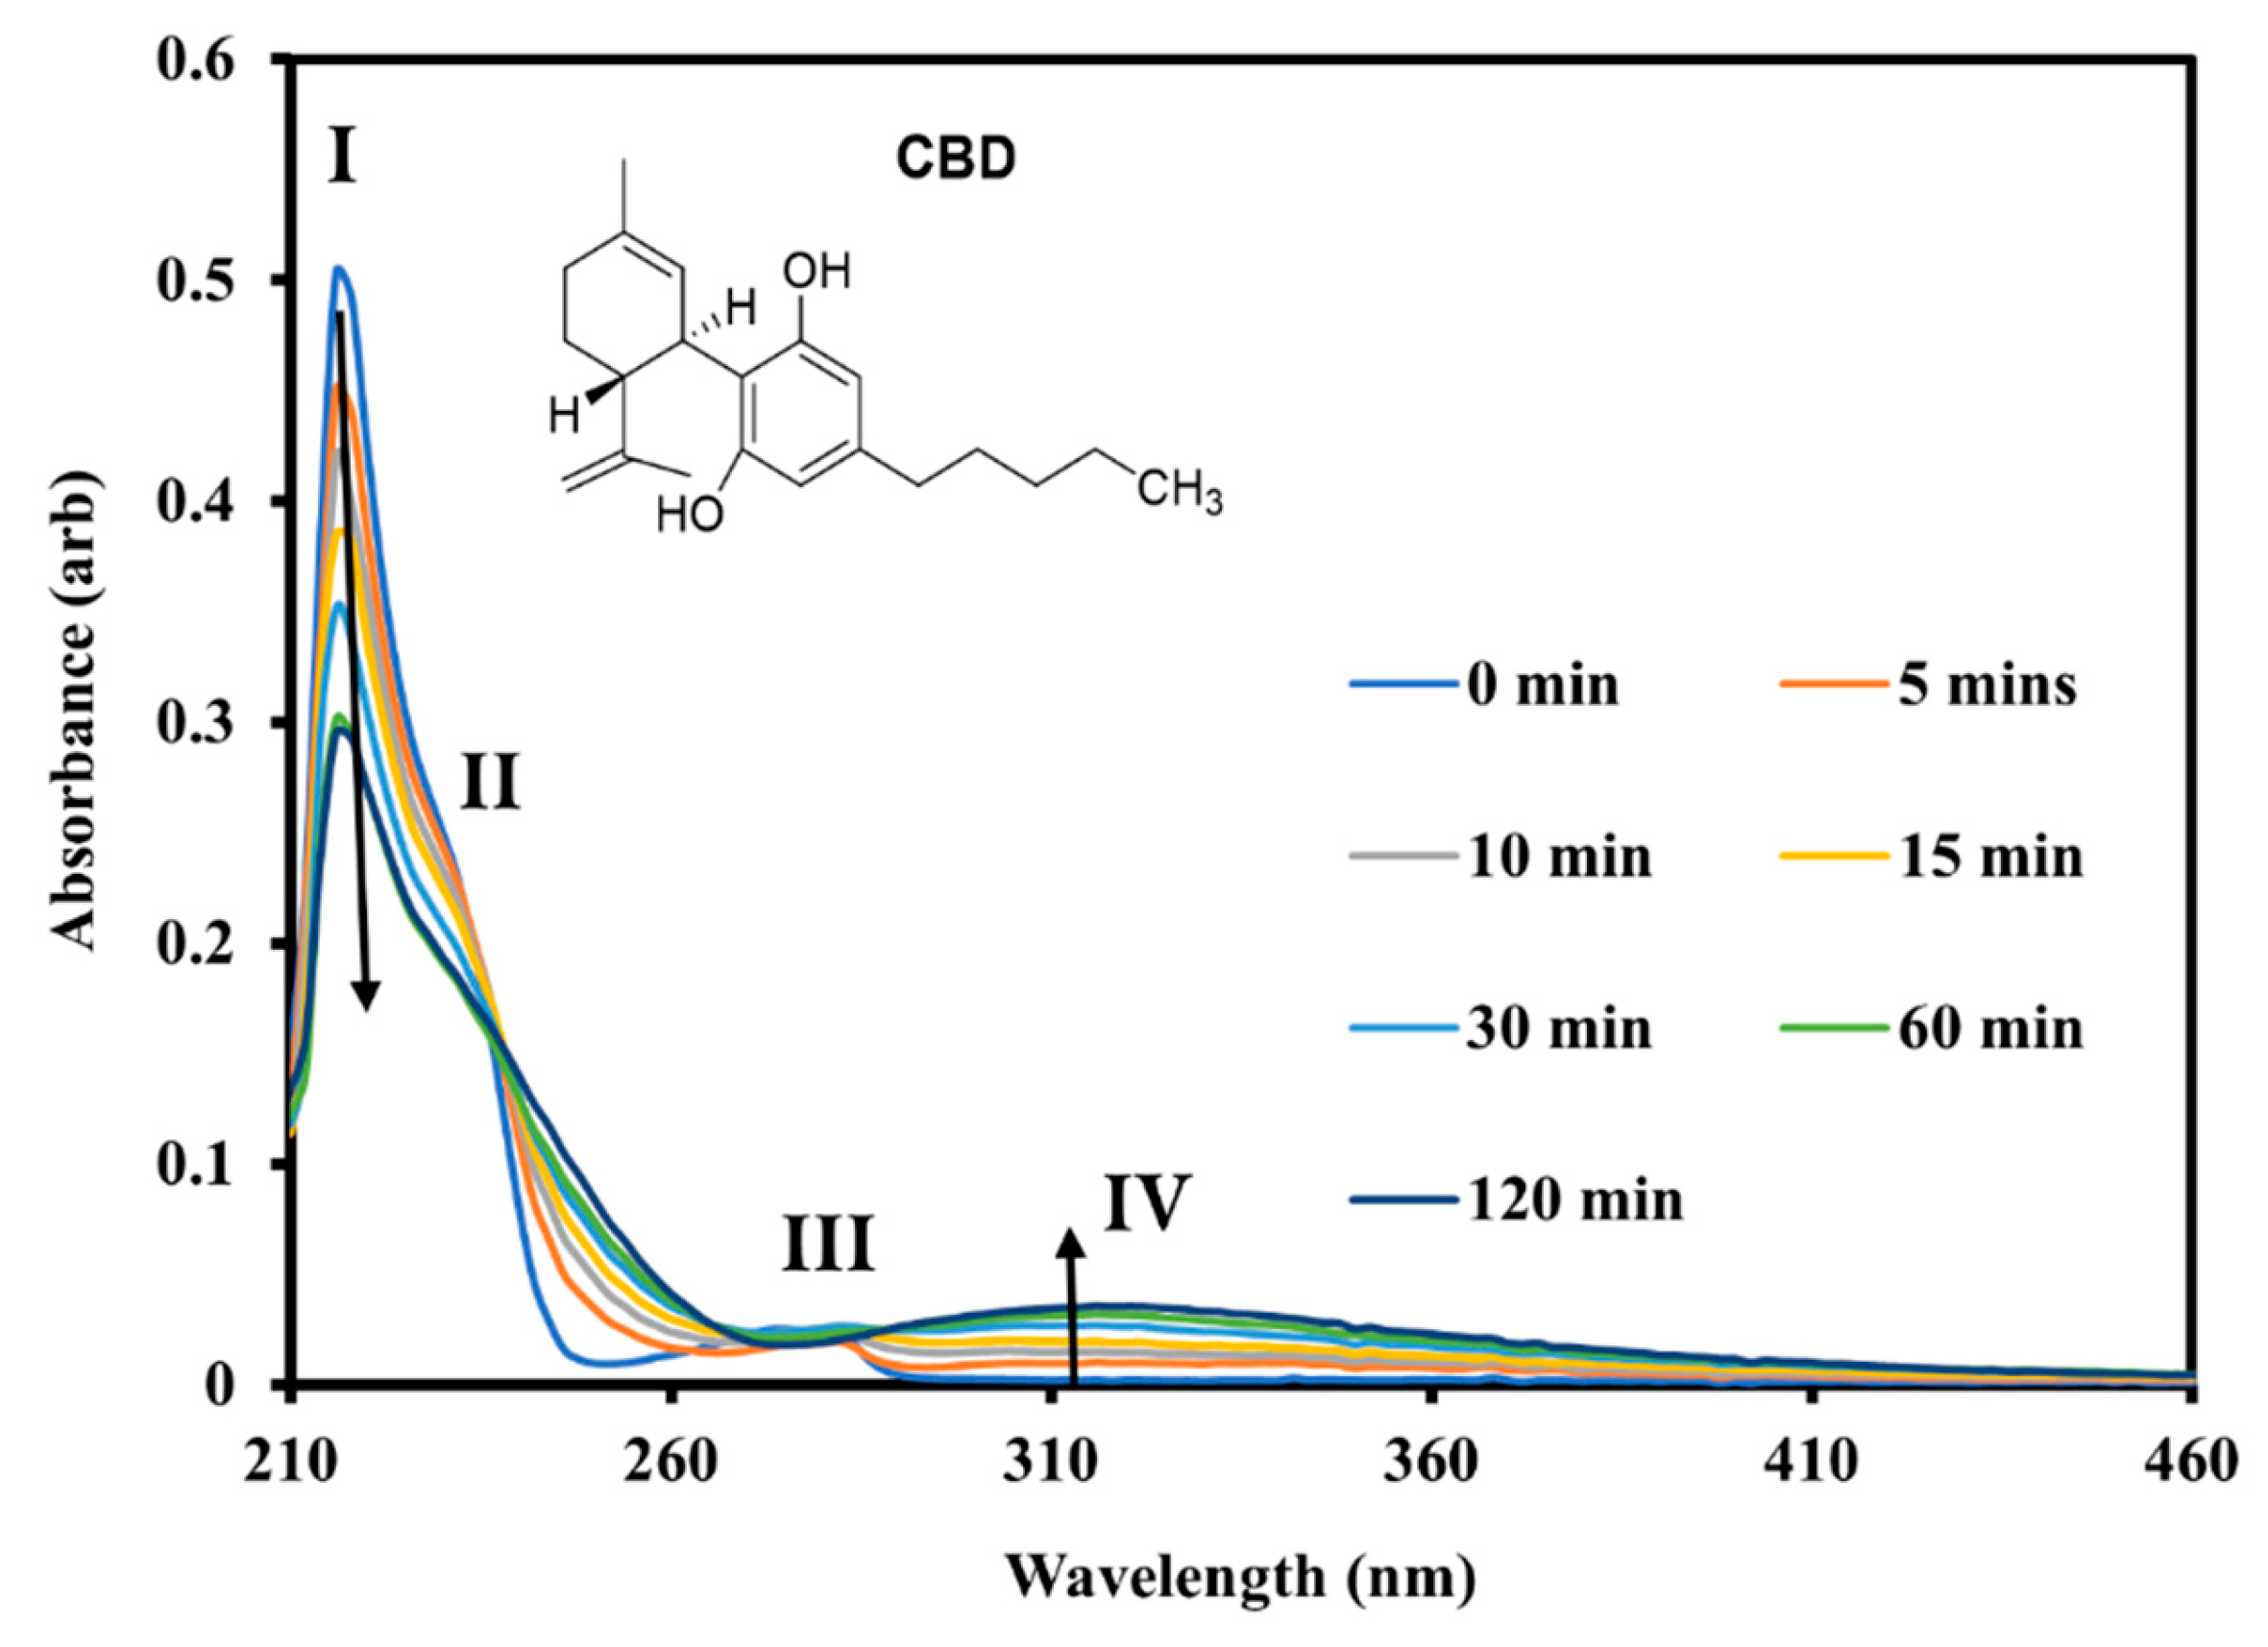
Figure 5.
ESI-MS ion intensities (negative ion mode) for 280 nm photolysis of solution-phase CBD displayed as a function of time. a) Displays the ion intensities for the precursor ion, [CBD–H]⁻, with the five most intense photoproduct ions, with b) showing the next five most intense photoproduct ions. Photolysis is initiated at t = 3 min and there is a 1 min lead time for the solution to reach the MS.
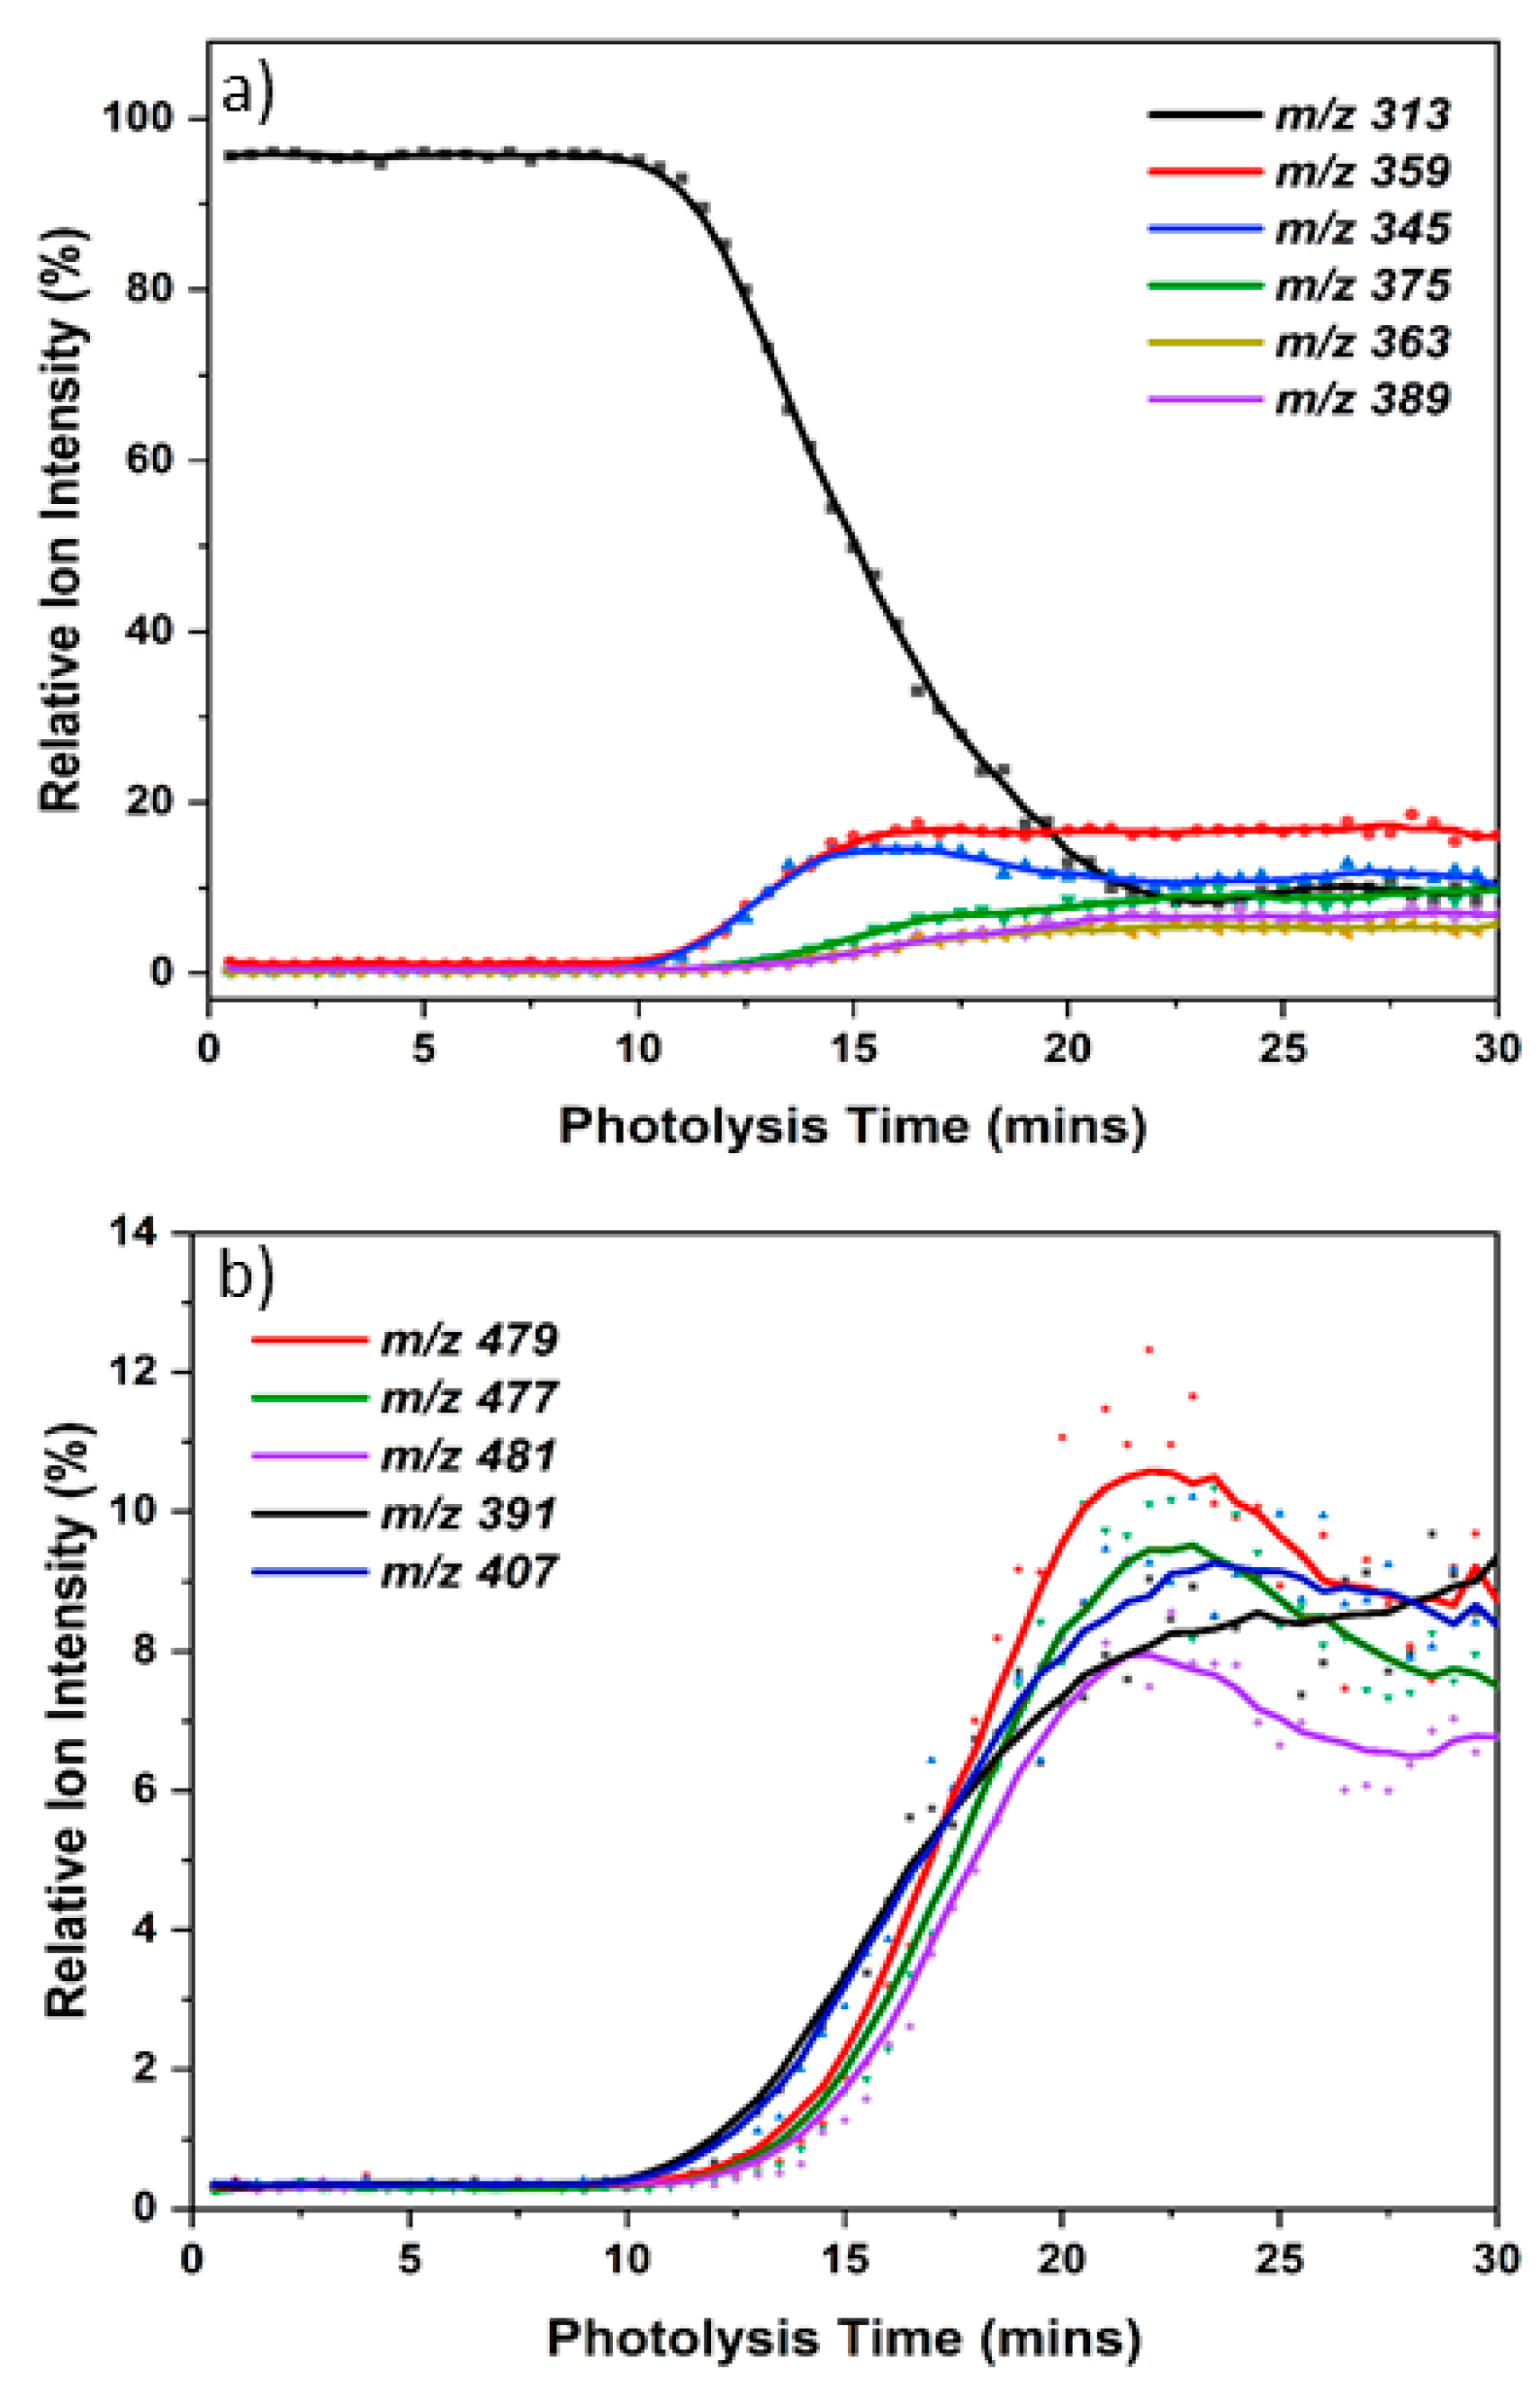
Figure 6.
Solution-phase UV–Vis absorption spectra of THCOOH in MeOH obtained following irradiation at 280 nm over 0–120 mins.
Figure 6.
Solution-phase UV–Vis absorption spectra of THCOOH in MeOH obtained following irradiation at 280 nm over 0–120 mins.
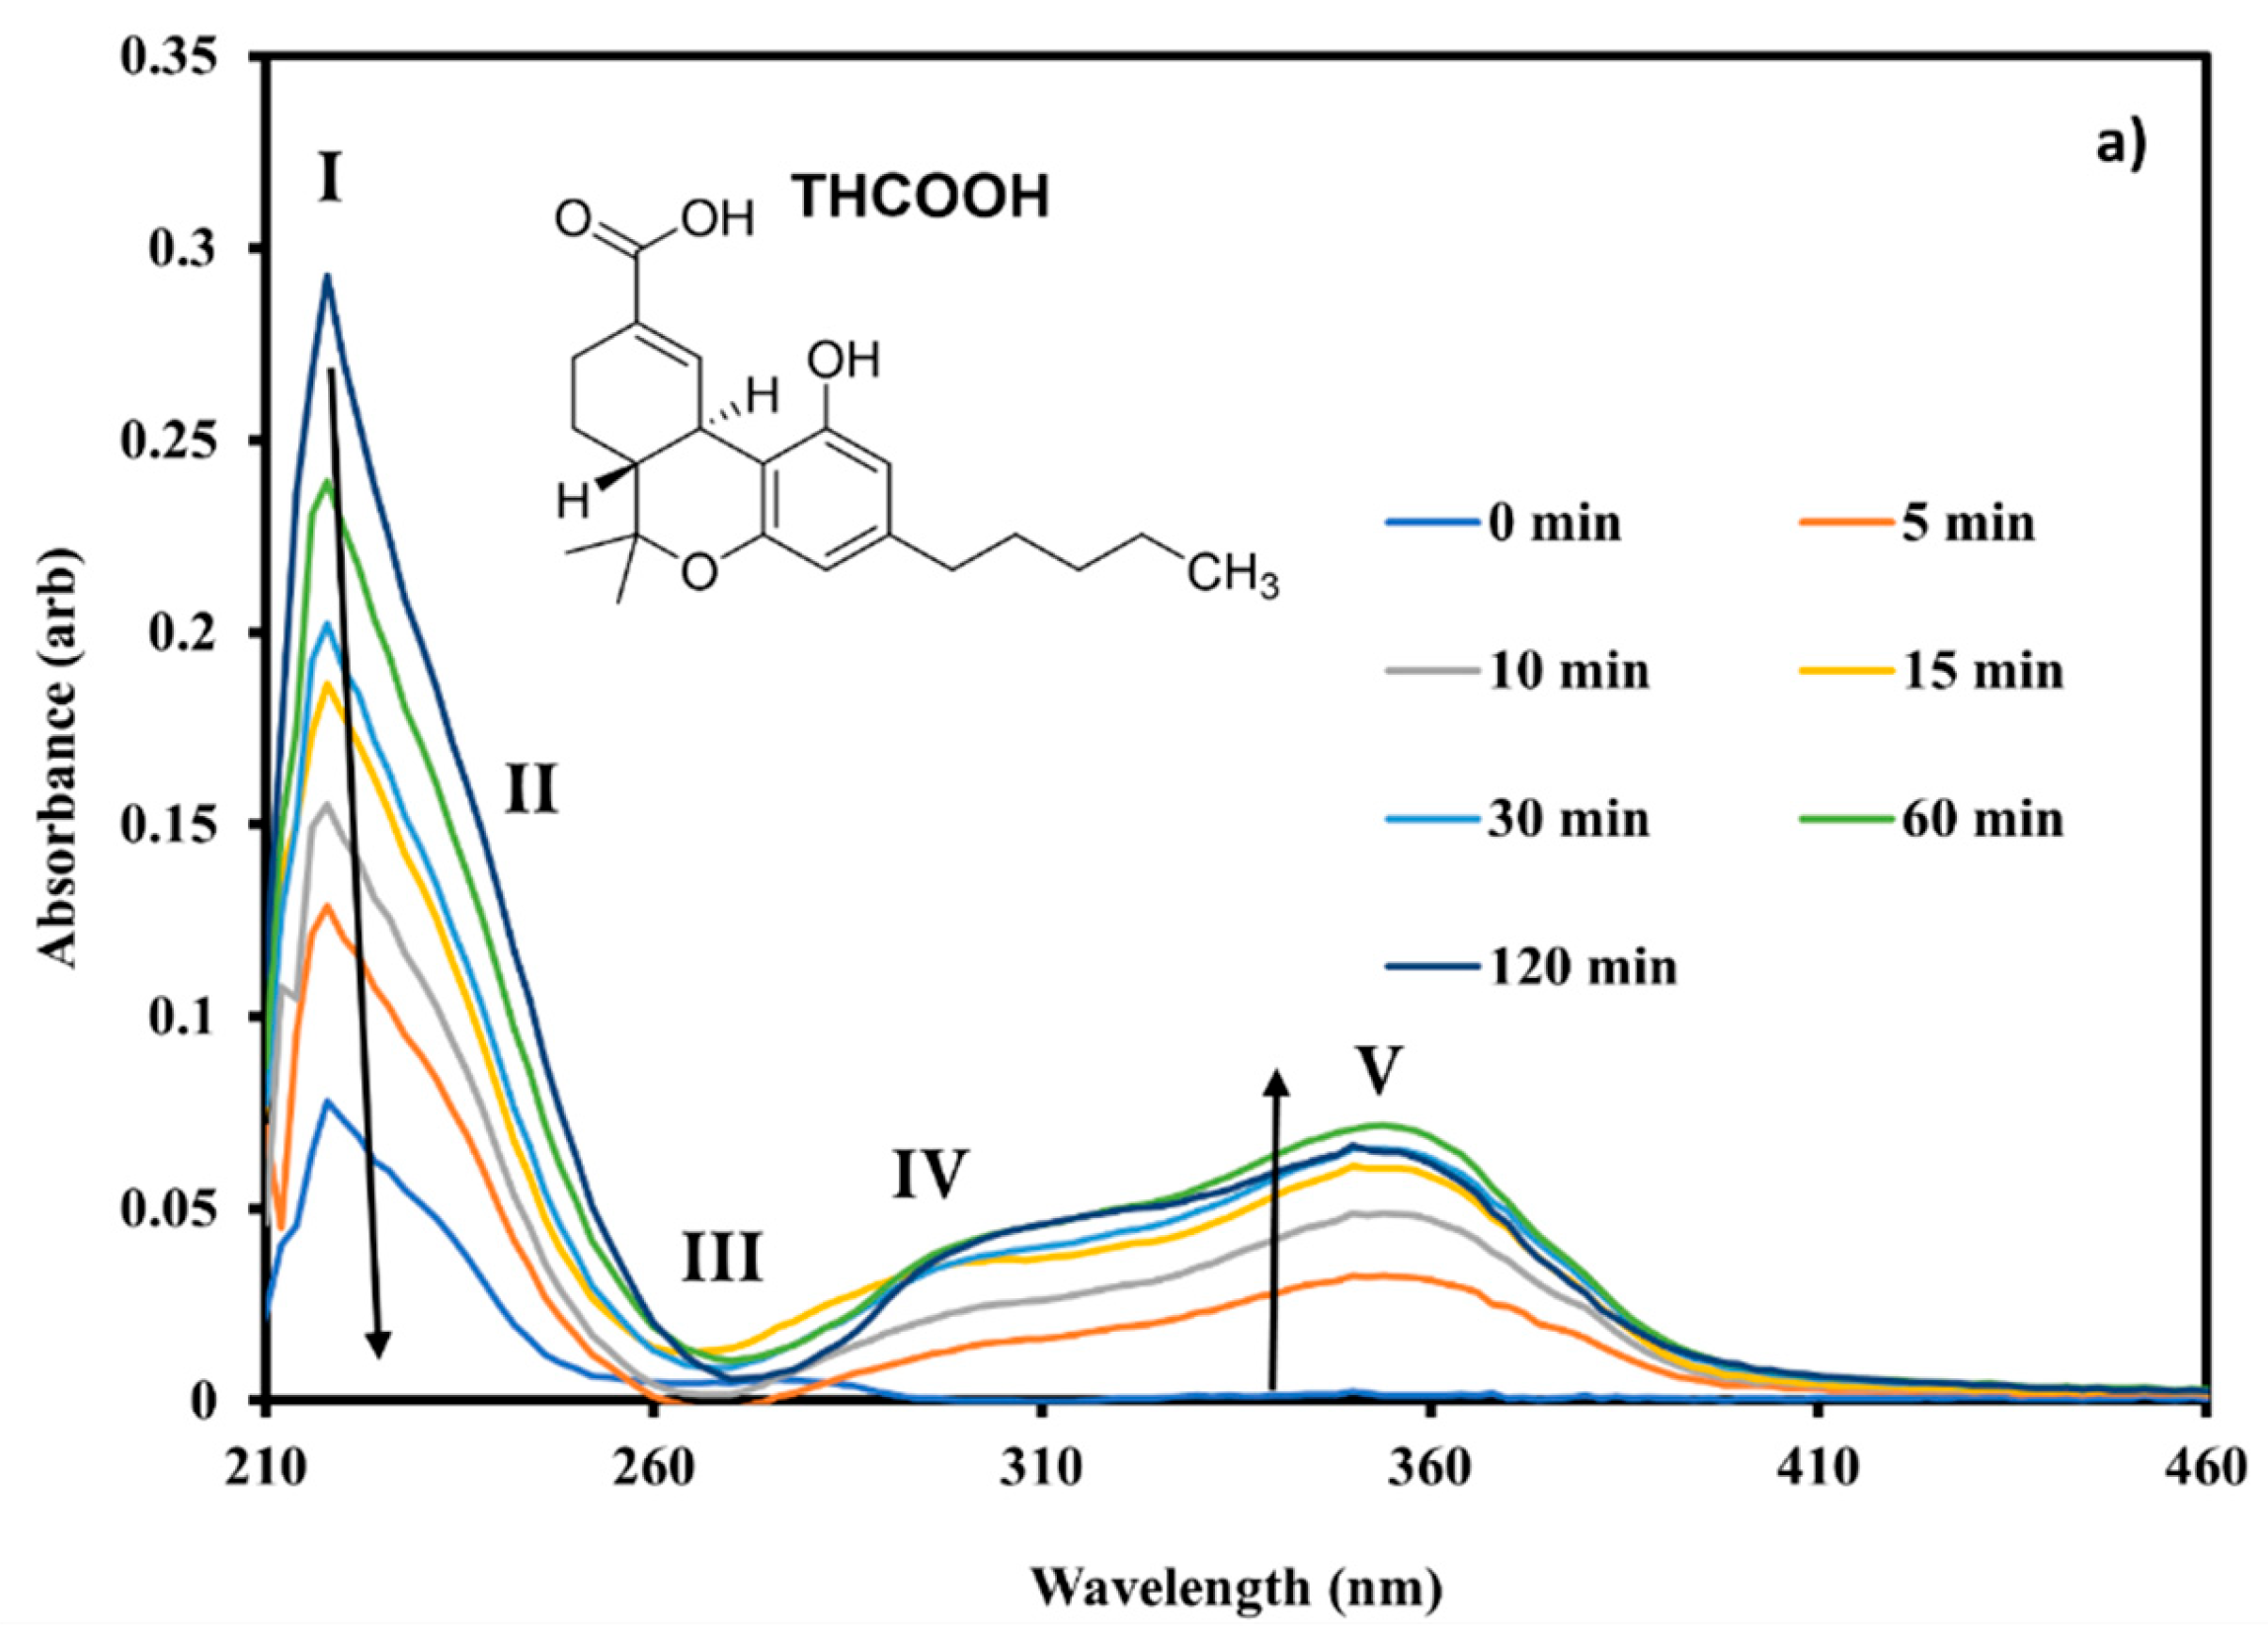
Figure 7.
ESI-MS ion intensities (negative ion mode) for 280 nm photolysis of solution-phase THCOOH displayed as a function of time, showing the decrease of the precursor ion, [THCOOH-H]- (m/z 343) and increase in the 10 most intense photoproduct ions. Photolysis is initiated at t = 3 min and there is a 1 min lead time for the solution to reach the MS.
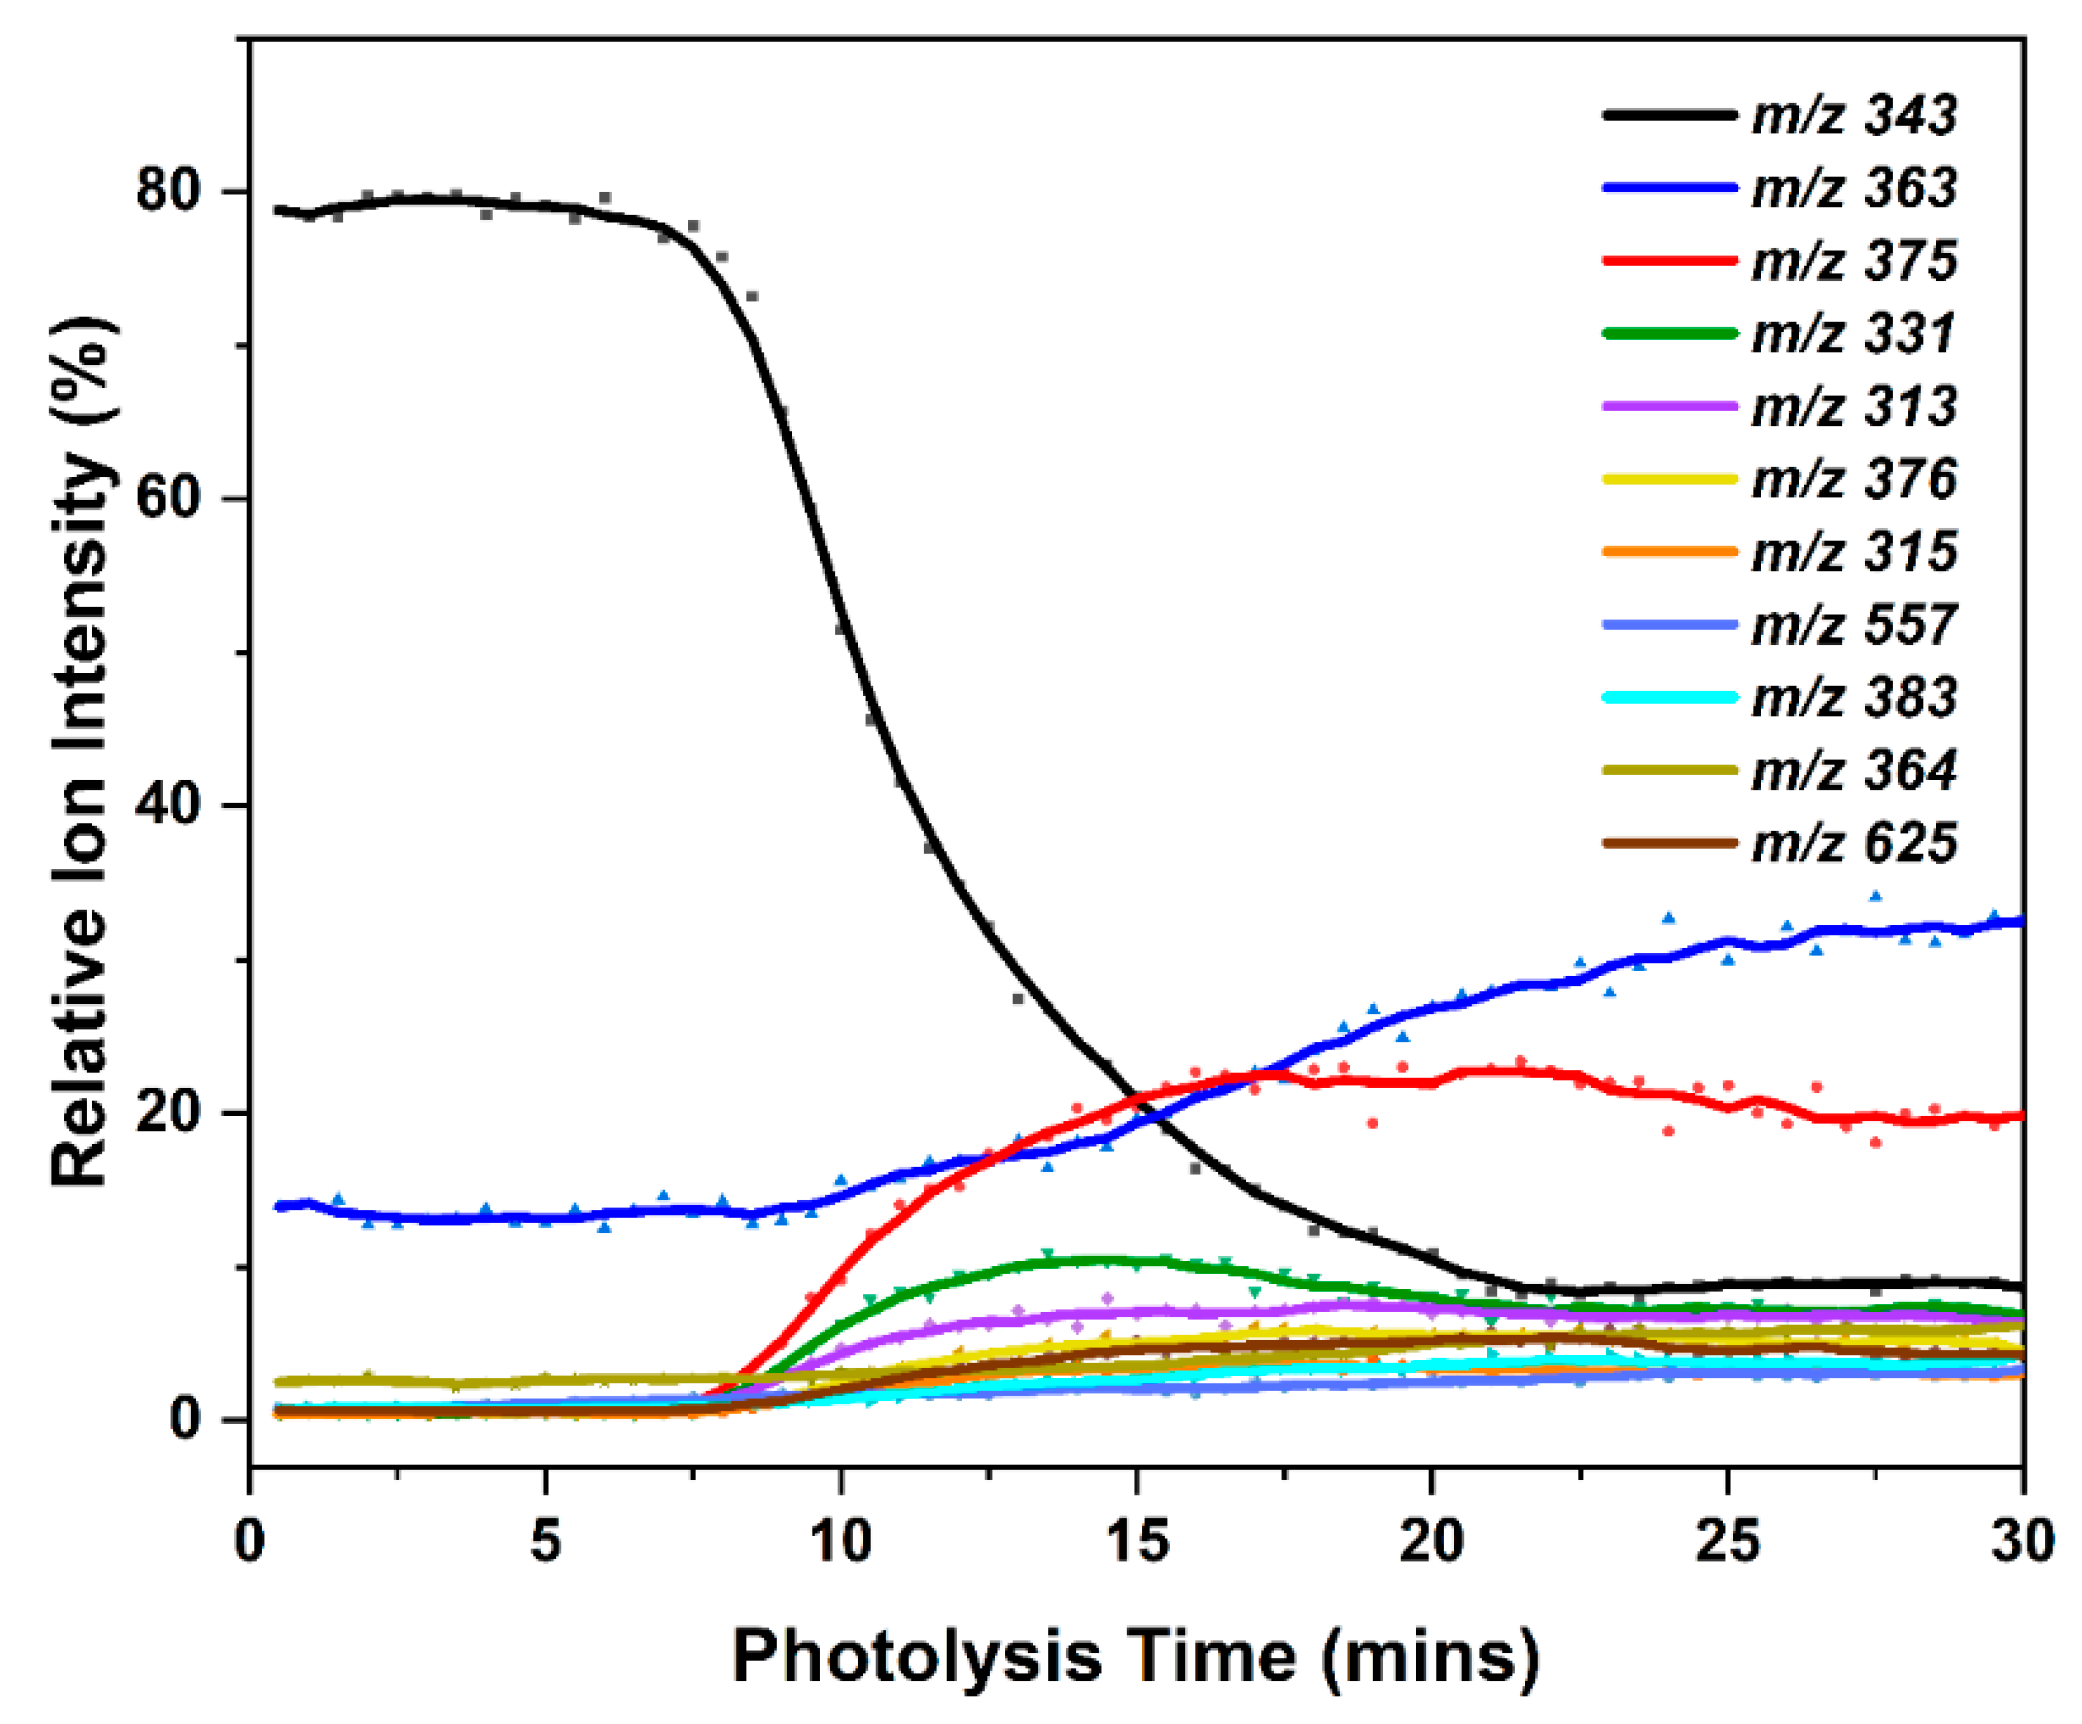
Figure 8.
Solution-phase UV–Vis absorption spectra of THCOH in MeOH obtained following irradiation at 280 nm over 0–120 mins.
Figure 8.
Solution-phase UV–Vis absorption spectra of THCOH in MeOH obtained following irradiation at 280 nm over 0–120 mins.
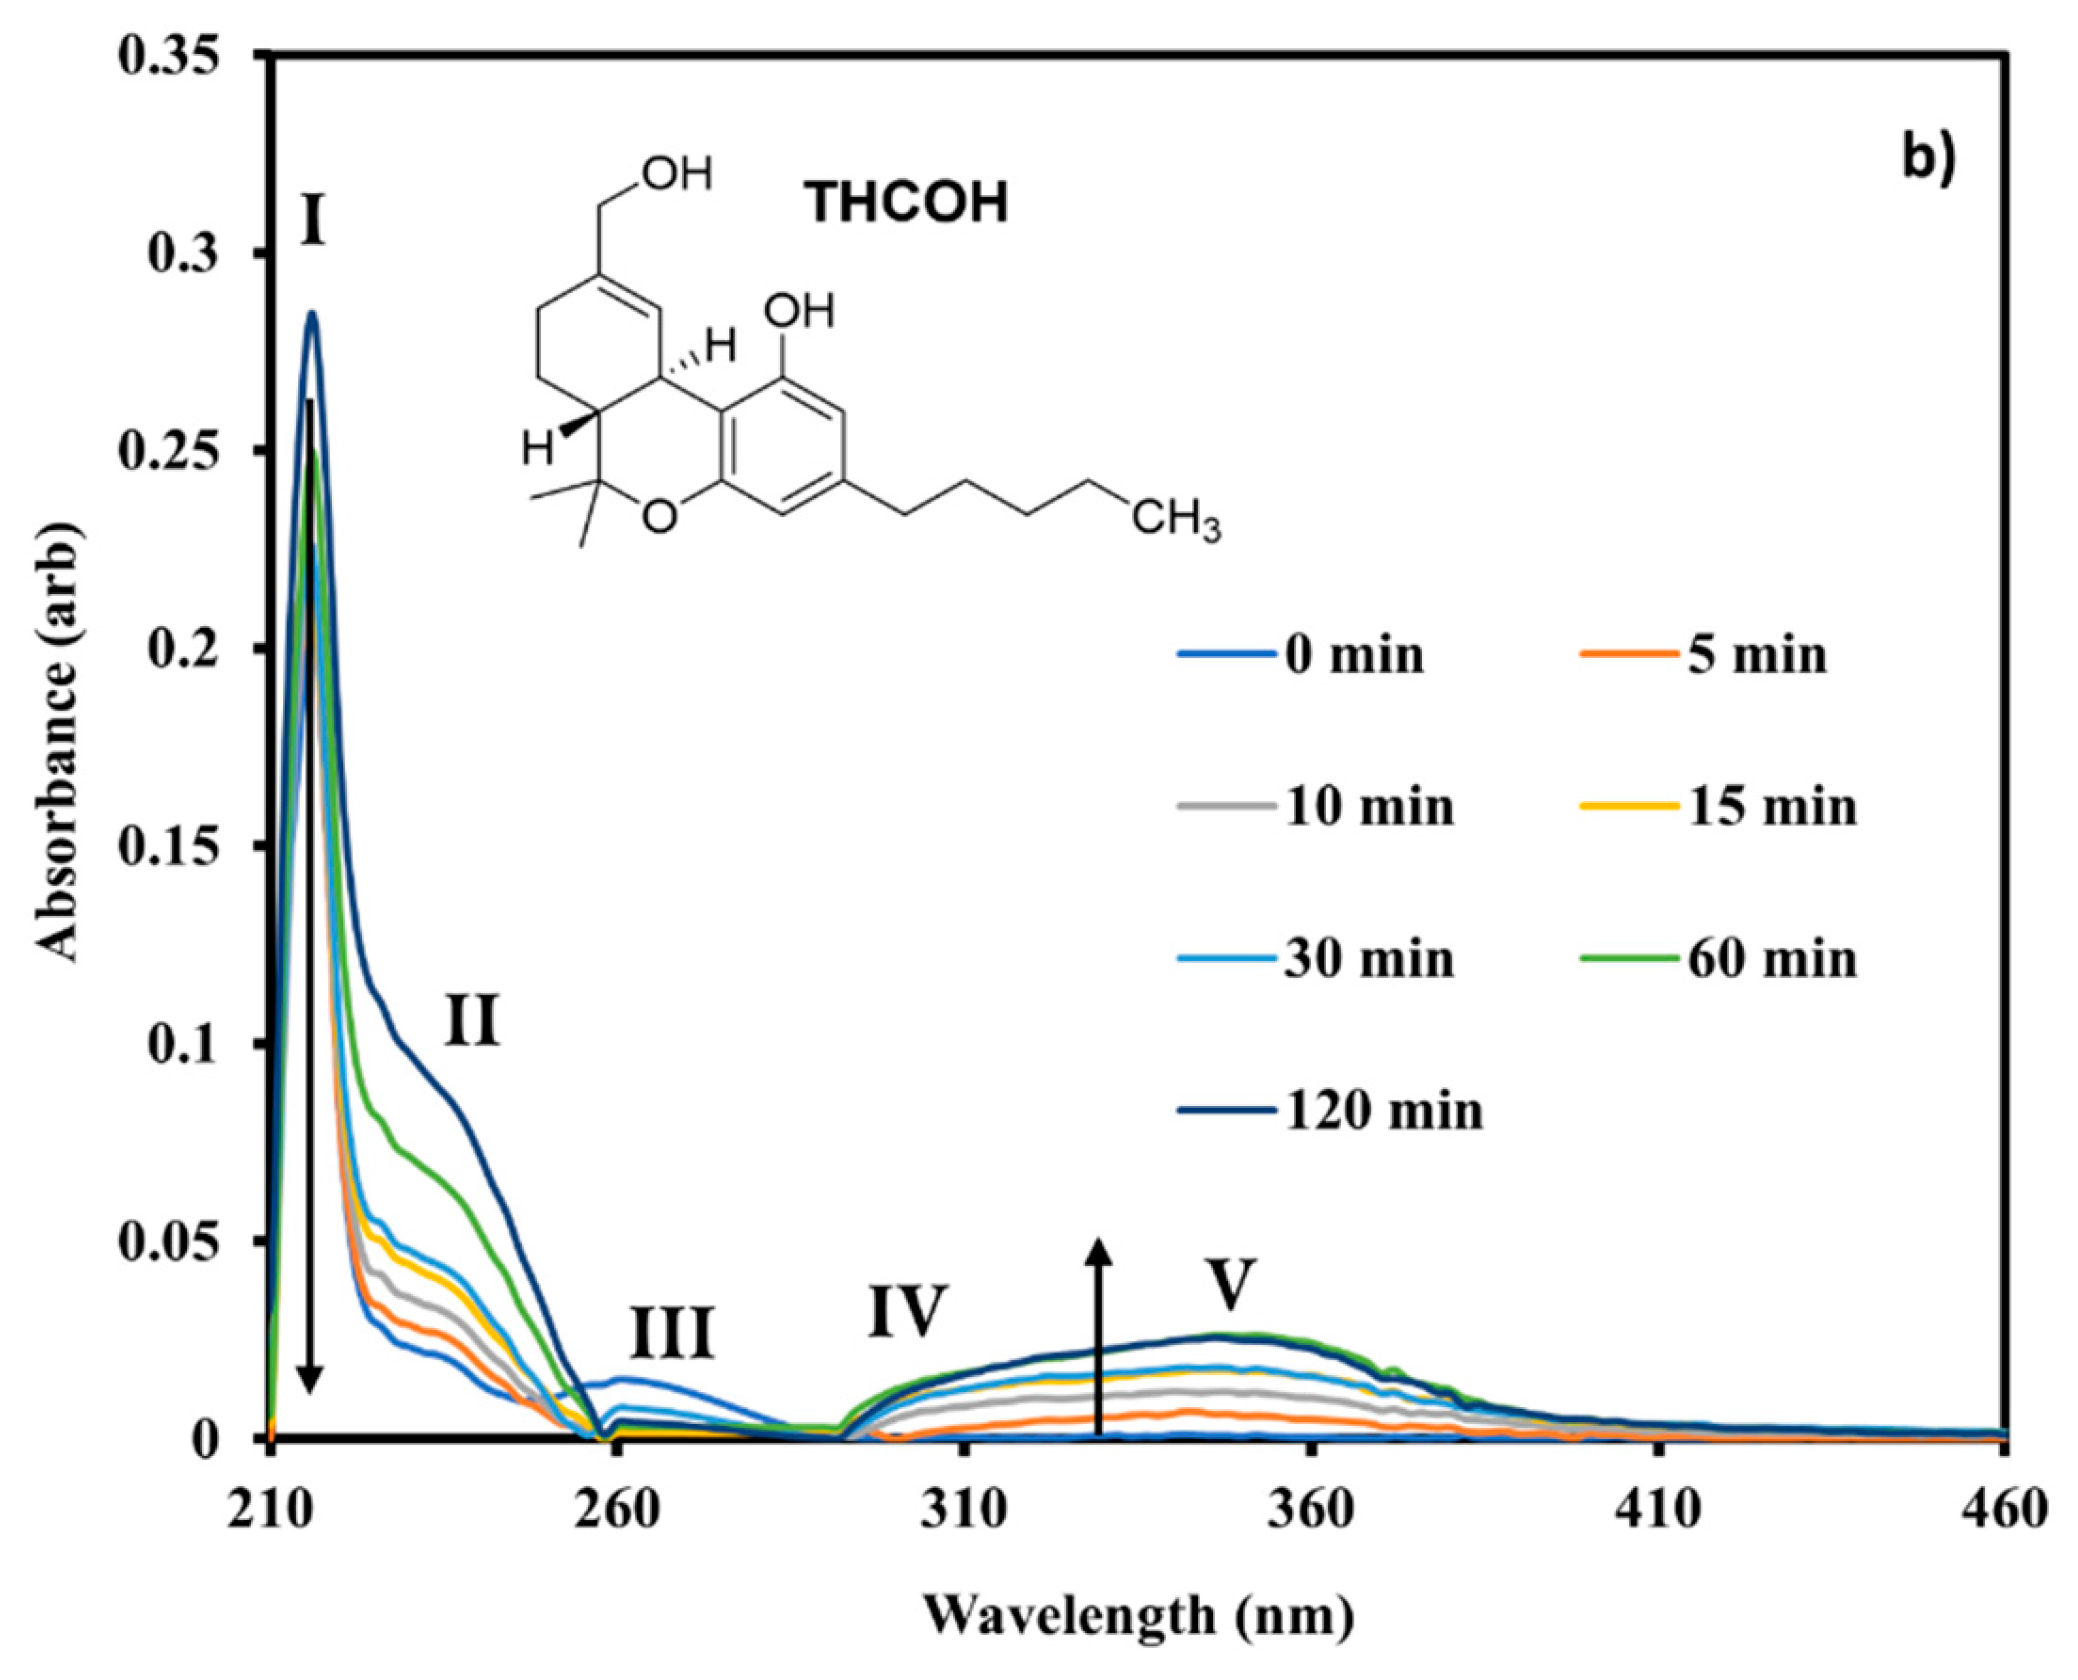
Figure 9.
ESI-MS ion intensities (negative ion mode) for 280 nm photolysis of solution-phase THCOH displayed as a function of time, showing the decrease of the precursor ion, [THCOH-H]- (m/z 329) and increase in the 10 most intense photoproduct ions. Photolysis is initiated at t = 3 min and there is a 1 min lead time for the solution to reach the MS.
Figure 10.
Solution-phase UV–Vis absorption spectra of CBDA in MeOH obtained following irradiation at 280 nm over 0–120 mins.
Figure 10.
Solution-phase UV–Vis absorption spectra of CBDA in MeOH obtained following irradiation at 280 nm over 0–120 mins.
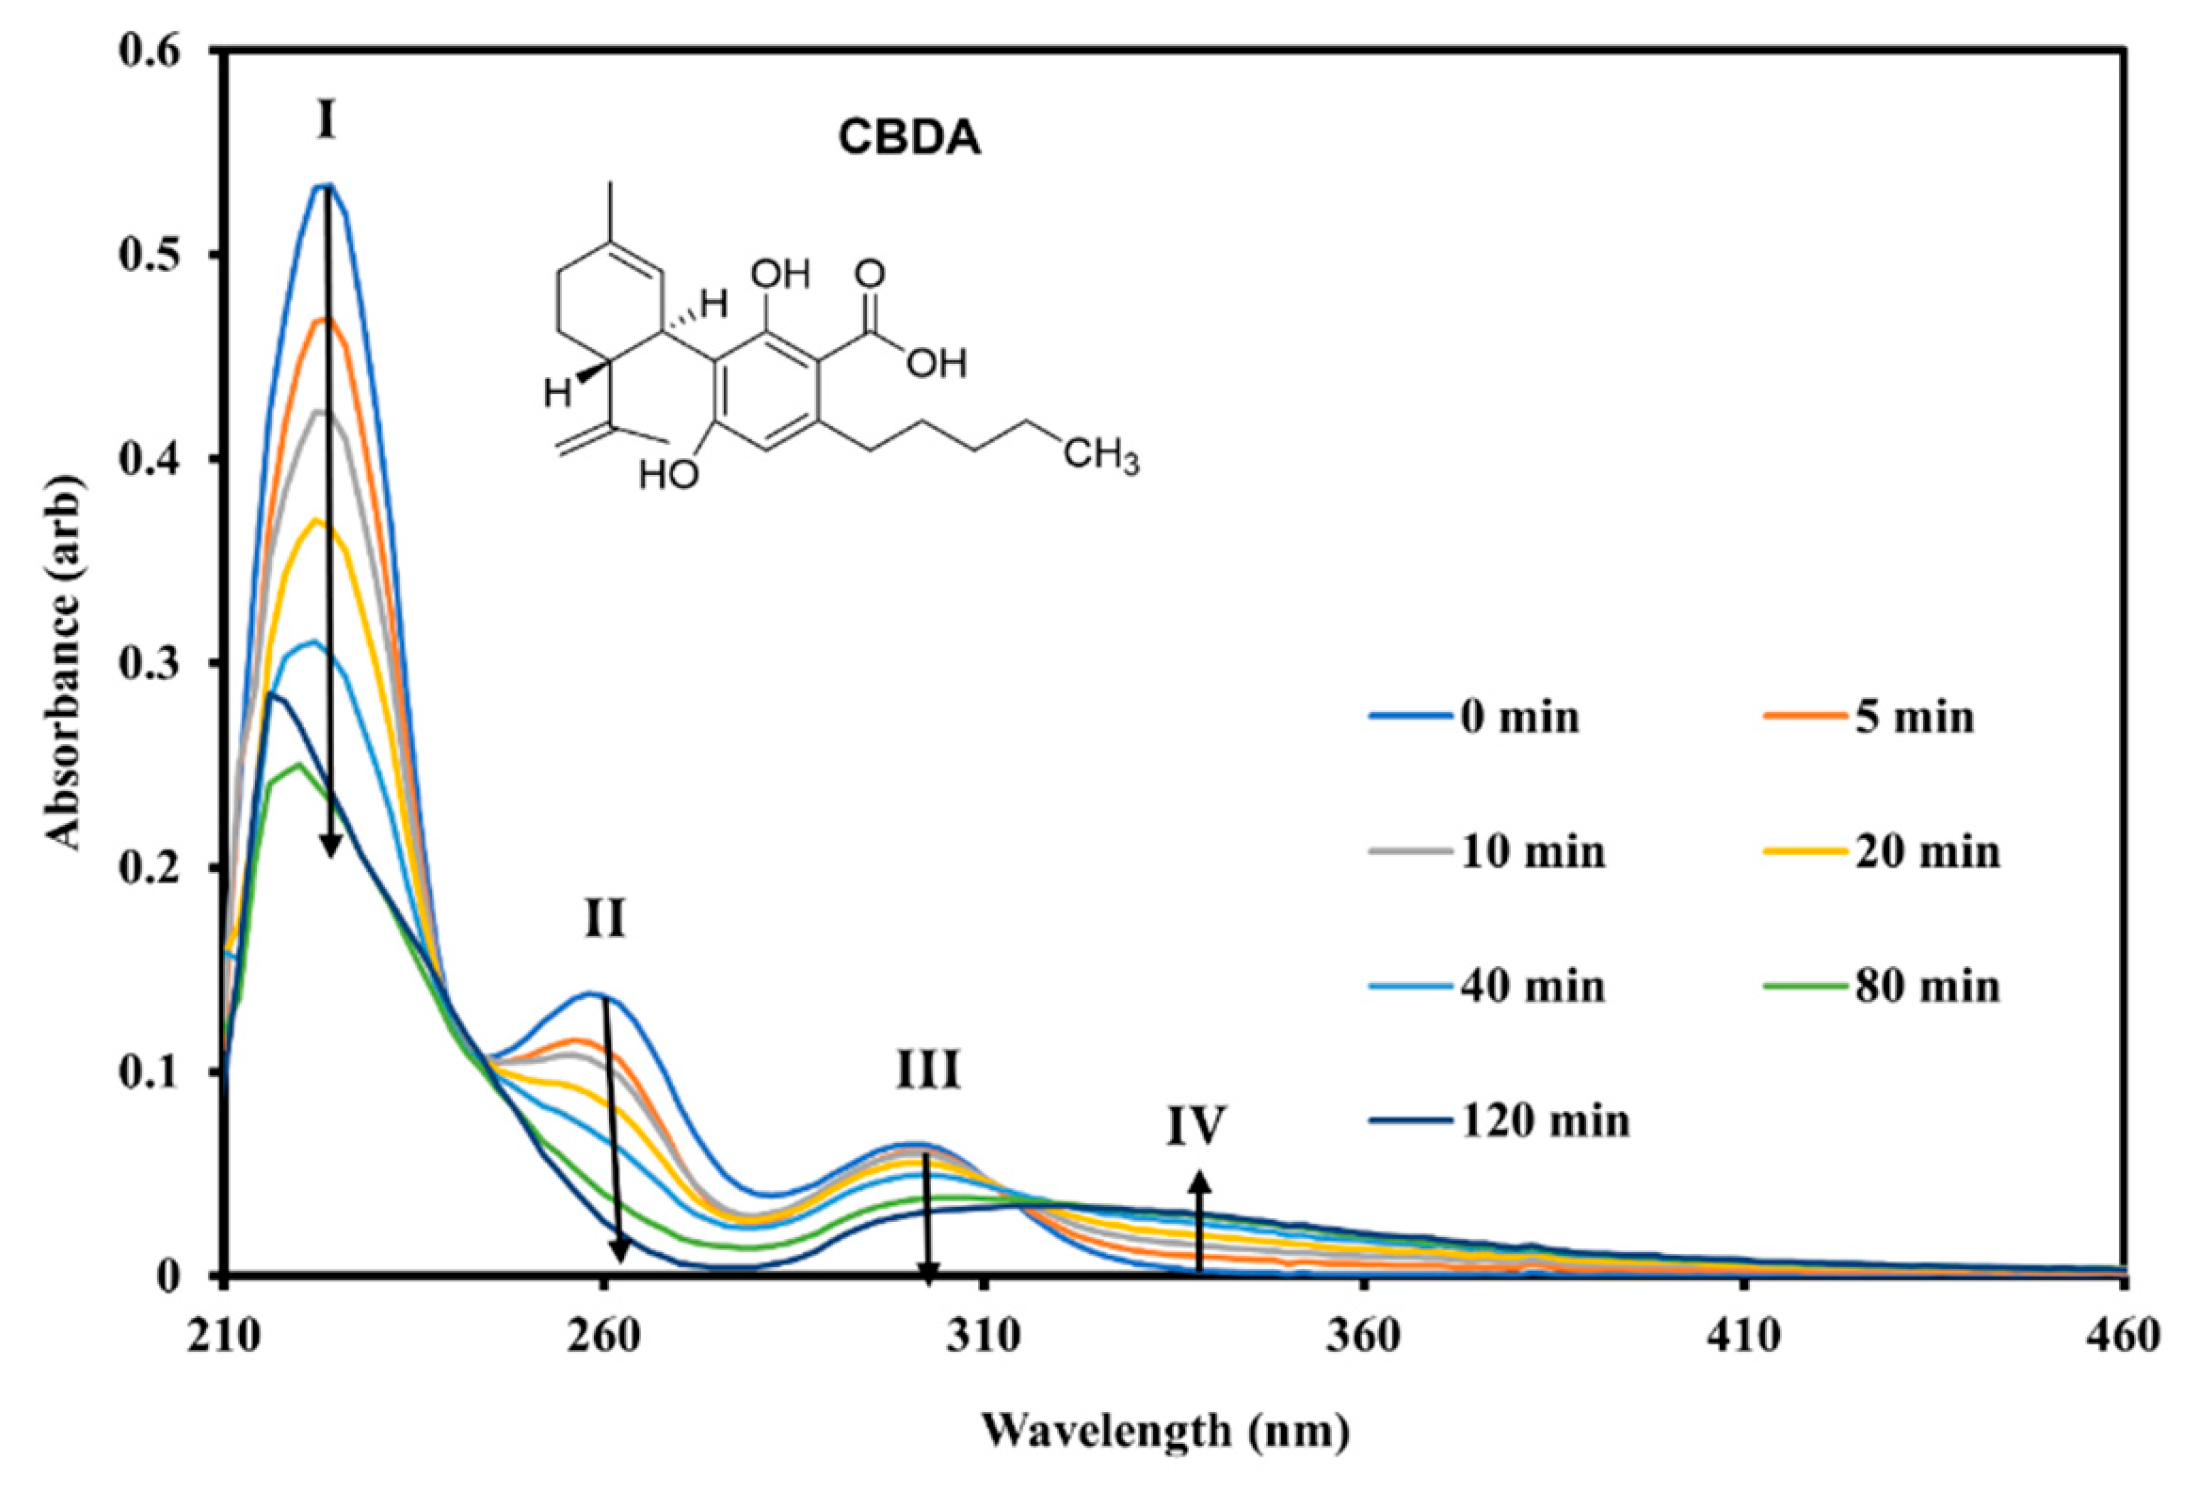
Figure 11.
(a) Photolysis OFF and (b) photolysis ON ESI mass spectra of CBDA obtained in negative ion mode. (b) (LHS) and (b) (RHS) displays the ESI-MS obtained with 365 and 280 nm photolysis, respectively. The [CBDA–H]⁻ precursor ion is visible at m/z 357.
Figure 11.
(a) Photolysis OFF and (b) photolysis ON ESI mass spectra of CBDA obtained in negative ion mode. (b) (LHS) and (b) (RHS) displays the ESI-MS obtained with 365 and 280 nm photolysis, respectively. The [CBDA–H]⁻ precursor ion is visible at m/z 357.
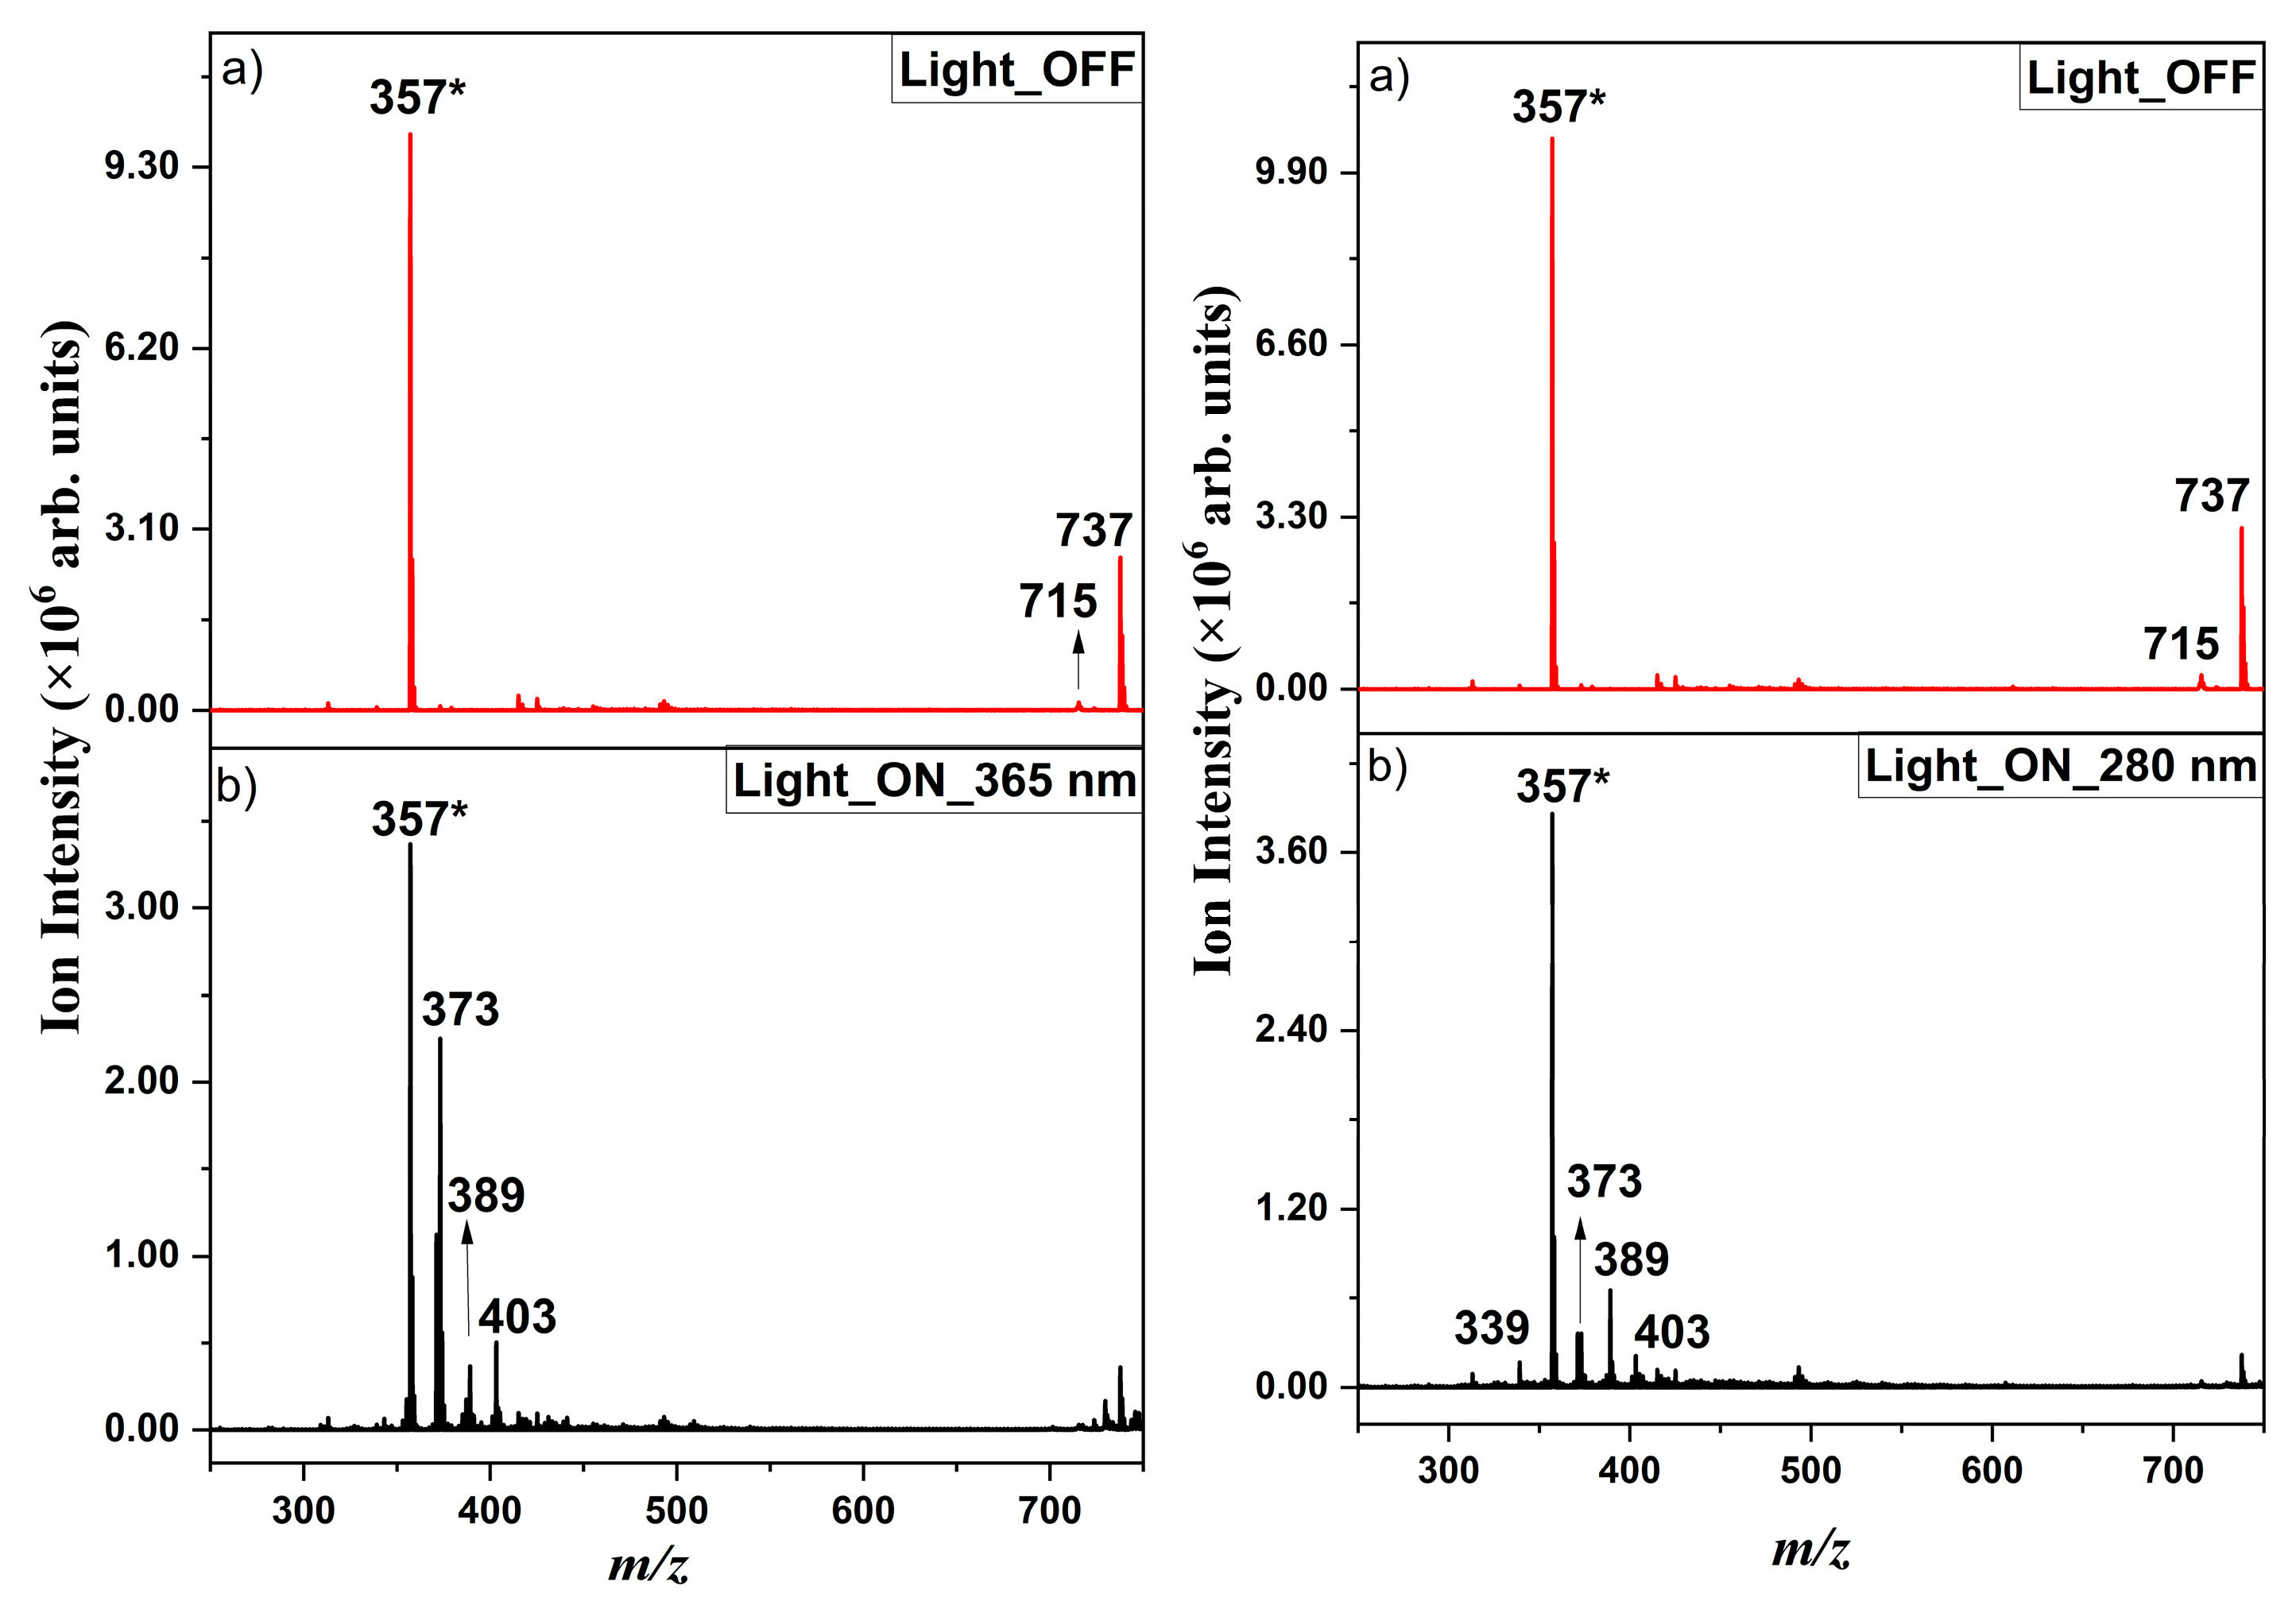
Figure 12.
Solution-phase UV–Vis absorption spectra of THCA in ACN obtained following irradiation at 280 nm over 0–120 mins.
Figure 12.
Solution-phase UV–Vis absorption spectra of THCA in ACN obtained following irradiation at 280 nm over 0–120 mins.
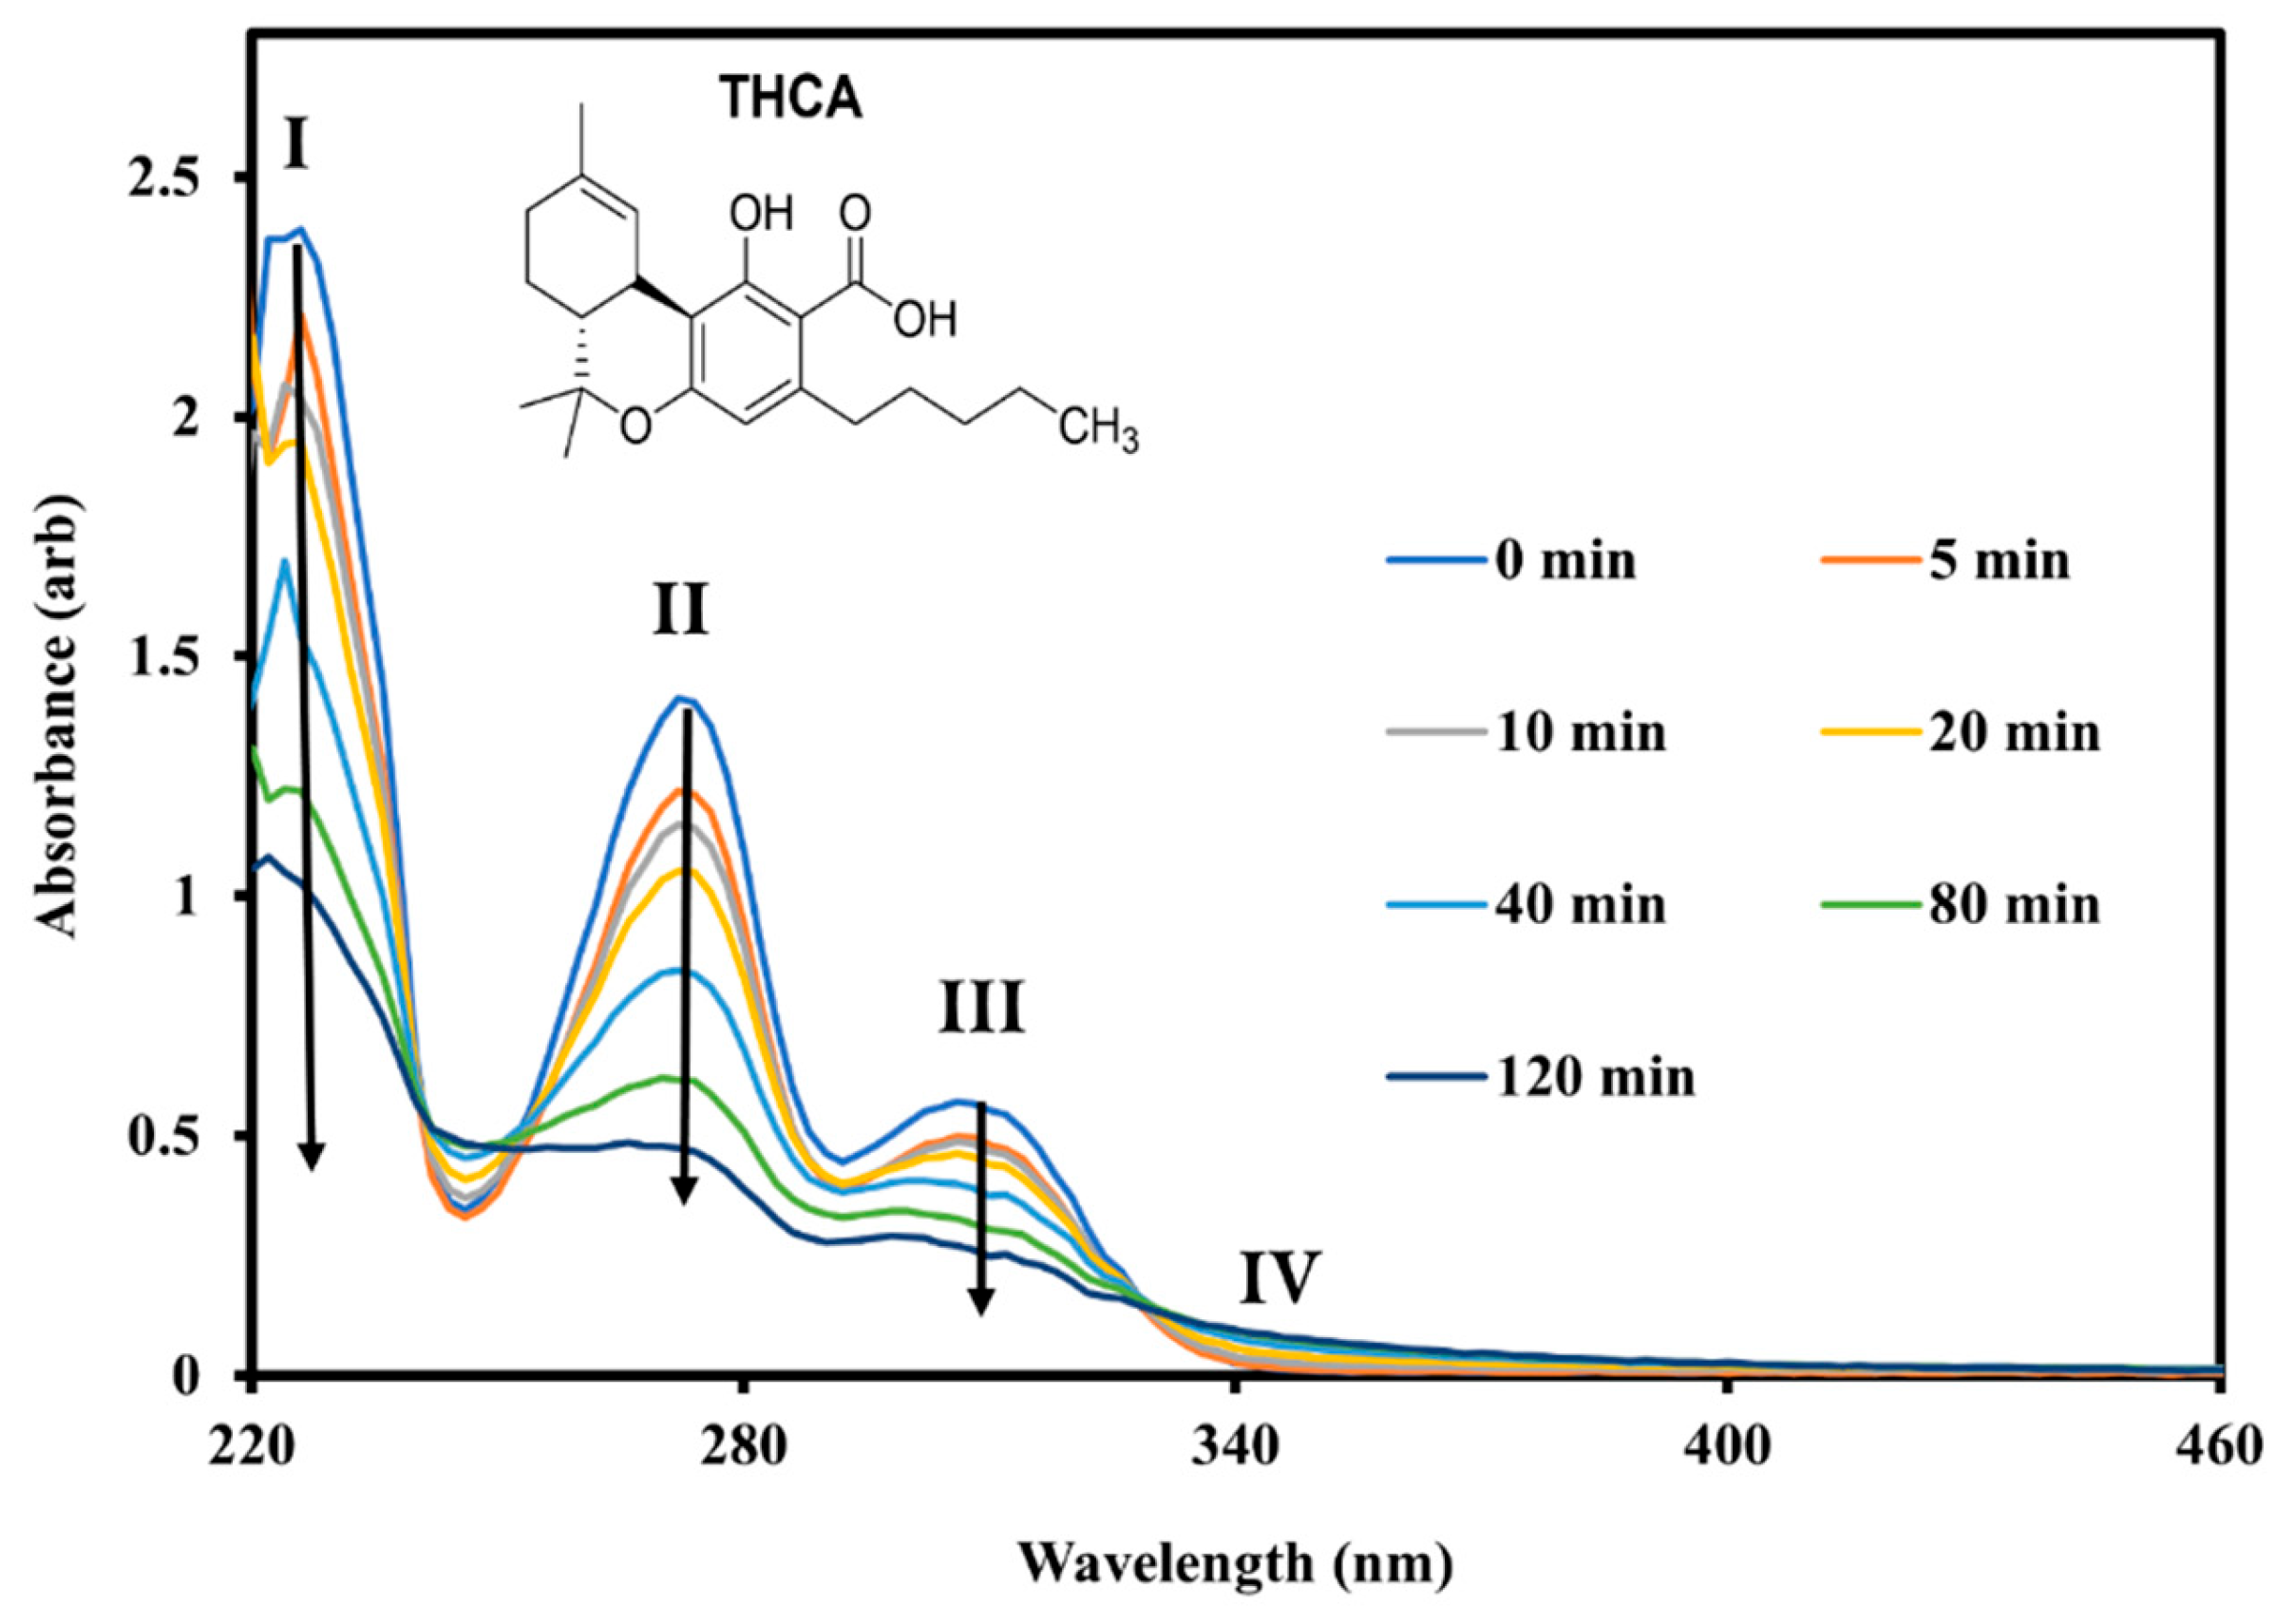
Figure 13.
(a) Photolysis OFF and (b) photolysis ON ESI-MS of THCA obtained in negative ion mode. The (LHS) and (RHS) panels display the ESI-MS obtained with 365 and 280 nm photolysis, respectively. The [THCA–H]⁻ precursor ion is visible at m/z 357.
Figure 13.
(a) Photolysis OFF and (b) photolysis ON ESI-MS of THCA obtained in negative ion mode. The (LHS) and (RHS) panels display the ESI-MS obtained with 365 and 280 nm photolysis, respectively. The [THCA–H]⁻ precursor ion is visible at m/z 357.
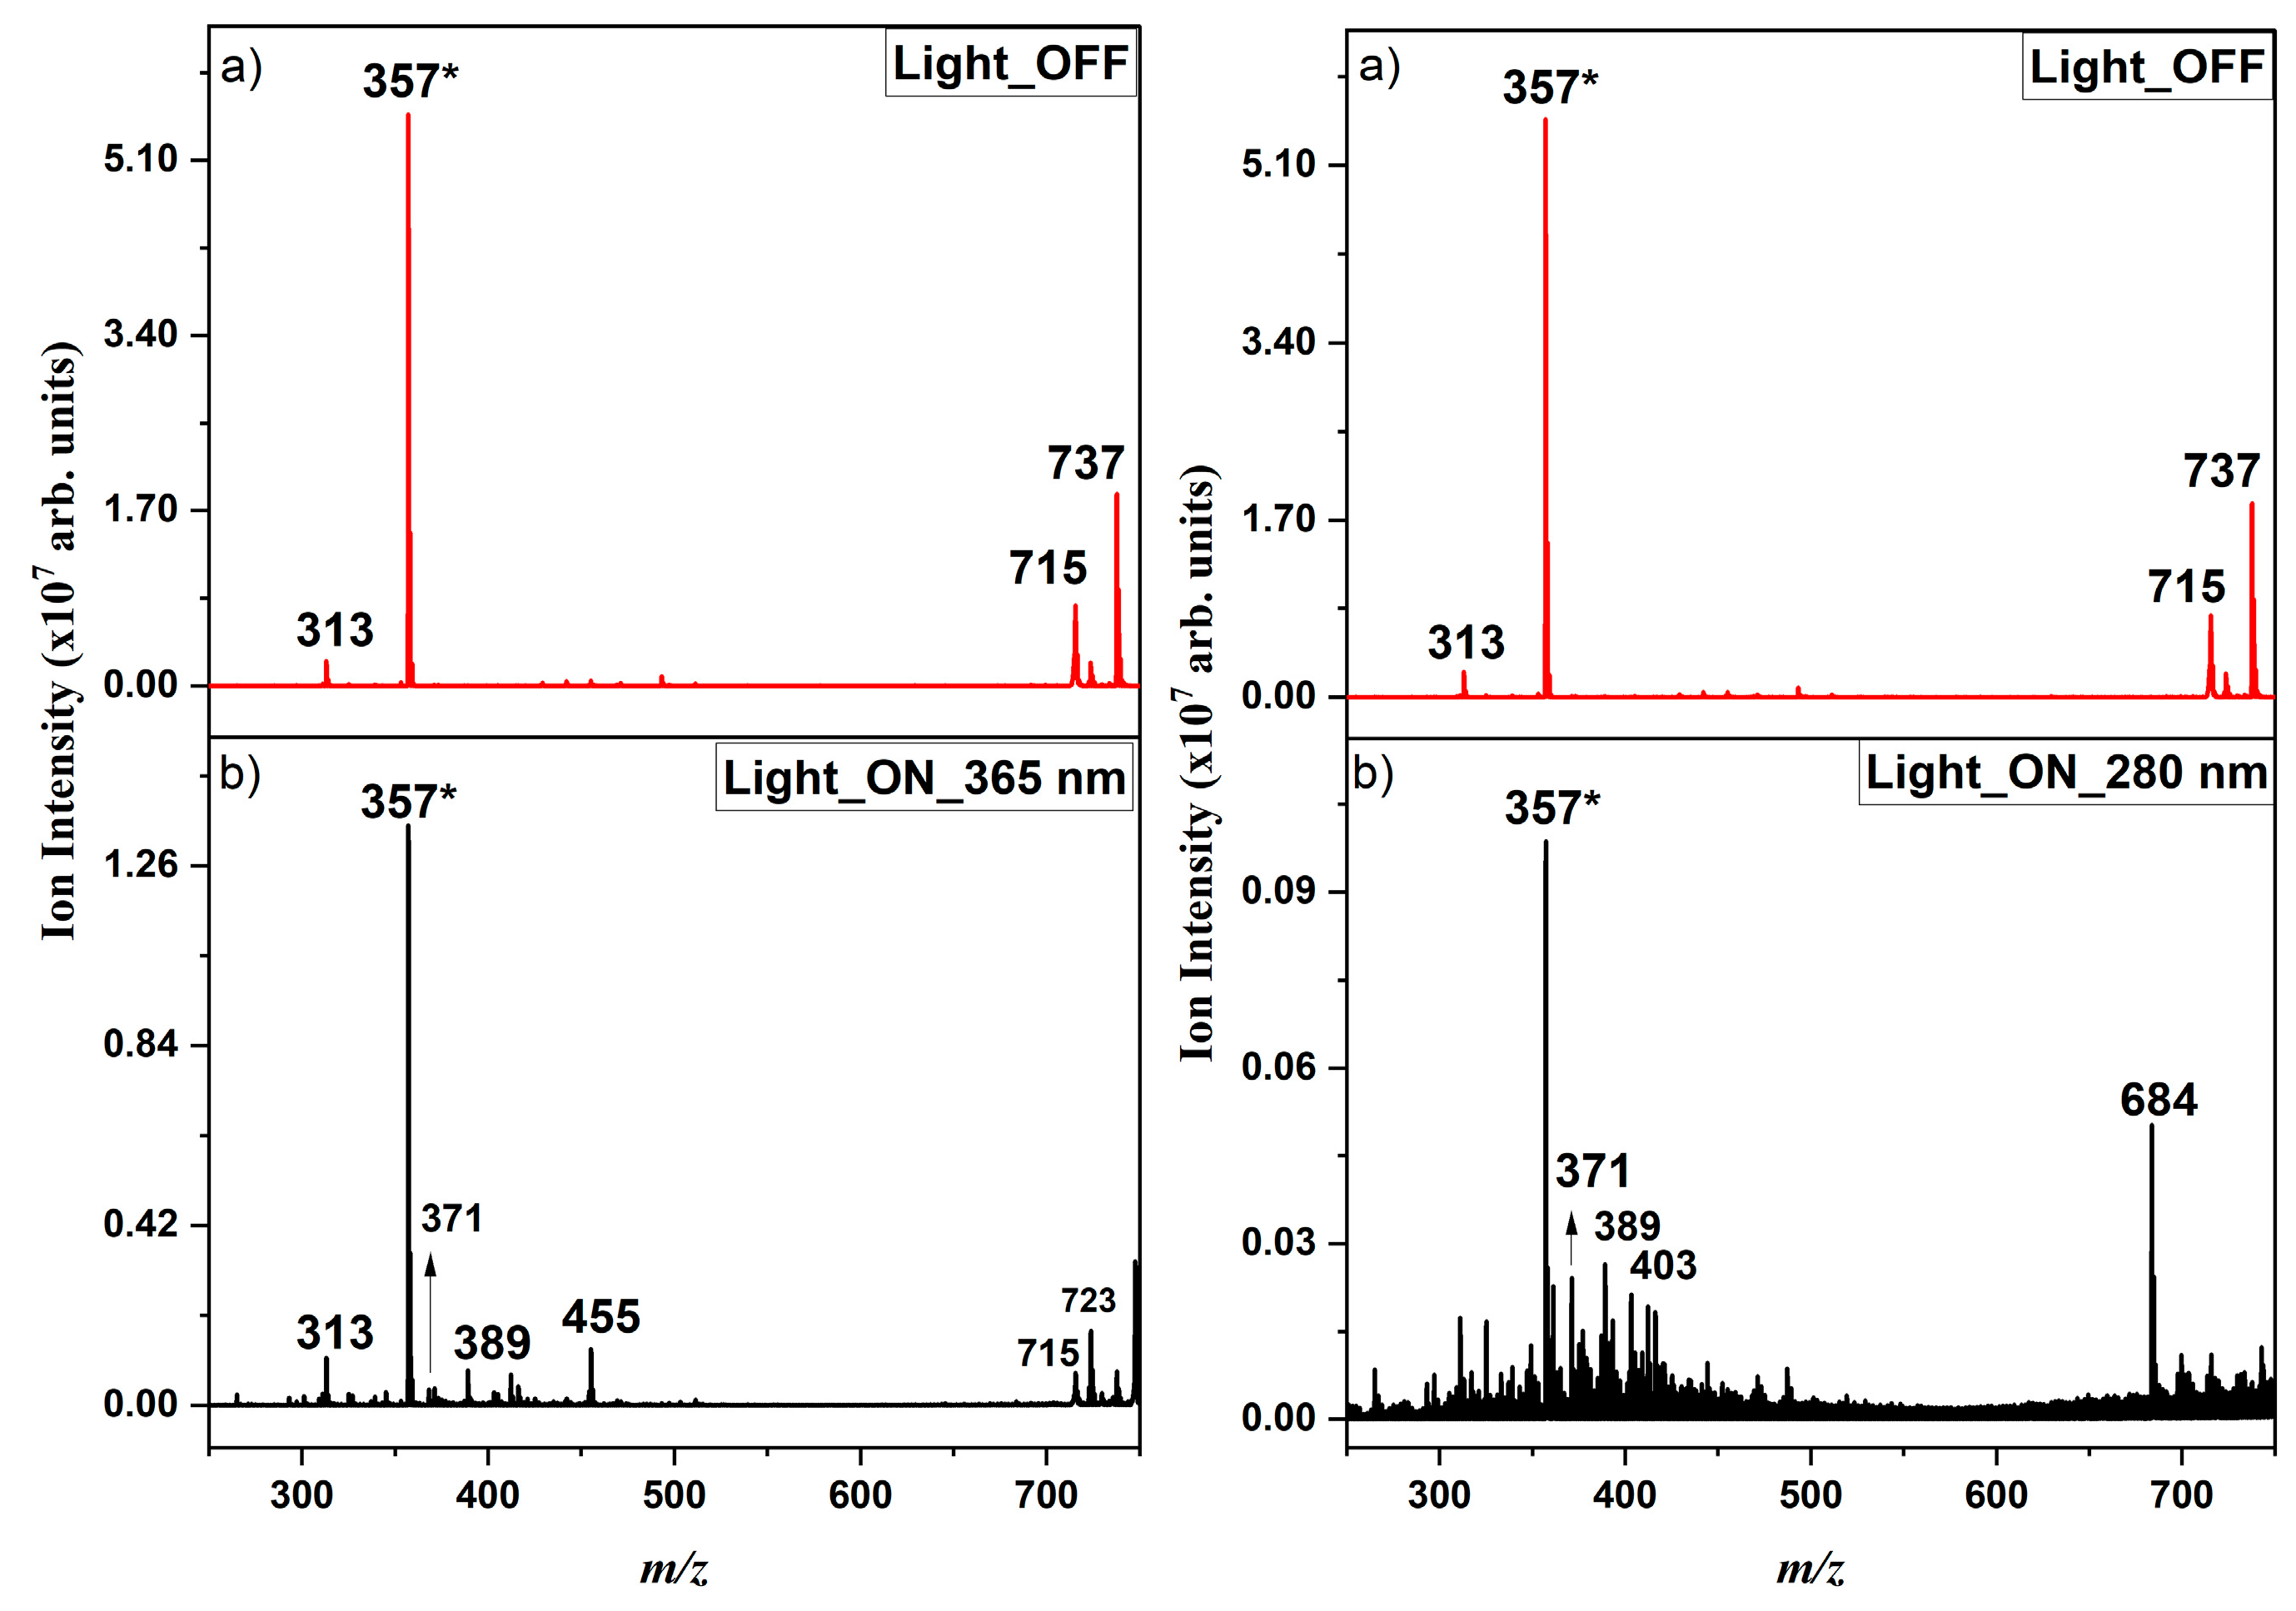

Table 1.
Comparison of observed m/z fragments from THC and CBD photolysis in methanol with negative ion mode ESI under three conditions: no light (OFF), 280 nm UV light (30 min), and 365 nm UV light (30 min). The precursor ion (m/z 313) is indicated by*. (Very strong (vs), strong (s), and weak (w).).
| m/z | THC_No Phot | THC_280 nm | THC_365 nm | CBD_No Phot | CBD_280 nm | CBD_365 nm |
|---|---|---|---|---|---|---|
| 113 | ✓ | ✓ (s) | ✗ | ✗ | ✓(s) | ✓ |
| 179 | ✓a | ✗ | ✓ a | ✓ a | ✗ | ✓a |
| 191 | ✓a | ✗ | ✓ a | ✗ | ✗ | ✗ |
| 207 | ✗ | ✓ (s) | ✗ | ✗ | ✓ (s) | ✓ |
| 245 | ✓ a | ✗ | ✓ a | ✓ a | ✗ | ✓a |
| 253 | ✓ | ✓ (s) | ✗ | ✗ | ✓ (s) | ✓ |
| 289 | ✓ | ✓ (s) | ✓ | ✗ | ✓ (v.s) | ✓ |
| 311 | ✓ a | ✗ | ✓ a | ✓ a | ✗ | ✓a |
| 313* | ✓ (v.s) | ✗ | ✓ (v.s) | ✓ (v.s) | ✗ | ✓ (v.s) |
| 345 | ✗ | ✓ (v.s) | ✗ | ✗ | ✓ (v.s) | ✗ |
| 359 | ✗ | ✓ (w) | ✗ | ✗ | ✓ (v.s) | ✗ |
| 363 | ✗ | ✓ (w) | ✗ | ✗ | ✓ (v.s) | ✗ |
| 375 | ✗ | ✓ (v.s) | ✗ | ✗ | ✓ (v.s) | ✗ |
| 381 | ✗ | ✓ (v.s) | ✗ | ✗ | ✓ (w) | ✗ |
| 389 | ✗ | ✓ (w) | ✗ | ✗ | ✓ (v.s) | ✗ |
| 391 | ✗ | ✓ (s) | ✗ | ✗ | ✓ (s) | ✗ |
| 393 | ✗ | ✓ (v.s) | ✗ | ✗ | ✓ (w) | ✗ |
| 407 | ✗ | ✓ (s) | ✗ | ✗ | ✓ (s) | ✗ |
| 477 | ✗ | ✓ (w) | ✗ | ✗ | ✓ (s) | ✗ |
| 479 | ✗ | ✓ (w) | ✗ | ✗ | ✓ (s) | ✗ |
| 481 | ✗ | ✓ (s) | ✗ | ✗ | ✓ (s) | ✗ |
| 509 | ✗ | ✓ (s) | ✗ | ✗ | ✓ (w) | ✗ |
| 511 | ✗ | ✓ (v.s) | ✗ | ✗ | ✓ (w) | ✗ |
| 513 | ✗ | ✓ (s) | ✗ | ✗ | ✓ (w) | ✗ |
| 627** | ✓ (v.s) | ✗ | ✓ (v.s) | ✓ (v.s) | ✗ | ✓ (v.s) |
a Present as a strong fragment at 20 % HCD (Figures S2 and S5).
Disclaimer/Publisher’s Note: The statements, opinions and data contained in all publications are solely those of the individual author(s) and contributor(s) and not of MDPI and/or the editor(s). MDPI and/or the editor(s) disclaim responsibility for any injury to people or property resulting from any ideas, methods, instructions or products referred to in the content. |
© 2026 by the authors. Licensee MDPI, Basel, Switzerland. This article is an open access article distributed under the terms and conditions of the Creative Commons Attribution (CC BY) license (http://creativecommons.org/licenses/by/4.0/).
Copyright: This open access article is published under a Creative Commons CC BY 4.0 license, which permit the free download, distribution, and reuse, provided that the author and preprint are cited in any reuse.


