Preprint
Article

This version is not peer-reviewed.

QTL-Seq Identifies Extra QTLs and Candidate Genes Controlling High Haploid Induction Rate in Maize

Submitted:

26 January 2026

Posted:

28 January 2026

You are already at the latest version

Abstract

Double-haploid (DH) technology is a well-established method for speeding up the development of inbred lines in breeding programs. The major loci qhir1 and qhir8 are widely used in marker-assisted selection (MAS) to increase the haploid induction rate (HIR) in maize. However, previous studies have shown that HIR can be unstable within populations, even in the presence of these two loci. To identify novel loci associated with HIR, we performed QTL-seq analysis on 337 S2 haploid inducers (qhir1+/qhir8+) derived from crossing K8 with BHI306. The population exhibited HIR ranging from 0% to 31.16%. We sequenced bulked DNA from 30 extreme high-HIR lines (15.72-31.16%) and 30 extreme low-HIR lines (0-3.84%), identifying candidate intervals on chromosomes 2 (qHI2), 3 (qHI3), 6 (qHI6), and 8 (qHI8). Based on the QTL-seq results, 147 high-confidence SNPs/InDels (R² > 0.3) led to the analysis of 58 genes across three QTLs. We retrieved ten missense mutation SNPs from three genes (GRMZM2G359746 (qHI2), AC198725.4 (qHI3), and GRMZM2G091276 (qHI8)), which are located on chromosomes 2, 3, and 8. Regression analysis of these SNPs showed an R² range of 0.27 to 0.72. The two most highly associated SNPs were located in exon 2 of GRMZM2G359746 (qHI2) and in exon 5 of GRMZM2G091276 (qHI8), respectively. Marker-trait association analysis revealed that lines carrying favorable alleles at both loci, together with qhir1+ and qhir8+, exhibited significantly higher average HIR (12.77%) compared to those with unfavorable alleles (6.66%). These findings provide valuable markers for enhancing maternal haploid inducer breeding programs in maize.

Keywords: 
;  ;  ;  ;  

1. Introduction

Maize (Zea mays L.) is one of the most widely cultivated crops in the world [1]. The top three producing countries are the United States, China, and Brazil, accounting for 32%, 24%, and 10% of the global production, respectively [2]. Maize is primarily grown for livestock feed and fuel ethanol production. Maize growers commonly use F1 hybrid seeds because they offer advantages such as higher yields, greater uniformity, and improved lodging resistance [3].
QTL-seq analysis is a widely used and powerful method for mapping quantitative trait loci (QTL). Takagi et al. [4] first reported and published a protocol that successfully identified QTL in rice using recombinant inbred lines (RILs) and F2 populations. This method can be applied to any population type to detect genomic regions that have undergone artificial or natural selection. However, QTL-seq has one limitation: it is not suitable for detecting QTL with minor effects because it is not possible to take replicated measurements for each genotype. In this approach, DNA is extracted from two groups with extreme phenotypes within a segregating population, as well as from the parental lines, for whole-genome sequencing. The ΔSNP index is used as the statistical model. First, the k-value is calculated, representing the number of reads with an allele that differs from the reference. Then, the SNP index for the two extreme bulked DNA samples is calculated using the formula:
SNP - index   = k 1 n   ,
Where n is the total number of reads. Typically, only SNPs with an index greater than 0.3 are retained for further analysis. Then, a sliding window approach is applied to visualize the graphs based on the SNP index. Next, the ΔSNP index is calculated as follows: ΔSNP index = SNP index of the highest bulk – SNP index of the lowest bulk. Finally, QTL are identified in regions with the highest ΔSNP index, assuming that these genomic regions differ significantly between the two bulks. A high ΔSNP index indicates that the genomic regions are representative of the highest bulk or related to phenotypes observed in the uppermost population groups [4,5]. QTL-seq has been widely used in various crops, including capsicum [6], soybean [7], peanuts [8,9], tomatoes [10,11,12], bottle gourds [13,14], pears [15], radishes [16], and rice [9,17,18,19,20,21,22,23,24,25,26,27,28,29,30,31].
The doubled haploid (DH) technique is an essential tool in commercial maize breeding programs because it is the fastest and most efficient way to generate completely homozygous lines, surpassing conventional inbred development [32]. This process uses maternal haploid inducers to produce pollen for haploid seed development [33,34]. Subsequent chromosome doubling of the haploid genome, followed by self-pollination, yields the final homozygous DH lines [32]. Two critical factors that govern DH efficacy are the haploid induction rate (HIR) and the DH technique. Recently, two major quantitative trait loci (QTL) controlling HIR were identified: qhir1 and qhir8. The underlying gene of qhir1 is one of these genes: MATRILINEAL (MTL), ZmPHOSPHOLIPASE-A1 (ZmPLA1), or NOT LIKE DAD (NLD). This gene is characterized by a 4-bp insertion in the fourth exon. In contrast, the Zea mays DUF679 domain membrane protein (ZmDMP) gene in the qhir8 region exhibits a single-nucleotide substitution mutation [11,35,36]. The ZmDMP mutation alone results in a low basal HIR of approximately 0.15%, but when it is presented with MTL, there is a 2-3-fold increase in HIR [11].
Additionally, mutations induced by CRISPR-Cas9 in the Zea mays PHOSPHOLIPASE D3 (ZmPLD3) gene can increase HIR by up to threefold (from 1.19% to 4.13%) when MTL is also present [37]. CRISPR-Cas9-induced mutations in the peroxidase65 (ZmPOD65) gene, which belongs to the reactive oxygen species (ROS) class, can lead to HIR ranging from 0.9% to 7.7% [38]. A recent genome-wide association study (GWAS) involving 952 lines, including 159 haploid inducers and 793 non-inducers, identified one significant QTL on chromosome 10 and a QTL with a smaller effect on six of the ten chromosomes [39]. Furthermore, a novel Centromeric Histone H3 (cenh3) gene associated with centromere failure caused by CENH3 dilution during post-meiotic cell divisions preceding gamete formation has been discovered. This dilution increases HIR to approximately 5% when crossing maize heterozygous for a cenh3 null mutation with wild-type plants to produce haploid progeny [40].
However, in our previous study, we found that HIRs are not stable, even in the presence of qhir1 and qhir8, when using haploid inducer populations in generations F3 and F4 [41]. To better understand the genetic basis of HIR, we performed a QTL-seq analysis of 337 S2 haploid inducer lines derived from a cross between K8, which has low levels of HIR, and the high-HIR inducer line BHI306. This study aims to (i) identify QTL associated with high HIR through QTL-seq analysis and (ii) gain a deeper understanding of the molecular mechanisms underlying haploid induction in maize.

2. Results

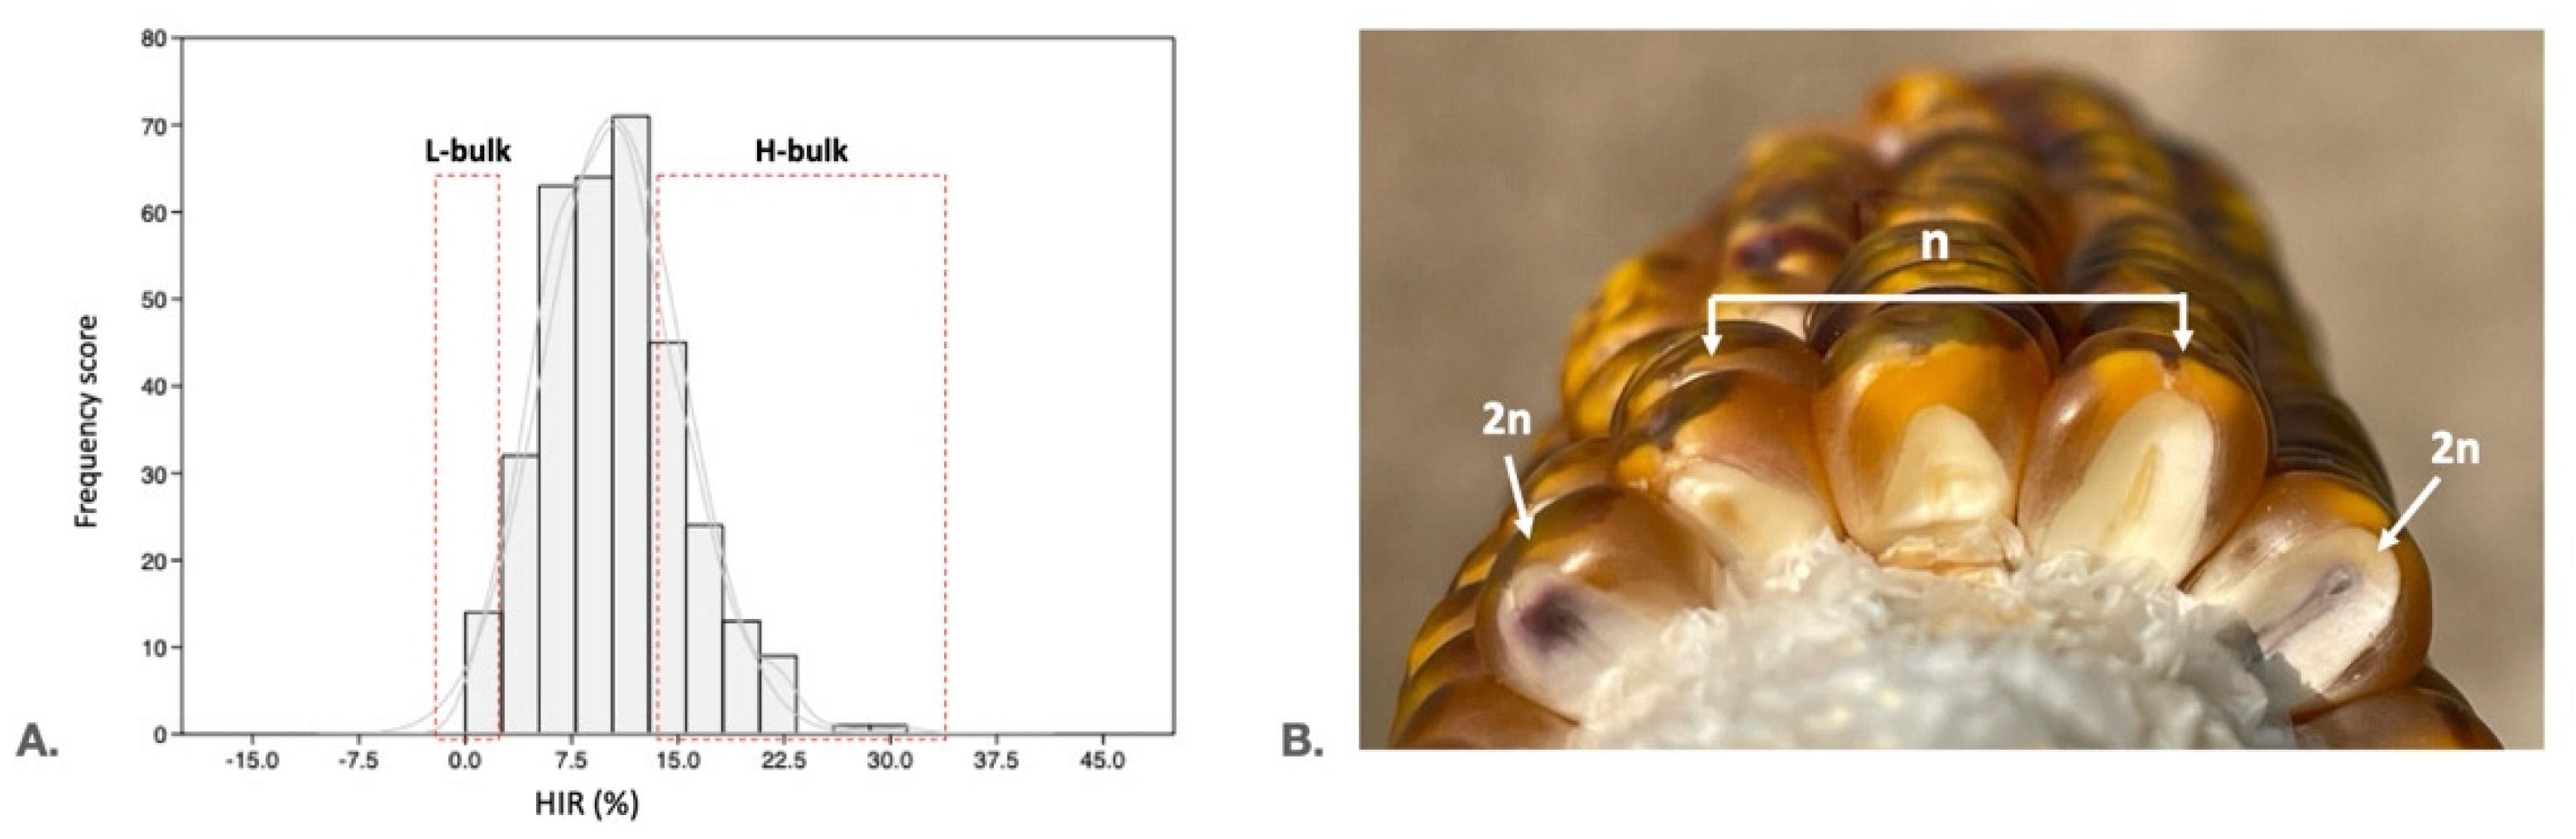
2.1. Phenotyping of the Mapping Population and Selection of Extremely High and Low HIR

Analysis of the HIR frequency distribution histogram (Figure 2) showed skewness towards low HIR values in populations. To identify the genomic region associated with HIR, we performed QTL-seq analysis on haploid inducers derived from a cross between BHI306 (male parent) and one tropical inducer, K8. A total of 337 S2 haploid inducer lines were used in the study (Table S1). To ensure the quality and robustness of the phenotyping, we used the innate differences between haploid (n) and diploid (2n) at the seedling stage to minimize errors (Figure S1).
Figure 2. Evaluation of the haploid induction rate (HIR) in 337 S2 inducer lines. A. Distribution of HIR in the 337-inducer population. The dashed rectangles indicate the lines selected to generate the H and L bulks. B. The phenotypic appearance of haploid (n) and diploid (2n) seeds was evaluated using the R1-nj biomarker.
Preprints 196132 g001

2.2. Whole-Genome Resequencing, Sequence Processing, and Variant Calling

Thirty extremely high and low HIRs were selected from each side. Their entire genome was captured using the BGISEQ-100 platform (Shenzhen, China). The cleaned reads from BHI306 and K8 were as follows: 186.83 and 140.32 million, respectively. This corresponded to a genome coverage of approximately 12.28- and 9.39-fold, respectively, given an estimated maize genome size of 2,058 megabase pairs (Mb).
A total of 1,521 million and 1,415 million cleaned reads were obtained from the 60 haploid inducer samples. The sequences of the 30 haploid inducers with high HIR were grouped together and referred to as high bulk (H bulk), while the sequences of the 30 haploid inducers with low HIR were grouped together and referred to as low bulk (L bulk). Based on read alignment to the B73 reference genome, the proportion of aligned reads was as follows: BHI306 (89.29%), K8 (87.58%), H bulk (99.95%), and L bulk (99.98%) (Table 1).

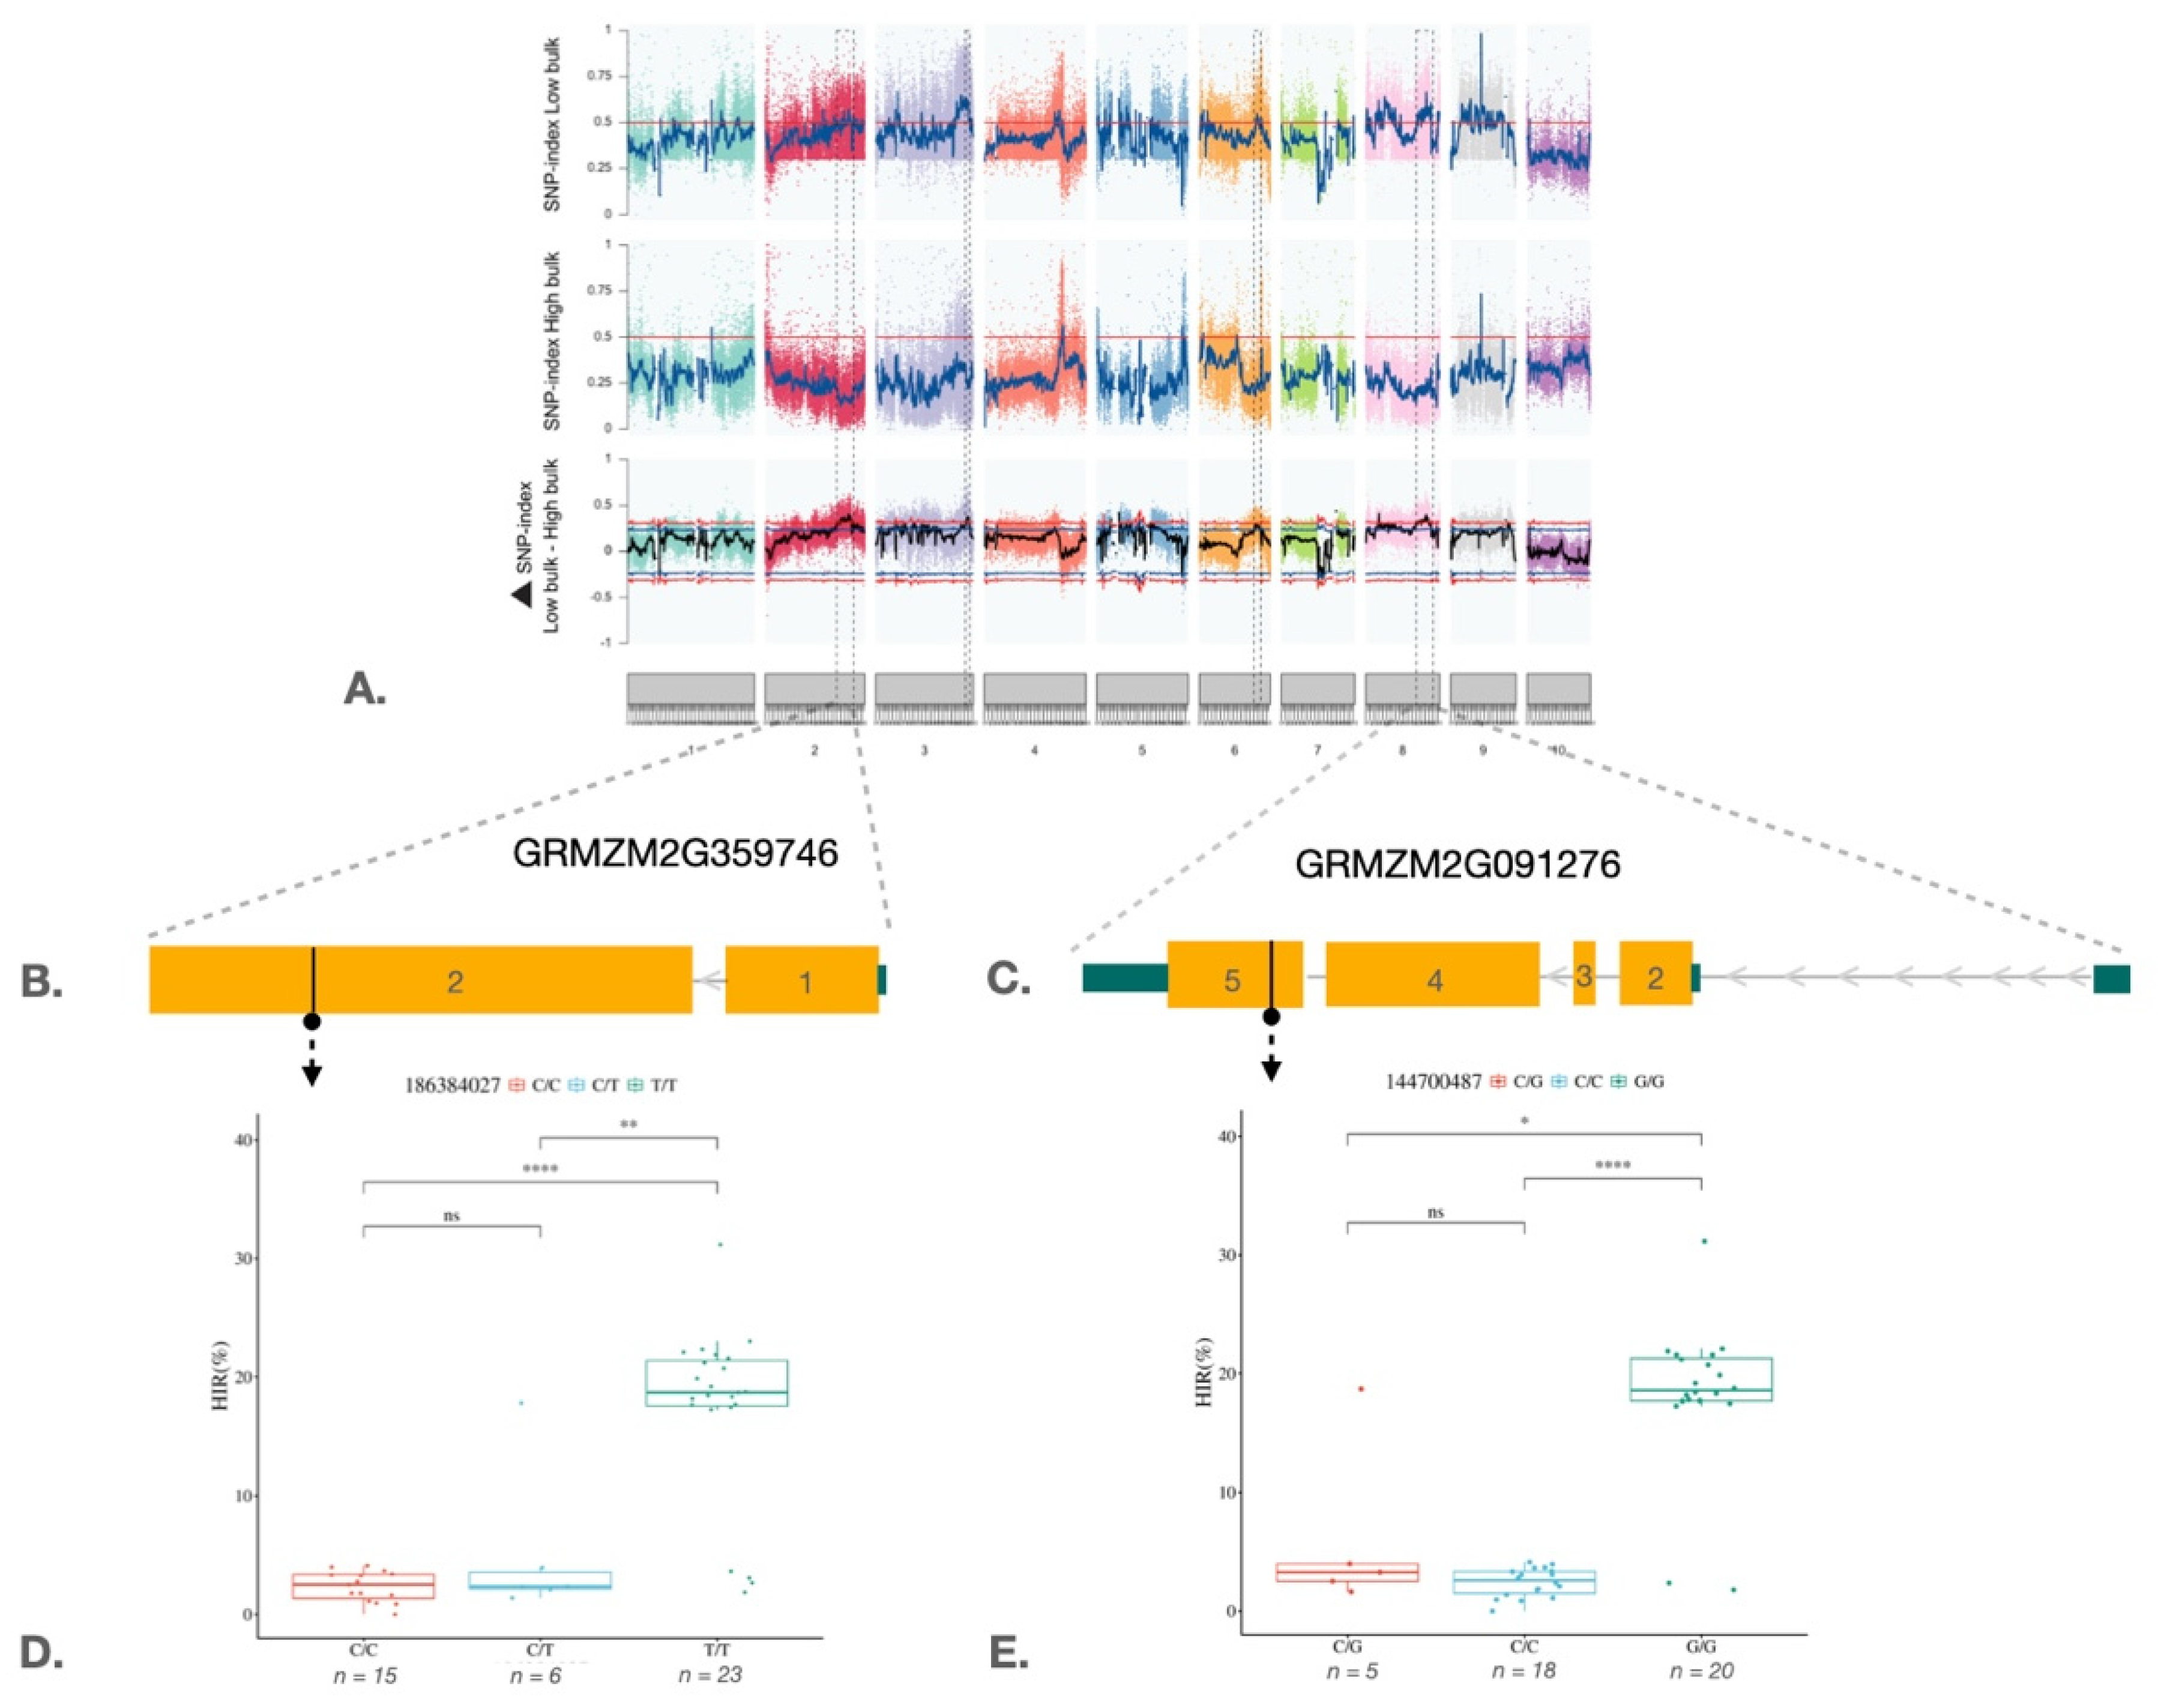
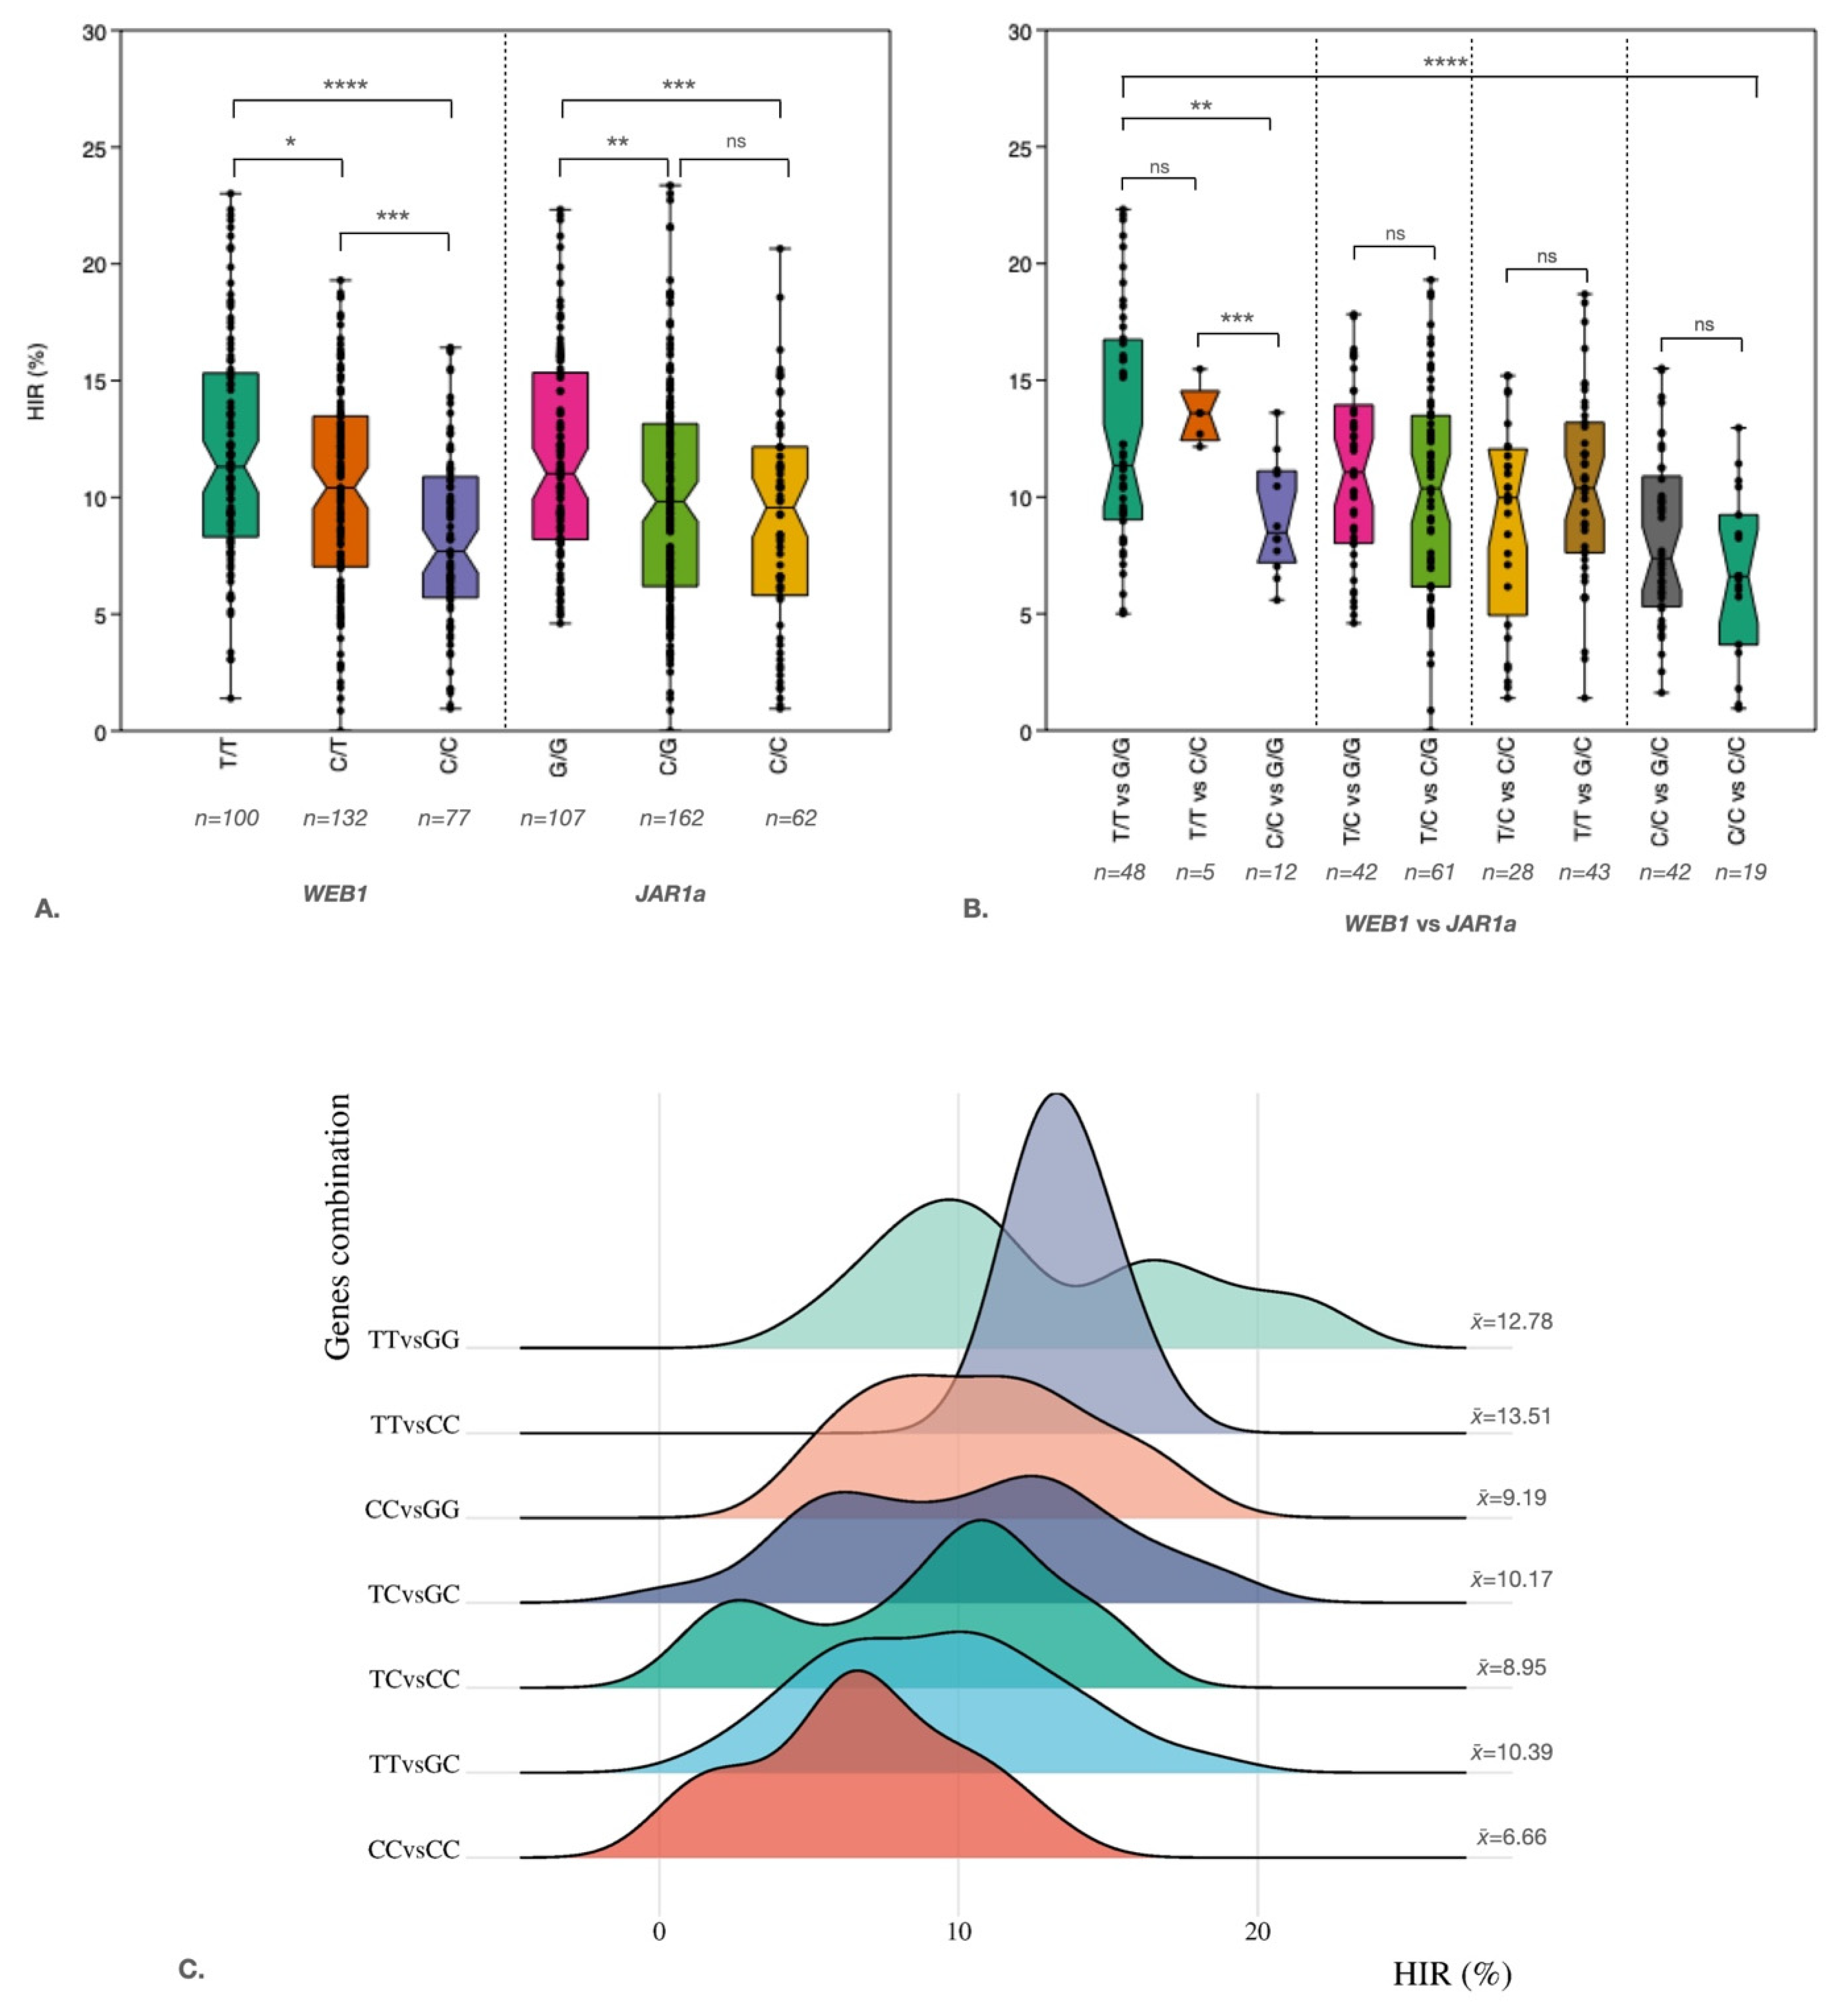
2.3. QTL-Seq Analysis and Marker Validation in the Maize Haploid Inducer Population

QTL-seq analysis was performed using the QTL-seq pipeline [42]. The SNP variants used in this analysis were common SNPs identified in both the H and L bulks based on read mapping against the BHI306 parental genome. Initially, 90,626 SNPs and 33,595 InDels were identified in the two bulks with a read support criterion of at least seven reads (Table 2). We calculated the ∆SNP index by subtracting the SNP index values in the H bulk from those in the L bulk. This calculation was based on moving windows that averaged SNP index values within 1-Mb regions with 100-kb increments. Then, we plotted the ∆SNP index across the ten maize chromosomes to identify genomic regions associated with high HIR (Figure 2A). As a result, four QTL were located on chromosomes 2, 3, 6, and 8, where the average ∆SNP index exceeded the 99% confidence interval with values ranging from 0.31 to 0.32 (Table 3). We evaluated the R² values for 5,224 SNPs within the four QTL and found that 147 SNPs with R² values greater than 0.3 were associated with qHI2, qHI3, and qHI6 and six candidate genes: GRMZM2G140156, GRMZM2G359746, GRMZM2G440943, AC198725.4, GRMZM2G091276, and GRMZM2G134738 (Table 3). Ten of these SNPs caused missense mutations in three genes: GRMZM2G359746, AC198725.4, and GRMZM2G091276. These mutations occurred on chromosomes 2, 3, and 8 (Table 4). Two SNPs with R² values greater than 0.5 on chromosomes 2 and 8 were selected for KASP marker development (Figure 3B–E).
Figure 3. Plots of the SNP index for the H and L bulk and the ΔSNP index across ten maize chromosomes. A. The graphs depict the SNP index for the L and H bulk and the Δ SNP index from QTL-seq analysis. The blue and red line pairs represent 95% and 99% confidence intervals, respectively, and the pink vertical bar represents the peak SNP in the candidate region. B. Structure of the WEB1 gene (GRMZM2G359746). C. Structure of the JAR1a gene (GRMZM2G091276). (D) Box plots of SNP position 186384027 belonging to the WEB1 gene. Box plots of SNP position 144700487 belonging to the JAR1a gene.
Preprints 196132 g002
To test the relationship between genes and HIR, two Kompetitive Allele-Specific PCR (KASP) markers were developed from the WEB1 and JAR1a genes identified in the QTL-seq analysis. These markers were then used to analyze the association between markers and traits. For the WEB1 gene, a marker was designed from SNP position 186384027 (WEB1_2_186384027) on chromosome 2 of the maize genome reference version 2 (V.2). A nucleotide substitution from T to C in exon 2 resulted in an amino acid change from arginine to glutamine (Table 4). The JAR1a marker was designed from the SNP position 144700487 (JAR1a_8_144700487) on chromosome 8 (V.2). A nucleotide substitution from C to G on exon 5 led to an amino acid change from glycine (G) to arginine (R) and was used to genotype the S2 population (Table 4). Marker-trait association results revealed a highly significant association between both markers and the phenotypes (P-value < 0.001) (Figure 4A,B). The phenotypic variance explained (PVE) by markers WEB1_2_186384027 and JAR1a_8_144700487 was 8% and 3%, respectively, in the entire population (Table 5). Additionally, we found that the presence of the WEB1 and JAR1a genes in homozygous TT and GG forms, respectively, leads to HIR of up to 12.78%. However, HIR is only 6.66% when the genotype is homozygous CC and CC, respectively (Figure 4C).
Figure 4. WEB1_2_186384027 and JAR1a_8_144700487 KASP marker validation. A. Box plot showing the genotype-phenotype correlations of HIR and the WEB1_2_186384027 (n = 309) and JAR1a_8_144700487 (n = 331) markers, respectively, in the S2 population. B. Box plot showing combinations of the two markers. C. A ridgeline plot showing the density of each combination of the two markers.
Preprints 196132 g003

3. Discussion

In this study, a total of 6 annotated candidate genes were associated with SNPs that exhibited an R2 value ranging from 0.27-0.72. These candidate genes were mainly located on chromosomes 2, 3, and 8. According to the MaizeGDB database, two genes of particular interest are GRMZM2G359746 (WEAK CHLOROPLAST MOVEMENT UNDER BLUE LIGHT 1), which is located on chromosome 2 and is highly related to chloroplast photo relocation movements under blue light. WEB1 localization in the cytosol, Kodama et al. [43] reported that the WEB1 mutation in Arabidopsis led to the chloroplast avoidance movement occurring more slowly than that of WT under strong blue light conditions due to the regulations of cp-actin filaments being impaired in the mutant [43]. Although the strong blue light can induce reactive oxygen species (ROS), there is no evidence that WEB1 is related to ROS. Majumdar and Kar [44] reported that chloroplast ROS generation occurs via thylakoid membrane-located large, multi-subunit oxidoreductase protein complexes, namely photosystem I and II (PS I and PS II). Found that in strong light conditions, the rates of energy transfer and electron (e−) transport through the photosynthetic e− transport chain (ETC) are much slower than light energy harvesting [45,46,47,48]. Creating O2˙− is produced significantly at the reducing side of photosystem I (PS I), where molecular O2 competes with NADP+ for receiving e− from PS I acting as the terminal e− acceptor and produces O2˙− by Mehler reaction [48,49]. Whereas H2O2 may originate from incomplete oxidation of H2O or one-electron reduction of O2˙− [50,51]. The associated SNP, denoted as WEB1_2_186384027, is located on chromosome 2 within the exon 2 of the WEB1 gene. This SNP shows a substitution from C to T, the missense mutation led to an amino acid change from Arginine (R) to glutamine (Q) with an R2 value of 0.58.
And the GRMZM2G091276 (Jasmonate-resistant 1) gene is located on chromosome 8 and is highly related to late stamen development. Song et al. [52] revealed that Arabidopsis jasmonate-aminosynthetase/jasmonate-resistant 1 (JAR1a) belongs to the jasmonic acid (JA) biosynthesis pathway as one of the structural genes. JA has been shown to play a role in stamen development, root growth, trichome formation, leaf senescence, anthocyanin accumulation, and defense against insects and pathogens [53,54,55,56,57,58]. JAR1a has been reported to convert acyl-CoA oxidase (ACX) into jasmonoyl-L-isoleucine (JA-Ile), which is the bioactive form of JA that is perceived by COI1. COI1 then recruits JAZ proteins for ubiquitination and degradation via the 26S proteasome. Degradation of the JAZ proteins releases the MYB21, MYB24, and MYB57 downstream factors to regulate late stamen development. Mutations in genes that encode JA biosynthetic enzymes result in filament elongation failure, delayed anther dehiscence, and unviable pollen at floral stage 13 [59,60,61]. The associated single-nucleotide polymorphism (SNP), denoted as JAR1a_8_144700487, is located on chromosome 8 within exon 5 of the JAR1a gene. This SNP involves a substitution from C to G; the resulting missense mutation changes the amino acid from glycine (G) to arginine (R), with an R² value of 0.72.
Of the markers evaluated in the entire S2 population, the percentage of variance explained (PVE) was found to be low. However, we found that the average HIR increased in both gene mutations, especially in the WEB1 gene. The maximum HIR increased to 23.01%, compared to 16.42% in the wild type (WT). The JAR1a gene mutation maintains a minimum HIR of 4.6%, compared to 0.95% in WT (Figure 4A). We believe that this finding will enable breeders to increase the HIR selection index in the haploid inducer breeding program in the future.
Key players in maternal haploid induction include the membrane protein DOMAIN OF UNKNOWN FUNCTION 679 (DMP), which has been shown to play a role in gamete fusion during double fertilization [62,63]. The MTL/ZmPLA1/NLD gene, which encodes a pollen-specific phospholipase, has also been associated with the haploid induction process in maize. It regulates the formation and development of maize pollen as well as pollen tube elongation [64,65,66]. However, the WEB1/PMI2 complex was found to suppress the chloroplast accumulation response control [67], and the JAR1a gene was found to be related to late stamen development 52. However, further validation is needed to confirm the involvement of these genes in haploid induction.

4. Materials and Methods

4.1. Plant Materials and HIR Evaluation

A population of 337 S2 haploid inducers was developed from crossing K8 (qhir1-/qhir8-, low HIR, tropical) x BHI306 (qhir1+/qhir8+, HIR of 10-15%, temperate) (Figure 1). BHI306 developed by Iowa State University's Doubled Haploid Facility, carries the R1-nj and Pl-1 markers for haploid identification. F1 plants were self-pollinated to produce F2 progeny. Using qhir1 and qhir8-specific markers [41], we genotyped the F2 population and selected 19 individuals with qhir1+/qhir8+ genotypes named as S1. Based on preliminary HIR screening and marker analysis, 19 superior S1 were selected and assigned to two groups (Group A: 10 families; Group B: 9 families) based on genetic diversity to maximize recombination. The pollen from each group were bulk for reciprocal intercross between groups generated 337 S2 lines, all confirmed as qhir1+/qhir8+ through marker-assisted selection. This intercrossing strategy was employed to maintain genetic variation at other loci while fixing the major HIR QTLs, thereby facilitating the identification of additional minor-effect loci.
HIR was evaluated by crossing each S2 inducer (as male) to the commercial hybrid Pacific789 (as female). Due to variable flowering times, the donor was planted four times at 5-day intervals. Each inducer pollinated one ear without replication. Standard precautions (bagging, detasseling) prevented contamination. Haploid seeds were identified using the R1-nj marker (purple crown endosperm, colorless embryo vs. diploid with purple in both tissues). HIR was calculated as follows:
HIR   ( % )   = seed   number   of   putative   haploid seed   set   x   100
where the seed set represents the total seed number of haploid seeds, diploid seeds, and the seeds without the R1-nj marker. Haploid identification was validated using seedling morphology (radicle and coleoptile length) as described by Dermail et al. [68].
Figure 4. The schematic of the S2 population development.
Preprints 196132 g004

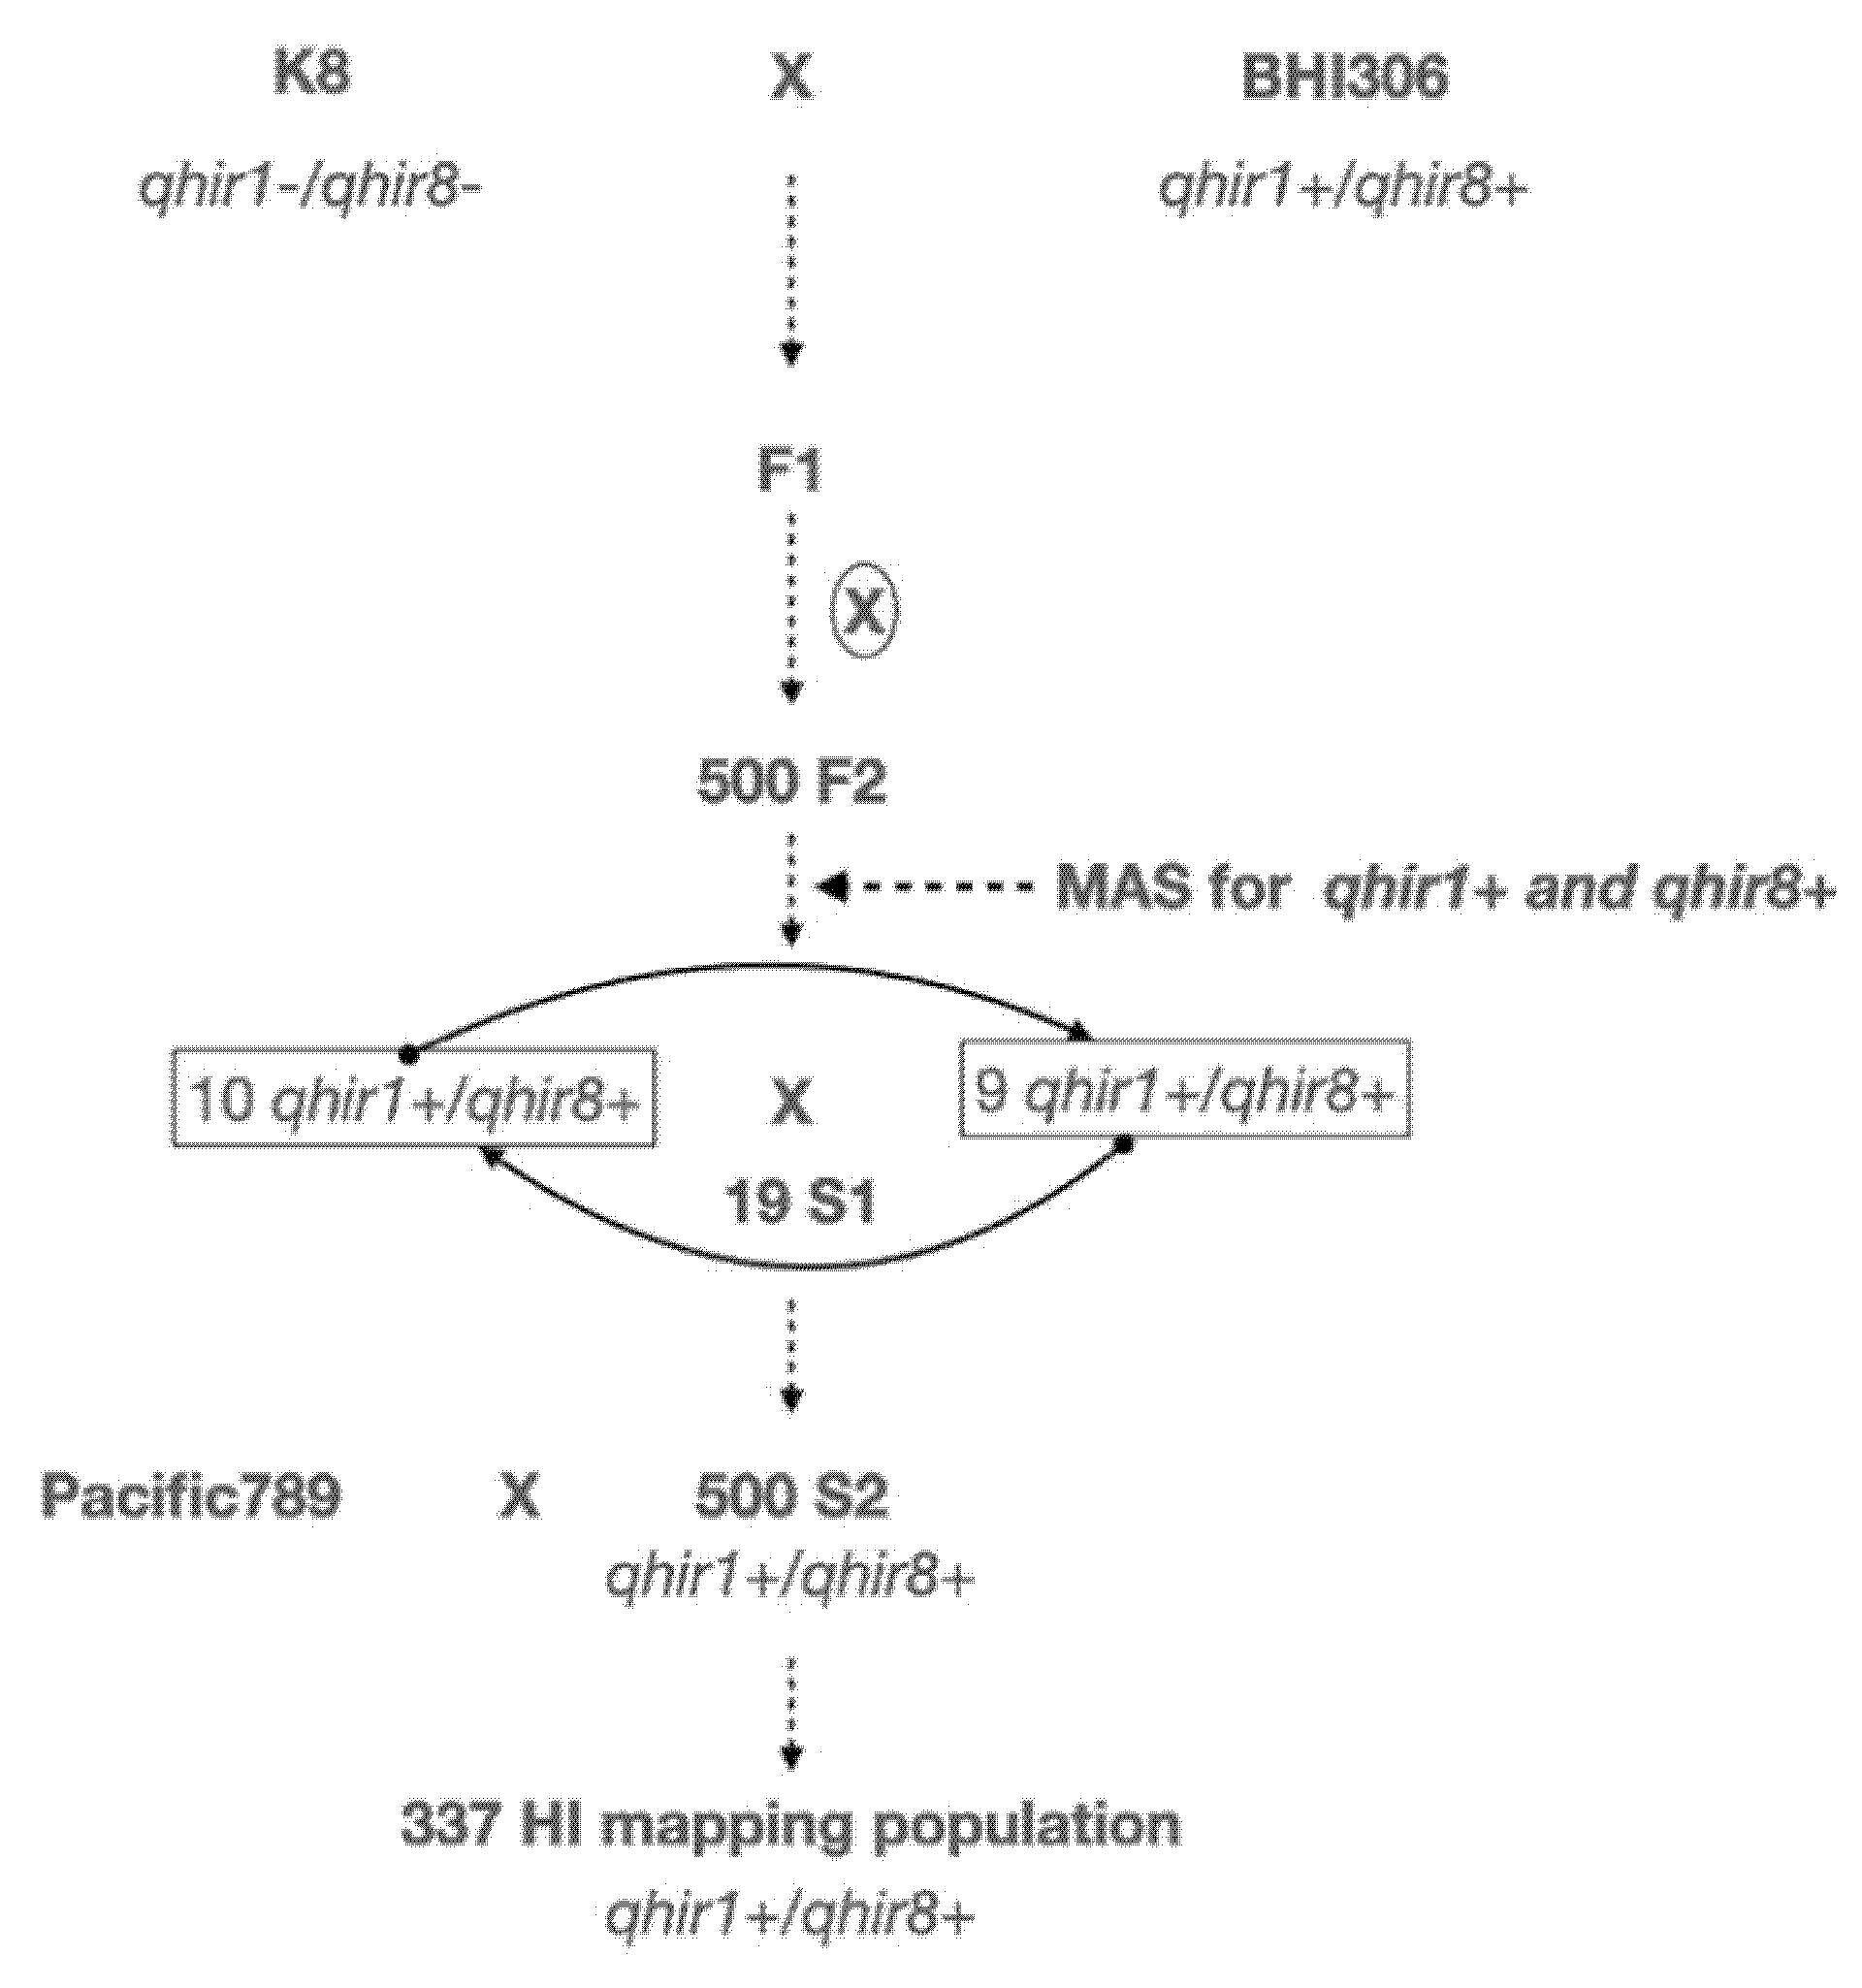
4.2. Selection of Plants with Extremely High and Low Haploid Induction Rates, DNA Isolation and Whole-Genome Resequencing

A total of 337 S2 haploid inducers were identified by the HIR using the R1-nj biomarker and innate differences (Table S1). The groups with the highest and lowest HIRs were selected for QTL-seq analysis. High-quality genomic DNA was extracted from the leaves of 30 high- and 30 low-HIR S2 haploid inducer plants (Table S2), as well as from the BHI306 and K8 parental lines, using a DNeasy Plant Mini Kit (Qiagen, Germany). The DNA samples were sent to BGI (BGI-Shenzhen, China) for whole-genome sequencing using the BGISEQ-100 platform.

4.3. Processing of Sequencing Data and QTL-seq Analysis

Raw reads were trimmed and filtered using Trimmomatic (v. 0.40) to remove low-quality sequences [22]. Of the 30 samples in the high HIR group, 1.521 billion clean reads were randomly selected and pooled to create the highest bulk (H bulk). Similarly, 1.415 billion clean reads were randomly selected from each of the 30 samples in the lowest HIR group and pooled as the low bulk (L bulk). These two pools were then used to perform QTL-seq analysis following the pipeline described by Takagi et al. [4] and Sugihara et al. [42].
To identify single-nucleotide polymorphisms (SNPs) and insertion-deletion variants (indels), the short reads from both bulks were aligned to the BHI306 reference genome. The SNP index was calculated at all identified SNP positions for both the H and L bulks. SNP positions with an index value of less than 0.3 and a read depth of less than seven were excluded from both bulks because they may be spurious SNPs resulting from sequencing and/or alignment errors [4]. The preprocessed reads from each sample were also aligned to the B73 reference genome (PRJNA10769) using the GATK best-practices pipeline to detect SNP and indel variants [69]. The result of single-sequencing and SNP/indel data was used for allelic variation analysis and candidate gene identification.

4.4. Design a Marker for HIR Validation

Two Kompetitive Allele-Specific PCR (KASP) markers were developed from the WEB1 and JAR1a genes identified by QTL-seq analysis and used to analyze marker-trait associations. The WEB1 marker was designed from the SNP position 186384027 on chromosome 2 of the maize genome reference version 2 (V.2), and the JAR1a marker was designed from the SNP position 144700487 on chromosome 8 (V.2) (Table 4). The KASP PCR conditions were set as follows: an initial temperature of 94 °C for 5 min, followed by 10 cycles of 94 °C for 20 s and 61 °C for 60 s (touchdown to 61 °C with a decrease of 0.6 °C per cycle), followed by 27 cycles of 94 °C for 20 s, 55 °C for 30 s, and a rest period of 1 min at 37 °C. After amplification, the fluorescence signals of the final PCR products were read using a QuantStudio 6 Flex Real-Time PCR System (Thermo Fisher Scientific, Waltham, MA, USA) 22. For marker-trait association analysis, genotype data were obtained by genotyping 337 S2 lines (Table S1). Marker-trait association analysis was performed using a simple regression method and the lm() function in R (http://www.r-project.org/).

5. Conclusions

This study evaluated a total of 337 S2 haploid inducers with extremely high and low haploid induction rates (HIRs) using the QTL-seq technique. Candidate intervals associated with HIR were located on chromosomes 2, 3, 6, and 8. Based on the annotation results, 147 single-nucleotide polymorphisms (SNPs)/insertion-deletion polymorphisms (InDels) were retrieved from 58 candidate genes. Of these, 10 missense mutation SNPs exhibited an R² value ranging from 0.27 to 0.72. According to MaizeGDB data, two genes potentially related to HIR were identified: WEB1 (GRMZM2G359746) and JAR1a (GRMZM2G091276). Marker-trait association analysis showed that WEB1 and JAR1a can increase the average HIR in the S2 population. This indicates that these genes may be significantly involved in the HIR trait in maize. In the future, it may be necessary to identify the role of these two genes in haploid induction to better understand their mechanisms and improve HIR in maize maternal haploid inducers.

6. Patents

This section is not mandatory but may be added if there are patents resulting from the work reported in this manuscript.

Supplementary Materials

The following supporting information can be downloaded at the website of this paper posted on Preprints.org, Figure S1: The innate difference between diploid and haploid young seedlings at five days after germination; Table S1: The haploid induction rate of the haploid inducer populations used in the study; Table S2: Whole genome resequencing data of selected haploid inducers with high and low haploid induction rates; Table S3: The sequence of two KASP markers belong to WEB1 and JAR1a genes.

Author Contributions

KK, YC, VR, KS, and AD: conceptualization; KS, AD, KK, and VR: methodology; KK, WA: data analysis and interpretation of result; KK, AD and YC: writing original draft preparation; TL, KS, VR, SW, TT and SA: supervision, review, and editing; SW and VR: funding acquisition. All authors have read and agreed upon the final version of the manuscript.

Funding

The author(s) declare that financial support was received for the research, authorship, and/or publication of this article from the National Science and Technology Development Agency (NSTDA).

Data Availability Statement

The datasets generated and analyzed during the current study are available in the NCBI repository, https://dataview.ncbi.nlm.nih.gov/object/PRJNA1403211 (accessed on 15 January 2026), with the accession number PRJNA1403211.

Acknowledgments

The authors would like to thank the Plant Breeding Research Center for Sustainable Agriculture, Faculty of Agriculture, Khon Kaen University, Thailand, for providing plant materials and research facilities. We also thank the National Science and Technology Development Agency (NSTDA) for providing the scholarship.

Conflicts of Interest

The authors declare that the research was conducted in the absence of any commercial or financial relationships that could be construed as a potential conflict of interest.

Abbreviations

The following abbreviations are used in this manuscript:
DH Double-Haploid
MAS Marker-Assisted Selection
HIR Haploid Induction Rate
QTL Quantitative Trait Loci
SNP Single Nucleotide Polymorphism
MTL MATRILINEAL
ZmPLA1 Zea mays PHOSPHOLIPASE-A1
NLD NOT LIKE DAD
ZmDMP Zea mays DUF679 domain membrane protein
ZmPLD3 Zea mays PHOSPHOLIPASE D3
ZmPOD65 Zea mays Peroxidase65
ROS Reactive Oxygen Species
GWAS Genome-Wide Association
CENH3 Centromeric Histone H3
R1-nj R1-Navajo
WEB1 WEAK CHLOROPLAST MOVEMENT UNDER BLUE LIGHT 1
JAR1a Jasmonate-resistant 1
PS I photosystem I
PS II photosystem II
JA Jasmonic Acid
ACX Acyl-CoA Oxidase
JA-Ile Jasmonoyl-L-Isoleucine
PVE Percentage of Variance

References

  1. Erenstein, O.; Jaleta, M.; Sonder, K.; Mottaleb, K.; Prasanna, B. M. Global maize production, consumption and trade: trends and R&D implications. Food security 2022, 14(5), 1295–1319. [Google Scholar]
  2. Corn, U., Foreign Agricultural Service. 2021.
  3. Sprague, G. The experimental basis for hybrid maize. Biological Reviews 1946, 21(3), 101–120. [Google Scholar] [CrossRef] [PubMed]
  4. Takagi, H.; Abe, A.; Yoshida, K.; Kosugi, S.; Natsume, S.; Mitsuoka, C.; Uemura, A.; Utsushi, H.; Tamiru, M.; Takuno, S. QTL-seq: rapid mapping of quantitative trait loci in rice by whole genome resequencing of DNA from two bulked populations. The Plant Journal 2013, 74(1), 174–183. [Google Scholar] [CrossRef]
  5. Majeed, A.; Johar, P.; Raina, A.; Salgotra, R.; Feng, X.; Bhat, J. A. Harnessing the potential of bulk segregant analysis sequencing and its related approaches in crop breeding. Frontiers in Genetics 2022, 13, 944501. [Google Scholar] [CrossRef]
  6. Park, M.; Lee, J.-H.; Han, K.; Jang, S.; Han, J.; Lim, J.-H.; Jung, J.-W.; Kang, B.-C. A major QTL and candidate genes for capsaicinoid biosynthesis in the pericarp of Capsicum chinense revealed using QTL-seq and RNA-seq. Theoretical and Applied Genetics 2019, 132(2), 515–529. [Google Scholar] [CrossRef]
  7. Zhang, X.; Wang, W.; Guo, N.; Zhang, Y.; Bu, Y.; Zhao, J.; Xing, H. Combining QTL-seq and linkage mapping to fine map a wild soybean allele characteristic of greater plant height. BMC genomics 2018, 19(1), 226. [Google Scholar] [CrossRef] [PubMed]
  8. Pandey, M. K.; Khan, A. W.; Singh, V. K.; Vishwakarma, M. K.; Shasidhar, Y.; Kumar, V.; Garg, V.; Bhat, R. S.; Chitikineni, A.; Janila, P. QTL-seq approach identified genomic regions and diagnostic markers for rust and late leaf spot resistance in groundnut (A rachis hypogaea L.). Plant biotechnology journal 2017, 15(8), 927–941. [Google Scholar] [CrossRef]
  9. Clevenger, J.; Chu, Y.; Chavarro, C.; Botton, S.; Culbreath, A.; Isleib, T. G.; Holbrook, C.; Ozias-Akins, P. Mapping late leaf spot resistance in peanut (Arachis hypogaea) using QTL-seq reveals markers for marker-assisted selection. Frontiers in plant science 2018, 9, 83. [Google Scholar] [CrossRef]
  10. Illa-Berenguer, E.; Van Houten, J.; Huang, Z.; van der Knaap, E. Rapid and reliable identification of tomato fruit weight and locule number loci by QTL-seq. Theoretical and Applied Genetics 2015, 128(7), 1329–1342. [Google Scholar] [CrossRef]
  11. Zhong, Y.; Liu, C.; Qi, X.; Jiao, Y.; Wang, D.; Wang, Y.; Liu, Z.; Chen, C.; Chen, B.; Tian, X. Mutation of ZmDMP enhances haploid induction in maize. Nature plants 2019, 5(6), 575–580. [Google Scholar] [CrossRef]
  12. Abebe, A. M.; Oh, C.-S.; Kim, H. T.; Choi, G.; Seo, E.; Yeam, I.; Lee, J. M. QTL-seq analysis for identification of resistance loci to bacterial canker in tomato. Frontiers in Plant Science 2022, 12, 809959. [Google Scholar] [CrossRef] [PubMed]
  13. Chanda, B.; Bednarek, R.; Wu, S.; Fei, Z.; Ling, K. Resequencing of bottle gourd germplasm and using QTL-Seq to map PRSV-W resistance in bottle gourd (Lagenaria sinceraria) Phytopathology; AMER PHYTOPATHOLOGICAL SOC 3340 PILOT KNOB ROAD: ST PAUL, MN 55121 USA, 2019; pp. pp 156–156. [Google Scholar]
  14. Song, H.; Huang, Y.; Gu, B. QTL-Seq identifies quantitative trait loci of relative electrical conductivity associated with heat tolerance in bottle gourd (Lagenaria siceraria). PloS one 2020, 15(11), e0227663. [Google Scholar] [CrossRef]
  15. Xue, H.; Shi, T.; Wang, F.; Zhou, H.; Yang, J.; Wang, L.; Wang, S.; Su, Y.; Zhang, Z.; Qiao, Y. Interval mapping for red/green skin color in Asian pears using a modified QTL-seq method. Horticulture Research 2017, 4. [Google Scholar]
  16. Hu, T.; Wei, Q.; Wang, J.; Wang, W.; Hu, H.; Yan, Y.; Bao, C. Identification of quantitative trait loci controlling radish root shape using QTL-seq. 2022. [Google Scholar] [CrossRef]
  17. Kadambari, G.; Vemireddy, L. R.; Srividhya, A.; Nagireddy, R.; Jena, S. S.; Gandikota, M.; Patil, S.; Veeraghattapu, R.; Deborah, D.; Reddy, G. E. QTL-Seq-based genetic analysis identifies a major genomic region governing dwarfness in rice (Oryza sativa L.). Plant Cell Reports 2018, 37(4), 677–687. [Google Scholar] [CrossRef] [PubMed]
  18. Lei, L.; Zheng, H.; Bi, Y.; Yang, L.; Liu, H.; Wang, J.; Sun, J.; Zhao, H.; Li, X.; Li, J. Identification of a major QTL and candidate gene analysis of salt tolerance at the bud burst stage in rice (Oryza sativa L.) using QTL-Seq and RNA-Seq. Rice 2020, 13(1), 55. [Google Scholar] [CrossRef]
  19. Nubankoh, P.; Wanchana, S.; Saensuk, C.; Ruanjaichon, V.; Cheabu, S.; Vanavichit, A.; Toojinda, T.; Malumpong, C.; Arikit, S. QTL-seq reveals genomic regions associated with spikelet fertility in response to a high temperature in rice (Oryza sativa L.). Plant cell reports 2020, 39(1), 149–162. [Google Scholar] [CrossRef]
  20. Riangwong, K.; Aesomnuk, W.; Sonsom, Y.; Siangliw, M.; Unartngam, J.; Toojinda, T.; Wanchana, S.; Arikit, S. QTL-seq identifies genomic regions associated with resistance to dirty panicle disease in rice. Agronomy 2023, 13(7), 1905. [Google Scholar] [CrossRef]
  21. Songtoasesakul, D.; Aesomnuk, W.; Pannak, S.; Siangliw, J. L.; Siangliw, M.; Toojinda, T.; Wanchana, S.; Arikit, S. QTL-seq identifies Pokkali-derived QTLs and candidate genes for salt tolerance at seedling stage in Rice (Oryza sativa L.). Agriculture 2023, 13(8), 1596. [Google Scholar] [CrossRef]
  22. Pannak, S.; Wanchana, S.; Aesomnuk, W.; Pitaloka, M. K.; Jamboonsri, W.; Siangliw, M.; Meyers, B. C.; Toojinda, T.; Arikit, S. Functional Bph14 from Rathu Heenati promotes resistance to BPH at the early seedling stage of rice (Oryza sativa L.) as revealed by QTL-seq. Theoretical and Applied Genetics 2023, 136(2), 25. [Google Scholar] [CrossRef]
  23. Branham, S. E.; Patrick Wechter, W.; Lambel, S.; Massey, L.; Ma, M.; Fauve, J.; Farnham, M. W.; Levi, A. QTL-seq and marker development for resistance to Fusarium oxysporum f. sp. niveum race 1 in cultivated watermelon. Molecular Breeding 2018, 38(11), 139. [Google Scholar] [CrossRef]
  24. Cho, Y.; Lee, S.; Park, J.; Kwon, S.; Park, G.; Kim, H.; Park, Y. Identification of a candidate gene controlling semi-dwarfism in watermelon, Citrullus lanatus, using a combination of genetic linkage mapping and QTL-seq. Horticulture, Environment, and Biotechnology 2021, 62(3), 447–459. [Google Scholar] [CrossRef]
  25. Lu, H.; Lin, T.; Klein, J.; Wang, S.; Qi, J.; Zhou, Q.; Sun, J.; Zhang, Z.; Weng, Y.; Huang, S. QTL-seq identifies an early flowering QTL located near Flowering Locus T in cucumber. Theoretical and applied genetics 2014, 127(7), 1491–1499. [Google Scholar] [CrossRef]
  26. Cao, M.; Li, S.; Deng, Q.; Wang, H.; Yang, R. Identification of a major-effect QTL associated with pre-harvest sprouting in cucumber (Cucumis sativus L.) using the QTL-seq method. BMC genomics 2021, 22(1), 249. [Google Scholar] [CrossRef] [PubMed]
  27. Zhang, C.; Badri Anarjan, M.; Win, K. T.; Begum, S.; Lee, S. QTL-seq analysis of powdery mildew resistance in a Korean cucumber inbred line. Theoretical and applied genetics 2021, 134(2), 435–451. [Google Scholar] [CrossRef] [PubMed]
  28. Das, S.; Upadhyaya, H. D.; Bajaj, D.; Kujur, A.; Badoni, S.; Laxmi; Kumar, V.; Tripathi, S.; Gowda, C. L.; Sharma, S. Deploying QTL-seq for rapid delineation of a potential candidate gene underlying major trait-associated QTL in chickpea. DNA research 2015, 22(3), 193–203. [Google Scholar] [CrossRef] [PubMed]
  29. Wang, Z.; Yan, L.; Chen, Y.; Wang, X.; Huai, D.; Kang, Y.; Jiang, H.; Liu, K.; Lei, Y.; Liao, B. Detection of a major QTL and development of KASP markers for seed weight by combining QTL-seq, QTL-mapping and RNA-seq in peanut. Theoretical and applied genetics 2022, 135(5), 1779–1795. [Google Scholar] [CrossRef]
  30. Lv, Z.; Lan, G.; Bai, B.; Yu, P.; Wang, C.; Zhang, H.; Zhong, C.; Zhao, X.; Yu, H. Identification of candidate genes associated with peanut pod length by combined analysis of QTL-seq and RNA-seq. Genomics 2024, 116(3), 110835. [Google Scholar] [CrossRef]
  31. Sheng, C.; Song, S.; Zhou, R.; Li, D.; Gao, Y.; Cui, X.; Tang, X.; Zhang, Y.; Tu, J.; Zhang, X. QTL-seq and transcriptome analysis disclose major QTL and candidate genes controlling leaf size in Sesame (Sesamum indicum L.). Frontiers in Plant Science 2021, 12, 580846. [Google Scholar] [CrossRef]
  32. Chaikam, V.; Molenaar, W.; Melchinger, A. E.; Boddupalli, P. M. Doubled haploid technology for line development in maize: technical advances and prospects. Theoretical and Applied Genetics 2019, 132(12), 3227–3243. [Google Scholar] [CrossRef]
  33. Coe, E., Jr. A line of maize with high haploid frequency. The American Naturalist 1959, 93(873), 381–382. [Google Scholar] [CrossRef]
  34. Rotarenco, V.; Dicu, G.; State, D.; Fuia, S. New inducers of maternal haploids in maize. 2010. [Google Scholar]
  35. Prigge, V.; Xu, X.; Li, L.; Babu, R.; Chen, S.; Atlin, G. N.; Melchinger, A. E. New insights into the genetics of in vivo induction of maternal haploids, the backbone of doubled haploid technology in maize. Genetics 2012, 190(2), 781–793. [Google Scholar] [CrossRef] [PubMed]
  36. Xu, X.; Li, L.; Dong, X.; Jin, W.; Melchinger, A. E.; Chen, S. Gametophytic and zygotic selection leads to segregation distortion through in vivo induction of a maternal haploid in maize. Journal of Experimental Botany 2013, 64(4), 1083–1096. [Google Scholar] [CrossRef] [PubMed]
  37. Li, Y.; Lin, Z.; Yue, Y.; Zhao, H.; Fei, X.; E, L.; Liu, C.; Chen, S.; Lai, J.; Song, W. Loss-of-function alleles of ZmPLD3 cause haploid induction in maize. Nature plants 2021, 7(12), 1579–1588. [Google Scholar] [CrossRef] [PubMed]
  38. Jiang, C.; Sun, J.; Li, R.; Yan, S.; Chen, W.; Guo, L.; Qin, G.; Wang, P.; Luo, C.; Huang, W. A reactive oxygen species burst causes haploid induction in maize. Molecular Plant 2022, 15(6), 943–955. [Google Scholar] [CrossRef]
  39. Trentin, H. U.; Krause, M. D.; Zunjare, R. U.; Almeida, V. C.; Peterlini, E.; Rotarenco, V.; Frei, U. K.; Beavis, W. D.; Lübberstedt, T. Genetic basis of maize maternal haploid induction beyond MATRILINEAL and ZmDMP. Frontiers in Plant Science 2023, 14, 1218042. [Google Scholar] [CrossRef]
  40. Wang, N.; Gent, J. I.; Dawe, R. K. Haploid induction by a maize cenh3 null mutant. Science Advances 2021, 7(4), eabe2299. [Google Scholar] [CrossRef]
  41. Khammona, K.; Dermail, A.; Suriharn, K.; Lübberstedt, T.; Wanchana, S.; Thunnom, B.; Poncheewin, W.; Toojinda, T.; Ruanjaichon, V.; Arikit, S. Accelerating haploid induction rate and haploid validation through marker-assisted selection for qhir1 and qhir8 in maize. Frontiers in Plant Science 2024, 15, 1337463. [Google Scholar] [CrossRef]
  42. Sugihara, Y.; Young, L.; Yaegashi, H.; Natsume, S.; Shea, D. J.; Takagi, H.; Booker, H.; Innan, H.; Terauchi, R.; Abe, A. High-performance pipeline for MutMap and QTL-seq. PeerJ 2022, 10, e13170. [Google Scholar] [CrossRef]
  43. Kodama, Y.; Suetsugu, N.; Kong, S.-G.; Wada, M. Two interacting coiled-coil proteins, WEB1 and PMI2, maintain the chloroplast photorelocation movement velocity in Arabidopsis. Proceedings of the National Academy of Sciences 2010, 107(45), 19591–19596. [Google Scholar] [CrossRef]
  44. Majumdar, A.; Kar, R. K. Chloroplast avoidance movement: a novel paradigm of ROS signalling. Photosynthesis research 2020, 144(1), 109–121. [Google Scholar] [CrossRef] [PubMed]
  45. Krieger-Liszkay, A. Singlet oxygen production in photosynthesis. Journal of experimental botany 2005, 56(411), 337–346. [Google Scholar] [CrossRef] [PubMed]
  46. Krieger-Liszkay, A.; Fufezan, C.; Trebst, A. Singlet oxygen production in photosystem II and related protection mechanism. Photosynthesis research 2008, 98(1), 551–564. [Google Scholar] [CrossRef]
  47. Ruban, A. V.; Johnson, M. P.; Duffy, C. D. The photoprotective molecular switch in the photosystem II antenna. Biochimica et Biophysica Acta (BBA)-Bioenergetics 2012, 1817(1), 167–181. [Google Scholar] [CrossRef] [PubMed]
  48. Foyer, C. H. Reactive oxygen species, oxidative signaling and the regulation of photosynthesis. Environmental and experimental botany 2018, 154, 134–142. [Google Scholar] [CrossRef]
  49. Kozuleva, M. A.; Petrova, A. A.; Mamedov, M. D.; Semenov, A. Y.; Ivanov, B. N. O2 reduction by photosystem I involves phylloquinone under steady-state illumination. FEBS letters 2014, 588(23), 4364–4368. [Google Scholar] [CrossRef]
  50. Pospíšil, P.; Šnyrychová, I.; Kruk, J.; Strzałka, K.; Nauš, J. Evidence that cytochrome b 559 is involved in superoxide production in photosystem II: effect of synthetic short-chain plastoquinones in a cytochrome b 559 tobacco mutant. Biochemical Journal 2006, 397(2), 321–327. [Google Scholar] [CrossRef]
  51. Pospíšil, P. Production of reactive oxygen species by photosystem II as a response to light and temperature stress. Frontiers in plant science 2016, 7, 1950. [Google Scholar] [CrossRef]
  52. Song, S.; Qi, T.; Huang, H.; Xie, D. Regulation of stamen development by coordinated actions of jasmonate, auxin, and gibberellin in Arabidopsis. Molecular Plant 2013, 6(4), 1065–1073. [Google Scholar] [CrossRef]
  53. Katsir, L.; Chung, H. S.; Koo, A. J.; Howe, G. A. Jasmonate signaling: a conserved mechanism of hormone sensing. Current opinion in plant biology 2008, 11(4), 428–435. [Google Scholar] [CrossRef]
  54. Browse, J. Jasmonate passes muster: a receptor and targets for the defense hormone. Annual Review of Plant Biology 2009, 60(1), 183–205. [Google Scholar] [CrossRef] [PubMed]
  55. Fonseca, S.; Chico, J. M.; Solano, R. The jasmonate pathway: the ligand, the receptor and the core signalling module. Current opinion in plant biology 2009, 12(5), 539–547. [Google Scholar] [CrossRef] [PubMed]
  56. Shan, X.; Zhang, Y.; Peng, W.; Wang, Z.; Xie, D. Molecular mechanism for jasmonate-induction of anthocyanin accumulation in Arabidopsis. Journal of experimental botany 2009, 60(13), 3849–3860. [Google Scholar] [CrossRef]
  57. Song, S.; Qi, T.; Huang, H.; Ren, Q.; Wu, D.; Chang, C.; Peng, W.; Liu, Y.; Peng, J.; Xie, D. The jasmonate-ZIM domain proteins interact with the R2R3-MYB transcription factors MYB21 and MYB24 to affect jasmonate-regulated stamen development in Arabidopsis. The Plant Cell 2011, 23(3), 1000–1013. [Google Scholar] [CrossRef]
  58. Lee, H. Y.; Seo, J.-S.; Cho, J. H.; Jung, H.; Kim, J.-K.; Lee, J. S.; Rhee, S.; Do Choi, Y. Oryza sativa COI homologues restore jasmonate signal transduction in Arabidopsis coi1-1 mutants. PloS one 2013, 8(1), e52802. [Google Scholar] [CrossRef]
  59. McConn, M.; Browse, J. The critical requirement for linolenic acid is pollen development, not photosynthesis, in an Arabidopsis mutant. The Plant Cell 1996, 8(3), 403–416. [Google Scholar] [CrossRef]
  60. Schilmiller, A. L.; Koo, A. J.; Howe, G. A. Functional diversification of acyl-coenzyme A oxidases in jasmonic acid biosynthesis and action. Plant Physiology 2007, 143(2), 812–824. [Google Scholar] [CrossRef]
  61. Caldelari, D.; Wang, G.; Farmer, E. E.; Dong, X. Arabidopsis lox3 lox4 double mutants are male sterile and defective in global proliferative arrest. Plant molecular biology 2011, 75(1), 25–33. [Google Scholar] [CrossRef] [PubMed]
  62. Cyprys, P.; Lindemeier, M.; Sprunck, S. Gamete fusion is facilitated by two sperm cell-expressed DUF679 membrane proteins. Nature plants 2019, 5(3), 253–257. [Google Scholar] [CrossRef] [PubMed]
  63. Zhang, X.; Zhang, L.; Zhang, J.; Jia, M.; Cao, L.; Yu, J.; Zhao, D. Haploid induction in allotetraploid tobacco using DMPs mutation. Planta 2022, 255(5), 98. [Google Scholar] [CrossRef]
  64. Gilles, L. M.; Khaled, A.; Laffaire, J. B.; Chaignon, S.; Gendrot, G.; Laplaige, J.; Bergès, H.; Beydon, G.; Bayle, V.; Barret, P. Loss of pollen-specific phospholipase NOT LIKE DAD triggers gynogenesis in maize. The EMBO journal 2017, 36(6), 707–717. [Google Scholar] [CrossRef]
  65. Kelliher, T.; Starr, D.; Richbourg, L.; Chintamanani, S.; Delzer, B.; Nuccio, M. L.; Green, J.; Chen, Z.; McCuiston, J.; Wang, W. MATRILINEAL, a sperm-specific phospholipase, triggers maize haploid induction. Nature 2017, 542(7639), 105–109. [Google Scholar] [CrossRef] [PubMed]
  66. Liu, C.; Li, X.; Meng, D.; Zhong, Y.; Chen, C.; Dong, X.; Xu, X.; Chen, B.; Li, W.; Li, L. A 4-bp insertion at ZmPLA1 encoding a putative phospholipase A generates haploid induction in maize. Molecular plant 2017, 10(3), 520–522. [Google Scholar] [CrossRef] [PubMed]
  67. Xin, G.-y.; Li, L.-p.; Wang, P.-t.; Li, X.-y.; Han, Y.-j.; Zhao, X. The action of enhancing weak light capture via phototropic growth and chloroplast movement in plants. Stress Biology 2022, 2(1), 50. [Google Scholar] [CrossRef]
  68. Dermail, A.; Lübberstedt, T.; Suwarno, W. B.; Chankaew, S.; Lertrat, K.; Ruanjaichon, V.; Suriharn, K. Combining ability of tropical× temperate maize inducers for haploid induction rate, R1-nj seed set, and agronomic traits. Frontiers in Plant Science 2023, 14, 1154905. [Google Scholar] [CrossRef]
  69. Van der Auwera, G. A.; Carneiro, M. O.; Hartl, C.; Poplin, R.; Del Angel, G.; Levy-Moonshine, A.; Jordan, T.; Shakir, K.; Roazen, D.; Thibault, J. From FastQ data to high-confidence variant calls: the genome analysis toolkit best practices pipeline. Current protocols in bioinformatics 2013, 43(1), 11.10. 1–11.10. 33. [Google Scholar] [CrossRef]
Table 1. Statistical analysis of sample sequencing data evaluation.
Sample Cleaned reads (million) Cleaned base (Gb) % Alignment Average depth coverage (x)
BHI306 186.83 27.52 89.29 12.28
K8 140.32 20.68 87.58 9.39
Highest HIR bulk 1521.00 229.00 99.95 107.00
Lowest HIR bulk 1415.00 212.00 99.98 99.37
Table 2. Statistical analysis of SNP detection and annotation results.
Length (bp) All variants (read depths > 7)
SNPs InDels
301,354,135 10,615 4,200
237,068,873 11,149 4,100
232,140,174 16,807 6,170
241,473,504 10,476 3,692
217,872,852 6,239 2,722
169,174,353 9,796 3,510
176,764,762 5,623 1,663
175,793,759 8,146 3,273
156,750,706 7,519 2,632
150,189,435 4,256 1,633
2,058,582,553 90,626 33,595
Table 3. Summary of the genomic region associated with the HIR in maize.
QTL Chr. QTL-region Mb Confidence interval (99%) Δ(SNP index) No. of SNP/InDel R2>0.3 No. of genes Candidate genes
qHI2 2 170263374 - 210388889 40.12 0.31 0.39 1,777 69 28 GRMZM2G140156_RID-transcription factor 2, GRMZM2G359746_WEB1 gene_WEAK CHLOROPLAST MOVEMENT UNDER BLUE LIGHT 1
qHI3 3 213006045 - 223082649 10.08 0.32 0.40 1,254 35 15 GRMZM2G440943_Helicase/SANT-associated DNA binding protein, AC198725.4_FG009_WRKY DNA-binding protein 28
qHI6 6 130180223 - 145992397 15.81 0.31 0.35 473 2 - -
qHI8 8 120056063 - 159995947 38.94 0.31 0.38 1,720 41 15 GRMZM2G091276_JAR1a_Jasmonate-resistant 1, GRMZM2G134738_Cytochrome c oxidase subunit 5b-3 mitochondrial (ZmCOX5b-3)
Table 4. Candidate SNPs of each chromosome region.
SNP position (V.2) Chromosome R2 P-value N Gene Variation Mutation Exon Amino acid change
186384027 2 0.58 1.04E-09 42 GRMZM2G359746 T/C missense 2 R->Q
186384242 2 0.28 1.31E-04 42 GRMZM2G359746 T/G missense 2 Q->H
186384636 2 0.43 5.14E-07 43 GRMZM2G359746 T/G missense 2 D->A
217212966 3 0.34 1.37E-05 43 AC198725.4 T/G missense 3 D->P
217212967 3 0.34 1.37E-05 43 AC198725.4 C/G missense 3 D->P
217214782 3 0.27 1.31E-04 44 AC198725.4 T/G missense 1 T->P
144700162 8 0.27 1.57E-04 43 GRMZM2G091276 C/T missense 5 G->E
144700252 8 0.31 6.44E-05 41 GRMZM2G091276 C/T missense 5 G->D
144700393 8 0.5 2.98E-08 44 GRMZM2G091276 C/T missense 5 R->H
144700487 8 0.72 3.47E-13 41 GRMZM2G091276 G/C missense 5 G->R
Table 5. Marker-trait association analysis of the two KASPs.
Marker Range of HIR Average SNP n R2 P-value PVE
WEB1_2_186384027 1.39-23.01 11.96 T/T 309 0.08 4.39E-07 8
0-19.3 10.36 T/C
0.95-16.42 8.19 C/C
JAR1a_8_ 144700487 4.6-22.32 11.67 G/G 331 0.03 1.82E-03 3
0-23.36 10.02 G/C
0.95-20.65 9.02 C/C
Disclaimer/Publisher’s Note: The statements, opinions and data contained in all publications are solely those of the individual author(s) and contributor(s) and not of MDPI and/or the editor(s). MDPI and/or the editor(s) disclaim responsibility for any injury to people or property resulting from any ideas, methods, instructions or products referred to in the content.
Copyright: This open access article is published under a Creative Commons CC BY 4.0 license, which permit the free download, distribution, and reuse, provided that the author and preprint are cited in any reuse.
Prerpints.org logo

Preprints.org is a free preprint server supported by MDPI in Basel, Switzerland.

Subscribe

Disclaimer

Terms of Use

Privacy Policy

Privacy Settings

© 2026 MDPI (Basel, Switzerland) unless otherwise stated