
Submitted:
28 January 2026
Posted:
28 January 2026
You are already at the latest version
Abstract
Research on biomarkers reflecting tumor biology and systemic metabolism is crucial for improving the accuracy and personalization of breast cancer (BC) prognosis. We investigated circulating dodecanoic acid in 229 patients undergoing radiotherapy (RT) and assessed its association with progression-free survival and overall survival over six years. Patients were classified into two phenotypes based on post-RT changes in dodecanoic acid: The Increase Phenotype (IP) had lower baseline concentrations and showed a post-RT rise, whereas the Decrease Phenotype (DP) had higher pre-RT levels and declined after treatment. Dodecanoic acid levels were lower in tumors than in peritumoral samples, and their association with phenotypes varied by sampling region, suggesting that systemic changes reflect broader metabolic adaptations rather than local tissue concentrations. Post-RT increases in dodecanoic acid were associated with higher paraoxonase-1 activity, suggesting a link with antioxidant status. Patients in the IP group had a significantly lower risk of progression than those in the DP group, whereas no significant differences in overall survival were observed. These findings highlight the potential utility of dodecanoic acid measurement as a prognostic biomarker and suggest that modulating fatty acid metabolism could be explored as a therapeutic strategy.
Keywords:
biomarkers
; breast cancer
; dodecanoic acid
; metabolism
; radiotherapy
1. Introduction
Breast cancer (BC) remains the most diagnosed solid tumor in women and a leading cause of cancer-related mortality worldwide. According to the GLOBOCAN, BC accounted in 2022 for approximately 2.3 million new cases, representing 11.6% of all cancer diagnoses, and close to 666,000 deaths [1]. Recent projections from the International Agency for Research on Cancer indicate that the global burden of this disease is expected to rise substantially in the coming decades, with estimates suggesting that annual cases could reach around 3.2 million, and deaths approximately 1.1 million by 2050 if current trends persist [2]. These forecasts underscore the growing epidemiological weight of BC and highlight the need for improved prevention, early detection, and therapeutic strategies.
The marked heterogeneity of BC continues to demand individualized therapeutic strategies that consider not only patient-specific factors but also tumor stage, molecular subtype, and other indicators of aggressiveness [3]. Current clinical management routinely involves surgery, radiotherapy (RT), chemotherapy, targeted therapies, and endocrine treatments. Neoadjuvant strategies are increasingly employed before surgery to downstage tumors and provide insight into treatment responsiveness, thereby informing subsequent therapeutic decisions [4,5]. Collectively, these interventions aim to eliminate malignant cells, halt disease progression, and improve both survival outcomes and quality of life [6]. This wide heterogeneity in tumor characteristics and treatment responses underscores the need to identify approaches that can better personalize therapy and accurately estimate patient prognosis.
Recent studies have highlighted the pivotal role of metabolism in tumor development and therapeutic response [7,8]. Cancer cells reprogram their metabolic pathways to extract essential substrates even from nutrient-poor environments, thereby supporting their growth, survival, and adaptability [9]. These metabolic adaptations not only influence how tumors respond to therapy but also give rise to distinctive phenotypes that may serve as valuable biomarkers for diagnosis, treatment monitoring, and patient stratification, ultimately enabling more precise and personalized cancer care [10]. In this regard, preliminary studies from our research group suggested that plasma levels of dodecanoic acid could be associated with BC outcomes [11]. This compound, a medium-chain saturated fatty acid (also known as lauric acid), is considered potentially beneficial, as several studies have demonstrated its ability to promote apoptosis and suppress the expression of oncogenic microRNAs in cultured cancer cells [12,13,14]. Moreover, both pharmacological and dietary administration of dodecanoic acid have shown promising results in cancer treatment [15,16,17].
Motivated by these findings, the present study aimed to explore the potential of dodecanoic acid as a prognostic biomarker in BC patients and to investigate its association with long-term clinical outcomes over a 6-year follow-up period.
2. Materials and Methods
2.1. Study Population and Clinical Design
This prospective study enrolled 229 women diagnosed with invasive BC and treated with curative intent between 2014 and 2022. The median follow-up was 6 years (2-7 years), with some patients reaching 8 years. Patients followed different therapeutic pathways before RT, receiving either surgery or chemotherapy as the initial treatment, based on clinical and molecular characteristics. Eligible participants were ≥18 years of age with histologically confirmed invasive carcinoma. Exclusion criteria included a history of previous oncological disease or Paget’s disease of the nipple. Additionally, individuals with connective tissue or autoimmune disorders (e.g., systemic lupus erythematosus, scleroderma), pregnancy or lactation, severe psychiatric illness, or active infection (including SARS-CoV-2 positivity during the study period) were excluded.
RT was administered to all patients and consisted of hypofractionated whole-breast or chest-wall irradiation (40 Gy in 15 fractions over 3 weeks, 2.67 Gy per fraction). Regional nodal irradiation was added when indicated. A sequential or simultaneous boost to the tumor bed was delivered as needed. Adjuvant chemotherapy and/or hormonal therapy were then given based on tumor molecular subtype, stage, and individual clinical risk.
Progression-free survival (PFS) and overall survival (OS) were evaluated. PFS was defined as the time from study entry to disease progression, including local or regional recurrence, distant metastasis, or death from any cause, whichever occurred first. OS was defined as the time from study entry to death from any cause.
Peripheral blood samples were collected immediately before RT (pre-RT) and again one month after RT completion (post-RT). Each patient’s paired samples were processed under identical conditions for intra-individual comparisons.
Baseline plasma dodecanoic acid levels showed marked inter-individual variability. This heterogeneity motivated exploratory analyses to evaluate whether pre-RT dodecanoic acid concentrations were associated with tumor characteristics. Patients were stratified into Low and High pre-RT groups based on baseline plasma dodecanoic acid levels. The median value of the cohort was used as the cut-off for group assignment. Moreover, plasma dodecanoic acid concentrations exhibited variable responses to RT, increasing in some patients and decreasing in others. Based on these patterns, participants were classified into two groups: the Increase Phenotype (IP), including individuals whose plasma dodecanoic acid levels rose after RT (positive delta: Δ = post-RT – pre-RT > 0), and the Decrease Phenotype (DP), including those whose levels declined after RT (negative delta: Δ = post-RT – pre-RT < 0).
Participants provided written informed consent in line with the ethical guidelines of the 1975 Declaration of Helsinki. The study was approved by the Institutional Review Board (project code: 14/2017) of the Institut d’Investigació Sanitària Pere Virgili. Written informed consent was obtained.
2.2. Sample Collection and Processing
Peripheral blood samples were collected to obtain both whole blood and serum for routine laboratory analyses, as well as additional serum and plasma aliquots for the determination of dodecanoic acid levels, oxidative stress, and inflammatory markers. Samples designated for routine analyses were processed immediately, whereas the additional serum and plasma aliquots were stored at –80°C in our Biobank until batched analyses. Additionally, paired fresh tumor and peritumoral biopsies were obtained in a small subgroup of 11 patients immediately after surgical excision, and were also stored at –80°C until analytical processing. The sample size for this subgroup was limited because obtaining additional fresh tissue was not feasible due to logistical constraints.
2.3. Dodecanoic Acid Measurement
Dodecanoic acid concentrations in plasma and tissue samples were analyzed by chromatographic separation and mass spectrometry.
For plasma samples, protein precipitation was achieved by adding four volumes of methanol containing deuterated myristic acid-d27 (internal standard) to 50 µL of serum. Myristic acid-d27 was used for dodecanoic acid quantification because of its structural similarity to a saturated medium-chain fatty acid and its comparable chromatographic and ionization behavior. Samples were vortexed, incubated at −20 °C for 30 min, and centrifuged at 15,000 rpm at 4 °C. The resulting supernatants were evaporated to dryness and reconstituted in 50 µL of methanol before analysis. Ultra-high-performance liquid chromatography coupled to quadrupole time-of-flight mass spectrometry (UHPLC–qTOF, model 6550, Agilent Technologies, Santa Clara, CA, USA) was used in negative electrospray ionization mode. Chromatographic separation was achieved using a C18 column (ACQUITY UPLC BEH C18, 1.7 µm, 2.1 × 100 mm) and a water–acetonitrile gradient containing 0.05% formic acid. Dodecanoic acid identification was confirmed based on accurate mass, retention time, and tandem mass spectra matched to the Agilent METLIN-PCDL database (>40,000 compounds), and further validated by comparison with pure analytical standards.
For tissue samples, freshly obtained tumor and peritumoral biopsies were homogenized in methanol:water (8:2, v/v) containing an internal standard using stainless steel beads in a bullet blender. Supernatants were centrifuged (15,000 rpm, 4 °C, 5 min), evaporated at 45 °C, reconstituted in methoxyamine, and incubated for 90 min at 37 °C. Samples were subsequently silylated with N-methyl-N-(trimethylsilyl) trifluoroacetamide containing 1% trimethylchlorosilane for 60 min at room temperature. Gas chromatography coupled to electron ionization and qTOF detection (GC–EI–qTOF, Agilent 7890A coupled to 7200 QTOF) was performed under standard conditions, using helium as the carrier gas (1.1 mL/min). The oven temperature was programmed from 60 °C to 320 °C, and data were acquired in full-scan mode (m/z 50–600).
Dodecanoic acid was identified using analytical standards and quantified in relative units (RU), defined as the ratio of the analyte peak area to the internal standard peak area multiplied by 1,000, providing a standardized relative measure of compound abundance.
2.4. Additional Biomarker and Routine Laboratory Assessments
Plasma levels of interferon-γ (IFN-γ) and serum concentrations of the antioxidant enzyme paraoxonase-1 (PON1) were measured using ELISA kits from Elabscience® (Houston, Texas, USA). Serum PON1 activity was assessed by monitoring the hydrolysis rate of phenylacetate at 270 nm in a 9 mM Tris-HCl buffer (pH 8.0) containing 0.9 mM CaCl₂, as previously described [18]. Plasma concentrations of chemokine (C-C motif) ligand 2 (CCL2) were quantified using ABTS ELISA Development kits (Peprotech, London, UK). Routine clinical parameters, including serum glucose, lipid profile, hepatic enzymes, C-reactive protein, carcinoembryonic antigen (CEA), and cancer antigen 15-3 (CA 15.3), were determined with a COBAS® 8000 automated analyzer (Roche Diagnostics, Basel, Switzerland). Complete blood counts were obtained using a Sysmex XN-1000 automated hematology analyzer (Sysmex, Kobe, Japan).
2.5. Statistical Analyses
All statistical analyses were conducted in R (version 4.5.0). Continuous variables are presented as medians and interquartile ranges (IQR, in parentheses). Paired comparisons between pre-RT and post-RT measurements were performed using the Wilcoxon signed-rank test. Between-group comparisons were assessed with the Mann–Whitney U test. Median differences were estimated using the Hodges–Lehmann estimator with corresponding 95% confidence intervals. Spearman’s correlation was used to assess relationships between continuous variables. Associations between Δ-dodecanoic acid (post minus pre-RT) and laboratory or immune markers were evaluated using single linear regression and Spearman correlation analyses. Building on these association tests, baseline biochemical and immune variables were then examined for their capacity to discriminate between metabolic phenotypes. To this end, a LASSO-penalized logistic regression model was fitted using glmnet with cross-validation. Discriminative performance was assessed using receiver operating characteristic (ROC) curves and the area under the curve (AUC).
Cox proportional hazards models were used to evaluate PFS and OS. Hazard ratios (HR) and 95% confidence intervals (CI) were estimated. Multivariable models were adjusted for age. All visualizations, including boxplots, scatterplots, heatmaps, forest plots, and ROC curves, were generated using ggplot2, gridExtra, and pROC. All statistical tests were two-sided.
3. Results
3.1. Demographic, Clinical, and Tumor Characteristics of the Studied Population
The study cohort had a median age of 55 years and was predominantly postmenopausal. Baseline clinical characteristics and comorbidities were well balanced and are summarized in Table 1.
Most tumors were ductal carcinomas and were diagnosed at early clinical stages (T1-T2), with no nodal involvement and no distant metastases. Histological grade II-III predominated. According to molecular classification, Luminal A and B were the most common subtypes, whereas HER2-positive and triple-negative tumors were less common.
All patients underwent surgical treatment, followed by RT with curative intent. Neoadjuvant chemotherapy was administered in 23.6% of cases, whereas 26.2% of patients received adjuvant chemotherapy. Adjuvant hormone therapy was prescribed in 62.0% of patients, in accordance with hormone receptor status.
During follow-up, disease recurrence was observed in 19 patients (8.3%), including local, regional nodal, and distant metastatic recurrence (6.6%). Among patients with distant recurrence, metastatic sites included bones (n = 7), lung (n = 2), liver (n = 1), and brain (n = 1), with several patients presenting metastases in more than one anatomical location (n = 7). In addition, 15 patients (6.6%) died during the follow-up period.
3.2. Dodecanoic Acid Dynamics Pre- and Post- RT
To investigate whether baseline plasma dodecanoic acid levels were associated with tumor characteristics prior to RT, patients were stratified into Low and High pre-RT groups, with their clinical and tumor features summarized in Table 2. Apart from the expected differences in dodecanoic acid concentrations, no significant differences in baseline clinical or tumor characteristics were observed between the two groups.
Circulating dodecanoic acid concentrations exhibited substantial inter-individual variability. Among 229 patients, 119 (52.0%) showed a post-RT decline in dodecanoic acid levels (Decrease Phenotype, DP), whereas 110 (48.0%) showed a post-RT increase (Increase Phenotype, IP) (Figure 1A).
Before RT, patients in the DP group had significantly higher plasma dodecanoic acid levels than those in the IP group. After RT, this pattern reversed, with higher post-RT concentrations observed in the IP group. As a result, the net change (Δ-dodecanoic acid) was negative in the DP group and positive in the IP group, confirming a robust divergence between the two metabolic trajectories (Figure 1B–C).
Baseline dodecanoic acid levels were strongly associated with both the magnitude and direction of the post-RT change: patients with lower pre-RT levels tended to exhibit greater increases after treatment, whereas those with higher baseline values frequently showed a decline (Figure 1D).
Most demographic and clinical variables were comparable between phenotypes. Tumor size did not differ significantly between groups; however, a trend was observed across clinical T stages, with the proportion of patients classified as the IP increasing from early (T0–T1) to intermediate stages (T2–T3), while the DP predominated in T0 and T4 tumors (Figure 1E, Supplementary Table 1). No significant differences were observed in molecular subtype, histological grade, or hormone receptor status.
Together, these findings indicate that RT induces patient-specific metabolic shifts in dodecanoic acid, with the direction of the response being strongly influenced by baseline metabolic status and, to a lesser extent, by tumor burden, as discussed further below.
3.3. Immune-Metabolic Correlations and Predictive Modeling
We compared pre-RT biochemical and immune markers between groups to assess whether the metabolic phenotypes (IP vs DP) were associated with baseline characteristics. As shown in Supplementary Table 2, none of the baseline variables reached statistical significance after FDR correction. CEA showed nominal significance in the unadjusted analysis, but this did not persist after multiple testing corrections. All other biochemical and immune parameters, including PON1 concentration, PON1 activity, IFN-γ, and CCL2, were similar between the IP and DP phenotypes, indicating that these phenotypes were not defined by pre-RT systemic profiles.
Because individual markers failed to discriminate between phenotypes, we next explored whether coordinated immune-metabolic patterns might reveal subtle baseline differences. Correlation matrices constructed separately for each phenotype (Figure 2A) revealed largely similar network structures. No phenotype-specific modules or coordinated signatures were identified, and only minor, isolated variations in pairwise correlations were observed. These results suggest that the pre-RT immune-metabolic architecture does not determine which patients will subsequently exhibit the IP or DP phenotype.
To further assess baseline multidimensional differences, we applied LASSO-penalized logistic regression that incorporated all pre-RT biochemical and immune markers. Only two predictors (PON1 activity and leukocyte count) were retained with non-zero coefficients (Supplementary Table 3). Even with this sparse model, discriminatory performance was negligible (ROC AUC = 0.66; Figure 2B), consistent with the lack of meaningful baseline differences in the univariate analyses.
Having confirmed that the metabolic phenotypes were not distinguishable prior to RT, we examined post-treatment immune-metabolic associations. Among all post-RT markers, only PON1 activity showed a significant relationship with Δ-dodecanoic acid (Supplementary Table 4), with higher post-RT PON1 activity associated with greater increases in circulating dodecanoic acid (Figure 2C). Furthermore, PON1 activity was significantly elevated in the IP group compared with the DP group, highlighting its role as the principal immune-metabolic feature associated with the post-RT metabolic response.
3.4. Tissue Dodecanoic Acid and Plasma–Tissue Relationships
To explore whether systemic dodecanoic acid dynamics reflect local changes in the tumor microenvironment, we measured its levels in a small set of paired tumor and peritumoral biopsies. Dodecanoic acid levels were higher in peritumoral tissue than in tumor tissue, indicating relative depletion within the tumor core (Figure 3A). We summarized this gradient for each patient by calculating a peritumoral-to-tumoral ratio based on the spatial analysis. This ratio could be evaluated only in the subset of patients with both tissue compartments and a matched plasma phenotype available. No significant differences were observed between phenotypes, although the analysis was limited by the small sample size (Figure 3B).
Correlation analyses revealed contrasting relationships between tissue and plasma dodecanoic acid: peritumoral tissue levels correlated negatively with plasma Δ-dodecanoic acid, whereas tumor tissue levels correlated positively (Figure 3C–D). These patterns suggest that systemic changes are not directly reflected in tissue concentrations and that the relationship differs between the tumor core and surrounding tissue.
3.5. Survival Analyses According to Dodecanoic Acid Phenotype
To investigate the potential prognostic significance of systemic dodecanoic acid modulation after RT, we analyzed PFS and OS according to plasma phenotype. Kaplan–Meier analysis revealed no significant differences in OS between dodecanoic acid phenotypes. However, patients with increased dodecanoic acid levels after RT showed a significantly improved PFS compared with those in the DP group (long-rank p = 0.043; Figure 4A-B).
4. Discussion
The most relevant finding of this prospective study is the identification of two distinct systemic metabolic phenotypes based on post-RT changes in circulating dodecanoic acid (IP and DP), and the observation that patients in the IP group exhibited improved PFS at 6 years of follow-up.
A possible interpretation of the post-RT increase in circulating dodecanoic acid is that it may reflect a favorable systemic metabolic adaptation. Patients in the IP group had lower pre-RT dodecanoic acid levels, suggesting efficient mitochondrial β-oxidation and greater metabolic flexibility [19,20]. Following RT, tumor cell damage may likely reduce dodecanoic acid consumption, leading to higher circulating levels in these patients [6,9]. This increase may represent a combination of reduced tumor demand, restored systemic metabolic homeostasis, and improved antioxidant and inflammatory balance, as suggested by higher PON1 activity [21,22]. In contrast, patients in the DP group had higher pre-RT dodecanoic acid, possibly reflecting impaired mitochondrial utilization or metabolic inflexibility [23]. After RT, these patients may experience further metabolic stress or a diversion of fatty acids toward inflammatory pathways, leading to decreased circulating dodecanoic acid and a less favorable prognosis.
The divergence between plasma and tissue dodecanoic acid provides further insight into systemic metabolic adaptations. Tumor tissue exhibited lower concentrations than peritumoral tissue, and tissue measurements showed distinct correlation patterns with plasma Δ-dodecanoic acid. If systemic changes simply mirrored local tumor concentrations, plasma levels would be expected to correlate uniformly with tumor tissue. Instead, the differential associations indicate that circulating dodecanoic acid dynamics are influenced by broader systemic processes, rather than solely by local tumor uptake. Lower tumor tissue levels likely reflect basal consumption by cancer cells to support growth and survival, as previously reported [23,24,25]. Importantly, higher post-RT circulating levels may enhance systemic availability of dodecanoic acid, which has documented anticancer effects, including induction of apoptosis and sensitization of tumor cells to ferroptosis [26].
Integrating these observations with the phenotypic patterns, IP patients appear to have a systemic metabolic profile that recovers more effectively after treatment. This combination of efficient systemic recovery and increased circulating dodecanoic acid may help limit tumor persistence and contribute to the reduced recurrence risk observed in the IP group [27]. Monitoring post-RT dynamics of dodecanoic acid could therefore provide insight into both systemic metabolic recovery and tumor vulnerability, offering a novel perspective on prognostic biomarkers in BC.
Beyond mechanistic insights, our findings have potential clinical relevance. We observed that post-RT increases in circulating dodecanoic acid are associated with lower progression risk. This indicates that plasma dodecanoic acid may serve as a novel prognostic biomarker. It could complement established clinicopathological parameters, such as tumor size, stage, and molecular subtype. Assessing dodecanoic acid dynamics after RT may help stratify patients by progression risk. This can support closer monitoring of those with unfavorable profiles and potentially inform post-treatment surveillance or adjuvant therapeutic decisions. Moreover, as dodecanoic acid has demonstrated antitumor effects in preclinical models [12,13,14], these results raise the possibility that therapeutic strategies aimed at modulating systemic fatty acid levels through diet or supplementation could be explored as an adjunct to conventional treatment. Overall, our study highlights the importance of integrating metabolic biomarkers into clinical decision-making, opening avenues for more personalized BC care.
5. Strengths and Limitations
Strengths of our study include its prospective design, long-term follow-up of up to six years, and comprehensive integration of metabolomic, immunologic, and clinical data. By combining systemic metabolic profiling with standard clinicopathological assessments, our findings provide a robust framework for developing more personalized prognostic tools and may help inform tailored therapeutic strategies.
Despite these strengths, several limitations should be acknowledged. The study was conducted at a single center, and the sample size for paired tissue analyses was small, limiting statistical power to detect correlations between plasma and tissue dodecanoic acid. In addition, although analyses were adjusted for pre-RT treatment modalities, residual confounding related to the heterogeneous metabolic effects of chemotherapy, targeted therapies, or surgery cannot be fully excluded. Validation in independent, larger cohorts is therefore necessary to confirm the prognostic value of dodecanoic acid phenotypes and further elucidate the underlying biological mechanisms.
6. Conclusions
Post-RT increases in circulating dodecanoic acid were associated with a reduced progression risk in patients with BC. Inter-individual variability in baseline dodecanoic acid levels was linked to distinct metabolic responses to RT, supporting the potential prognostic relevance of this metabolite. Future studies are warranted to validate these findings in independent cohorts, elucidate the mechanistic links between systemic metabolism and tumor biology, and explore whether modulation of dodecanoic acid-related pathways may improve treatment outcomes.
Supplementary Materials
The following supporting information can be downloaded at the website of
this paper posted on Preprints.org, Table S1: Clinical and tumor characteristics of breast cancer patients according to dodecanoic acid response to radiotherapy; Table S2: Pre-radiotherapy biochemical and immune markers according to dodecanoic acid response phenotype; Table S3: Coefficients from the LASSO-penalized logistic regression model (pre-radiotherapy variables); Table S4: Association between biochemical and immune markers and Δ-dodecanoic acid (post-pre) measured post-radiotherapy.
Author Contributions
Conceptualization, A.J.F., J.C. and M.A.; methodology, A.J.F.; software, A.J.F. and V.C.C.; validation, J.C. and M.A.; formal analysis, A.J.F.; investigation, A.J.F., V.C.C., R.G.P., M.C.C., R.B.V., X.G.B., and I.F.G.; resources, J.J. and M.A.; data curation, A.J.F.; writing—original draft preparation, A.J.F.; writing—review and editing, J.C. and M.A.; visualization, J.C.; supervision, J.C., J.J. and M.A.; project administration, J.C.; funding acquisition, J.J. and M.A. All authors have read and agreed to the published version of the manuscript.
Funding
This study has been funded by the FUNDACIÓN CIENTÍFICA DE LA ASOCIACIÓN ESPAÑOLA CONTRA EL CÁNCER (Madrid, Spain) under the grant “CLJUN235174GARC”, the FUNDACIÓ ONCOLÒGICA DR. AMADEU PELEGRÍ “AODAP/2023” (Salou, Spain), and the INSTITUTO DE SALUD CARLOS III (Madrid, Spain) through the project “PI22/00770”. A.J.F.is the recipient of a AGAUR-FI grant Joan Oró program from the DEPARTMENT OF RESEARCH AND UNIVERSITIES OF THE GENERALITAT DE CATALUNYA (2023 FI-3-00065).
Institutional Review Board Statement
The study was conducted in accordance with the Declaration of Helsinki, and approved by the Institutional Review Board (or Ethics Committee) of INSTITUT D’INVESTIGACIÓ SANITÀRIA PERE VIRGILI (project code: 14/2017).
Informed Consent Statement
Informed consent was obtained from all subjects involved in the study.
Data Availability Statement
The raw data supporting the conclusions of this article will be made available by the authors on request.
Acknowledgments
The authors thank Anna Gimenez-Huguet and Blanca Llorens-Ladera for their technical assistance. During the preparation of this work, the authors utilized CHAT GPT 5.0 (developed by OpenAI, San Francisco, CA, USA) to assist in improving the grammar, syntax, and clarity of the text and Grammarly (from Grammarly Inc., San Francisco, CA, USA) for orthographic corrections. After using these tools, the authors reviewed and edited the content as needed and took full responsibility for the content of the published article. The content, ideas, and scientific conclusions presented in this manuscript are solely the authors’ work and have not been generated by AI. The AI tools were utilized exclusively to enhance the readability and presentation of the text.
Conflicts of Interest
The authors declare no conflicts of interest. The funders had no role in the design of the study; in the collection, analyses, or interpretation of data; in the writing of the manuscript; or in the decision to publish the results.
Abbreviations
The following abbreviations are used in this manuscript:
| AUC | Area under the curve |
| BC | Breast cancer |
| CA 15.3 | Cancer antigen 15.3 |
| CCL2 | Chemokine (C-C motif) ligand 2 |
| CEA | Carcinoembryogenic antigen |
| CRP | C-reactive protein |
| DP | Decrease phenotype |
| FDR | False discovery rate |
| HDL | High-density lipoprotein |
| HR | Hazard ratio |
| IFN-γ | Interferon-γ |
| IP | Increase phenotype |
| IQR | Interquartile range |
| LDL | low-density lipoprotein |
| OR | Odds ratio |
| OS | Overall survival |
| PFS | Progression-free survival |
| PON1 | Paraoxonase-1 |
| qTOF | Quadrupole time-of-flight |
| ROC | Receiver operating characteristic |
| RT | Radiotherapy |
| SD | Standard deviation |
| UHPLC | Ultra-high-performance liquid chromatography |
| VLDL | Very-low-density lipoprotein |
References
- Bray, F.; Laversanne, M.; Sung, H.; Ferlay, J.; Siegel, R.L.; Soerjomataram, I.; Jemal, A. Global cancer statistics 2022: GLOBOCAN estimates of incidence and mortality worldwide for 36 cancers in 185 countries. CA Cancer J. Clin. 2024, 74, 229–263. [Google Scholar] [CrossRef] [PubMed]
- Kim, J.; Harper, A.; McCormack, V.; Sung, H.; Houssami, N.; Morgan, E.; Mutebi, M.; Garvey, G.; Soerjomataram, I.; Fidler-Benaoudia, M.M. Global patterns and trends in breast cancer incidence and mortality across 185 countries. Nat. Med. 2025, 31, 1154–1162. [Google Scholar] [CrossRef]
- Sousa, B.; Ribeiro, A.S.; Paredes, J. Heterogeneity and plasticity of breast cancer stem cells. Adv. Exp. Med. Biol. 2019, 1139, 83–103. [Google Scholar] [CrossRef] [PubMed]
- Trayes, K.P.; Cokenakes, S.E.H. Breast cancer treatment. Am. Fam. Physician. 2021, 104, 171–178. [Google Scholar]
- Łukasiewicz, S.; Czeczelewski, M.; Forma, A.; Baj, J.; Sitarz, R.; Stanisławek, A. Breast cancer-epidemiology, risk factors, classification, prognostic markers, and current treatment strategies—An updated review. Cancers 2021, 13, 4287. [Google Scholar] [CrossRef] [PubMed]
- Tenori, L.; Oakman, C.; Morris, P.G.; Gralka, E.; Turner, N.; Cappadona, S.; Fornier, M.; Hudis, C.; Norton, L.; Luchinat, C.; Di Leo, A. Serum metabolomic profiles evaluated after surgery may identify patients with oestrogen receptor negative early breast cancer at increased risk of disease recurrence. Results from a retrospective study. Mol. Oncol. 2015, 9, 128–139. [Google Scholar] [CrossRef]
- Vízkeleti, L.; Spisák, S. Rewired metabolism caused by the oncogenic deregulation of MYC as an attractive therapeutic target in cancers. Cells 2023, 12, 1745. [Google Scholar] [CrossRef]
- Swaminathan, H.; Saravanamurali, K.; Yadav, S.A. Extensive review on breast cancer its etiology, progression, prognostic markers, and treatment. Med. Oncol. 2023, 40, 238. [Google Scholar] [CrossRef]
- Zhang, D.; Xu, X.; Ye, Q. Metabolism and immunity in breast cancer. Front. Med. 2021, 15, 178–207. [Google Scholar] [CrossRef]
- Schmidt, D.R.; Patel, R.; Kirsch, D.G.; Lewis, C.A.; Vander Heiden, M.G.; Locasale, J.W. Metabolomics in cancer research and emerging applications in clinical oncology. CA Cancer J. Clin. 2021, 71, 333–358. [Google Scholar] [CrossRef] [PubMed]
- Jiménez-Franco, A.; Jiménez-Aguilar, J.M.; Canela-Capdevila, M.; García-Pablo, R.; Castañé, H.; Martínez-Navidad, C.; Araguas, P.; Malavé, B.; Benavides-Villarreal, R.; Acosta, J.C.; Onoiu, A.I.; Somaiah, N.; Camps, J.; Joven, J.; Arenas, M. Preliminary metabolomics study suggests favorable metabolic changes in the plasma of breast cancer patients after surgery and adjuvant treatment. Biomedicines 2024, 12, 2196. [Google Scholar] [CrossRef]
- Fauser, J.K.; Matthews, G.M.; Cummins, A.G.; Howarth, G.S. Induction of apoptosis by the medium-chain length fatty acid lauric acid in colon cancer cells due to induction of oxidative stress. Chemotherapy 2013, 59, 214–224. [Google Scholar] [CrossRef]
- Sheela, D.L.; Narayanankutty, A.; Nazeem, P.A.; Raghavamenon, A.C.; Muthangaparambil, S.R. Lauric acid induce cell death in colon cancer cells mediated by the epidermal growth factor receptor downregulation: An in silico and in vitro study. Hum. Exp. Toxicol. 2019, 38, 753–761. [Google Scholar] [CrossRef]
- Verma, P.; Ghosh, A.; Ray, M.; Sarkar, S. Lauric acid modulates cancer-associated microRNA expression and inhibits the growth of the cancer cell. Anticancer Agents Med. Chem. 2020, 20, 834–844. [Google Scholar] [CrossRef]
- Takagi, T.; Fujiwara-Tani, R.; Mori, S.; Kishi, S.; Nishiguchi, Y.; Sasaki, T.; Ogata, R.; Ikemoto, A.; Sasaki, R.; Ohmori, H.; Luo, Y.; Bhawal, U.K.; Sho, M.; Kuniyasu, H. Lauric acid overcomes hypoxia-induced gemcitabine chemoresistance in pancreatic ductal adenocarcinoma. Int. J. Mol. Sci. 2023, 24, 7506. [Google Scholar] [CrossRef]
- Wang, H.; Shao, Z.; Xu, Z.; Ye, B.; Li, M.; Zheng, Q.; Ma, X.; Shi, P. Antiproliferative and apoptotic activity of gemcitabine-lauric acid conjugate on human bladder cancer cells. Iran J. Basic Med. Sci. 2022, 25, 536–542. [Google Scholar] [CrossRef]
- Ramya, V.; Shyam, K.P.; Kowsalya, E.; Balavigneswaran, C.K.; Kadalmani, B. Dual roles of coconut oil and its major component lauric acid on redox nexus: Focus on cytoprotection and cancer cell death. Front. Neurosci. 2022, 16, 833630. [Google Scholar] [CrossRef]
- Richter, R.J.; Jarvik, G.P.; Furlong, C.E. Paraoxonase 1 (PON1) status and substrate hydrolysis. Toxicol. Appl. Pharmacol. 2009, 235, 1–9. [Google Scholar] [CrossRef]
- Schönfeld, P.; Wojtczak, L. Short- and medium-chain fatty acids in energy metabolism: the cellular perspective. J. Lipid Res. 2016, 57, 943–954. [Google Scholar] [CrossRef]
- Do, L.H.; Da Costa, R.T.; Solesio, M.E. Effects of nutrients and diet on mitochondrial dysfunction: An opportunity for therapeutic approaches in human disease. Biomed. Pharmacother. 2025, 191, 118493. [Google Scholar] [CrossRef]
- Camps, J.; Iftimie, S.; Arenas, M.; Castañé, H.; Jiménez-Franco, A.; Castro, A.; Joven, J. Paraoxonase-1: How a xenobiotic detoxifying enzyme has become an actor in the pathophysiology of infectious diseases and cancer. Chem. Biol. Interact. 2023, 380, 110553. [Google Scholar] [CrossRef]
- Camps, J.; Castañé, H.; Rodríguez-Tomàs, E.; Baiges-Gaya, G.; Hernández-Aguilera, A.; Arenas, M.; Iftimie, S.; Joven, J. On the role of paraoxonase-1 and chemokine ligand 2 (C-C motif) in metabolic alterations linked to inflammation and disease. A 2021 update. Biomolecules 2021, 11, 971. [Google Scholar] [CrossRef]
- Koundouros, N.; Poulogiannis, G. Reprogramming of fatty acid metabolism in cancer. Br. J. Cancer 2020, 122, 4–22. [Google Scholar] [CrossRef]
- Mallick, R.; Bhowmik, P.; Duttaroy, A.K. Targeting fatty acid uptake and metabolism in cancer cells: A promising strategy for cancer treatment. Biomed. Pharmacother. 2023, 67, 115591. [Google Scholar] [CrossRef]
- Nagarajan, S.R.; Butler, L.M.; Hoy, A.J. The diversity and breadth of cancer cell fatty acid metabolism. Cancer Metab. 2021, 9, 2. [Google Scholar] [CrossRef]
- Han, K.; Li, J.; Yin, S.; Hu, H.; Zhao, C. Medium-chain fatty acids selectively sensitize cancer cells to ferroptosis by inducing CD36 and ACSL4. Nutrients 2025, 17, 794. [Google Scholar] [CrossRef]
- Corn, K.C.; Windham, M.A.; Rafat, M. Lipids in the tumor microenvironment: From cancer progression to treatment. Prog. Lipid Res. 2020, 80, 101055. [Google Scholar] [CrossRef]
Figure 1.
Systemic dodecanoic acid response to radiotherapy: (A) Waterfall plot illustrating individual changes in plasma dodecanoic acid, ordered by ln[post-RT/pre-RT] values. Each bar represents one patient, with negative values (to the left of 0) corresponding to the Decrease phenotype and positive values (to the right of 0) corresponding to the Increase phenotype. (B-C) Boxplots show pre-RT, post-RT, and delta (post–pre) dodecanoic acid levels by phenotype. Individual data points are overlaid (median and interquartile range shown). Two-sided Mann–Whitney tests were used. Phenotype assignment is based on the sign of ln(post-RT/pre-RT). (D) Scatterplot showing the association between baseline (pre-RT) dodecanoic acid levels and the post-RT change (Δ = post–pre). (E) Distribution of tumor size across phenotypes (Increase vs Decrease), categorized by TNM stage (T0–T4). Sample sizes include all patients with available paired measurements. Abbreviations: RU, relative units; RT, radiotherapy.
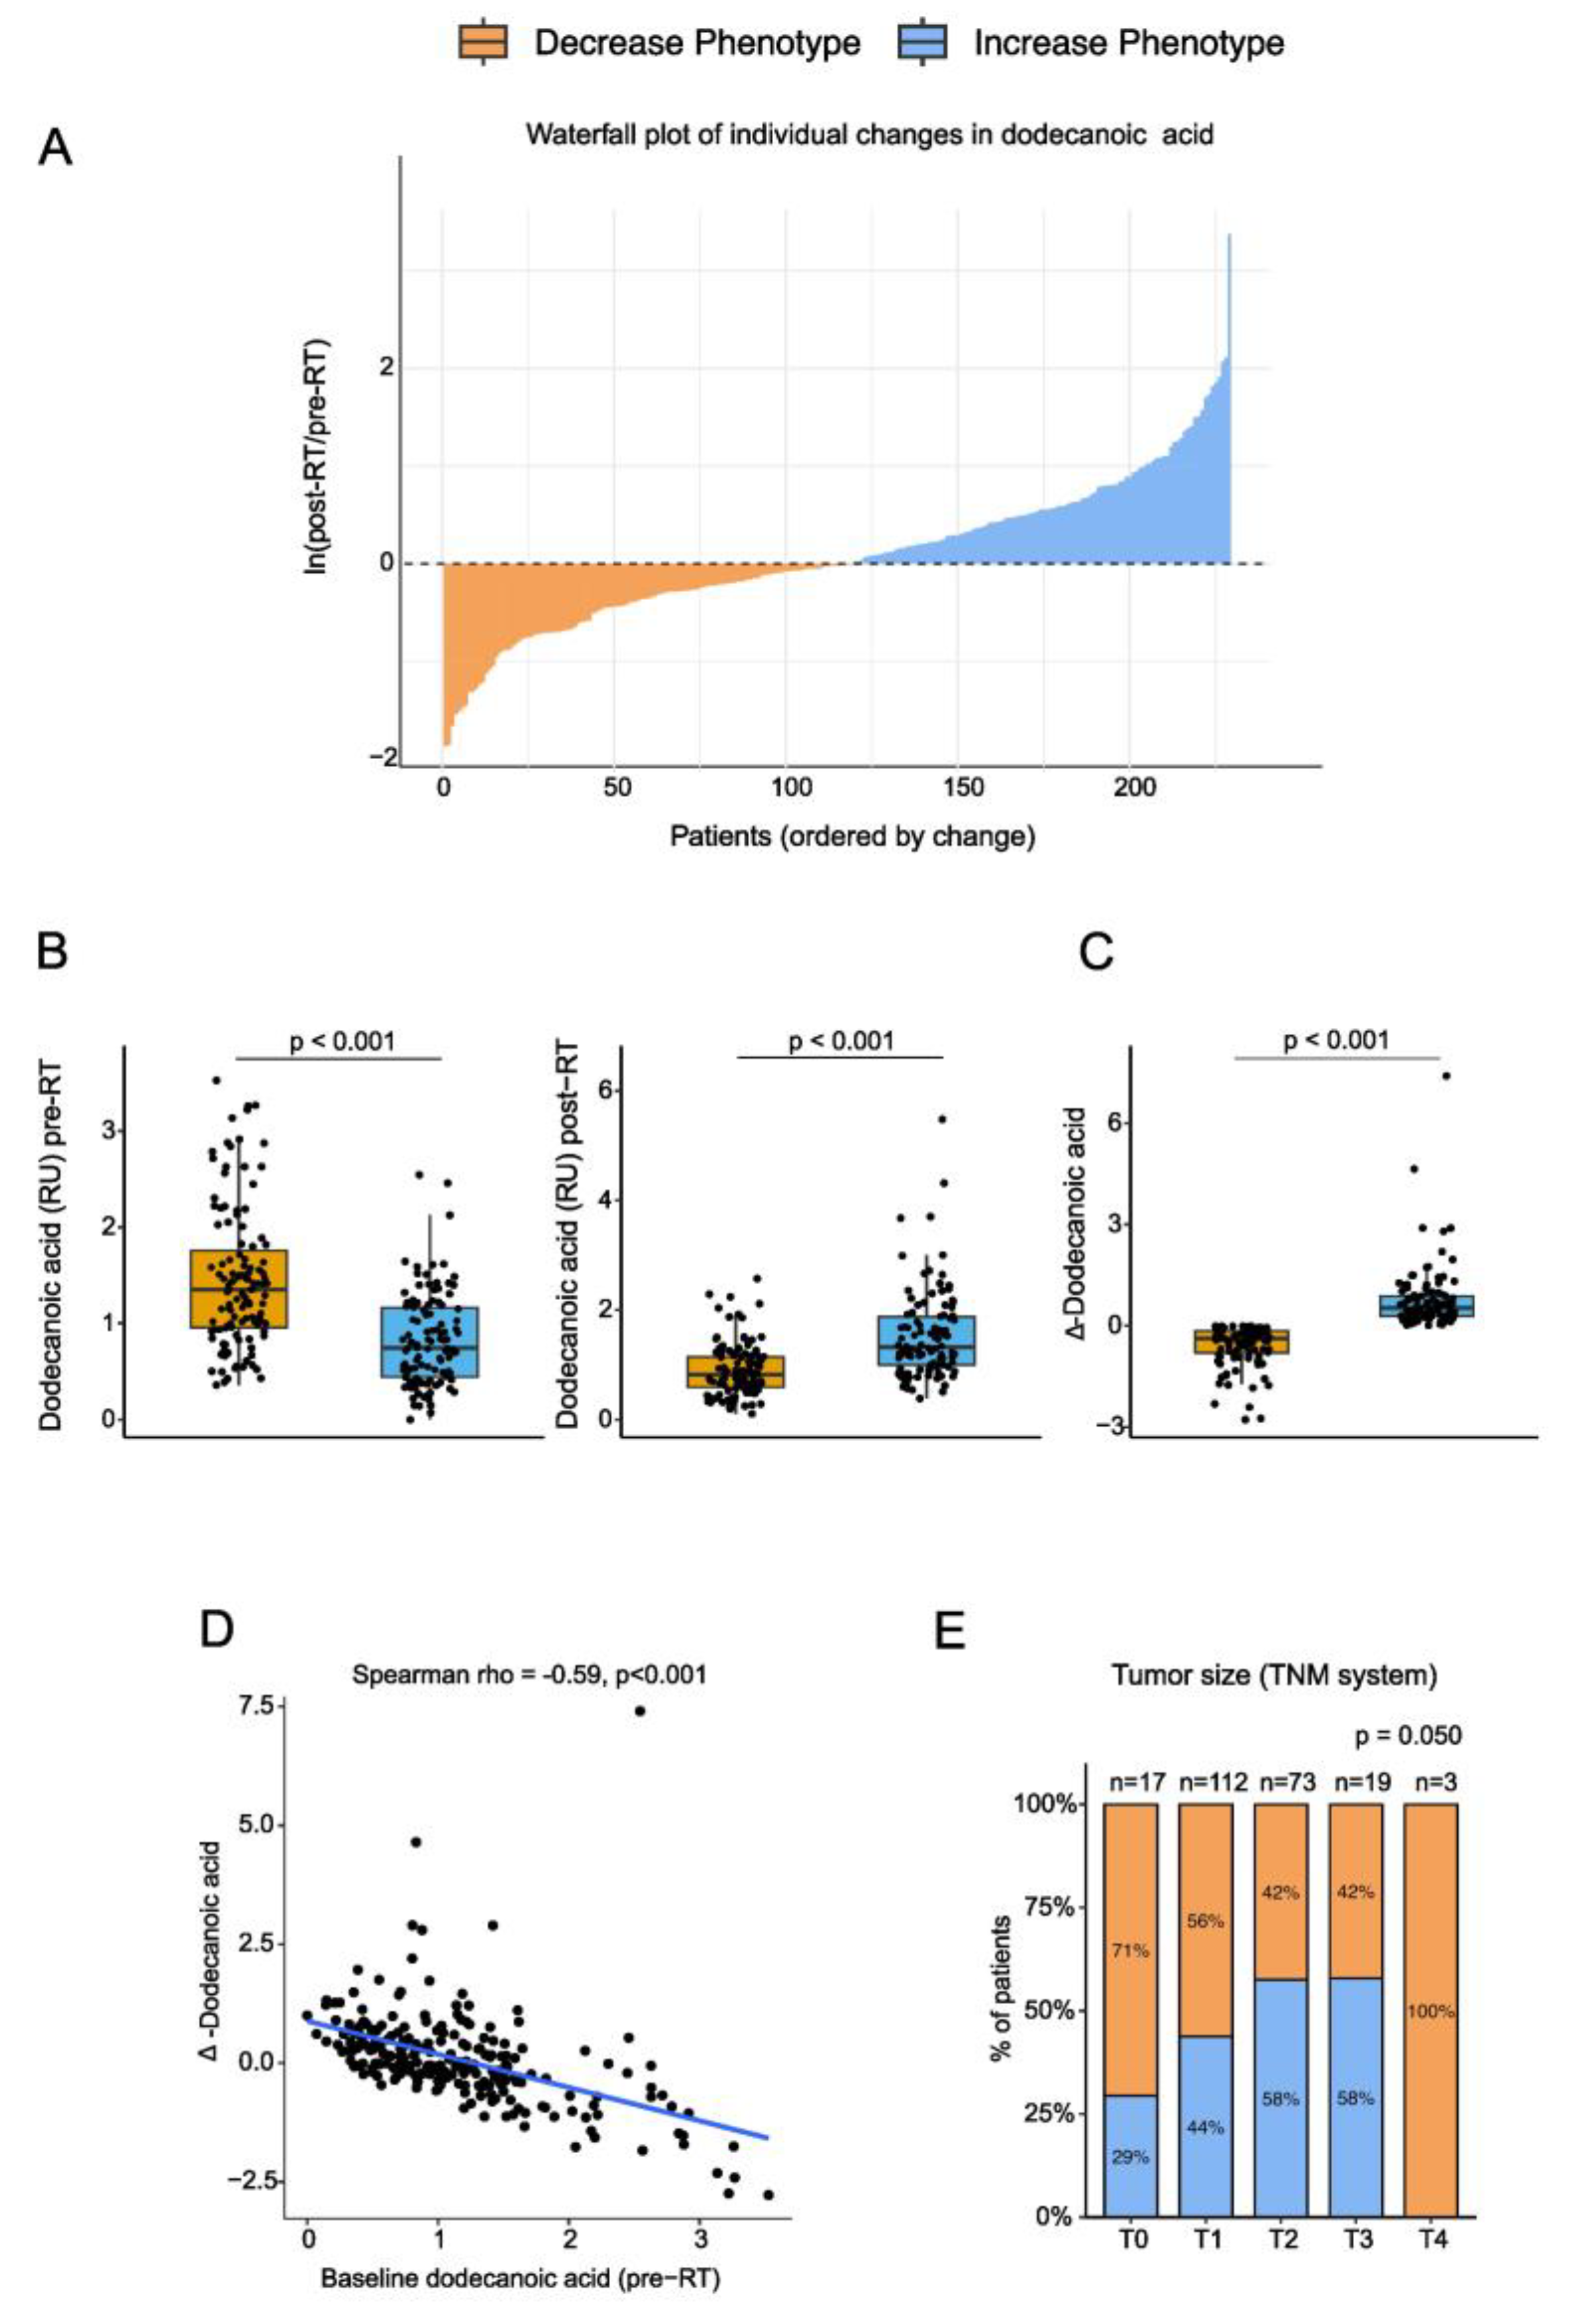
Figure 2.
Metabolic and immune correlates of the dodecanoic acid phenotype: (A) Baseline immune-metabolic correlation matrices for the Decrease and Increase phenotypes. Spearman correlation coefficients (a measure of monotonic association) were computed using all available pre-radiotherapy (Pre-RT) biochemical and immune markers. (B) ROC curve for a LASSO-penalized logistic regression model trained on baseline biochemical and immune markers to classify the post-RT metabolic phenotype (Increase vs Decrease). (C) Post-RT PON1 activity according to phenotype (left) and its association with Δ-dodecanoic acid (the change in dodecanoic acid levels after RT (right). Boxplots display the median and interquartile range; p-values were obtained using two-sided Mann-Whitney test. Abbreviations: ALT, alanine aminotransferase; AST, aspartate aminotransferase; AUC, area under the curve; CCL2, chemokine (C-C motif) ligand 2; CEA, carcinoembryonic antigen; CRP, C-reactive protein; HDL, high-density lipoprotein; IFN-γ, interferon-gamma; LDL, low-density lipoprotein; OR, odds ratio; PON1, paraoxonase-1; ROC, receiver operating characteristic; RT, radiotherapy; SD, standard deviation; VLDL, very-low-density lipoprotein.
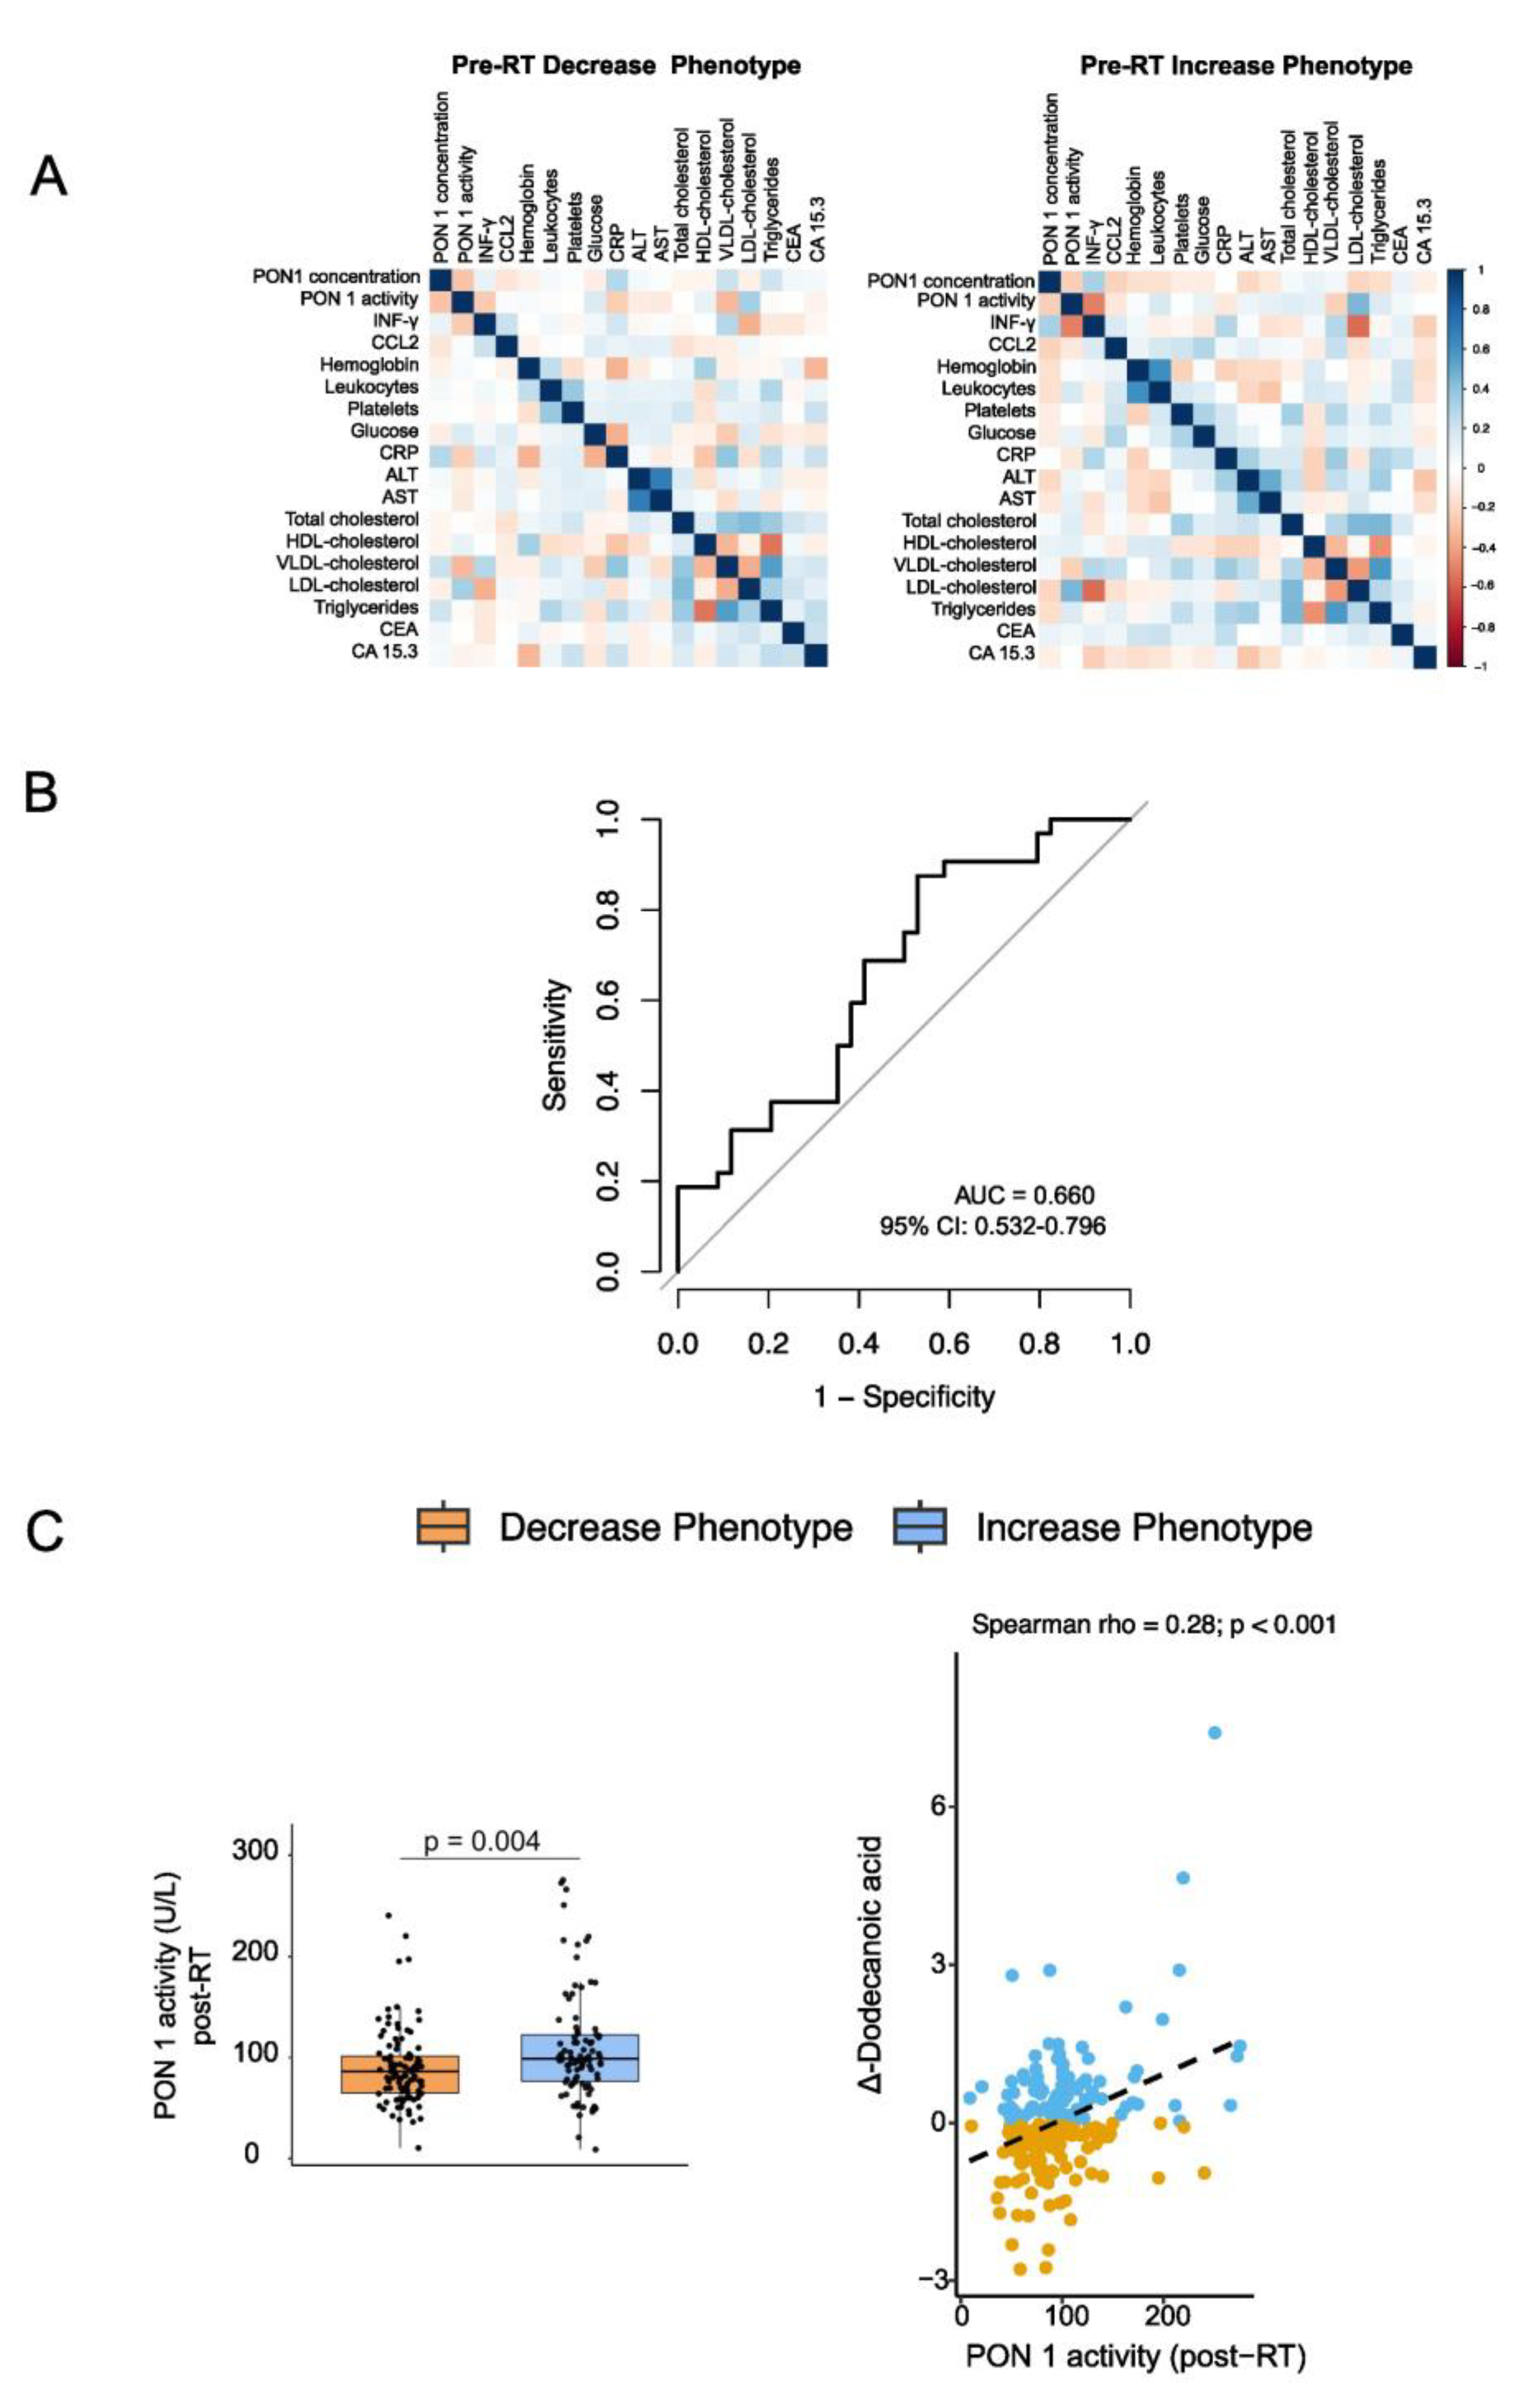
Figure 3.
Tissue and systemic dodecanoic acid dynamics: (A) Paired comparison of peritumoral and tumoral dodecanoic acid concentrations (n = 11 pairs). Boxplots show medians and interquartile ranges (IQR), with points representing paired observations. Statistical significance was assessed using a paired Wilcoxon signed-rank test. (B) Peritumoral-to-tumoral ratio of dodecanoic acid according to plasma phenotype (Increase vs Decrease). The ratio summarizes the spatial gradient between tissue compartments for each patient. Group comparisons were performed using a two-sided Mann–Whitney test (C) Exploratory Spearman correlation heatmap showing associations between tissue dodecanoic acid metrics and plasma or clinical variables. Tiles display correlation coefficients (ρ); asterisks indicate p < 0.05. (D) Scatterplots illustrating two key associations: an inverse correlation between peritumoral and plasma Δ-dodecanoic acid, and a positive correlation between tumoral and plasma Δ-dodecanoic acid. Dashed lines indicate linear fits for visualization purposes. These data indicate relative depletion of dodecanoic acid within the tumor microenvironment, with systemic compensatory increases after radiotherapy. Abbreviations: CCL2, chemokine (C-C motif) ligand 2; PON1, paraoxonase-1; RU, relative units; RT, radiotherapy.
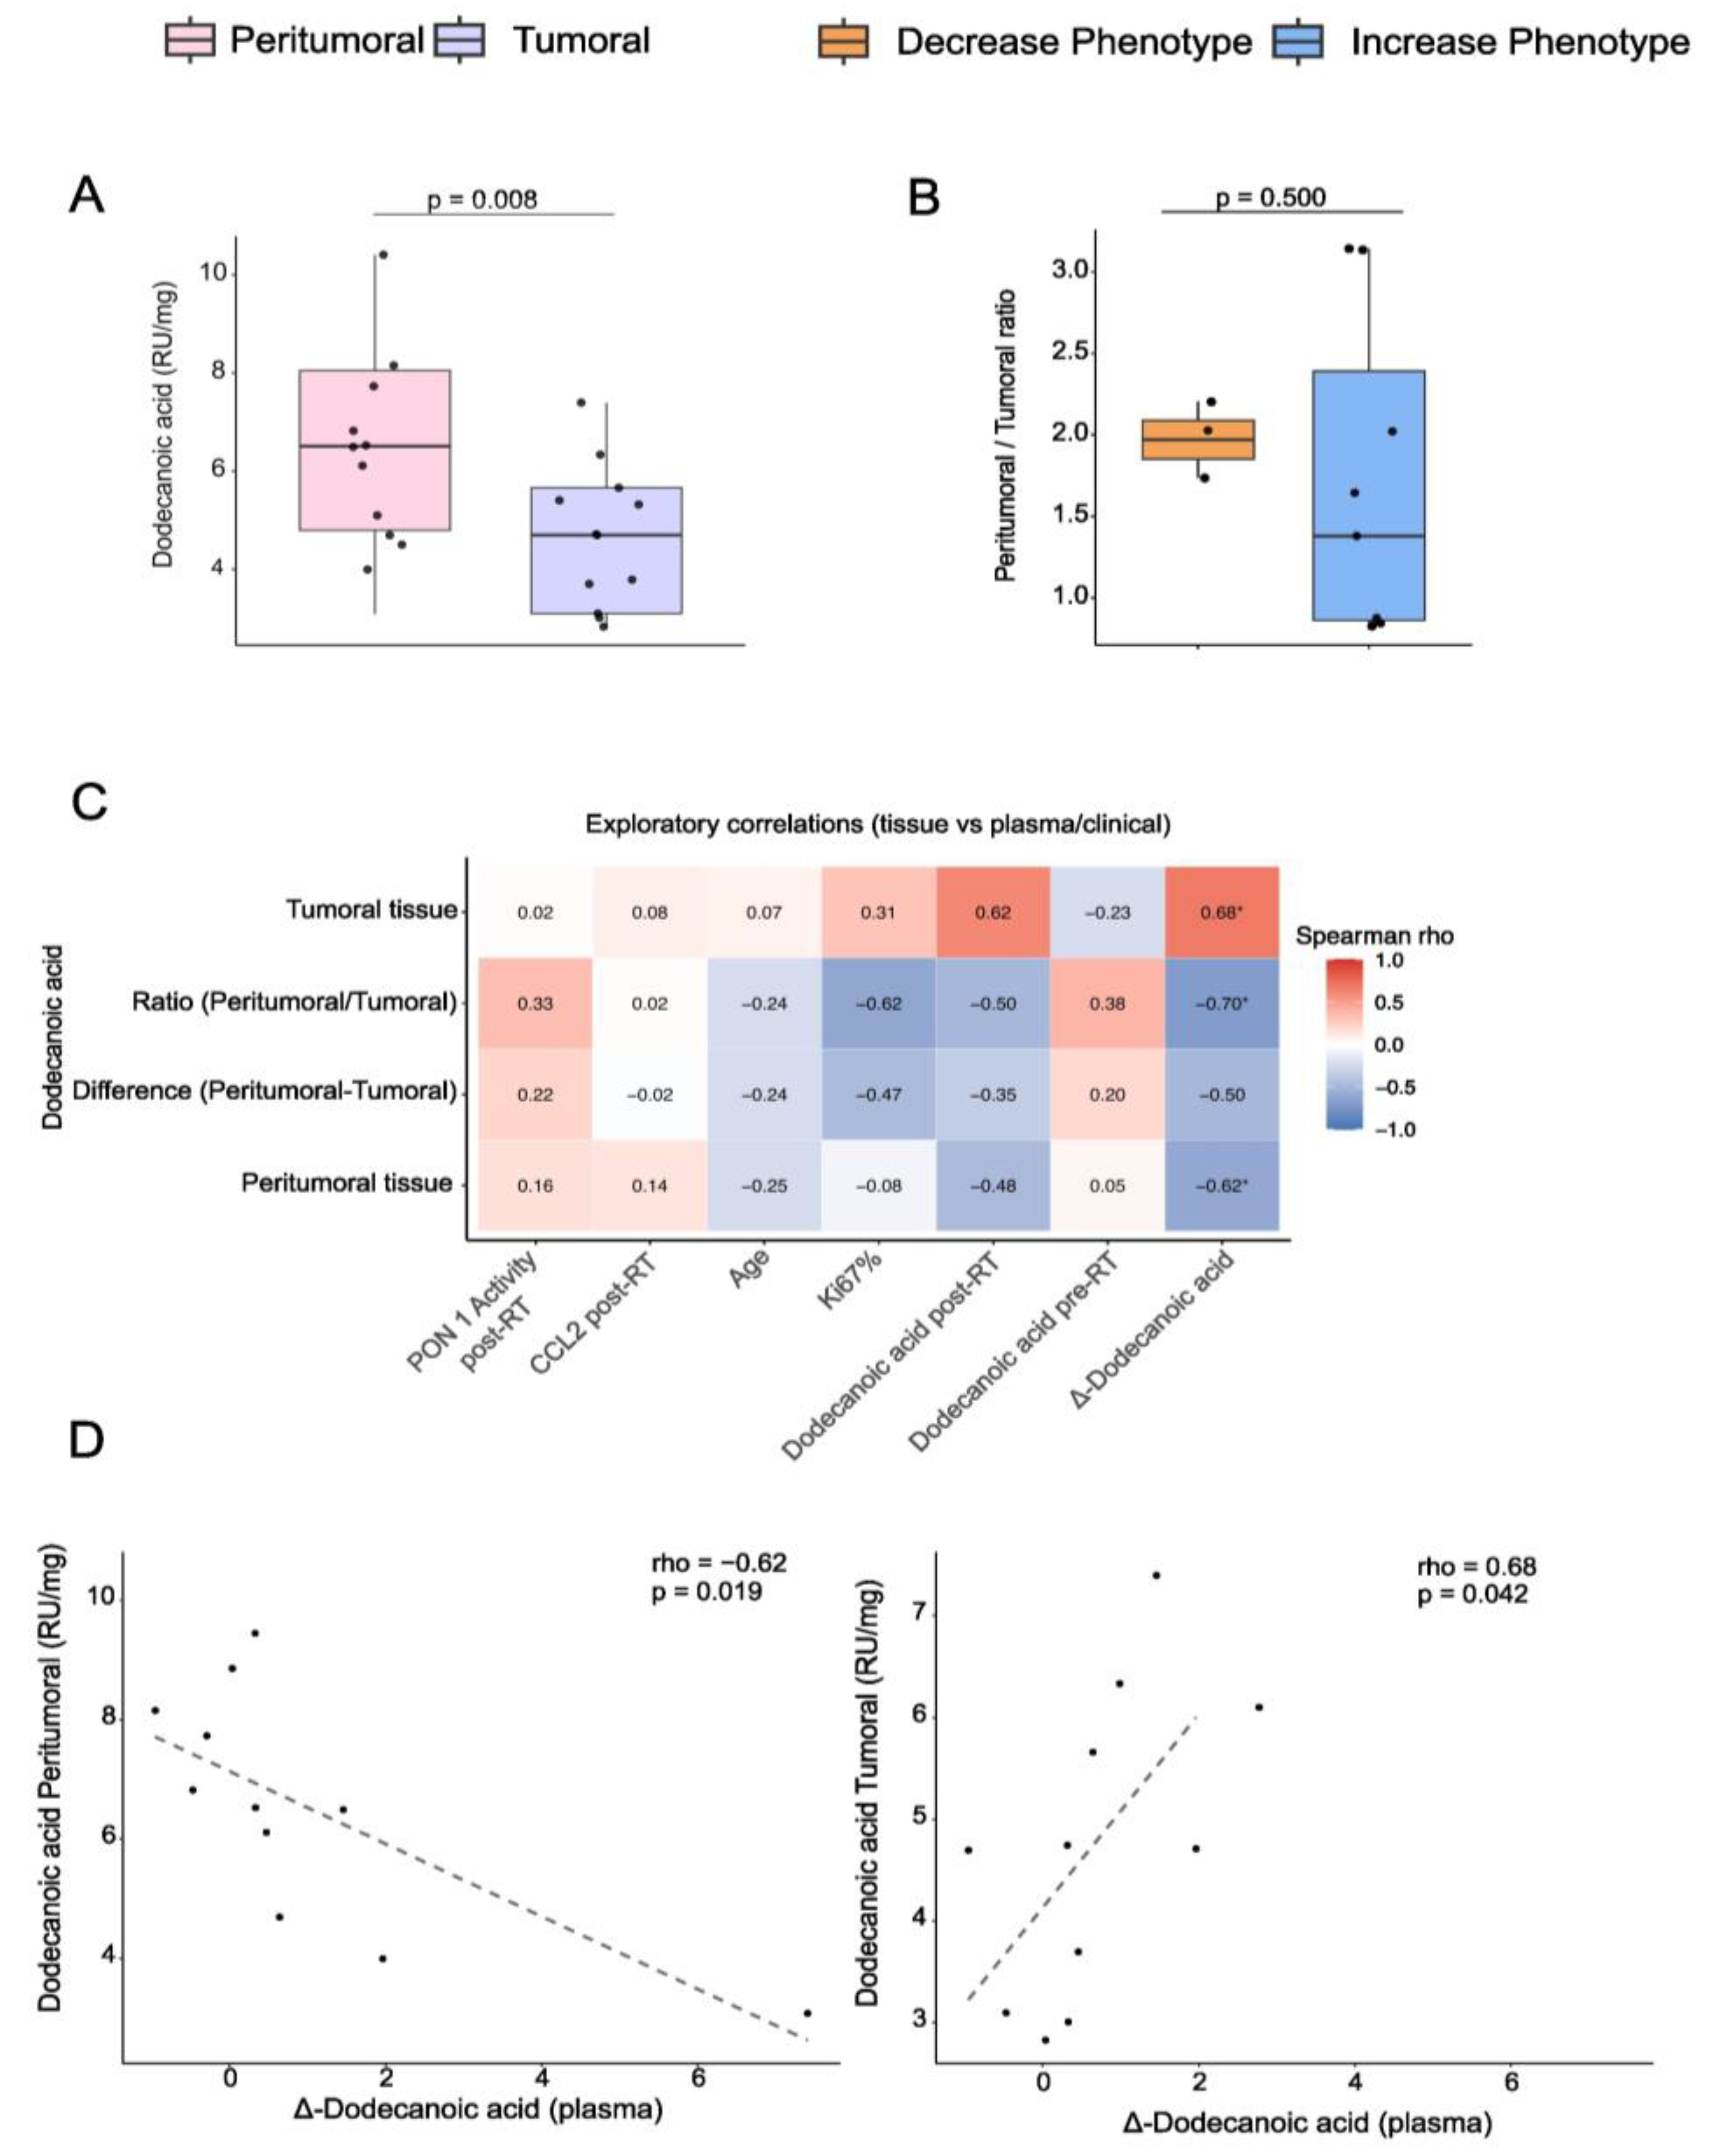
Figure 4.
Survival analyses by dodecanoic acid phenotype: (A–B) Kaplan–Meier curves for OS (A) and PFS (B) by dodecanoic acid phenotype (Decrease vs. Increase). Numbers at risk are displayed in the PFS panel; they are identical for both outcomes. Two-sided log-rank p-values are indicated on the panels. (C) Adjusted Cox proportional hazards regression model for PFS according to dodecanoic acid phenotype (Increase vs Decrease) adjusted for age. Hazard rations (HRs) and 95% confidence intervals (CIs) are shown on a logarithmic scale; HR < 1 indicates a lower risk of disease progression for the Increase phenotype. Abbreviations: CI, confidence interval; HR, hazard ratio; OS, overall survival; PFS, progression-free survival; RT, radiotherapy.
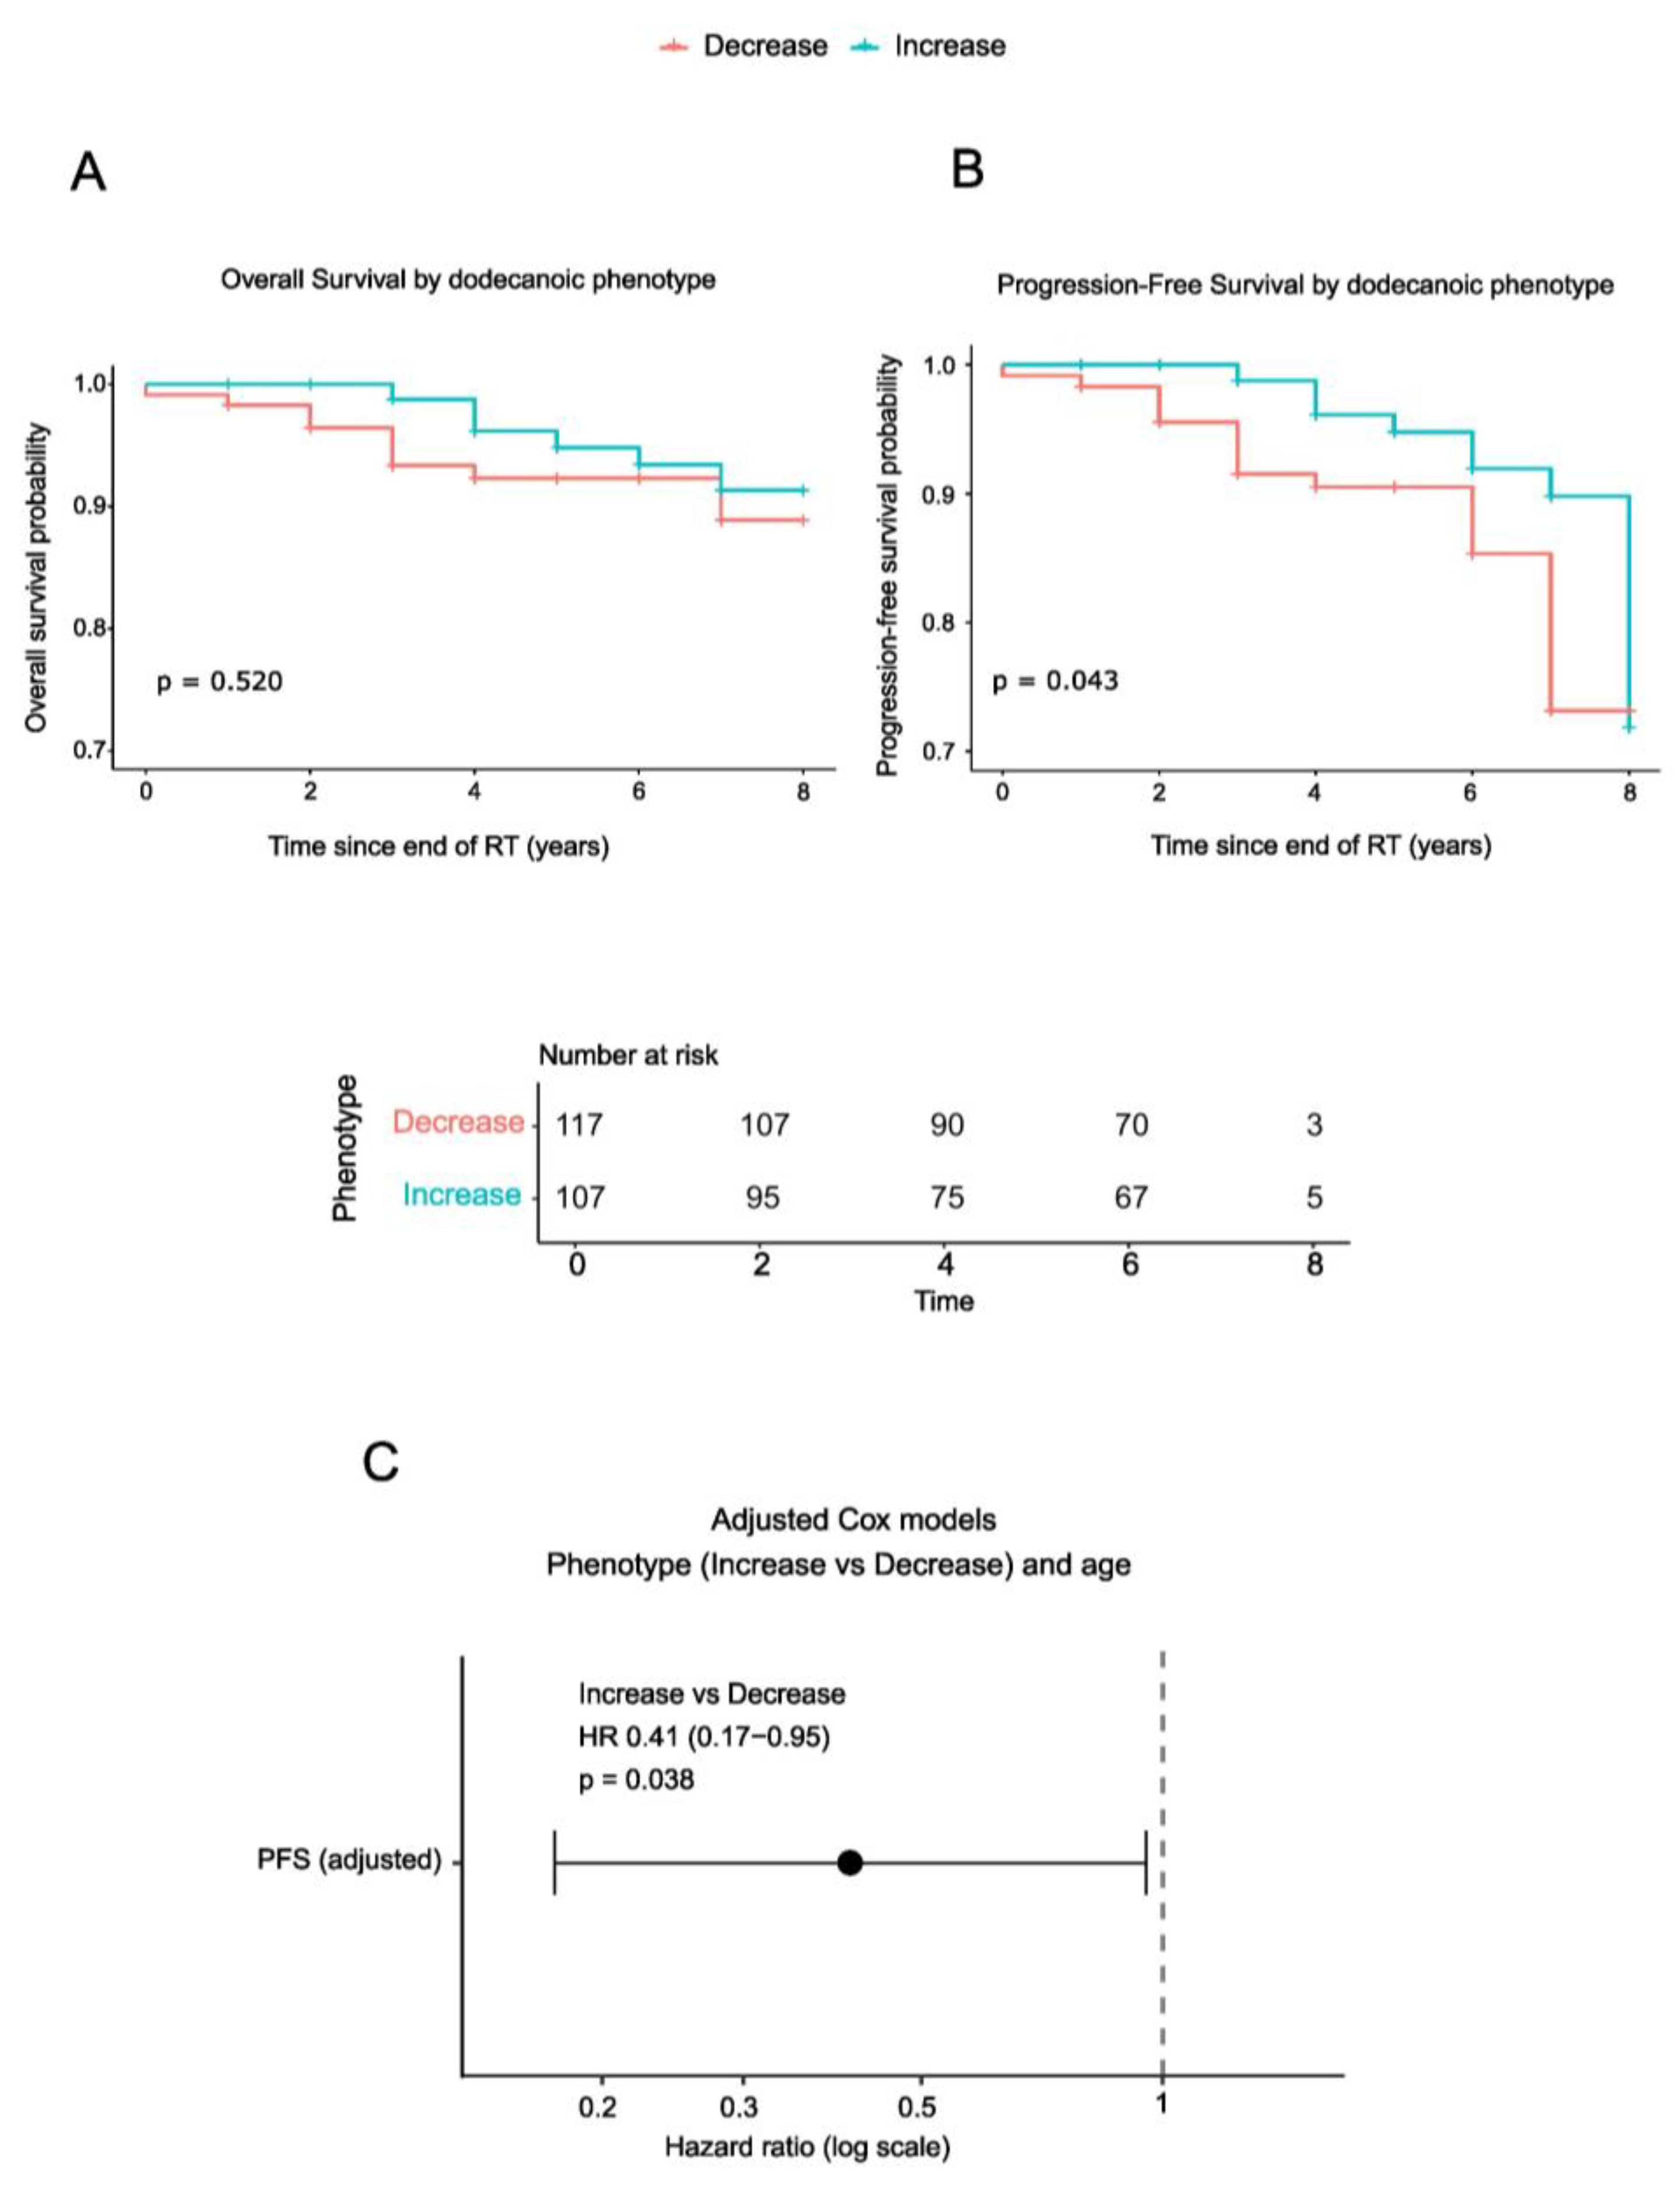

Table 1.
Demographic and clinical characteristics of included patients.
| Clinical characteristics | |
| Age at diagnosis (years) | 55 (48-64) |
| Smoking habit | 50 (21.8) |
| Alcohol habit (>20g/day) | 15 (6.6) |
| Diabetes mellitus | 15 (6.6) |
| Hypertension | 52 (22.7) |
| Dyslipidemia | 53 (23.1) |
| Chronic obstructive pulmonary disease | 10 (4.4) |
| Ischemic heart disease | 7 (3.1) |
| Menopause status | |
| Premenopausal | 52 (22.7) |
| Peri-menopausal | 27 (11.8) |
| Postmenopausal | 145 (63.3) |
| No data | 5 (2.2) |
| Use of oral contraceptives | 73 (31.9) |
| Motherhood | 172 (75.1) |
| Family history of cancer | 101 (44.1) |
| Cancer Characteristics | |
| Tumor size (TNM system) | |
| T0 | 17 (7.4) |
| T1 | 113 (49.3) |
| T2 | 72 (31.4) |
| T3 | 19 (8.3) |
| T4 | 3 (1.3) |
| No data | 5 (2.2) |
| Nodes (TNM system) | |
| N0 | 149 (65.1) |
| N1 | 54 (23.6) |
| N2 | 17 (7.4) |
| N3 | 4 (1.7) |
| No data | 5 (2.2) |
| Metastases (TNM system) | |
| M0 | 229 (100) |
| M1 | - |
| Pathological anatomy | |
| Ductal carcinoma | 190 (83.8) |
| Lobular carcinoma | 8 (3.9) |
| Other | 23 (10.0) |
| No data | 6 (2.6) |
| Histological grade | |
| I | 44 (19.2) |
| II | 118 (51.5) |
| III | 62 (27.1) |
| No data | 5 (2.2) |
| Estrogen receptors | |
| Positive | 184 (80.3) |
| Negative | 40 (17.5) |
| No data | 5 (2.2) |
| Progesterone receptors | |
| Positive | 149 (51.1) |
| Negative | 75 (32.8) |
| No data | 5 (2.2) |
| HER2 positive | 41 (17.9) |
| Ki67 antigen | |
| 0% | 1 (0.4) |
| 1-15% | 81 (35.4) |
| 16-50% | 109 (47.6) |
| >50% | 33 (14.4) |
| No data | 5 (2.2) |
| Tumor molecular classification | |
| Luminal A | 64 (27.9) |
| Luminal B | 89 (38.9) |
| HER 2 positive | 40 (17.5) |
| Triple negative | 31 (13.5) |
| No data | 5 (2.2) |
| Oncological treatments | |
| Surgery | 229 (100) |
| Neoadjuvant chemotherapy | 54 (23.6) |
| Adjuvant chemotherapy | 60 (26.2) |
| Adjuvant hormone therapy | 142 (62.0) |
| Adjuvant radiotherapy | 220 (100) |
| Follow up | |
| Follow up (years) | 6 (2-7) |
| Cancer Recurrence | |
| Local | 3 (1.3) |
| Regional (nodal) | 1 (0.4) |
| Distant (metastatic) | 15 (6.6) |
| No data | 5 (2.2) |
| Deceased | 15 (6.6) |
Values are expressed as n (percentage) or median (interquartile range). Abbreviations: BC, breast cancer; HER2, human epidermal growth factor receptor 2; M0/1, absence/presence of distant metastasis; N0-3 lymph node status; T0-4, tumor size.
Table 2.
Baseline tumor characteristics stratified by pre-radiotherapy dodecanoic acid levels.
| Low pre-RT (n = 115) |
High pre-RT (n = 114) |
p-value | FDR | |
|---|---|---|---|---|
| Pre-RT dodecanoic acid (RU) | 0.65 (0.43–0.84) | 1.47 (1.24–1.98) | 4.53x10-39 | 4.53x10-38 |
| Age at diagnosis (years) | 58 (48.5–65.5) | 53.5 (47–62) | 0.035 | 0.175 |
| Tumor size (TNM system) | 0.270 | 0.338 | ||
| T0 | 5 (4.5) | 12 (10.7) | ||
| T1 | 56 (50.0) | 57 (50.9) | ||
| T2 | 41 (36.6) | 31 (27.7) | ||
| T3 | 8 (7.1) | 11 (9.8) | ||
| T4 | 2 (1.8) | 1 (0.9) | ||
| No data | 2 (1.8) | 2 (1.8) | ||
| Nodes (TNM system) | 0.110 | 0.276 | ||
| N0 | 74 (66.1) | 76 (67.9) | ||
| N1 | 31 (27.7) | 22 (19.6) | ||
| N2 | 7 (6.2) | 10 (8.9) | ||
| N3 | - | 4 (3.6) | ||
| No data | 2 (1.8) | 2 (1.8) | ||
| Histological grade | 0.721 | 0.721 | ||
| I | 21 (18.8) | 23 (20.5) | ||
| II | 62 (55.4) | 56 (50.0) | ||
| III | 29 (25.9) | 33 (29.5) | ||
| No data | 3 (2.6) | 2 (1.75) | ||
| Estrogen receptors | 0.600 | 0.667 | ||
| Positive | 90 (89.4) | 94 (83.9) | ||
| Negative | 22 (19.6) | 18 (16.1) | ||
| No data | 3 (2.6) | 2 (1.75) | ||
| Progesterone receptors | 0.257 | 0.337 | ||
| Positive | 70 (62.5) | 79 (70.5) | ||
| Negative | 42 (37.5) | 33 (29.5) | ||
| No data | 3 (2.6) | 2 (1.75) | ||
| HER2 positive | 17 (15.2) | 25 (22.3) | 0.231 | 0.337 |
| Ki67 antigen | 0.196 | 0.337 | ||
| 0% | 34 (30.4) | 47 (42.0) | ||
| 1-15% | 60 (53.6) | 49 (43.8) | ||
| 16-50% | 17 (15.2) | 16 (14.3) | ||
| >50% | 1 (0.9) | - | ||
| No data | 3 (2.6) | 2 (1.8) | ||
| Tumor molecular classification | 0.062 | 0.207 | ||
| Luminal A | 26 (23.2) | 38 (33.9) | ||
| Luminal B | 51 (45.5 | 38 (33.9) | ||
| HER 2 positive | 16 (14.3) | 24 (21.4) | ||
| Triple negative | 19 (17.0) | 12 (10.7) | ||
| No data | 3 (2.6) | 2 (1.8) |
Values are presented as n (percentage) or median (interquartile range). Statistical comparisons were performed using the Mann-Whitney U test for continuous variables and adjusted for multiple comparisons using the Benjamini–Hochberg false discovery rate (FDR) method. Fisher’s exact test was used for categorical variables. Abbreviations: HER2, human epidermal growth factor receptor 2; M0/1, absence/presence of distant metastasis; N0-2 lymph node status; RU: relative units; RT: radiotherapy; T0-4, tumor size.
Table 3.
Multivariable Cox regression analyses for progression-free survival (PFS).
| Outcome | Variable | HR | 95% CI | p-value |
|---|---|---|---|---|
| PFS | Phenotype (increase/decrease) | 0.41 | 0.17-0.95 | 0.038 |
| Age at diagnosis (year) | 0.98 | 0.95-1.02 | 0.350 |
PFS was defined as the time from the end of radiotherapy to disease recurrence, distant metastasis, or death, whichever occurred first. Hazard ratios (HRs) and 95% confidence intervals (CIs) are shown. The multivariable model was adjusted for age. HR<1 indicates a lower risk of progression. The dodecanoic acid phenotype was defined based on the direction of change after radiotherapy.
Disclaimer/Publisher’s Note: The statements, opinions and data contained in all publications are solely those of the individual author(s) and contributor(s) and not of MDPI and/or the editor(s). MDPI and/or the editor(s) disclaim responsibility for any injury to people or property resulting from any ideas, methods, instructions or products referred to in the content. |
© 2026 by the authors. Licensee MDPI, Basel, Switzerland. This article is an open access article distributed under the terms and conditions of the Creative Commons Attribution (CC BY) license.
Copyright: This open access article is published under a Creative Commons CC BY 4.0 license, which permit the free download, distribution, and reuse, provided that the author and preprint are cited in any reuse.


