Submitted:
28 January 2026
Posted:
29 January 2026
You are already at the latest version
Abstract
This study addresses the challenge of forecasting backend service metrics in highly dynamic and disturbed environments and proposes a robust time series prediction framework based on uncertainty estimation. The method first applies a multi-scale encoding structure to decompose and represent service metric sequences, allowing the model to capture mixed characteristics of trends, periodic patterns, and noise disturbances. It then constructs a cross-sequence dependency modeling module to describe structural coupling among multiple metrics so that the model can identify implicit interaction patterns across different service nodes in backend systems. On this basis, the framework outputs both the mean and variance of future metrics through distributed prediction heads, enabling joint characterization of predictions and their associated risk ranges. A noise response mechanism is incorporated to enhance model stability under anomalous disturbances. To improve the controllability of the overall prediction process, a risk adjustment module is designed to transform uncertainty signals into actionable adjustment factors, allowing the model to maintain consistent outputs in high volatility environments. The experiments evaluate hyperparameter sensitivity, environmental sensitivity, and data sensitivity. The results show that the proposed framework maintains high stability and robustness under multiple source disturbances and effectively suppresses error propagation caused by anomalous samples, structural changes, and system scaling. By jointly modeling point predictions and risk estimation, the study verifies the effectiveness of an uncertainty-driven robust forecasting framework for backend metric management and system reliability, providing a scalable technical path for data-driven analysis in complex systems.
Keywords:
uncertainty estimation
; backend service metrics
; time series forecasting
; robust modeling
I. INTRODUCTION
With the continuous expansion of internet infrastructure and the rapid evolution of service patterns, backend services have become the core support of the digital ecosystem[1]. Online transaction platforms, real-time computing systems, and autonomous service architectures rely on large numbers of distributed components to maintain high availability and stability. In this environment, service metrics such as CPU usage, memory consumption, request latency, concurrency, and error rates show greater dynamism and complexity. Their variations are no longer driven by simple workload patterns. They are shaped by peak traffic fluctuations, feature switches, service version iterations, container orchestration strategies, and hardware heterogeneity[2]. This reality transforms backend metric forecasting from a stationary statistical process into a highly nonlinear, noisy, and mixed-period dynamic process. Any prediction bias can escalate into system risks, such as resource misallocation, fault propagation, and link congestion. Building a robust forecasting system for backend metrics is therefore essential for adaptive scheduling, early anomaly warning, and refined resource management.
Most existing forecasting methods rely on a single deterministic output. They often ignore the model's inherent uncertainty when facing insufficient data, bursty traffic patterns, abnormal disturbances, or distribution shifts. In real production environments, backend metrics are affected by uncontrollable fluctuations. Many variations have strong non-stationary properties. New feature releases, microservice refactoring, and container scheduling changes all cause distribution drift. The model cannot observe these patterns fully during training. When a forecasting system cannot express uncertainty, high-risk predictions may be misinterpreted as high-confidence results. This leads to over-scheduling, insufficient scaling, missing alarms, or delayed fault handling. Introducing uncertainty estimation is therefore crucial for improving the credibility of predictions. It also forms the foundation for risk-aware operation in large-scale backend systems[3].
In traditional backend systems, uncertainty is often expressed through heuristic thresholds, empirical rules, or static ranges. These methods cannot adapt to the correlated features across multi-scenario and multi-modal metrics. They also cannot reflect the model's true confidence in its outputs. As system scale grows, metric dimensions extend from single services to cross-service chains and further to cluster-level resource scheduling. The noise structure and correlation patterns of time series become increasingly complex. Without reliable uncertainty measures, predictions lack transparency, and automated operations tools cannot maintain strategy elasticity. The system becomes fragile under unexpected load. To address this challenge, it is necessary to design a forecasting system that can represent prediction intervals, model risk boundaries, and quantify distribution shifts. Such a system enables backend platforms to reduce decision strength in high-risk conditions and increase throughput in low-risk scenarios. This supports refined and resilient system management[4,5].
Backend service environments show strong heterogeneity across scenarios. The reliability of the same forecasting model may vary significantly under peak load, low load, canary release, container migration, or concurrency jitter. Without uncertainty modeling, the system cannot distinguish between trustworthy predictions and high-risk predictions. It cannot support tiered decision-making in automated workflows. In complex business systems, incorrect predictions with high confidence can invalidate scaling strategies and may cause local anomalies to propagate into upper-layer logic. This can trigger cascading failures[6,7]. A forecasting system that is robust to scenario changes, structural disturbances, and distribution shifts is therefore essential. It marks a key step toward transforming intelligent operations from simple result prediction to risk-aware prediction.
II. RELATED WORK
The The challenge of robust time series forecasting under uncertainty has attracted increasing attention, with research focusing on deep learning architectures, graph modeling, and risk-aware adaptation. Deep reinforcement learning has become a practical approach for intelligent scheduling under heterogeneous and dynamic conditions. For instance, Gao et al. proposed a deep Q-learning-based scheduling framework, demonstrating adaptive policy optimization for robust system management [8]. Multi-scale temporal alignment has also proven valuable, as shown by Chang et al., whose machine learning approaches for risk prediction utilize multi-scale temporal information to enhance robustness and accuracy in sequential data analysis [9]. Chiang et al. introduced dynamic graph frameworks leveraging deep learning for robust risk prediction, where the modeling of cross-entity dependencies supports stability in fluctuating environments [10].
Trust and robustness in orchestration frameworks have been improved through dynamic trust-aware modeling, as presented by Hu et al., which enables adversarially robust multi-agent collaboration—a paradigm applicable for distributed system resilience and adaptive control [11]. Self-supervised and retrieval-augmented learning strategies [12], as well as meta-learning approaches [13], offer tools for handling limited data, distributional shifts, and evolving patterns—critical for generalizable and robust forecasting systems.
Reinforcement learning has also been applied for adaptive rate limiting in microservices, as shown by Lyu et al., highlighting the necessity to balance multiple objectives under dynamic workloads [14]. For spatiotemporal prediction, Qiu et al. leveraged graph neural networks to extract implicit dependencies among backend metrics, enabling more accurate and robust forecasting in distributed systems [15].
Further, transformer-based architectures for risk monitoring [16], topology-aware graph reinforcement learning for dynamic routing [17], and multi-scale adaptation strategies for recommendation systems [18] all demonstrate how advanced neural architectures, dependency modeling, and risk-driven representation learning can be applied across different domains, with techniques transferable to robust time series forecasting. Self-supervised learning and confidence-constrained prediction frameworks [19] contribute methods for uncertainty-aware modeling and prediction under imbalanced or high-variance scenarios.
Hierarchical attention mechanisms, as proposed by Cheng, provide effective tools for integrating multi-level temporal and metric interactions, supporting robust scheduling delay prediction [20]. Kang’s multi-scale temporal and structure-aware anomaly detection further demonstrates the importance of capturing temporal and structural dependencies in high-dimensional metric spaces [21]. Graph neural architectures with temporal dynamics, such as those introduced by Zhang et al., support comprehensive anomaly detection and robustness to distributional shifts, directly inspiring advanced solutions for uncertainty-aware forecasting [22].
Collectively, these studies provide a rich methodological foundation—spanning multi-scale modeling, graph neural networks, uncertainty quantification, and robust learning—that supports the development of robust forecasting systems for backend metrics under uncertainty. The present work builds upon these ideas by proposing an uncertainty-driven approach for time series prediction that jointly models point forecasts and risk boundaries to enhance reliability and scalability in volatile environments.
III. PROPOSED FRAMEWORK
The robust prediction system constructed in this study uses multimodal time series of backend service indicators as input and completes joint modeling from dynamic behavior to disturbance risk through a hierarchical coding structure. First, the original indicator sequence is mapped to a multi-scale state representation to capture the implicit structural relationships between trend, periodic, and random disturbance terms. This process is achieved through a class of learnable dynamic decomposition functions, the core of which is:
Here, represents the basic representation of time t, used for subsequent uncertainty modeling and prediction generation. Building upon this, the model further introduces cross-sequence dependency analysis, using adaptive weights to characterize the structural coupling between indicators, enabling the system to maintain a stable input representation when facing noise from different sources. The model architecture is shown in Figure 1.
To characterize the prediction risk of backend indicators, this study introduces an uncertainty estimation mechanism based on a parameterized distribution into the prediction head. The prediction module not only outputs the point estimate A for future time moments but also explicitly models the variance of the prediction distribution, defined as follows:
Here, and represent the model's optimal estimate of future values and the risk range, respectively. Through this distributed representation, the system can proactively identify a decline in prediction confidence under high-fluctuation load conditions, thus providing a more robust basis for scheduling strategies. To ensure the stability of the distribution, the model employs a differentiable variance regularization term, preventing the risk estimate from over-expanding or over-contracting in the face of sudden changes.
In the overall reasoning process, the model integrates short-term and long-term uncertainties through a sequence-level risk propagation mechanism to form an overall risk profile for the future interval. Specifically, the model uses a time-dimensional risk accumulation function to integrate continuous prediction intervals, in the form of:
Here, describes the cumulative uncertainty within the future time window. This mechanism enables the prediction system to progressively amplify or suppress risks when faced with distribution shifts, model biases, or external disturbances, thereby maintaining the overall robustness of decision-making. Furthermore, the system introduces a gradient-sensitive structural perturbation term to measure the model's response to input noise, further enhancing reliability.
Ultimately, the prediction system jointly encodes point predictions and uncertainty into an actionable risk adjustment signal. Through an optimization method based on expected loss, the model simultaneously focuses on prediction accuracy and risk representation during training. The optimization objective consists of two parts: one for compressing the mean squared bias and the other for constraining distributed risk. Its overall form can be expressed as:
This objective function ensures that the model learns the corresponding confidence boundaries while learning the predicted values. To prevent the model from making overly aggressive adjustments in high-risk scenarios, this study constructs a risk adjustment factor for the predicted output:
controls the expansion of the confidence interval, enabling the prediction system to achieve a balance between flexible control and robustness.
IV. EXPERIMENTAL ANALYSIS
A. Dataset
This study uses the open dataset ChronoGraph. The dataset is constructed from a microservice system in a real production environment. It collects multivariate metric time series for each service node, such as CPU usage, memory consumption, and network I O. It also provides the dependency graph among services.
Each time step in the dataset contains multiple service metrics. This offers input for multivariate time series modeling under realistic and complex conditions. The dependency graph helps describe service chains and metric coupling structures. It reflects the interaction patterns among modules in backend service systems.
In addition, the dataset includes event window annotations. These annotations support the identification of system anomalies, load surges, or fault propagation scenarios. They provide a solid foundation for studying model robustness when facing distribution shifts or sudden disturbances. They also support more accurate estimation of predictive uncertainty.
B. Experimental Results
This paper first conducts a comparative experiment, and the experimental results are shown in Table 1.
The results show clear performance differences across models for multivariate time series forecasting of backend service metrics: MLP performs worst due to its inability to capture temporal dependencies, while LSTM and BiLSTM improve error metrics by modeling short-term dynamics. Transformer further outperforms RNN-based models by leveraging self-attention to learn long-range dependencies and global sequence structures, but remains sensitive to distribution shifts and noise. The proposed method achieves the best overall performance, with significant reductions in MSE, RMSE, MAE, and stable improvements in MAPE, demonstrating enhanced robustness through uncertainty-aware forecasting, risk adjustment, and noise handling. By jointly modeling predictions and confidence ranges, it delivers more reliable and controllable forecasts under dynamic and heterogeneous backend conditions; Figure 2 further analyzes the effect of hidden-layer dimensionality on RMSE.
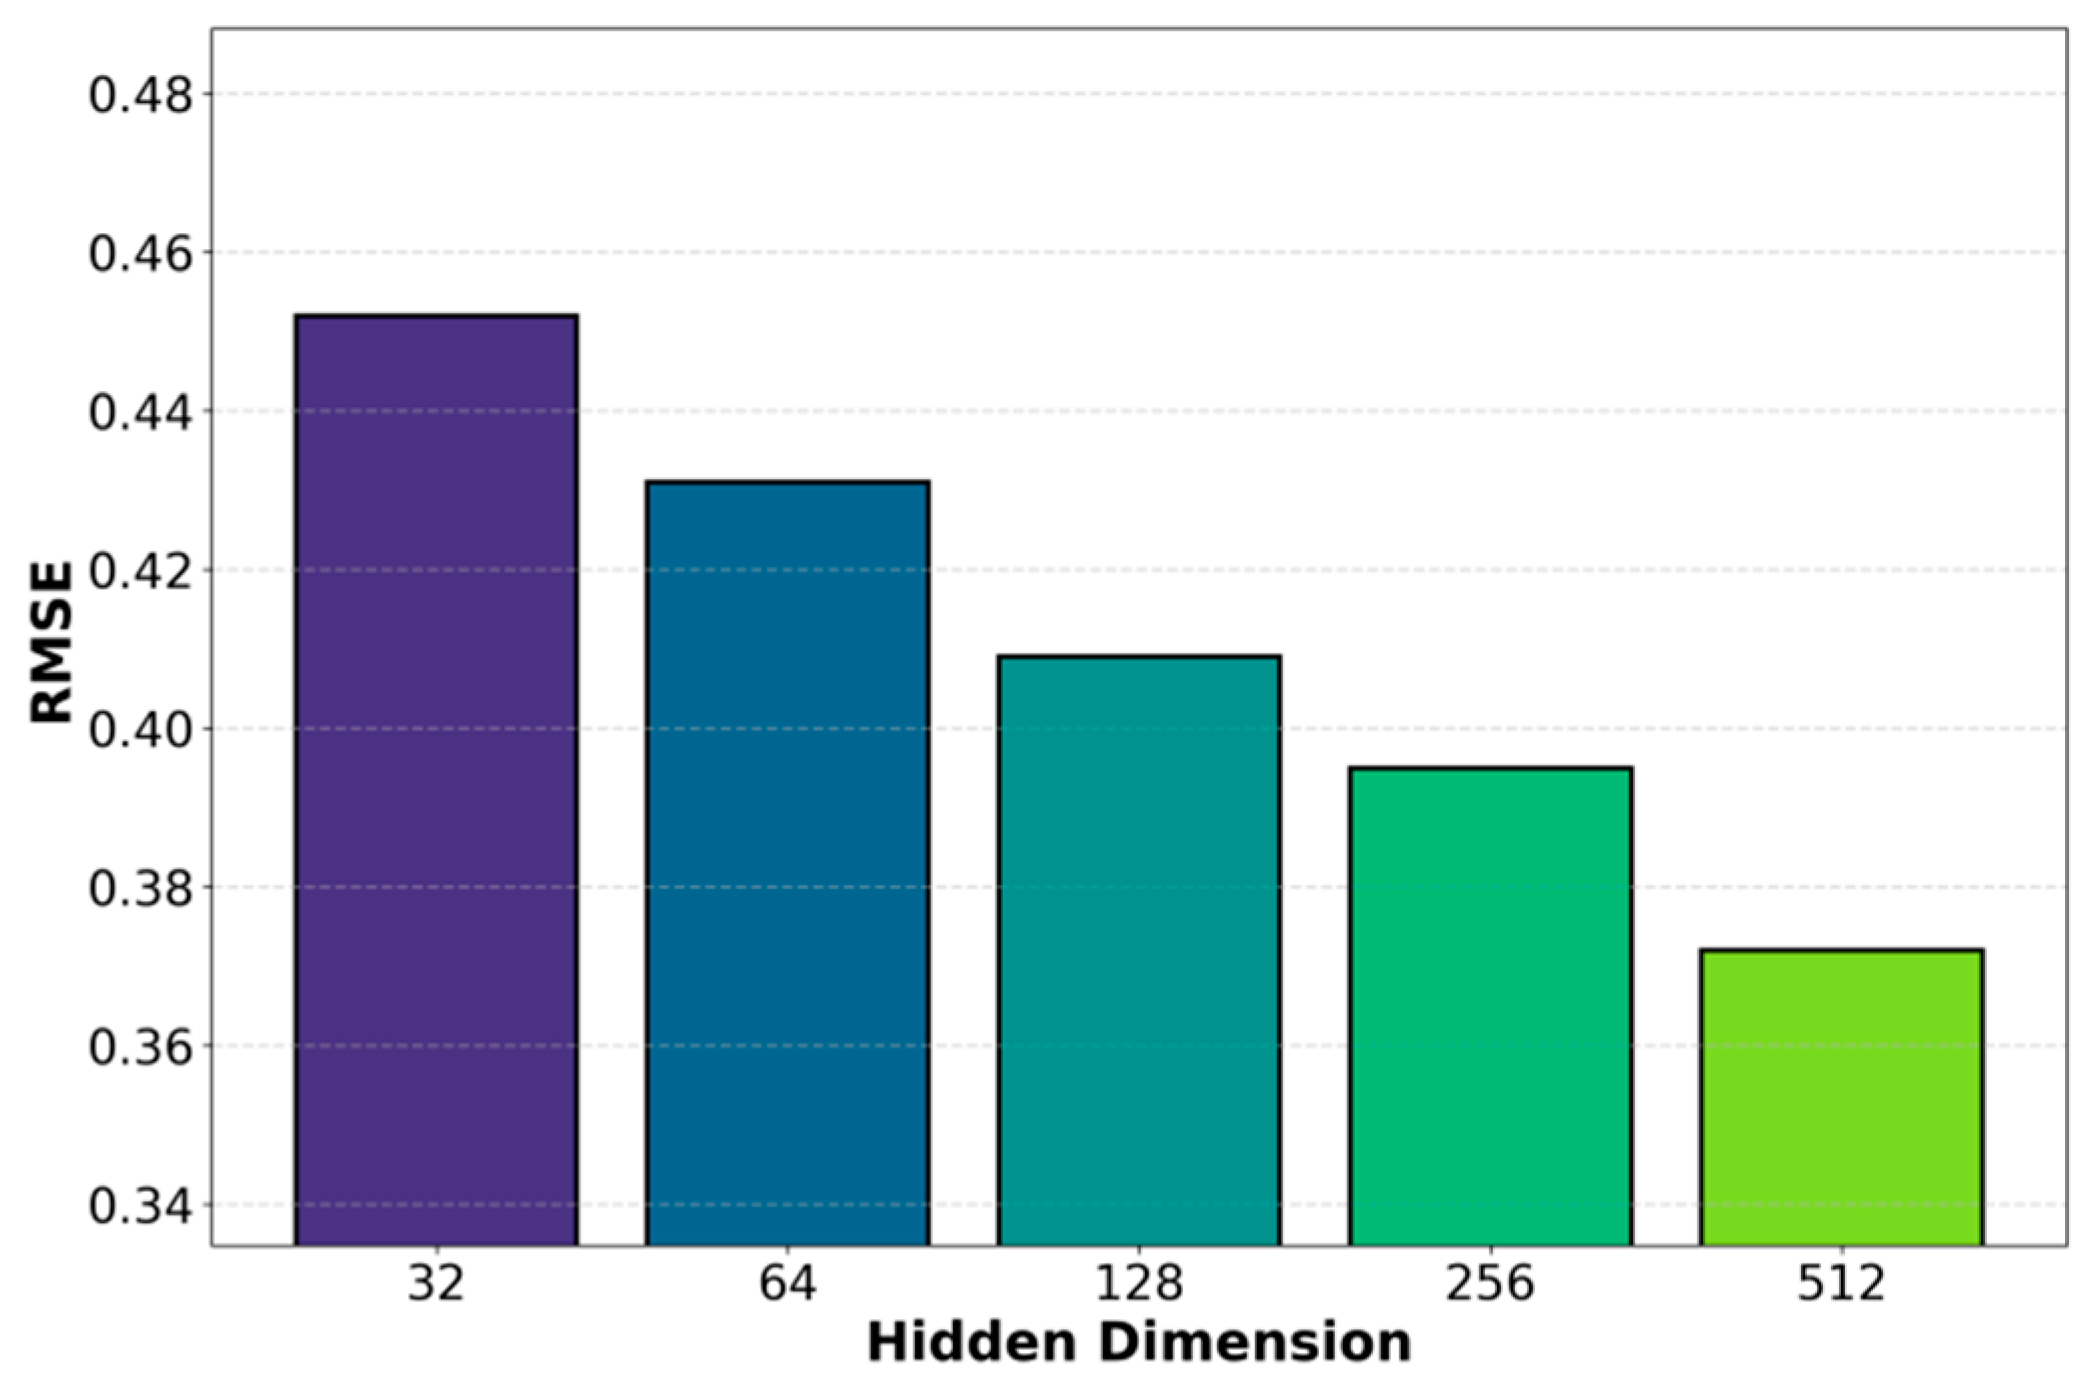
As the hidden-layer dimension increases from 32 to 512, RMSE decreases nearly monotonically, indicating that larger representation capacity consistently improves forecasting accuracy by capturing complex dynamics, multi-scale trends, and cross-metric coupling in backend service metrics. Higher-dimensional latent spaces enhance feature extraction, stabilize state representations under volatility, and suppress noise and prediction bias, while also improving the expression of uncertainty and risk-aware behavior. Overall, larger hidden dimensions strengthen robustness to non-stationarity and distribution shifts, yielding more reliable forecasts; Figure 2 further examines the impact of service deployment scale on prediction performance.
Figure 3.
Impact of changes in the number of service instances on experimental results.
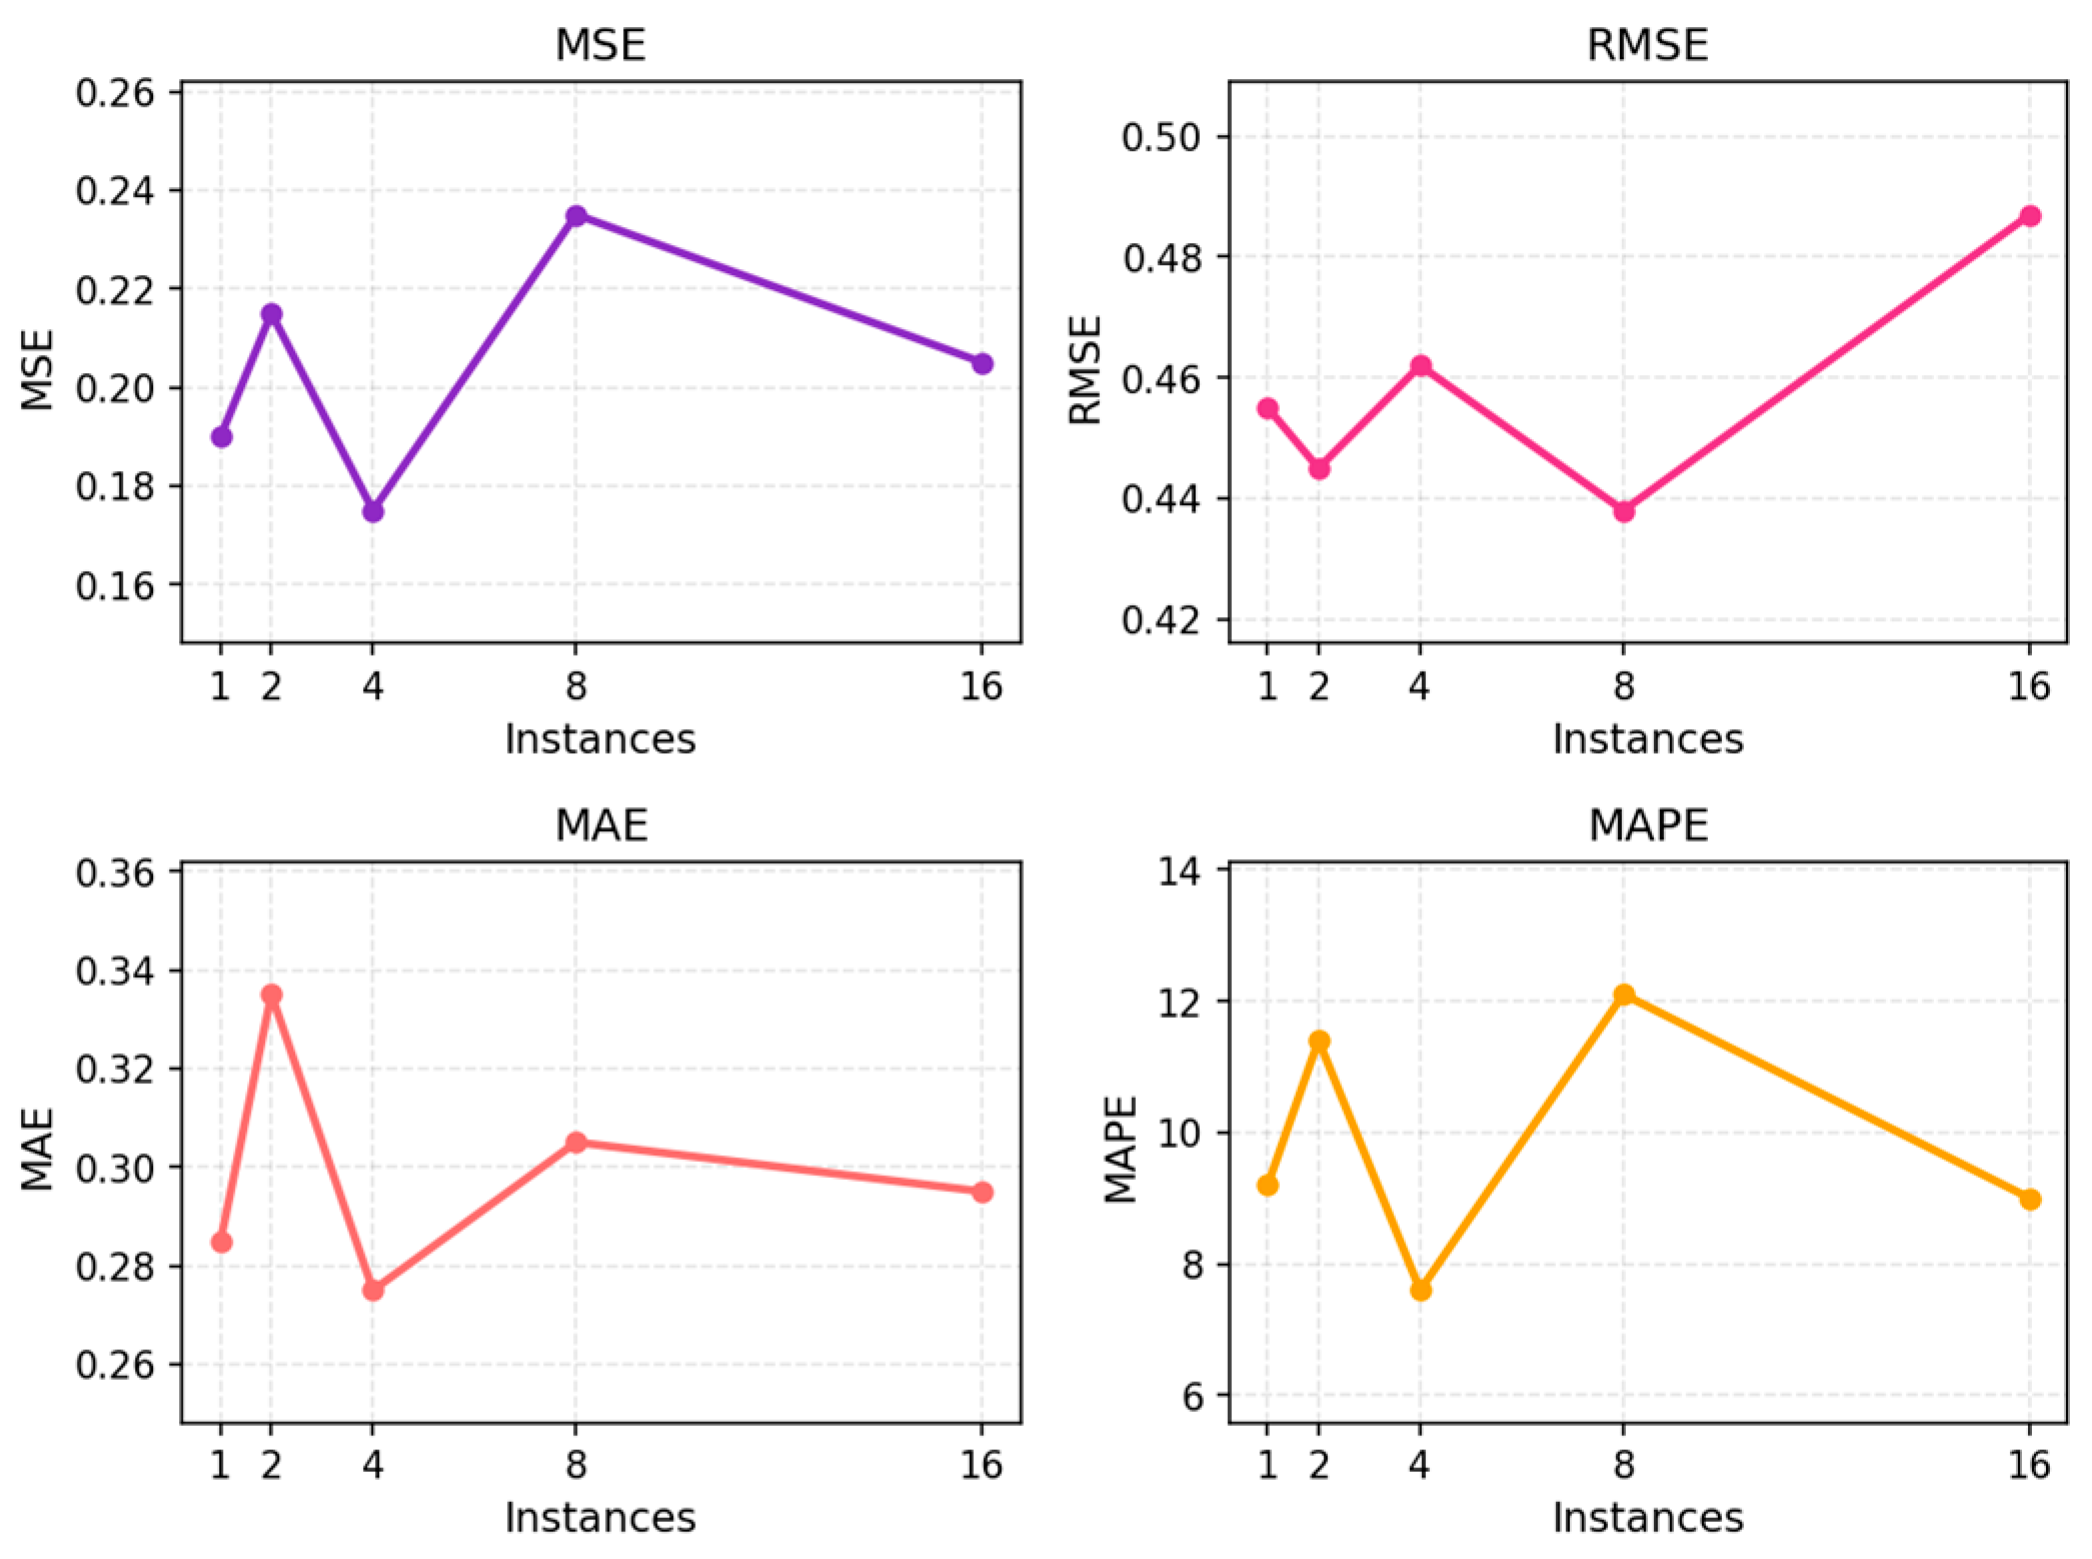
The results show that forecasting performance is highly sensitive to service instance scale. With few instances, system behavior is more stable and error metrics remain low, whereas increasing the number of instances introduces greater structural complexity and metric heterogeneity, leading to higher MSE, RMSE, MAE, and MAPE. Error fluctuations, particularly in RMSE and MAE, reflect increased uncertainty from latency propagation, load imbalance, and stronger cross-instance coupling, while MAPE highlights heightened sensitivity to relative variations across nodes. Overall, the findings indicate that instance scale significantly affects forecasting robustness and underscore the need for uncertainty-aware models to maintain stable performance under dynamic and large-scale deployments; Figure 3 further examines the impact of abnormal sample ratios on prediction accuracy.
Figure 3.
The impact of abnormal sample injection ratio on experimental results.
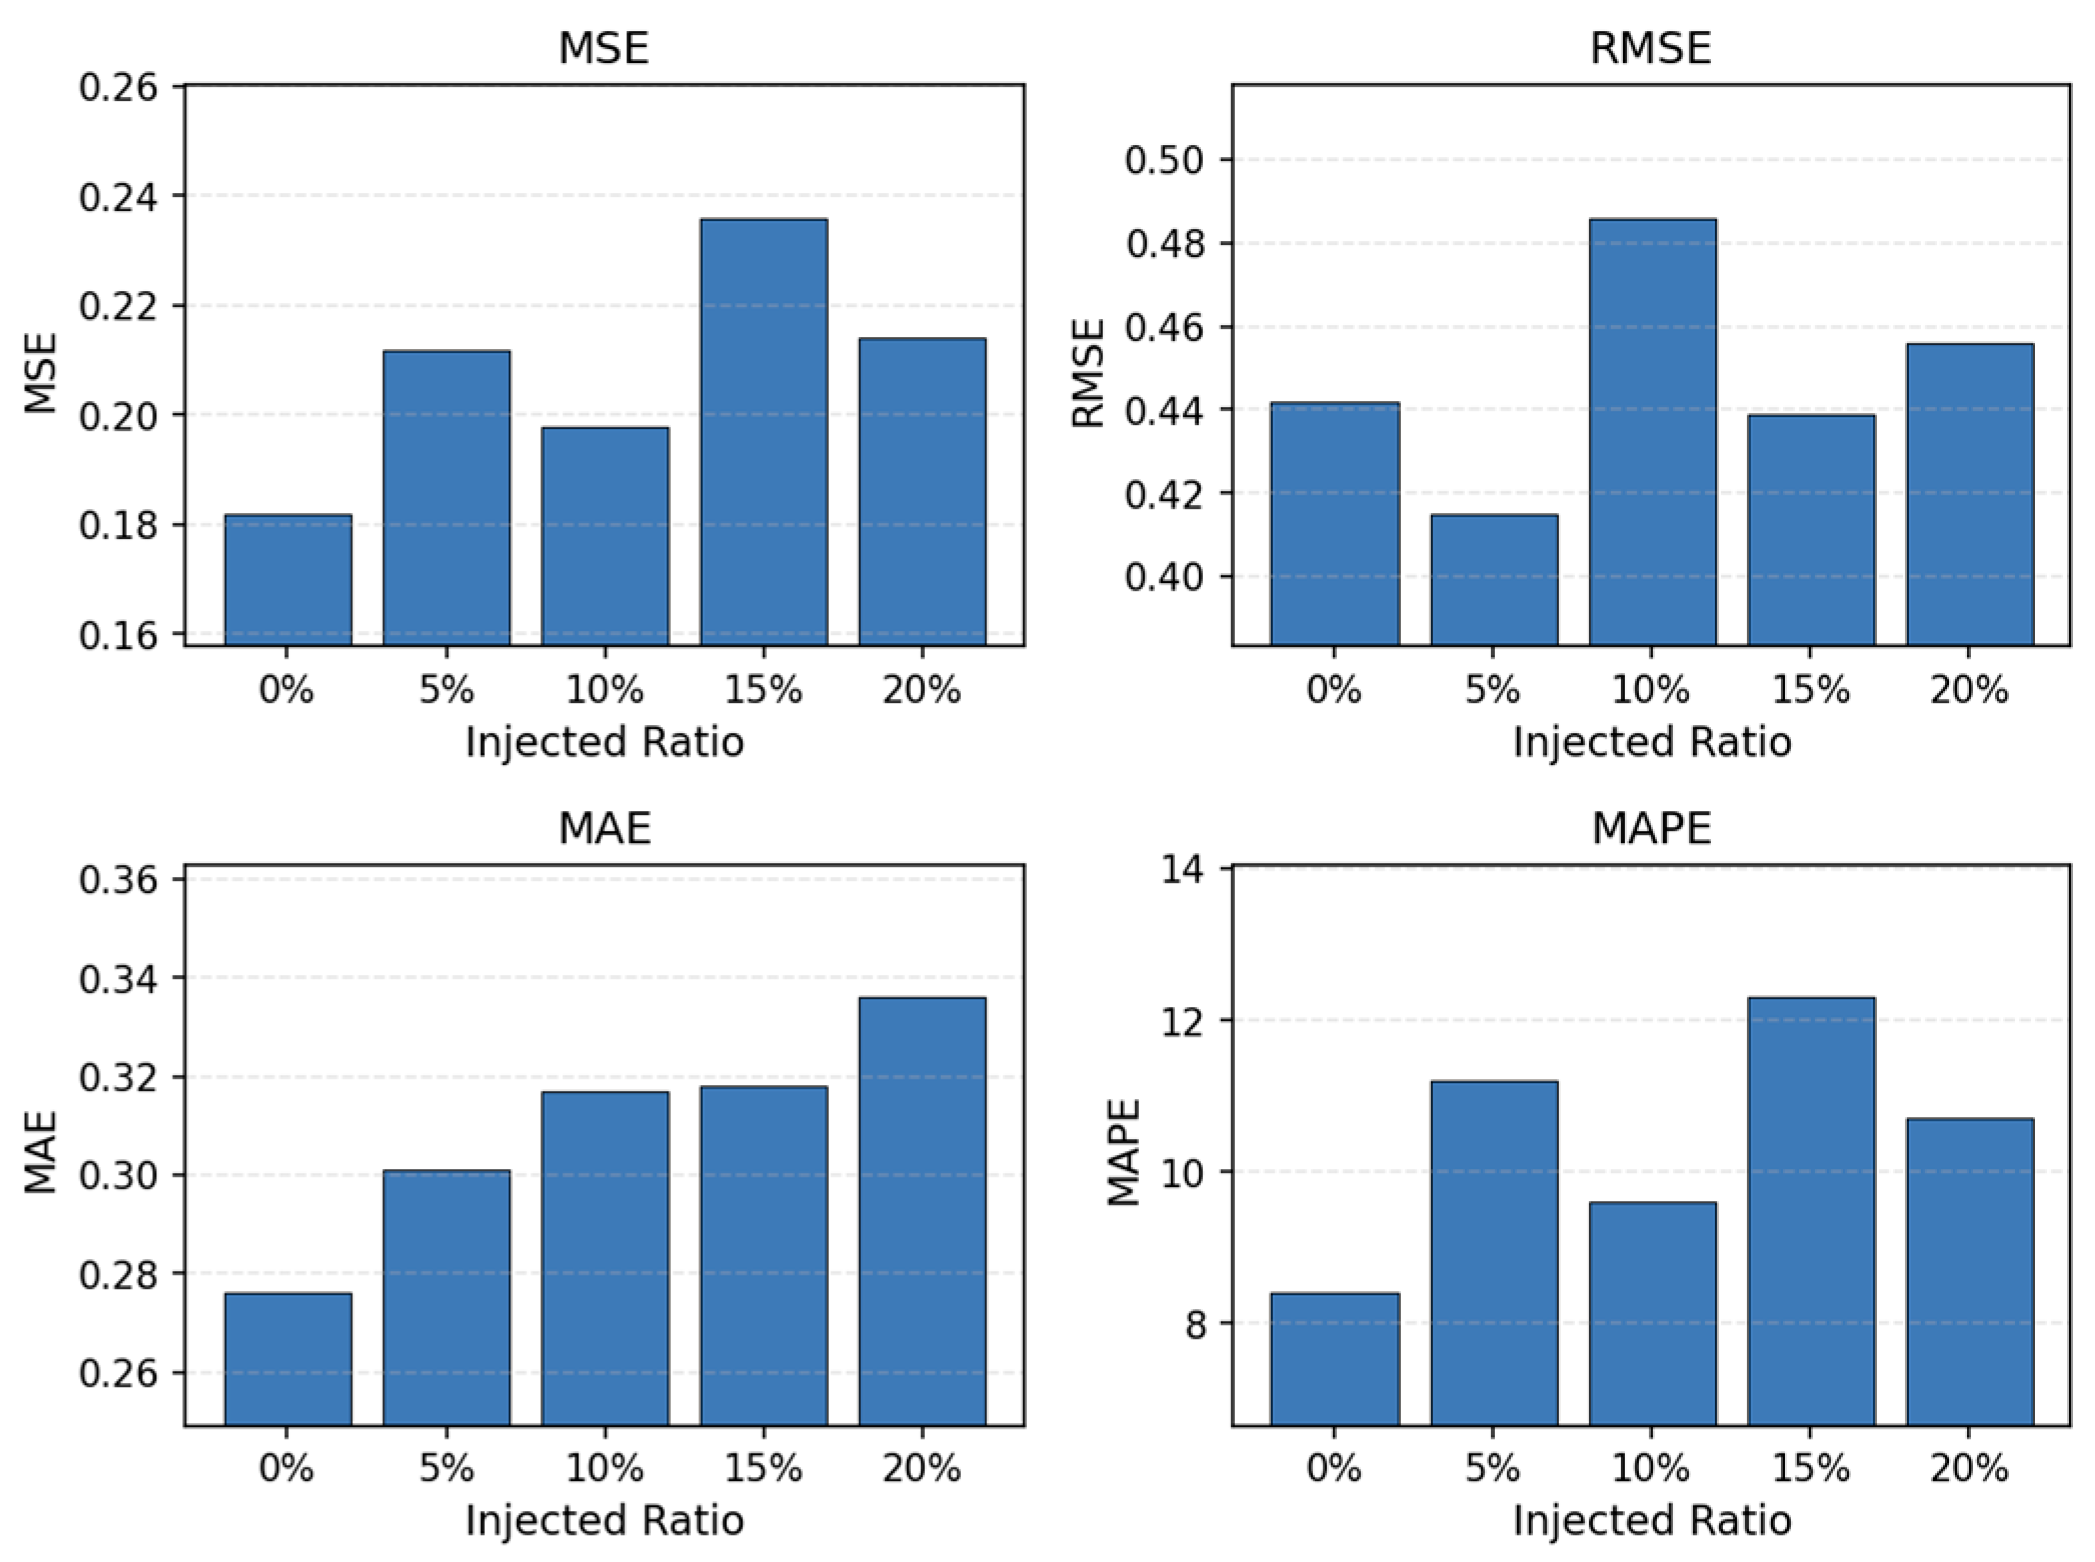
When the proportion of injected anomalous samples is raised from 0% to 20%, all four evaluation metrics become more volatile and deteriorate overall, highlighting the disruptive effect of anomalies on prediction stability. This indicates that anomalous samples introduce substantial disturbances to the distribution structure of backend service metrics. When the injection ratio is low, the system remains relatively stable. The model can rely on the original pattern structure, so the errors remain at low levels. As the proportion of anomalous samples increases, the noise components in the data are amplified. The recognizability of normal patterns declines. The model finds it more difficult to extract stable features from the input sequence. This leads to increases in MSE, RMSE, MAE, and MAPE.
The trends of multiple metrics show that anomalous samples disrupt the continuity and consistency of time series. When the injection ratio reaches medium or high levels, the errors show noticeable peaks. This suggests that anomalous samples affect not only point predictions but also amplify error propagation through temporal dependencies. The results become more unstable under high noise conditions. During this process, the internal representations and risk estimation mechanisms of the model are disturbed. The strong fluctuations in MAPE show that relative error is particularly sensitive to anomalous samples. In complex backend systems, anomalies often appear as extreme values or abrupt changes. These characteristics directly increase relative error and make MAPE highly sensitive to changes in anomaly proportion. Overall, this experiment shows that anomalous samples are a key factor affecting the robustness of backend metric forecasting. It highlights the importance of incorporating uncertainty estimation, noise response mechanisms, and risk adjustment modules into model design. These components help ensure more stable and controllable predictive behavior under anomalous disturbances.
V. CONCLUSION
This study proposes a robust forecasting framework for backend service metrics based on uncertainty estimation. The framework improves predictive reliability in complex dynamic environments through multi-level structural modeling, distributed risk representation, and noise response mechanisms. The method builds more resilient representations under multiple source disturbances, load fluctuations, and structural changes. It significantly reduces prediction bias and provides trustworthy decision support for scheduling, resource management, and anomaly suppression in highly dynamic systems. The experimental results show that the framework captures structural features of multivariate metrics stably. It also mitigates the impact of uncertainty through a risk adjustment module. This demonstrates the potential of robust forecasting in system-level tasks.
As backend systems continue to scale, service deployment structures, load patterns, and metric distributions show stronger non-stationarity and heterogeneity. The proposed framework offers a feasible way to address these challenges. It introduces uncertainty modeling into traditional time series forecasting. The model, therefore, evolves from a simple predictor into a decision support tool that provides both predictions and risk information. This approach helps the system identify high-risk situations, adjust resource planning dynamically, and improve the stability of automated operations and service governance. The framework also has minimal intrusiveness to real deployment environments. It adapts to different backend architectures and offers strong engineering practicality.
Future work can extend uncertainty estimation to more complex distribution settings, such as multi-domain transfer scenarios, cross-service collaborative forecasting, and online adaptive control. It is also possible to explore enhanced versions that integrate reinforcement learning, causal inference, or graph-based modeling. Such extensions would allow the model to not only identify risks but also select optimal strategies under high uncertainty. With the development of intelligent operations and autonomous management architectures, robust forecasting systems will play a greater role in cloud native platforms, automatic scaling, intelligent fault prevention, and large-scale service network optimization. They will provide essential technical foundations for building more reliable, efficient, and adaptive computing infrastructures.
References
- T. H. Yoon, Y. Park, E. K. Ryu, et al., "Robust probabilistic time series forecasting," Proceedings of the International Conference on Artificial Intelligence and Statistics, PMLR, pp. 1336-1358, 2022.
- V. Jensen, F. M. Bianchi and S. N. Anfinsen, "Ensemble conformalized quantile regression for probabilistic time series forecasting," IEEE Transactions on Neural Networks and Learning Systems, vol. 35, no. 7, pp. 9014-9025, 2022. [CrossRef] [PubMed]
- M. Zaffran, O. Féron, Y. Goude, et al., "Adaptive conformal predictions for time series," Proceedings of the International Conference on Machine Learning, PMLR, pp. 25834-25866, 2022.
- Q. Tan, M. Ye, A. J. Ma, et al., "Explainable uncertainty-aware convolutional recurrent neural network for irregular medical time series," IEEE Transactions on Neural Networks and Learning Systems, vol. 32, no. 10, pp. 4665-4679, 2020. [CrossRef] [PubMed]
- V. Z. Zheng and L. Sun, "Multivariate probabilistic time series forecasting with correlated errors," Advances in Neural Information Processing Systems, vol. 37, pp. 54288-54329, 2024.
- L. Domingo, M. Grande, F. Borondo, et al., "Quantifying the Uncertainty of Reservoir Computing: Confidence Intervals for Time-Series Forecasting," Mathematics, vol. 12, no. 19, p. 3078, 2024. [CrossRef]
- A. Upadhaya, J. S. Telle, S. Schlüters, et al., "A Robust Approach to Extend Deterministic Models for the Quantification of Uncertainty and Comprehensive Evaluation of the Probabilistic Forecasting," International Journal of Energy Research, vol. 2025, no. 1, p. 4460462, 2025. [CrossRef]
- K. Gao, Y. Hu, C. Nie and W. Li, "Deep Q-Learning-Based Intelligent Scheduling for ETL Optimization in Heterogeneous Data Environments," arXiv preprint arXiv:2512.13060, 2025. arXiv:2512.13060.
- W. C. Chang, L. Dai and T. Xu, "Machine Learning Approaches to Clinical Risk Prediction: Multi-Scale Temporal Alignment in Electronic Health Records," arXiv preprint arXiv:2511.21561, 2025. arXiv:2511.21561. [CrossRef]
- C. F. Chiang, D. Li, R. Ying, Y. Wang, Q. Gan and J. Li, "Deep Learning-Based Dynamic Graph Framework for Robust Corporate Financial Health Risk Prediction," 2025. [PubMed]
- Y. Hu, J. Li, K. Gao, Z. Zhang, H. Zhu and X. Yan, "TrustOrch: A Dynamic Trust-Aware Orchestration Framework for Adversarially Robust Multi-Agent Collaboration," 2025.
- X. Guo, Y. Luan, Y. Kang, X. Song and J. Guo, "LLM-Centric RAG with Multi-Granular Indexing and Confidence Constraints," arXiv preprint arXiv:2510.27054, 2025. arXiv:2510.27054.
- F. Hanrui, Y. Yi, W. Xu, Y. Wu, S. Long and Y. Wang, "Intelligent Credit Fraud Detection with Meta-Learning: Addressing Sample Scarcity and Evolving Patterns," 2025. [PubMed]
- N. Lyu, Y. Wang, Z. Cheng, Q. Zhang and F. Chen, "Multi-Objective Adaptive Rate Limiting in Microservices Using Deep Reinforcement Learning," Proceedings of the 4th International Conference on Artificial Intelligence and Intelligent Information Processing, pp. 862-869, 2025.
- Z. Qiu, F. Liu, Y. Wang, C. Hu and D. Wu, "Spatiotemporal Traffic Prediction in Distributed Backend Systems via Graph Neural Networks," arXiv preprint arXiv:2510.15215, 2025. arXiv:2510.15215. [CrossRef]
- Y. Wu, Y. Qin, X. Su and Y. Lin, "Transformer-based risk monitoring for anti-money laundering with transaction graph integration," Proceedings of the 2025 2nd International Conference on Digital Economy, Blockchain and Artificial Intelligence, pp. 388-393, 2025.
- Y. Wang, H. Liu, G. Yao, N. Long and Y. Kang, "Topology-aware graph reinforcement learning for dynamic routing in cloud networks," arXiv preprint arXiv:2509.04973, 2025. arXiv:2509.04973. [CrossRef]
- H. Zhang, L. Zhu, C. Peng, J. Zheng, J. Lin and R. Bao, "Intelligent Recommendation Systems Using Multi-Scale LoRA Fine-Tuning and Large Language Models," 2025.
- J. Lai, A. Xie, H. Feng, Y. Wang and R. Fang, "Self-Supervised Learning for Financial Statement Fraud Detection with Limited and Imbalanced Data," 2025. [PubMed]
- Z. Cheng, "Hierarchical Attention-Based Modeling for Intelligent Scheduling Delay Prediction in Complex Backend Systems," Transactions on Computational and Scientific Methods, vol. 4, no. 4, 2024.
- Y. Kang, "Deep Learning-Based Multi-Scale Temporal and Structure-Aware Modeling for Metric Anomaly Detection in Microservice Systems," Transactions on Computational and Scientific Methods, vol. 4, no. 1, 2024.
- Q. Zhang, N. Lyu, L. Liu, Y. Wang, Z. Cheng and C. Hua, "Graph Neural AI with Temporal Dynamics for Comprehensive Anomaly Detection in Microservices," arXiv preprint arXiv:2511.03285, 2025. arXiv:2511.03285. [CrossRef]
- A. Lazcano, M. A. Jaramillo-Morán and J. E. Sandubete, "Back to basics: The power of the multilayer perceptron in financial time series forecasting," Mathematics, vol. 12, no. 12, p. 1920, 2024. [CrossRef]
- Y. Fan, Q. Tang and Y. Guo, "BiLSTM-MLAM: A Multi-Scale Time Series Prediction Model Based on Bi-LSTM and Local Attention Mechanism," 2024.
- J. Nguinabé, R. Rockefeller, N. M. Khan, et al., "Bootstrap prediction intervals for the long short term memory (LSTM) recurrent neural network," Expert Systems with Applications, p. 127728, 2025.
- B. Tang and D. S. Matteson, "Probabilistic transformer for time series analysis," Advances in Neural Information Processing Systems, vol. 34, pp. 23592-23608, 2021.
Figure 1.
Overall model architecture diagram.
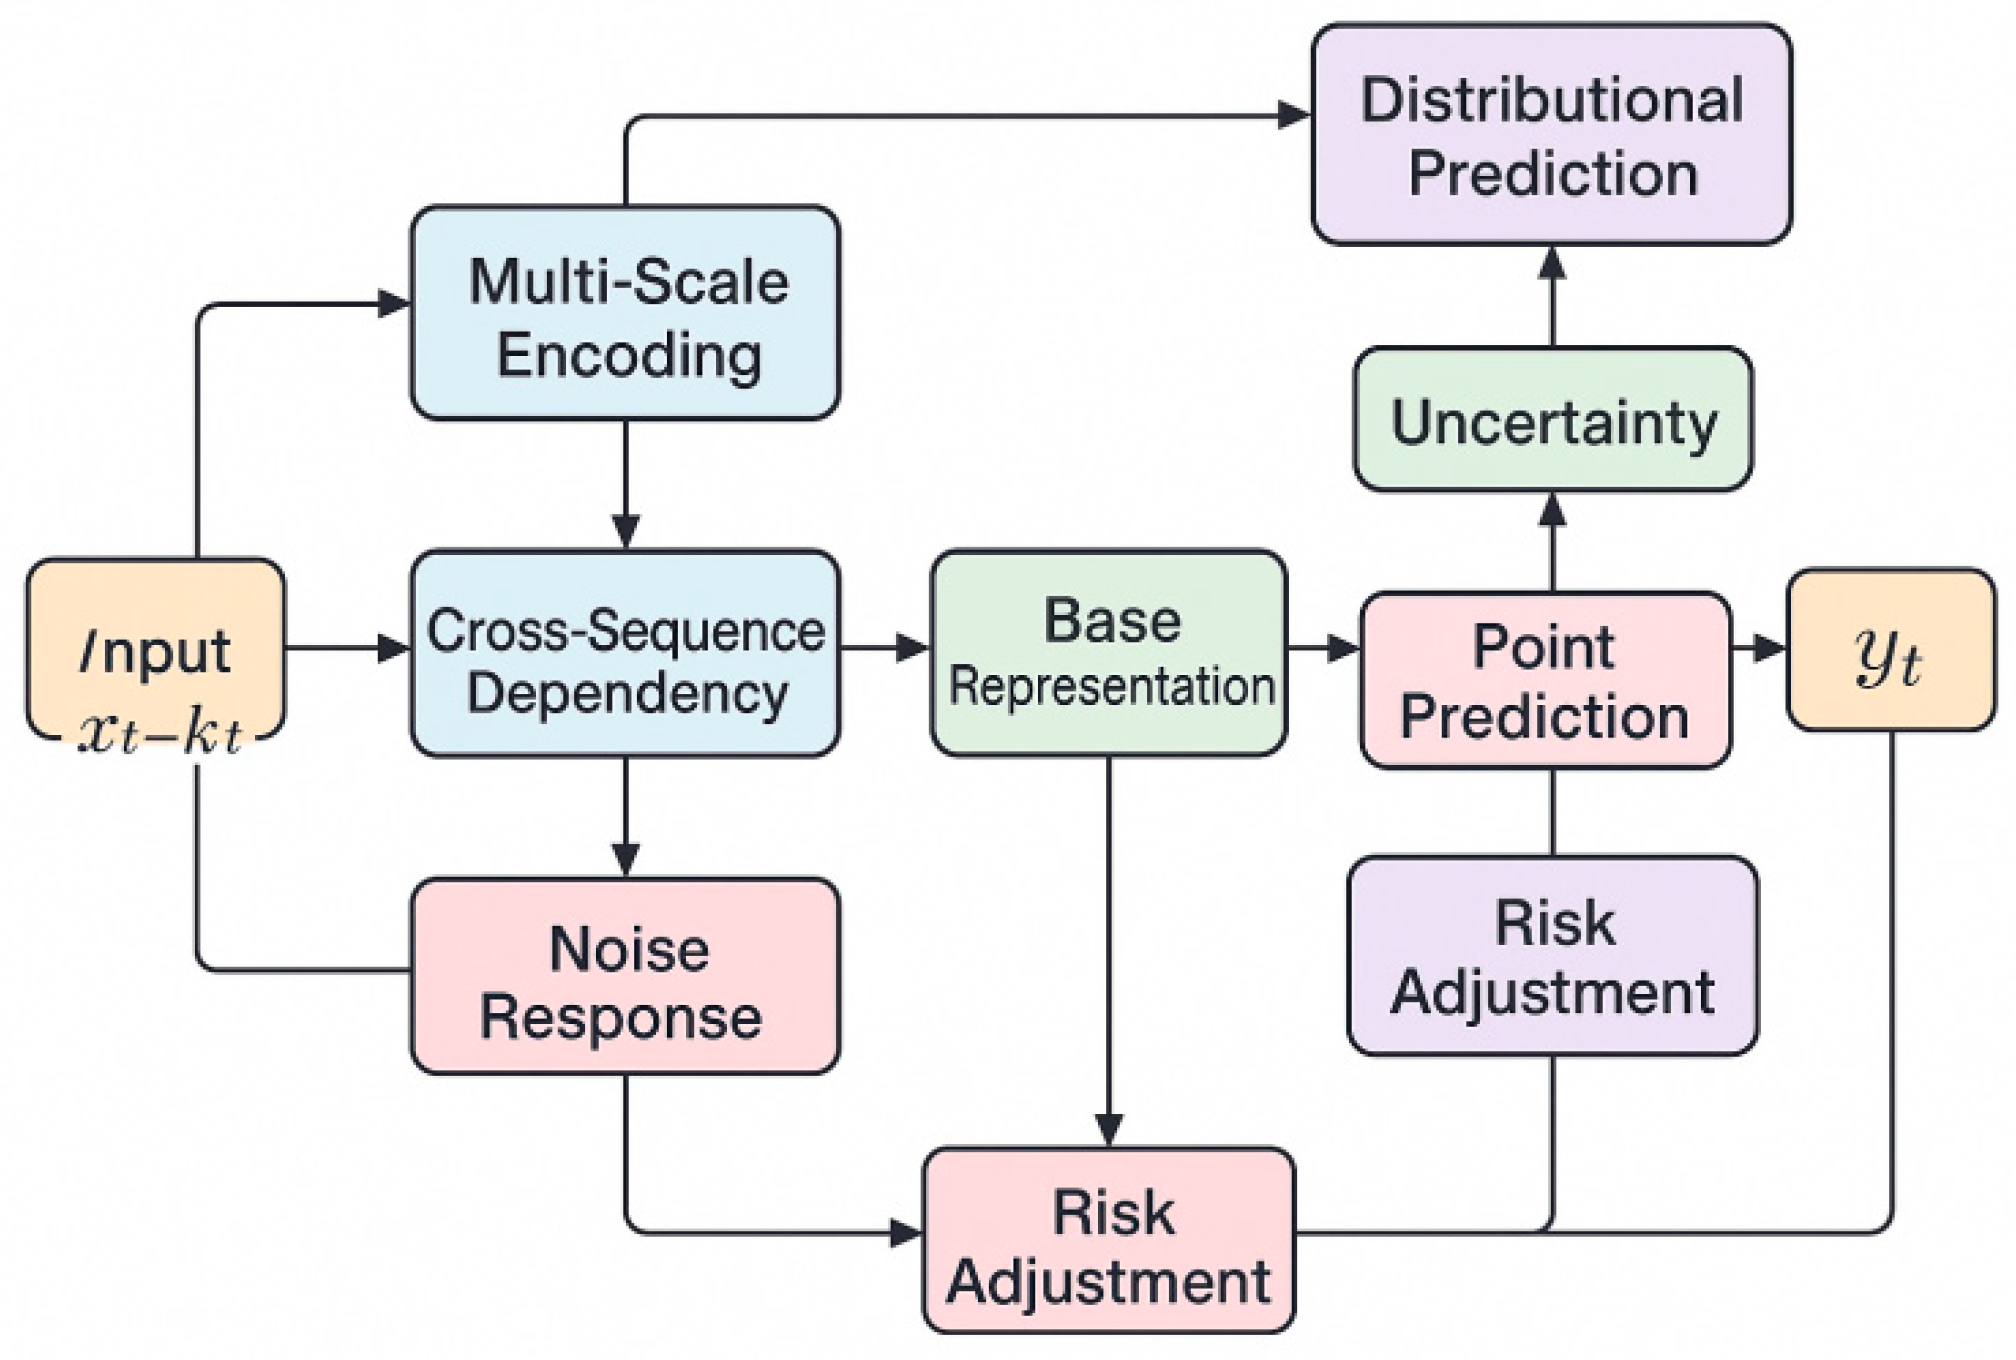
Figure 2.
Hyperparameter sensitivity experiment of hidden layer dimension size on the prediction RMSE of backend service metrics.
Figure 2.
Hyperparameter sensitivity experiment of hidden layer dimension size on the prediction RMSE of backend service metrics.

Disclaimer/Publisher’s Note: The statements, opinions and data contained in all publications are solely those of the individual author(s) and contributor(s) and not of MDPI and/or the editor(s). MDPI and/or the editor(s) disclaim responsibility for any injury to people or property resulting from any ideas, methods, instructions or products referred to in the content. |
© 2026 by the authors. Licensee MDPI, Basel, Switzerland. This article is an open access article distributed under the terms and conditions of the Creative Commons Attribution (CC BY) license (http://creativecommons.org/licenses/by/4.0/).
Copyright: This open access article is published under a Creative Commons CC BY 4.0 license, which permit the free download, distribution, and reuse, provided that the author and preprint are cited in any reuse.


