Submitted:
27 January 2026
Posted:
28 January 2026
You are already at the latest version
Abstract
Background/Objectives: This study evaluated the influence of key biomechanical pa-rameters—orthodontic force magnitude, loading direction, and insertion depth—on stress and strain distribution in orthodontic mini-implants using three-dimensional fi-nite element analysis (FEM). Methods: A three-dimensional model of a titanium or-thodontic mini-implant inserted into a mandibular bone segment was developed and analyzed under varying force magnitudes (1–10 N), loading directions (30°, 45°, and 60°), and insertion depths (5–7 mm). Cortical and cancellous bone components were included, and static loading conditions were applied using simplified, linear elastic material assumptions. Results: Stress and strain levels increased with higher force magnitudes, with implant stresses approaching critical values at loads above 9 N. Cor-tical bone stresses remained within physiological limits, whereas cancellous bone ex-ceeded damage thresholds at forces greater than 3 N. A 60° loading direction reduced implant bending and strain, while deeper insertion significantly decreased strain and displacement, indicating improved primary stability. Conclusions: Optimal mechani-cal behavior occurred under 1–3 N forces, 60° loading direction, and 6–7 mm insertion depth. Loads above 9 N approached fatigue and interfacial risk. These findings align with prior experimental evidence and provide quantitative guidance for.
Keywords:
anchorage stability
; finite element analysis
; insertion depth
; loading direction
; orthodontic force
; orthodontic mini-implants
; primary stability
1. Introduction
The success of orthodontic mini-implants is influenced by a complex interaction of mechanical and biological factors that affect their primary and long-term stability. Reported failure rates range from 6.9% to 28%, depending on skeletal pattern, insertion site, applied force magnitude and direction, cortical bone characteristics, and operator experience [1,2]. These variations highlight the importance of understanding the biomechanical behavior of mini-implants under different clinical conditions.
Orthodontic forces applied to mini-implants must be sufficient to achieve effective tooth movement while preserving anchorage stability. Clinically accepted force magnitudes typically range between 1 and 3 N, depending on bone quality and treatment objectives, as higher forces may increase stress concentrations and micromovements at the bone–implant interface [3,4].
Insertion angle plays a critical biomechanical role by influencing bending moments, load transfer mechanisms, and the extent of cortical bone engagement. Finite element studies have commonly investigated insertion angles of 30°, 45°, and 60°, as these represent frequently used clinical ranges. Several authors have reported increased stress concentrations at lower angulations due to larger bending moments acting at the implant neck [5,6,7], whereas more vertical orientations tend to reduce bending and enhance stability [8]. However, the reported magnitude and clinical relevance of these effects vary among studies.
In addition to insertion angle, cortical bone thickness and insertion depth are key determinants of mini-implant stability. A minimum cortical thickness of approximately 1.0 mm has been suggested for adequate primary stability, while increased cortical engagement and deeper insertion have been associated with improved anchorage and reduced failure risk [9,10,11].
Therefore, a comprehensive parametric evaluation integrating orthodontic force magnitude, loading direction, and insertion depth within a unified three-dimensional finite element framework is needed to better clarify their combined influence on mini-implant biomechanics. Finite element modeling provides a powerful, non-invasive approach for systematically analyzing stress and strain distributions under controlled conditions.
Accordingly, the aim of the present study is to investigate the combined effects of orthodontic force magnitude, loading direction, and insertion depth on stress and strain distribution in orthodontic mini-implants and surrounding bone using three-dimensional finite element analysis.
2. Materials and Methods
2.1. Geometric Modeling
A commercially available titanium mini-implant (Ti-6Al-4V) with a diameter of 2.0 mm and a length of 12 mm (Jeil Medical Corporation, Seoul, South Korea) was modeled using the finite element method (FEM) (Figure 1a). The mini-implant featured a threaded portion of approximately 8 mm, allowing insertion depths ranging between 2 and 4 mm, as analyzed in the present study.
The mandibular geometry was obtained from computed tomography (CT) scans (DEXIS, Biberach, Germany) and digitized to generate a three-dimensional solid model (Figure 1b). Both the mini-implant and the mandible were reconstructed and assembled using SpaceClaim 2023.1 software (ANSYS Inc., Canonsburg, Pennsylvania, USA).
2.2. Simulation Parameters
The insertion site of the mini-implant was selected in the interradicular space between the premolar and molar regions. The complete model was imported into ANSYS Workbench (version 2021, ANSYS Inc., Canonsburg, PA, USA) for analysis.
The geometry was discretized using 10-node tetrahedral structural elements with automatic meshing. All components—bone, teeth, periodontal ligament, and implant—were assumed to be homogeneous, isotropic, and linearly elastic (Figure 2). These assumptions are commonly adopted in orthodontic finite element studies to reduce computational complexity and to enable controlled comparison of relative stress and strain trends across parametric conditions.
2.3. Boundary Conditions and Loading
The lower region of the cortical bone was fully constrained to prevent rigid body motion, simulating fixation to the remaining mandibular structure. A nonlinear contact was defined between the mini-implant threads and the surrounding bone, allowing for separation under tensile load and compression transfer through the interface. Orthodontic forces ranging from 1 N to 10 N were applied at the mini-implant head, following three different loading directions (30°, 45°, and 60° relative to the implant’s longitudinal axis) to replicate clinically relevant conditions. The loading point corresponded to the area where the orthodontic wire or spring would typically exert force in vivo.
In finite element models of orthodontic mini-implants, cortical bone thickness is a critical parameter influencing stress distribution and implant stability. For mandibular simulations, cortical bone thickness values commonly range between 2 and 3 mm, reflecting the greater cortical density and thickness of mandibular bone reported in the literature [12,13].
2.4. Mesh Convergence and Model Validation
A mesh convergence test was conducted to ensure numerical accuracy and independence of the results from the element size. The element size was gradually refined until the variation in maximum von Mises stress was less than 5% between successive refinements. The final model contained approximately 300,000 to 400,000 tetrahedral elements, depending on the analyzed configuration.
2.5. Post-Processing and Evaluation Parameters
The simulations were performed using ANSYS Workbench 2021 (ANSYS Inc., USA) under static structural analysis. The results were evaluated in terms of:
- • Von Mises equivalent stress (σvM) in the implant and surrounding bone,
- • Total displacement (U) at the implant head,
- • Contact pressure distribution at the bone–implant interface.
The obtained data were analyzed to identify areas of maximum stress concentration and to assess the influence of biomechanical parameters on implant stability and load transfer efficiency
2.6. Model Verification
No direct experimental validation was performed. The present model was verified through quantitative comparison with existing FEM studies using similar geometries and force ranges. Accordingly, the results should be interpreted as relative biomechanical trends rather than absolute clinical predictions.
3. Results
3.1. Contact Pressure and Interface Behavior
In Figure 3, the regions of contact between the mini-implant and bone are illustrated. The distribution of contact pressure is shown in Figure 3(a), with a maximum value of 5.1 MPa.In Figure 3(b), the contact status map shows how the mini-implant interacts with the cortical bone. The “sticking” zones are mainly located along the upper and middle threads, where full contact and efficient load transfer occur. The “Max” area appears near the implant neck, indicating the highest contact pressure, while the “Min” zones toward the tip show reduced contact. Small “sliding” regions suggest minor micromovements under load. These patterns confirm that most of the stress is transferred through the upper threads, helping to maintain primary stability during orthodontic loading.
This contact pressure distribution is useful for evaluating the stability and efficiency of orthodontic anchorage, providing information on the distribution of forces and pressures at the contact interface. The analysis highlights the nature and extent of contact between the mini-implant and the bone, identifying possible regions of overload or deformation. Evaluating these aspects is essential for ensuring stable and durable orthodontic anchorage throughout treatment.
3.2. Influence of Orthodontic Force
In Figure 4(a), the total displacements in the cross-section of the anchorage area—including the mini-implant, cancellous bone, and cortical bone—are shown. The maximum displacement recorded was 0.028948 mm at the head of the mini-implant near the site of orthodontic force application.
In Figure 4(b), the equivalent von Mises stress distribution in section view is presented. The maximum value of 80.682 MPa was observed near the orthodontic anchorage at a depth of 1.2 mm in the cancellous bone, with the highest stress located within the mini-implant. The affected bone volume is small, and the volume of affected cortical bone is slightly larger due to its higher stiffness.
Figure 4(c) shows the equivalent strain distribution in the section. The maximum equivalent strain was 0.0065382 mm/mm near the orthodontic anchorage, at a depth of 0.6 mm in the cortical bone. The affected region is concentrated around the implant anchorage, with a higher proportion in the cortical bone, which has a lower elongation at fracture than cancellous bone. However, these maximum values are localized within a very small volume of material, adjacent to the mini-implant thread.
3.2.1. Influence of Force Magnitude
In Figure 5, the graph shows the maximum equivalent von Mises stress in the global mini-implant model as a function of loading force. The maximum recorded value was 486.9 MPa in the most highly stressed and the minimum value was 50.466 MPa for a 1 N load. The graph indicates that the yield strength of the implant material is exceeded for forces above 9 N, suggesting that loads should remain below this threshold during orthodontic treatment. Considering that fatigue strength is typically lower than yield strength, the allowable load should be even smaller.
3.2.2. Influence of Force Application Angle
3.2.2.1. Total Displacement
Figure 6 presents the total deformation state of the mini-implant under three force application angles (30°, 45°, and 60°).
The total deformation of the mini-implant decreased progressively as the force application angle increased from 30° to 60°. The maximum displacement was observed at 30° (0.0328 mm), while the smallest deformation occurred at 60° (0.0267 mm). This reduction in displacement indicates that higher loading angles generate a more favorable stress distribution, lowering bending effects on the implant neck and enhancing overall mechanical stability under orthodontic loading.
Figure 7 shows that the deformation of the mini-implant changes slightly with the direction of the applied orthodontic force. The highest value was recorded at 45°, while both 30° and 60° produced lower and more stable responses. This suggests that when the force is applied at a higher angle, the load is better distributed along the implant threads, reducing bending and improving overall stability.
3.2.2.2. Equivalent von Mises Stress
In Figure 8 the stress distribution for the three loading angles is presented. The maximum stress value (80.682 MPa) occurred at 30°, and the minimum (54.066 MPa) at 60°. The stress distribution patterns were similar across all cases, with the maximum localized at the same point. However, at 60°, the stress values across both the bone and implant were lower.
As illustrated in Figure 9, the stress in the mini-implant decreased as the force angle increased. The highest stress occurred at 30°, while at 60° the values were noticeably lower, indicating that higher loading angles help distribute the load more evenly and reduce concentration of stress near the implant neck.
3.2.2.3. Equivalent Strain
Figure 10 shows the equivalent linear strain for the three loading angles. The maximum strain (0.0065382 mm/mm) was obtained for a 30° force, and the minimum (0.0058778 mm/mm) for 60°. As with stress, strain patterns were similar across models, with lower strain levels at higher loading angles.
As shown in Figure 11, the strain values gradually decreased as the force angle increased. The highest strain appeared at 30°, and the lowest at 60°, indicating that higher angles help distribute the load more evenly and reduce deformation around the mini-implant.
3.3. Influence of Mini-Implant Insertion Depth
3.3.1. Total Displacement
As the mini-implant is inserted deeper, its movement under load becomes smaller, indicating greater stability. This trend emphasizes the importance of sufficient insertion depth for minimizing deformation and maintaining secure anchorage during orthodontic treatment.
Figure 12 shows the total deformation in the mini-implant depending on insertion depth (2 mm, 3 mm, and 4 mm). Larger deformations occur for shallower insertion depths, as the effective lever arm of the orthodontic force increases.
As shown in Figure 13, total displacement decreased as insertion depth increased. The highest movement occurred at 2 mm, while 4 mm provided the most stable result. This indicates that deeper insertion improves implant stability by reducing bending and micromovement during orthodontic loading.
3.3.2. Equivalent von Mises Stress
Figure 14 shows the von Mises stress distribution for three insertion depths. The maximum stress (138.92 MPa) was observed for 5 mm insertion, and the minimum (80.682 MPa) for 7 mm insertion. The stress patterns differ notably, with the maximum located closer to the surface for shallower insertion. A larger material volume is affected in both cortical and cancellous bone for shorter insertions.
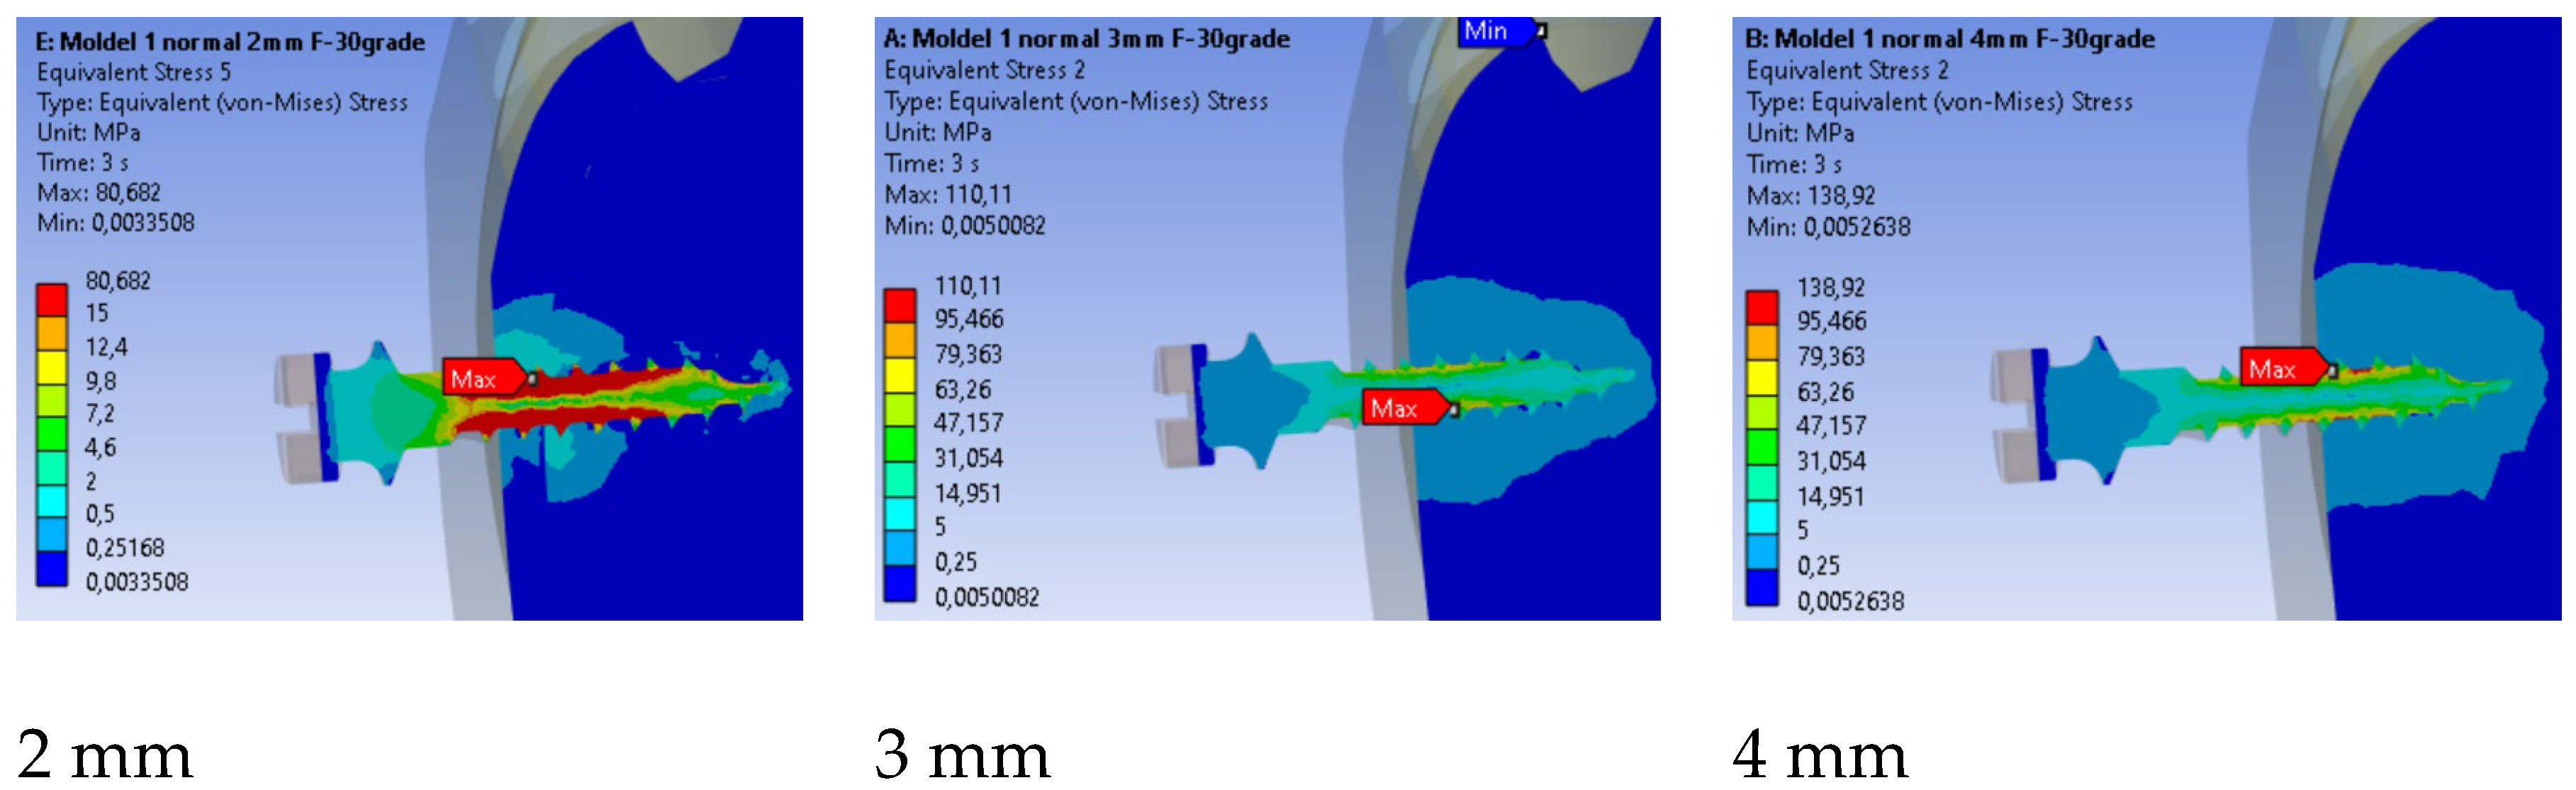
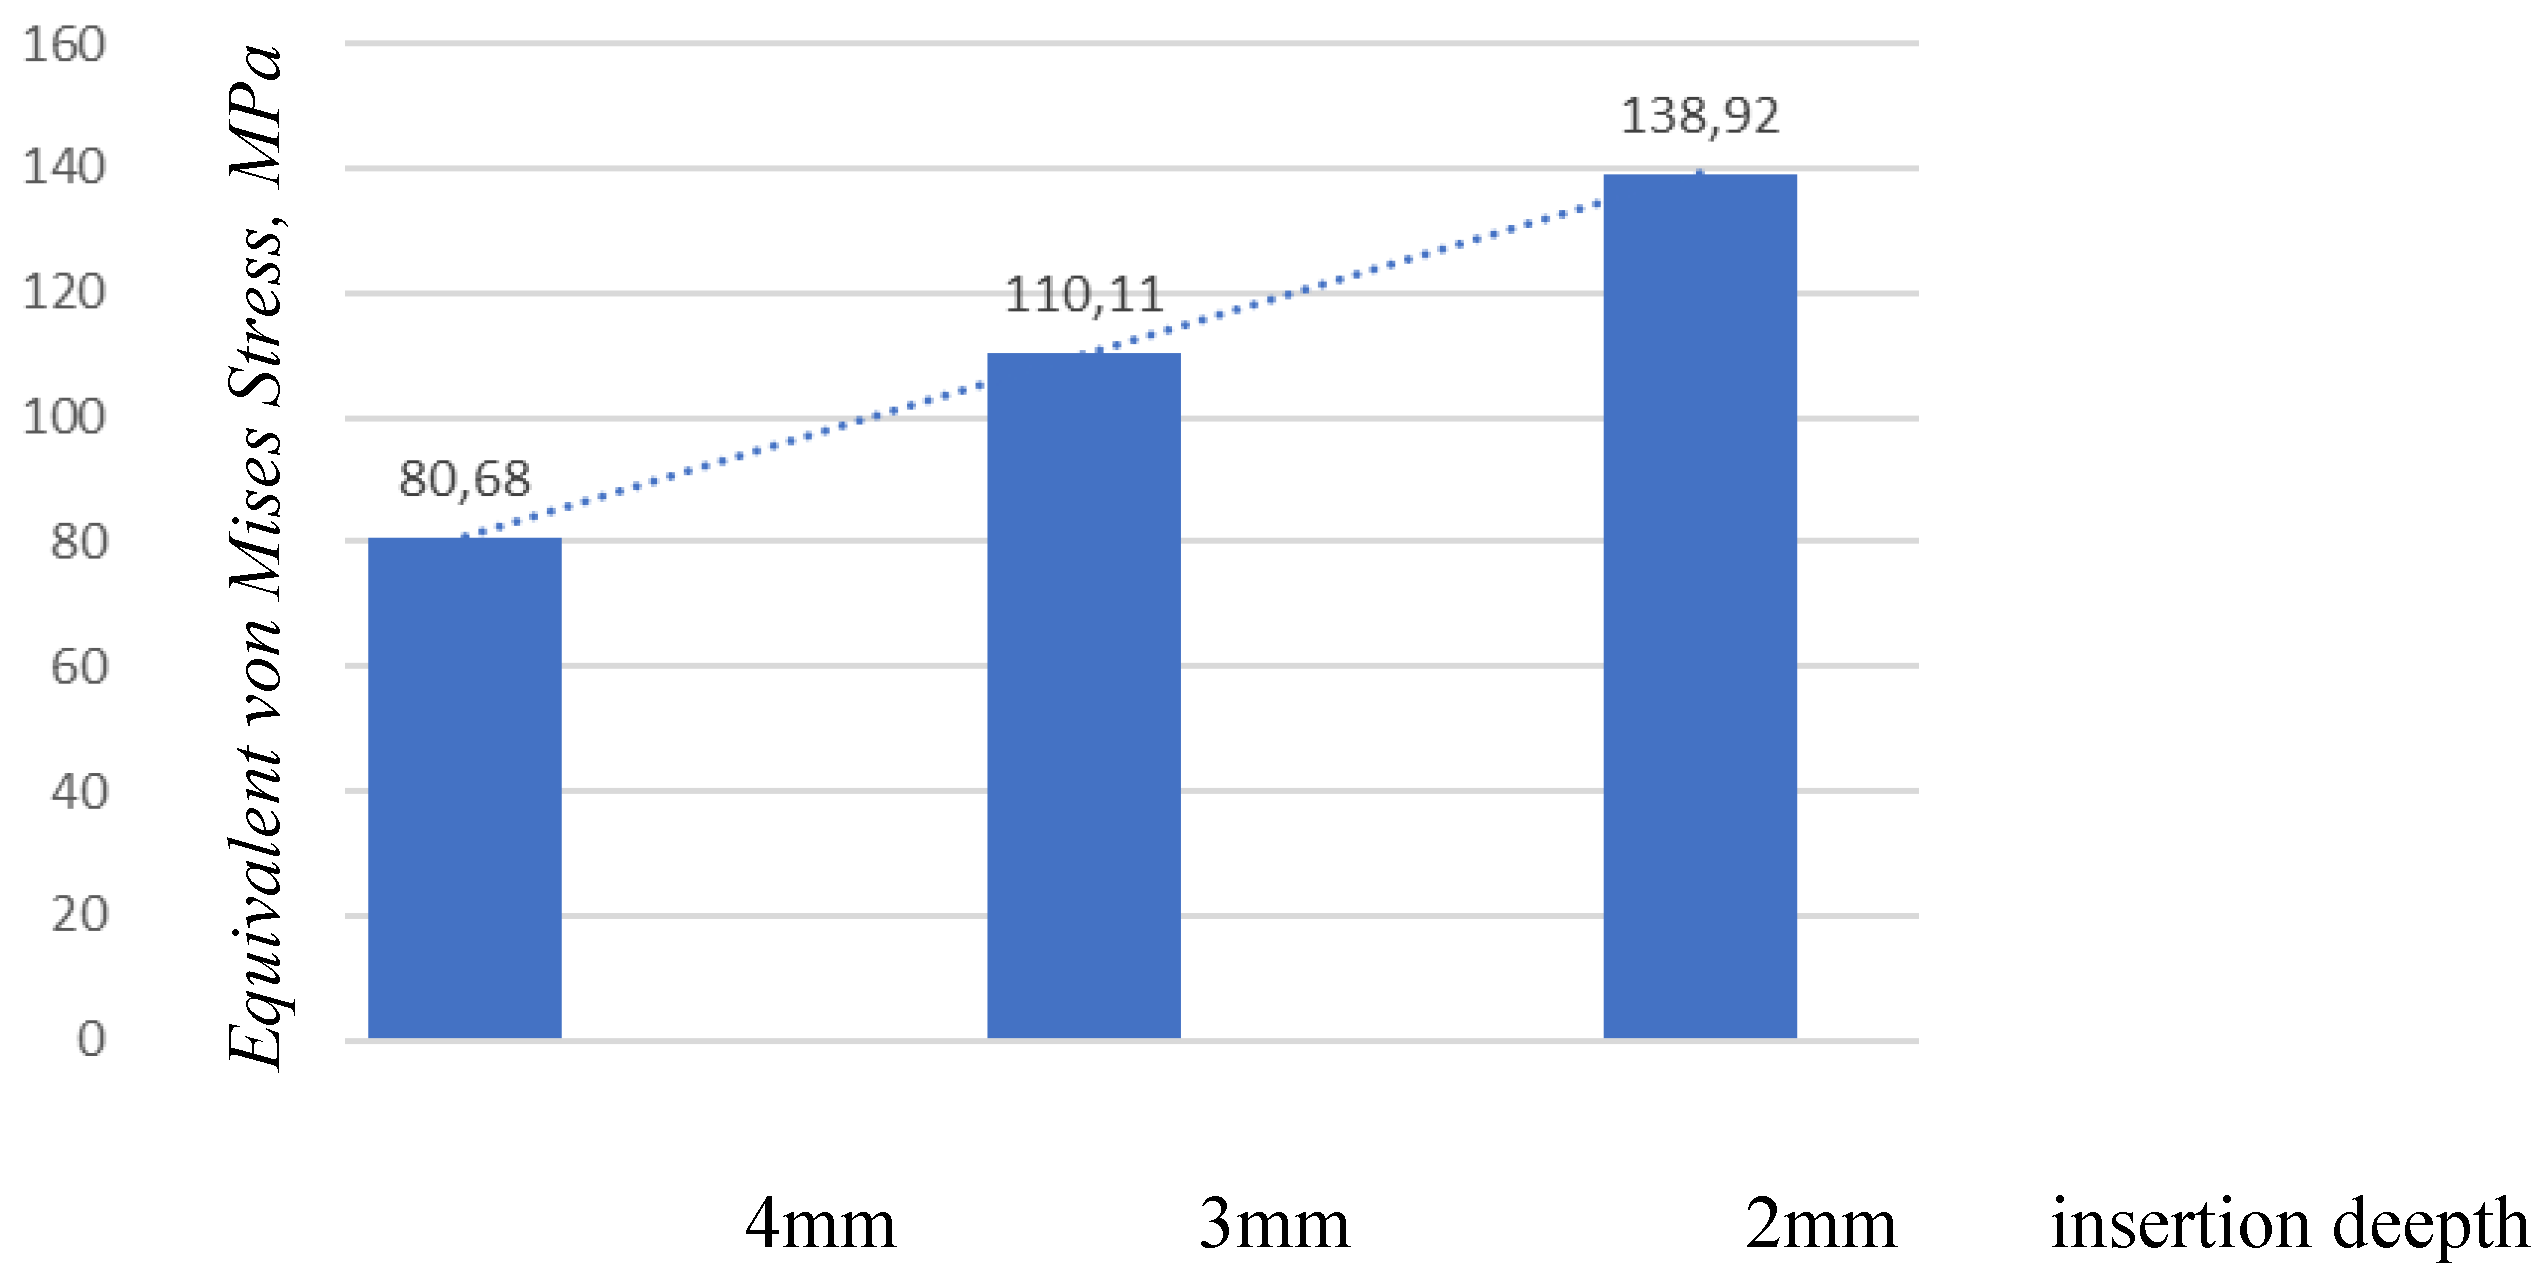
Figure 14.
Stress distribution for three insertion depths.
Figure 15.
Comparison of maximum stress values by insertion depth.
3.3.3. Equivalent Strain
The distribution of equivalent linear strain for the three insertion depths is shown in Figure 16. The maximum value obtained was 0.016497 mm/mm for the insertion depth of 2 mm, while the minimum value was 0.0065382 mm/mm for the 4 mm insertion depth. The results indicate that the equivalent strain patterns differ among all analyzed cases, with the maximum values located at different points.
4. Discussion
4.1. Contact Pressure and Interfacial Load Transfer
Our model predicted a maximum contact pressure of 5.1 MPa along the thread–cortex interface (Fig.3a-b). This value sits at the lower bound of the ranges commonly reported for titanium miniscrews in cortical bone (≈20–40 MPa reported in several FEM/experimental studies under comparable loading). Two factors likely explain this difference: (i) the contact formulation (allowing separation with compression transfer) which disperses peak pressure over a broader thread flank, and (ii) the force level actually used in clinical orthodontics (1–2 N in most scenarios).
In the context of orthodontic mini-implants, maximum contact pressures reported for titanium implants in cortical bone typically range from about 19.85 MPa to 43.34 MPa, depending on specific dimensions and loading conditions. Sivamurthy and Sundari conducted a finite element analysis that revealed stress values for mini-implants with dimensions of 1.3 × 6 mm and 1.3 × 8 mm, showing a minimum stress of 19.85 MPa and a maximum of 43.34 MPa during retraction and intrusion, which are well within the fatigue limit of titanium, approximately 193 MPa [7] (table 1). This indicates that mini-implants maintain structural integrity under typical orthodontic loads.
Zhou et al. corroborated these findings, noting that loading stress is primarily distributed in the cortical bone around the implant neck, with minimal stress in the bone around the implant root [17]. Their research highlighted this stress distribution, reinforcing the concept that it serves as a protective mechanism for the surrounding bone tissue. This is consistent with findings by Wahengbam et al., which reported that the concentration of forces in cortical bone is significant, and stresses are managed within the material limits of titanium [18].
Interestingly, another study by Sarika et al. reported that peak stress values in the bone surrounding a mini-implant under various angles of insertion varied, with maximum stress values recorded as around 5.1301 MPa in the cortical bone and up to 26.355 MPa in the mini-implant itself. This highlights the importance of implant positioning and load direction in stress distribution [19) (Table 1).
Further detailing how the application of forces affects the interface, Yazıcıoğlu et al. found that oblique loads significantly enhance interfacial stresses [19]. Their findings revealed that oblique forces could elevate these stresses by as much as 5 to 20 times compared to vertical loads. They specifically analyzed the consequences of a 300 N oblique occlusal bite force on the mini-implant, confirming high localized stress at the facial and lingual areas of the bone, which is relevant for understanding potential points of failure. Research by Lu et al. examined the impact of mini-implant characteristics—such as diameter and length—on stress levels in surrounding bone [21]. This suggests that optimizing implant dimensions may mitigate stress concentrations at the bone–implant interface. Sharma et al. explored the effects of insertion height and angulation on stress distribution at the mini-implant site [6].
The present FEM model predicted lower contact pressures (≈5.1 MPa) than previously reported ranges (≈20–40 MPa), mainly due to the nonlinear contact formulation and clinically relevant low orthodontic loads (1–2 N). Literature consensus indicates that stresses are concentrated around the implant neck and first threads, with magnitudes depending on implant geometry, insertion angle, and loading direction. This comparison reinforces that cortical bone is the dominant load-bearing region in mini-implant biomechanics.
4.2. Loading Direction: Reconciling Literature with Model Behavior
Across the 30°, 45°, and 60° loading directions—defined relative to a line parallel to the mini-implant axis in the sagittal plane—the finite element model revealed lower peak stress and strain values at 60°. Specifically, the maximum von Mises stress decreased from approximately 80.68 MPa at 30° to 54.07 MPa at 60° , while the equivalent strain also declined from 0.00654 to 0.00588 mm/mm. Although some studies have reported higher interfacial stresses under oblique (non-axial) loads, others have observed reduced stress at certain angled configurations. These discrepancies are likely due to differences in angle definition (relative to the implant axis, bone surface, or occlusal plane), load application points, and boundary or contact conditions. In the present model, a 60° loading direction minimized the bending moment at the implant neck, allowing a more uniform load distribution along the engaged threads and reducing stress concentration. Clinically, this suggests that the optimal force vector should minimize neck bending rather than adhere to a specific universal angle; under the current geometric and boundary conditions, a 60° direction achieved the most favorable stress distribution.
The optimal insertion angles for orthodontic mini-implants have been examined in various studies, with recommendations typically favoring angles between 30° and 45° for enhanced stability. Lin et al. reported that the suitable insertion angle range for mini-implants is between 30° to 45°, emphasizing that using these angles minimizes stress on the surrounding cortical bone while maximizing stability [21]. They conducted finite element analyses demonstrating that angles beyond this range, particularly 60°, tended to increase stress and, consequently, the risk of implant failure.
Popa et al. indicated that an insertion angle of 30° was beneficial, allowing better stress distribution compared to steeper angles like 60° or 90° [22]. Their research showed that the combination of insertion angle and cortical bone thickness significantly affects the stability of mini-implants, asserting that lower angles provide more favorable conditions for integration. However, Wilmes et al. concluded that traditional recommendations suggested avoiding low angles like 30° for mini-implants, and later findings indicate that angles between 60° and 70° may enhance primary stability while still maintaining low stress on the cortical bone [23]. This presents a contrast to the typical preference for 30° to 45° angles. Kovuru et al. found that altering the insertion angle from 90° to 45° increased cortical bone contact and improved primary stability for mini-implants [2]. Their findings support the preference for moderate angles (approximately 45°) to address osseointegration effectively. Xavier et al. discovered that incrementing the angle from 30° to 90° led to decreased stress values in both mini-implants and cortical bone, suggesting that higher angles could promote stability [24]. However, it is important to note that their study indicated an optimal angle closer to 90° for enhanced stability, which differs from the 30° to 45° recommendation. On the other hand, Marimuthu et al. presented evidence showing maximum stress in the bone at 30° and 60°, warning that excessive angling (up to 90°) could lead to increased stress and potential failure [25].
4.3. Insertion Depth: Displacement, Strain Volume, and Stability
Varying threaded engagement from 5 mm to 7 mm markedly altered system rigidity. At 5 mm, the maximum equivalent strain in bone reached 0.01650 mm/mm and the affected material volume was larger and closer to the cortical surface (Fig. 12), with bone strain in cortex ≈2.5× higher than at 7 mm (Fig.13). These findings mirror reports that deeper insertion reduces lever-arm effects, spreads load over more threads, and shrinks the high-strain zone—all hallmarks of improved primary stability. Within anatomical limits, 6–7 mm effective engagement appears mechanically advantageous in this model, dovetailing with experimental pull-out/torque trends in the literature.

Table 2.
Insertion Depth and Stability.
| PARAMETER / FINDING | PRESENT FEM STUDY (2025) | FINDINGS FROM LITERATURE | REFERENCES |
|---|---|---|---|
| Insertion depth analyzed | 5 mm – 7 mm | Typically 4–7 mm in most studies | Pan et al. (2012)[26] Petrey et al. (2010)[27] |
| Maximum equivalent strain | 0.01650 mm/mm at 5 mm; ~2.5× higher than at 7 mm | Higher strain at shallower insertions due to increased lever arm effect | Ichinohe et al. (2019[28]; |
| Implant displacement | Increased at 5 mm; minimal at 7 mm | Deeper insertion reduces micromovement and bending | Petrey et al. (2010)[27] Hirai et al. (2021)[29] |
| Stress distribution pattern | Larger strained volume near cortical surface at 5 mm; reduced at 7 mm | Deeper engagement distributes load across more threads and reduces cortical stress | Pan et al. (2012)[26]; Wilmes & Drescher (2011)[23] |
| Predicted stability | 6–7 mm insertion depth provides best rigidity and lowest strain | Depths ≥6 mm generally enhance torque and pull-out resistance | Nienkemper et al. (2013)[30]; Ichinohe et al. (2019)[28] |
| Clinical implication | Optimal insertion range: 6–7 mm for improved mechanical anchorage | Depths >6 mm yield stable fixation without overloading cortical bone | Hirai et al [29] Nienkemper et al [30] |
The literature provides various insights on optimal insertion depths for achieving primary stability for orthodontic mini-implants, with a consensus generally supporting deeper insertions as essential for enhanced stability. Pan et al. emphasized that mini-implants should be inserted as deeply as possible to maximize stability. They suggest that greater insertion depth not only increases stability but also minimizes tipping moments at the bone rim that could contribute to implant failure due to excessive strain at the bone-implant interface [26] (table 2). Wilmes and Drescher discussed that higher insertion depths tend to yield greater insertion torques and primary stability; however, their focus was primarily on the effects of insertion angle and cortical bone thickness rather than explicitly on depth [23] (table 2)
Ichinohe et al. confirmed that increasing insertion depth significantly enhances mini-implant stability. Their findings demonstrate that stability improves with depths greater than 6 mm, emphasizing the relation between depth and stability during the initial healing phase [28] (table 2).
Hirai et al. indicated that an insertion depth of 4.1 mm could be optimal for maintaining adequate stability without increasing risk factors associated with screw fracture. This highlights a threshold where additional depth does not proportionately contribute to stability [29] (table 2). However, the relationship with risk does not apply to all scenarios, as deeper insertions might still be required in specific cases. Nienkemper et al. underlined the importance of insertion depth, concluding that optimal depths should exceed 6 mm for effective primary stability, reinforcing the idea that deeper insertions correlate positively with retention and stability at the bone-implant interface [30] (table 2).
4.4. Study Limitations
This finite element study is subject to certain limitations.
- The finite element model relied on simplified representations of bone geometry and material properties, which may not fully capture the structural complexity of human bone.
- This study did not include direct experimental validation. The model was verified by comparison with previously published finite element analyses rather than in vitro or in vivo measurements.
- Bone and implant materials were modeled as homogeneous and isotropic to allow numerical convergence, although this does not reflect their true anisotropic behavior.
- Biological processes, including bone remodeling and inter-individual anatomical variability, were not incorporated into the model.
5. Conclusions
Optimal mechanical performance was achieved at moderate orthodontic forces (1–3 N), a loading direction of approximately 60°, and insertion depths of 6–7 mm. Under these conditions, stress and strain levels in both cortical and cancellous bone remained within physiological limits, ensuring stable anchorage and minimizing the risk of fatigue or micromovement. These findings are consistent with existing experimental data and provide practical guidance for improving the clinical success and long-term stability of orthodontic mini-implants.
Author Contributions
Conceptualization, T.P., A.S., C.D.N.S., C.L.R., and B.R.D. C.A, C.B; methodology, T.P., A.S., C.D.N.S., C.L.R., and B.R.D. C.A., C.B.; software, B.R.D.; validation, A.S. and C.D.N.S.; formal analysis, T.P.; investigation, T.P. and C.B.; resources, C.L.R. and B.R.D.; data curation, T.P.; writing—original draft preparation, T.P.; writing—review and editing, A.S. and C.D.N.S.; visualization, C.B.; supervision, A.S. and C.D.N.S.; project administration, A.S.; funding acquisition, C.D.N.S.
Funding
This research received no external funding.
Institutional Review Board Statement
Not applicable.
Informed Consent Statement
Not applicable.
Data Availability Statement
The original contributions presented in this study are included in the article/supplementary material. Further inquiries can be directed to the corresponding author.
Acknowledgments
The authors have reviewed and edited the output and take full responsibility for the content of this publication.
Conflicts of Interest
The authors declare no conflicts of interest.
Abbreviations
The following abbreviations are used in this manuscript:
| FEM | Finite Element Method |
| FEA | Finite Element Analysis |
| MI | Mini-implant |
| CT | Computed Tomography |
| CAD | Computer-Aided Design |
| Ti-6Al-4V | Titanium alloy (90% Ti, 6% Al, 4% V) |
| PDL | Periodontal Ligament |
| von Mises stress | Equivalent stress criterion (no abbreviation, but often used as term) |
| MPa | Megapascal |
| mm | Millimeter |
| N | Newton |
| STL | Standard Tessellation Language (file format for 3D printing/geometry) |
| ANSYS | Analysis System (commercial FEM software) |
| 3D | Three-dimensional |
| ° | Degrees (angle measurement) |
References
- Arqub, S.; Gandhi, V.; Mehta, S.; Palo, L.; Upadhyay, M.; Yadav, S. Survival estimates and risk factors for failure of palatal and buccal mini-implants. Angle Orthod. 2021, 91(6), 756–763. [Google Scholar] [CrossRef]
- Kovuru, V.; Aileni, K.; Mallepally, J.; Kumar, K.; Sursala, S.; Pramod, V. Factorial analysis of variables affecting bone stress adjacent to mini-implants used for molar distalization by direct anchorage—a finite element study. J. Orthod. Sci. 2023, 12(1). [Google Scholar] [CrossRef]
- Büchter, A.; Wiechmann, D.; Koerdt, S.; Wiesmann, H.; Piffko, J.; Meyer, U. Load-related implant reaction of mini-implants used for orthodontic anchorage. Clin. Oral Implants Res. 2005, 16(4), 473–479. [Google Scholar] [CrossRef]
- Guimarães, G.; Morais, L.; Elias, C.; Meyers, M. Sequential bone response to immediately loaded mini-implants, in vivo study. MRS Proc. 2006, 925. [Google Scholar] [CrossRef]
- Sana, S.; Reddy, R.; Talapaneni, A.; Hussain, A.; Bangi, S.; Fatima, A. Evaluation of stability of three different mini-implants based on thread shape factor and numerical analysis of stress around mini-implants with different insertion angles under en-masse retraction force. Dent. Press J. Orthod. 2020, 25(6), 59–68. [Google Scholar] [CrossRef] [PubMed]
- Sharma, V.; Singla, A.; Jaj, H.; Mahajan, V.; Thakur, S.; Nadda, P. Comparison of mini-implants placed at different heights and angulations for retraction and intrusion of maxillary incisors: a finite element model study. J. Indian Orthod. Soc. 2024, 59(1), 36–45. [Google Scholar] [CrossRef]
- Sivamurthy, G.; Sundari, S. Stress distribution patterns at mini-implant site during retraction and intrusion—a three-dimensional finite element study. Prog. Orthod. 2016, 17(1). [Google Scholar] [CrossRef] [PubMed]
- Choi, J.; Kim, M.; Kim, S.; Chung, K.; Nelson, G. Effect of different head hole positions on the rotational resistance and stability of orthodontic miniscrews: a three-dimensional finite element study. Sensors 2021, 21(11), 3798. [Google Scholar] [CrossRef]
- Abbas, S.; Alhuwaizi, A. Buccal cortical bone thickness in iraqi arab adults by cone beam computed tomography for orthodontic mini-implants. Journal of Baghdad College of Dentistry 2017, 29(1), 183–187. [Google Scholar] [CrossRef]
- Laursen, M.; Melsen, B.; Cattaneo, P. An evaluation of insertion sites for mini-implants. The Angle Orthodontist 2013, 83(2), 222–229. [Google Scholar] [CrossRef]
- Lim, J.; Lee, S.; Kim, Y.; Lim, W.; Chun, Y. Comparison of cortical bone thickness and root proximity at maxillary and mandibular interradicular sites for orthodontic mini-implant placement. Orthodontics and Craniofacial Research 2009, 12(4), 299–304. [Google Scholar] [CrossRef]
- Katić, V.; Kamenar, E.; Blažević, D.; Špalj, S. Geometrical design characteristics of orthodontic mini-implants predicting maximum insertion torque. The Korean Journal of Orthodontics 2014, 44(4), 177. [Google Scholar] [CrossRef]
- Motoyoshi, M.; Inaba, M.; Ueno, S.; Shimizu, N. Mechanical anisotropy of orthodontic mini-implants. International Journal of Oral and Maxillofacial Surgery 2009, 38(9), 972–977. [Google Scholar] [CrossRef]
- Motoyoshi, M.; Ueno, S.; Okazaki, K.; Shimizu, N. Bone stress for a mini-implant close to the roots of adjacent teeth--3D finite element analysis. Int J Oral Maxillofac Surg 2009, 38(4), 363–368. [Google Scholar] [CrossRef] [PubMed]
- Lu, Y.; Zhang, J.; Zhao, W.; Liu, Y. Finite element analysis of stress and strain in bone around orthodontic micro-implants with different thread designs. Prog. Orthod. 2018, 19(1), 12. [Google Scholar] [CrossRef]
- Kumaran, N. K.; Seralathan, S.; Sathishkumar, R. K.; Preethi, S. K. A three-dimensional finite element analysis of the stress distribution around the bone mini-implant interface based on the mini-implant angle of insertion, diameter, and length. J. Pharm. Bioallied Sci. 2023, 15 (Suppl 1), S705–S711. [Google Scholar] [CrossRef]
- Zhou, G.; Zhang, X.; Qie, H.; Li, C.; Lin, L.; Lihua, S. Three-dimensional finite element analysis of the stability of mini-implants close to the roots of adjacent teeth upon application of bite force. Dent. Mater. J. 2018, 37(5), 851–857. [Google Scholar] [CrossRef] [PubMed]
- Wahengbam, P.; Kalra, T.; Kumar, M.; Bansal, A. Evaluation of stress distribution in implant body and surrounding bone with and without splinting—a three-dimensional finite element analysis: an in vitro study. Dent. J. Adv. Stud. 2022, 10(1), 15–20. [Google Scholar] [CrossRef]
- Yazıcıoğlu, D.; Bayram, B.; Oğuz, Y.; Çınar, D.; Uçkan, S. Stress distribution on short implants at maxillary posterior alveolar bone model with different bone-to-implant contact ratios: finite element analysis. J. Oral Implantol. 2015. [Google Scholar] [CrossRef]
- Lu, Y.; Chang, S.; Ye, J.; Ye, Y.; Yu, Y. Finite element analysis of bone stress around micro-implants of different diameters and lengths with application of a single or composite torque force. PLoS ONE 2015, 10(12), e0144744. [Google Scholar] [CrossRef]
- Lin, D.; Wen, S.; Ye, Z.; Yi, Y.; Yuan, X.; Lai, W.; Long, H. Evaluation of optimal insertion sites and angles for orthodontic mini-implants at the anterior nasal spine region based on cone-beam computed tomography. J. Clin. Med. 2024, 13(3), 837. [Google Scholar] [CrossRef] [PubMed]
- Popa, A.; Dehelean, C.; Călniceanu, H.; Watz, C.; Brad, S.; Sinescu, C.; Szuhanek, C. A custom-made orthodontic mini-implant—effect of insertion angle and cortical bone thickness on stress distribution with a complex in vitro and in vivo biosafety profile. Materials 2020, 13(21), 4789. [Google Scholar] [CrossRef] [PubMed]
- Wilmes, B.; Su, Y.; Drescher, D. Insertion angle impact on primary stability of orthodontic mini-implants. Angle Orthod. 2008, 78(6), 1065–1070. [Google Scholar] [CrossRef] [PubMed]
- Xavier, J.; Sarika, K.; Ajith, V.; Varma, N. Evaluation of strain and insertion torque of mini-implants at 90° and 45° angulations on a bone model using three-dimensional finite element analysis. Contemp. Clin. Dent. 2022, 14(1), 25–31. [Google Scholar] [CrossRef]
- Marimuthu, V.; Kumar, K.; Sadhasivam, N.; Arasappan, R.; Jayamurugan, A.; Rathinasamy, R. Finite element analysis of stress and displacement around mini-implants using different insertion angles and various directions of orthodontic force in maxilla and mandible. J. Indian Orthod. Soc. 2015, 49(2), 61–66. [Google Scholar] [CrossRef]
- Pan, C.; Chou, S.; Tseng, Y.; Yang, Y.; Wu, C.; Lan, T.; Chang, H. Influence of different implant materials on the primary stability of orthodontic mini-implants. Kaohsiung J. Med. Sci. 2012, 28(12), 673–678. [Google Scholar] [CrossRef]
- Petrey, J.; Saunders, M.; Kluemper, G.; Cunningham, L.; Beeman, C. Temporary anchorage device insertion variables: effects on retention. Angle Orthod. 2010, 80(4), 634–641. [Google Scholar] [CrossRef]
- Ichinohe, M.; Motoyoshi, M.; Inaba, M.; Uchida, Y.; Kaneko, M.; Matsuike, R.; Shimizu, N. Risk factors for failure of orthodontic mini-screws placed in the median palate. J. Oral Sci. 2019, 61(1), 13–18. [Google Scholar] [CrossRef]
- Hirai, Y.; Watanabe, K.; Deguchi, T.; Ueda, K.; Hamada, K.; Tanaka, E. Influence of insertion depth on stress distribution in orthodontic miniscrew and the surrounding bone by finite element analysis. Dent. Mater. J. 2021, 40(5), 1270–1276. [Google Scholar] [CrossRef]
- Nienkemper, M.; Pauls, A.; Ludwig, B.; Drescher, D. Stability of paramedian inserted palatal mini-implants at the initial healing period: a controlled clinical study. Clin. Oral Implants Res. 2013, 26(8), 870–875. [Google Scholar] [CrossRef]
Figure 1.
Procedure for finite element modeling of an orthodontic mini-implant with adjacent bone structures: (a) A commercially available titanium mini-implant (2.0 mm diameter) was reconstructed and analyzed using the finite element method; (b) Mandibular geometry obtained from CT scan data, exported in STL format.
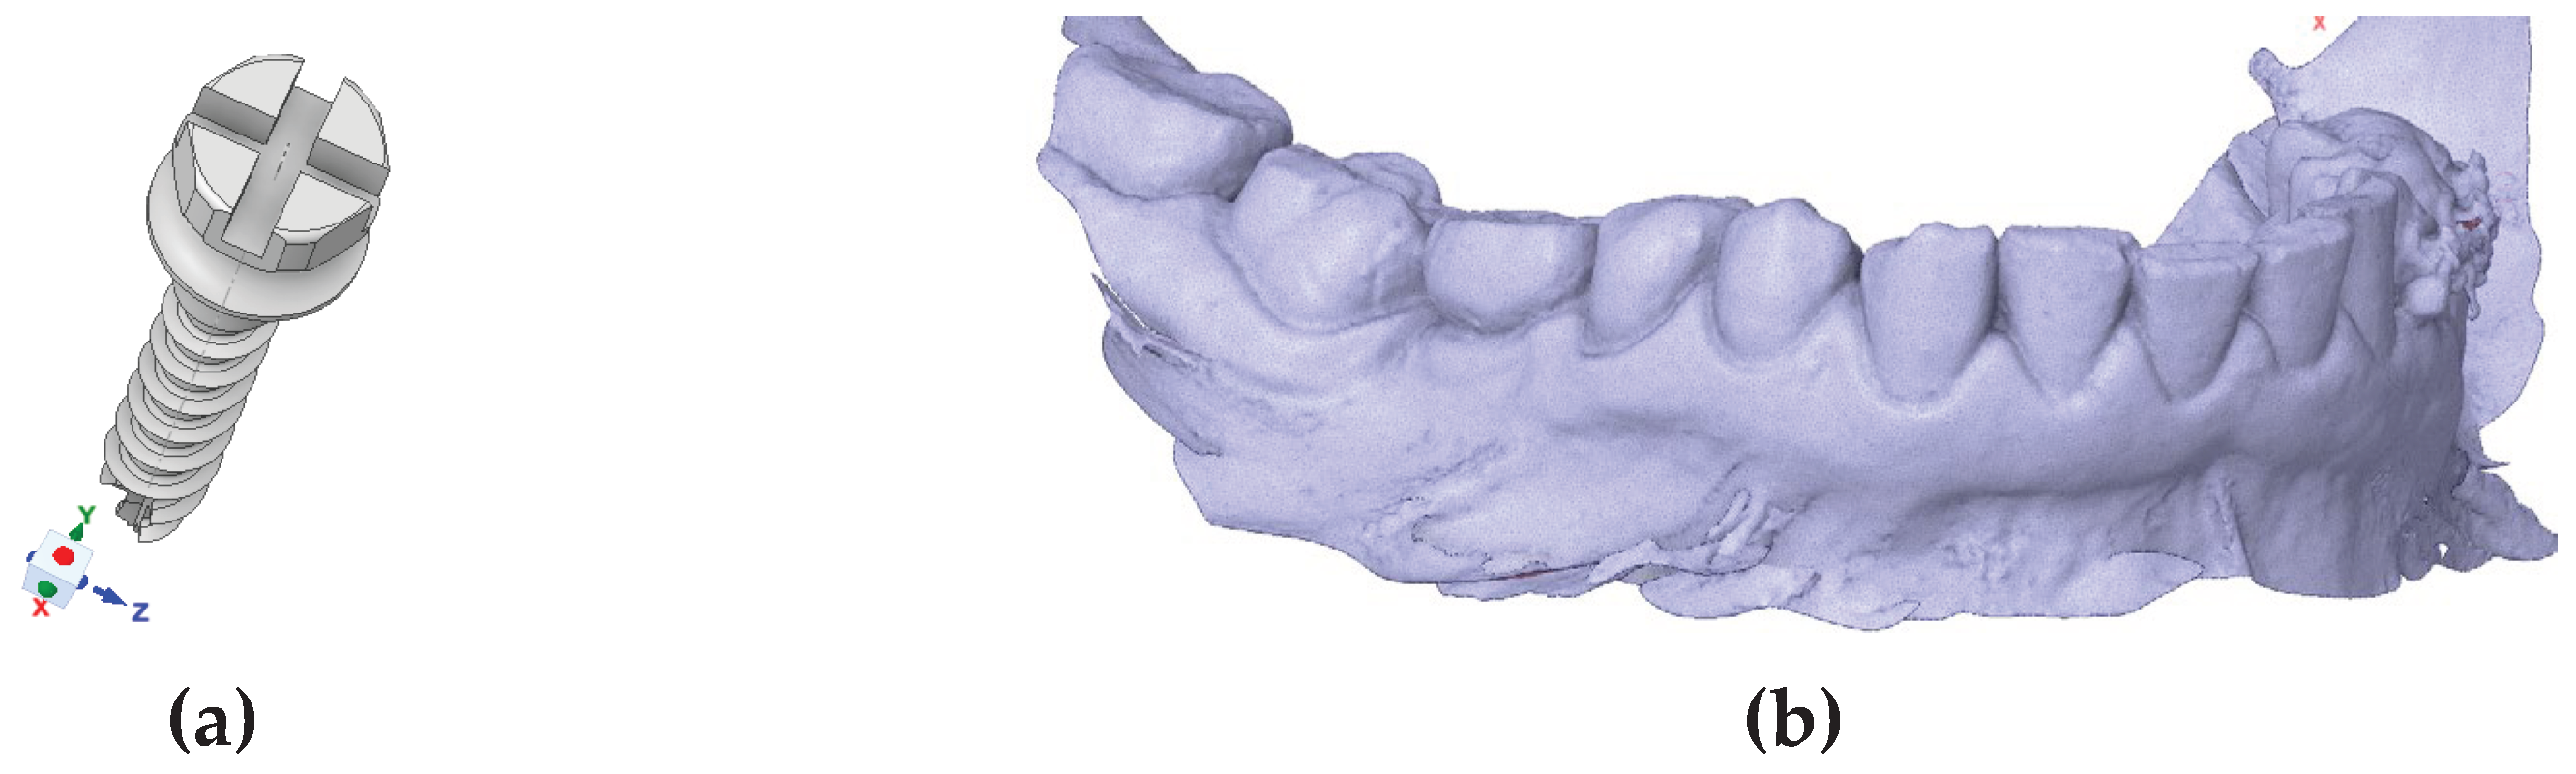
Figure 2.
Stepwise workflow for FEM modeling of orthodontic mini-implant and mandibular bone.
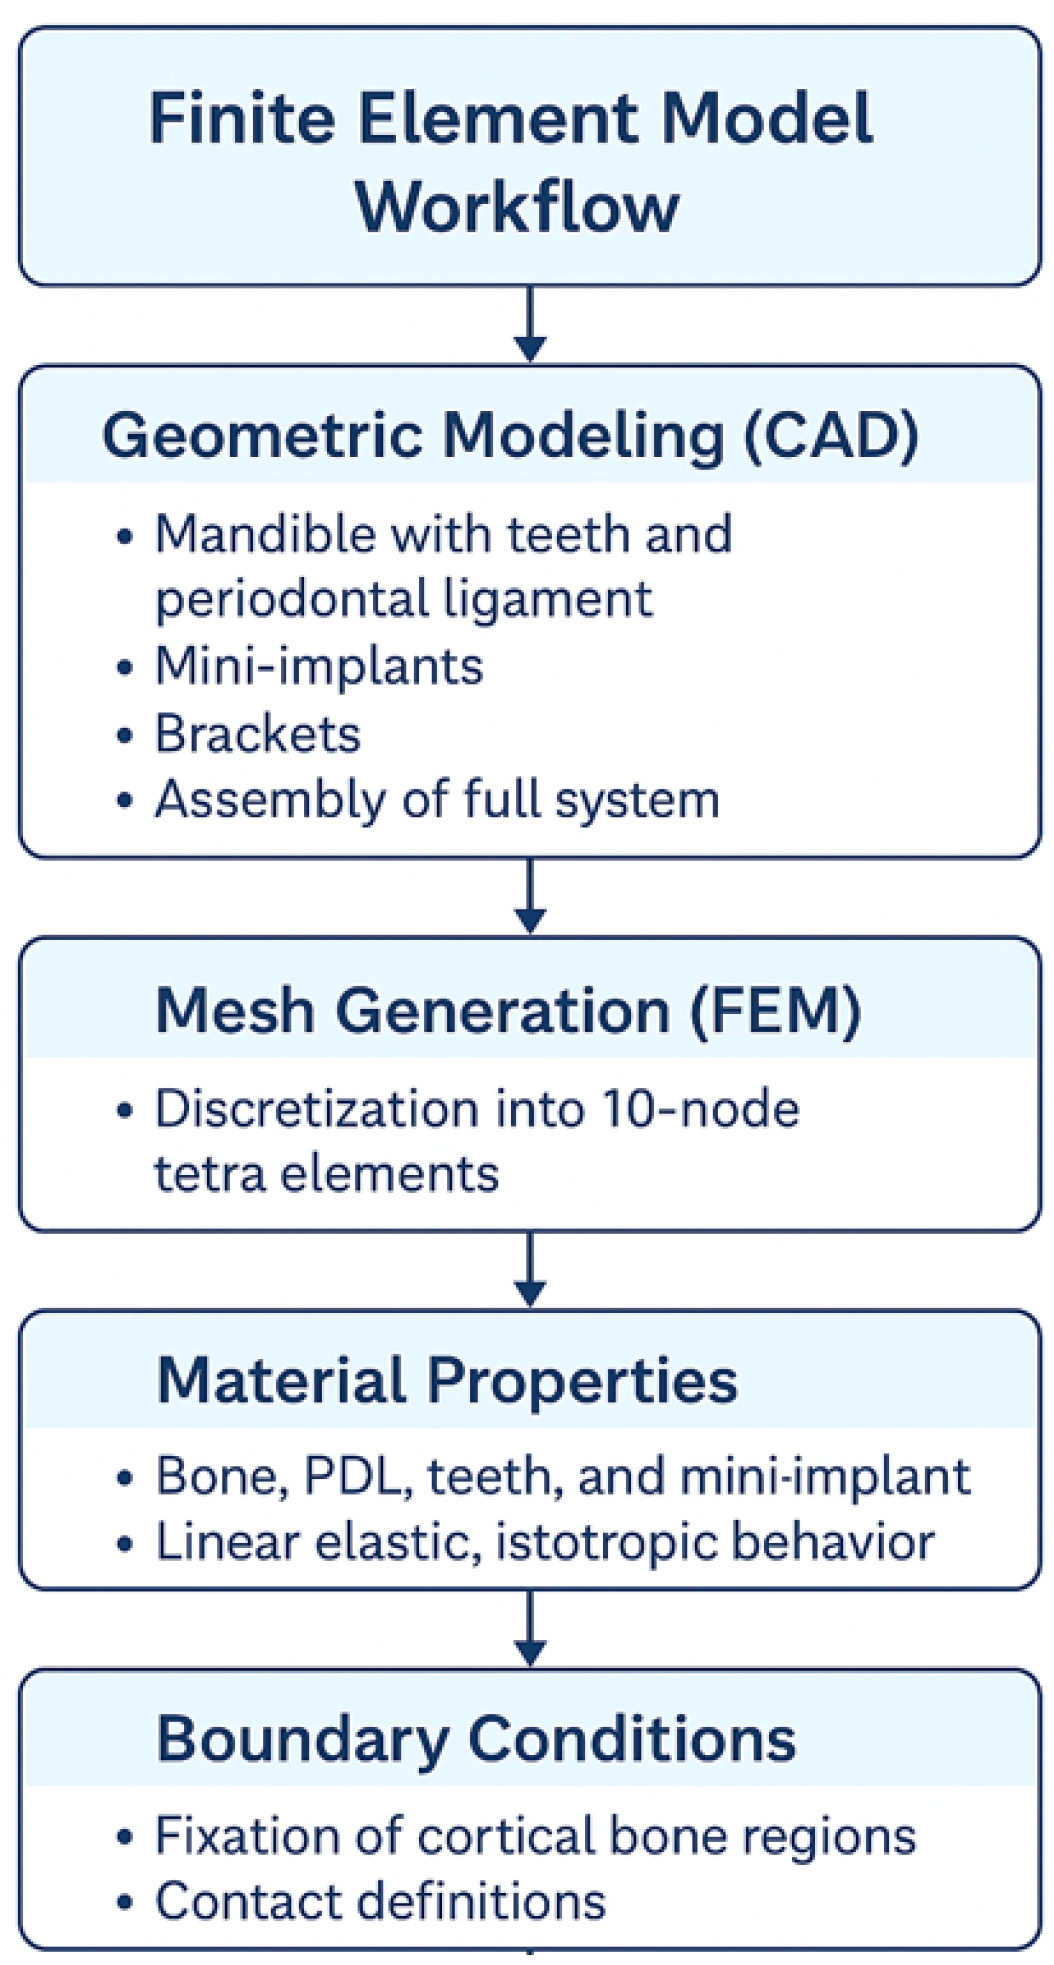
Figure 3.
Contact pressure distribution along the implant thread.
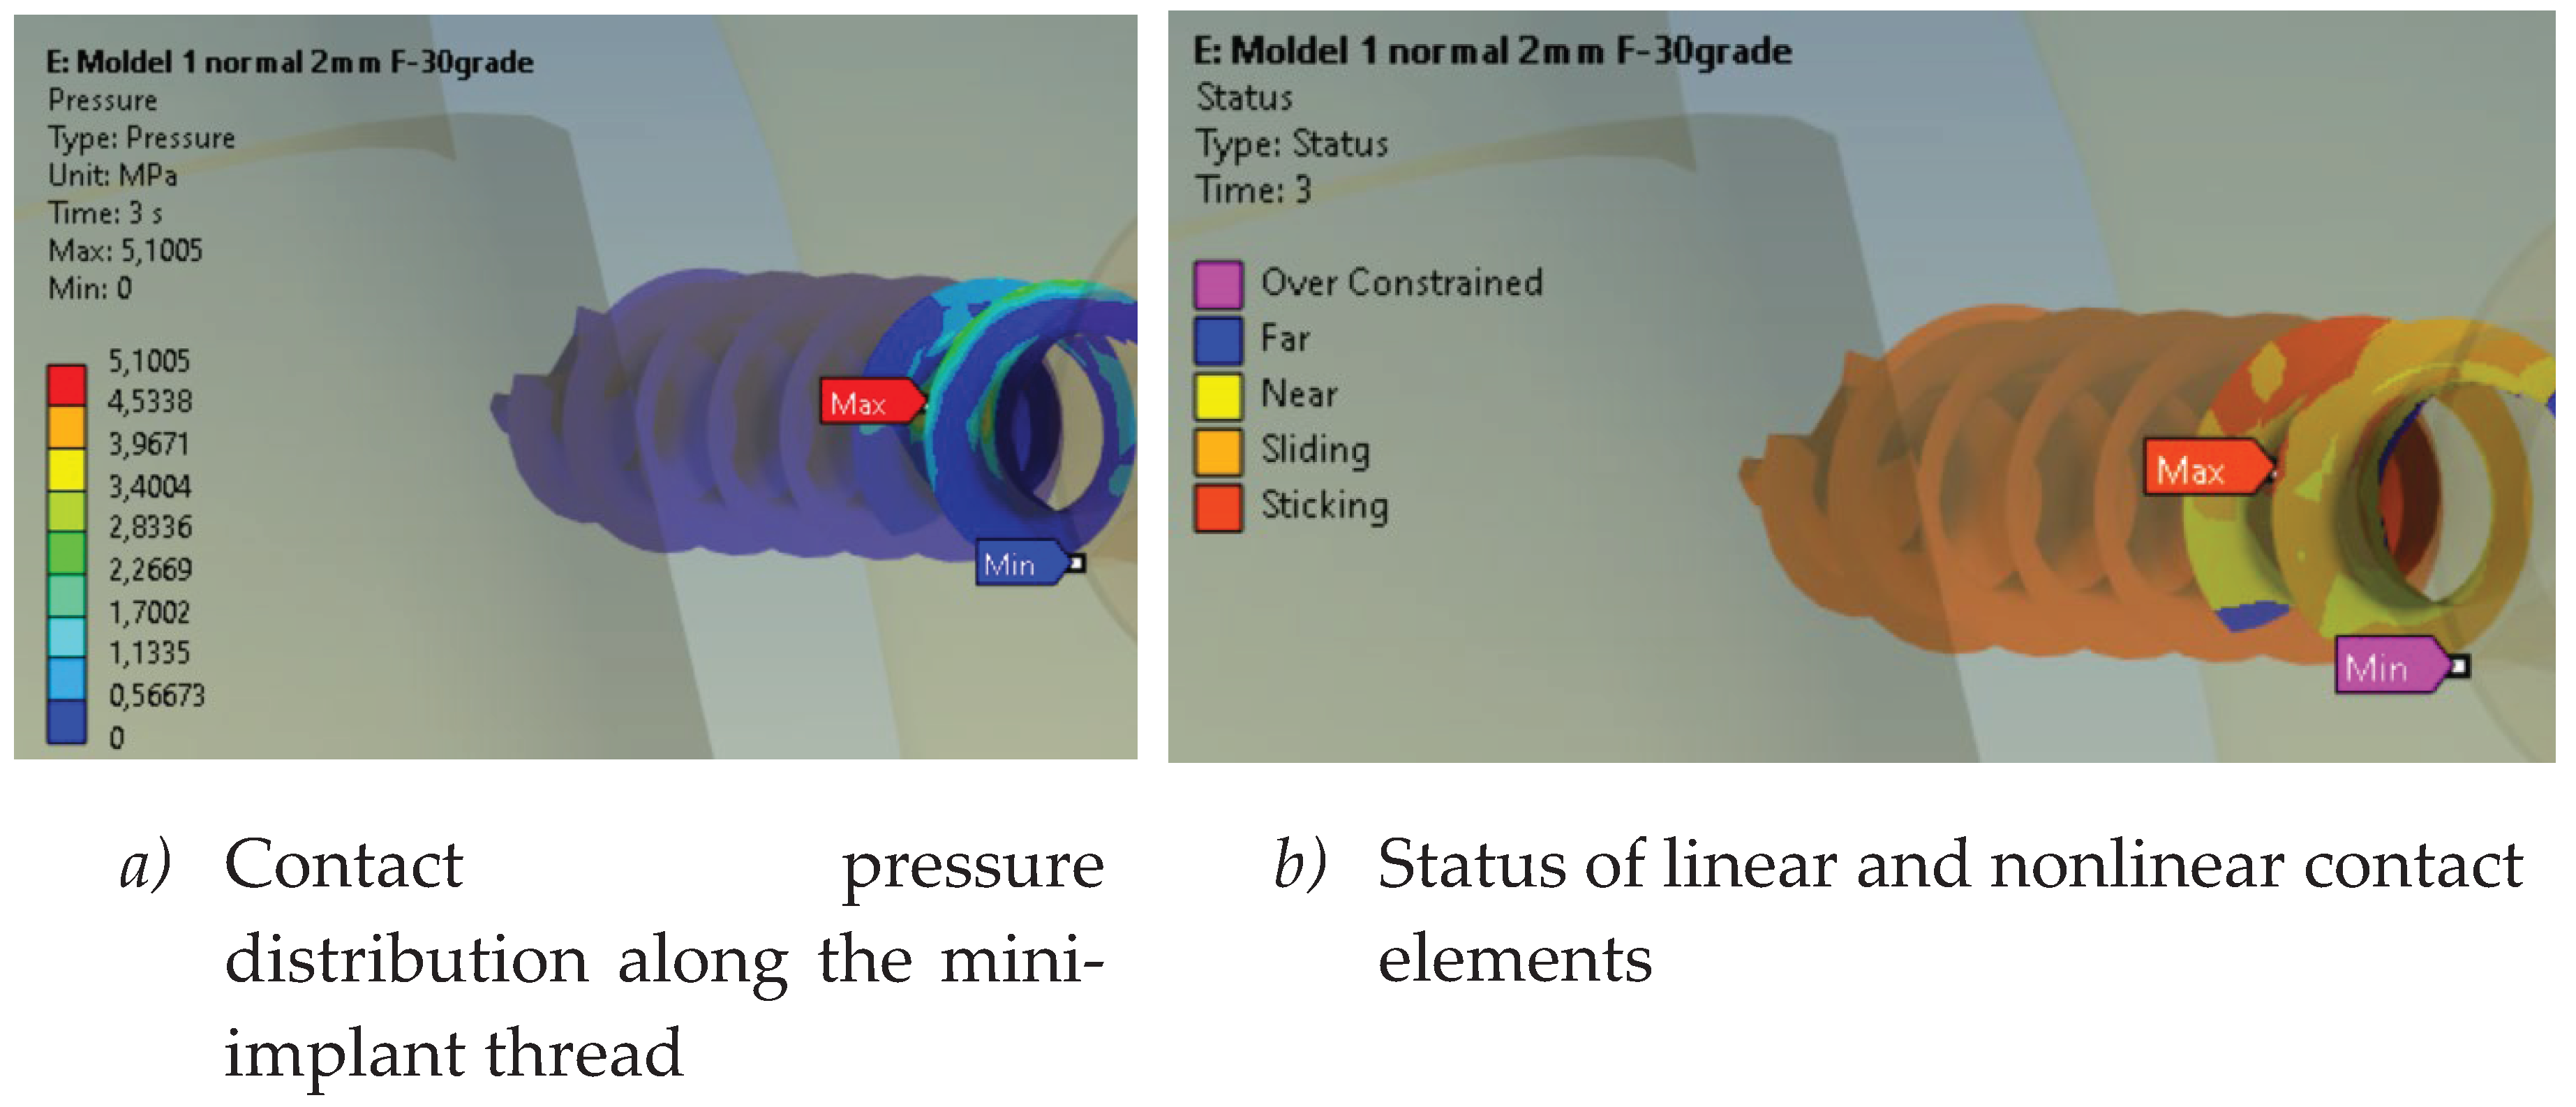
Figure 4.
Sectional results – mini-implant.
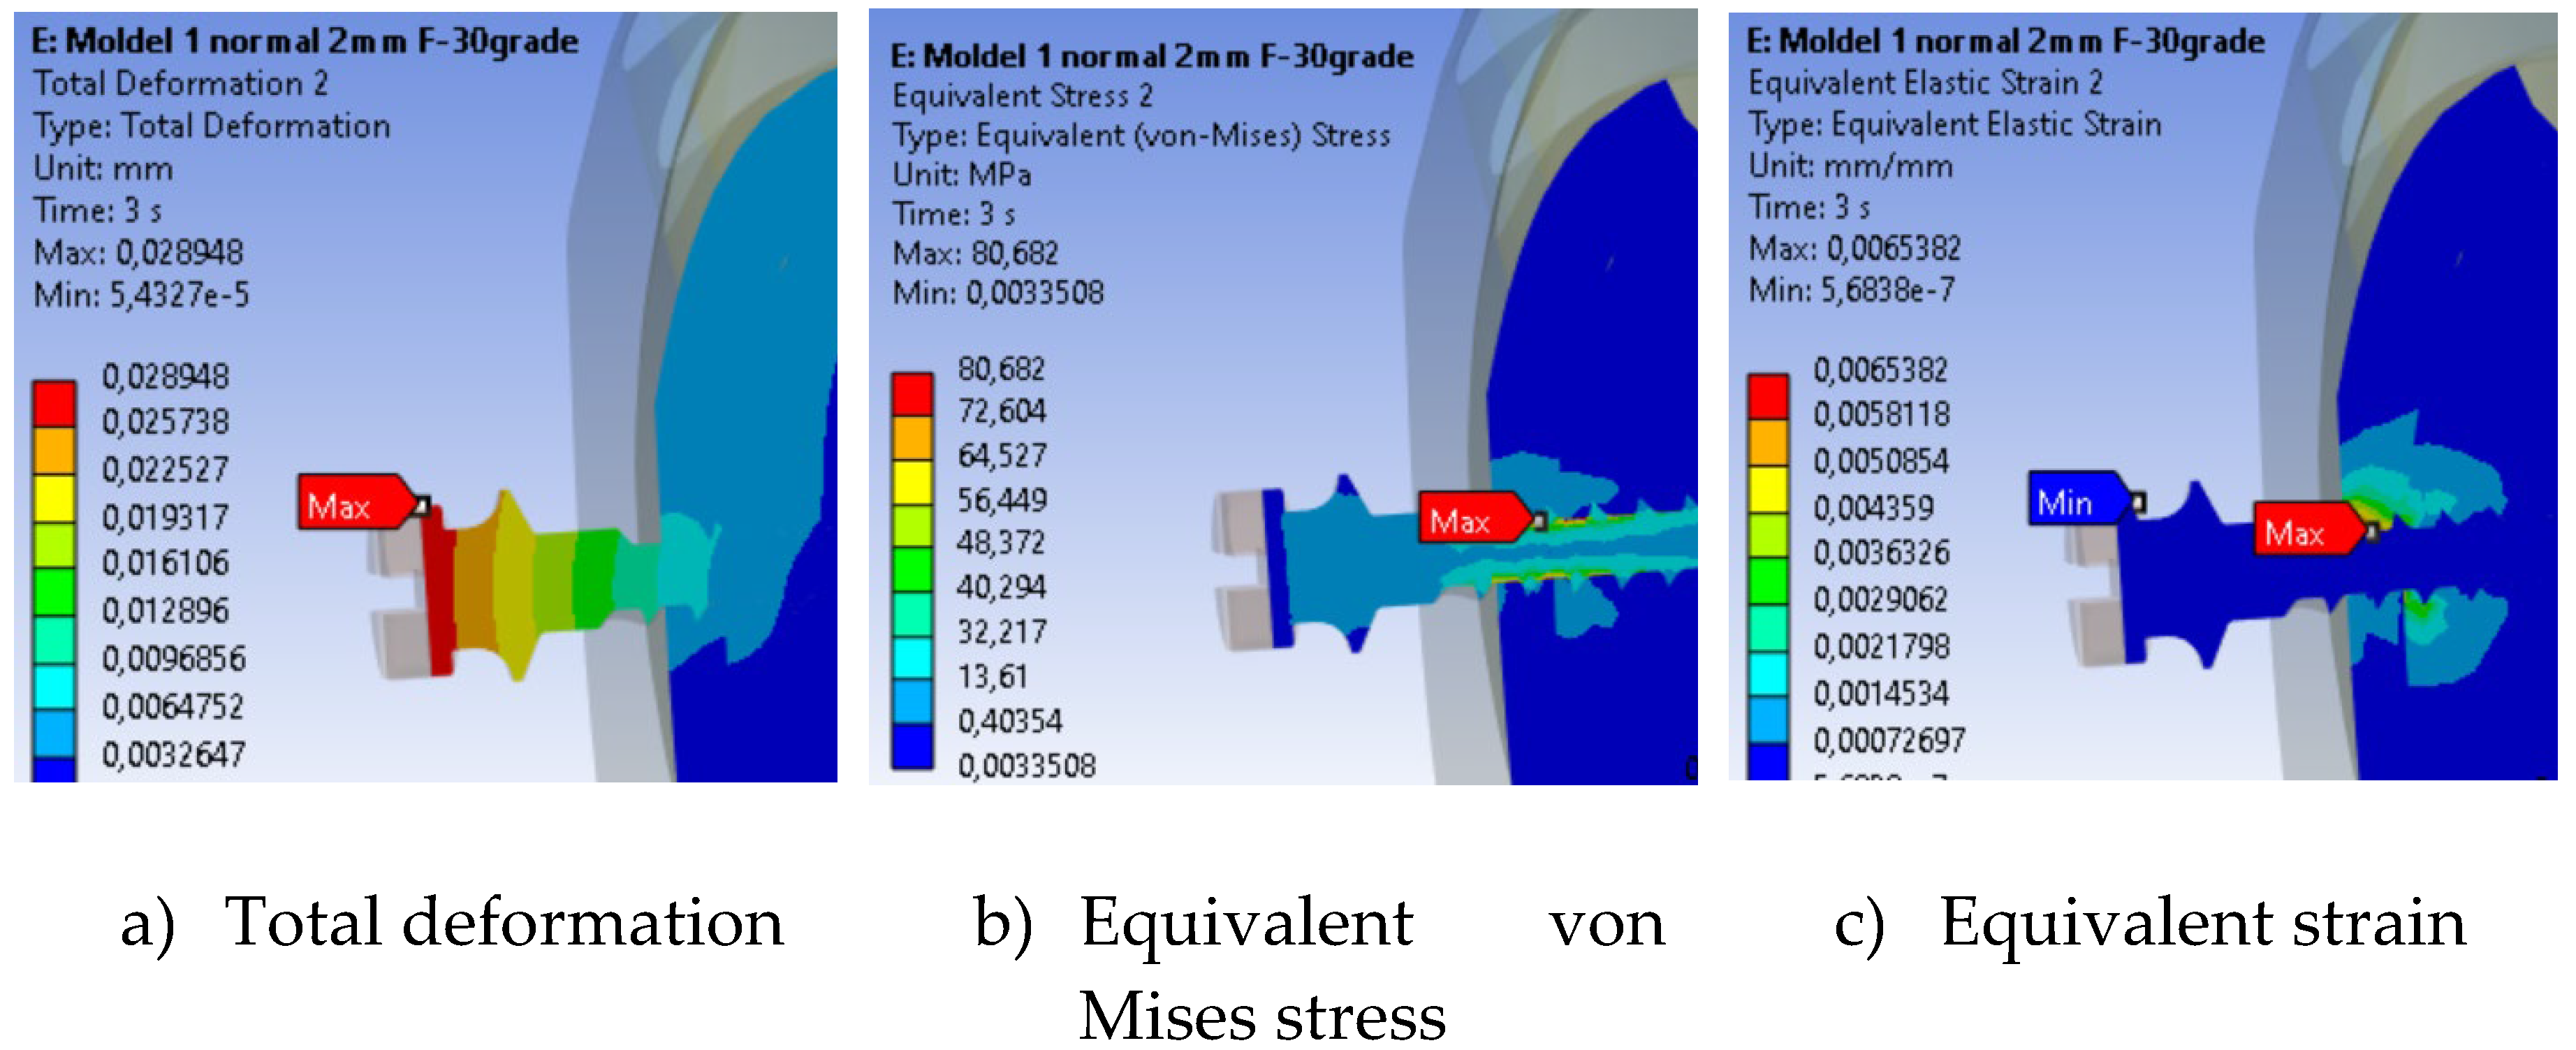
Figure 5.
Maximum equivalent von Mises stress in the mini-implant.
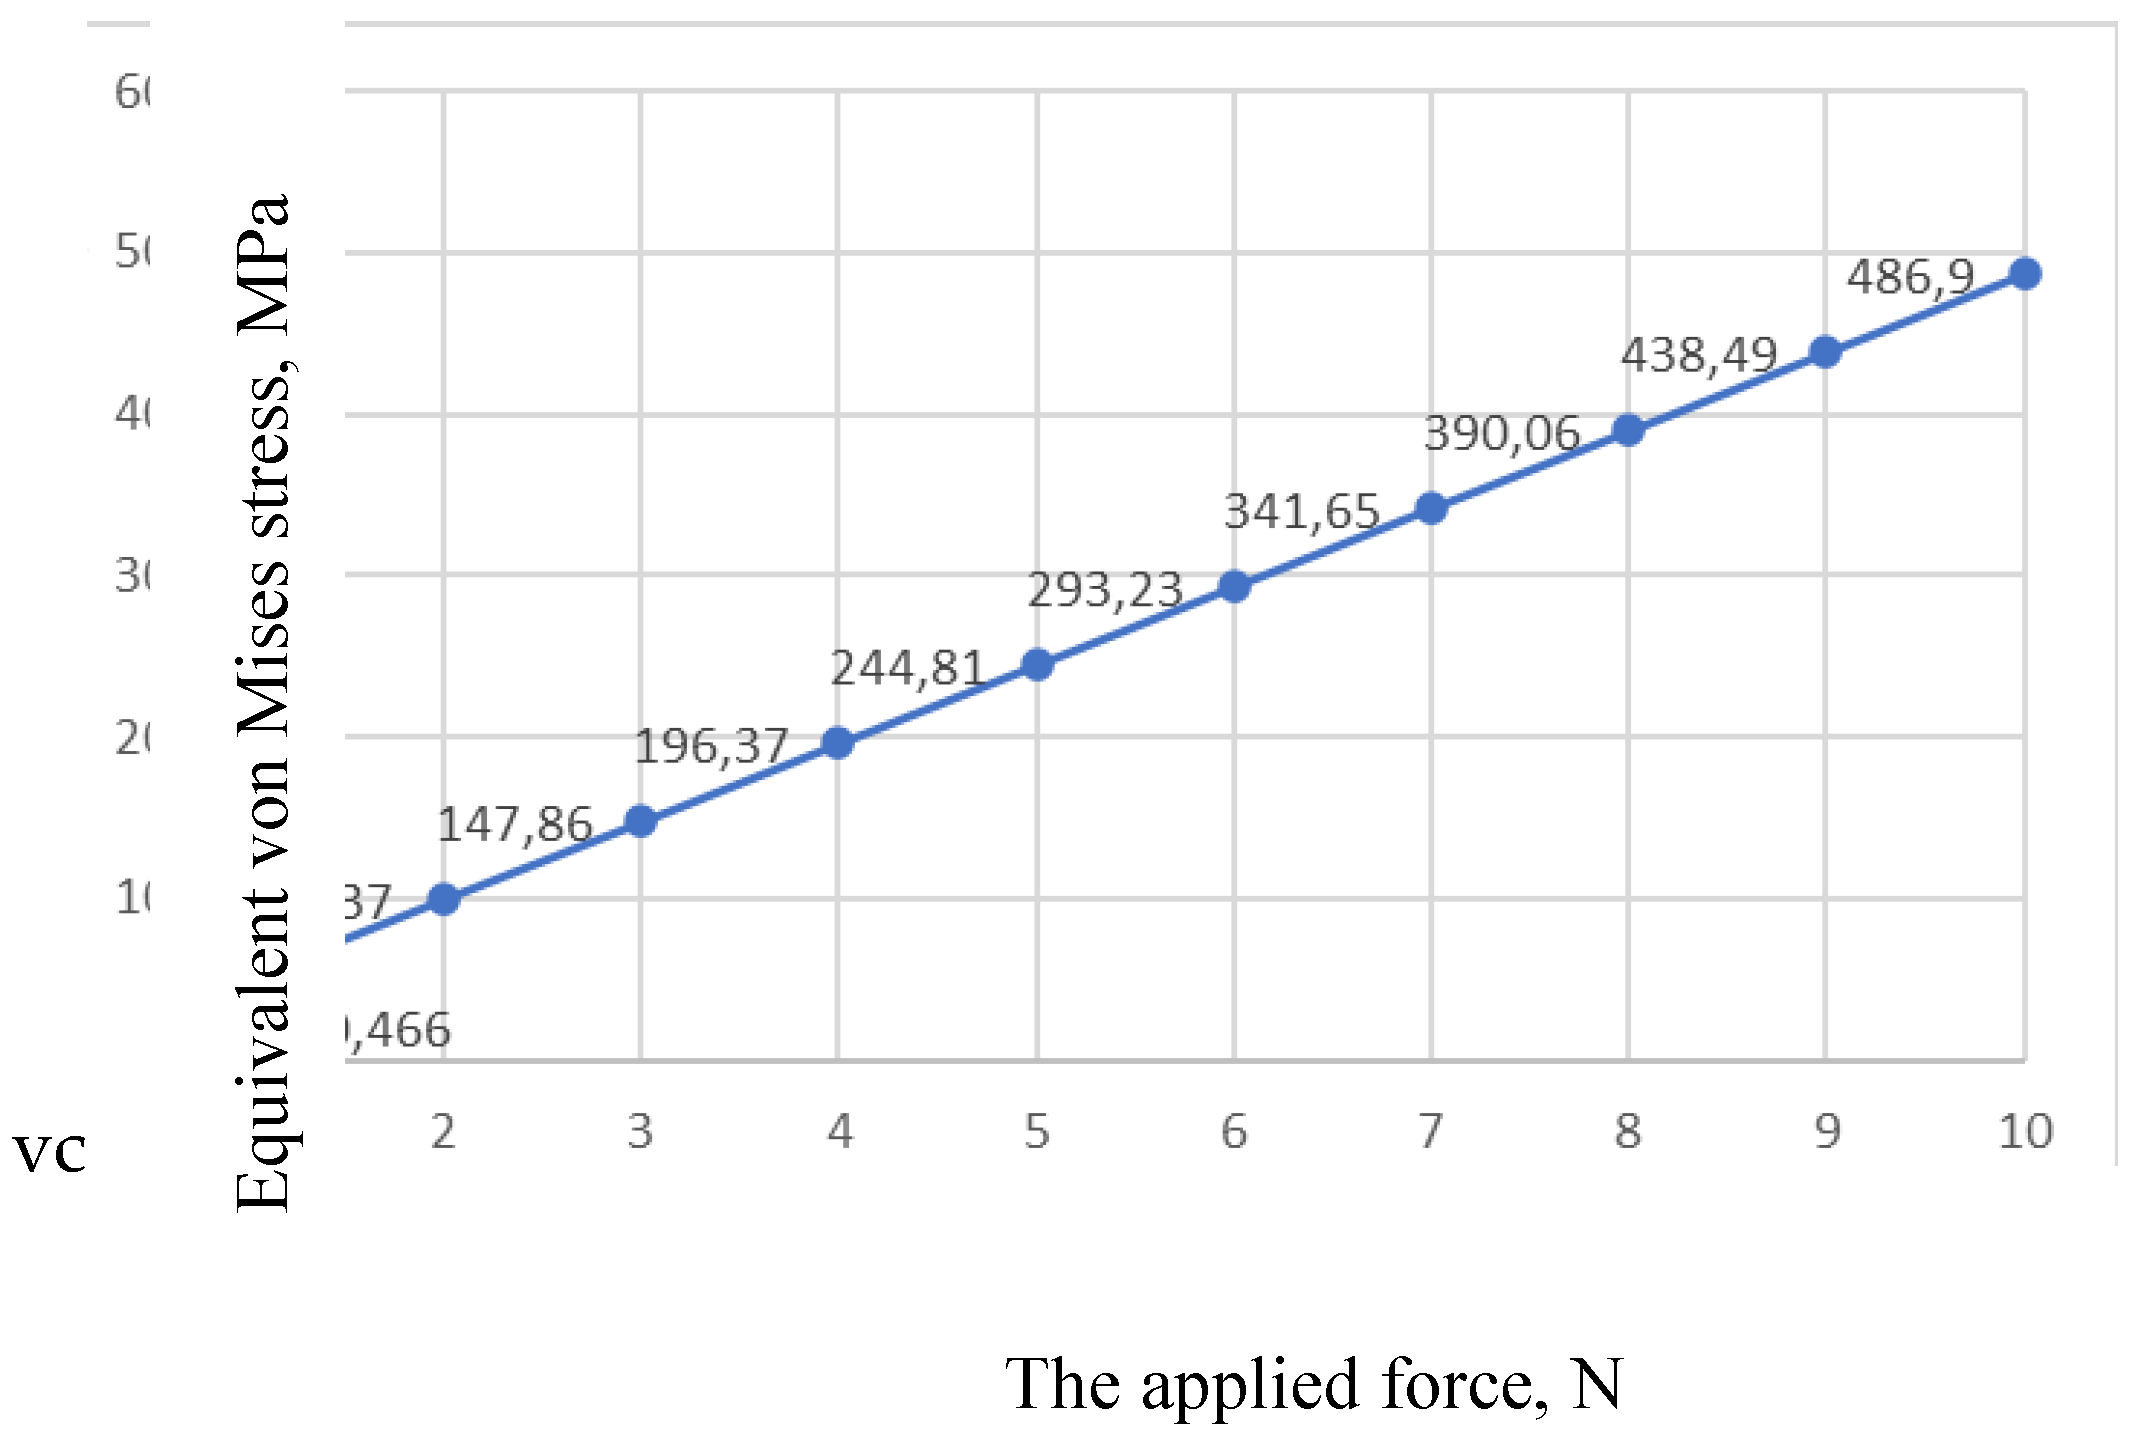
Figure 6.
Total deformation of the mini-implant as a function of force application angle.
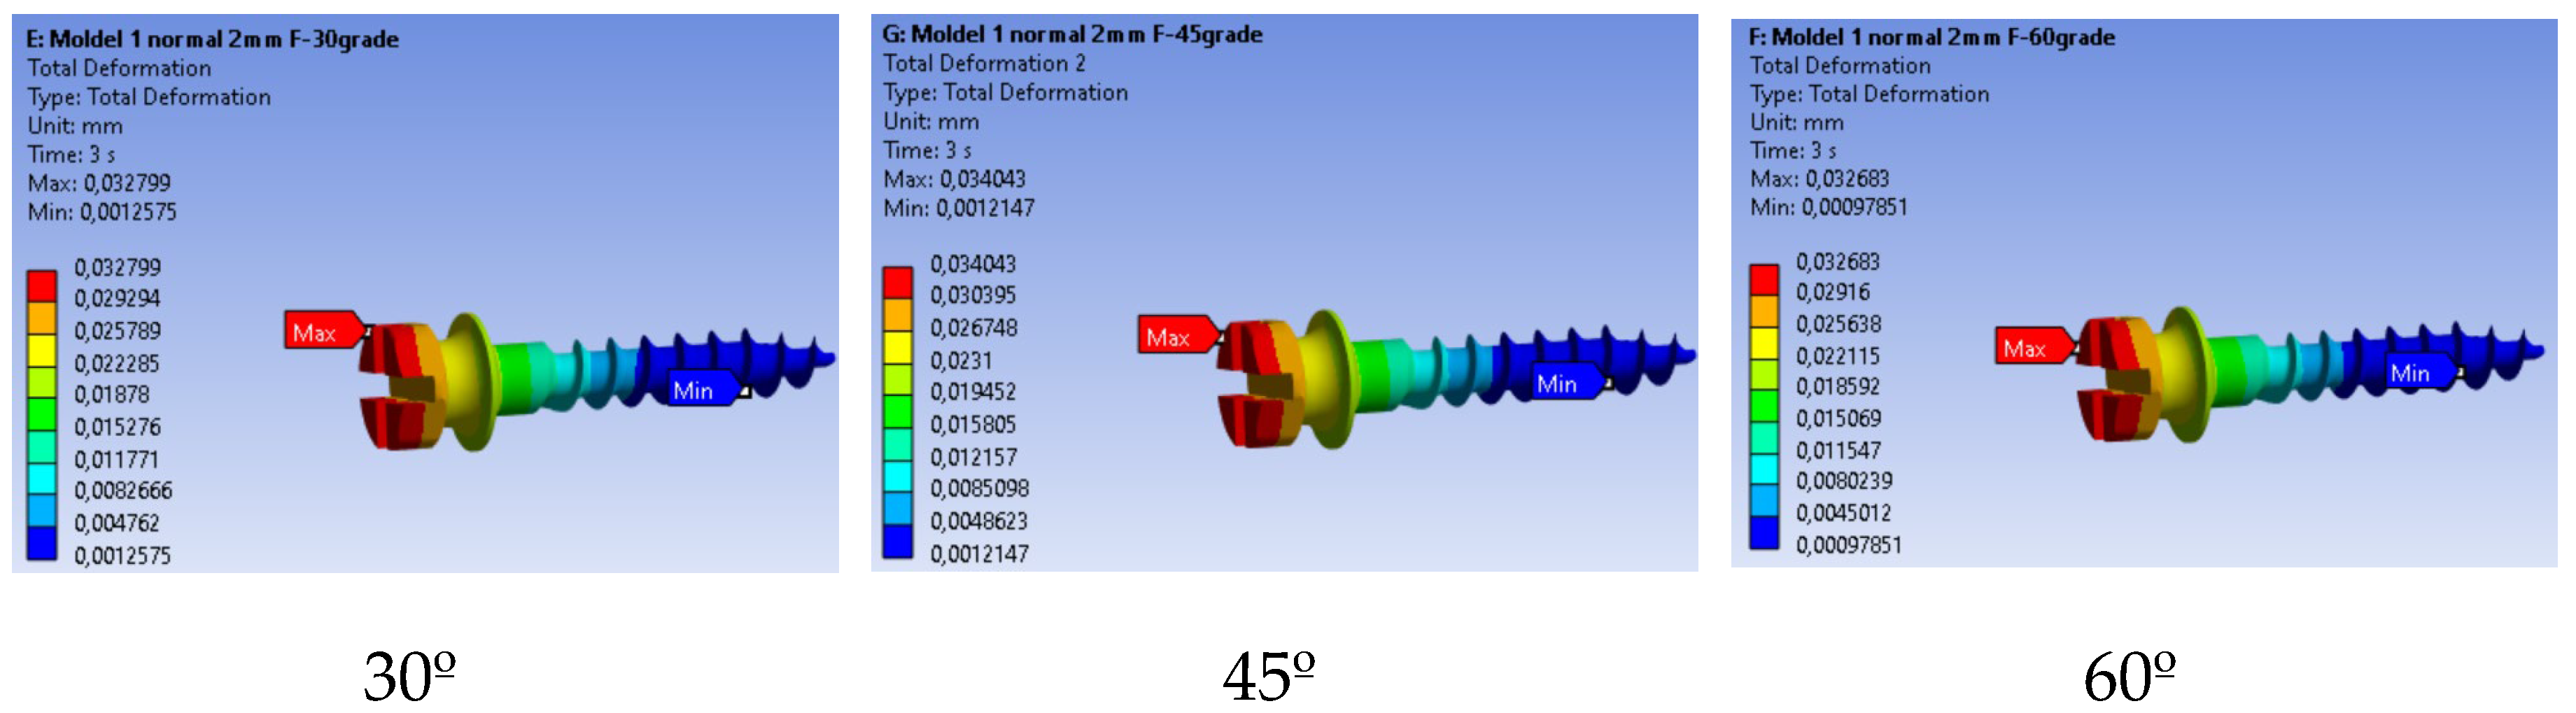
Figure 7.
Maximum total deformation of the mini-implant vs. orthodontic force angle.
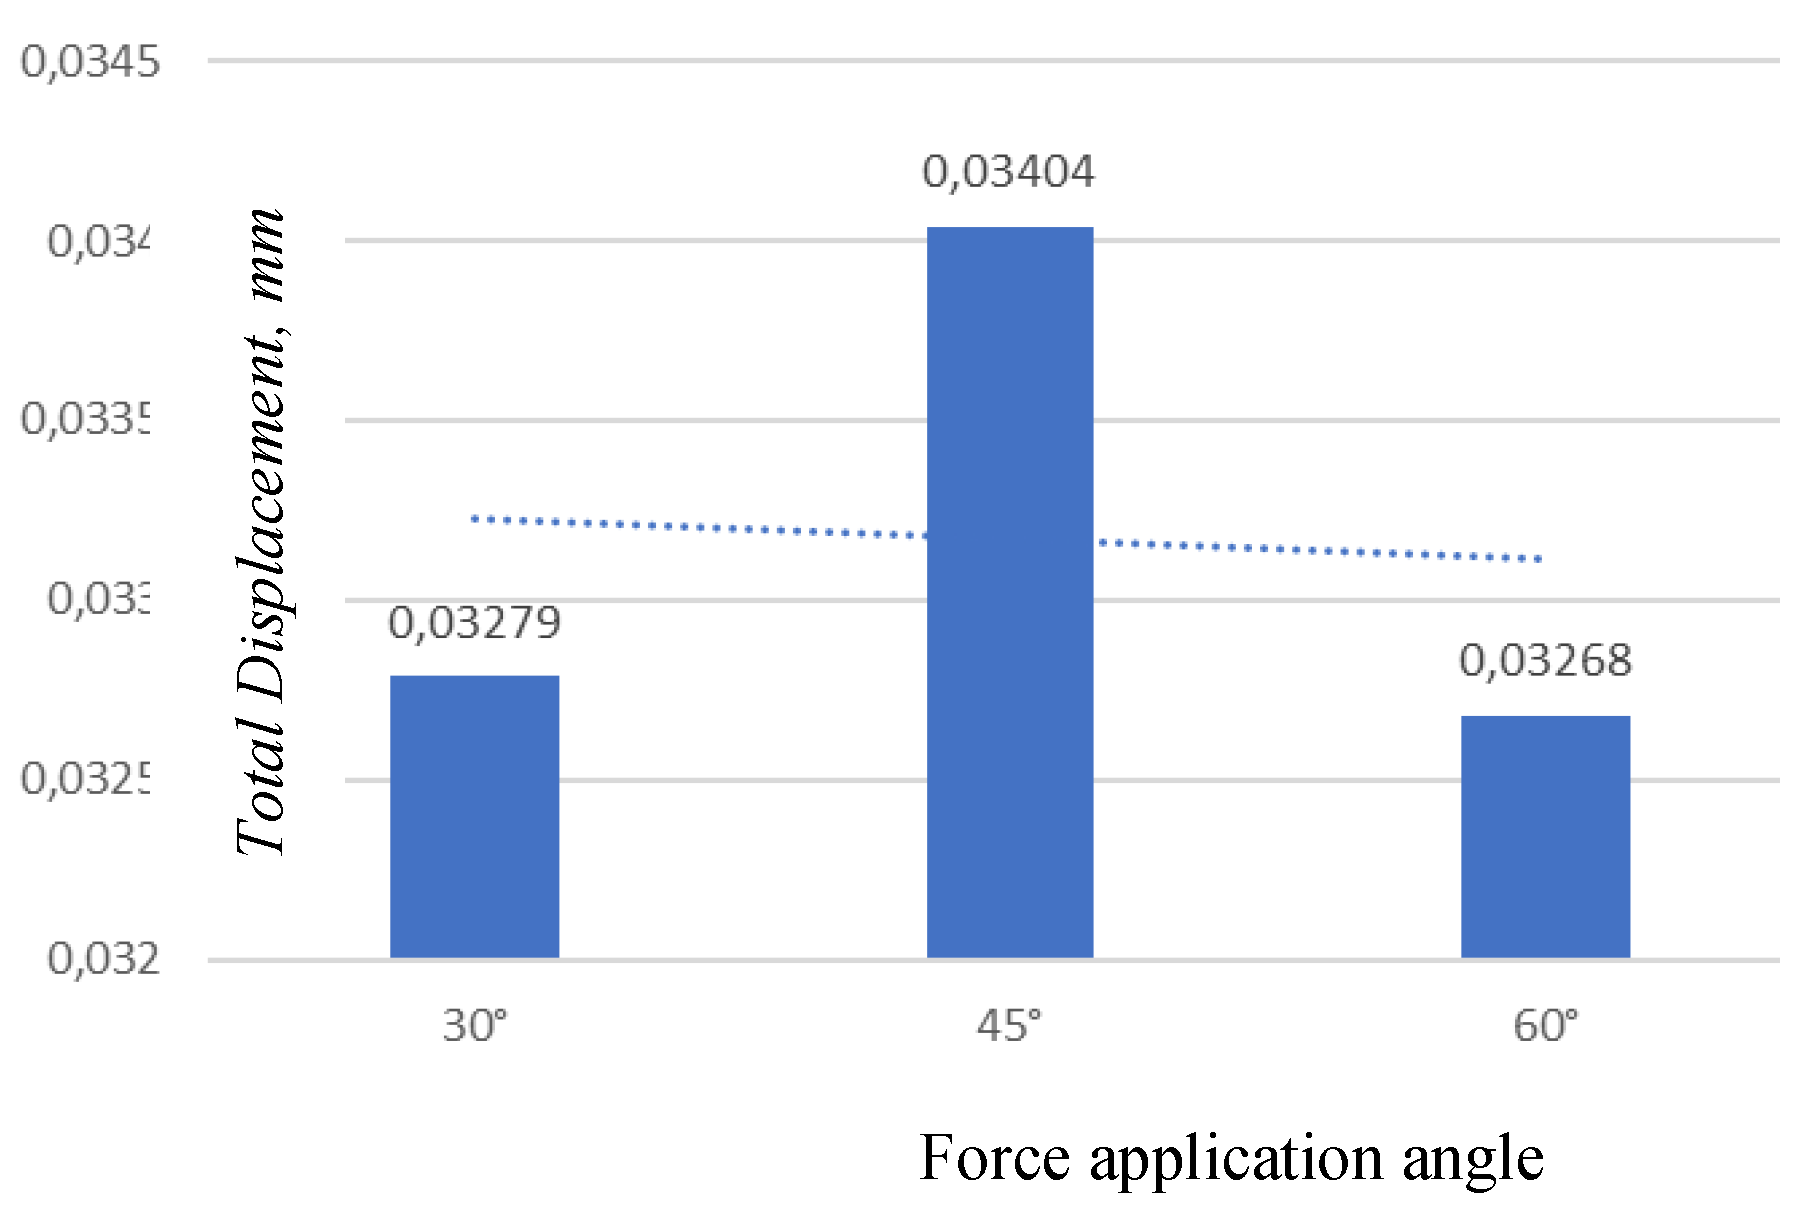
Figure 8.
Stress distribution for three loading angles.
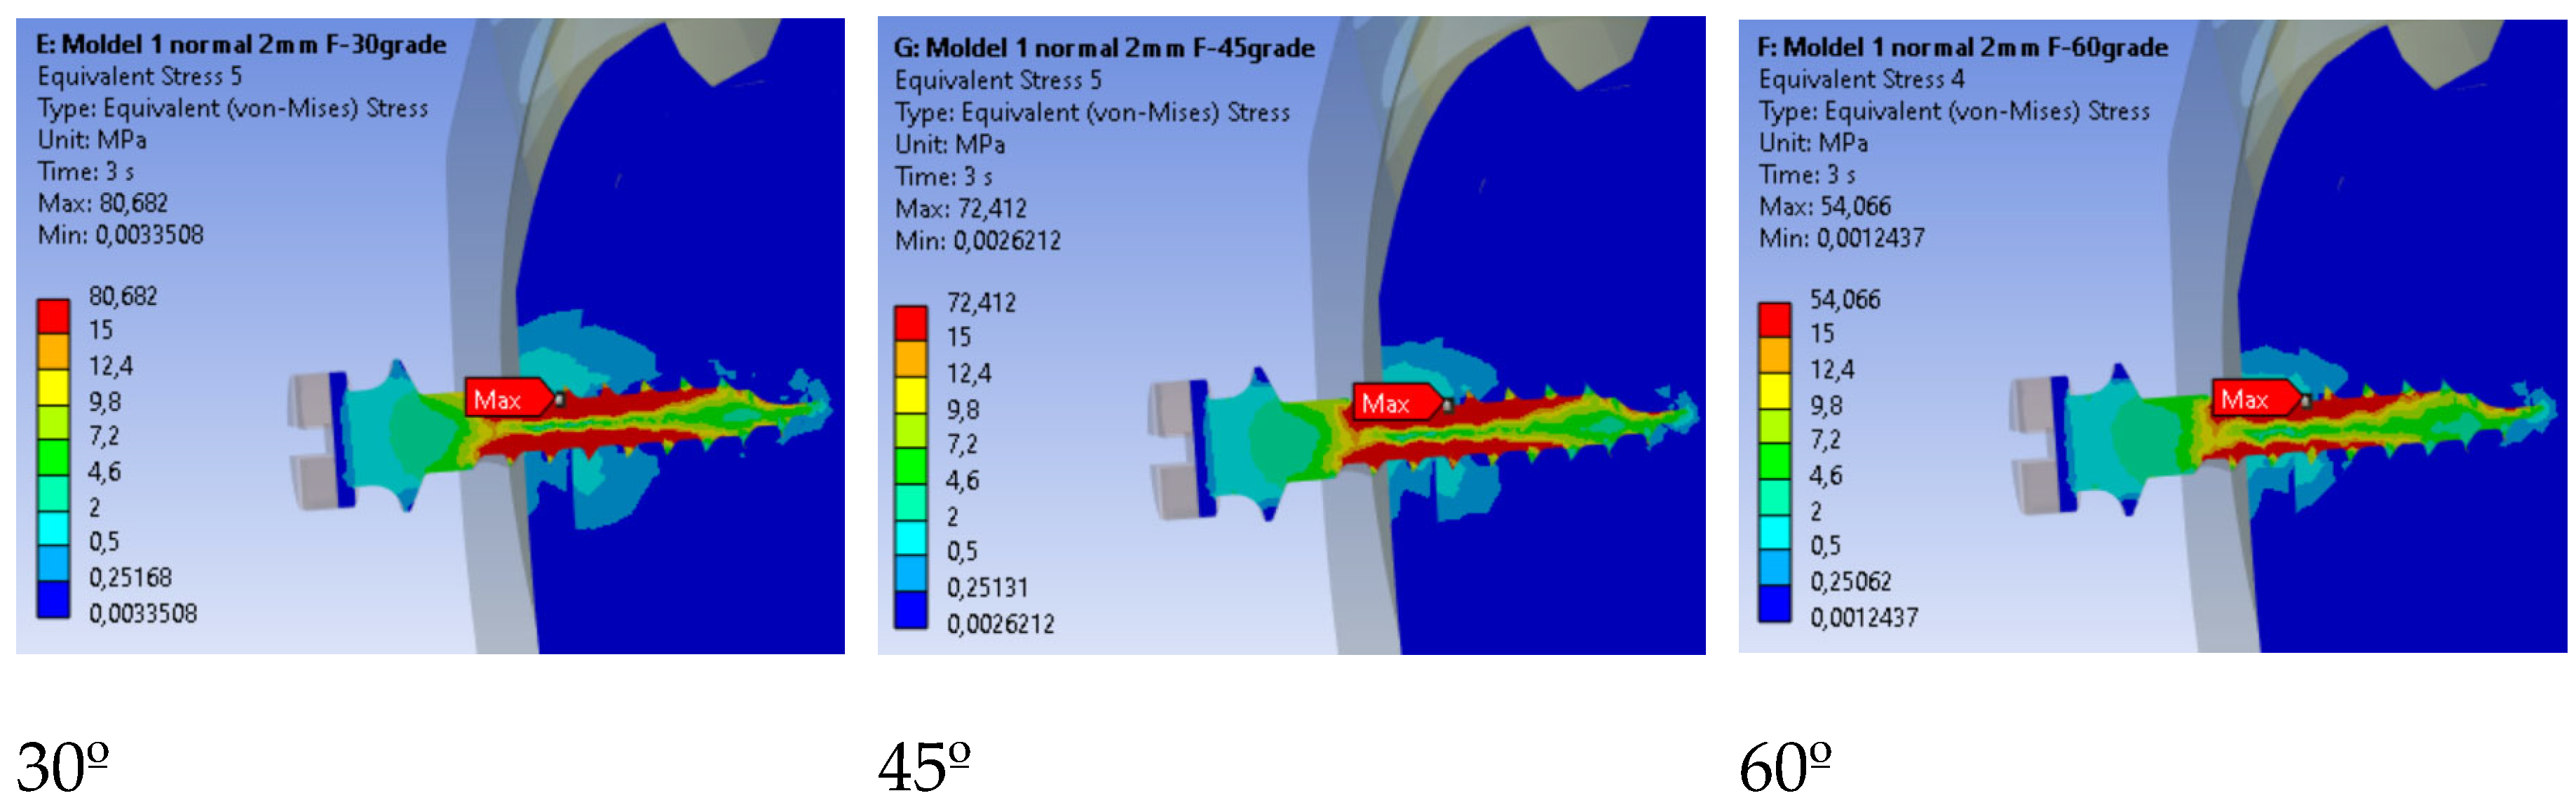
Figure 9.
Comparison of maximum stress values by loading angle.
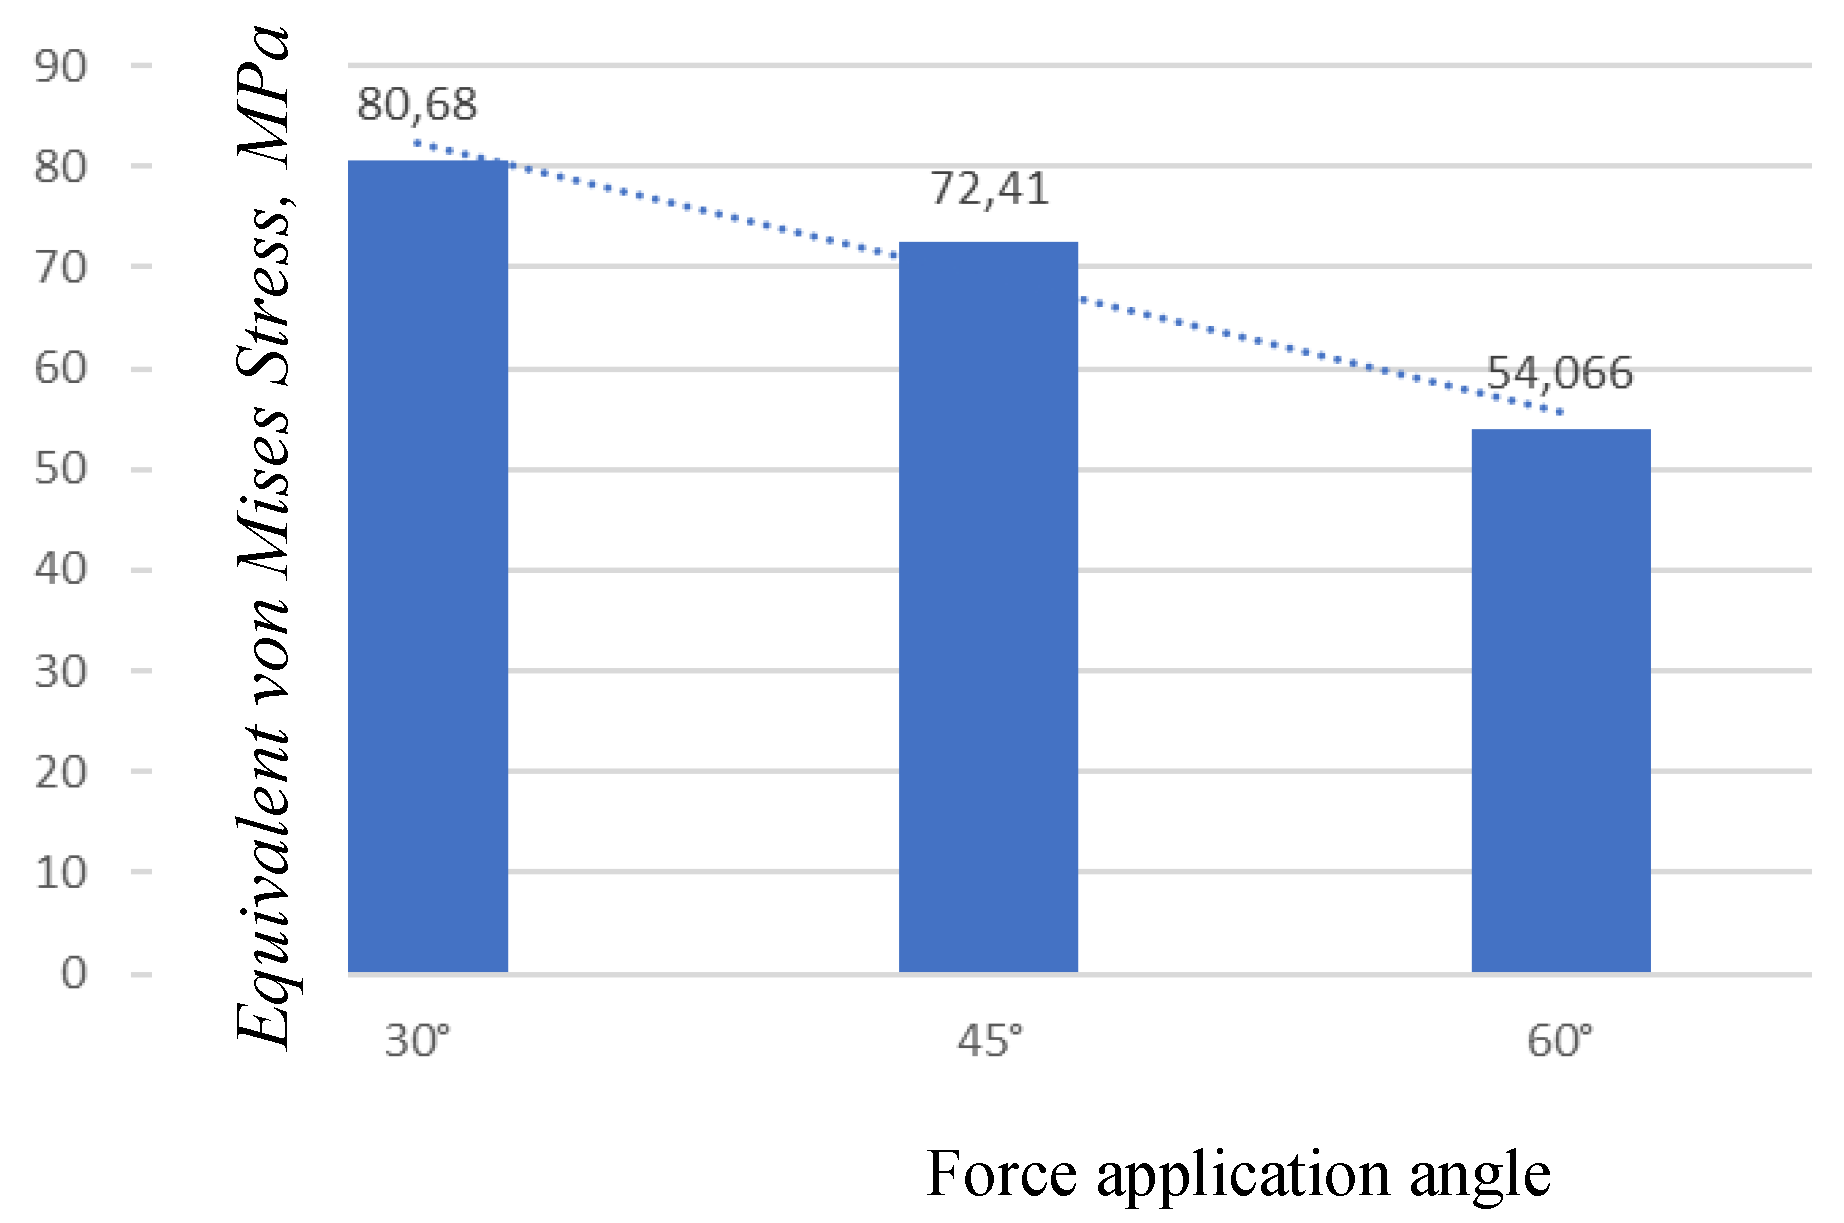
Figure 10.
Equivalent linear strain for three loading angles.
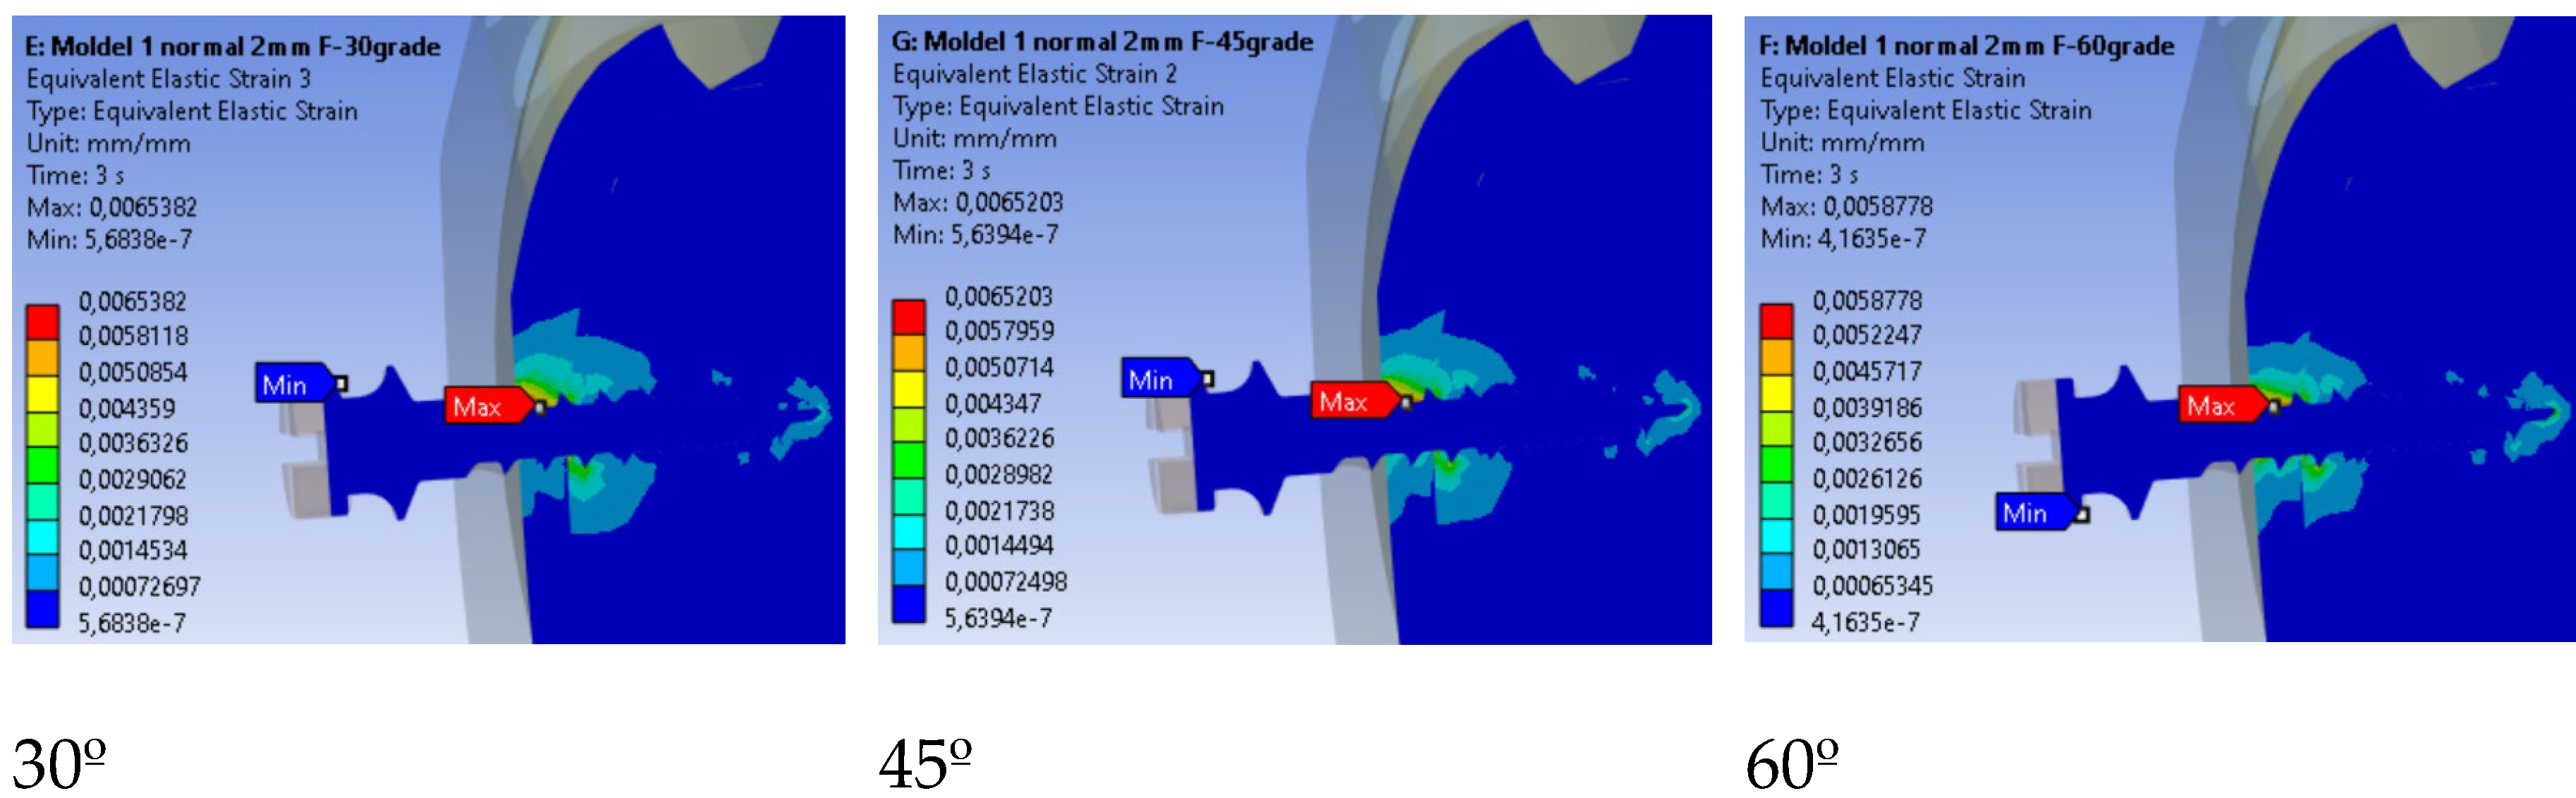
Figure 11.
Comparison of maximum strain values by loading angle.
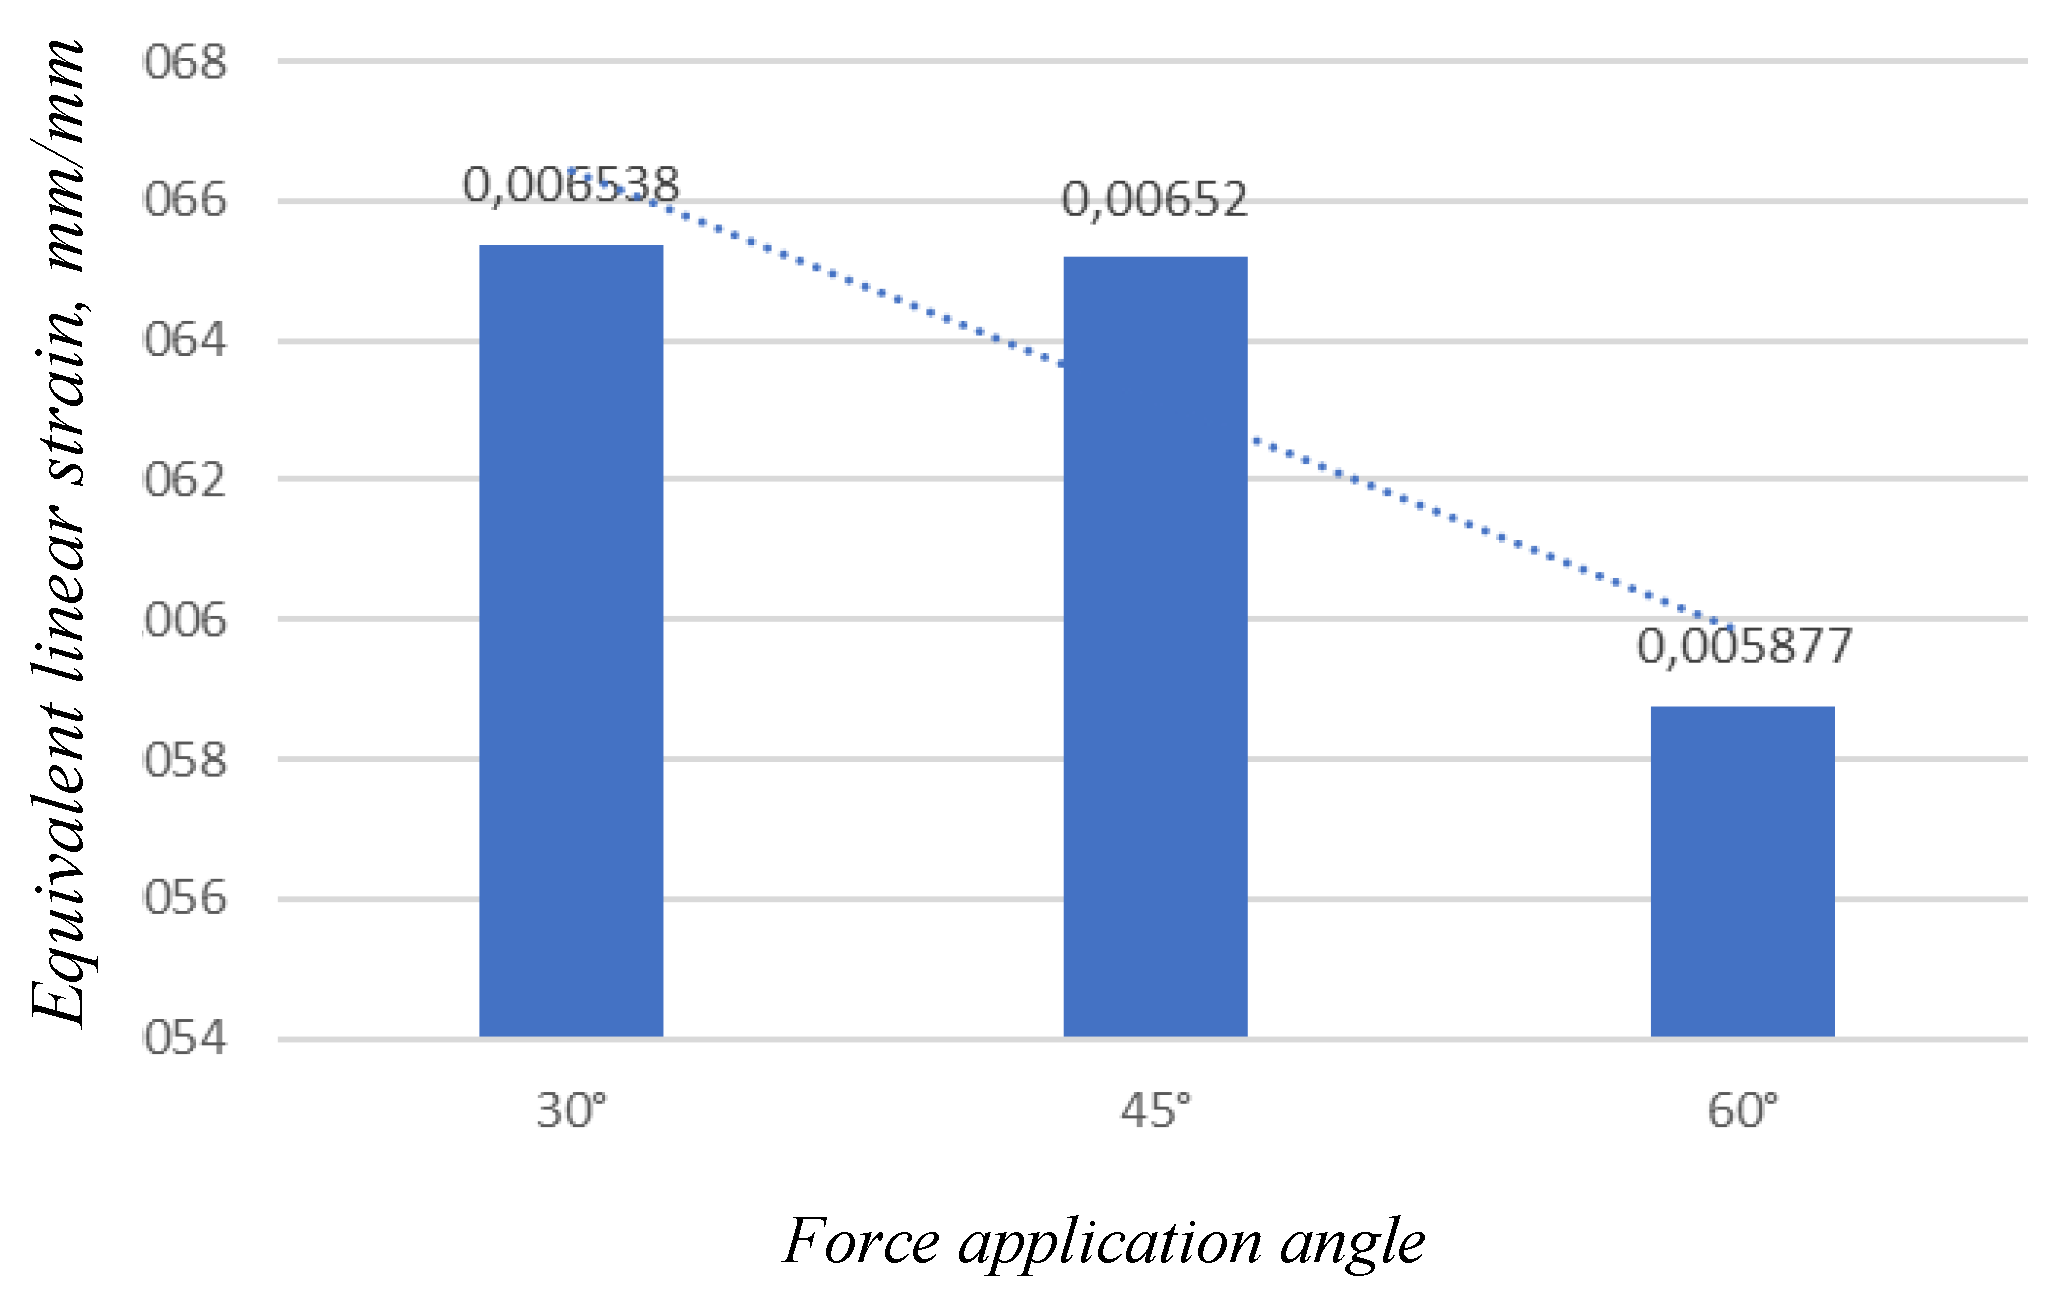
Figure 12.
Total deformation in the mini-implant according to insertion depth.
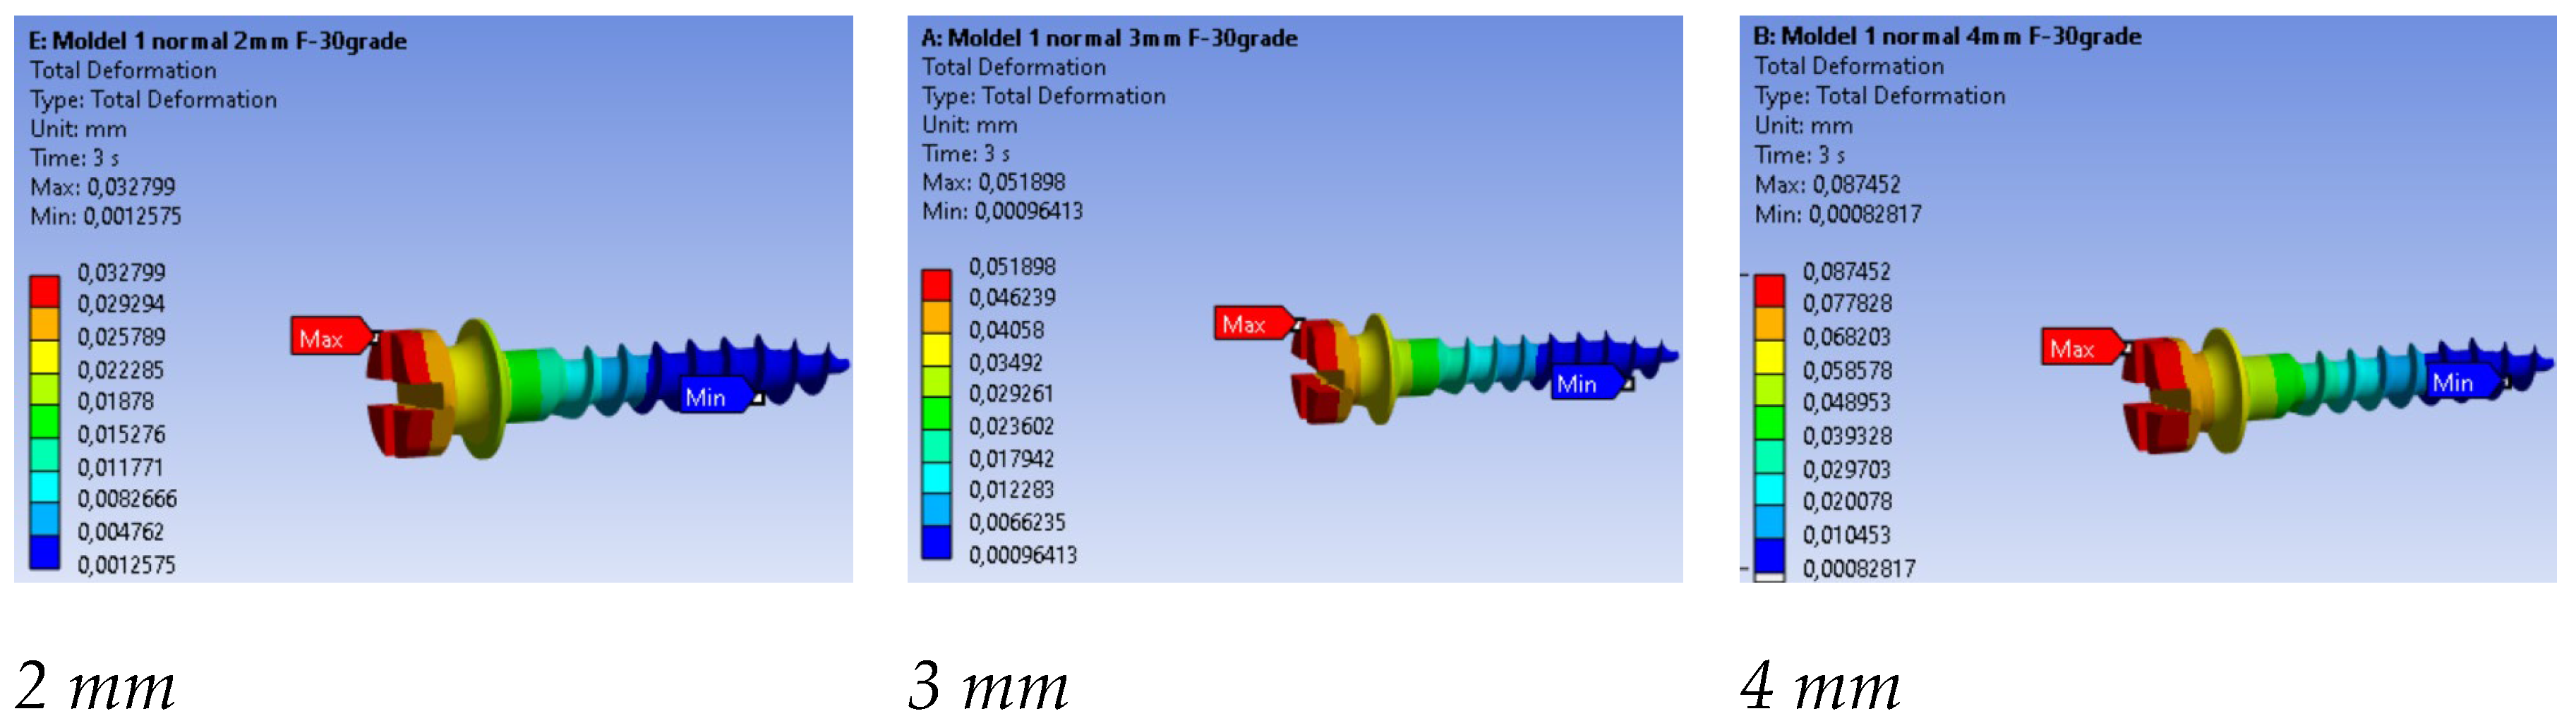
Figure 13.
Comparison of maximum total displacements by insertion depth.
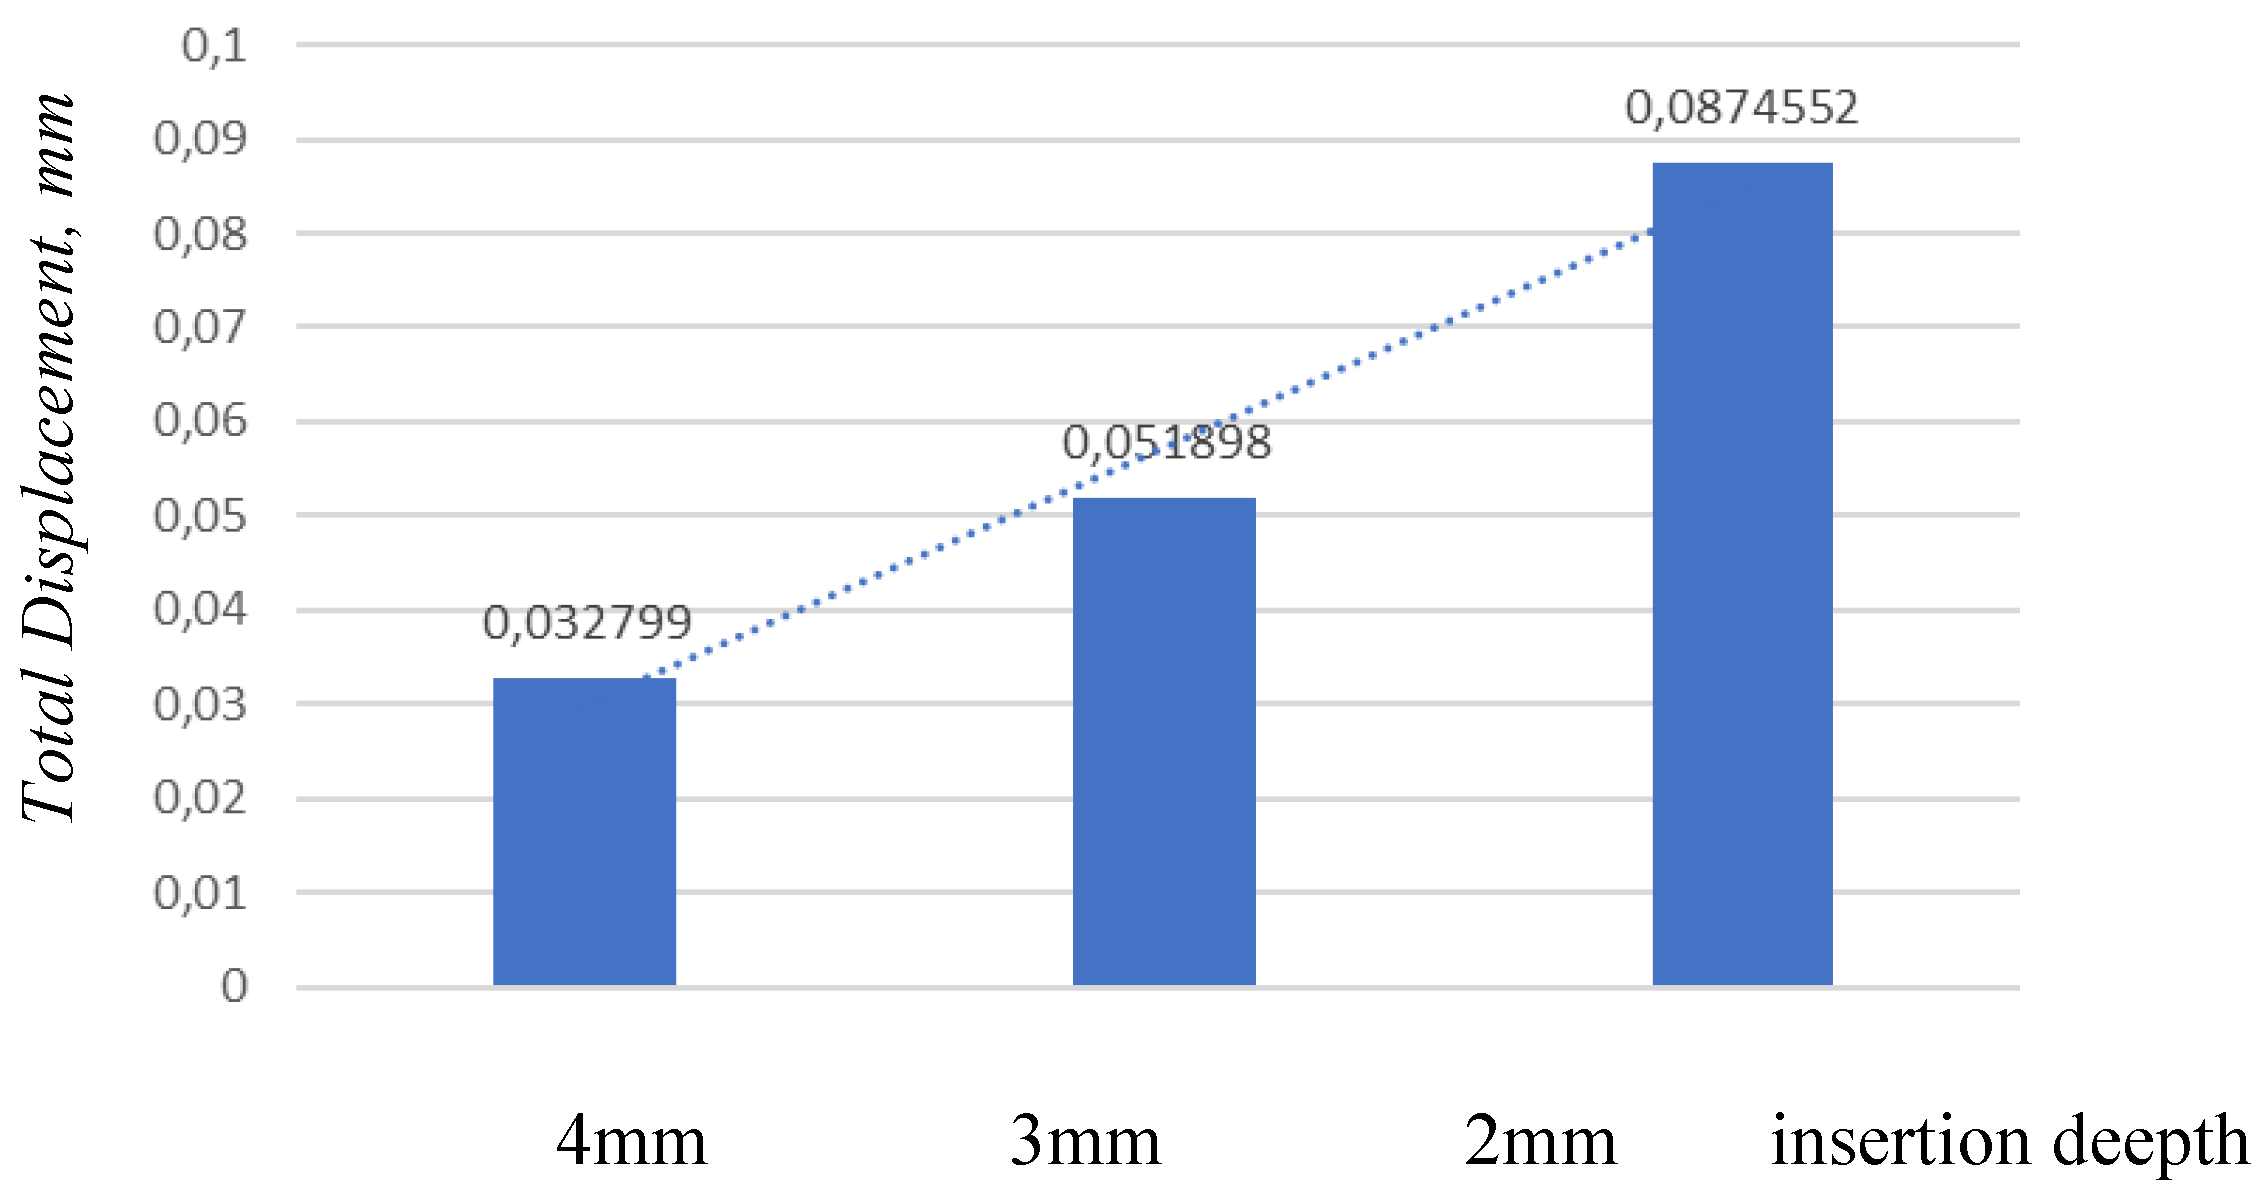
Figure 16.
Equivalent linear strain for three insertion depths.
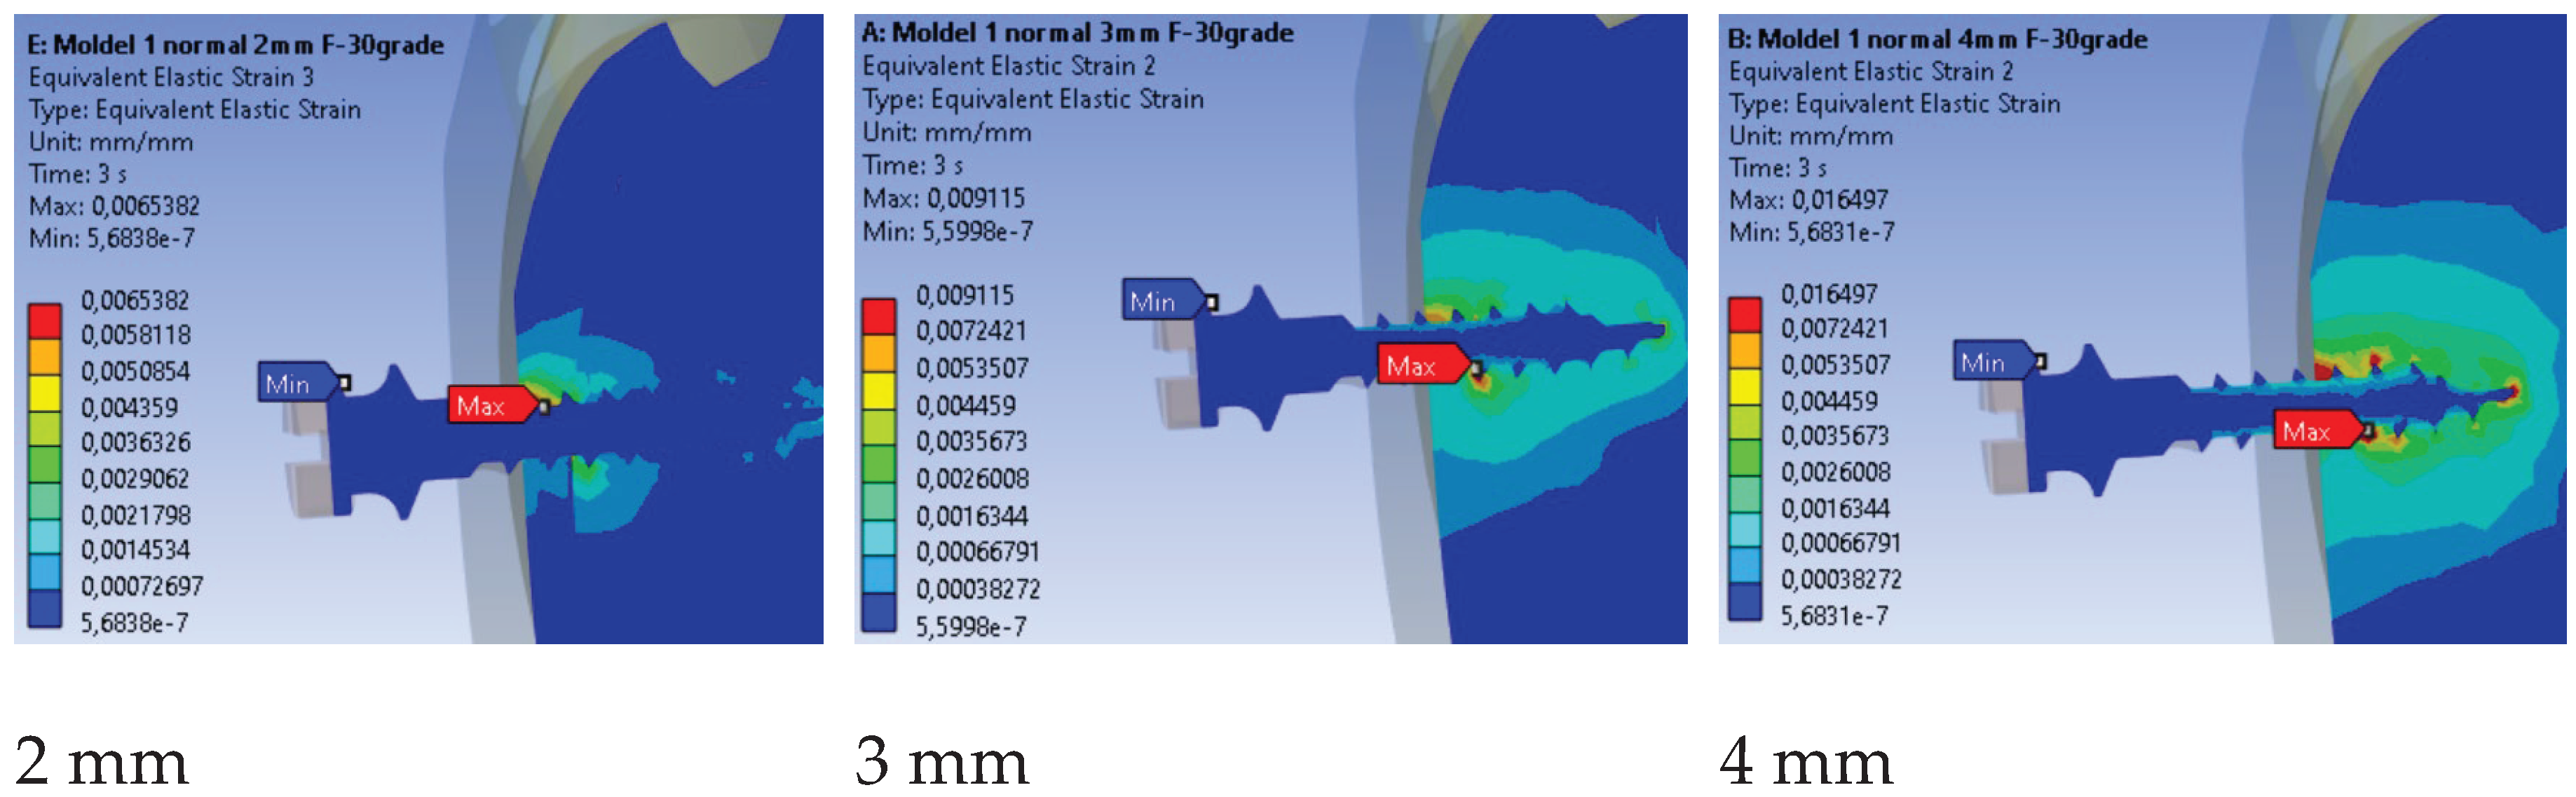
Table 1.
Summary of contact pressure and interfacial load transfer findings: present FEM results versus previous studies.
Table 1.
Summary of contact pressure and interfacial load transfer findings: present FEM results versus previous studies.
| Present FEM Study (2025) | Findings from Literature |
|---|---|
| • Max contact pressure: 5.1 MPa | • Typical range: 19.85–43.34 MPa |
| • Contact localized along thread–cortex interface | • Sivamurthy & Sundari (2016) [7]: 1.3×6 mm and 1.3×8 mm implants; stresses within titanium fatigue limit (~193 MPa). |
| • Load mainly in cortical region near implant neck | • Zhou et al. (2018) [17]: stress concentrated at neck; minimal stress near root. |
| • Pressure values lower than literature range | • Wahengbam et al. (2022) [18]: force concentration in cortical bone; within safe material limits. |
| – Nonlinear contact with separation | • Yazıcıoğlu et al. (2015) [19]: oblique loads increase stress by 5–20×; high local stresses at facial/lingual bone. |
| – Lower orthodontic forces (1–2 N) | • Lu et al. (2015) [20]: larger diameter leads to lower cortical stress. |
Disclaimer/Publisher’s Note: The statements, opinions and data contained in all publications are solely those of the individual author(s) and contributor(s) and not of MDPI and/or the editor(s). MDPI and/or the editor(s) disclaim responsibility for any injury to people or property resulting from any ideas, methods, instructions or products referred to in the content. |
© 2026 by the authors. Licensee MDPI, Basel, Switzerland. This article is an open access article distributed under the terms and conditions of the Creative Commons Attribution (CC BY) license (http://creativecommons.org/licenses/by/4.0/).
Copyright: This open access article is published under a Creative Commons CC BY 4.0 license, which permit the free download, distribution, and reuse, provided that the author and preprint are cited in any reuse.


