Submitted:
27 January 2026
Posted:
28 January 2026
You are already at the latest version
Abstract
Purpose & Research Gap: While Business Process Outsourcing (BPO) is widely studied, there is a lack of empirical research analyzing its specific impact on competitiveness within the logistics sector of emerging markets. This study addresses the gap regarding how BPO transitions from a cost-saving tool to a strategic expertise-driven model. Methodology: Data were collected from 132 logistics companies in Croatia. Structural Equation Modeling (SEM) was applied to test the hypotheses and mediation effects, as it allows for a robust analysis of complex causal relationships between latent constructs. Key Findings: SEM results reveal that BPO engagement alone does not guarantee competitiveness. The primary finding indicates that the expertise of BPO providers and strategic partnerships exert a significantly stronger positive effect on operational efficiency and market differentiation than simple cost reduction. Contribution: The paper contributes to the literature by redefining BPO as a strategic driver of innovation rather than a mere cost-cutting measure, providing logistics managers with evidence-based insights for knowledge-oriented outsourcing.
Keywords:
Business Process Outsourcing (BPO)
; logistics companies
; structural equation modeling (SEM)
; strategic partnerships
; emerging markets
; competitiveness
1. Introduction
In the contemporary globalized economy, Business Process Outsourcing (BPO) has evolved from a simple cost-reduction tactic into a sophisticated strategic management tool. BPO involves the transfer of responsibility for specific business functions to specialized external providers, enabling companies to focus on their core competencies while simultaneously reengineering their functional units (Du & Miao, 2022). In labor-intensive industries, such as logistics, BPO serves as a critical source of efficiency and competitive advantage by integrating advanced technological solutions and specialized expertise into the supply chain (Kimura, 2022).
The evolution of BPO has been accelerated by rapid advances in information and communication technologies (ICT), corporate restructuring, and the increasing demand for market agility. While early outsourcing models were primarily driven by the pursuit of lower labor costs, modern BPO strategies are increasingly rooted in the theory of dynamic capabilities. This perspective suggests that firms utilize BPO not just for efficiency, but to gain access to external knowledge and innovative processes that allow them to adapt to volatile market conditions (Helfat & Raubitschek, 2023). Furthermore, the success of these arrangements increasingly depends on relational governance, where strategic partnerships and trust-building replace traditional, purely transactional contracts.
The logistics sector in Southeast Europe, particularly in Croatia and Slovenia, presents a unique developmental trajectory within the European Union. While Slovenia has achieved deeper integration into Western supply chains, the Croatian market has faced specific institutional challenges. Historically, the adoption of BPO in Croatia was hindered by institutional resistance and stakeholder concerns regarding labor stability (Šarić, 2012). However, following Croatia’s integration into the EU single market, the logistics sector has undergone a significant transformation. Competitive pressures have forced domestic firms to harmonize with EU standards, shifting the focus of BPO from mere cost-cutting to the acquisition of high-level expertise and strategic resource exchange.
Despite the growing importance of these services, a significant research gap remains. Current literature extensively covers the general benefits of outsourcing, yet empirical evidence on the specific mechanisms through which BPO affects the competitiveness of logistics firms in emerging EU economies remains limited. Most existing studies focus on mature markets, leaving the interplay between cost reduction, provider expertise, and operational outcomes in the Adriatic region under-researched.
This study aims to address this gap by investigating the impact of BPO services on the competitiveness of logistics companies in Croatia. Using Structural Equation Modeling (SEM), the research tests whether competitiveness is driven primarily by cost efficiency or by the strategic expertise of BPO providers. By doing so, the paper contributes to the literature on strategic outsourcing and provides managerial insights into how logistics firms can leverage external partnerships to enhance their market position in an increasingly integrated European economy.
2. Theoretical Background of Business Process Outsourcing (BPO)
Business Process Outsourcing (BPO) represents a strategic reconfiguration of an organization’s value chain, combining business process management with external resource integration. Beyond the traditional dichotomy of back-office (administrative) and front-office (customer-facing) functions, modern BPO is increasingly viewed through the lens of dynamic capabilities. This framework suggests that BPO is not merely a tool for operational efficiency but a mechanism for firms to sense and seize market opportunities by accessing global talent pools and fostering organizational learning (Helfat & Raubitschek, 2023).
In the logistics sector, BPO serves as a catalyst for supply chain development. While early literature emphasized cost reduction as the primary driver, contemporary research highlights the transition toward knowledge-intensive BPO. This shift focuses on knowledge coordination, process flexibility, and the enhancement of core competencies (Chou et al., 2015; Hartmann, 2021). For logistics providers, BPO implementation allows for the delegation of complex, data-heavy tasks to specialized partners who possess superior technical expertise and infrastructure.
2.1. Strategic and Relational Dimensions of BPO in Logistics
The efficacy of BPO in logistics is no longer solely dependent on the technical execution of tasks but on relational governance. Unlike transactional outsourcing, which is governed by rigid contracts, relational governance emphasizes trust, shared goals, and collaborative problem-solving. This approach is vital in managing high-complexity logistics processes such as:
Digital Data Management & Indexing: Continuous digitization and automated document indexing ensure high data integrity, which is a prerequisite for real-time supply chain visibility (Arvis et al., 2024).
Automated Financial Operations: Modern BPO providers utilize AI-driven invoice processing and freight bill auditing, which minimizes human error and optimizes cash flow management (Doxey, 2021).
Advanced Logistics Accounting: Beyond simple bookkeeping, BPO partners provide sophisticated cost allocation and inventory analytics, enabling firms to achieve economies of scale (Zadorozhnyi et al., 2020).
2.2. BPO as a Driver of Competitiveness
Logistics companies leverage BPO to achieve three levels of process improvement: enhancement of local processes, optimization of existing workflows, and revolutionary reengineering of the organizational structure. In emerging markets, BPO acts as a bridge to international standards, allowing domestic firms to compensate for internal resource constraints by “plugging into” the advanced capabilities of BPO providers.
Current empirical evidence (e.g., Özdemir et al., 2021) suggests that the integration of BPO in logistics is a strategic response to increasing market volatility. By outsourcing non-core yet data-intensive functions, logistics firms develop the agility required to survive economic downturns and sustain long-term competitiveness.
3. Methodology
3.1. Data Analysis and Statistical Methods
Data processing and statistical analyses were performed using IBM SPSS Statistics v25.0 and IBM AMOS v25.0. The following methodological framework was applied:
Exploratory Factor Analysis (EFA): To identify the underlying latent structures, EFA was conducted using the Principal Component Analysis (PCA) method with Varimax orthogonal rotation. Factors were retained based on the Kaiser criterion (eigenvalue > 1). The analysis yielded six distinct factors, with all measurement scales demonstrating high internal consistency (Cronbach’s alpha > 0.8), exceeding the recommended threshold for reliability.
Confirmatory Factor Analysis (CFA): Following the EFA, a Confirmatory Factor Analysis was performed to validate the measurement models and ensure convergent and discriminant validity. This step was crucial for confirming that constructs such as “cost reduction” and “provider expertise” are statistically distinct, thereby providing a robust foundation for the structural model.
Normality Testing and Estimation Robustness: The Kolmogorov-Smirnov test indicated a significant deviation from normal distribution across all variables. To address this non-normality and ensure the reliability of the Maximum Likelihood (ML) estimation in SEM, a bootstrapping procedure with 5,000 resamples was implemented. This approach allows for the generation of robust standard errors and bias-corrected confidence intervals, mitigating the impact of distribution skewness common in survey-based research.
Structural Equation Modeling (SEM): SEM was utilized to test the complex causal and mediation relationships defined in the hypotheses. By simultaneously evaluating the relationships between manifest and latent variables, SEM provided a comprehensive assessment of how BPO engagement translates into competitiveness through the mediating paths of expertise and cost optimization.The sample size of N=132 is considered appropriate for Structural Equation Modeling (SEM) within the specific context of the Croatian logistics market, meeting the requirements for model stability and power in a specialized industry (Hair et al., 2024). Data screening confirmed the absence of missing values, ensuring the integrity of the statistical analysis.
The primary objective of this research is to analyze the mechanisms through which BPO services enhance the competitiveness of logistics firms. Moving beyond a simple cost-benefit analysis, this study investigates how different BPO drivers (cost vs. expertise) contribute to operational outcomes. Based on the established research gap and the proposed theoretical framework, the hypotheses are formulated as follows:
H1.
The implementation of Business Process Outsourcing (BPO) has a significant positive impact on the overall competitiveness of logistics companies.
H2.
The expertise and strategic competence of BPO providers exert a stronger mediating influence on a firm’s competitiveness and operational efficiency than the mere reduction of operating costs.
To precisely test this relationship within the structural model, H2 is further operationalized as:
H2a.
The reduction of operating costs is a significant mediator between BPO implementation and competitiveness.
H2b.
The expertise and strategic competence of BPO providers have a stronger and more significant positive effect on competitiveness than cost reduction.
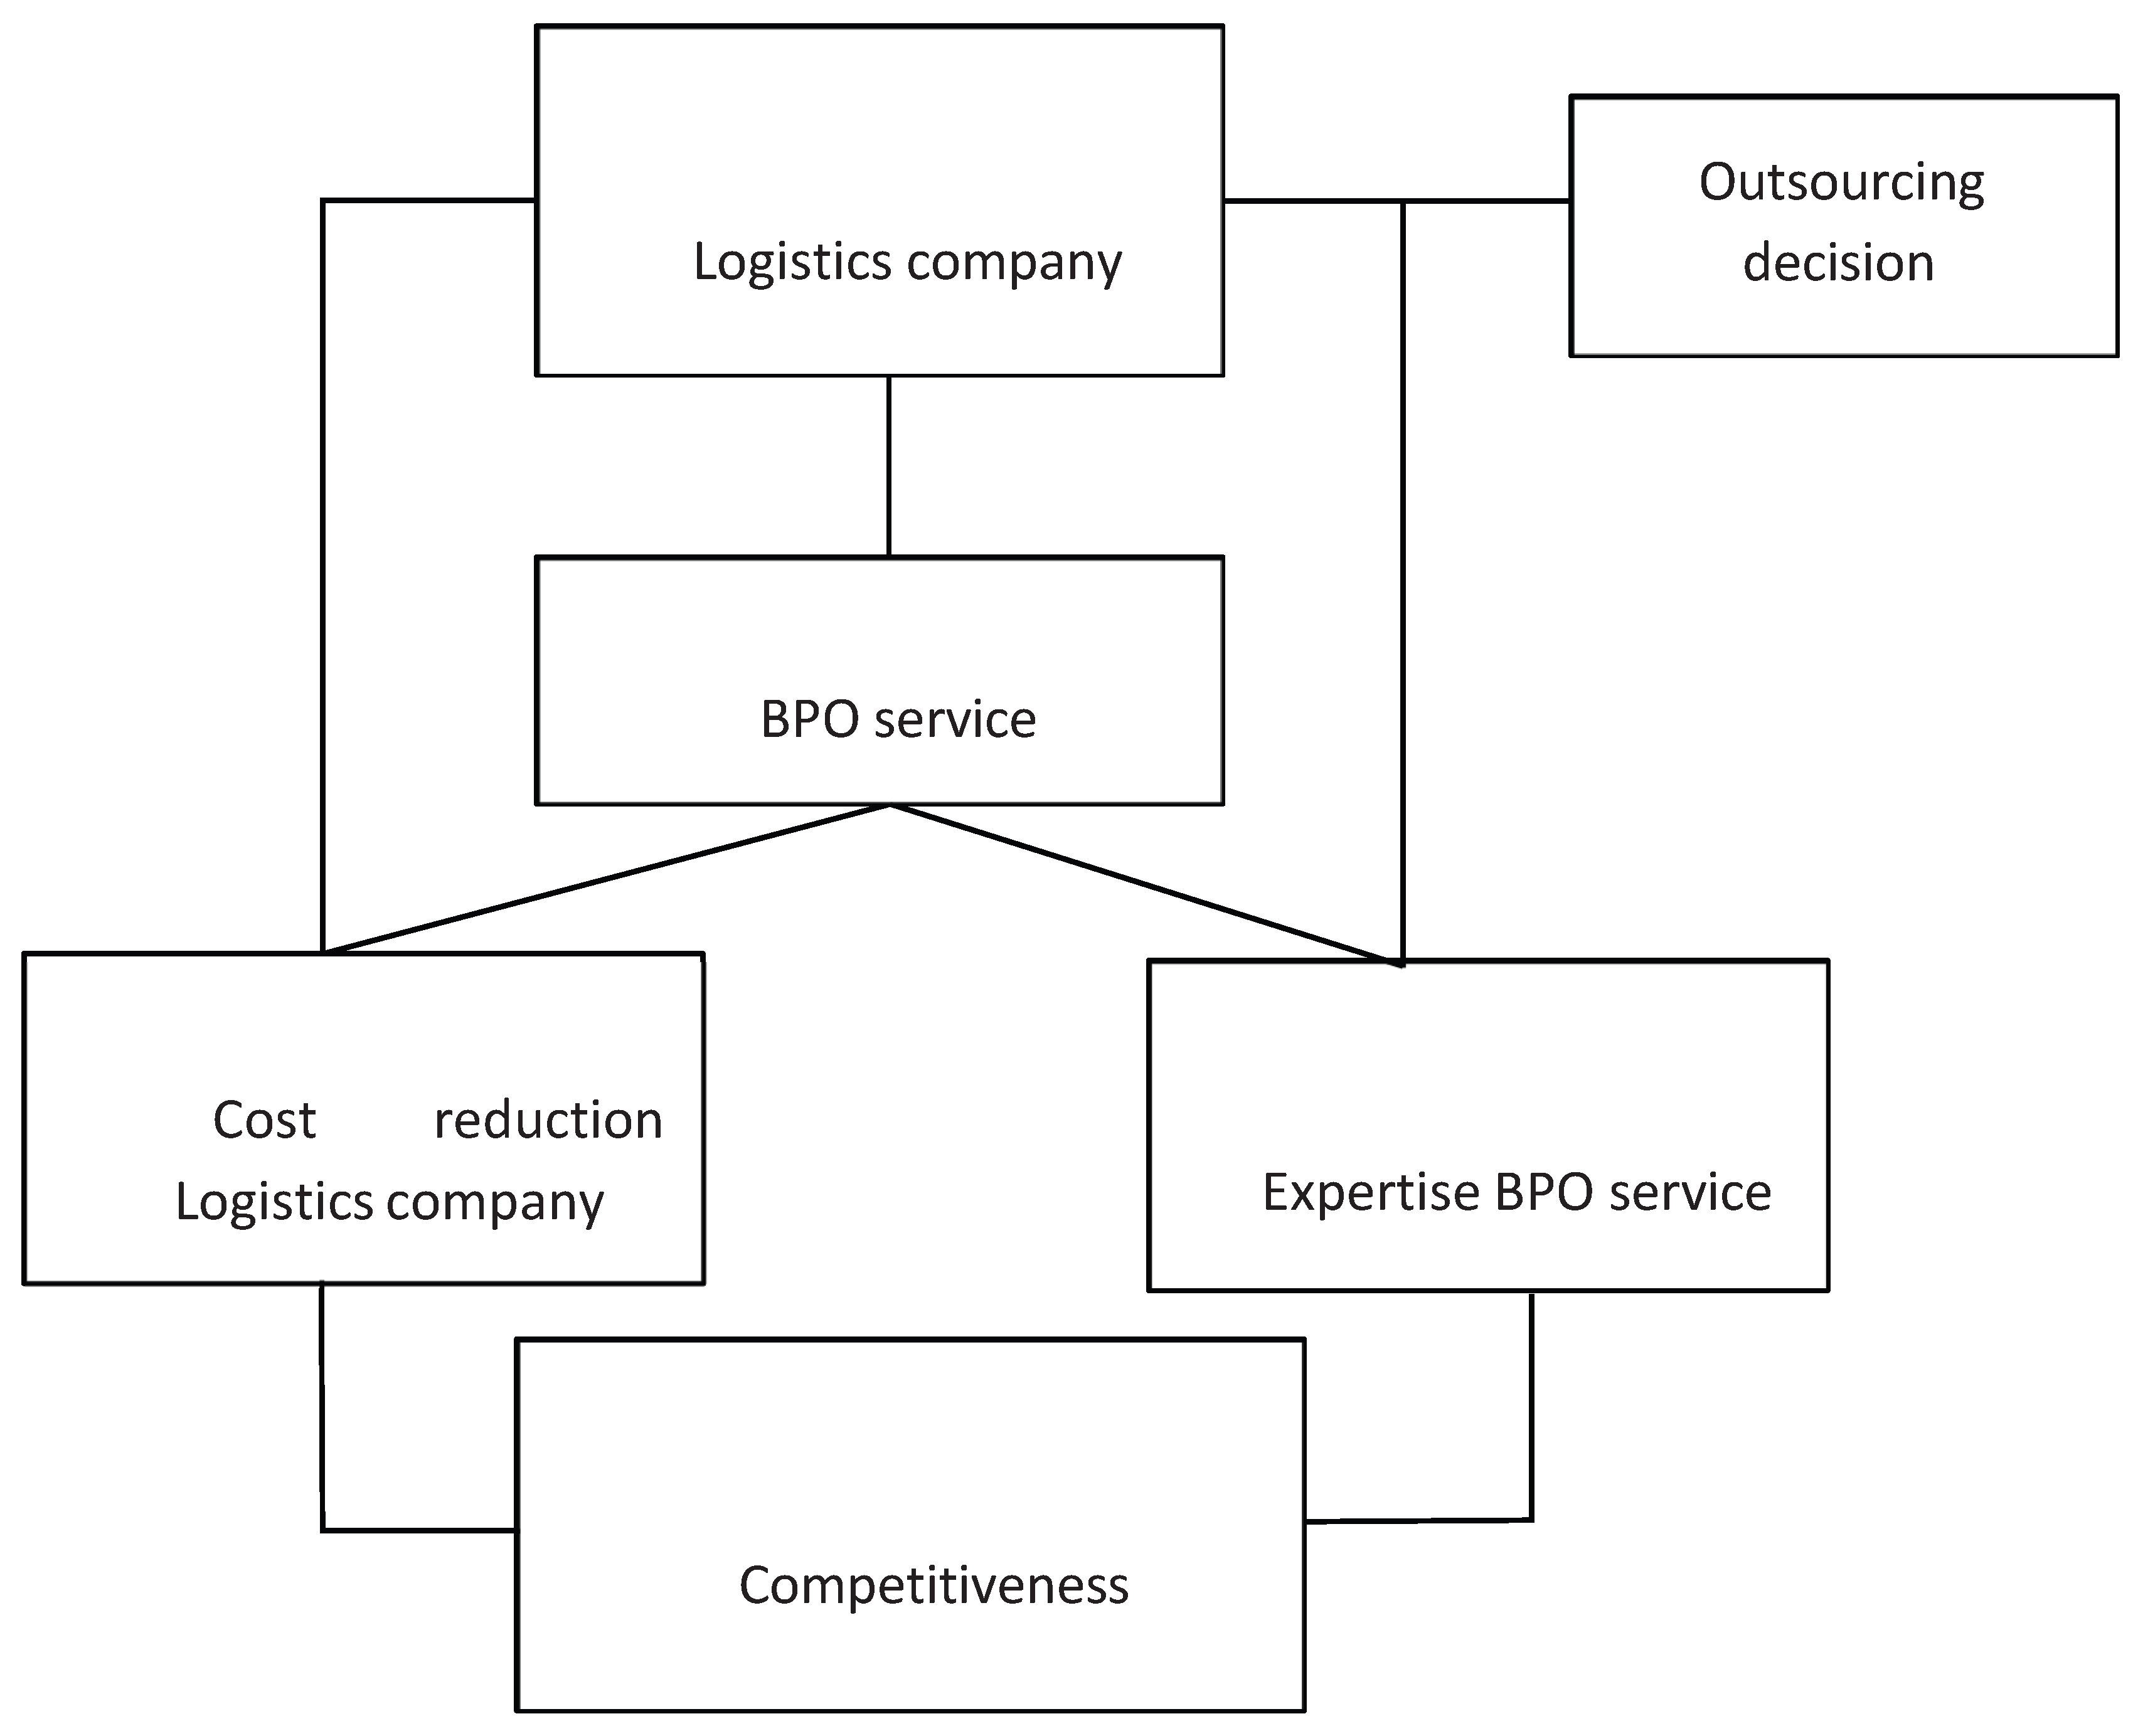
Figure 1.
Conceptual model. Source: own research.
The last column in Table 1 indicates the percentage of companies that stated they outsource each activity. The total sum of this column is greater than 100% because companies could list multiple activities.

Table 2.
Descriptive statistics of logistics companies.
|
1 |
2 |
3 |
4 |
5 |
6 |
||
| N | Valid | 132 | 132 | 132 | 132 | 132 | 132 |
| Missing | 0 | 0 | 0 | 0 | 0 | 0 | |
| Mean | 2,36 | 4,30 | 2,24 | 2,58 | 2,05 | 1,63 | |
| Median | 2,00 | 5,00 | 2,00 | 3,00 | 2,00 | 2,00 | |
| Std. Deviation | 0,711 | 1,865 | 1,085 | 0,802 | 0,755 | 0,485 | |
| Skewness | -0,641 | -0,483 | 1,686 | -1,423 | 0,408 | -0,538 | |
| Std. Error of Skewness | 0,211 | 0,211 | 0,211 | 0,211 | 0,211 | 0,211 | |
| Kurtosis | -0,795 | -1,366 | 2,220 | 0,100 | -0,131 | -1,736 | |
| Std. Error of Kurtosis | 0,419 | 0,419 | 0,419 | 0,419 | 0,419 | 0,419 | |
| Minimum | 1 | 1 | 1 | 1 | 1 | 1 | |
| Maximum | 3 | 6 | 5 | 3 | 4 | 2 | |
| Sum | 311 | 567 | 296 | 340 | 271 | 215 | |
Sources: own research.
Data preparation and storage for statistical analysis was done in MS Excel 2013. IBM SPSS
SCALA 1- BPO RESPECTS AND PROTECTS.
SCALE 2 - STRATEGIC PARTNERSHIP ENABLES THE COMPANY.
SCALE 3 - REDUCTION OF THE COMPANY’S OPERATING COSTS.
SCALE 4 - IMPLEMENTATION OF BPO SERVICES AFFECTS COMPETITIVENESS.
SCALE 5 - BPO SERVICES AFFECTS COMPETITIVENESS THROUGH COMPETITIVENESS.
SCALE 6 - BPO SERVICES IMPROVE.
For our research, we tested three scales/factors:
SCALE 3 - REDUCTION OF COMPANY OPERATING COSTS consists of the following statements:
12.1-The company’s operating costs are reduced
11.5-BPO service maintains the service in the shortest possible time 11.2-BPO service accepts work orders in the shortest possible time 12.3-Lower labor costs
11.4-BPO service controls the execution of the service in the shortest possible time 12.5-The overall costs for the company’s operations are lower
11.1-BPO service delivers the service in the shortest possible time 12.4-Lower operating costs increase the value of the company 12.2-The company’s turnover time is reduced
SCALE 4 - IMPLEMENTATION OF BPO SERVICE AFFECTS COMPETITIVENESS consists of the following statements:
9.2-Implementation of BPO has influenced the increase in the company’s innovativeness 9.3-Implementation BPO influenced better adaptation to customer and market requirements 9.4-Implementation of BPO influenced employee development and continuous learning
9.1-Implementation of BPO influenced improvement of product and service quality
SCALE 5 - BPO SERVICE AFFECTS COMPETITIVENESS THROUGH COMPETITION consists of the following statements:
8.2-Competence of the own company to perform a given activity in comparison to the supplier is low
8.4-Expertise of the BPO service as a supplier is of higher quality compared to the internal department of our company
8.3-Costs of the BPO service for a given activity are lower than the costs of the internal unit that performed the activity within the company.
8.1-BPO supplier has higher quality business solutions.
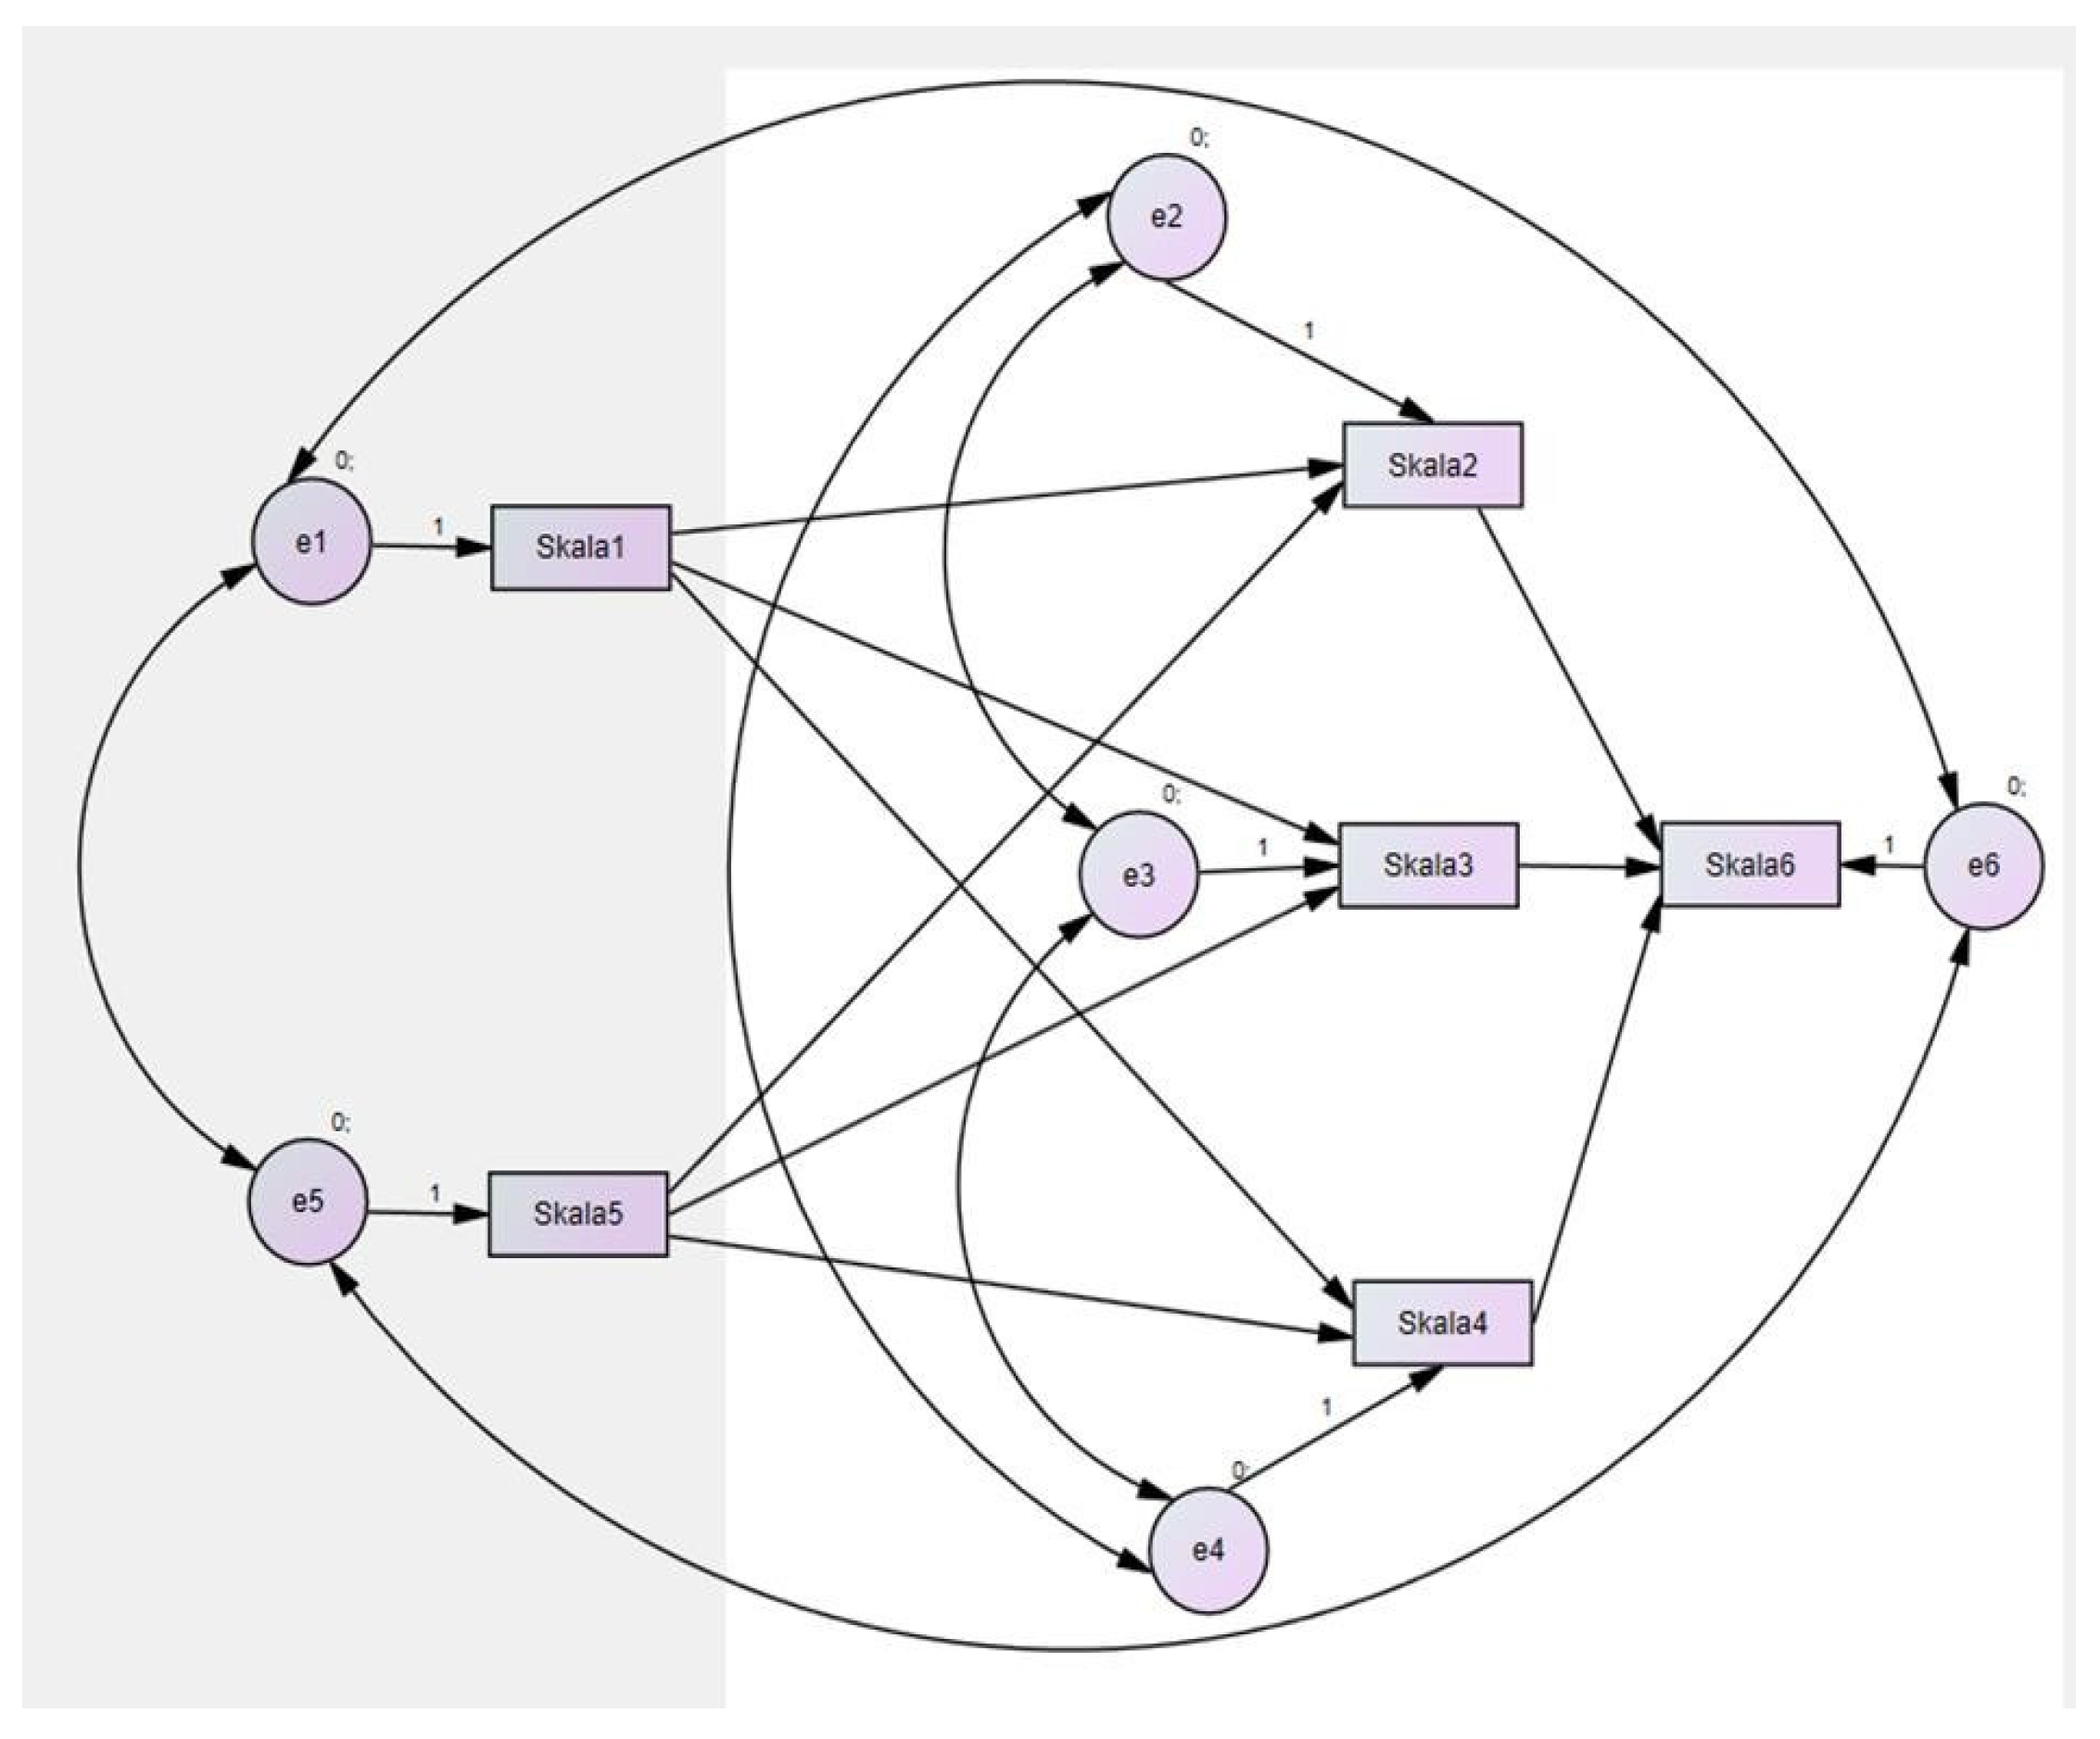
Figure 2.
Input Path diagram: own research Šarić, M.
3.2. Sample and Data Collection
The research was conducted by distributing a structured survey questionnaire to the authorized email addresses of 420 logistics companies operating in the Republic of Croatia. A total of 132 valid responses were collected, resulting in a response rate of approximately 31.4%. The sample consisted of companies that utilize BPO services for single (37.1%) or multiple business activities (62.9%).
A stratified sampling method was employed to ensure that the sample accurately represents the population of Croatian logistics providers across different strata, specifically company size (number of employees) and ownership type. The majority of the participating firms are privately owned (77.3%), while 19.7% are publicly owned and 3% are under mixed ownership. In terms of size, small and medium enterprises (SMEs) with 10 to 49 employees represent the largest segment (51.5%), followed by firms with 1 to 9 employees (23.5%) and those with 50 to 249 employees (21.2%). Only 3.8% of the sample consisted of large enterprises with 250 or more employees. Regarding organizational history, nearly half of the firms (49.2%) were established after 2001, reflecting the dynamic growth of the logistics market following Croatia’s deeper integration intoEU value chains
4. Research Results
4.1. Factor Analysis
By grouping 35 statements (items) from the questionnaire that were answered by selecting the degree of agreement on the Likert scale and which were already grouped into 7 scales in the questionnaire, we formed new scales/factors using exploratory factor analysis (EFA) (Brown, 2006; Seashore & Yuchtman, 1967).
The factor analysis program generates a series of tables. The first table contains correlation coefficients that show that each of the 35 statements is related to all other statements, and we did not include this table in the paper due to its size. Some correlations between statements are high (+ or – 0.60 or greater) and some are close to 0. High correlations (>0.60) mean that the associated statements are likely to be in the same factor, mean correlation (0.20 – 0.60) means that the associated statements may be in the same factor, and at low correlations (<0.20) the associated statements will not be in the same factor.Several assumptions are then tested. The determinant of the correlation matrix should be greater than 0. In our case, Determinant=5.888E-16, so this assumption is fulfilled (Ho, 2006).
With the level of statistical significance α=0,001, Bartlett’s sphericity test indicates that the variables correlate high enough and provide a reasonable basis for conducting factor analysis (p<α). The matrix with correlation coefficients is statistically significantly different from the unit matrix.Due to the large sample and fulfilled assumptions, the data are suitable for factor analysis.For the method of extracting (extracting) or obtaining factors from 35 manifest variables,
the iterative method of common factors (PAF, Principal Axis Factoring) was used. To determine the number of factors that it makes sense to use in the continuation of the analysis, we used the Kaiser criterion, we took into further analysis only those factors with variance > 1.
Table 3 gives a representation of the eigenvalues of the correlation matrix that are variances or magnitudes of significant factors, before and after orthogonal rotation, and a cumulative representation of the extent to which all significant factors contribute to the explanation of variance.
Table 4.
Total explained variance using significant factors.
| Extraction Sums of Squared Loadings | Rotation Sums of Squared Loadings | |||||
| Factor | Total | % of Variance | Cumulative % | Total | % of Variance |
Cumulative % |
| 1 | 15.998 | 45.703 | 45.703 | 5.270 | 15.059 | 15.059 |
| 2 | 3.118 | 8.908 | 54.610 | 5.220 | 14.913 | 29.972 |
| 3 | 1.398 | 3.994 | 58.575 | 5.217 | 14.904 | 44.876 |
| 4 | 1.057 | 3.021 | 61.596 | 3.308 | 9.451 | 54.328 |
| 5 | 0.921 | 2.632 | 84.228 | 2.582 | 7.377 | 61.704 |
| 6 | 0.730 | 2.086 | 86.314 | 1.613 | 4.609 | 66.314 |
6 post-rotation factors have an explained variance measure greater than 1, which is the accepted criterion for the factor to be included in further analysis. We used orthogonal rotation (varimax). This means that the final factors do not correlate as much as possible with each other. Consequently, we can assume that the information interpreted by one factor is independent of the information carried by other factors. We rotate the factors to make them as easy as possible to interpret. After rotation, the first factor explains 15.059% of the variance, the second explains 14.913%, the third factor explains 14.904% of the variance, the fourth 9.451%, the fifth 7.377% and, finally, the sixth factor explains 4.609% of the variance. The total proportion of the explained variance is 66.314% (File S1: Matrix of rotated factors).
The decision to retain the 6 factors was taken after personal analysis by the author and verification of the reliability of the measurement scales (scales). All 35 claims that will be needed for further doctoral research have been retained. In the case of this original scientific paper, we will use three factors to test hypotheses, namely:
1. Implementation of BPO service.
2. Reduction of operating costs of companies.
3. BPO affects competitiveness due to competence.
4.2. Confidence Checks of Measurement Scales
The reliability of measurement scales is tested by calculating Cronbach’s Alpha coefficients, as well as by calculating what would be the value of Cronbach’s Alpha coefficients for individual measurement scales if each respective statement were removed from the scale. Cronbach’s Alpha coefficient has become one of the most used coefficients for determining the reliability of measurement scales.Cronbach’s Alpha coefficient (Cronbach’s alpha α) represents the measure of internal consistency of a set of statements and can range between 0 and 1. The closer Cronbach’s Alpha coefficient is to 1, the more reliable the measurement scale is.
Regarding the reliability criteria of measurement scales, Kline (Kline, 1998) states that if the reliability coefficient (including Cronbach’s Alpha coefficient) approaches a value around 0.9, the reliability can be considered excellent. If it approaches a value around 0.8, the reliability can be considered very good, and if it approaches a value around 0.7, then the reliability is considered acceptable. In cases where the reliability coefficient is less than 0.5, it indicates that more than half of the observed variance could be due to random error, and measurement scales with such low reliability coefficients cannot be considered reliable and should not be used in further analysis.
Table 5.
Reliability analysis results.
| Cronbach’s Alpha | Cronbach’s Alpha based on standardized items | N of items | |
|
1- BPO RESPECTS AND PROTECTS |
0,919 | 0,924 | 6 |
| 2-STRATEGIC PARTNERSHIP ENABLES THE COMPANY | 0,907 | 0,911 | 8 |
| 3- REDUCTION OF OPERATING COSTS OF COMPANIES | 0,943 | 0,945 | 10 |
| 4- IMPLEMENTATION OF BPO SERVICES AFFECTS COMPETITIVENES |
0,897 | 0,898 | 4 |
| S | |||
| 5-BPO SERVICE AFFECTS COMPETITIVENES S THROUGH COMPETENCE | 0,838 | 0,836 | 4 |
| 6-BPO SERVICE IMPROVES | 0,819 | 0,818 | 3 |
Sources: own research :Šarić M.
The previous table shows the values of Cronbach’s Alpha coefficients for the applied measurement scales and the number of questions/statements in each scale.
Based on the Cronbach’s Alpha coefficients shown in the previous table, it can be concluded that the applied measurement scales in our research case have a very satisfactory level of reliability, confirming them as valid instruments for measuring respondents’ attitudes and opinions.
Testing Structural Equation Models (SEM)
4.3. Model Validation and Fit Measures
To test the cause-and-effect relationships between latent variables (factors) identified by exploratory factor analysis, a structural equation model (SEM) was used in the IBM AMOS v25.0 program. The established model tested the influence of factors Scale 1 and Scale 5 as exogenous variables on factors Scale 2, Scale 3, Scale 4, and Scale 6 as endogenous variables.
The model was first validated by checking fit indices. The values of these indices show the extent to which the proposed theoretical model corresponds to the collected data. Table 28 shows the key measures of model fit.The model was first validated by checking fit indices. The values of these indices show the extent to which the set theoretical model corresponds to the collected data. shows the key measures of model fit.
Table 6.
Model fit measures.
| Measure Name | Abbr. | Model Value | Recommended/Value | Fit |
| Chi-square | χ²/df | 2.805 | < 3.0 (for good fit) | Good |
| RMSEA | RMSEA | 0,041 | < 0.08 (acceptable) | Good |
| CFI | CFI | 0.911 | > 0.90 (acceptable) | Acceptable / Good |
| TLI | TLI | 0.902 | > 0.90 (acceptable) | Acceptable / Good |
Note. Adapted from “How to Interpret SEM Model Fit Results in AMOS” by L. Miljko, 2025 (https://www.statistischedatenanalyse.de/index.php/research-methods/sem- amos/How_to_interpret_sem_model-Fit_results_in_amos.pdf).
The analysis of the fit measures indicates that the established model is well adapted to the data from the sample, which enables further interpretation of the path coefficients and hypothesis testing.
Hypothesis Testing and Path Analysis Results .
A structural equation model was tested to assess the effects between latent variables, and the results are shown in Figure 3. (standardized Output Path diagram). The standardized regression coefficients (\( \beta \) ) indicate the strength and direction of the effect, while the p-value indicates statistical significance. Figure 3. Standardized structural equation model
Table 7.
Regression Weights: (Group number 1 - Default model) Standardized and unstandardized path coefficients (full table from AMOS).
Table 7.
Regression Weights: (Group number 1 - Default model) Standardized and unstandardized path coefficients (full table from AMOS).
| Estimate | S.E. | C.R. | P | Label | |||
| Skala2 | <--- | Skala1 | 0,423 | 0,113 | 3,737 | *** | par_1 |
| Skala3 | <--- | Skala1 | 0,499 | 0,084 | 5,936 | *** | par_2 |
| Skala3 | <--- | Skala5 | 0,304 | 0,091 | 3,331 | *** | par_3 |
| Skala4 | <--- | Skala5 | 0,388 | 0,12 | 3,239 | 0,001 | par_4 |
| Skala4 | <--- | Skala1 | 0,569 | 0,11 | 5,153 | *** | par_7 |
| Skala2 | <--- | Skala5 | 0,29 | 0,123 | 2,362 | 0,018 | par_8 |
| Skala6 | <--- | Skala2 | 0,596 | 0,096 | 6,239 | *** | par_5 |
| Skala6 | <--- | Skala3 | -0,029 | 0,128 | -0,229 | 0,819 | par_9 |
| Skala6 | <--- | Skala4 | -0,048 | 0,102 | -0,467 | 0,641 | par_11 |
Explained Variance
Based on the results presented in Table 8, it can be concluded that the predictor variables are moderately successful in explaining the variance in Scales 3 and 4 (with an explained variance of approximately 41% to 46%). On the other hand, they are less successful in explaining the variance in Scale 2 and the final outcome variable, Scale 6 (where they explain about 25% to 27% of the variance).
Examination of the normality of distribution
For all variables, the Kolmogorov-Smirnov test determined that there is a significant deviation from the assumption of a normal distribution. We are aware of deviations from normality, but we used robust estimation methods within AMOS (Maximum Likelihood) on a sample of 132 logistic subjects (West, Finch, & Curran, 1995). Structural equation models with nonnormal variables: Problems and remedies. In R. H. Hoyle (Ed.), Structural equation modeling: Concepts, problems and applications (p. 56–75).Parametric methods provide strong statistical power for testing complex relationships, because they give us a more complete picture of the investigated phenomenon and enable testing of complex causal relationships of our model.
In the case when the results on the variable cannot be transformed into a normal distribution, non-parametric techniques such as the Chi-Square Goodness-of-Fit Test, Mann-Whitney U Test, Kruskal-Wallis Test, Spearman correlation test, etc. are available to researchers. If Sig. greater than 0.05 the hypothesis is accepted, --> we have the normality of the distribution, while if Sig. less than 0.05 (p<0.05) the hypothesis is rejected --> we do not have the normality of the distribution
Table 9.
Descriptive Statistics for the Measured Scales/Factors.
| Scale/Factor 3 |
132 | 4,30 | 0,798 | 2 | 5 |
| Scale/Factor 4 | 132 | 3,90 | 1,003 | 1 | 5 |
| Scale/Factor 5 | 132 | 4,61 | 0,707 | 2 | 5 |
Sources: own research Šarić, M.
4.4. Hypothesis Testing Results
Following is a consolidated overview of the hypothesis testing results,
Table 10.
Summary of Hypothesis Testing Results.
| Hypothesis | Description | Result | Explanation |
|---|---|---|---|
| H1 | BPO implementation (Scale 1) has a significant positive impact on the overall competitiveness of logistics companies. | Confirmed | All relevant paths are statistically significant ( p<0.05p is less than 0.05 p<0.05 ). |
| H2a | BPO implementation enhances competitiveness primarily through the reduction of operating costs (Scale 3). | Not confirmed | The path from Scale 3 to competitiveness is statistically insignificant ( p=0.819p equals 0.819 p=0.819 ili p=0.214p equals 0.214 p=0.214 ovisno o tablici). |
| H2b | The expertise of BPO providers (Scale 5) and strategic partnership (Scale 2) have a stronger impact on competitiveness than cost reduction. | Confirmed | The path via Scale 2 is strong and significant ( β=0.596,p<0.001beta equals 0.596 comma p is less than 0.001 β=0.596,p<0.001 ), while Scale 3 is insignificant, confirming expertise as the dominant driver. |
Explanation of non-significant paths (H2):
The results showed that, within this model and sample, the variables Reduction of operating costs (Scale 3) and Perception of competitiveness (Scale 4) do not have a direct statistically significant impact on Operational efficiency/Competitiveness (Scale 6). This is counterintuitive given the initial assumptions and the general literature. These non-significant results suggest that in the context of the Croatian logistics market, indirect effects (through strategic partnership and expertise) may be more dominant than the direct, measurable impact of the costs themselves. These unexpected findings will be elaborated in the Discussion chapter.
5. Discussion
This chapter interprets the obtained results, discusses their significance, and compares them with the existing scientific literature, with a special emphasis on Transaction Cost Theory (TCE) and the Resource-Based View (RBV). 5.1. Interpretation and Comparison of Findings Structural Equation Modeling (SEM) confirmed that the established model is well-adapted to the collected data. Standardized regression coefficients confirm the direction and strength of the effects. Hypothesis H1, which assumes a significant positive impact of BPO on competitiveness, is confirmed by strong and statistically significant coefficients. This finding is in line with the classical literature that sees BPO as a key management tool (Du & Miao, 2022). Our results confirm that logistics companies that use BPO achieve a measurable competitive advantage. Findings related to the mediation mechanisms (H2a and H2b) represent the key novelty of this paper. The results showed that the path of BPO’s impact on competitiveness through cost reduction (H2a) is not statistically significant (\( p=0.819\) ), while the path through expertise and strategic partnership (H2b) is strongly confirmed (\( \beta =0.596,p<0.001\) ).
5.2. Link to Theoretical Frameworks
The rejection of H2a (the cost-driven path) is surprising and contrary to classic works such as Pavić (2009) or early literature based on Transaction Cost Theory (TCE). According to TCE, companies outsource activities primarily to minimize control and coordination costs. However, our results suggest that in the modern logistics environment, mere cost-cutting is no longer a sufficient driver for achieving a sustainable competitive advantage. Instead, our findings indicate a clear shift towards the Resource-Based View (RBV) and the concept of relational outsourcing: RBV Perspective: In the Croatian logistics market, firms are not only looking for cheaper labor (TCE logic), but also for access to unique resources and dynamic capabilities—such as specialized expertise, advanced technology, and global networks—that they do not possess internally. The factor analysis and SEM results clearly showed that expertise and strategic partnership are the primary drivers of competitiveness (H2b).Relational Outsourcing: The insignificant effect of costs highlights that achieving competitiveness (and not just survival) requires deeper integration with the BPO partner, based on trust and shared goals (relational governance). These findings explain why earlier research in more developed countries might have reached different conclusions: emerging markets, such as Croatia, utilize BPO as a strategic means to “leapfrog” and catch up with EU quality and knowledge standards, rather than using it primarily as a simple cost-saving mechanism.
5.3. Theoretical and Practical Contributions
This research offers significant contributions at both theoretical and practical levels, providing stakeholders in the logistics sector with concrete, evidence-based guidelines.
5.3.1. Theoretical Contributions
- Expanding the Strategic Role of BPO: The research moves beyond the traditional literature focus on cost reduction (TCE logic) and empirically confirms the shift toward a strategic function of building competitive advantage through expertise and dynamic capabilities (RBV logic).
- Regional Context of Emerging Economies: A significant gap in the literature regarding the impact of BPO in the specific regional context of Southeastern Europe is filled, offering new insights into the dynamics of BPO adoption in transition economies.
- Validation of Measurement Scales: The application and testing of specific scales (via EFA and SEM) to assess perceptions of cost, reliability, and agility provide validated instruments for future research in this field.
5.3.2. Practical Contributions and Business Recommendations
- Focus on Reliability and Agility: Managers are encouraged not to select BPO partners solely based on the lowest price. The results suggest that service reliability and quality are more critical for long-term competitiveness. Management should integrate clear agility and service quality metrics (Service Level Agreements - SLAs) into contracts.
- Building Strategic Partnerships: Firms may benefit from cultivating long-term relationships with BPO suppliers, treating them as strategic partners rather than transactional vendors. This includes knowledge sharing and potential joint investment in ICT solutions.
5.3.3. Implications for Policies and Industry Standards
The results indicate that the development of the BPO sector could be further supported through targeted training programs for a highly skilled workforce. Furthermore, the findings suggest a need for the standardization of outsourcing contracts that effectively balance cost-efficiency with the requirement for high-level expertise, potentially serving as a basis for new industrial guidelines in the Southeastern European logistics sector.
6. Limitations and Future Research
Although this study provides valuable insights, certain limitations offer directions for future research:
- Longitudinal Research: This study is cross-sectional in nature. Future research should monitor the effects of BPO over a longer period (longitudinal approach) to determine the long-term sustainability of the identified competitive advantages.
- Objective Financial Indicators: While this research relies on perceptual data from managers, future studies could incorporate objective financial indicators (e.g., ROI, ROA, or exact cost savings) to triangulate the findings.
- Comparative Regional Studies: Expanding the geographical scope to include a comparative analysis of multiple CEE countries (e.g., a Slovenia–Croatia–Hungary comparison) would allow for a deeper understanding of how different institutional environments influence BPO outcomes.
Supplementary Materials
The following supporting information can be downloaded at Preprints.org.
References
- Arvis, J. F.; Ojala, L.; Shepherd, B.; Saslavsky, D.; Busch, C.; Raj, A. Connecting to Compete: Trade Logistics in the Global Economy – The Logistics Performance Index and its Indicators; World Bank: Washington, DC, 2024. [Google Scholar]
- Bajec, P.; Zanne, M. The current status of the Slovenian logistics outsourcing market, its ability and potential measures to improve the pursuit of global trends. International Journal of Logistics Systems and Management 2014, 18(4), 436–448. [Google Scholar] [CrossRef]
- Barchard, K. A., Scott, J., Weintraub, D., & Pace, L. A. (2008). Better Data Entry: Double Entry is Superior to Visual Checking. Paper presented at the American Psychological Association Annual Convention, Boston, MA. doi.org.
- Bartlett, M. S. The Effect of Standardization on a χ2 Approximation in Factor Analysis. Biometrika 1951, 38(3/4), 337–344. [Google Scholar] [CrossRef]
- Boison, D.; Amedi, E.; Linda, A.; Asiedu, E. Assessing the impact of outsourcing on organizational performance: A case of Vodafone Ghana. Journal of Business and Management 2019, 1259–1267. [Google Scholar]
- Brown, T. Confirmatory Factor Analysis for Applied Research; The Guilford Press: New York, NY, 2006. [Google Scholar]
- Brown, D.; Wilson, S. The Black Book of Outsourcing: How to Manage the Changes, Challenges, and Opportunities; Wiley, 2005. [Google Scholar]
- Bühler, A.; Wallenburg, C. M.; Wieland, A. Accounting for external turbulence of logistics organizations via performance measurement systems. Supply Chain Management 2016, 21(6). [Google Scholar] [CrossRef]
- Chou, S. W.; Techatassanasoontorn, A. A.; Hung, I. H. Understanding commitment in business process outsourcing relationships. Information & Management 2015, 52(1), 30–43. [Google Scholar] [CrossRef]
- Dossani, R.; Dossani, S. Business Process Outsourcing. In International Encyclopedia of the Social & Behavioral Sciences, 2nd ed.; Elsevier, 2015; Vol. 3. [Google Scholar]
- Doxey, C. H. The New Accounts Payable Toolkit: Invoice Processing; Wiley / AP & P2P, 2021. [Google Scholar]
- Du, J.; Miao, L. Business Process Outsourcing (BPO): Current and Future Trends. International Research in Economics and Finance 2022, 6(3). [Google Scholar] [CrossRef]
- Dudė, U.; Žitkienė, R.; Jurevičienė, D.; Skvarciany, V.; Lapinskaite, I. Evaluation of Outsourcing Development in the Service Sector. Economies 2021, 9(2), 1–19. [Google Scholar] [CrossRef]
- Ejechi, J. O.; Oshodin, E. A. Business Process Outsourcing Strategy on Competitive Advantage and Organizational Performance. International Journal of Academic Research in Business and Social Sciences 2019, 9(6). [Google Scholar] [CrossRef] [PubMed]
- Garg, A. What is the true cost of processing a freight bill? Journal of Corporate Accounting & Finance 2002, 13(4), 15–20. [Google Scholar] [CrossRef]
- Hartmann, E. Outsourcing Logistics Functions. In International Encyclopedia of Transportation; 2021; pp. 102–106. [Google Scholar] [CrossRef]
- Helfat, C. E.; Raubitschek, R. S. Dynamic capabilities, ecosystems, and digital platforms: The strategic role of BPO in value creation. Strategic Management Journal 2023, 44(1). [Google Scholar]
- Ho, R. Handbook of univariate and multivariate data analysis and interpretation with SPSS; Chapman & Hall/CRC, 2006. [Google Scholar] [CrossRef]
- Kaiser, H. F. An Index of Factorial Simplicity. Psychometrika 1974, 39(1), 31–36. [Google Scholar] [CrossRef]
- Kalinzi, C. Outsourcing (Logistics) Services and Supply Chain Efficiency – A Critical Review of Outsourcing Function in Mukwano Group of Companies. Journal of Supply Chain Management Systems 2016. [Google Scholar] [CrossRef]
- Kimura, F. Subcontracting and the Performance of Small and Medium Firms in Japan. Small Business Economics 2002, 18(1–3), 163–175. [Google Scholar] [CrossRef]
- Kline, R. B. Principles and Practice of Structural Equation Modeling; The Guilford Press: New York, NY, 1998. [Google Scholar]
- Kogoh, Z. B. K. Effect of outsourcing on performance of logistics industry in Kenya. Thesis, 2015. [Google Scholar]
- Kolesnikov, M. V.; et al. IOP Conference Series: Materials Science and Engineering 2020, 918, 012031. [CrossRef]
- McIvor, R. Global Services Outsourcing; Cambridge University Press: New York, NY, 2010. [Google Scholar] [CrossRef]
- Miljko, L. Statistische Beratung: How to interpret SEM model fit results in AMOS. 2025. Available online: https://www.statistischedatenanalyse.de.
- Misura, I. The use of large data sets (Big Data) in the planning process of intercity passenger transport. Diploma thesis, University of Zagreb, Faculty of Transport Sciences, 2023. [Google Scholar]
- Özdemir, S.; Bayat, T.; Çetiner, B. The Role and Importance of Outsourcing in Logistics Enterprises. 19th International Logistics and Supply Chain Congress, Gaziantep, Turkey; 2021. [Google Scholar]
- Özkan, A.; Elma, O. Demand of Outsourcing in Turkey: An Empirical Study. Revista Produção e Desenvolvimento 2017, 3, 78–88. [Google Scholar] [CrossRef]
- Pavić, M. Uloga outsourcinga u povećanju konkurentnosti velikih hrvatskih poduzeća na međunarodnom tržištu. Poslovna izvrsnost - Business Excellence 2009, 3(2), 41–57. Available online: https://hrcak.srce.hr/50652.
- Prokopenko, O.; Dikiy, A.; Butenko, N.; Naumenko, M.; Dedilova, T.; Miroshnyk, R. Business process optimization based on logistics concepts and technologies. International Journal of Advanced Research in Engineering and Technology 2020, 11, 184–196. [Google Scholar] [CrossRef]
- Sako, M. Outsourcing and Offshoring: Implications for Productivity of Business Services. In Oxford Review of Economic Policy; 2006. [Google Scholar] [CrossRef]
- Seashore, S. E.; Yuchtman, E. Factorial analysis of organizational performance. Administrative Science Quarterly 1967, 12(3), 377–395. [Google Scholar] [CrossRef]
- Šarić, M. Eksternalizacija kao model restrukturiranja poduzeća. Tranzicija 2012, 14(29), 122–131. Available online: https://hrcak.srce.hr/86075.
- Šarić, M. Opravdanost privatizacije hrvatskog javnog sektora modelom outsourcinga. Zbornik radova Međimurskog veleučilišta u Čakovcu 2016, 7(2), 99–107. Available online: https://hrcak.srce.hr/172366.
- Tavakol, M.; Dennick, R. Making Sense of Cronbach’s Alpha. International Journal of Medical Education 2011, 2, 53–55. [Google Scholar] [CrossRef]
- Wenwen, Z.; Stephen, C. H. The role of outsourcing management process in improving the effectiveness of logistics outsourcing. International Journal of Production Economics 2017, 188, 29–40. [Google Scholar] [CrossRef]
- West, S. G.; Finch, J. F.; Curran, P. J. Structural equation models with nonnormal variables: Problems and remedies. In Structural equation modeling: Concepts, problems and applications; Hoyle, R. H., Ed.; 1995; pp. 56–75. [Google Scholar]
- Zadorozhnyi, Z. M.; Muravskyi, V.; Pochynok, N.; Hrytsyshyn, A. Innovation Management and Automated Accounting in the Chaotic Storage Logistics. Marketing and Management of Innovations 2020, 2, 313–323. [Google Scholar] [CrossRef]
- Zadorozhnyi, Z. M.; Muravskyi, V.; Shevchuk, O.; Sudyn, Y. Management accounting of logistics costs in the conditions of BPO integration. Economic Annals-XXI 2020, 185(9-10), 140–1. [Google Scholar]
Figure 3.
put Path diagram – standardized, (own analysis, model from IBM AMOS).
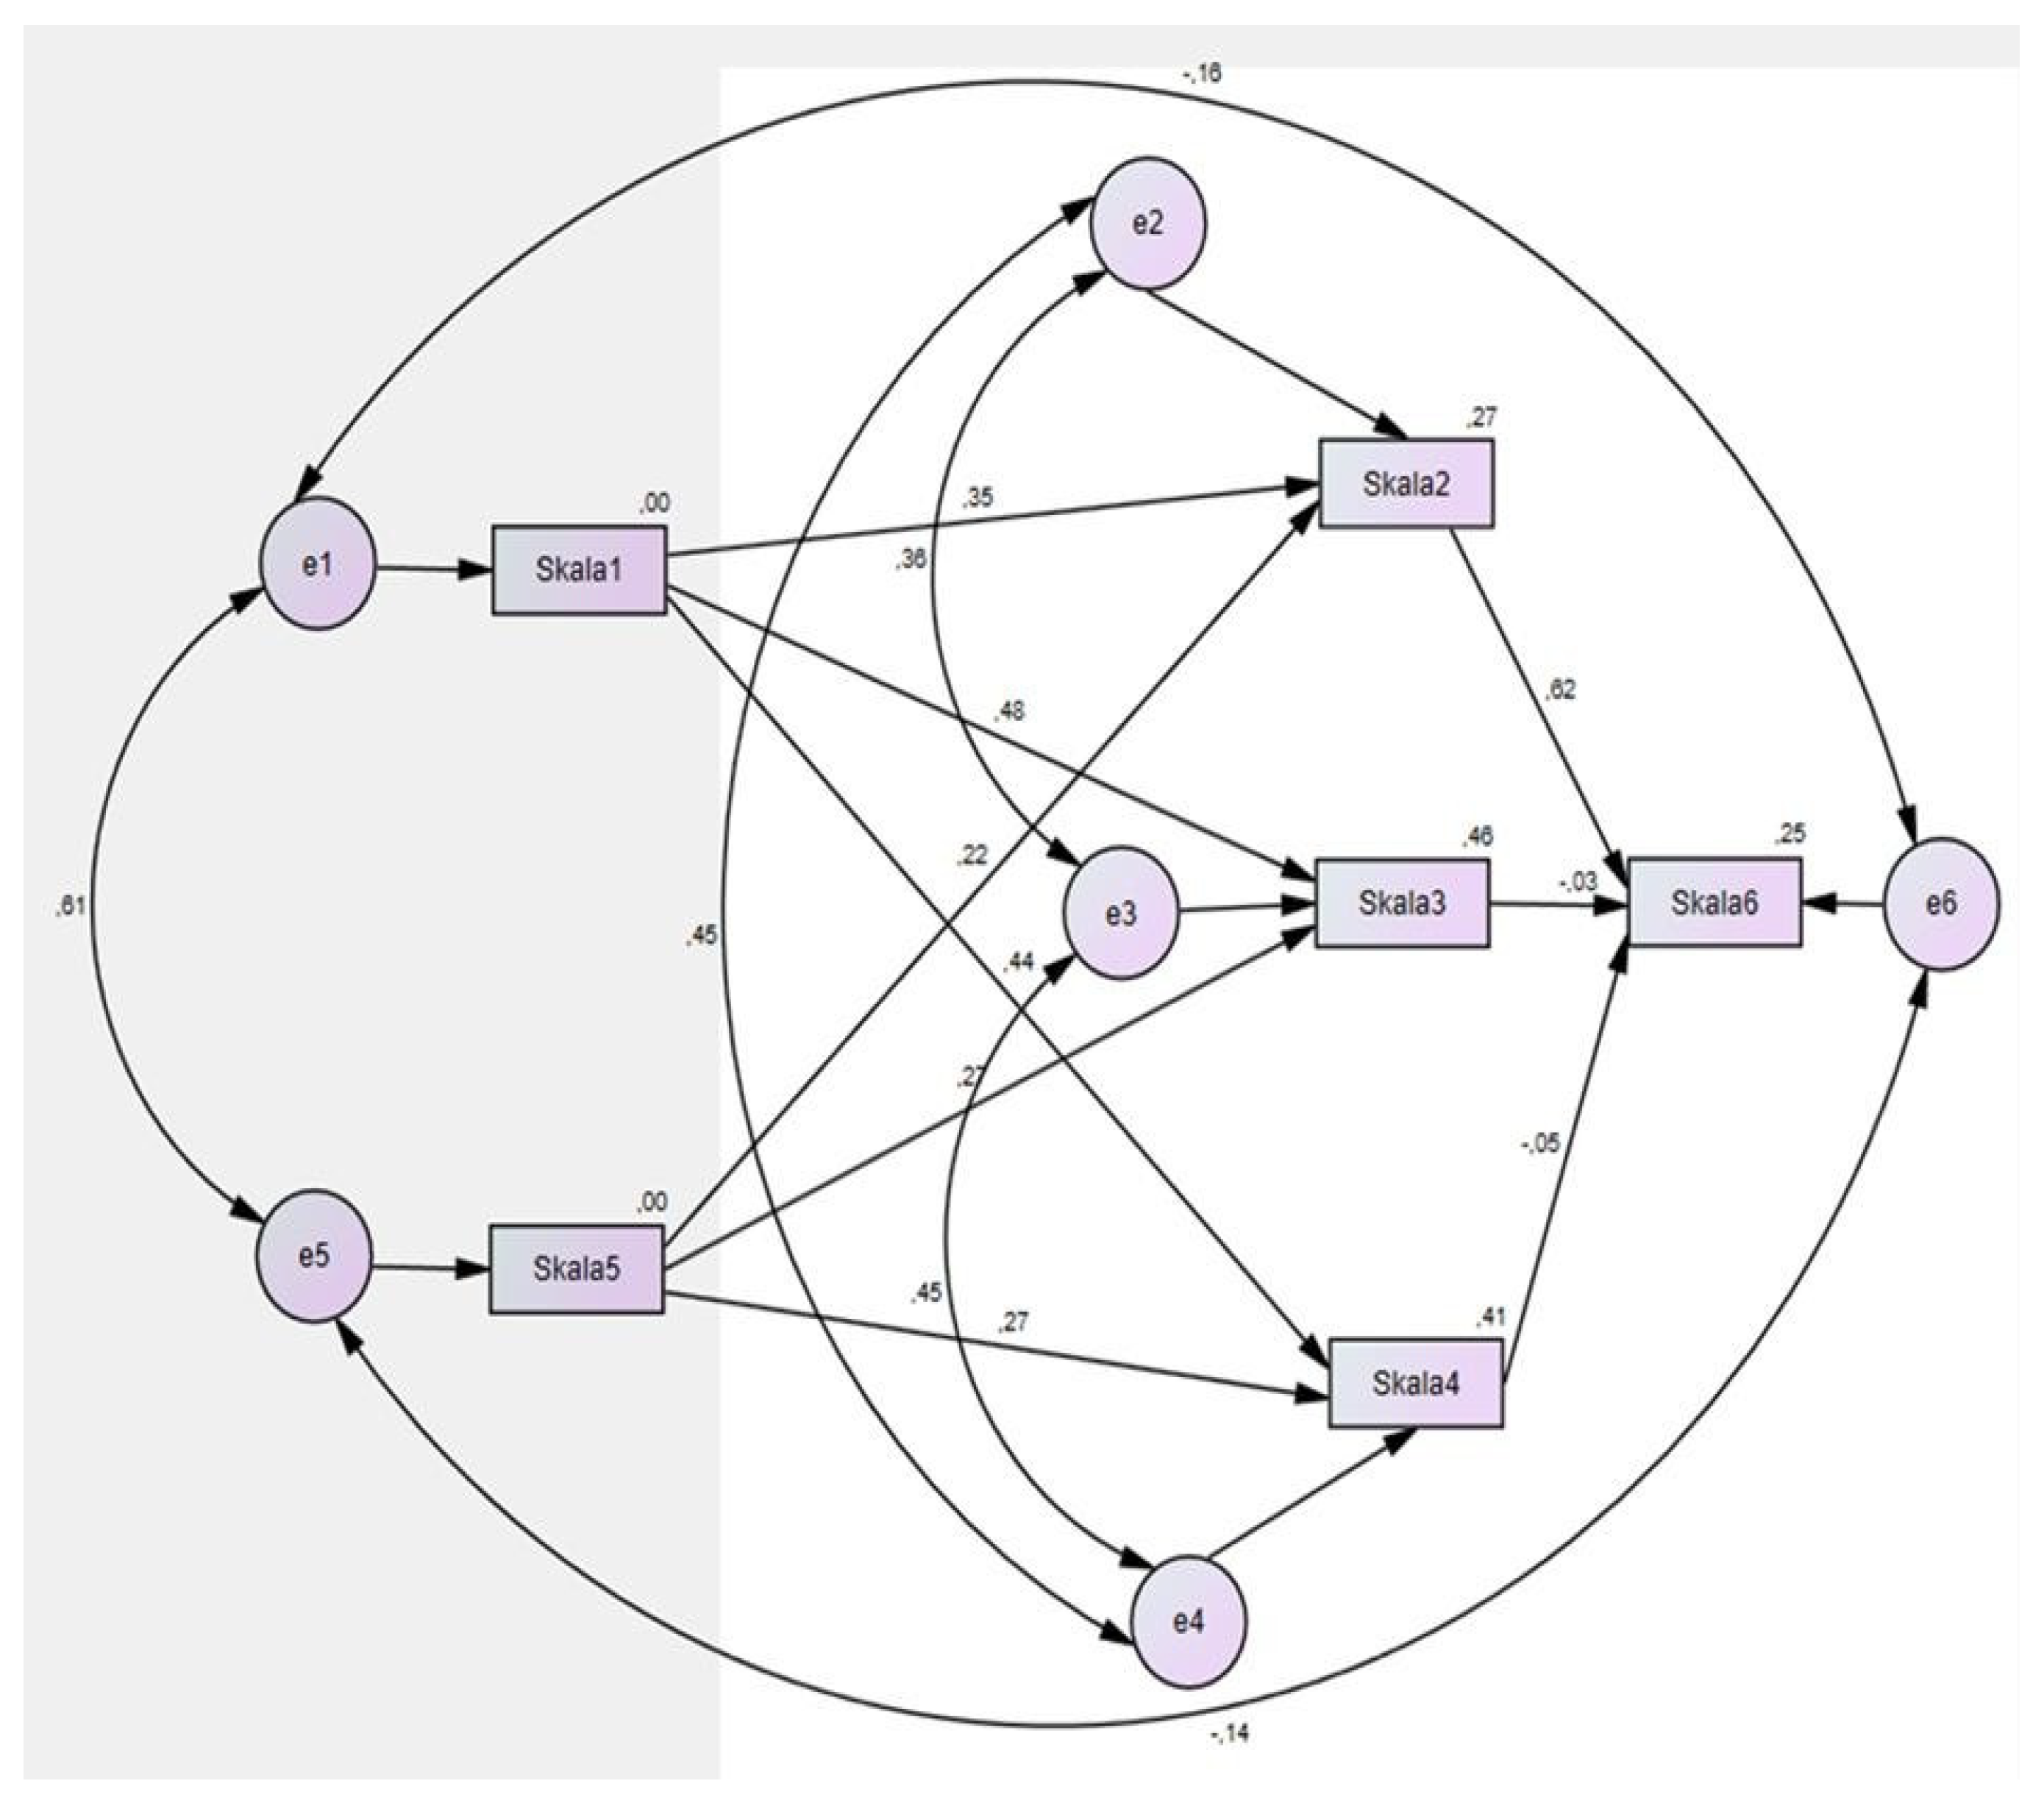
Table 1.
Activities the company outsources to an external BPO service.
| Responses | Respondent % | ||
| N | % | ||
| Data Entry | 34 | 10.6% | 25.8% |
| Invoice Processing | 28 | 8.7% | 21.2% |
| Freight Bill Processing | 21 | 6.5% | 15.9% |
| Logistics Accounting | 79 | 24.5% | 59.8% |
| Document Indexing | 28 | 8.7% | 21.2% |
| Data Management | 40 | 12.4% | 30.3% |
| Maintenance and Cleaning | 58 | 18.0% | 43.9% |
| IT | 4 | 1.2% | 3.0% |
| Market Research | 3 | .9% | 2.3% |
| Human Resources | 2 | .6% | 1.5% |
| Occupational Safety | 17 | 5.3% | 12.9% |
| Warehouse Worker Leasing | 1 | .3% | .8% |
| Payroll Processing | 1 | .3% | .8% |
| Legal Services | 2 | .6% | 1.5% |
| Ticket Sales | 1 | .3% | .8% |
| Collection of Port Fees | 1 | .3% | .8% |
| Representation of Foreign Shipowners | 1 | .3% | .8% |
| Freight Exchange | 1 | .3% | .8% |
| Total | 322 | 100.0% | 243.9% |
Source: own research.
Table 3.
The Kaiser – Meyer – Olkin Eligibility Test (KMO) and Bartlett test are assumption tests.
| Kaiser-Meyer-Olkin Measure of Sampling Adequacy. 0,920 |
| Bartlett’s Test of Sphericity Approx. Chi-Square 4155,618 |
| df 595 |
| Sig. 0,000 |
Table 8.
Squared Multiple Correlations: (Group number 1 - De-fault model).
| Estimate | |
| Skala5 | 0 |
| Skala1 | 0 |
| Skala4 | 0,408 |
| Skala3 | 0,458 |
| Skala2 | 0,267 |
| Skala6 | 0,251 |
Disclaimer/Publisher’s Note: The statements, opinions and data contained in all publications are solely those of the individual author(s) and contributor(s) and not of MDPI and/or the editor(s). MDPI and/or the editor(s) disclaim responsibility for any injury to people or property resulting from any ideas, methods, instructions or products referred to in the content. |
© 2026 by the authors. Licensee MDPI, Basel, Switzerland. This article is an open access article distributed under the terms and conditions of the Creative Commons Attribution (CC BY) license (http://creativecommons.org/licenses/by/4.0/).
Copyright: This open access article is published under a Creative Commons CC BY 4.0 license, which permit the free download, distribution, and reuse, provided that the author and preprint are cited in any reuse.


