
Submitted:
27 January 2026
Posted:
28 January 2026
You are already at the latest version
Abstract
Traumatic brain injury (TBI) refers to a brain injury caused by a traumatic impact. Depending on severity, TBI can be classified as mild, which may temporarily affect brain function, or severe, which can cause long-term complications such as headaches, speech disorders, mood changes, anxiety, and depression. At present, common treatments for TBI include anti-anxiety drugs, anticonvulsants, antidepressants, and muscle relaxants. However, the use of electroacupuncture (EA) for TBI and its molecular mechanisms remain poorly studied. To address this research gap, this study examined the influence of EA on neuroinflammation, adiponectin, and transient receptor potential vanilloid 1 (TRPV1) pathways in a mouse model of TBI. TBI was induced using automatic gravity impact. Molecular analyses confirmed that TBI causes a neuroinflammatory response in the medial prefrontal cortex. TBI model mice showed decreases in the adiponectin receptor 1 (AdipoR1) and TRPV1 signaling pathways, leading to comorbid depression. Next, we demonstrated that EA or Trpv1−/− reduced levels of astrocytes, microglia, and their signaling mediators high mobility group box 1 and s100 calcium-binding protein B. Notably, EA or Trpv1−/− further increased AdipoR1–APPL1 and these effects were downstream to the AMPK/PPAR/SIRT1 pathway. Similar results were observed in the TRPV1 signaling pathway. Taken together, these findings indicate that EA effectively treats TBI by reducing neuroinflammation and activating the AdipoR1 and TRPV1 pathways, providing important directions and applications for future clinical research.
Keywords:
traumatic brain injury
; electroacupuncture
; neuroinflammation
; adiponectin
; TRPV1
; mPFC
1. Introduction
Traumatic brain injury (TBI) is primarily caused by external forces that damage or degenerate brain cells, such as car accidents, falls, violent impacts, blows, vibrations, or the entry of foreign objects into the brain. The symptoms of TBI range from mild concussion to severe coma and death, and depending on the affected brain area, it can cause physiological, psychological, cognitive, and emotional abnormalities. These symptoms are typically evaluated by neurological examination combined with assessment of motor function, sensation, hearing, language, coordination, and mental status [1,2,3]. Notably, TBI can also affect mood and cause depression, which is the most common psychological disease, affecting approximately 15%–20% of people during their life. Among all emotional diseases, depression is responsible for the main expense in insurance costs. Neuroimaging methods, such as computed tomography, are used to diagnose TBI and confirm the location of skull fractures, brain contusions, hemorrhages, or masses [4,5,6]. Magnetic resonance imaging (MRI) is an even more sensitive neuroimaging method that allows for finer differentiation of anatomical location, type of injury, and severity. Neuroimaging studies have revealed structural and metabolic abnormalities in the prefrontal cortex region of TBI patients that can cause depression [7,8,9].
The main non-nerve cells in the brain are astrocytes and microglia, which are identified using the protein markers glial fibrillary acidic protein (GFAP) and ionized calcium-binding adapter molecule 1 (Iba1), respectively. These cell types are strongly associated with neuroinflammation, neurodegeneration, central pain sensitization, and the assessment of brain injury. Increased GFAP levels reflect astrocyte activation and are well-established markers of neuronal inflammation and injury. Similarly, microglia become activated when nerves are inflamed. These activated microglia are classified as M1 cells and result in increased Iba1 protein levels. Recent preclinical and clinical studies suggest that astrocyte and microglia undergo significant activation and proliferation after TBI [10,11,12]. Mouse models of different stages of TBI show increased white cortex levels of both GFAP and Iba1. Excessive release of HMGB1 and S100B from astrocytes and microglia is thought to lead to neuroinflammation. Prolonged inflammation increases levels of NOD-like receptor pyrin domain-containing protein 3, which activates astrocytes and microglia. These changes result in persistent neurotransmission alterations that cause neurological dysfunction, ultimately increasing the risk of mood disorders such as depression [13,14,15].
Adiponectin was reported to regulate glucose, enhance insulin sensitivity, anti-inflammation, and prevention of type 2 diabetes and metabolic diseases. When the brain is damaged, the immune system sends immune cells to repair tissue, which triggers a neuroinflammatory response. The release of adiponectin can reduce inflammation caused by astrocytes, microglia, and macrophages. Through its anti-inflammatory effects, adiponectin has also been shown to protect the heart, vascular system, intestines, lungs, and brain tissue [16,17,18]. After it is released, adiponectin binds to the adiponectin 1 AdipoR1 and AdipoR2 receptors. Recent studies show that AdipoR1 receptors are mainly found in the brain, blood vessels, skeletal muscle, and heart, whereas AdipoR2 receptors are mainly found in the liver, arteries, and adipocytes. Studies of mice have demonstrated that adiponectin receptor deprivation results in glucose intolerance and hyperinsulinemia, confirming the role of this receptor in stabilizing carbohydrates and insulin. Adiponectin can directly activate the adaptor protein phosphotyrosine, which interacts with the PH domain and leucine zipper 1 (APPL1) to bind to the intracellular structure of AdipoR1 after activating AdipoR1, and then further activates AMPK and Sirtuin 1 (SIRT1). APPL1 can then activate PPARα and the PI3K/Akt/FOXO1 signaling pathway [19,20,21].
TRPV1 plays important roles in pain and heat transmission and, in blood vessels, participates in vasodilation, thermal sensation, and inflammation. TRPV1 was initially discovered in mammalian sensory neurons and is responsive to various stimuli including capsaicin, mechanical force, temperatures above 43 °C, low pH, anandamide, and inflammation. Genetic manipulation studies have further confirmed the association of TRPV1 with thermal pain sensitization. Capsaicin can dilate cerebral arteries to alleviate cerebral edema and blood–brain barrier damage. Overall, these findings suggest that the neuroprotective effect of capsaicin is related to blood vessels [22,23,24]. Neuroinflammation can significantly activate TRPV1, resulting in increased expression of protein kinase A (PKA), PI3K, and PKC. These effects relate to the central sensitization process of pain caused by fibromyalgia, which involves both the peripheral and central nervous systems. PKCε is known to induce pain hypersensitization in nociceptors, thereby contributing to central sensitization and fibromyalgia pain. Mitogen-activated protein kinase is also involved in neuroinflammatory and pain signaling pathways and belongs to the family that includes extracellular signal-regulated kinase (ERK), p38, and c-Jun N-terminal kinase. The phosphoinositide 3-kinase (PI3K)-Akt-mTOR signaling pathway is also involved in central pain sensitization. These hormones are related to pain transmission, central sensitization, and neural plasticity. Activation of the cyclic AMP-responsive element-binding protein (CREB) is thought to be involved in the generation of fibromyalgia pain [25,26,27,28].
Acupuncture, which has been used in Asia for over 3,000 years, is used to balance the flow of qi and blood and promote the health of meridians. Acupuncture methods have been improved to use stainless steel needles inserted into specific locations termed acupoints. Scientific studies have confirmed that acupuncture can relieve symptoms by stimulating peripheral nerves via stimulating connective tissue or muscles and transmitting information upward to the central nervous system, and the World Health Organization now recognizes its applicable for more than 100 diseases—particularly for pain management. EA is widely used to standardize stimulation conditions and shows anti-inflammatory effects. For example, EA stimulation of the Zusanli acupoint (ST36) can activate the vagus nerve-adrenal axis in mice and can effectively control inflammation in mouse sepsis models [29,30]. There is growing evidence that EA can treat inflammatory pain, neuropathic pain, and fibromyalgia [31,32,33,34]. Studies also support that acupuncture can treat comorbid pain and depression by reducing levels of inflammatory factors in the plasma, such as interleukins, tumor necrosis factor-α, and interferon-γ [34]. However, there is limited research on the molecular mechanisms through which EA can treat TBI.
To address this research gap, this study investigated whether EA can treat TBI and comorbid depression in mice. We hypothesized that TBI would result in damage to the prefrontal cortex and lead to depression-like symptoms, and that EA or TRPV1 gene deletion would improve these symptoms. Specifically, we anticipated that EA would reduce neuroinflammation by releasing adiponectin and acting on the AdipoR1 signaling pathway. As predicted, TBI model mice showed increased protein levels of GFAP and Iba1 in the prefrontal cortex and decreased AdoR1 levels. These effects were also reflected by the expression levels of their signaling substances HMGB1 and S100B. This phenomenon also occurred in its downstream pathway APPL1-SIRT1-AMPK-PPAR, with a similar phenomenon observed in the TRPV1 signaling pathway. Importantly, both EA or Trpv1−/− were shown to reverse these brain injury-induced phenomena. Overall, this study provides evidence that EA treats TBI by modulating neuroinflammation via adiponectin. Given these findings, we propose that EA modulates the adiponectin signaling pathway and can thus be used to treat TBI-induced depression.
2. Materials and Methods
2.1. Mouse Model of TBI and Comorbid Depression
We obtained 8–12 week old C57BL/6 wild-type mice, weighing approximately 18–22 grams, from BioLasco (Taipei, Taiwan Co., Ltd.). All mice were transported directly to the animal center and confirmed to have healthy fur and no wounds. Mice were maintained in a pathogen-free environment with a room temperature of 25 °C, humidity of 60%, and a controlled light/dark cycle of 12 hours (8:00 AM to 8:00 PM). Power calculations using G*Power 3.1.9.7 indicated that a minimum of nine mice per group was required to achieve a significance level of α = 0.05 and 80% statistical power. Mice were randomly assigned to four groups: normal group; TBI-induced depression comorbidity (TBI); TBI-induced depression comorbidity treated with 2 Hz EA (TBI + 2 Hz EA); or Trpv1−/− mice treated with TBI-induced depression comorbidity (TBI + Trpv1−/−). TBI was induced using the gravity impact model. Mice were anesthetized with isoflurane (induction concentration 5%, maintenance concentration 1%) and fixed in a stereotaxic apparatus. The left frontal cortex was exposed using a 3 mm drill and a gravity impact was performed at a point 1.95 mm posterior to the anterior fontanelle and 0.3 mm lateral to the midline. The impact conditions were as follows: impact head diameter 2 mm, impact depth 2 mm, impact velocity 5 m/s, and post-impact duration 100 ms (Impact ONE; Leica Biosystems, IL 60010, United States). After impact, the wound was sutured with surgical sutures and antibiotic ointment was applied to prevent infection. All animal experiments were approved by the Animal Ethics Committee of China Medical University, Taiwan (Approval No.: CMUIACUC-2023-066) and followed the Guidelines for the Use of Laboratory Animals (National Academy of Sciences Press).
2.2. EA Treatment
EA was performed once daily for 14 days starting on the 15th day after brain injury. Prior to EA, mice were anesthetized with 5% isoflurane and maintained under 1% isoflurane. Two 0.5-inch long 32G stainless steel needles (Yu-Kuang Chemical Industrial Co., Ltd., Taiwan) were vertically inserted into the bilateral ST36 acupoints, which are located 3–4 mm below the patella, between the fibula and tibia, anterior to the tibialis anterior muscle. The stainless steel needles were connected to the EA machine using a Trio 300 electrostimulator (Ito Corporation, Tokyo, Japan). The EA conditions were as follows: 1 mA intensity, 2 Hz frequency, 150 μs pulse width, and continuous square wave pulses for 20 minutes. During EA stimulation, slight twitching of the muscles around the acupoint was observed.
2.3. Evaluation of Depressive Behaviors
The open field test (OFT) and forced swimming test (FST) were used to assess depressive behaviors in mice before and 4 weeks after TBI. Tests were performed using the Smart 3 system (TrackMot V.5.45; Signa Technology Co, Taipei, Taiwan) combined with video tracking software for analysis. The OFT used a 45 × 45 × 45 cm square white enclosed space made of acrylic plastic divided into nine equal-sized areas. Mice were initially placed in the central area and allowed to move freely for 15 min. The distance traveled across the central area, time spent in the central area, and total amount of movement in the open space were automatically recorded and analyzed by the software. Depressive behavior was indicated by a decrease in the number of times the mouse traveled across the central area or a shorter time spent in the central area. The FST was performed using a transparent plastic cylinder (47 cm high, 38 cm inner diameter) filled with 18 cm of 25 °C water. This water depth was sufficient to prevent the mouse’s tail from touching the bottom, preventing interference with the experimental results. The water was changed after each test. Each mouse performed a 5-min FST, with their trajectory and time spent stationary automatically recorded using software. Depressive behavior was indicated by an increased immobility time during the FST. After the test, the mice were removed, dried with a towel, and returned to their original cages.
2.4. Western Blot Analysis
The mouse cerebellum was dissected and tissues were placed on ice and stored at −80 ºC until protein extraction. Entire proteins were isolated in cold radioimmunoprecipitation (RIPA) lysis buffer containing 50 mM Tris-HCl pH 7.4, 250 mM NaCl, 1% NP-40, 5 mM EDTA, 50 mM NaF, 1 mM Na3VO4, 0.02% NaN3, and 1× protease inhibitor cocktail (AMRESCO). The extracted proteins were subjected to 8% SDS-tris glycine gel electrophoresis and transmitted to a polyvinylidene difluoride (PVDF) membranes. The membranes were initially incubated in 5% non-fat milk in TBS-T buffer (10 mM Tris pH 7.5, 100 mM NaCl, 0.1% Tween 20) followed by incubation a primary antibody in TBS-T with 1% bovine serum albumin (BSA) for 1 h at room temperature. Peroxidase-conjugated antirabbit antibody or antimouse antibody (1: 5000) was used as the secondary antibody. Blots were imaged using a chemiluminescent substrate kit (PIERCE) and LAS-3000 Fujifilm system (Fuji Photo Film Co., Ltd., Tokyo, Japan). β-actin or α-tubulin was used as an internal control. Finally, the protein concentration of the bands was measured using NIH Image J 1.54h software (Bethesda, MD, USA).
2.5. Immunofluorescence
Mice were euthanized with a 5% isoflurane and intracardially injected with 0.9% normal saline followed by 4% paraformaldehyde. Tissues were immediately excised and fixed with 4% paraformaldehyde at 4 ºC for 3 days. Subsequently, the samples were embedded in 30% sucrose for cryoprotection overnight at 4ºC, fixed in an optimal cutting temperature complex, rapidly frozen in liquid nitrogen, and then stored at −80 ºC. Frozen tissues were cut into a 20 mm sections using a cryostat directly placed on glass slides. The sections were fixed with 4% paraformaldehyde and then incubated with a blocking solution consisting of 3% BSA, 0.1% Triton X-100, and 0.02% sodium azide for 1 h at room temperature. The samples were incubated overnight with the primary antibody (1:200, Alomone) for Iba1, TRPV1, and pERK in 1% BSA solution. Finally, the samples were incubated with the secondary antibody (1:500), 488-conjugated AffiniPure donkey antirabbit IgG (H + L) and 594-conjugated AffiniPure donkey antigoat IgG (H + L) for 2 h at room temperature and then fixed with cover slips for immunofluorescence visualization (Leica, DM500, CA 94539, USA) .
2.6. Statistical Analysis
Statistical analyses were performed using SPSS 21.0 software (IBM, USA). Data are presented as the mean ± standard error of mean. Differences among all groups were tested by analysis of variance followed by post hoc Tukey’s test. Results with P < 0.05 were considered to indicate statistically significant differences.
3. Results
3.1. TBI Induces Comorbid Depression and 2 Hz EA or TRPV1 Receptor Dysfunction Reverses These Symptoms
We confirmed that TBI induces comorbid depression using the OFT and FST performed at baseline and 4 weeks after inducing TBI. All groups showed a similar total walking distance in the OFT at weeks 0 and 4, confirming normal motor activity. Normal group mice entered the central region normally in both weeks 0 (Figure 1A, black column, Week 0: 1572.72 ± 76.72 cm, n = 9) and 4 (Figure 1A, red column, Week 4: 1815.01 ± 183.36 cm, n = 9), indicating the absence of depressive behavior. TBI group mice showed a significantly reduced entry distance into the central region at week 4 (Figure 1A, red column, Week 4: 817.44 ± 125.67 cm, *p < 0.05, n = 9), indicating comorbid depression caused by TBI. After EA treatment, TBI mice showed a significantly increased distance into the central region (Figure 1A, red column, Week 4: 1351.51 ± 117.34 cm, #p < 0.05, n = 9), confirming that EA improved treat comorbid depression. The same results were observed for mice lacking TRPV1 (Figure 1A, red column, Week 4: 1688.83 ± 176.45 cm, #p < 0.05, n = 9). Analysis of the percentages of time spent in the outer and central regions showed similar rates between weeks 0 and 4 for normal group mice, confirming the absence of depressive behavior. In contrast, TBI mice showed a higher percentage of time in the outer region (Figure 1B, red column, Week 4: 83.30 ± 1.33%, *p < 0.05, n = 9) and a significantly lower percentage in the central zone at week 4 (Figure 1B, red column, Week 4: 16.70 ± 1.33%, *p < 0.05, n = 9), indicating TBI-induced depression. This phenomenon was reversed in the EA treatment and Trpv1−/− groups (Figure 1B, red columns, #p < 0.05, n = 9).
The FST was used to further confirm depressive behaviors. Normal group mice exhibited lower immobility responses in the FST at weeks 0 and 4, confirming the absence of depressive behavior. TBI mice showed significant increases from 0 to 4 weeks in the total percentage (Figure 1C, red column, Week 4: 19.18 ± 2.26%, *p < 0.05, n = 9) and total time of immobility (Figure 1C, red column, Week 4: 57.55 ± 6.78 s, *p < 0.05, n = 9), indicating the formation of depressive behavior. Electroacupuncture and Trpv1−/− effectively inhibited these increases (Figure 1C, red columns, #p < 0.05, n = 9), demonstrating their antidepressant effects. The mean immobility time was similar across all groups at weeks 0 and 4, indicating periods of depression. TBI mice showed an increased number of immobility episodes (Figure 1D, red column, Week 4: 49.80 ± 3.37 n, *p < 0.05, n = 9), and 2 Hz EA or Trpv1−/− reduced this immobility (Figure 1D, red columns, #p < 0.05, n = 9). These findings support that mPFC injury leads to depressive behavior in mice and that EA or Trpv1−/− can reverse this effect.
3.2. TBI Enhances Neuroinflammation, Leading to Astrogliosis and Microgliosis Proliferation that Reduces the Adiponectin and TRPV1 Signaling Pathways
Next, we tested our hypothesis that TBI-induced depression is caused by the proliferation of astrocytes and microglia. To do so, we assessed the protein expression of astrocytes and microglia in the left mPFC on the affected side by Western blot. The results showed normal protein levels of astrocytes and microglia in wild-type control group mice, whereas TBI mice showed significantly increased expression of astrocytes and microglia (Figure 2A&B, *p < 0.05, n = 6). EA or Trpv1−/− effectively prevented the proliferation of astrocytes and microglia (Figure 2A&B, #p < 0.05, n = 6). We also examined protein expression of the signaling substances HMGB1 and S100B released from astrocytes and microglia. On day 28 of TBI-induced depression, HMGB1 and S100B protein levels in the left mPFC region of TBI mice were significantly increased (Figure 2C&D, *p < 0.05, n = 6). This increase was effectively reversed by EA treatment as well as Trpv1 gene knockout (Figure 2C&D, #p < 0.05, n = 6).
As we suspected that EA treats TBI by releasing adiponectin, we examined the AdipoR1 signaling pathway in the left mPFC. Normal group mice showed normal AdipoR1 in the mPFC, whereas TBI mice showed reduced AdipoR1 expression (Figure 2E, *p < 0.05, n = 6). This phenomenon was improved in EA-treated and Trpv1 gene knockout mice (Figure 2E, #p < 0.05, n = 6). Results for the AdipoR1 embedded protein APPL1 showed that APPL1 was significantly reduced in TBI mice (Figure 2F, *p < 0.05, n = 6) and that this phenomenon was reversed by EA or Trpv1 gene knockout (Figure 2F, #p < 0.05, n = 6). Investigation of downstream pathways revealed that AMPKα protein expression decreases due to brain injury (Figure 2G, *p < 0.05, n = 6); however, EA or Trpv1 knockout mice exhibited increased AMPKα expression (Figure 2G, #p < 0.05, n = 6). Similar phenomena were observed for the protein expression levels of PPARα or SIRT1(Figure 2H&I, n = 6).
Given our finding of reduced TRPV1 expression in the mPFC of TBI mice, we further investigated the TRPV1 signaling pathway. The results showed that TRPV1 protein expression was reduced in TBI mice (Figure 3A, *p < 0.05, n = 6). However, it returned to normal levels after EA treatment and almost disappeared in the brains of Trpv1 knockout mice (Figure 3A, *p < 0.05, n = 6). We also assessed the expression of downstream hormones related to the TBI mPFC pathway. We found that the levels of pPKA, pPI3K, and PKC (Figure 3B-D, *p < 0.05, n = 6) were significantly reduced, representing decreased neural activity. Again, EA treatment or Trpv1 gene knockout effectively increased protein expression of the pPKA, pPI3K, and PKC signaling pathways (Figure 3B-D, #p < 0.05, n = 6). Further results showed relatively lower functional phosphorylation levels of pAkt and pmTOR in TBI mice compared to normal mice (Figure 3E&F, *p < 0.05, n = 6). The low phosphorylation levels were restored in EA-treated or in Trpv1−/− TBI mice (Figure 3E&F, #p < 0.05, n = 6). Western blot results showed that expression of the transcription factors pERK and pCREB was normal in the mPFC region of wild-type mice, whereas TBI mice showed lower expression levels (Figure 3G&H, *p < 0.05, n = 6). The expression levels of these proteins returned to normal in the EA and Trpv1−/− groups (Figure 3G&H, #p < 0.05, n = 6).
3.3. Protein Analysis Revealed no Increase in Astrocytes or Microglia and Similar AdipoR1 and TRPV1 Concentrations Across All Groups
Subsequently, we investigated whether contralateral TBI leads to depression and whether neuroinflammatory phenomena have a bilateral effect. We observed normal protein expression of astrocytes and microglia in the right mPFC of wild-type mice. Despite the presence of depressive symptoms, the expression of astrocyte and microglia in the right PFC did not increase in TBI mice (Figure 4A&B, *p > 0.05, n = 6). EA or Trpv1−/− did not alter the expression levels of astrocytes or microglia (Figure 4A&B, *p > 0.05, n = 6). Similar results were observed for the protein expression of the neurotransmitters HMGB1 and S100B released by astrocytes and microglia. Neuroinflammation was not observed in the right PFC (Figure 4C&D, *p > 0.05, n = 6). Assessment of the AdipoR1 signaling pathway showed normal AdipoR1 expression in the right mPFC of control group mice; TBI did not change AdipoR1 expression in the right mPFC. No changes in AdipoR1 were observed in EA-treated or Trpv1 knockout mice (Figure 4E, *p > 0.05, n = 6). Investigation of the AdipoR1 embedded protein APPL1 indicated that its protein expression level was not altered by TBI and was not affected by EA or Trpv1 gene knockout (Figure 4F, *p > 0.05, n = 6). Similarly, there were no changes in SIRT1, AMPKα, or PPARα in TBI mice or after EA treatment or Trpv1 gene knockout (Figure 4G-I, *p > 0.05, n = 6).
We also investigated whether the contralateral TRPV1 signaling pathway was altered by TBI. Our results confirmed that TRPV1 protein expression in the contralateral mPFC was unaffected. EA treatment did not change TRPV1 protein expression and TRPV1 was not expressed in the mPFC of Trpv1 gene knockout mice (Figure 5A, *p > 0.05, n = 6). Next, we examined expression of the TRPV1 downstream hormones pPKA, pPI3K, and PKC. The groups showed similar concentrations of pPKA, pPI3K, and PKC in the contralateral mPFC, indicating that contralateral neural activity was unaffected. EA treatment or Trpv1 gene knockout did not alter protein expression of the pPKA, pPI3K, or PKC signaling pathways (Figure 5B-D, *p > 0.05, n = 6). The phosphorylation levels of pAkt and pmTOR in the contralateral PFC of TBI mice were similar to those in control group mice. Treatment of TBI mice with EA or Trpv1−/− did not change their expression levels (Figure 5E&F, *p > 0.05, n = 6). Lastly, we measured the expression levels of pERK and the transcription factor pCREB. Again, the results showed similar protein expression levels across all groups, indicating that the contralateral PFC was not affected by TBI (Figure 5H&I, *p > 0.05, n = 6).
3.4. Effects of TBI on Protein Expression and Reversal Effects with EA Treatment or Trpv1 Gene Knockout: Immunofluorescence Analysis Results
Immunofluorescence was performed to qualitatively analyze the effects of TBI on protein expression changes. Compared with wild-type mice, TBI mice showed lower DAPI fluorescence in the left mPFC, indicating more severe cell damage. Both EA treatment and Trpv1 gene knockout reduced the number of cell deaths, suggesting neuroprotective effects (Figure 6A). Measurement of protein levels in microglia showed a significant increase in Iba1 fluorescence in the left PFC of TBI mice, indicating neuroinflammation. EA treatment or Trpv1 gene knockout reduced Iba1 fluorescence, indicating an anti-neuroinflammatory effect (Figure 6B). The results for TRPV1 and pERK protein staining showed decreased levels in TBI mice, and that both EA treatment and Trpv1 gene knockout increased these fluorescence levels (Figure 6C&D).
4. Discussion
Our study is the first to demonstrate that TBI leads to increased neuroinflammation in the mPFC in mice. We observed significant increases in astrocytes, microglia, and their neurotransmitters HMGB1 and S100B. Neurotransmission dominated by AdipoR1 and TRPV1 was reduced by TBI. Overall, our findings support that EA can effectively alleviate neuroinflammation and improve impaired neurotransmission. Notably, similar results were observed in Trpv1 knockout mice.
TBI is commonly associated with mental and neurological abnormalities. While the mortality rate from severe TBI has significantly decreased due to the introduction of protective measures such as helmets, the mental, cognitive, and emotional sequelae caused by TBI of varying severity are increasing. The manifestations of TBI are highly complex and depend on the location of the impact [35]. These can include symptoms of emotional instability such as irritability, impulsivity, extreme anger, suicidal tendencies, post-traumatic stress disorder, and depression. Recent articles have indicated that SERPINE1 is an important blood marker for predicting TBI-induced depression. Using a gene expression omnibus dataset for a TBI with comorbid depression sample, the authors performed a weighted gene co-expression network analysis that identified factors related to circadian rhythm function, consistent with the idea that TBI and depression are influenced by circadian rhythms. By inducing TBI and depression in an animal model, they demonstrated that inhibiting SERPINE1 expression reduced the protein expression levels of claudin-1 and brain-derived neurotrophic factor, which improved treating TBI and depression comorbidity. They also confirmed that excessive SERPINE1 expression activates neutrophils, which affects circadian rhythms and causes comorbid causing TBI and depression [36]. Antidepressants are currently the main treatment for comorbid TBI and depression. However, due to the complexity of the TBI site and underlying mechanism, treatment efficacy is poor and there are often concerns about side effects, safety, and tolerability. Methylphenidate, which was originally developed as a central nervous system stimulant for the treatment of attention deficit hyperactivity disorder, is reported to have better therapeutic effects in the early stages following mild to moderate brain injury [37]. Our results support that TBI does lead to depressive comorbidity in mice. We further found that EA can effectively alleviate TBI-induced depression. Similar results were observed for Trpv1 knockout, supporting that EA treats depression through effects on the TRPV1 pathway.
Melatonin has recently emerged as a novel neuroprotective mechanism for treating TBI and serves as a potential new direction for treating TBI-induced depression. The heme oxygenase-1 (HO-1)/cAMP response element-binding protein (CREB) signaling pathway is also closely related to the occurrence of depression. CREB activity in nucleus accumbens (NAc) primarily governs reward and motivation. A previous study demonstrated that melatonin can effectively treat TBI-induced depressive behavior and reduce pCREB protein levels in the NAc. This study further demonstrated that intraventricular injection of HO-1-specific inhibitors can mitigate the neuroprotective effects of melatonin. Melatonin has been shown to reduce the expression levels of A1 astrocyte and IL-6 in NAc after TBI, and these changes can be reversed by HO-1-specific inhibitors [38]. Du et al. used RNA sequencing (RNA-Seq) technology to study the role of circular RNAs in TBI-induced depression. They observed reductions in the level of circSpna2 expression in the plasma of TBI mice, which was proportional to the severity of depression. Knock-down of circSpna2 was found to exacerbate depressive symptoms in TBI mice. They revealed that circSpna2 can bind to the ubiquitin ligase Keap1, thereby regulating the Nrf2-Atp7b signaling pathway and affecting cuproptosis. These results suggest that circSpna2 plays an important role in copper apoptosis and may offer a new therapeutic direction for TBI-induced depression [39]. Zhou et al. reported a statistically significant increase in FOXO1 protein expression in neutrophils in TBI patients and mouse models. However, neutrophils with high FOXO1 concentrations showed increased infiltration in both the acute and chronic phases after TBI that were proportional to the severity of TBI and promoted depressive episodes. In the acute phase, FOXO1 increased cytoplasmic Versican expression and interacted with the apoptosis regulator B-cell lymphoma-2 (BCL-2)-associated X protein (BAX) to prevent apoptosis. These findings of higher FOXO1 levels in neutrophils in both acute and chronic TBI highlight the importance of regulating neutrophils in this condition [40]. In the present study, our molecular analyses confirmed that TBI induces a neuroinflammatory response in the PFC and decreases in the AdipoR1 and TRPV1 signaling pathways, leading to comorbid depression. We further demonstrated that EA or Trpv1−/− can reduce the levels of astrocyte (indicated by GFAP), microglia (Iba1), and their signaling mediators HMGB1 and S100B. Moreover, EA or Trpv1−/− can further increase AdipoR1–APPL1 downstream to the SIRT1/AMPK/PPAR pathway. We observed similar results for the TRPV1 signaling pathway.
Boyko et al. reported that TBI rats have significantly worse neurological function scores (NSS) at 48 h compared to control animals; however, after 1 month, neurological function was similar in the two groups. MRI revealed that TBI rats have more severe cerebral edema and greater blood–brain barrier damage than normal rats. Depressive symptoms were confirmed by a significantly lower sucrose intake by TBI rats compared to control rats, and the reduced time spent in the open arm and fewer entries indicated that TBI rats also had higher levels of anxiety [41]. A recent study reported the effects of controlled cortical impact-induced TBI in normal mice and IL-10 gene-deficient mice. Serum IL-10 concentrations were significantly elevated in normal male (but not female) mice after TBI. Male IL-10 gene-deficient mice also showed a larger injured volume than control mice and they exhibited poorer performances of sensorimotor tasks and cognitive tests and showed higher anxiety- and depression-related behaviors. Importantly, male IL-10 gene-deficient mice showed significantly increased levels of GFAP and Iba1 proteins in the brain injury area and a significantly lower number of NeuN-positive cells, indicating greater cell death. These results confirm that IL-10 deficiency exacerbates cognitive and emotional function after TBI through an inflammatory response caused by stellate cell and glial cell proliferation [42].
5. Conclusions
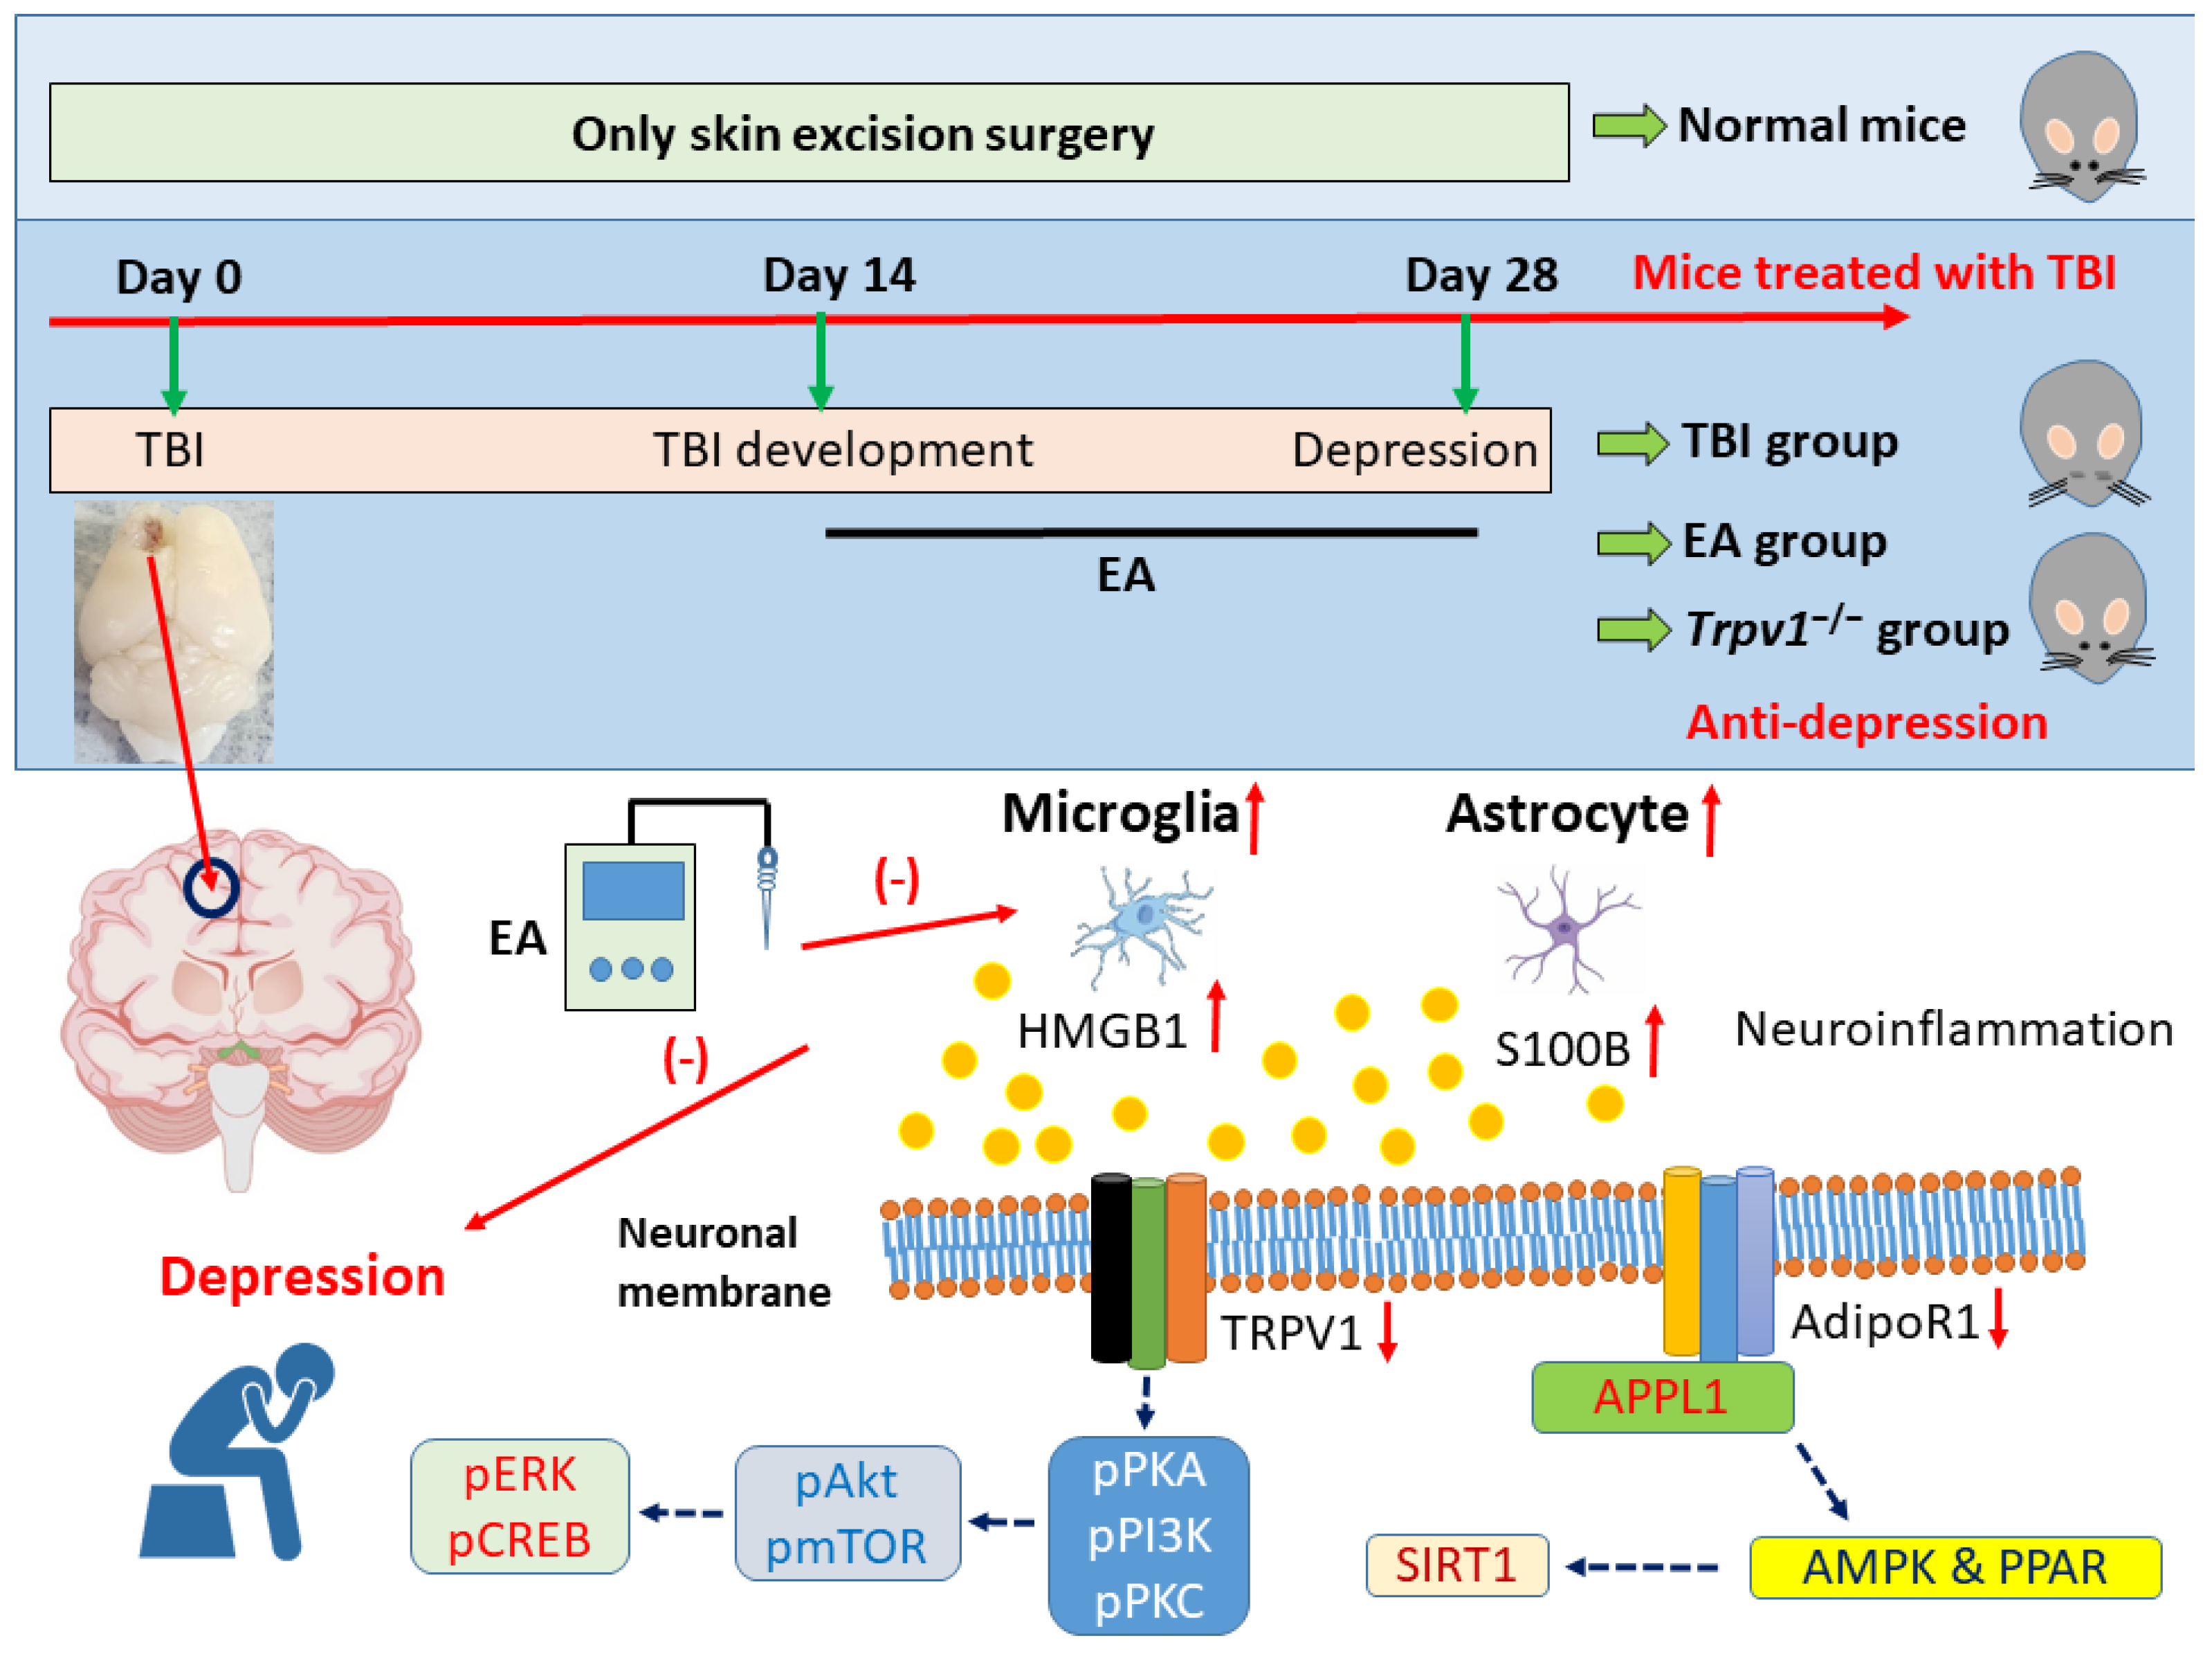
Taken together, these findings support that TBI induces depressive comorbidity in mice as assessed by the OFT and FST. We found that EA can treat TBI-induced depression, a phenomenon also observed in TRPV1 knockout mice, highlighting TRPV1 as an important target of this comorbidity. Our protein analyses revealed that TBI induces increased neuroinflammatory responses in the PFC, as evidenced by significant increases in the protein levels of astrocytes (GFAP), microglia (Iba1), and their signaling mediators HMGB1 and S100B. We also observed lower levels of AdipoR1 and its adaptor protein APPL1 in the PFC of TBI mice, with similar results observed in the downstream SIRT1/AMPK/PPAR pathway and a similar trend throughout the entire TRPV1 signaling pathway. Importantly, EA and Trpv1−/− both reversed these phenomena (Figure 7). These findings provide important directions and applications for future clinical research, suggesting EA as an effective treatment for TBI.
Author Contributions
IH Hsiao, Y Chae, MC Lin, and CY Ho: Conceptualization, Methodology, Software, Data curation, Writing - original draft, Visualization, Investigation. HC Hsu and YW Lin: Supervision, Validation, Writing - review & editing.
Funding
This work was supported by the following grants: NSTC 114-2314-B-039-031, NSTC 114-2314-B-039-087, CMUHCH-DMR-113-025, and the “Chinese Medicine Research Center, China Medical University” from The Featured Areas Research Center Program within the framework of the Higher Education Sprout Project by the Ministry of Education (MOE) in Taiwan.
Institutional Review Board Statement
The animal study protocol was approved by the Institute of Animal Care and Use Committee of China Medical University (Permit no. CMUIACUC- 2023-066, 12/28/2022).
Informed Consent Statement
Not applicable.
Data Availability Statement
The data that support the findings of this study are available on request from the corresponding author. The data are not publicly available due to privacy or ethical restrictions.
Conflicts of Interest
The authors declare no financial or other relationships that might lead to conflicts of interest.
References
- Andrei, D.; Mederle, A.L.; Ghenciu, L.A.; Borza, C.; Faur, A.C. Efficacy of Neurorehabilitation Approaches in Traumatic Brain Injury Patients: A Comprehensive Review. Life (Basel) 2025, 15. [Google Scholar] [CrossRef]
- Khan, N.; Romila, L.; Ciobica, A.; Burlui, V.; Kamal, F.Z.; Mavroudis, I. Mild Traumatic Brain Injury as a Risk Factor for Parkinsonism, Tics, and Akathisia: A Systematic Review and Meta-Analysis. Life (Basel) 2023, 14. [Google Scholar] [CrossRef] [PubMed]
- Hajimohammadebrahim-Ketabforoush, M.; Meybodi, T.E.; Mehmandoost, M.; Fallah, M.; Bahri, A.; Hajimirzaei, S.M.; Sharifi, H.; Zare, A.; Oveisi, S.; Zali, A.; et al. Immunonutrition for modifying inflammatory markers and improving clinical outcomes following traumatic brain injury: a systematic review and meta-analysis. BMC Neurol 2025, 26, 16. [Google Scholar] [CrossRef]
- Narapareddy, B.R.; Narapareddy, L.; Lin, A.; Wigh, S.; Nanavati, J.; Dougherty, J., 3rd; Nowrangi, M.; Roy, D. Treatment of Depression After Traumatic Brain Injury: A Systematic Review Focused on Pharmacological and Neuromodulatory Interventions. Psychosomatics 2020, 61, 481–497. [Google Scholar] [CrossRef] [PubMed]
- Clay, F.J.; Perry, L.A.; Hicks, A.J.; Batty, R.; Tufanaru, C.; Jayaram, M.; Ponsford, J.; Hopwood, M. Safety and effectiveness of pharmacotherapy for depression in adults who have sustained a traumatic brain injury: a systematic review protocol. JBI Database System Rev Implement Rep 2017, 15, 2270–2286. [Google Scholar] [CrossRef] [PubMed]
- Dehbozorgi, M.; Maghsoudi, M.R.; Rajai, S.; Mohammadi, I.; Nejad, A.R.; Rafiei, M.A.; Soltani, S.; Shafiee, A.; Bakhtiyari, M. Depression after traumatic brain injury: A systematic review and Meta-analysis. Am J Emerg Med 2024, 86, 21–29. [Google Scholar] [CrossRef]
- Fujiwara, E.; Schwartz, M.L.; Gao, F.; Black, S.E.; Levine, B. Ventral frontal cortex functions and quantified MRI in traumatic brain injury. Neuropsychologia 2008, 46, 461–474. [Google Scholar] [CrossRef]
- Kang, E.K.; Kim, D.Y.; Paik, N.J. Transcranial direct current stimulation of the left prefrontal cortex improves attention in patients with traumatic brain injury: a pilot study. J Rehabil Med 2012, 44, 346–350. [Google Scholar] [CrossRef]
- Chen, W.; Man, X.; Zhang, Y.; Yao, G.; Chen, J. Medial prefrontal cortex oxytocin mitigates epilepsy and cognitive impairments induced by traumatic brain injury through reducing neuroinflammation in mice. Sci Rep 2023, 13, 5214. [Google Scholar] [CrossRef]
- Cui, L.; Luo, W.; Jiang, W.; Li, H.; Xu, J.; Liu, X.; Wang, B.; Wang, J.; Chen, G. Human umbilical cord mesenchymal stem cell-derived exosomes promote neurological function recovery in rat after traumatic brain injury by inhibiting the activation of microglia and astrocyte. Regen Ther 2022, 21, 282–287. [Google Scholar] [CrossRef]
- Wang, J.; Hou, Y.; Zhang, L.; Liu, M.; Zhao, J.; Zhang, Z.; Ma, Y.; Hou, W. Estrogen Attenuates Traumatic Brain Injury by Inhibiting the Activation of Microglia and Astrocyte-Mediated Neuroinflammatory Responses. Mol Neurobiol 2021, 58, 1052–1061. [Google Scholar] [CrossRef] [PubMed]
- Xue, J.; Zhang, Y.; Zhang, J.; Zhu, Z.; Lv, Q.; Su, J. Astrocyte-derived CCL7 promotes microglia-mediated inflammation following traumatic brain injury. Int Immunopharmacol 2021, 99, 107975. [Google Scholar] [CrossRef] [PubMed]
- Kodali, M.; Madhu, L.N.; Reger, R.L.; Milutinovic, B.; Upadhya, R.; Gonzalez, J.J.; Attaluri, S.; Shuai, B.; Gitai, D.L.G.; Rao, S.; et al. Intranasally administered human MSC-derived extracellular vesicles inhibit NLRP3-p38/MAPK signaling after TBI and prevent chronic brain dysfunction. Brain Behav Immun 2023, 108, 118–134. [Google Scholar] [CrossRef]
- Wan, L.; Guo, H.; Hu, F.; Pan, Y.; Yang, S.; Jiang, C.Y.; Liu, W.; Wu, X.; Wu, X. EZH2-mediated suppression of TIMP1 in spinal GABAergic interneurons drives microglial activation via MMP-9-TLR2/4-NLRP3 signaling in neuropathic pain. Brain Behav Immun 2025, 128, 234–255. [Google Scholar] [CrossRef]
- Xie, J.; Bi, B.; Qin, Y.; Dong, W.; Zhong, J.; Li, M.; Cheng, Y.; Xu, J.; Wang, H. Inhibition of phosphodiesterase-4 suppresses HMGB1/RAGE signaling pathway and NLRP3 inflammasome activation in mice exposed to chronic unpredictable mild stress. Brain Behav Immun 2021, 92, 67–77. [Google Scholar] [CrossRef] [PubMed]
- Lim, J.Y.; Templeton, S.P. Regulation of lung inflammation by adiponectin. Front Immunol 2023, 14, 1244586. [Google Scholar] [CrossRef]
- Liu, C.; Li, X. Role of leptin and adiponectin in immune response and inflammation. Int Immunopharmacol 2025, 161, 115082. [Google Scholar] [CrossRef]
- Zheng, J.; Zhang, W.; Xu, R.; Liu, L. The role of adiponectin and its receptor signaling in ocular inflammation-associated diseases. Biochem Biophys Res Commun 2024, 717, 150041. [Google Scholar] [CrossRef]
- Najafi, A.; Mohammadi, I.; Sadeghi, M.; Bruhl, A.B.; Sadeghi-Bahmani, D.; Brand, S. Evaluation of Plasma/Serum Adiponectin (an Anti-Inflammatory Factor) Levels in Adult Patients with Obstructive Sleep Apnea Syndrome: A Systematic Review and Meta-Analysis. Life (Basel) 2022, 12. [Google Scholar] [CrossRef]
- Zhang, Y.; Wu, Y.; Fei, X.; Li, Y.; Li, Y.; Yan, X. Effects of Aerobic Exercise on Serum Adiponectin Concentrations in Children and Adolescents with Obesity: A Systematic Review and Meta-Analysis. Life (Basel) 2023, 13. [Google Scholar] [CrossRef]
- Myasoedova, V.A.; Bertolini, F.; Valerio, V.; Moschetta, D.; Massaiu, I.; Rusconi, V.; De Giorgi, D.; Ciccarelli, M.; Parisi, V.; Poggio, P. The Role of Adiponectin and Leptin in Fibro-Calcific Aortic Valve Disease: A Systematic Review and Meta-Analysis. Biomedicines 2024, 12. [Google Scholar] [CrossRef]
- Devesa, I.; Fernandez-Ballester, G.; Fernandez-Carvajal, A.; Ferrer-Montiel, A. A review of the patent literature surrounding TRPV1 modulators. Expert Opin Ther Pat 2025, 35, 477–491. [Google Scholar] [CrossRef]
- Escelsior, A.; Sterlini, B.; Murri, M.B.; Serafini, G.; Aguglia, A.; da Silva, B.P.; Corradi, A.; Valente, P.; Amore, M. Red-hot chili receptors: A systematic review of TRPV1 antagonism in animal models of psychiatric disorders and addiction. Behav Brain Res 2020, 393, 112734. [Google Scholar] [CrossRef]
- Li, L.; Chen, C.; Chiang, C.; Xiao, T.; Chen, Y.; Zhao, Y.; Zheng, D. The Impact of TRPV1 on Cancer Pathogenesis and Therapy: A Systematic Review. Int J Biol Sci 2021, 17, 2034–2049. [Google Scholar] [CrossRef]
- Kong, W.L.; Peng, Y.Y.; Peng, B.W. Modulation of neuroinflammation: Role and therapeutic potential of TRPV1 in the neuro-immune axis. Brain Behav Immun 2017, 64, 354–366. [Google Scholar] [CrossRef] [PubMed]
- Li, Y.; Uhelski, M.L.; North, R.Y.; Farson, L.B.; Bankston, C.B.; Roland, G.H.; Fan, D.H.; Sheffield, K.N.; Jia, A.; Orlando, D.; et al. ApoA-I binding protein (AIBP) regulates transient receptor potential vanilloid 1 (TRPV1) activity in rat dorsal root ganglion neurons by selective disruption of toll-like receptor 4 (TLR4)-lipid rafts. Brain Behav Immun 2025, 123, 644–655. [Google Scholar] [CrossRef]
- Lin, Y.W.; Cheng, S.W.; Liu, W.C.; Zailani, H.; Wu, S.K.; Hung, M.C.; Su, K.P. Chemogenetic targeting TRPV1 in obesity-induced depression: Unveiling therapeutic potential of eicosapentaenoic acid and acupuncture. Brain Behav Immun 2025, 123, 771–783. [Google Scholar] [CrossRef] [PubMed]
- Liu, S.; Wang, Z.; Su, Y.; Qi, L.; Yang, W.; Fu, M.; Jing, X.; Wang, Y.; Ma, Q. A neuroanatomical basis for electroacupuncture to drive the vagal-adrenal axis. Nature 2021, 598, 641–645. [Google Scholar] [CrossRef]
- Torres-Rosas, R.; Yehia, G.; Pena, G.; Mishra, P.; del Rocio Thompson-Bonilla, M.; Moreno-Eutimio, M.A.; Arriaga-Pizano, L.A.; Isibasi, A.; Ulloa, L. Dopamine mediates vagal modulation of the immune system by electroacupuncture. Nat Med 2014, 20, 291–295. [Google Scholar] [CrossRef] [PubMed]
- Lin, Y.W.; Chou, A.I.W.; Su, H.; Su, K.P. Transient receptor potential V1 (TRPV1) modulates the therapeutic effects for comorbidity of pain and depression: The common molecular implication for electroacupuncture and omega-3 polyunsaturated fatty acids. Brain Behav Immun 2020, 89, 604–614. [Google Scholar] [CrossRef]
- Hsiao, I.H.; Lin, M.C.; Hsu, H.C.; Chae, Y.; Su, Y.K.; Lin, Y.W. Chemogenetic Modulation of Electroacupuncture Analgesia in a Mouse Intermittent Cold Stress-Induced Fibromyalgia Model by Activating Cerebellum Cannabinoid Receptor 1 Expression and Signaling. Life (Basel) 2025, 15. [Google Scholar] [CrossRef] [PubMed]
- Chou, L.W.; Hsieh, Y.L.; Kuan, T.S.; Hong, C.Z. Needling therapy for myofascial pain: recommended technique with multiple rapid needle insertion. Biomedicine (Taipei) 2014, 4, 13. [Google Scholar] [CrossRef]
- Lin, H.C.; Park, H.J.; Liao, H.Y.; Chuang, K.T.; Lin, Y.W. Accurate Chemogenetics Determines Electroacupuncture Analgesia Through Increased CB1 to Suppress the TRPV1 Pathway in a Mouse Model of Fibromyalgia. Life (Basel) 2025, 15. [Google Scholar] [CrossRef]
- Lin, Y.W.; Chou, A.I.W.; Su, H.; Su, K.P. Transient receptor potential V1 (TRPV1) modulates the therapeutic effects for comorbidity of pain and depression: The common molecular implication for electroacupuncture and omega-3 polyunsaturated fatty acids. Brain Behav Immun 2020, 89, 604–614. [Google Scholar] [CrossRef]
- Howlett, J.R.; Nelson, L.D.; Stein, M.B. Mental Health Consequences of Traumatic Brain Injury. Biol Psychiatry 2022, 91, 413–420. [Google Scholar] [CrossRef]
- Cai, Y.; Huang, G.; Ren, M.; Zhang, X.; Yan, T.; Zhu, L. Identification of preventive biomarkers associated with circadian rhythms in traumatic brain injury-mediated depression: Expression of SERPINE1 protein and bioinformatics analysis. Int J Biol Macromol 2025, 310, 143229. [Google Scholar] [CrossRef]
- Tranchida, N.; Inferrera, F.; Cuzzocrea, S.; Cordaro, M.; Di Paola, R. Updates on first- and second-generation antidepressants used in the treatment of traumatic brain injury-induced depression. Prog Neuropsychopharmacol Biol Psychiatry 2025, 141, 111458. [Google Scholar] [CrossRef]
- Xie, L.L.; Rui, C.; Li, Z.Z.; Li, S.S.; Fan, Y.J.; Qi, M.M. Melatonin mitigates traumatic brain injury-induced depression-like behaviors through HO-1/CREB signal in rats. Neurosci Lett 2022, 784, 136754. [Google Scholar] [CrossRef] [PubMed]
- Du, M.; Fu, J.; Zhang, J.; Zhu, Z.; Huang, X.; Tan, W.; Liu, L.; Huang, Z.; Liu, X.; Tan, Q.; et al. CircSpna2 attenuates cuproptosis by mediating ubiquitin ligase Keap1 to regulate the Nrf2-Atp7b signalling axis in depression after traumatic brain injury in a mouse model. Clin Transl Med 2024, 14, e70100. [Google Scholar] [CrossRef] [PubMed]
- Zhou, M.; Liu, Y.W.; He, Y.H.; Zhang, J.Y.; Guo, H.; Wang, H.; Ren, J.K.; Su, Y.X.; Yang, T.; Li, J.B.; et al. FOXO1 reshapes neutrophils to aggravate acute brain damage and promote late depression after traumatic brain injury. Mil Med Res 2024, 11, 20. [Google Scholar] [CrossRef]
- Boyko, M.; Gruenbaum, B.F.; Shelef, I.; Zvenigorodsky, V.; Severynovska, O.; Binyamin, Y.; Knyazer, B.; Frenkel, A.; Frank, D.; Zlotnik, A. Traumatic brain injury-induced submissive behavior in rats: link to depression and anxiety. Transl Psychiatry 2022, 12, 239. [Google Scholar] [CrossRef] [PubMed]
- Gu, Y.; Dong, Y.; Wan, J.; Ren, H.; Koehler, R.C.; Wang, J. Interleukin-10 deficiency aggravates traumatic brain injury in male but not female mice. Exp Neurol 2022, 355, 114125. [Google Scholar] [CrossRef] [PubMed]
Figure 1.
Schematic diagram of depressive behavior exhibited by mice after TBI. (A) OFT shows the total walking distance and distance into the central region; (B) OFT shows the percentage of time mice entered the outer and central regions. (C) Percentage of total immobility and time spent by mice during the FST behavioral test; (D) Average time and number of immobility during the FST behavioral test. *Significant difference compared to the normal mouse group at the same time point. #Significant difference compared to the TBI mouse group at the same time point. n = 9 per group.
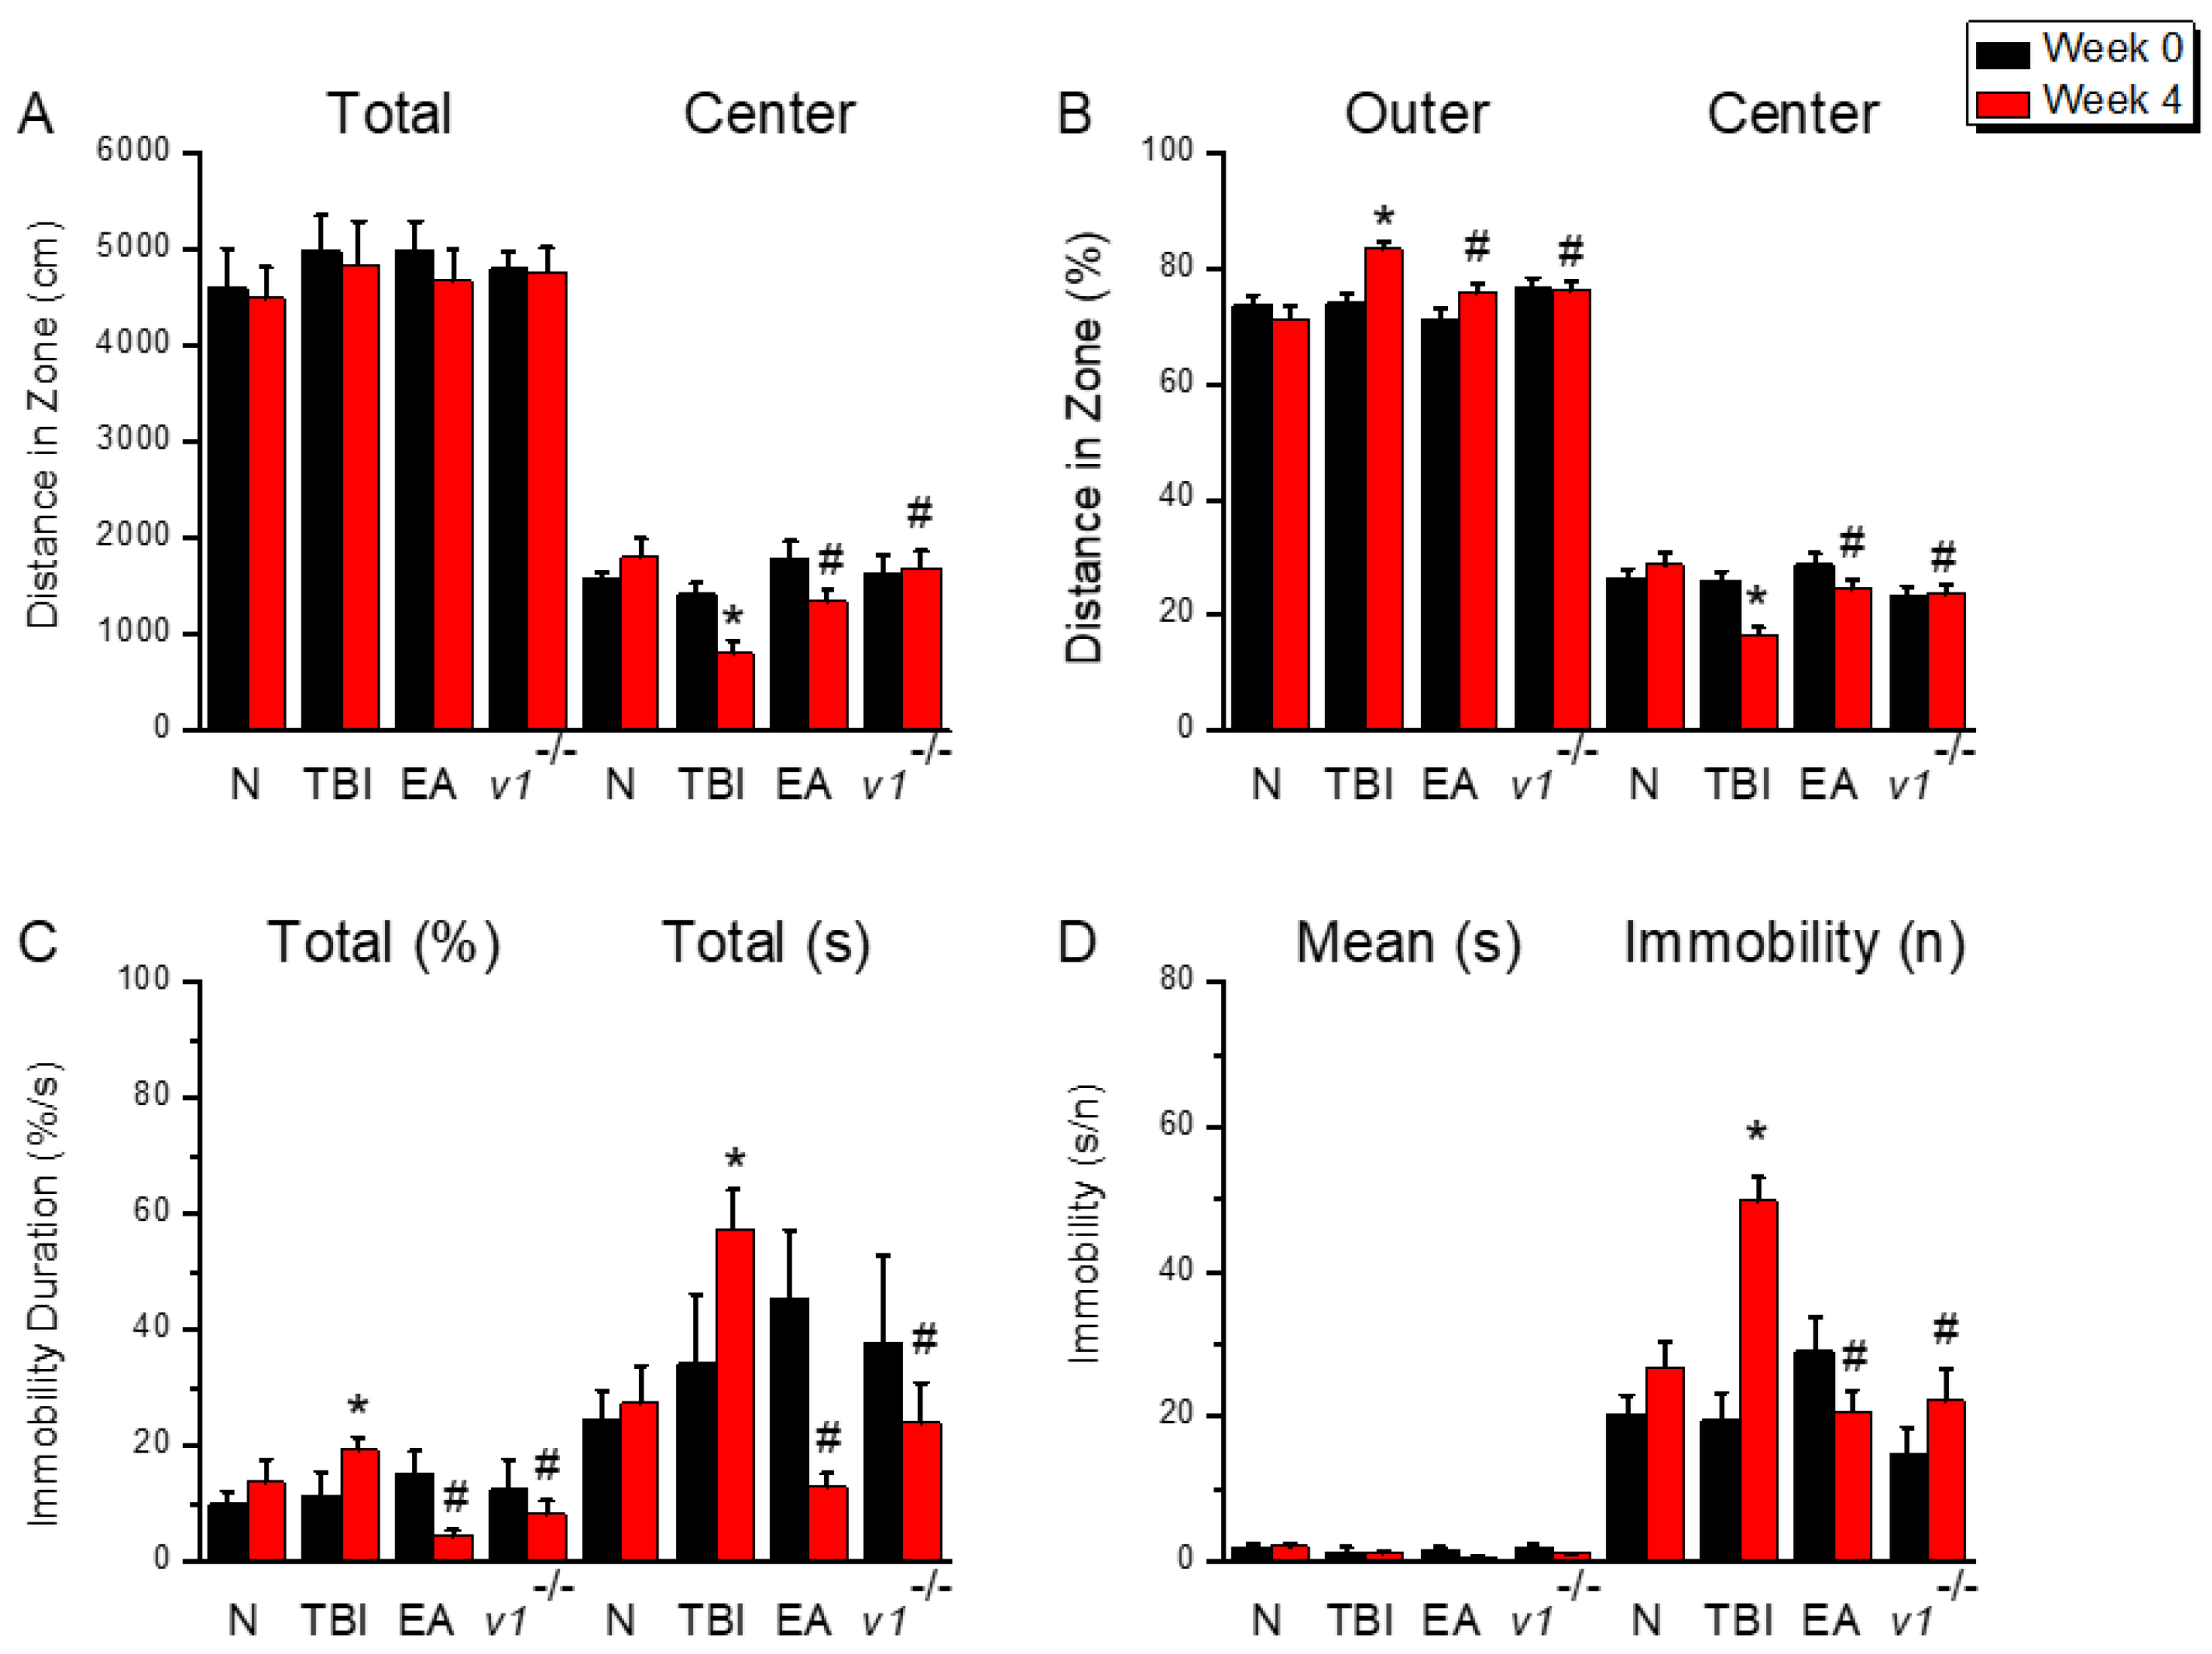
Figure 2.
Neuroinflammation in the left mPFC region of mice; protein expression of AdipoR1-related molecules. Western blotting assay included four lanes: normal group, TBI group, TBI+EA group, and TBI+ Trpv1−/− group. (A) GFAP, (B) Iba1, (C) HMGB1, (D) S100B, (E) AdipoR1, (F) APPL1, (G) AMPKα, (H) PPARα, (I) SIRT. *Significant differences compared to the normal mouse group at the same time point. #Significant differences compared to the TBI mouse group at the same time point. n = 6 per group.
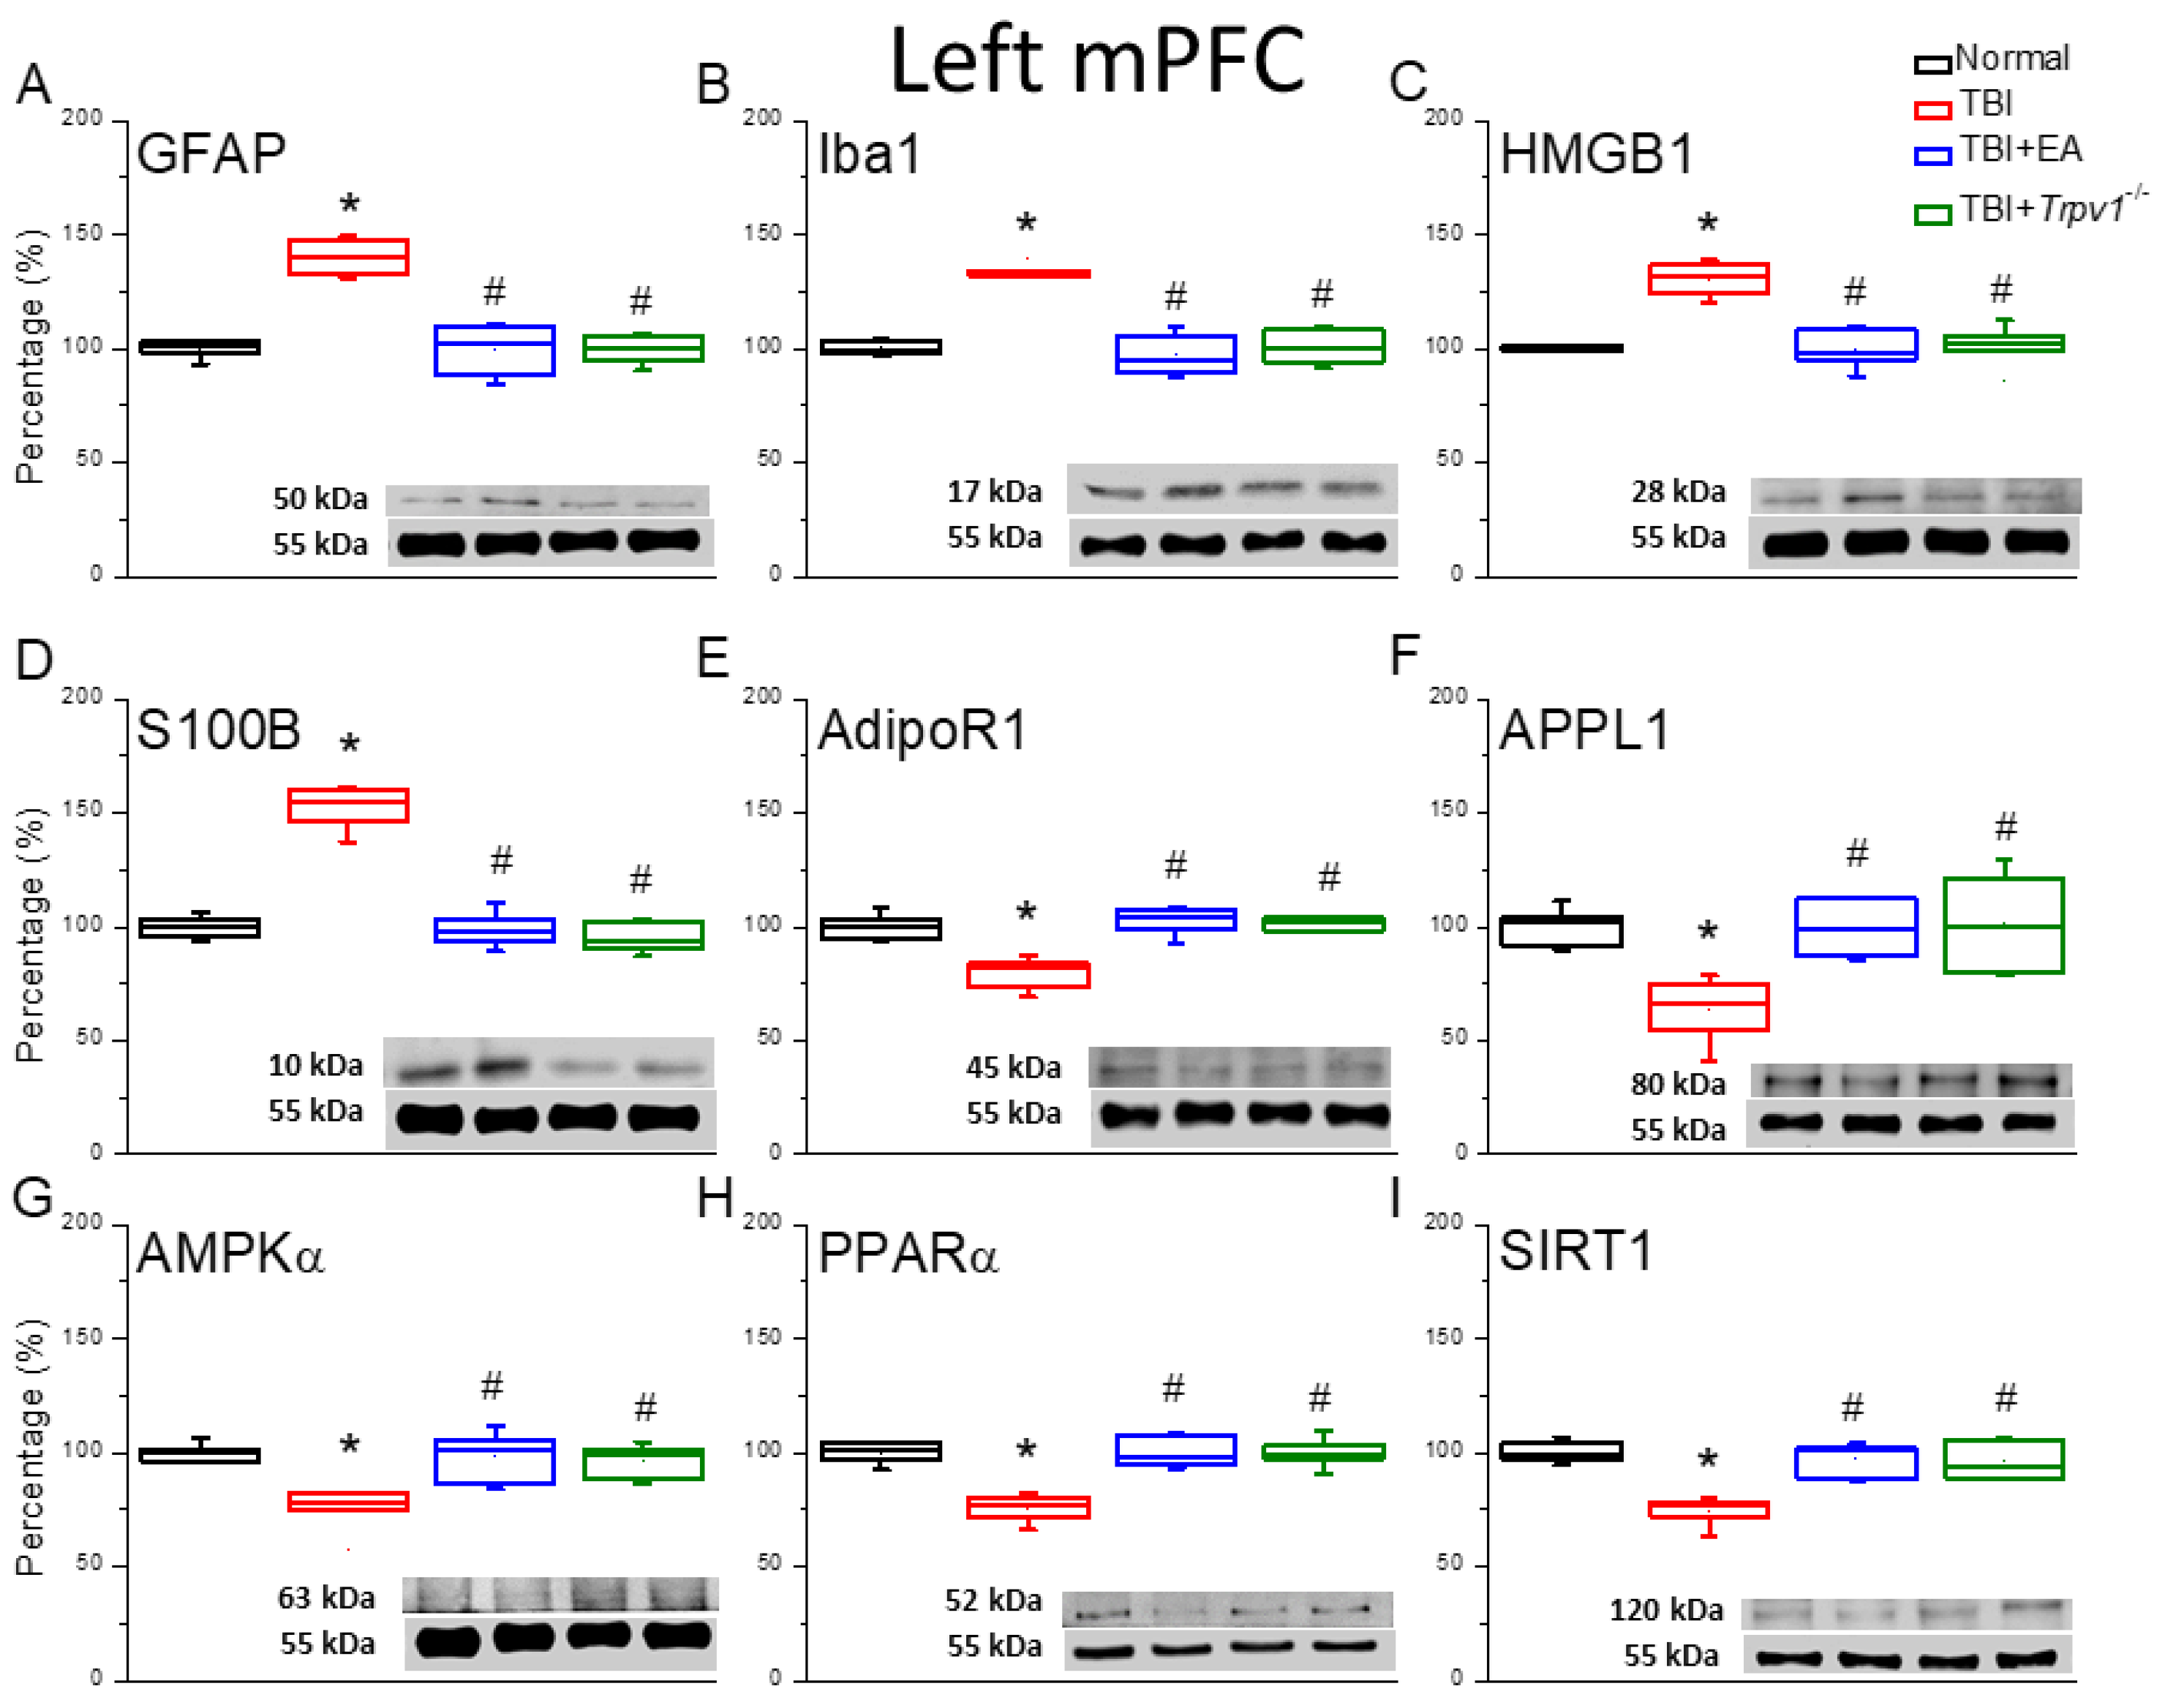
Figure 3.
Protein expression of TRPV1-related molecules in the left mPFC region of mice. Western blotting assay included four lanes: normal group, TBI group, TBI+EA group, and TBI+ Trpv1−/− group. (A) TRPV1, (B) pPKA, (C) pPI3K, (D) pPKC, (E) pAkt, (F) pmTOR, (G) pERK, (H) pCREB. *Significant differences compared to the normal mouse group at the same time point. #Significant differences compared to the TBI mouse group at the same time point. n = 6 per group.
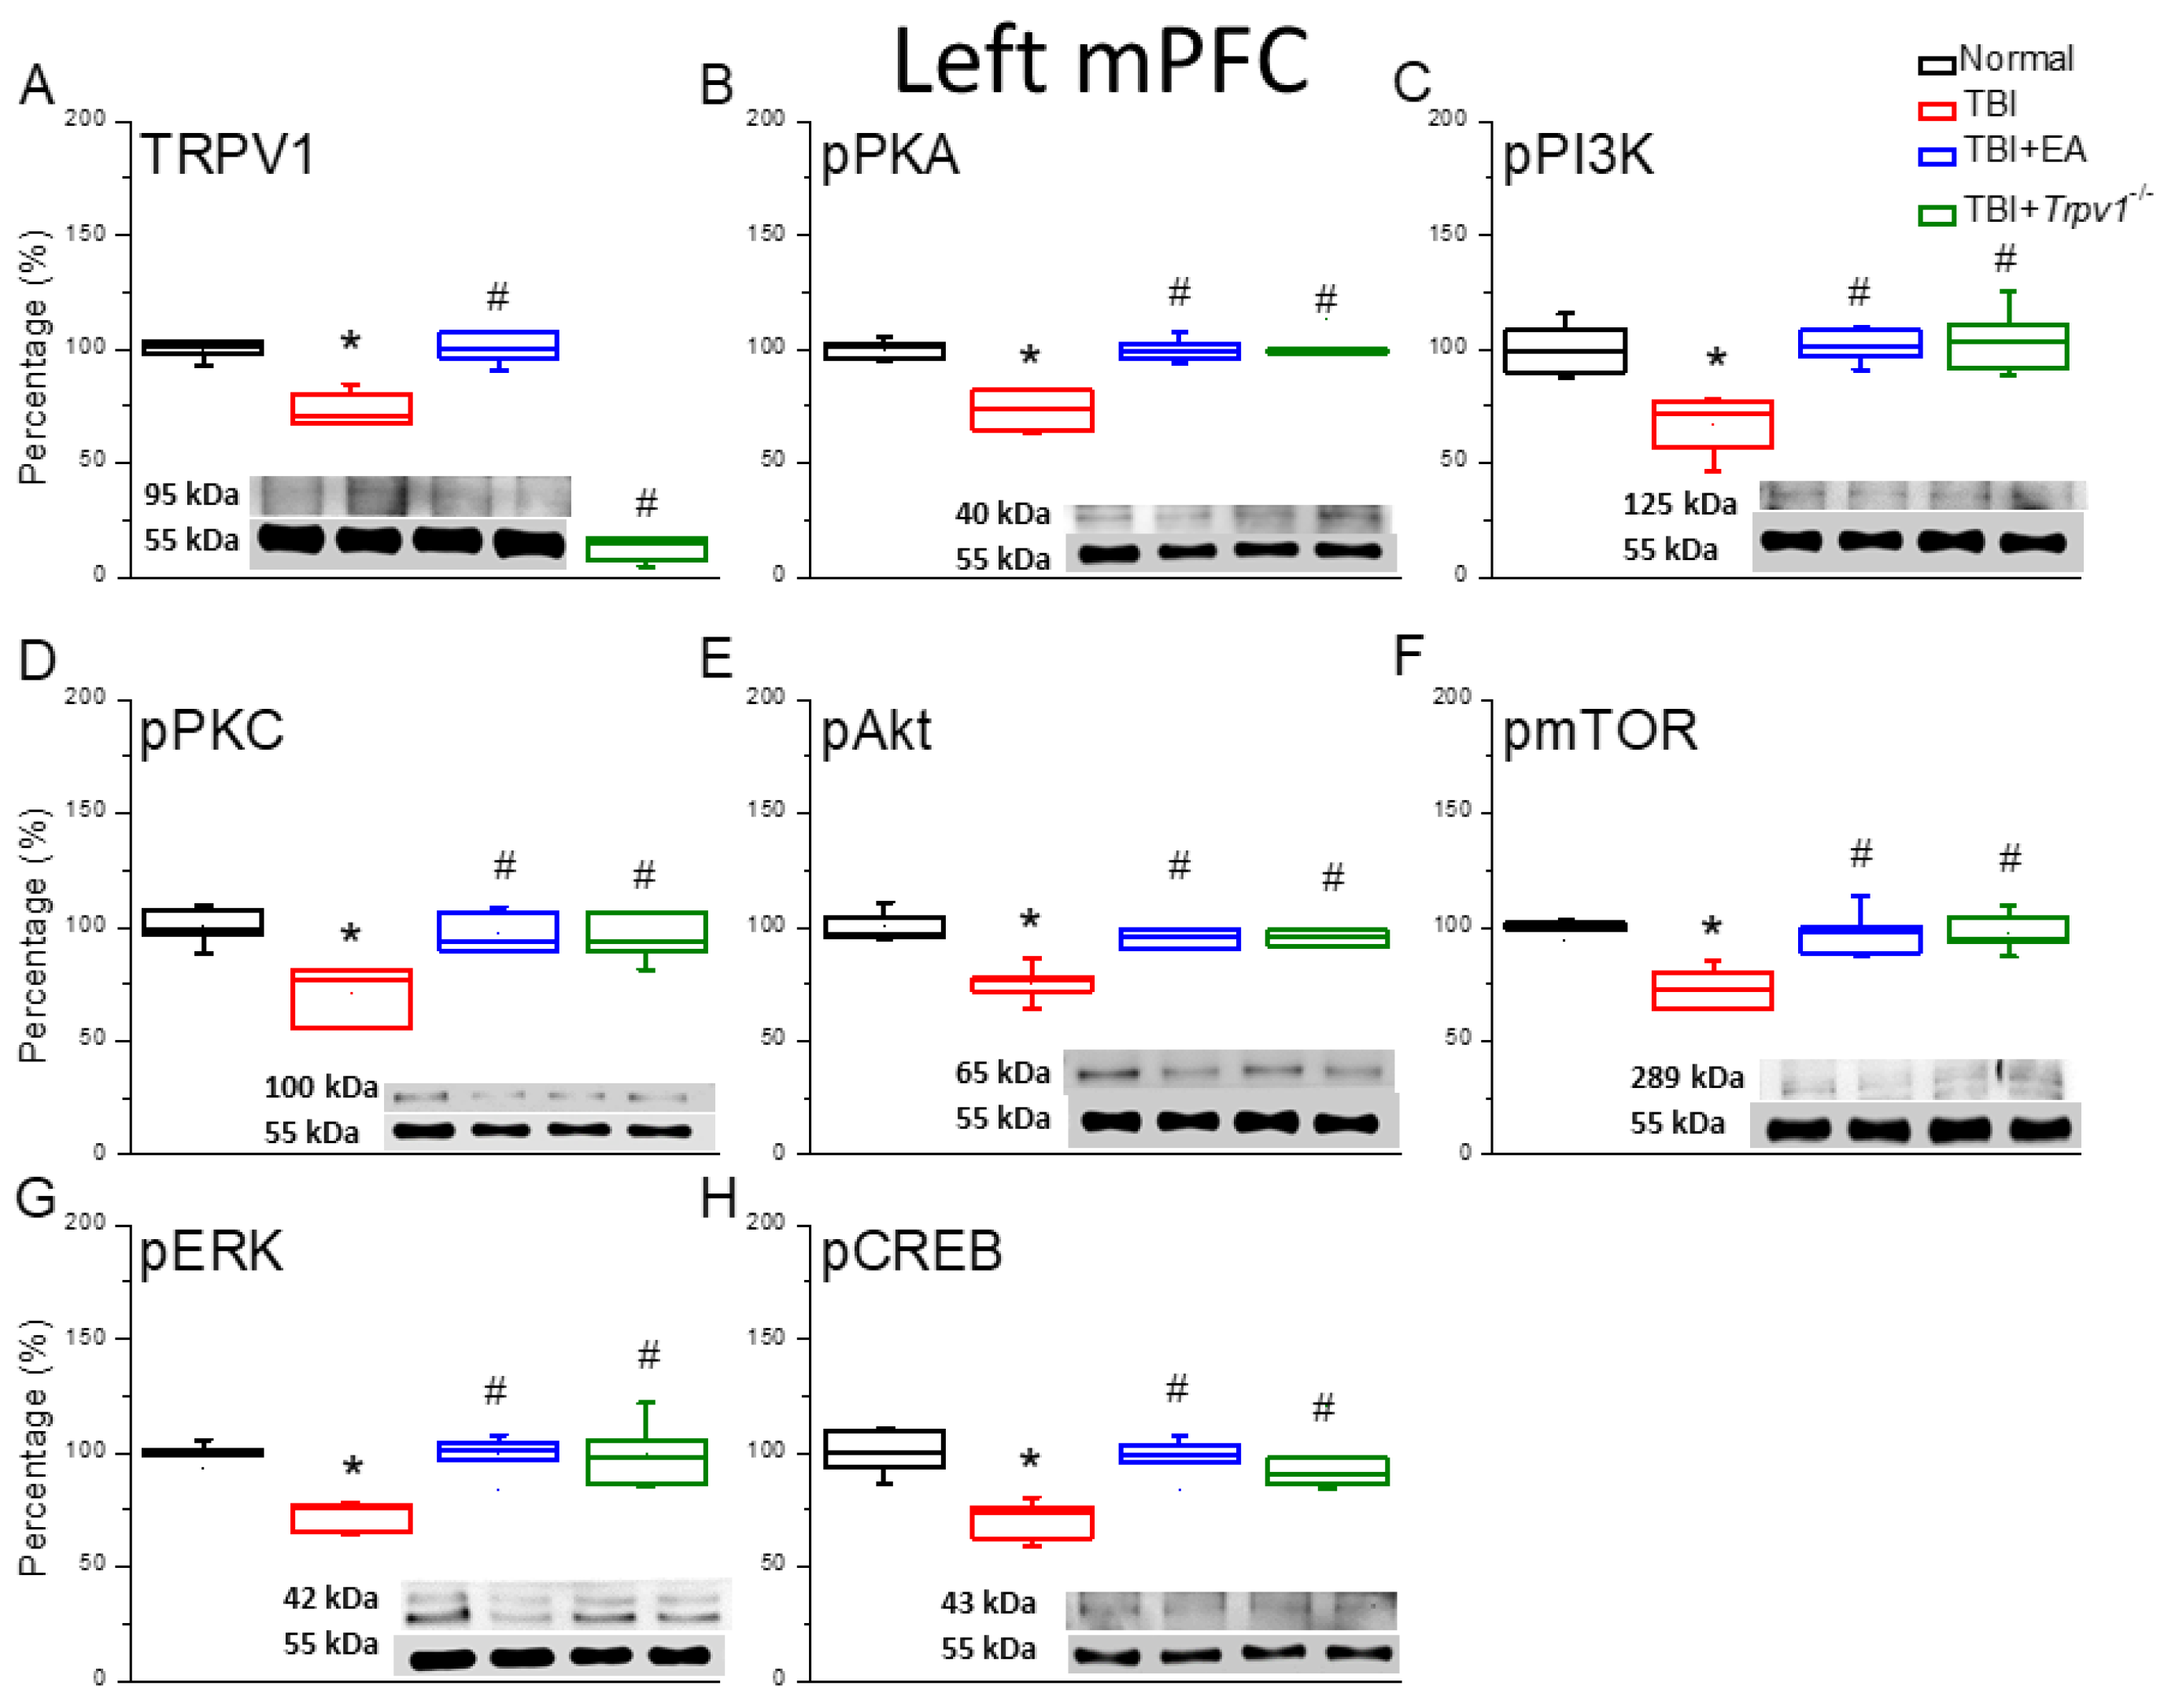
Figure 4.
Neuroinflammation in the right mPFC region of mice; protein expression of AdipoR1-related molecules. Western blotting assay included four lanes: normal group, TBI group, TBI+EA group, and TBI+Trpv1−/− group. (A) GFAP, (B) Iba1, (C) HMGB1, (D) S100B, (E) AdipoR1, (F) APPL1, (G) AMPKα, (H) PPARα, (I) SIRT. *Significant differences compared to the normal mouse group at the same time point. #Significant differences compared to the TBI mouse group at the same time point. n = 6 per group.
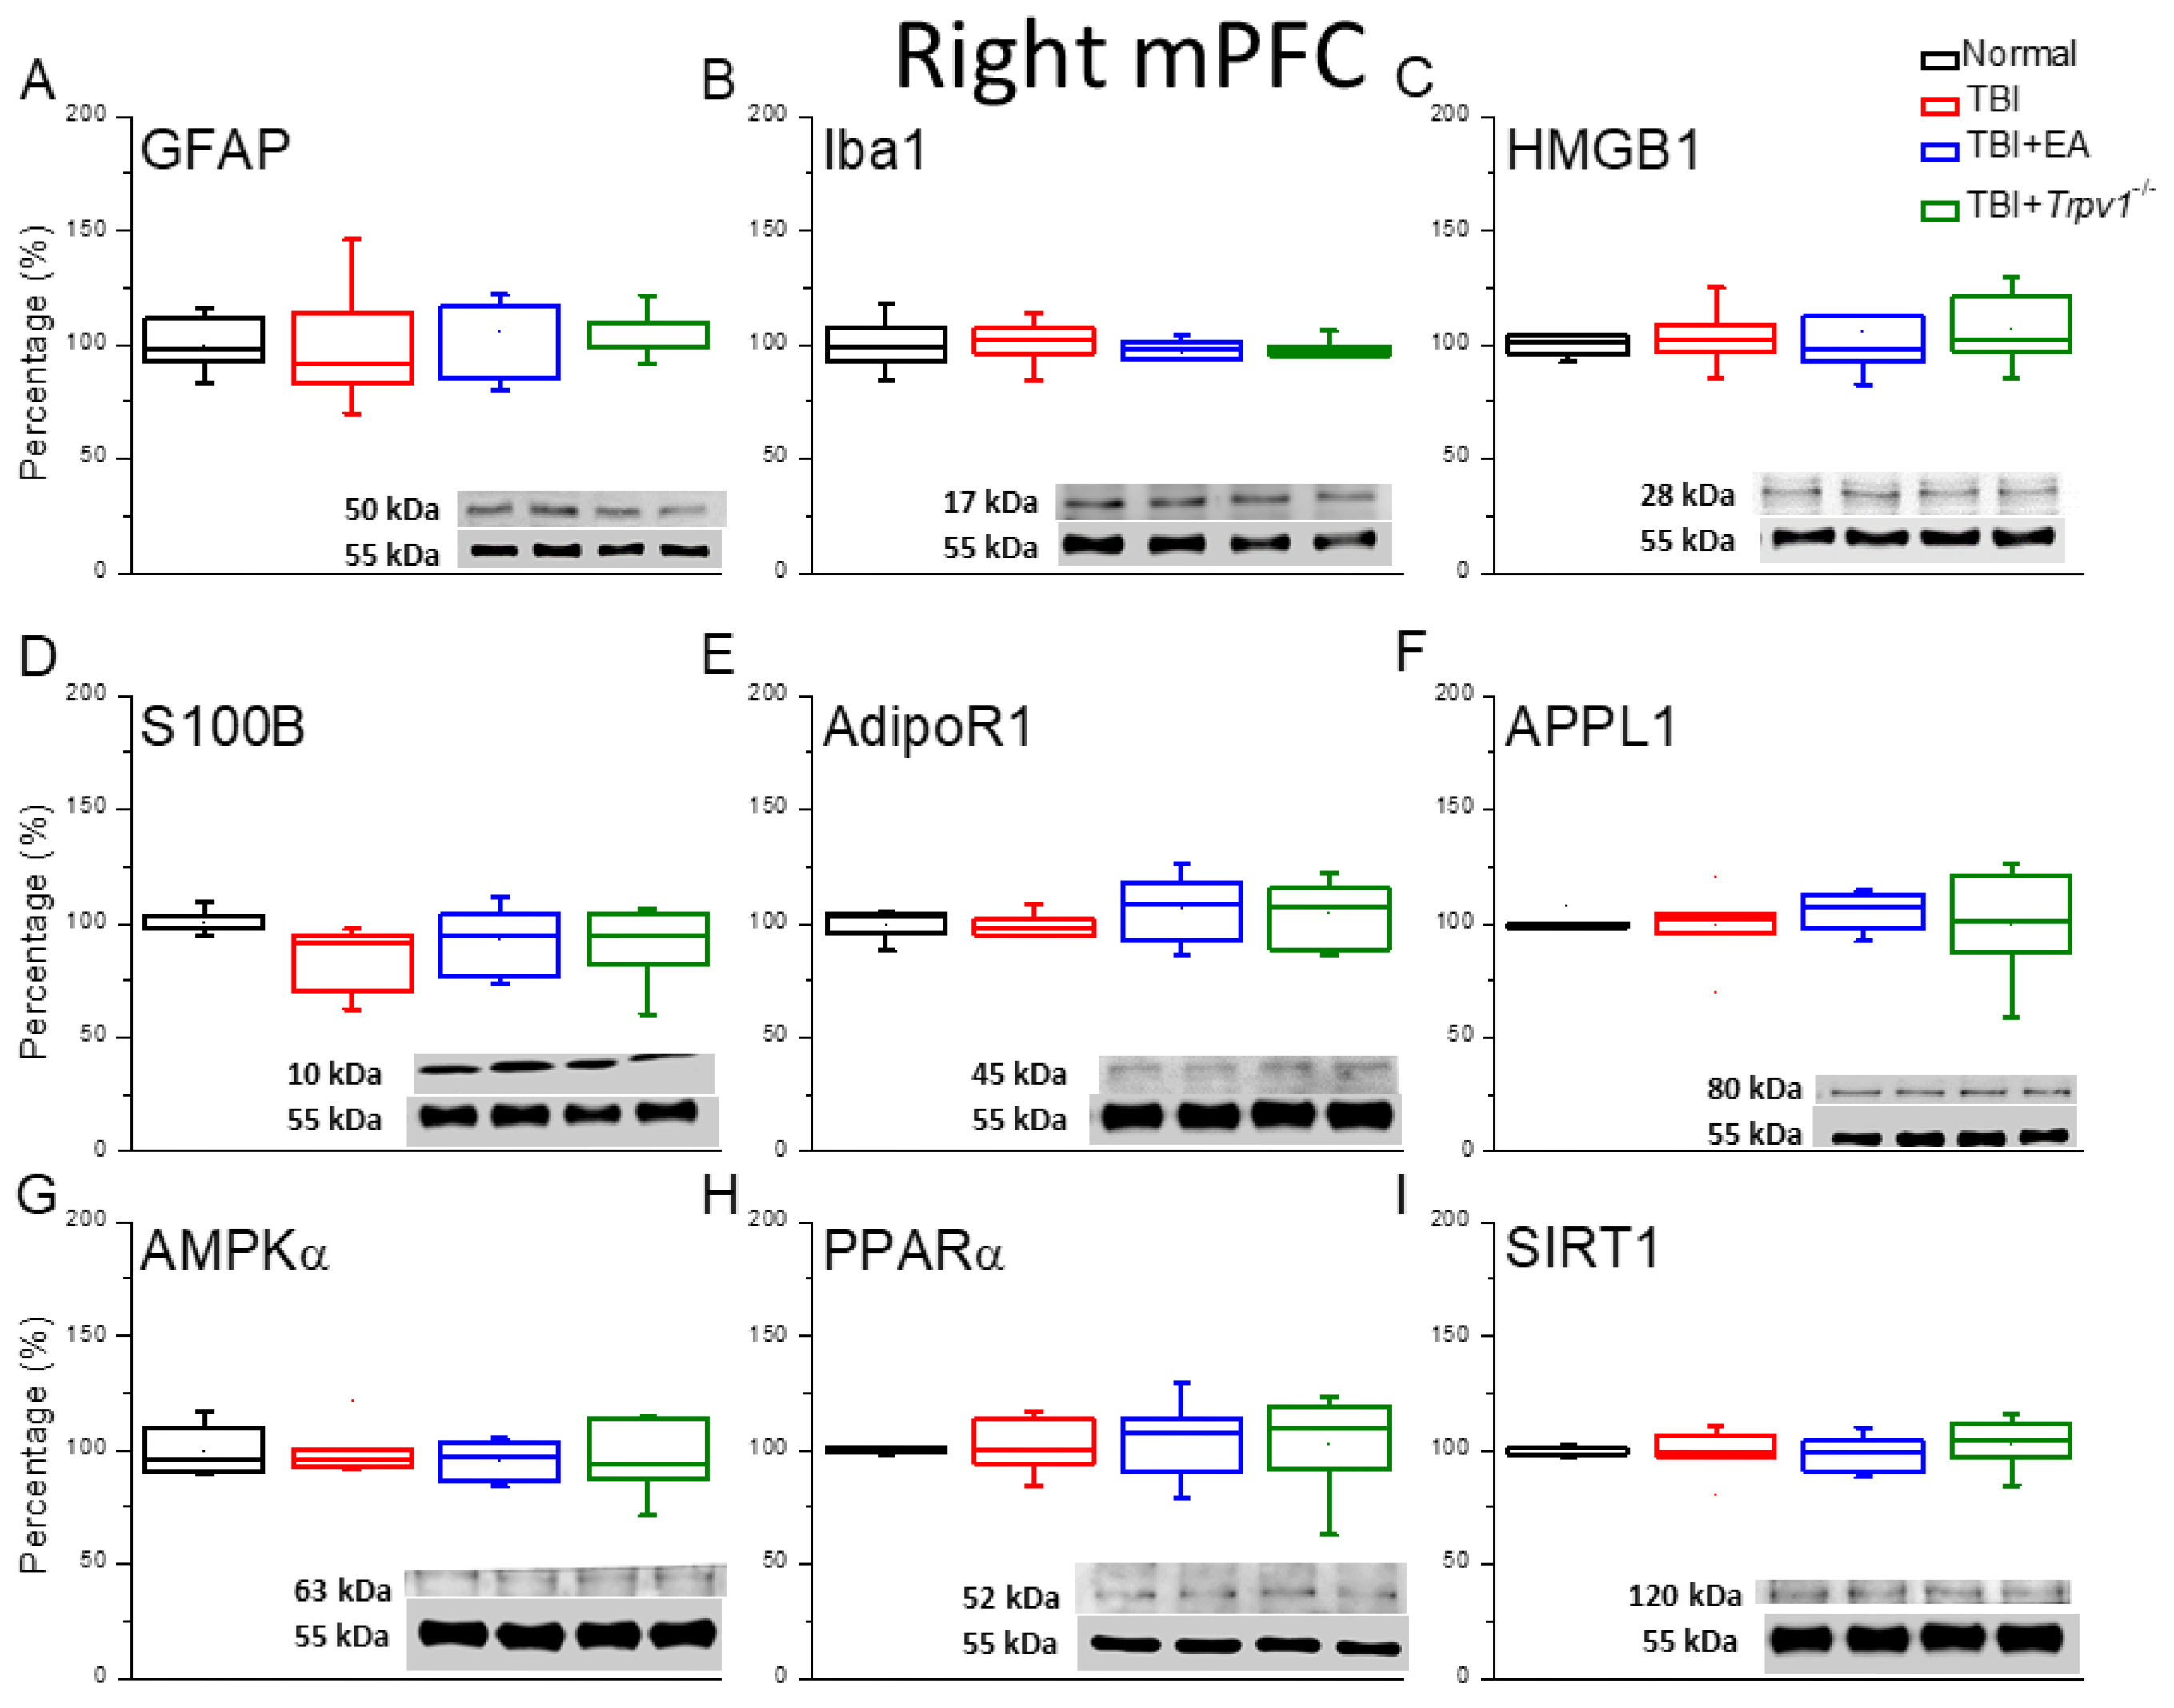
Figure 5.
Protein expression of TRPV1-related molecules in the right mPFC region of mice. Western blotting assay included four lanes: normal group, TBI group, TBI+EA group, and TBI+ Trpv1−/− group. (A) TRPV1, (B) pPKA, (C) pPI3K, (D) pPKC, (E) pAkt, (F) pmTOR, (G) pERK, (H) pCREB. *Significant differences compared to the normal mouse group at the same time point. #Significant differences compared to the TBI mouse group at the same time point. n = 6 per group.
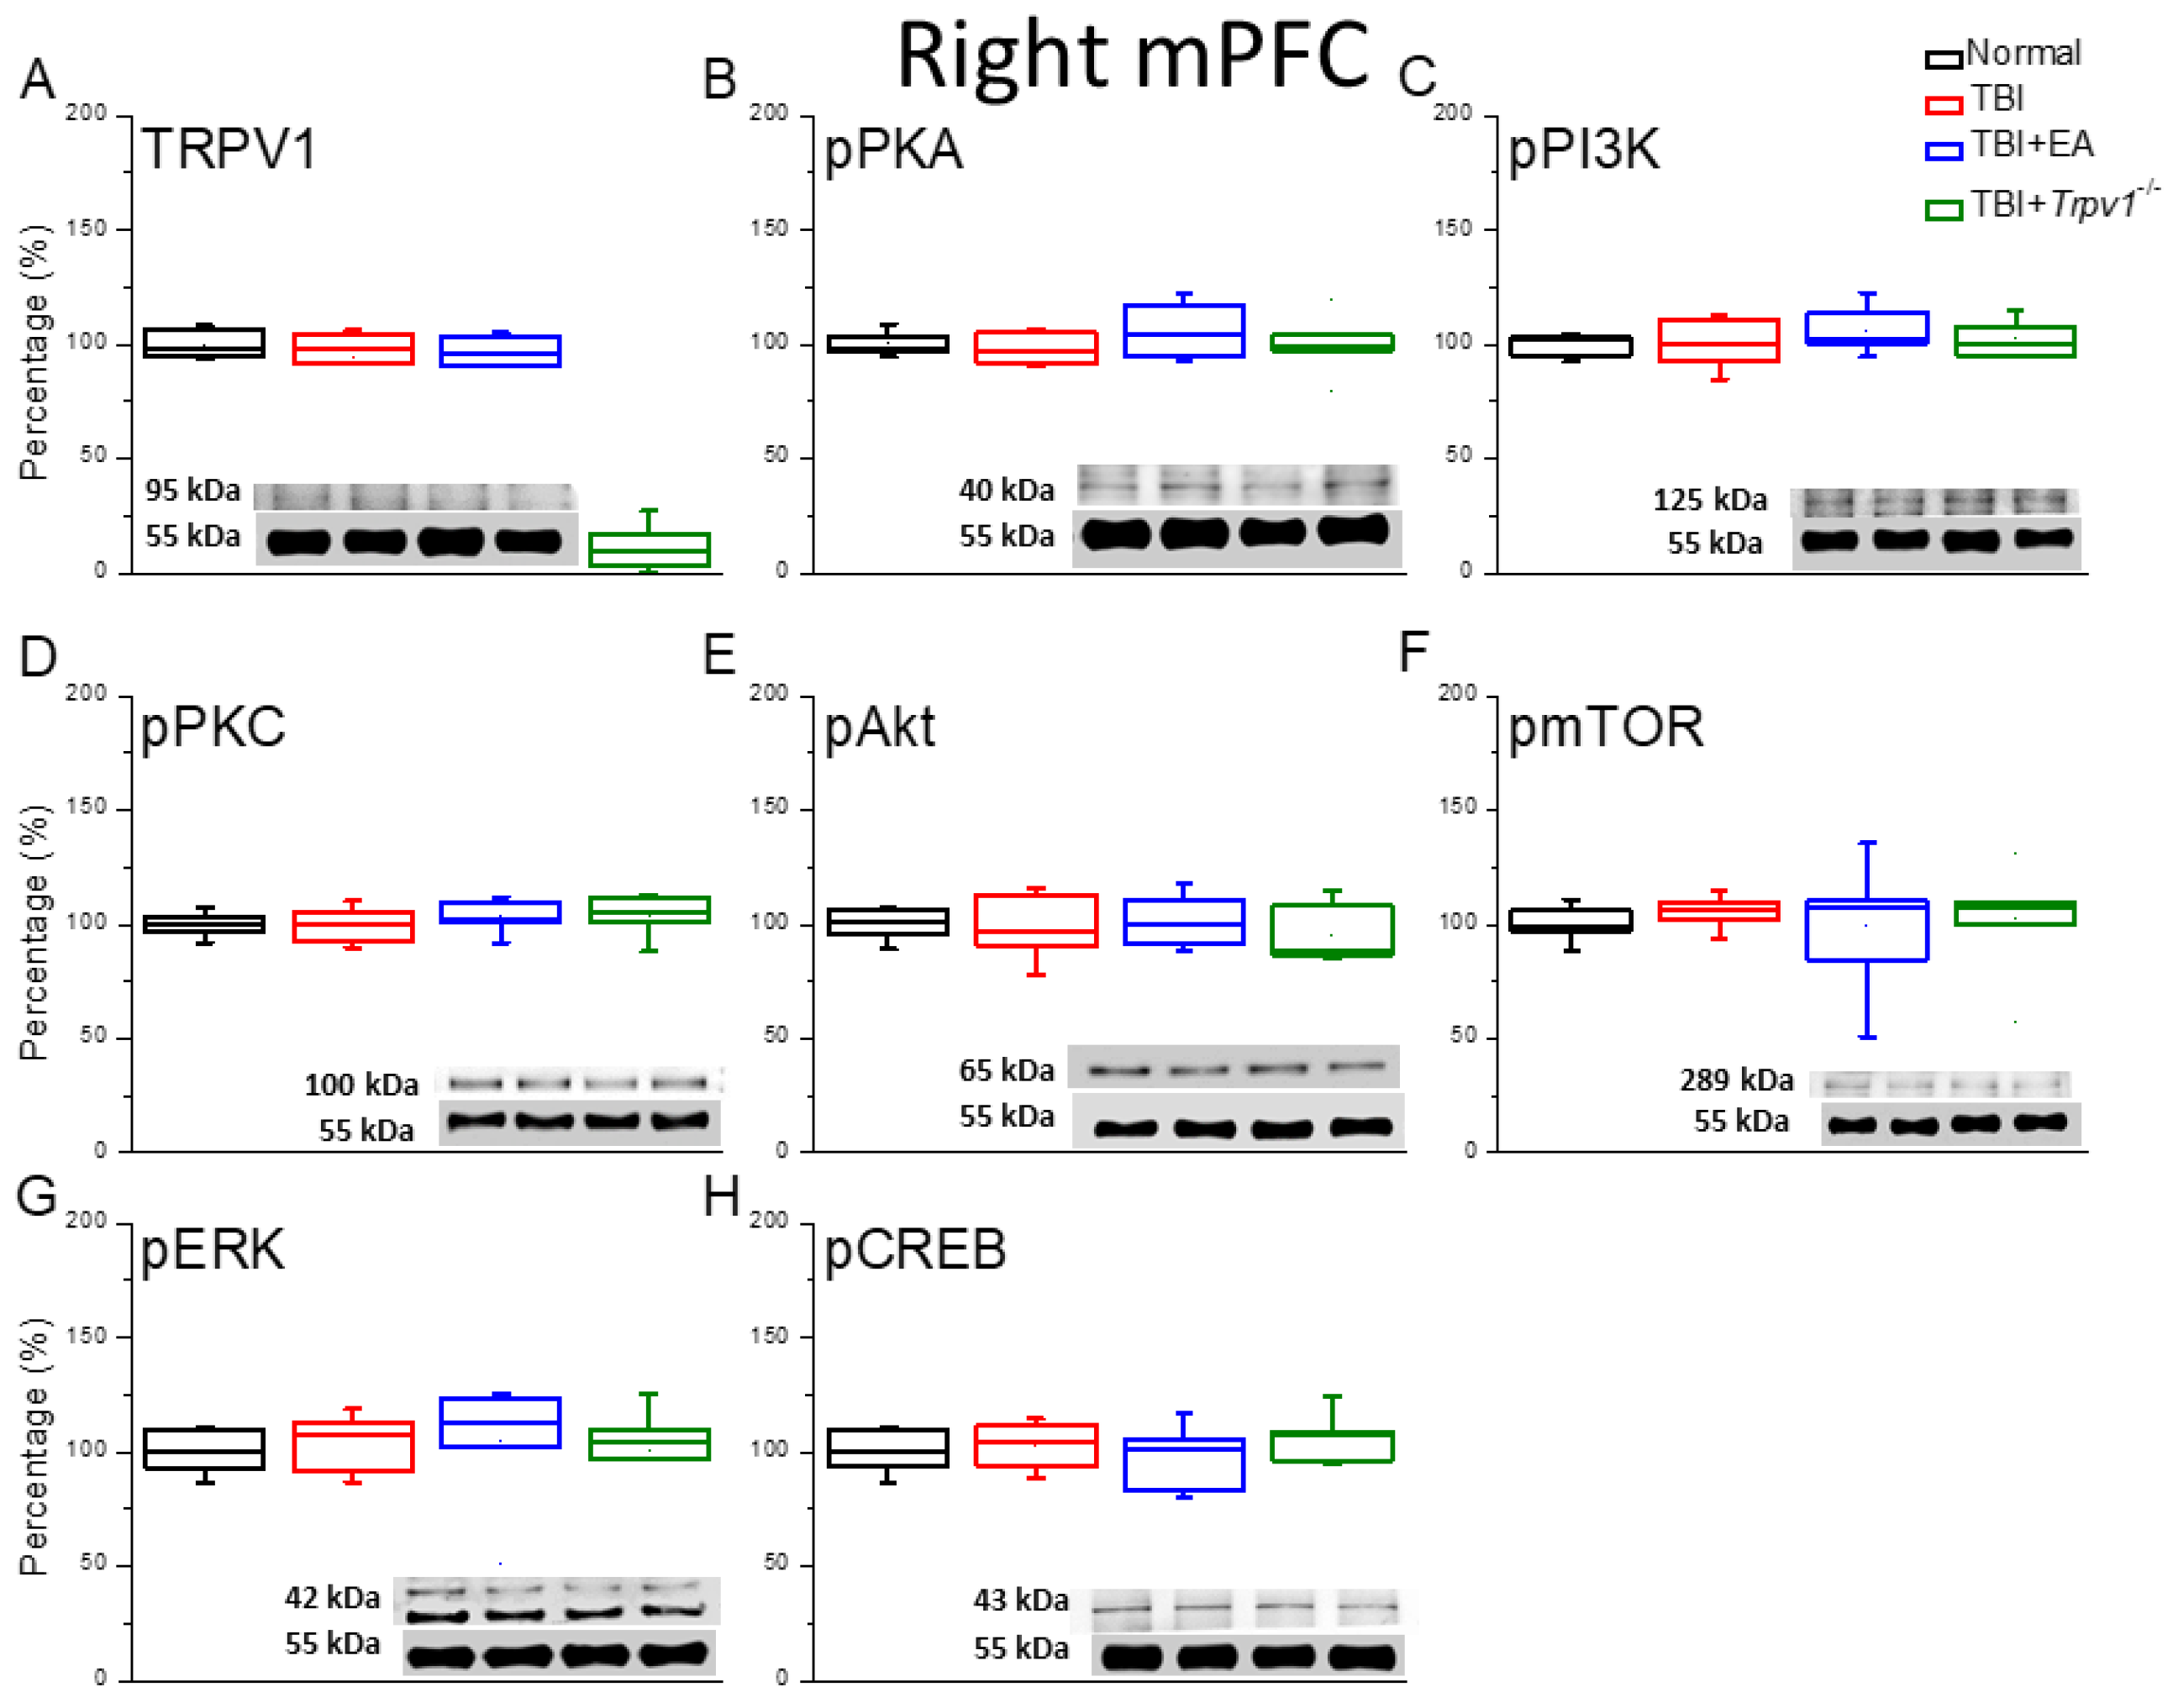
Figure 6.
Fluorescence intensities of TRPV1 and related molecules labeled in the mouse left mPFC. Immunofluorescence staining of (A) DAPI, (B) Iba1, (C) TRPV1, and (D) pERK in the mouse mPFC (blue, red, or green). There were significant reduced in DAPI, TRPV1, and pERK protein levels of TBI mice. There was significant increase in Iba1 protein levels of TBI mice. n = 3 in all groups.
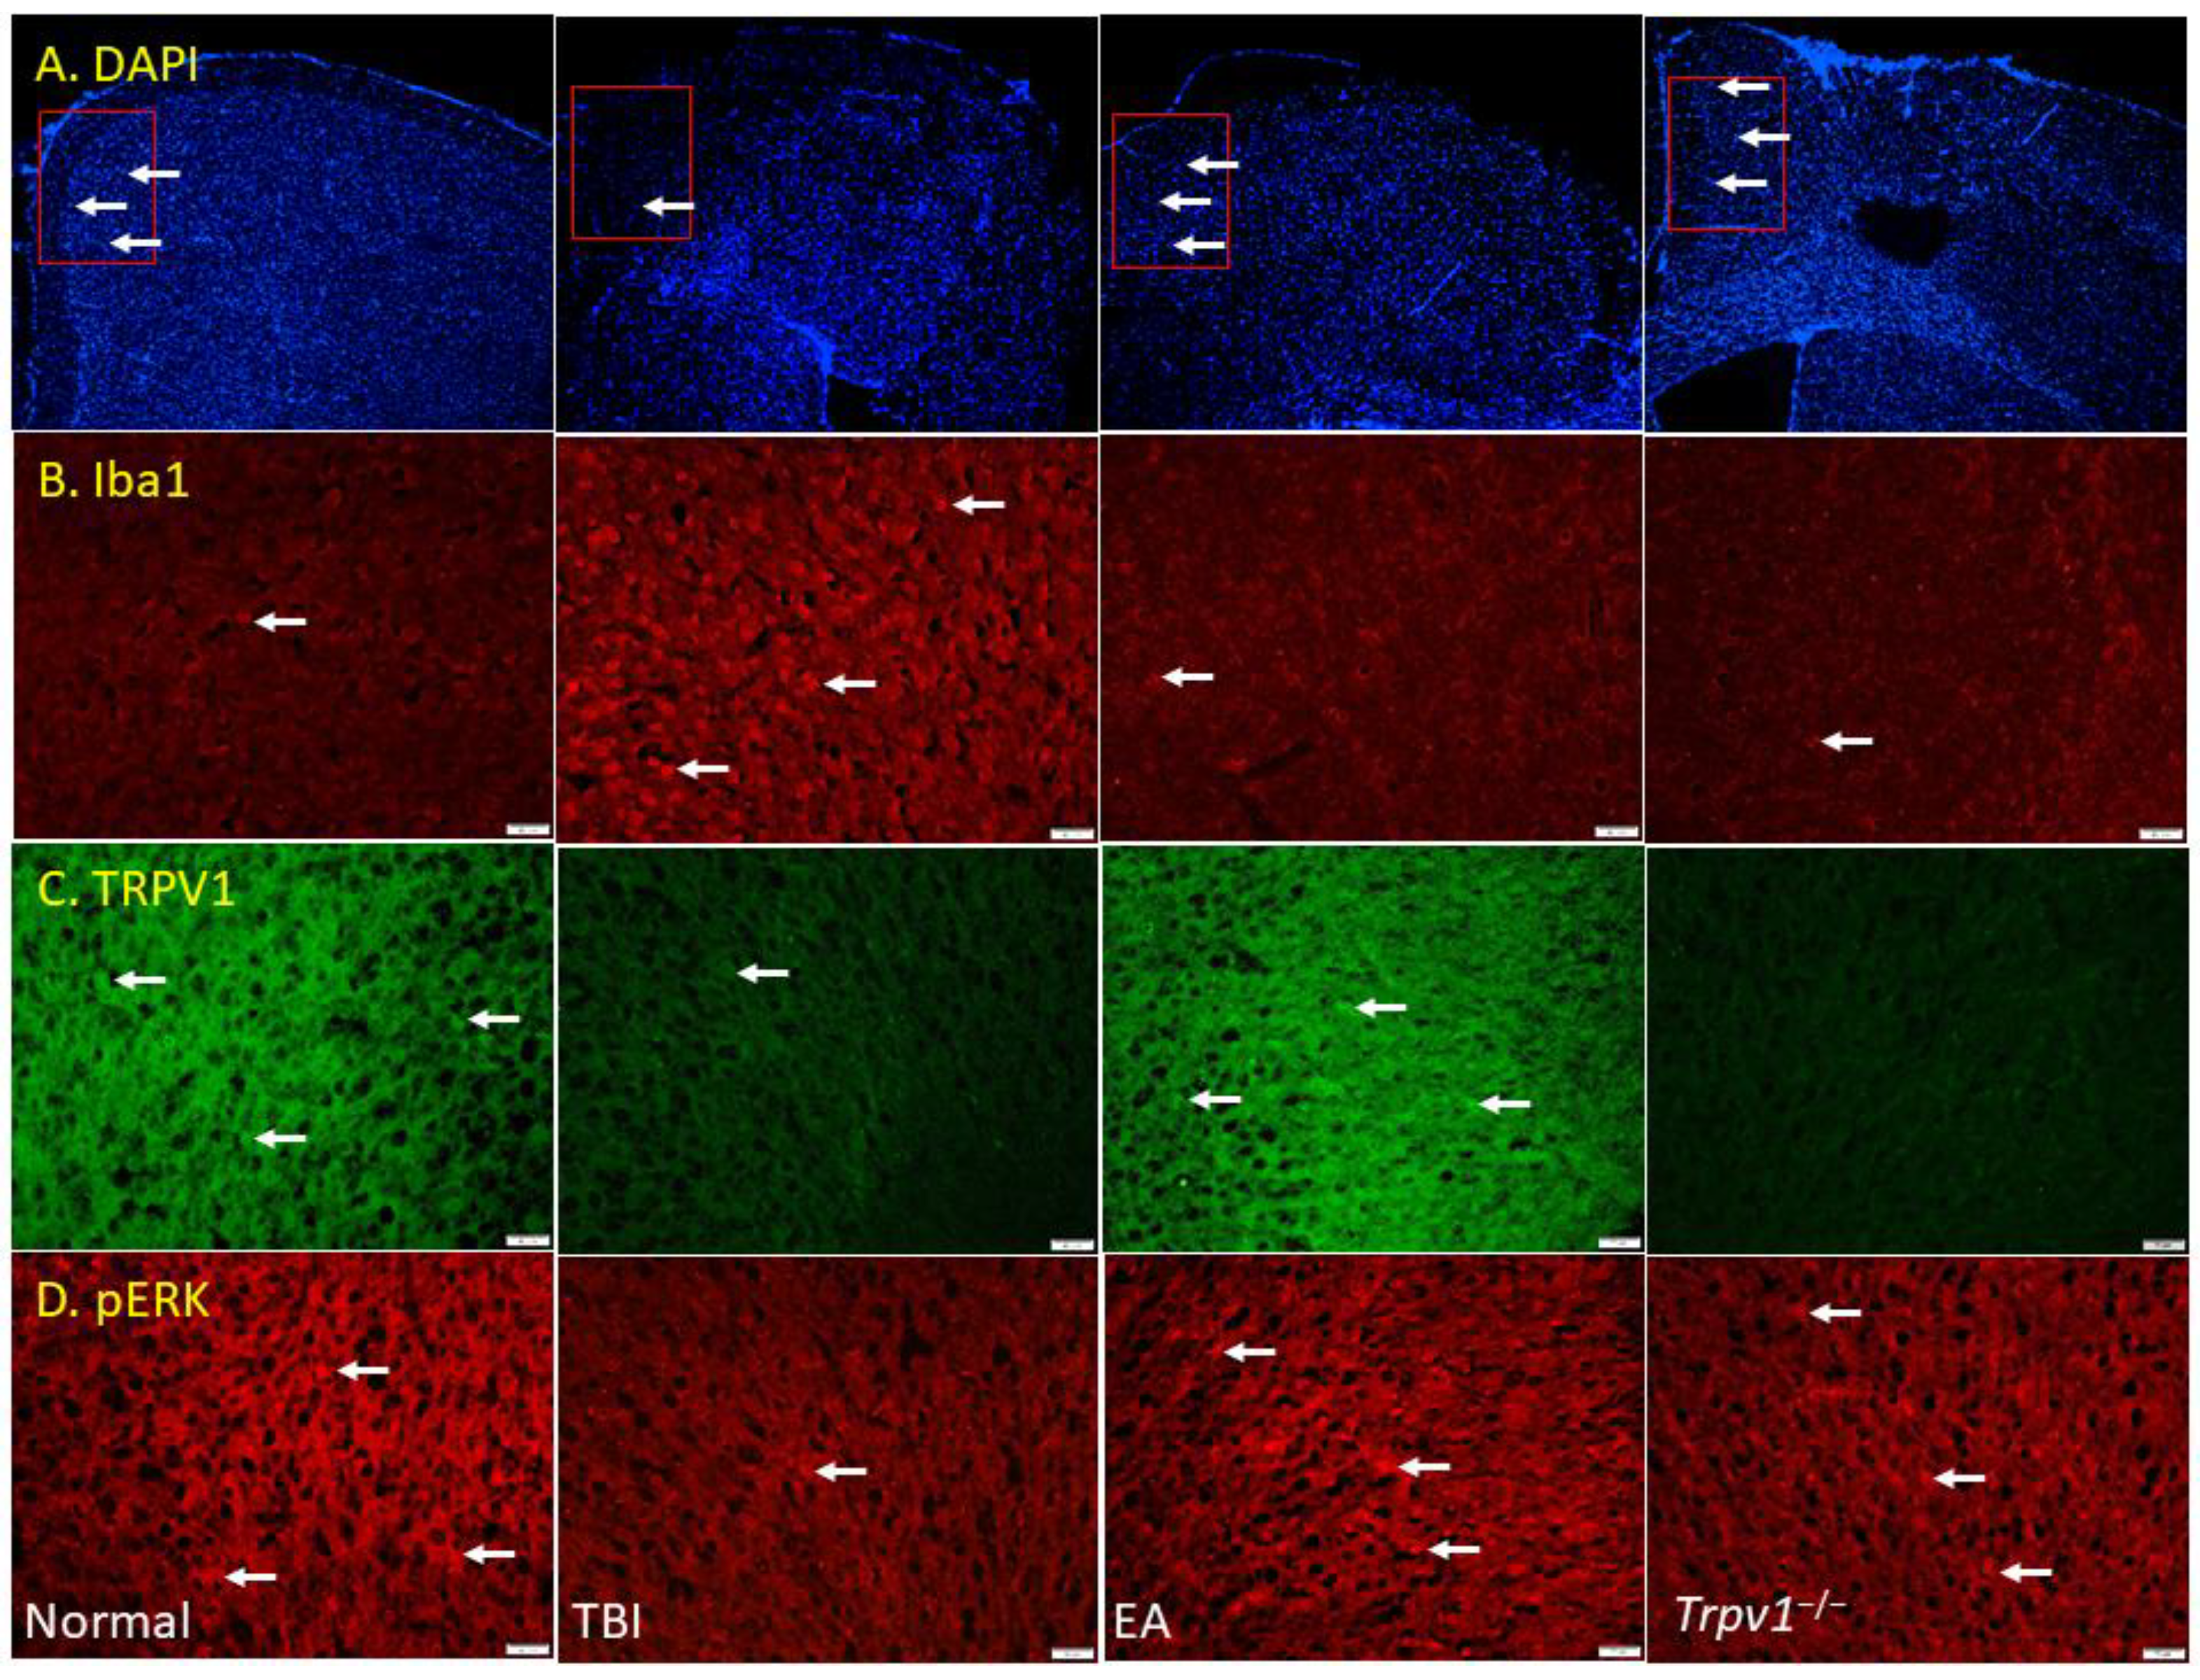
Figure 7.
Graphic diagram of EA in TBI-induced depression via neuroinflammation, AdipoR1, and TRPV1 signaling pathways.
Figure 7.
Graphic diagram of EA in TBI-induced depression via neuroinflammation, AdipoR1, and TRPV1 signaling pathways.
Disclaimer/Publisher’s Note: The statements, opinions and data contained in all publications are solely those of the individual author(s) and contributor(s) and not of MDPI and/or the editor(s). MDPI and/or the editor(s) disclaim responsibility for any injury to people or property resulting from any ideas, methods, instructions or products referred to in the content. |
© 2026 by the authors. Licensee MDPI, Basel, Switzerland. This article is an open access article distributed under the terms and conditions of the Creative Commons Attribution (CC BY) license (http://creativecommons.org/licenses/by/4.0/).
Copyright: This open access article is published under a Creative Commons CC BY 4.0 license, which permit the free download, distribution, and reuse, provided that the author and preprint are cited in any reuse.


