Submitted:
27 January 2026
Posted:
28 January 2026
You are already at the latest version
Abstract
Ceratocystis fimbriata, a widespread plant pathogenic fungus, causes symptoms such as black spots, wilting, and death on various plants. Pomegranate wilt, caused by this fungus, is a devastating disease in which chlamydospores play a key role in the disease cycle. In this study, we performed transcriptomic and metabolic analyses on three C. fimbriata strains (A4, F1, and D1) obtained from the Plant Pathology Laboratory of Xichang University. We compared mycelia samples collected before and after chla-mydospore formation. Our analysis identified 3,395 differentially accumulated metab-olites and 4,268 differentially expressed genes. By integrating the transcriptome and metabolome data, we found 63, 44 and 57 metabolic pathways enriched in each strain, respectively. Notably, 29 pathways were shared across all three strains, predominantly those associated with amino acid biosynthesis, cofactor biosynthesis, carbon metabo-lism and 2-oxocarboxylic acid metabolism. Furthermore, genes related to branched-chain transaminase and citrate synthase-related genes were enriched in these core pathways. These findings suggest that branched-chain transaminase and citrate synthase play important roles in chlamydospore formation.
Keywords:
Ceratocystis fimbriata
; chlamydospores
; transcriptome
; metabolome
; conjoint analysis
1. Introduction
Ceratocystis fimbriata is an ascomycetous fungus that poses serious threat to agricultural and forestry production [1,2,3,4,5]. This pathogen is distributed worldwide and has a wide host range, infecting over 30 species [2,3,4,5]. It causes xylem discoloration, wilting, ulceration, and rotting of tuber roots during storage, ultimately leading to plant death [1,2,3]. Pomegranate wilt caused by C. fimbriata is often referred to as the “cancer” of the pomegranate [9,10]. The disease has spread rapidly since its first discovery in the Panxi region of Sichuan in 2009, devastating local pomegranate industry and causing significant economic losses [9,11].
C. fimbriata produces four types of spores: ascospore, conidium, conidiophore and chlamydospore [11,12,13]. Among these, chlamydospores are the most important dormant structures and are essential for the disease cycle [13,14]. However, the molecular basis for the formation of chlamydospores in this pathogen remains unclear [15,16]. Recently, integrated transcriptomic and metabolomic approaches has been successfully applied to elucidate the mechanisms underlying chlamydospore formation in pathogens such as Fusarium oxysporum [16,17] and Fusarium graminearum [18]. These studies offer novel perspectives for developing targeted disease management strategies [19,20].
In this study, we performed transcriptomic and metabolomic profiling of mycelia from three C. fimbriata strains (A4, F1, and D1, all preserved at the Plant Pathology Laboratory, Xichang University) by comparing samples collected before and after chlamydospore formation, aiming to identify key genes and metabolic pathways involved in this developmental process. The results of this study provide a theoretical basis for understanding the mechanism of chlamydospore formation and developing effective disease prevention and control strategies.
2. Materials and Methods
2.1. Collection and Isolation of Diseased Samples
Strains A4, F1, and D1: Preserved strains from the Plant Pathology Laboratory of Xichang University.
Purification : Water agar medium ( WA ) was used to isolate single spores of strains A4 and F1 to obtain pure cultures. Subsequently, the well-grown colonies were transferred to potato dextrose agar ( PDA ) and cultured in a constant temperature incubator at 25 °C.
2.2. Preparation of Sequencing Samples
The preparation of sequencing samples was performed according to the method described by Hu et al., 2017 [21]. Nine different hyphal samples were collected before chlamydospore formation and incubated at 25℃ for 48 hours. Another set of nine different hyphal samples were collected after chlamydospore formation and incubated at 25℃ for 7 days. The abundance of chlamydospore in the latter samples were confirmed by microscopy [14]). From both pre- and post-chlamydospore samples, 3 samples were selected for transcriptome analysis and 6 for metabolome analysis. Each of the samples was at least 200 mg of the fungal hyphae. All collected samples were immediately snap-frozen in liquid nitrogen and stored at -80℃.
2.3. Transcriptomic Analysis
According to the established transcriptome analysis workflow [22], RNA quality was assessed using a Nanadrop and an Agilent 2100 Bioanalyzer. Based on RNA-Seq technology [23], a cDNA library was constructed and sequenced on the Illumina platform to obtain raw reads. Adapter-containing and low-quality reads were filtered out to obtain high-quality, clean reads [24]. De novo transcriptome assembly was performed using Trinity software [25], and the longest transcripts were extracted using a Python script to obtain a final set of non-redundant unigenes.
CPC software (v2.0) was used to screen and predict unigenes with coding potential. The identified coding unigenes were then compared with the Nr, Swiss-Prot, GO, eggNOG/COG, KOG, KEGG and Pfam databases using the BLAST program to obtain annotation information for novel genes.
The transcriptome data were analyzed using the negative binomial distribution model. Expression levels of transcripts and genes were calculated using StringTie software (v3.0.0). Differential expression analysis was subsequently performed using DESeq [26], with a screening threshold of Fold Change ≥ 2 and False Discovery Rate (FDR) < 0.05. The identified differentially expressed genes (DEGs) were subjected to functional annotation, Gene Ontology (GO) and Kyoto Encyclopedia of Genes and Genomes (KEGG) enrichment analyses, using a significance threshold q ≤ 0.05.
2.4. Metabolomic Analysis
LC-MS/MS-based untargeted metabolomics approach was used in this study [27,28]. Metabolites were extracted following a protocol described by Li Na et al. [29]. Specifically, 100 μL of supernatant was added to each sample, and an additional 100 μL was pooled into a quality control (QC) sample.
Polar metabolites were analyzed as described by Want, E. J.[30]. The liquid chromatography mobile phase consisted of 25 mmol/L ammonium acetate and 25 mmol/L ammonia in water (A) and acetonitrile (B). The injection volume was 2 μL, and the sample tray was maintained at 4 °C.
Data were generated from a Q-Exactive Orbitrap mass spectrometer. Principal component analysis (PCA) and orthogonal partial least squares discriminant analysis (OPLS-DA) were performed using SIMCA software (18.0.1). Metabolite identification was achieved from a database established by the Beijing Tsingke Biotech Co., Ltd. Differentially abundant metabolites (DAMs) were screened with thresholds of variable importance in projection (VIP) ≥ 1 and P < 0.05. The differentially abundant metabolites were then subjected to KEGG pathway annotation and enrichment analysis.
2.5. Transcriptome and Metabolome Integrative Analysis
The KEGG IDs of the screened DEGs and DAMs were mapped to the KEGG Pathway database. the significantly enriched metabolic pathways in both transcriptome and metabolome datasets were identified (p < 0.05).
This section may be divided by subheadings. It should provide a concise and precise description of the experimental results, their interpretation, as well as the experimental conclusions that can be drawn.
3. Results
3.1. Summary of Transcriptome Data Sets
A total of 954,415,766 raw sequences were generated by RNA sequencing, which were filtered to yield 945,592,192 high-quality sequences (Q20: 99.33%; Q30: 97.28%). Subsequent de novo assembly using Trinity software produced 67,443 transcripts and 47,090 unigenes with lengths between 200 and 2000 bp. Differential expression analysis using DESeq2. identified numerousdifferentially expressed genes (DEGs; fold change (FC) >=2 or <= 1/2, and false discovery rate (FDR) < 0.05) between groups. There are 507 DGEs in strain A4 (222 upregulated and 285 downregulated), 762 DEGs in strain D1 (336 upregulated and 426 downregulated), and 2,999 DEGs in strain F1 (1,268 upregulated and 1,731) (Figure 1).
3.2. Annotation of Differentially Expressed Genes
To understand the biological significance of the DEGs in the course of chlamydospore formation in C. fimbriata, we performed functional annotation of the DEGs using the Gene Ontology (GO) database, which include three major categories: biological process (BP), cellular component (CC), and molecular function (MF) (Figure 2). We identified a number of GO terms shared by DEGs of all the three strains, including 14 common terms in the BP category, 2 in CC, and 10 in MF (Table 1).
We further characterized the functions of proteins encoded by the DEGs by mapping them to the KEGG (Kyoto Encyclopedia of Genes and Genomes) database. The results reveal that the encoded proteins were mainly involved in five categories: cellular processes, environmental information processing, genetic information processing, metabolism, and organismal systems (Figure 3). Table 2 summarizes the specific KEGG pathways shared by all three strains: (Table 2).
3.3. Enrichment Analysis of DEGs
We then conducted GO enrichment analysis to identify significantly overrepresented GO terms (q ≤ 0.05) for each strain (Figure 4). For strain A4, the six most significant GO terms were biological process, cellular process, cellular anatomical entity, cellular component, molecular function, and intracellular anatomical structure. For strain D1, the top six GO terms were biological process, cellular process, molecular function, cellular anatomical entity, cellular component, and intracellular anatomical structure. For strain F1, the top four GO terms were small molecule metabolic process, oxidoreductase activity, alpha-amino acid metabolic process, and alcohol biosynthetic process.
We also performed KEGG enrichment analysis for each strainand identified two significantly enriched pathways common to all the strains: starch and sucrose metabolism and isoquinoline alkaloids biosynthesis (Table 3). These pathways are primarily involved in carbon source utilization, amino acid metabolism, energy metabolism and secondary metabolite synthesis.
3.4. Orthogonal Partial Least Squares-Discriminant Analysis (OPLS-DA) of Metabolomic Data
Metabolome analysis of the three strains initially detected 95,983 peaks, of which 65,588 peaks were retained after preprocessing. To assess the differences between pre- and post-chlamydospore formation samples, we constructed OPLS-DA models using SIMCA and obtained the following parameters for the three strains: strain A4 (R2X=0.546, R2Y=0.995, and Q2=0.939), strain D1 (R2X=0.527, R2Y=1.0, and Q2=0.976), strain F1 (R2X=0.367, R2Y=0.999, and Q2=0.92). This indicates that the model exhibited strong predictive power without overfitting. The clear separation observed in the OPLS-DA plots revealed significant metabolic shifts during chlamydospore formation in C. fimbriata (Figure 5).
3.5. Identification of Differentially Abundant Metabolites (DAMs)
Metabolites were considered differentially abundant if they met the dual criteria of Student’s t-test P-value < 0.05 and a Variable Importance in the Projection (VIP) score > 1 (from the OPLS-DA model). Based on these criteria, a total of 3,395 differentially abundant metabolites were identified from the comparison before and after chlamydospore formation in C. fimbriata. Among these, 1,772 metabolites were upregulated while 1,643 were downregulated (Figure 6).
3.6. KEGG Pathway Annotation and Enrichment Analysis of DAMs
The DAMs were annotated using the KEGG database and all the associated pathways were mapped Saccharomyces cerevisiae. Enrichment analysis showed that strain A4 was significantly enriched in five KEGG pathways, including metabolic pathways, ABC transporters, nucleotide metabolism, biosynthesis of amino acid and carbon metabolism (Figure 7). Strain D1 was mainly enriched metabolic pathways, biosynthesis of cofactor, ABC transporters, biosynthesis of amino acid and carbon metabolism (Figure 7). Strain F1 was primarily enriched in metabolic pathways, biosynthesis of cofactor, biosynthesis of amino acid, ABC transporters, nucleotide metabolism and alanine, aspartate and glutamate metabolism (Figure 7). Overall, the above results revealed that the enriched pathways shared among the three strains were metabolic pathways, biosynthesis of amino acid, ABC transporters, biosynthesis of cofactor and nucleotide metabolism.
3.7. Integrated Analysis of Transcriptomics and Metabolomics
We integrated the DEGs and DAMs from each strain by mapping them to KEGG pathways in S. cerevisiae (budding yeast). There are 44, 57, and 63 pathways shared by both the transcriptomic and metabolomic datasets in strains A4, D1, and F1, respectively (Figure 8). By integrating the enrichment results across the three strains, we identified 29 common pathways (Table 4), including amino acid biosynthesis, cofactor biosynthesis, 2-oxocarboxylic acid metabolism and carbon metabolism. By analyzing gene enrichment within the core pathways, we found that genes associated with branched-chain aminotransferase and citrate synthase were consistently enriched across all three pathways. Based on these findings, we inferred that branched-chain transaminase and citrate synthase play a role in chlamydospore formation in C. fimbriata.
4. Discussion
To our knowledge, this study presents the first integrated transcriptomic and metabolomic analysis of chlamydospore formation in C. fimbriata. Our omics approach identified 29 involved metabolic pathways, among which the core pathways were amino acid biosynthesis, cofactor biosynthesis, 2-oxocarboxylic acid metabolism and carbon metabolism. Notably, the genes related to branched-chain aminotransferase and citrate synthase were significantly enriched in these pathways, highlighting them as key candidate genes contributing to chlamydospore formation.
Our findings align with the results of Ding et al. [16]., which conducted a multi-omics analysis of F. oxysporum f. sp. cubense before and after chlamydospore formation by establishing an induction system. Their study concluded that the core metabolic pathways were primarily carbon source metabolism, amino acid synthesis, and purine metabolism. Subsequently, functional validation experiments by Ding confirmed that the deletion of the histidinol phosphatase-encoding gene A12048 in the amino acid synthesis pathway inhibited chlamydospore formation in the pathogen [16]. Similarly, we provide the first evidence implicating branched-chain aminotransferase and citrate synthase genes in chlamydospore formation in C. fimbriata, providing a foundation for elucidating the underlying molecular mechanism.
Although this study revealed the transcriptional and metabolic basis of chlamydospore formation in C. fimbriata, the specific mechanism of its regulatory network remains to be further analyzed. Future work will focus on candidate genes potentially involved in chlamydospore formation, with functional validation via gene knockout to elucidate their roles in both chlamydospore development and pathogenicity.
In summary, our integrated transcriptomic and metabolomic study systematically revealed the potential metabolic pathways and candidate genes involved in chlamydospore formation in C. fimbriata data. These findings not only help elucidate the developmental and pathogenic mechanisms of C. fimbriata, but also lay a theoretical foundation for the development of novel pesticides targeting key genes.
5. Conclusions
Our integrated transcriptomic and metabolomic analysis of three C. fimbriata strains identified 4,268 differentially expressed genes and 3,395 differential metabolites associated with chlamydospore formation. Correlation analysis of the two omics data showed that 29 pathways common to all three strains.Among these, four pathways were identified as core pathways: Biosynthesis of amino acids, Biosynthesis of cofactors, Carbon metabolism, and 2-Oxocarboxylic acid metabolism.
Analysis of the core pathways revealed that genes encoding branched-chain aminotransferase were enriched in the Biosynthesis of amino acids, Biosynthesis of cofactors, and 2-Oxocarboxylic acid metabolism pathways, while citrate synthase-related genes were enriched in the Biosynthesis of amino acids, Carbon metabolism, and 2-Oxocarboxylic acid metabolism pathways. We propose that genes for branched-chain aminotransferase and citrate synthase play critical roles in chlamydospore formation in C. fimbriata.
In the future, the functional verification of the selected key candidate genes will be carried out to prove their specific role in the formation process and pathogenicity of chlamydospores, and to further explore the specific mechanism of regulating the formation of chlamydospores in C. fimbriata. These genes hold promise as molecular targets for controlling devastating diseases such as pomegranate wilt.
Supplementary Materials
The transcriptome data are available for download at: https://www.ncbi.nlm.nih.gov/bioproject/?term=PRJNA1377537.
Author Contributions
J.S. designed the study plan, and wrote the draft manuscript; L.H. conducted the experiments and analyzed data; B.X. analyzed data; L.L. Metabolome detection; Z.Z. sampling; X.Z. conceptualization, review and editing, funding acquisition. All authors have read and agreed to the published version of the manuscript.
Funding
This work was supported by grants from the National Natural Science Foundation of China (32160629) and the Research Project of Liangshan (24JCYJ0008).
Institutional Review Board Statement
Not applicable.
Informed Consent Statement
Not applicable.
Data Availability Statement
Data are provided within the manuscript or Supplementary Information Files.
Acknowledgments
The authors thankful to Beijing Tsingke Biotech Co., Ltd. for its technical support. This study was financially supported by the National Natural Science Foundation of China (Grant No. 32160629), and we hereby express our sincere thanks.
Conflicts of Interest
The authors declare no conflicts of interest.
AI Statement
The authors have used DeepSeek in the preparation of the manuscript to check for grammatical errors and to improve readability.
References
- Liu, Y. Study on the Antibacterial Effect of Volatile Organic Compounds from Ceratocystis fimbriata on Two Leaf Spot Diseases. Ph.D. Thesis, Yunnan Agricultural University, Kunming, China, 2024. [Google Scholar]
- Liu, Y.; He, Y.; Ruan, X. Ceratocystis fimbriata——A Pathogen Damaging Multiple Crops with Wide Distribution. J. Yunnan Agric. Univ. 2003, 18, 408–412. [Google Scholar]
- Zou, L.; Jiang, Y.; Yu, L.; et al. Morphological Studies on Ceratocystis fimbriata Isolated from Pomegranate, Taro and Sweet Potato. J. Yunnan Univ. (Nat. Sci. Ed.) 2008, 30 (Suppl. 1), 81–85. [Google Scholar]
- Yu, L.; Gao, L.; Guo, J.; et al. Effects of Ceratocystis fimbriata Infection on Antioxidant Enzyme Activities in Sweet Potato Storage Roots. Chin. J. Eco-Agric. 2011, 19, 141–145. [Google Scholar] [CrossRef]
- Sailapura, E. N.; Kulkarni, S.; Shantaraju, S.; et al. Molecular Characterization and Genetic Variation in Ceratocystis fimbriata Ell. & Halst. on Pomegranate. J. Fungi 2022, 8, 1276. [Google Scholar]
- Alizadeh, M.; Azaryan, A.; Ghaleh, M. R. K.; et al. Host and Geographical Distribution of the Plant-Pathogenic Fungus Ceratocystis fimbriata (Ascomycota) Worldwide. Nova Hedwigia 2024, 118, 1–24. [Google Scholar] [CrossRef]
- Ploetz, R. C.; Hulcr, J.; Wingfield, M. J.; et al. Destructive Tree Diseases Associated with Ambrosia and Bark Beetles: Black-Swan Events in Tree Pathology? Plant Dis. 2013, 97, 856–872. [Google Scholar] [CrossRef] [PubMed]
- Alfenas, A. C.; Ferreira, M. A.; et al. Global Spread of Ceratocystis Pathogens: Pathways and Impacts. Annu. Rev. Phytopathol. 2023, 61, 301–325. [Google Scholar]
- Zheng, X.; Xu, B.; He, P.; et al. The Pathogen of Pomegranate Wilt in Sichuan Province. Mycosystema 2012, 31, 523–530. [Google Scholar]
- Yuan, Y.; Liu, X.; Hu, X. Preliminary Study on Fungicide Screening and Synergistic Effects for Control of Pomegranate Wilt. Agrochemicals 2018, 57, 71–74. [Google Scholar]
- Huang, Q.; Lu, W.; Fan, J.; et al. Discovery of Pomegranate Wilt in Yunnan Province. Acta Phytopathol. Sin. 2004, 34, 95–96. [Google Scholar]
- 12. Harrington, T. C. Ecology and Evolution of Mycophagous Bark Beetles and Their Fungal Partners. In Bark Beetles: Biology and Ecology of Native and Invasive Species; Vega, F. E., Hofstetter, R. W., Eds.; Academic Press: Cambridge, MA, USA, 2015; pp. 257–291. ISBN 9780124171565. [Google Scholar]
- Chaudhari, V. G. Studies on Wilt-Complex Disease of Pomegranate. Ph.D. Thesis, Mahatma Phule Krishi Vidyapeeth, Rahuri, India, 2015. [Google Scholar]
- Halfeld-Vieira, B. A.; Zilli, J. E.; Nechet, K. L.; Pereira, G. M. D.; Souza, G. R. First Record of Ceratocystis fimbriata on Carapa guianensis. New Dis. Rep. 2012, 26, 13. [Google Scholar] [CrossRef]
- Kenna, G. H. J.; Mullins, E.; Doohan, F. M. The Resilience of Fusarium Pathogens: A Review of the Role of Chlamydospores and Persistent Propagules in Disease Dynamics. Mol. Plant Pathol. 2023, 24, 1023–1040. [Google Scholar]
- Ding, Z.; Peng, J.; Zhang, X. Correlation Analysis of Transcriptome and Metabolome Reveals Association between Amino-Acid Biosynthesis and Chlamydospore Formation in Fusarium oxysporum f. sp. cubense. In Proceedings of the 2024 Annual Academic Conference of the Mycological Society of China, Beijing, China, 2024. [Google Scholar]
- Zhang, H.; Wu, Q.; Cao, L.; et al. Integrated Transcriptomic and Metabolomic Analysis Reveals Key Genes Involved in Fusarium oxysporum Chlamydospore Formation. Front. Microbiol. 2022, 13, 845731. [Google Scholar]
- Son, H.; Kim, M. G.; Min, K.; et al. A Metabolomic Approach to Understand Fusarium graminearum Development. Nat. Commun. 2021, 12, 3816. [Google Scholar]
- Rangel, L. I.; Spanner, R. E.; Bolton, M. D.; et al. Targeting Fungal Dormancy: A New Strategy for Disease Control. Phytopathology 2022, 112, 1029–1038. [Google Scholar]
- Pereira, C.; Fernandes, Â.; Barros, L.; et al. Natural Compounds as Inhibitors of Fungal Chlamydospore Formation. J. Fungi 2023, 9, 588. [Google Scholar]
- Hu, Z.; Chang, X.; Dai, T.; et al. GC-MS-Based Metabolomic Analysis of Botrytis cinerea. J. Instrum. Anal. 2017, 36, 633–639. [Google Scholar]
- Kim, K. T.; Lee, Y. H. RNA-Seq-Based Transcriptome Analysis of Fungal Development. Methods Mol. Biol. 2022, 2480, 173–192. [Google Scholar]
- Wang, Z.; Gerstein, M.; Snyder, M. RNA-Seq: A Revolutionary Tool for Transcriptomics. Nat. Rev. Genet. 2009, 10, 57–63. [Google Scholar] [CrossRef] [PubMed]
- Bolger, A. M.; Lohse, M.; Usadel, B. Trimmomatic: A Flexible Trimmer for Illumina Sequence Data. Bioinformatics 2014, 30, 2114–2120. [Google Scholar] [CrossRef]
- Grabherr, M. G.; Haas, B. J.; Yassour, M.; et al. Trinity: Reconstructing a Full-Length Transcriptome without a Genome from RNA-Seq Data. Nat. Biotechnol. 2011, 29, 644–652. [Google Scholar] [CrossRef]
- Anders, S.; Huber, W. Differential Expression Analysis for Sequence Count Data. Genome Biol. 2010, 11, R106. [Google Scholar] [CrossRef] [PubMed]
- Pang, Z.; Chong, J.; Zhou, G.; et al. MetaboAnalystR 3.0: Toward an Optimized Workflow for Global Metabolomics. Nat. Protoc. 2021, 16, 4615–4633. [Google Scholar] [CrossRef]
- Smedsgaard, J.; Nielsen, J. Metabolite Profiling of Fungi and Yeast: From Phenotype to Metabolome by MS and Informatics. Fungal Genet. Biol. 2005, 42, 981–992. [Google Scholar] [CrossRef] [PubMed]
- Li, N.; Zhang, H.; Wang, L. Optimization of Metabolite Extraction and LC-MS/MS Detection Methods for Fungi. Acta Microbiol. Sin. 2020, 60, 1650–1658. [Google Scholar]
- Want, E. J.; Wilson, I. D.; Gika, H.; et al. Global Metabolic Profiling Procedures for Urine Using UPLC-MS. Nat. Protoc. 2010, 5, 1005–1018. [Google Scholar] [CrossRef]
Figure 1.
Volcano Plot for Differentially Expressed Gene Screening in Three Strains. Each dot in the differential expression volcano plot represents a gene. The x-axis indicates the logarithmic value of the fold change in gene expression between two samples, while the y-axis represents the significance value after -log10 transformation. In the plot, green dots denote downregulated differentially expressed genes, red dots denote upregulated differentially expressed genes, and black dots denote non-differentially expressed genes.
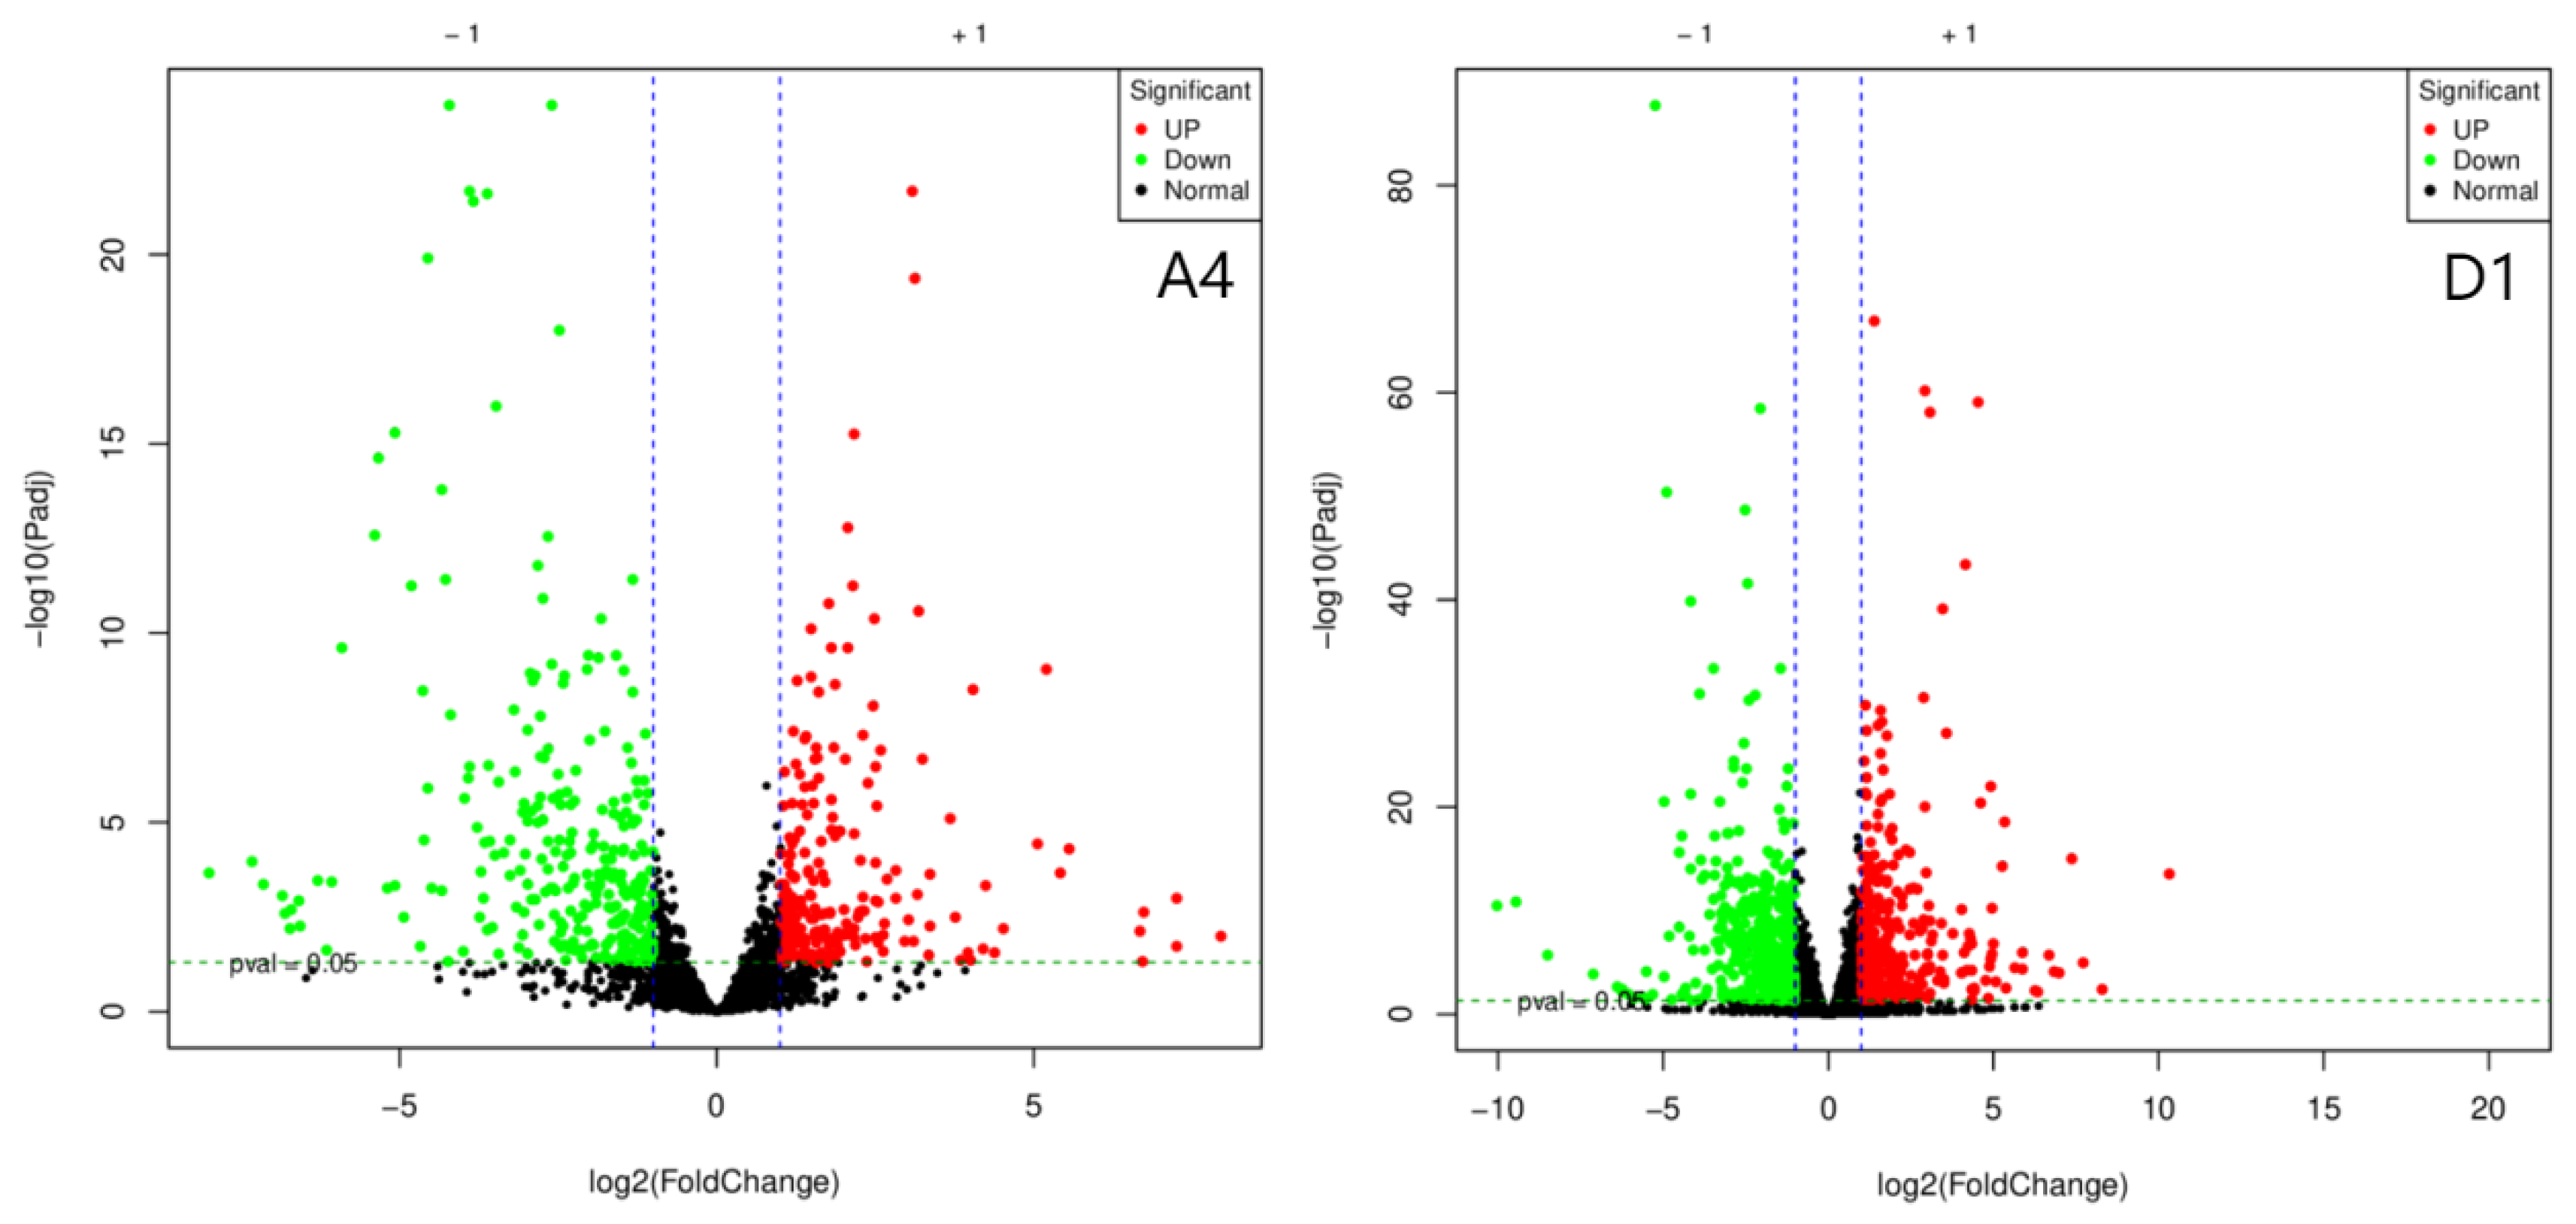
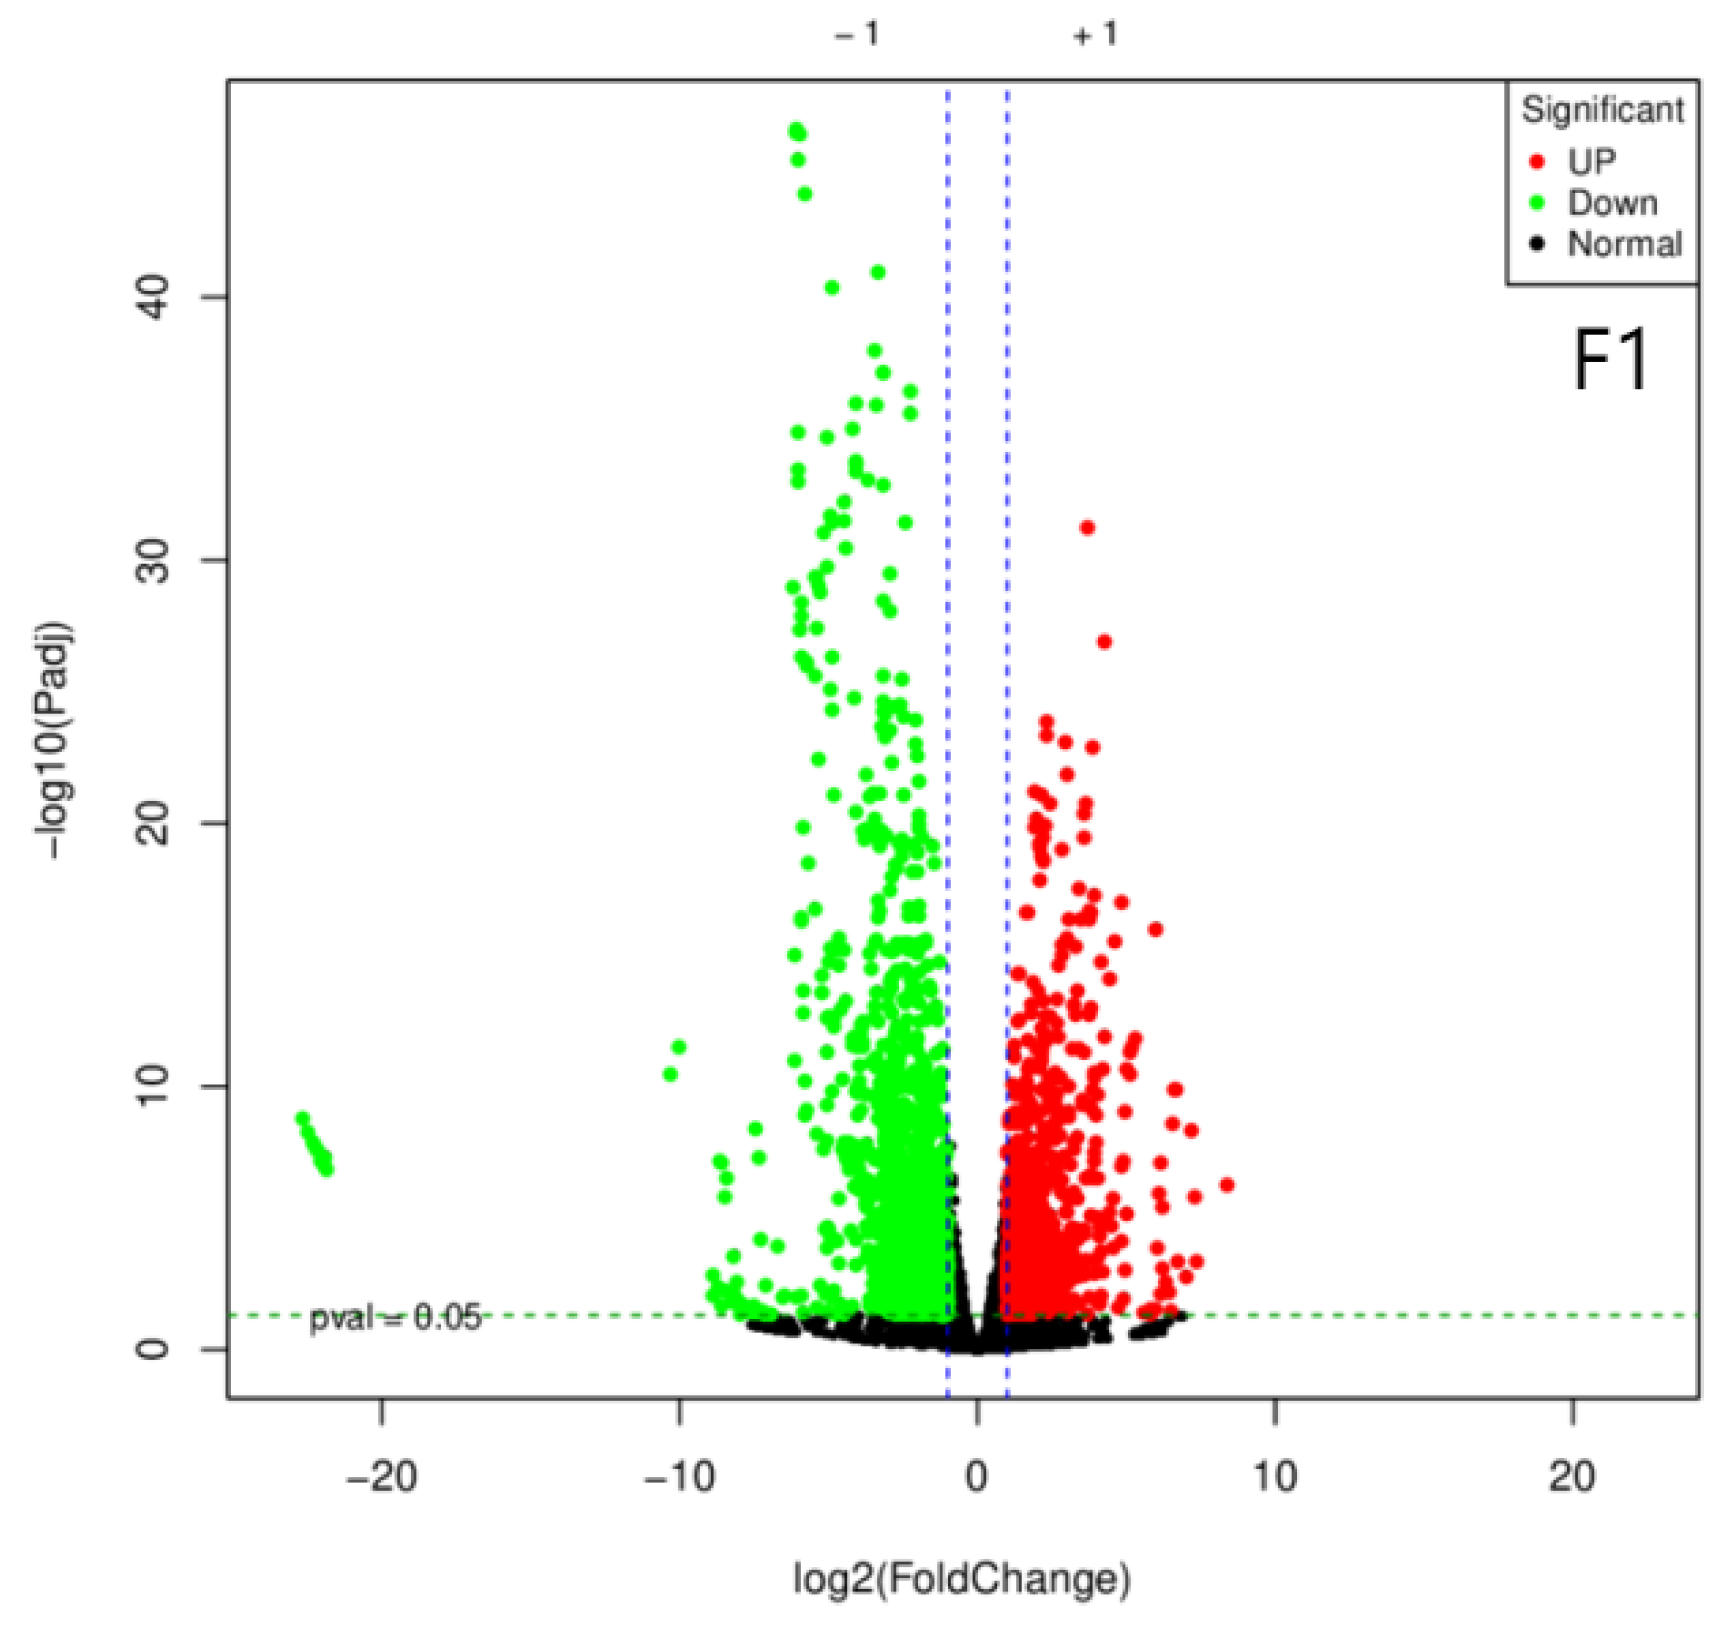
Figure 2.
GO Functional Annotation Classification Diagram for Differentially Expressed Genes Among Three Strains. Note: The horizontal axis represents the number of enriched genes, while the vertical axis denotes GO categories.
Figure 2.
GO Functional Annotation Classification Diagram for Differentially Expressed Genes Among Three Strains. Note: The horizontal axis represents the number of enriched genes, while the vertical axis denotes GO categories.
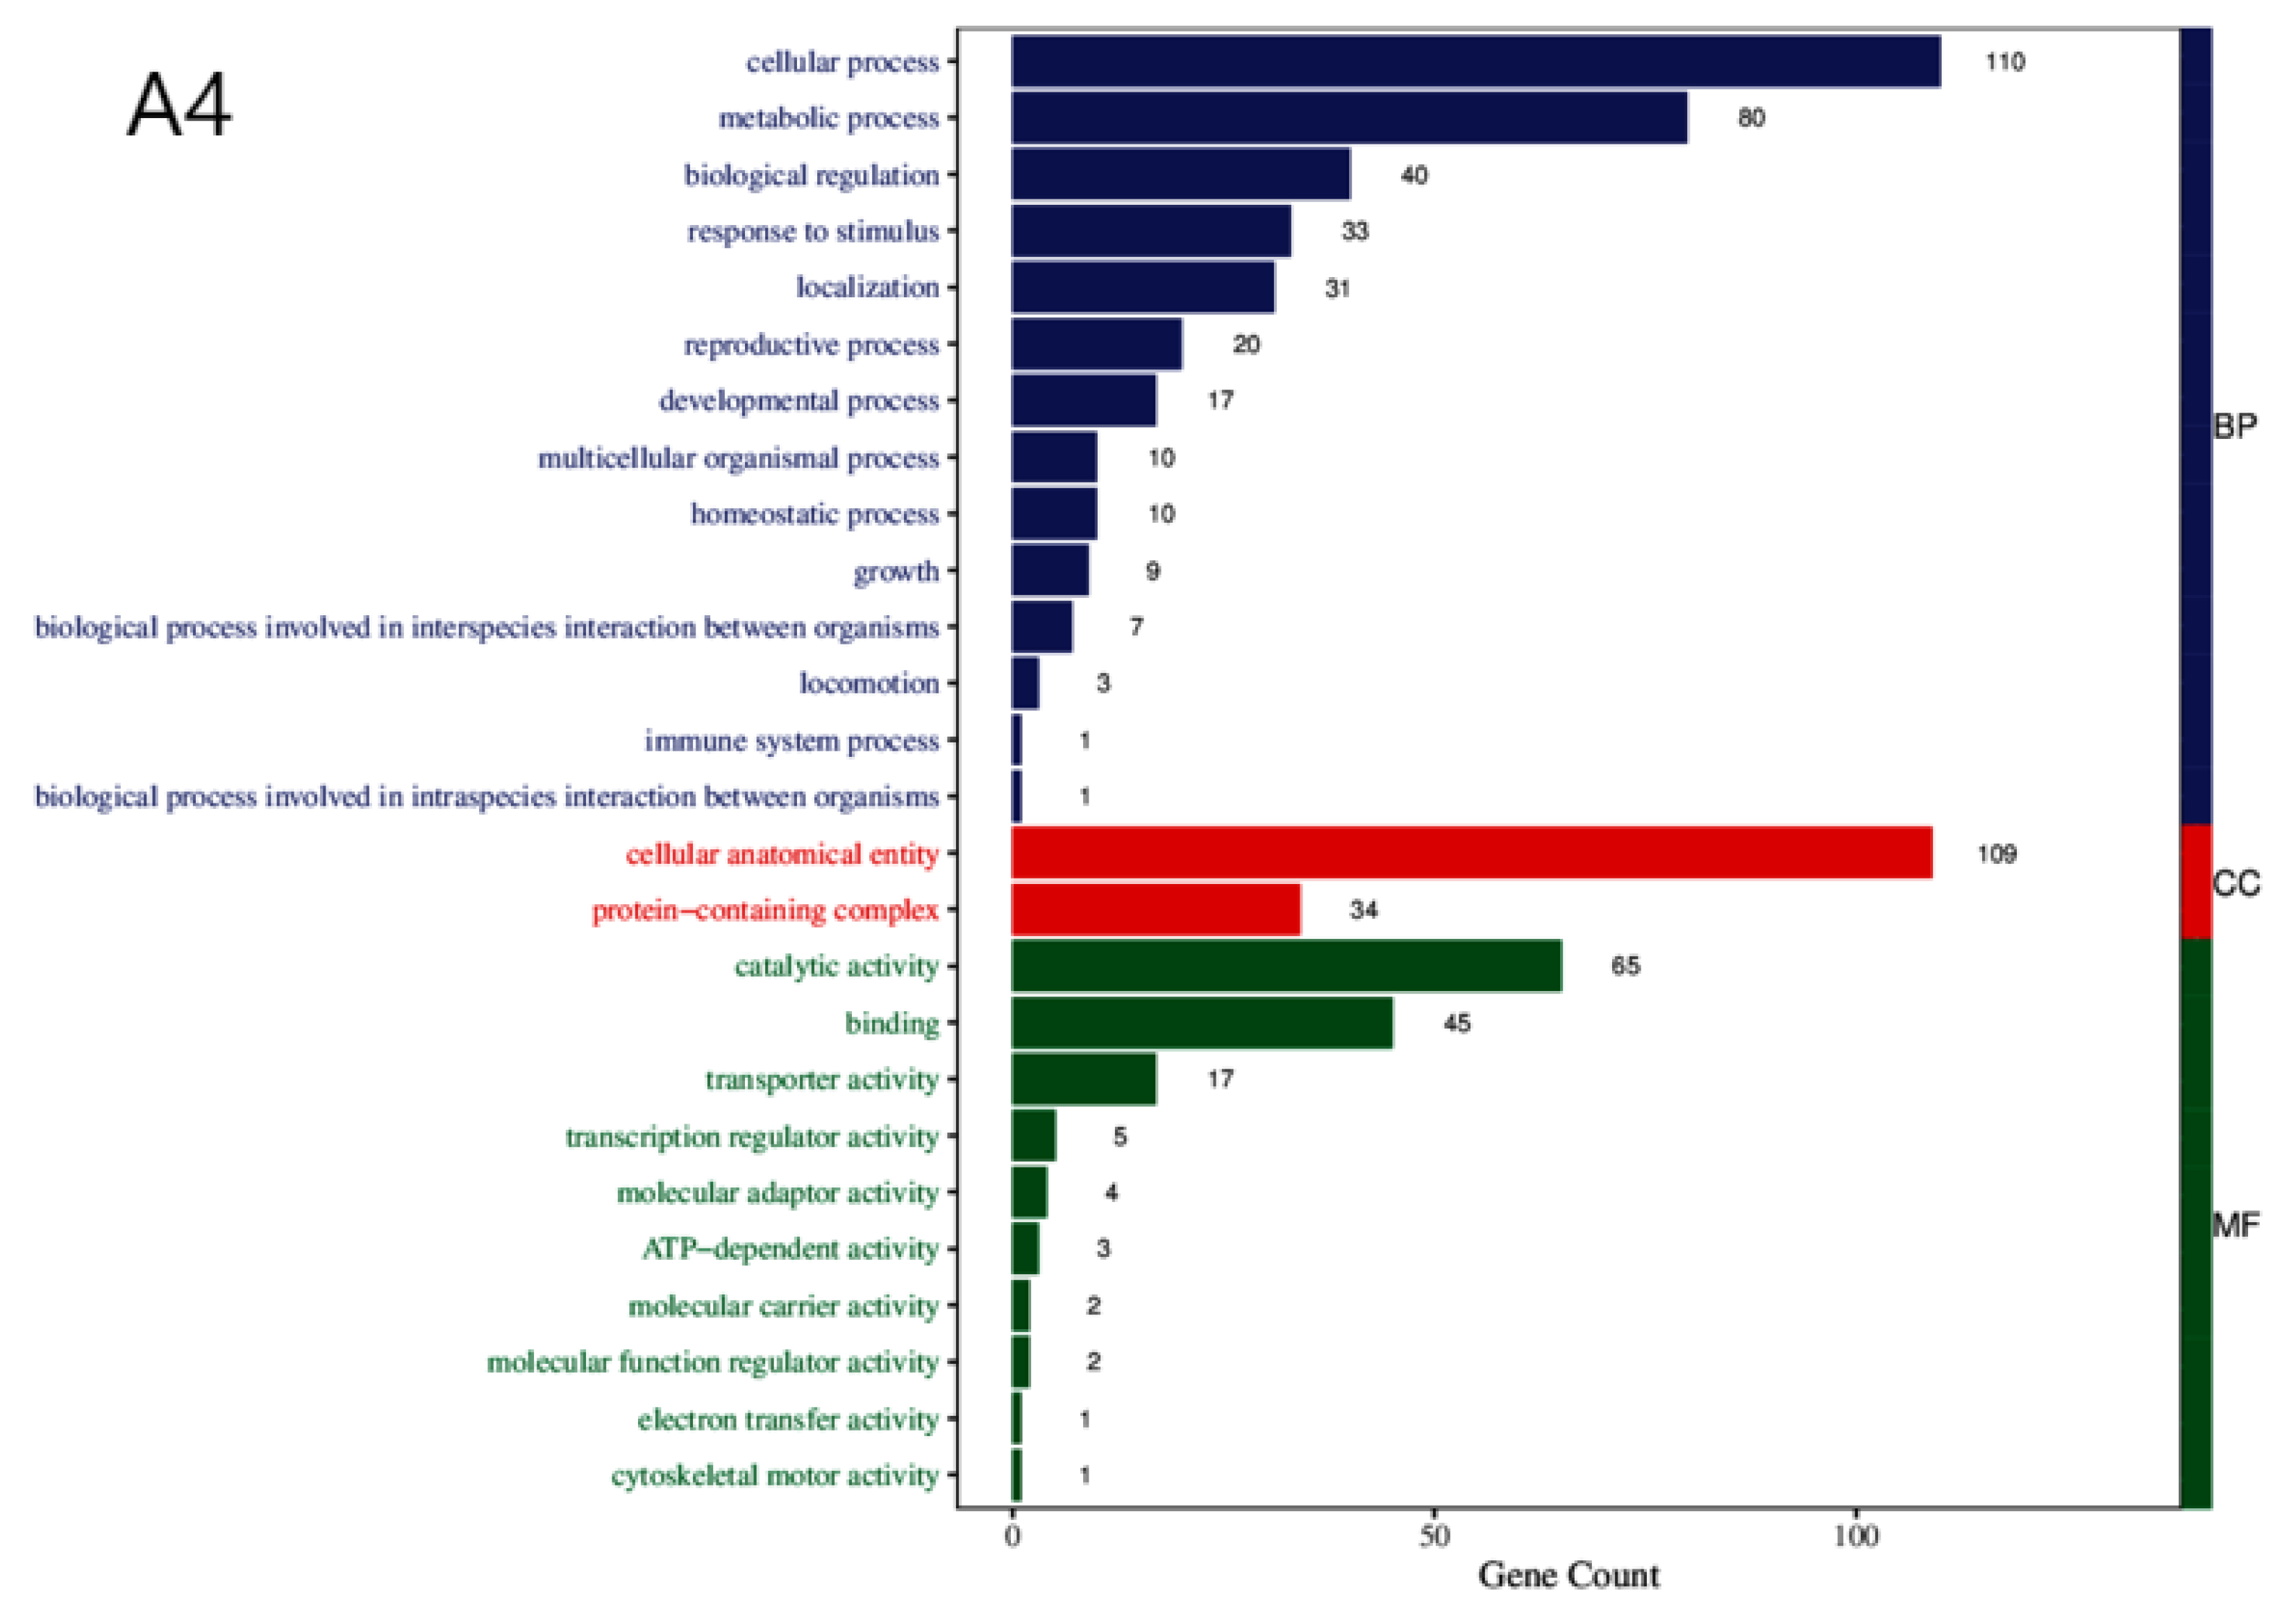
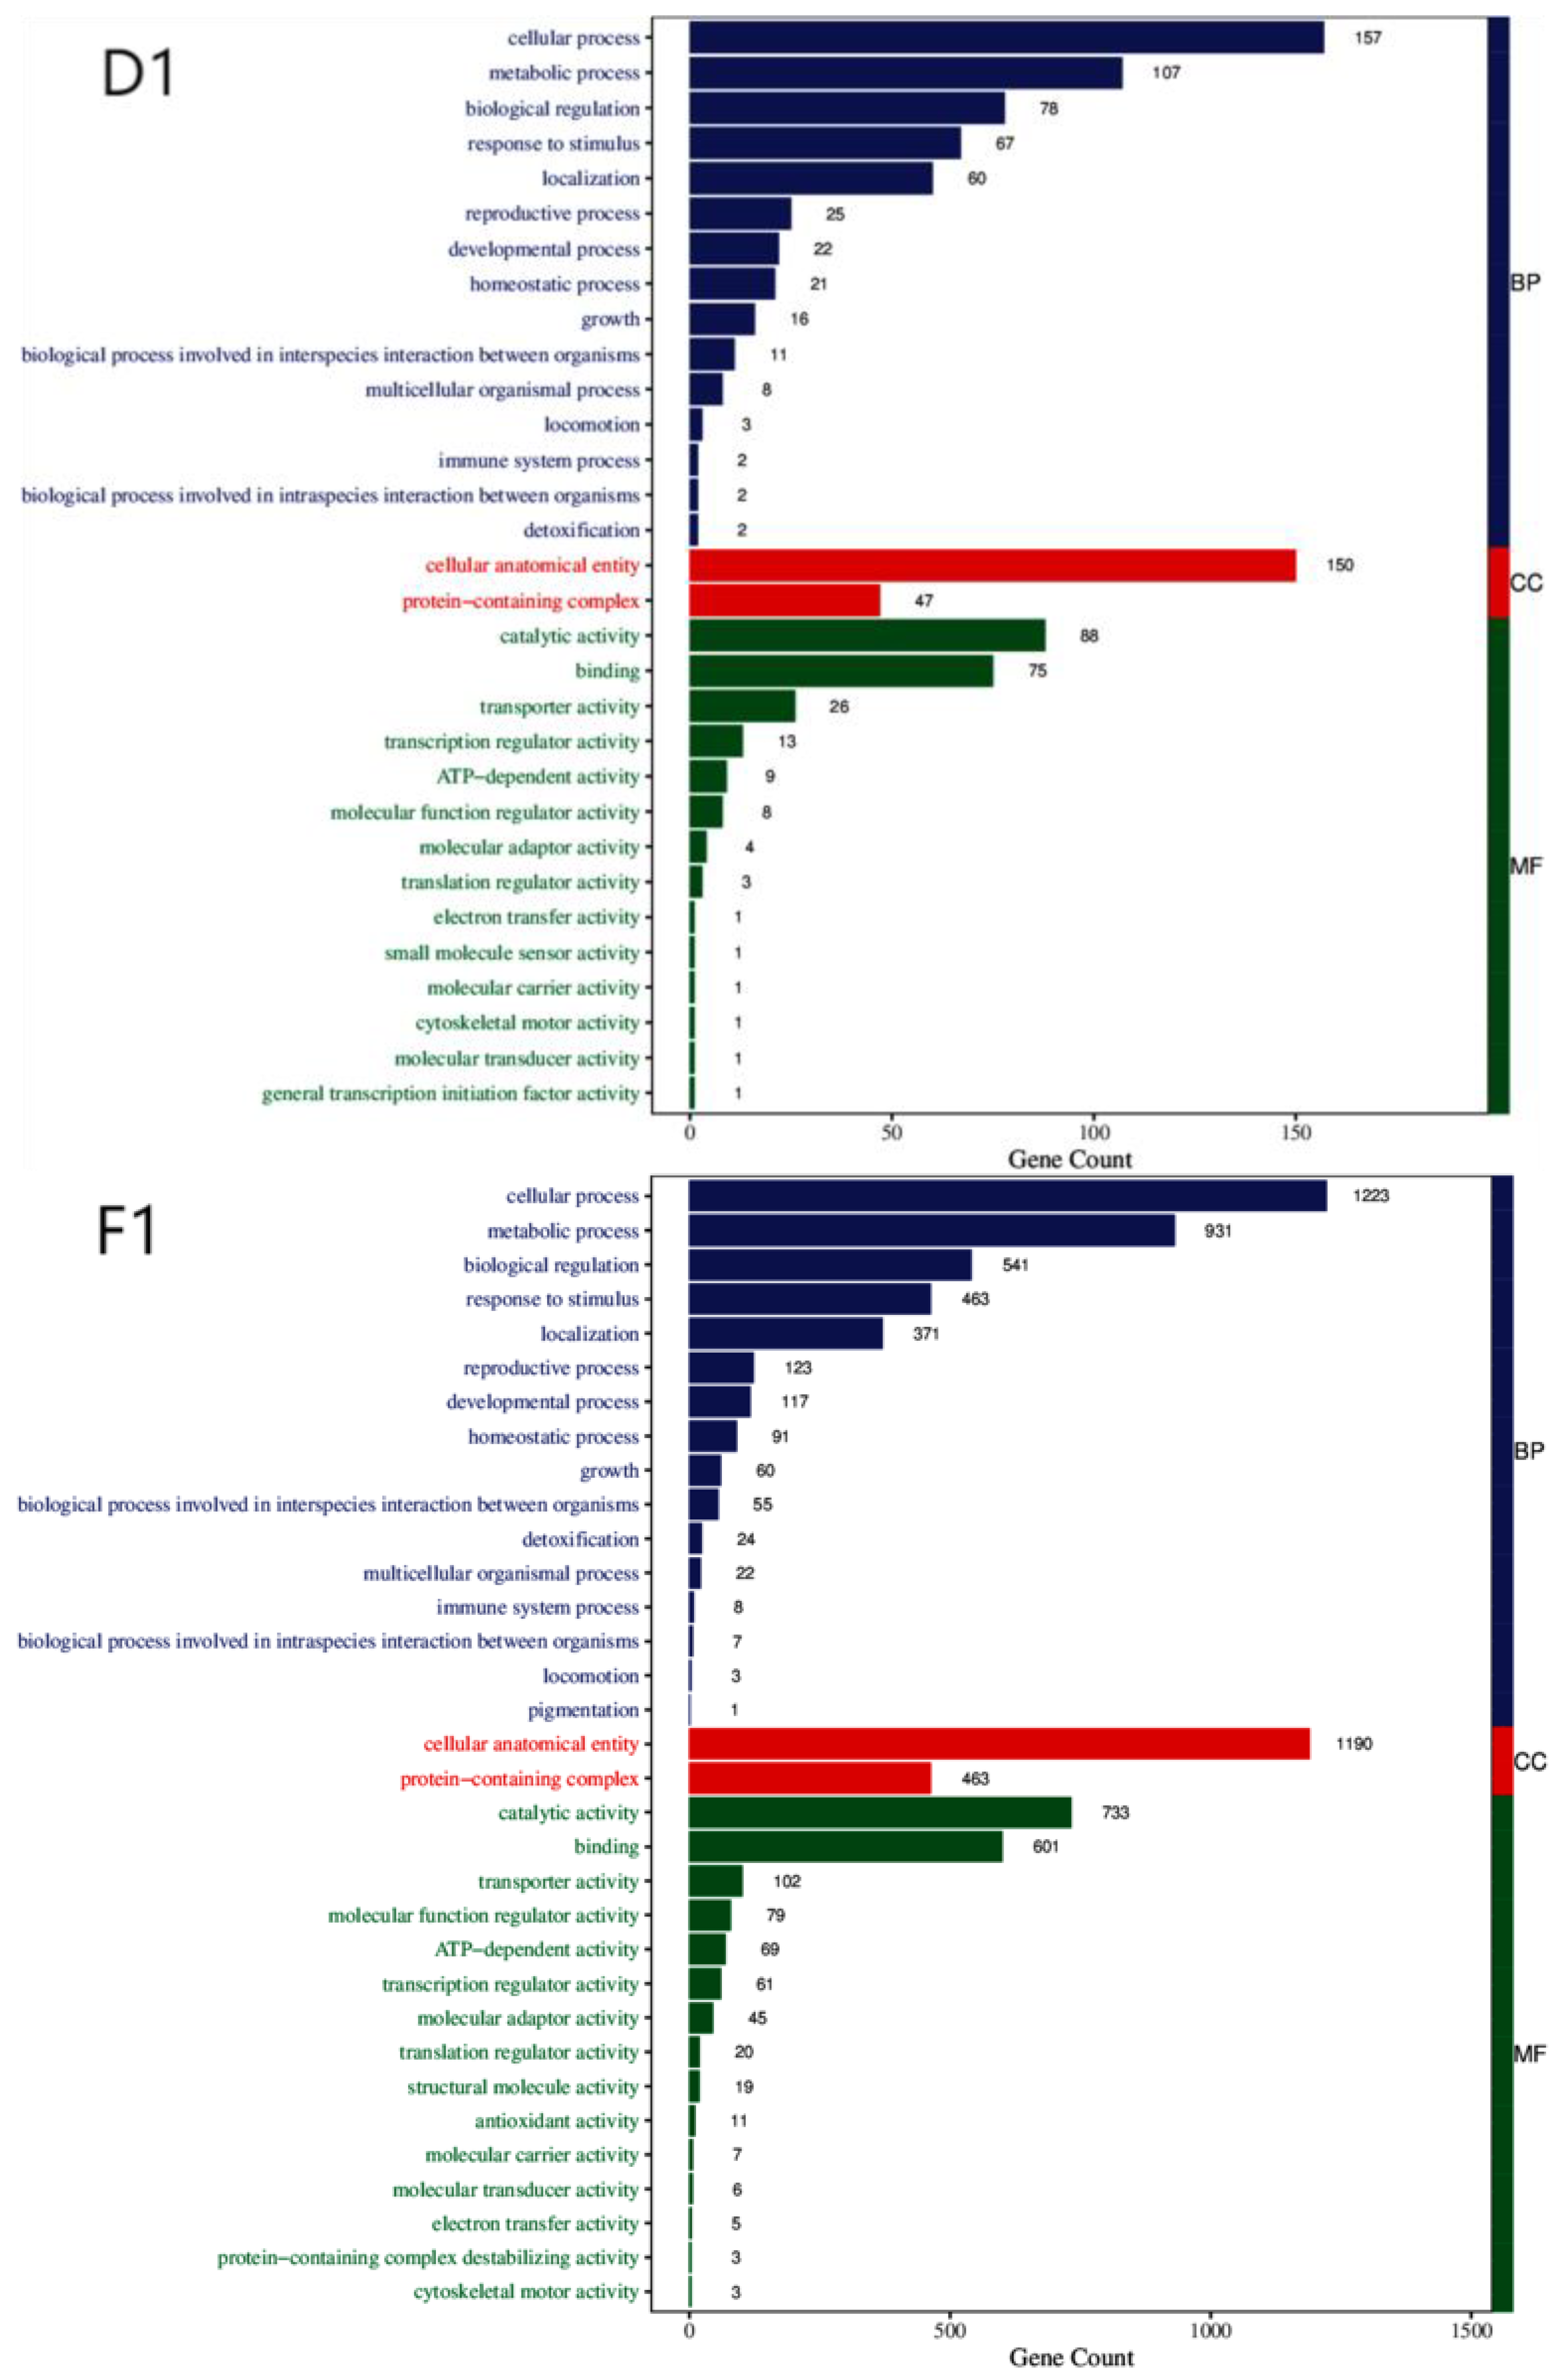
Figure 3.
KEGG Functional Annotation Classification Diagram for Differentially Expressed Genes Across Three Strains. Note: The x-axis represents the number of enriched genes, with different colours denoting KEGG classifications.
Figure 3.
KEGG Functional Annotation Classification Diagram for Differentially Expressed Genes Across Three Strains. Note: The x-axis represents the number of enriched genes, with different colours denoting KEGG classifications.
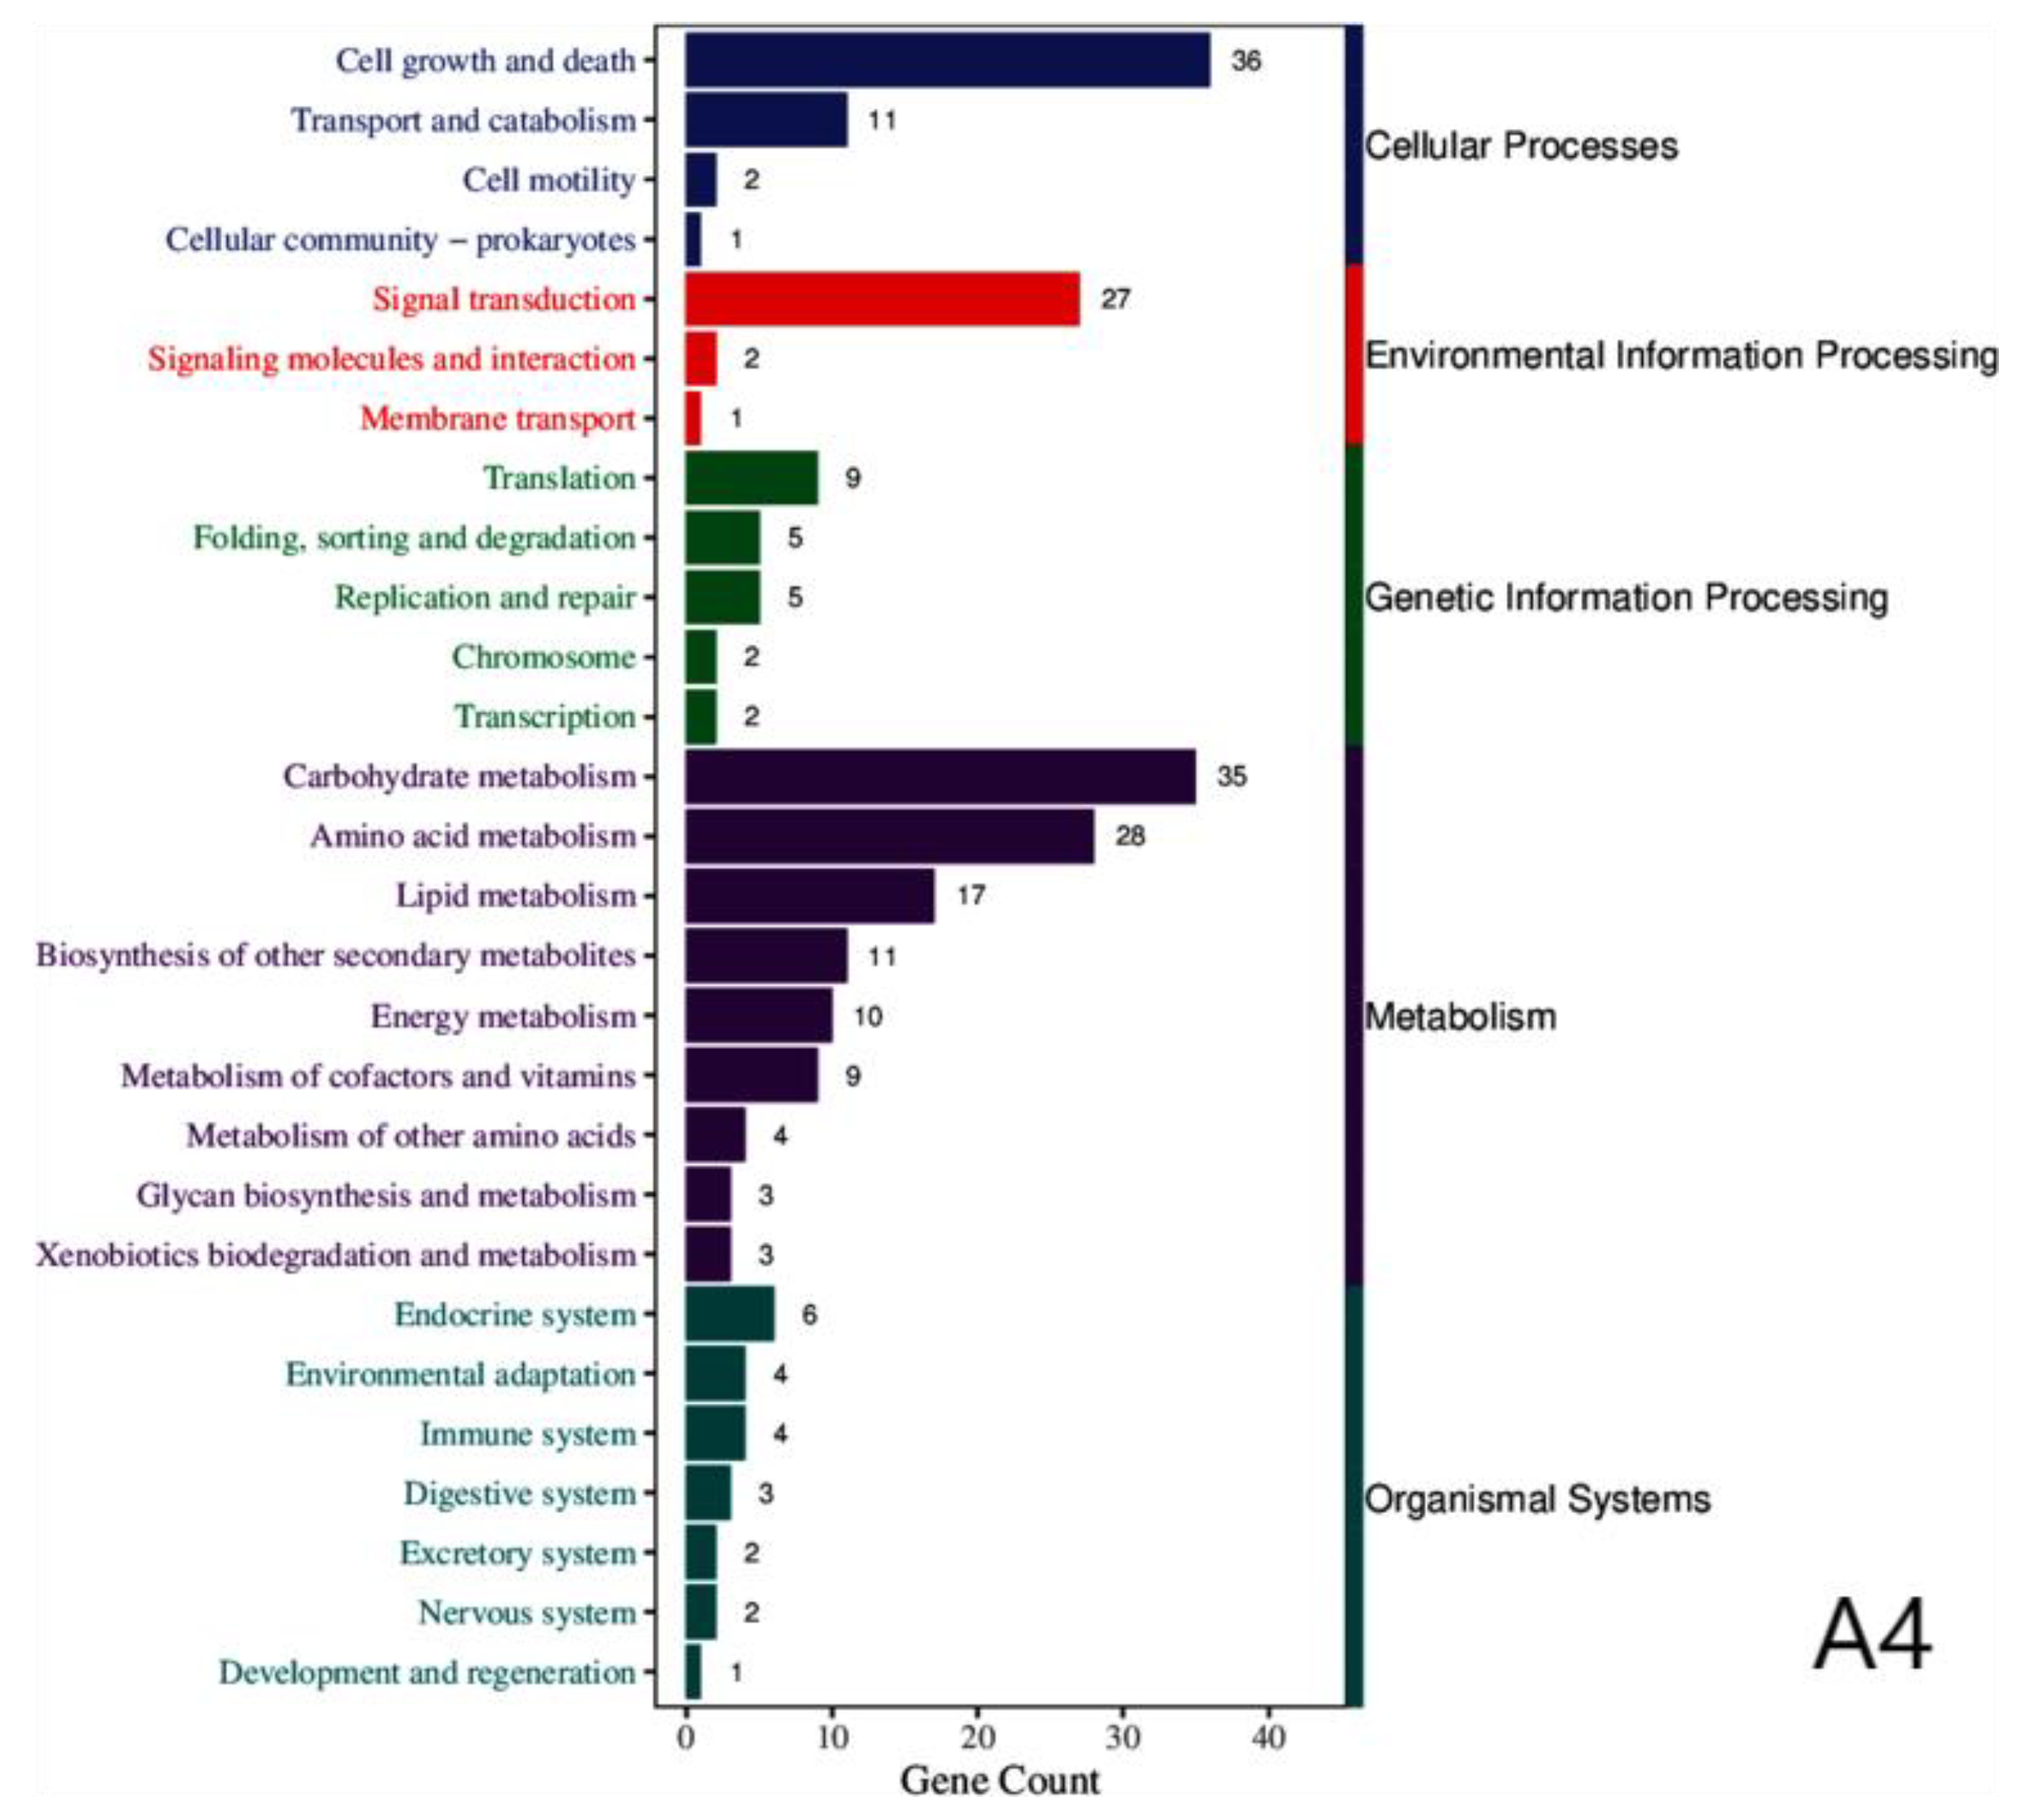
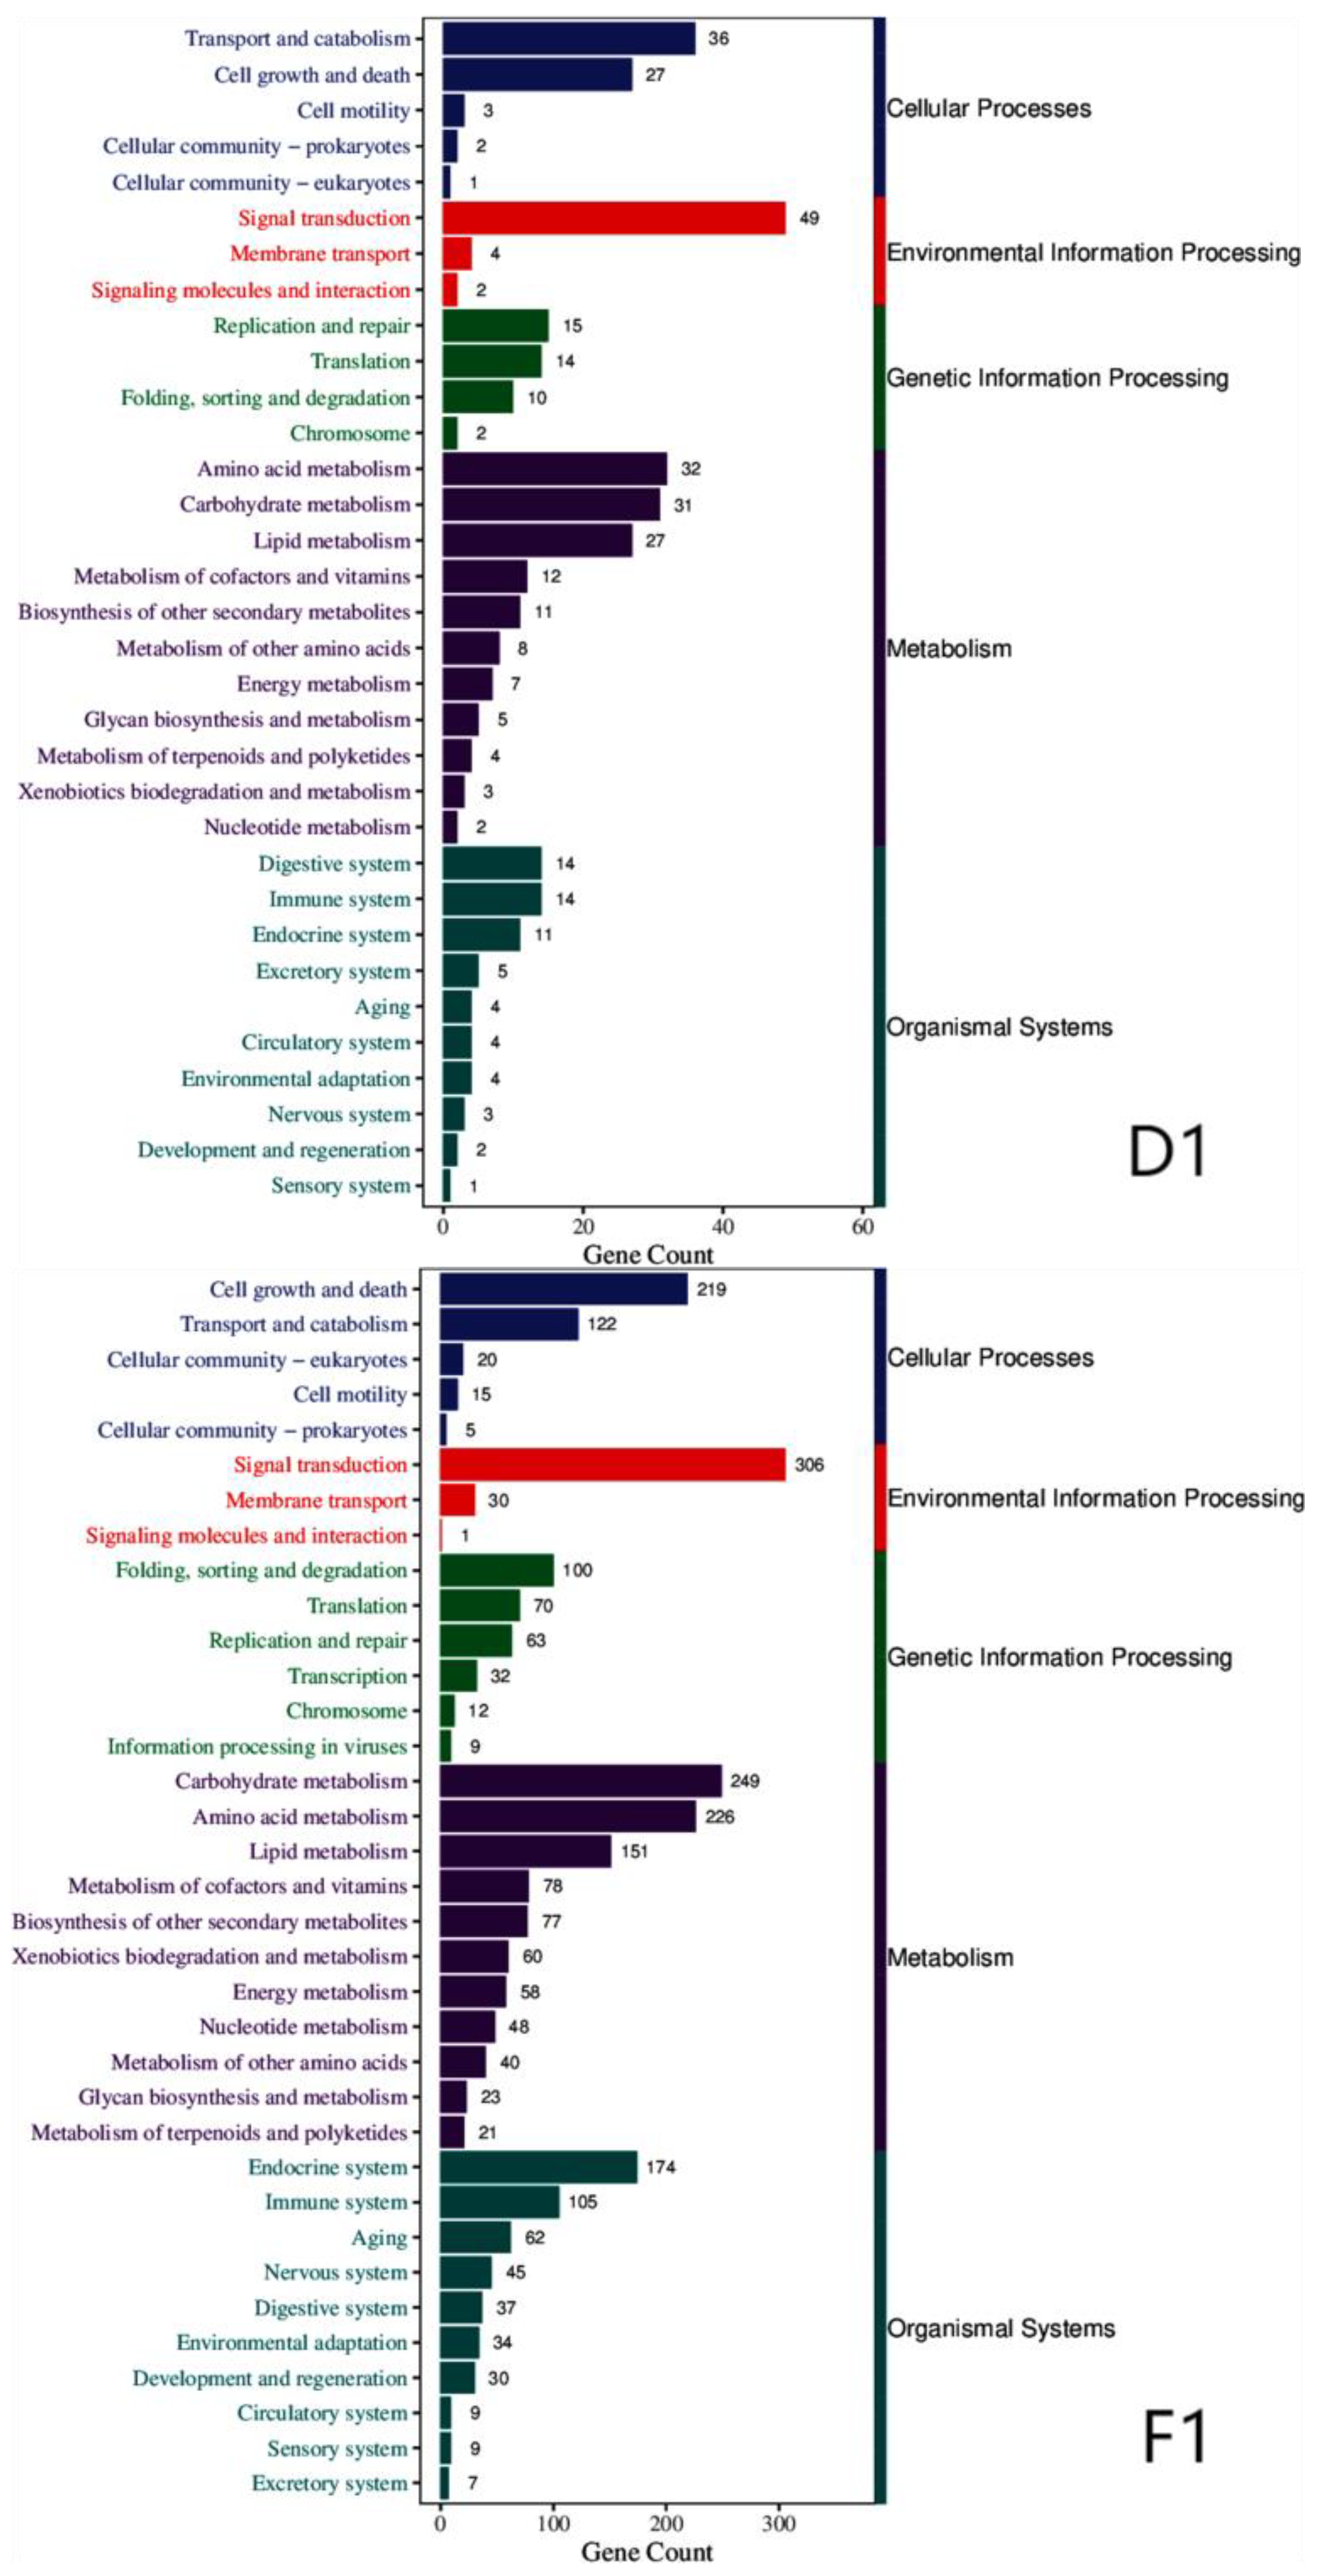
Figure 4.
GO enrichment analysis diagram for the three strains. Note: The horizontal axis represents the number of enriched genes, while the vertical axis denotes the GO term names.
Figure 4.
GO enrichment analysis diagram for the three strains. Note: The horizontal axis represents the number of enriched genes, while the vertical axis denotes the GO term names.
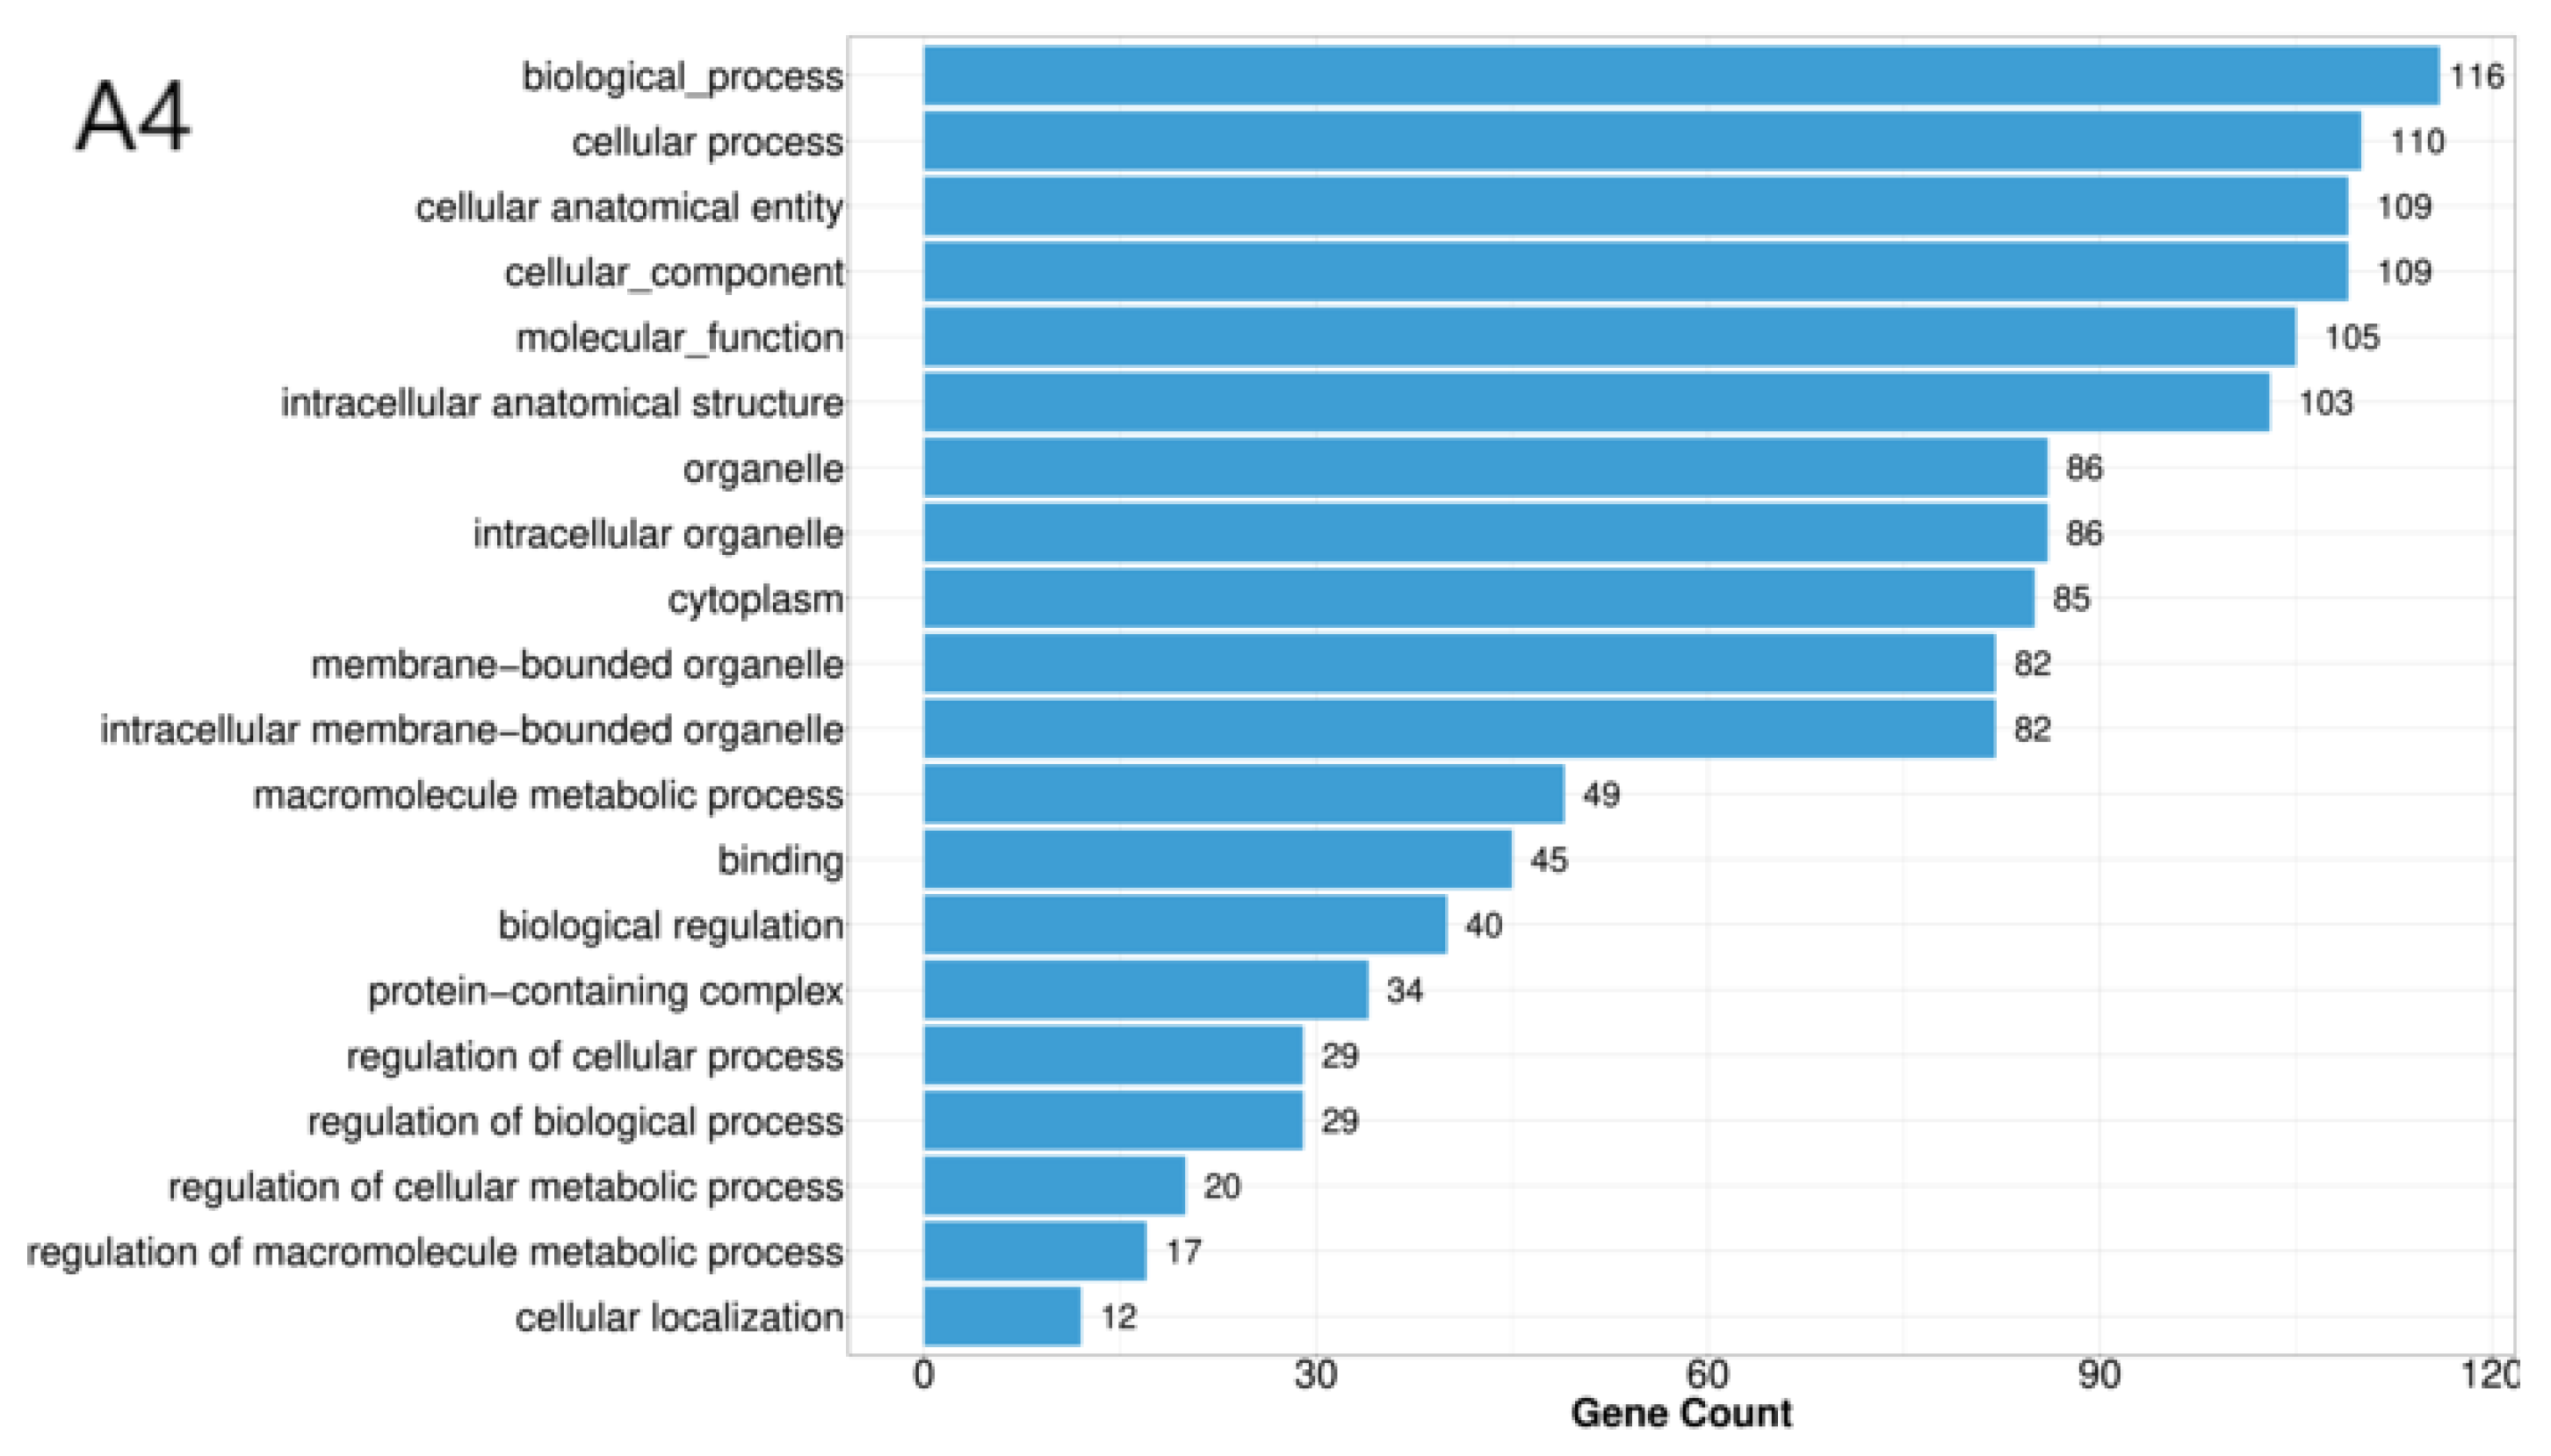
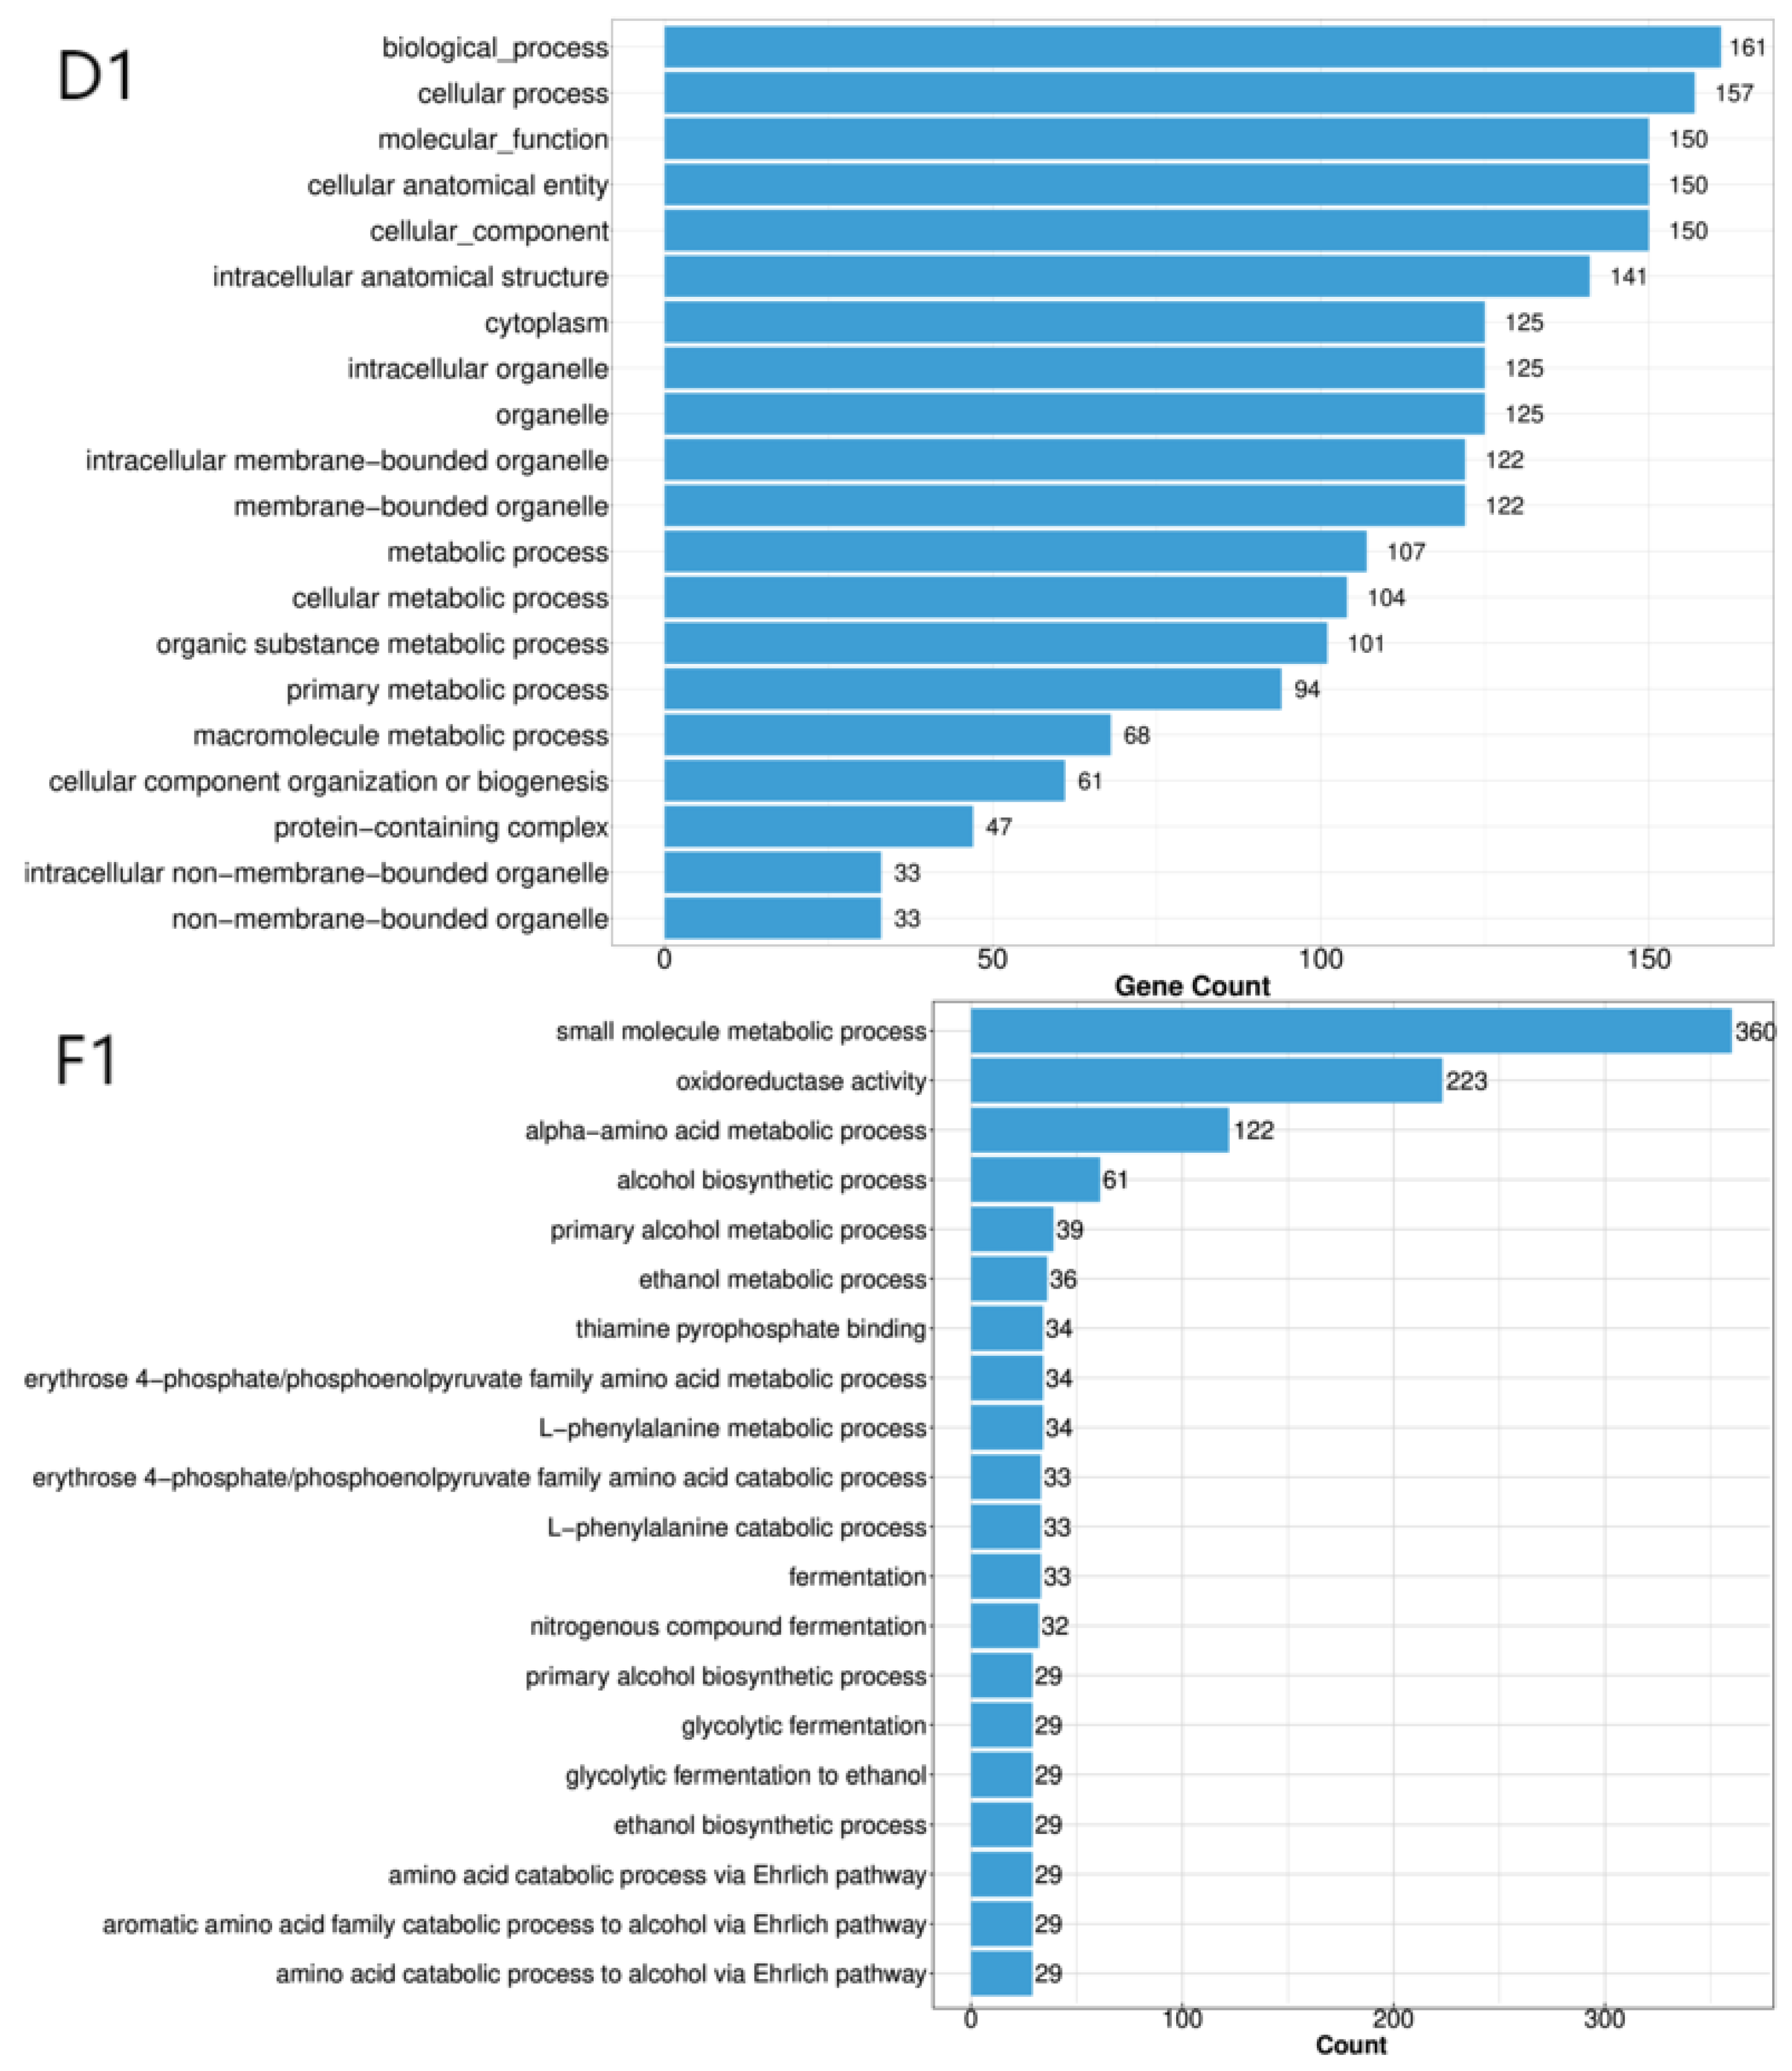
Figure 5.
Scatter plot of OPLS-DA models for the three groups. Note: The horizontal axis t[1]P denotes the predicted principal component score for the first principal component, illustrating inter-group differences. The vertical axis t[1]O denotes the orthogonal principal component score, illustrating intra-group differences. Each scatter point represents a sample, with scatter point shape and colour denoting different experimental groups.
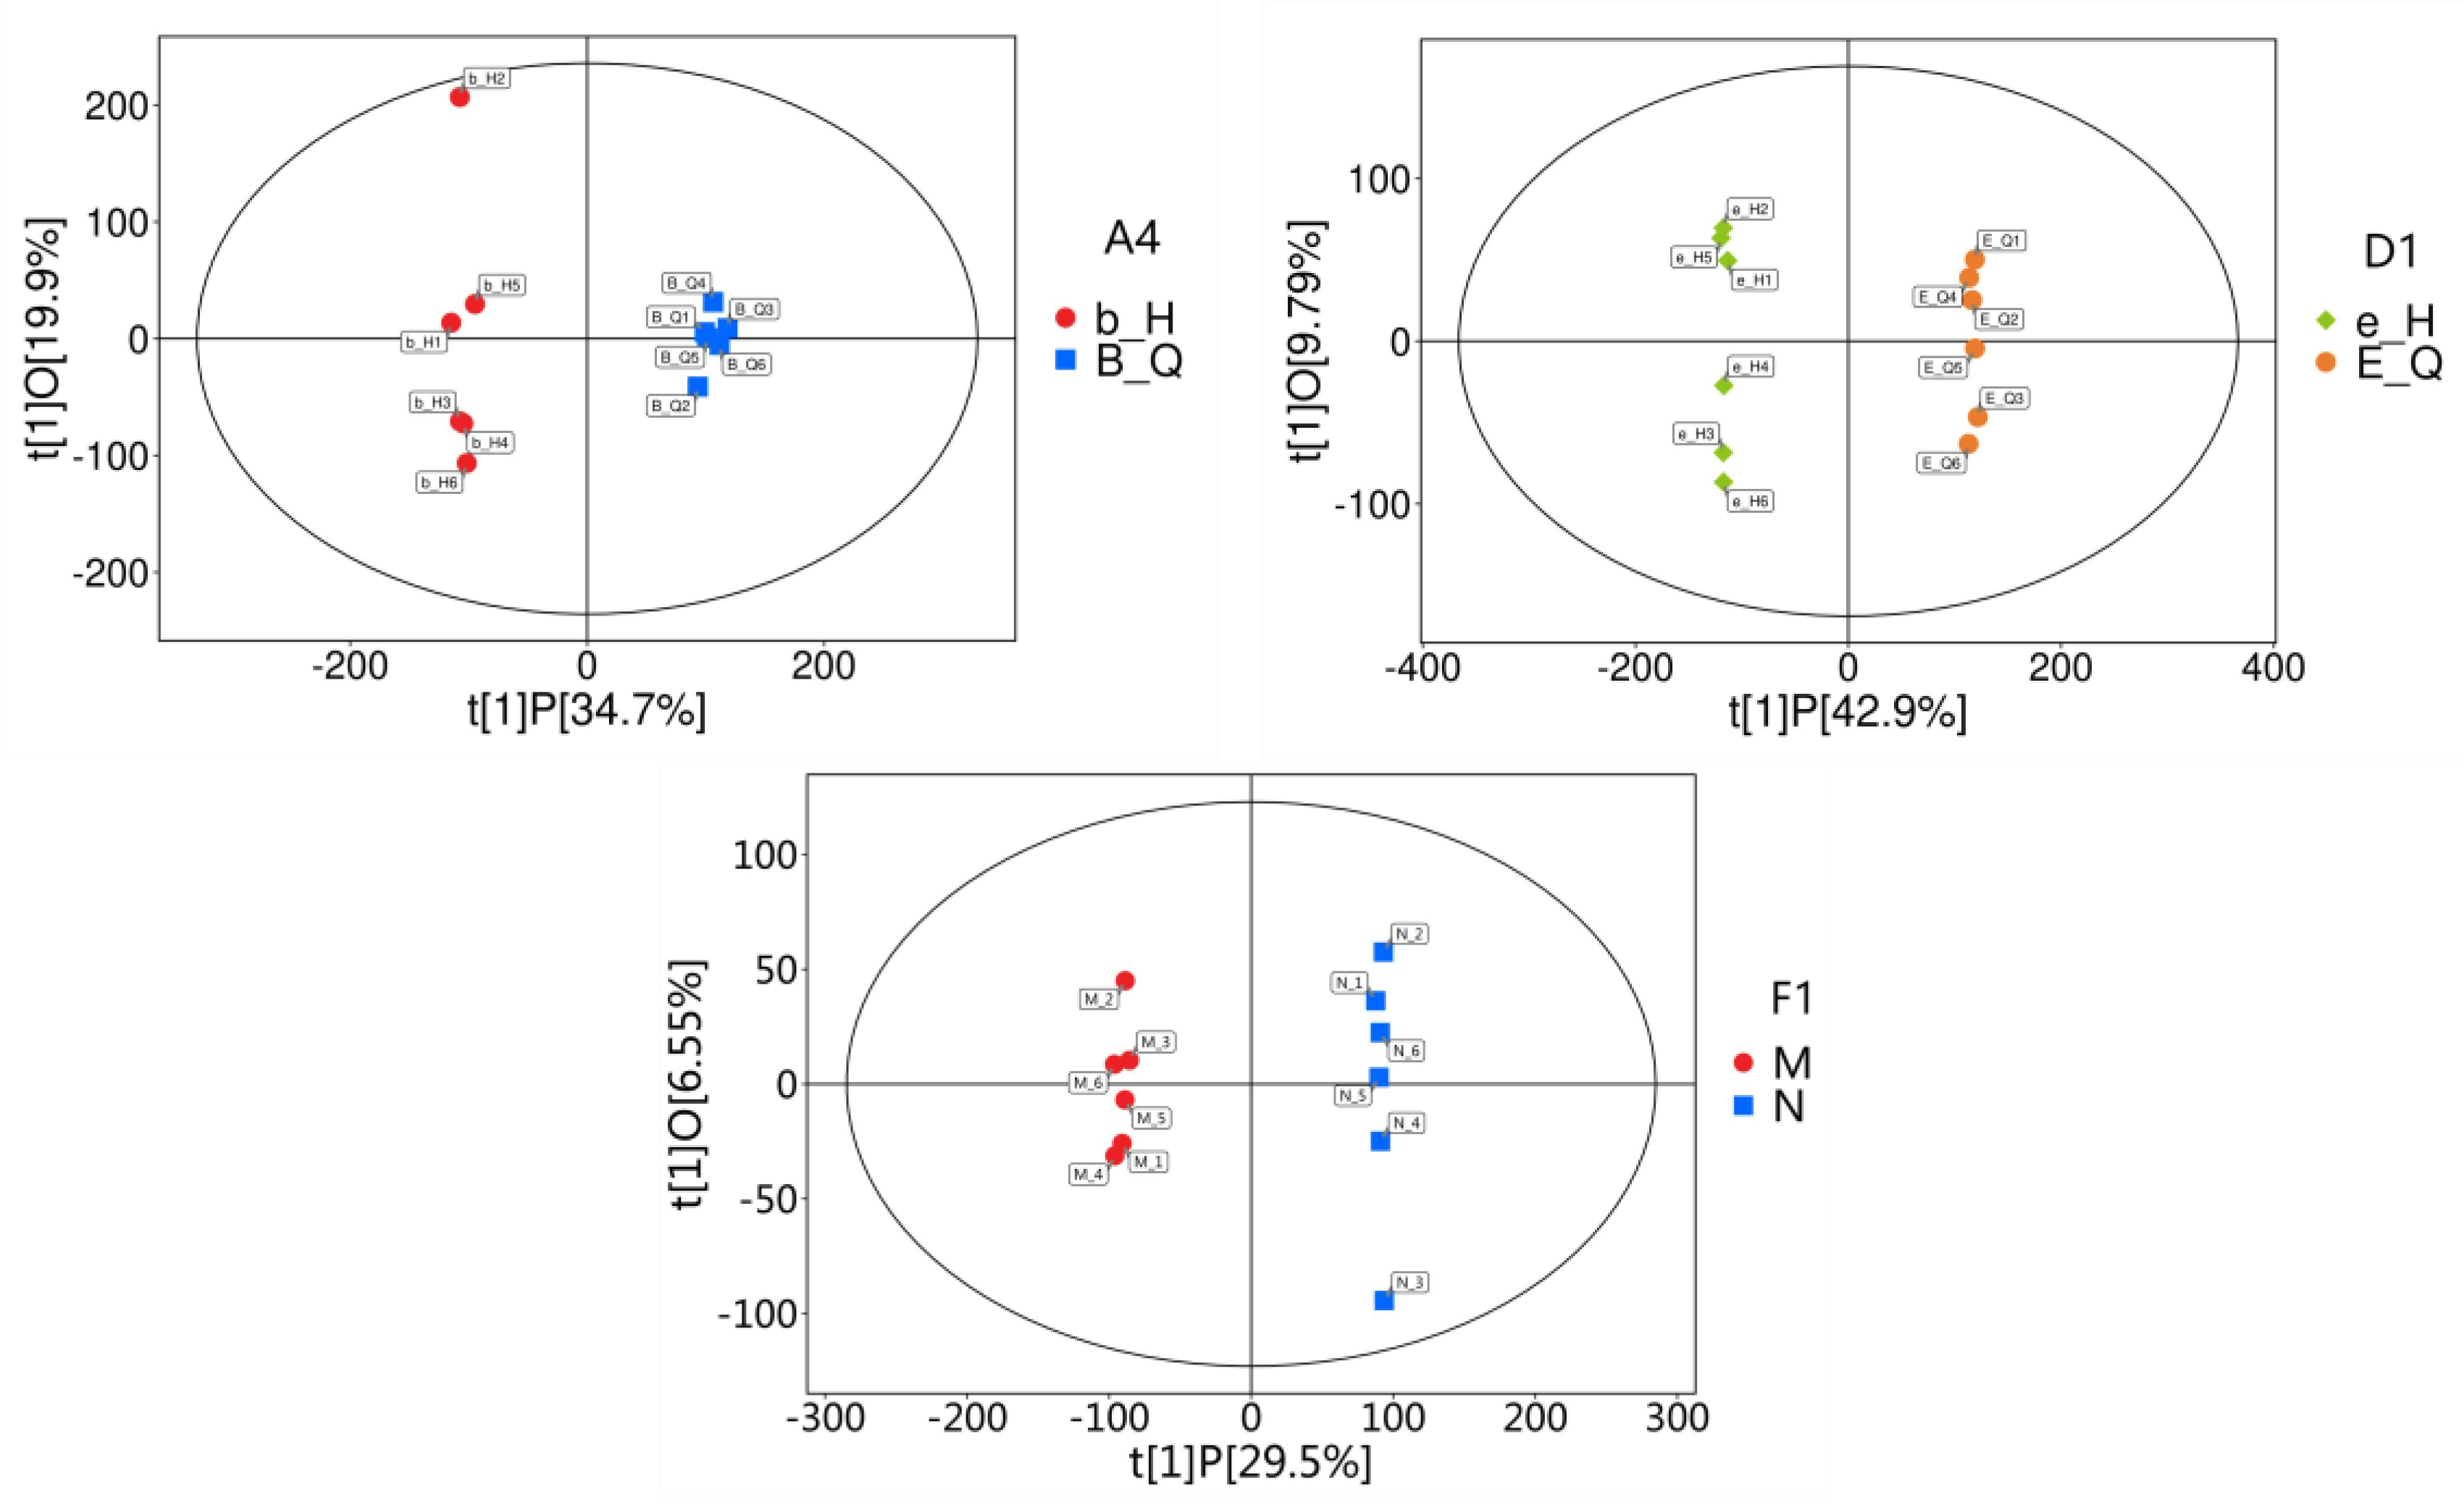
Figure 6.
Volcano plot for differential metabolite screening across three strains. Note: Each point in the volcano plot represents a peak, encompassing all substances detected in this experiment. The x-axis denotes the fold change relative to the control group (logarithm base 2), while the y-axis indicates the Student’s t-test P-value (negative logarithm base 10). Significantly upregulated metabolites are indicated in red, significantly downregulated metabolites in blue, and metabolites showing no significant difference in grey.
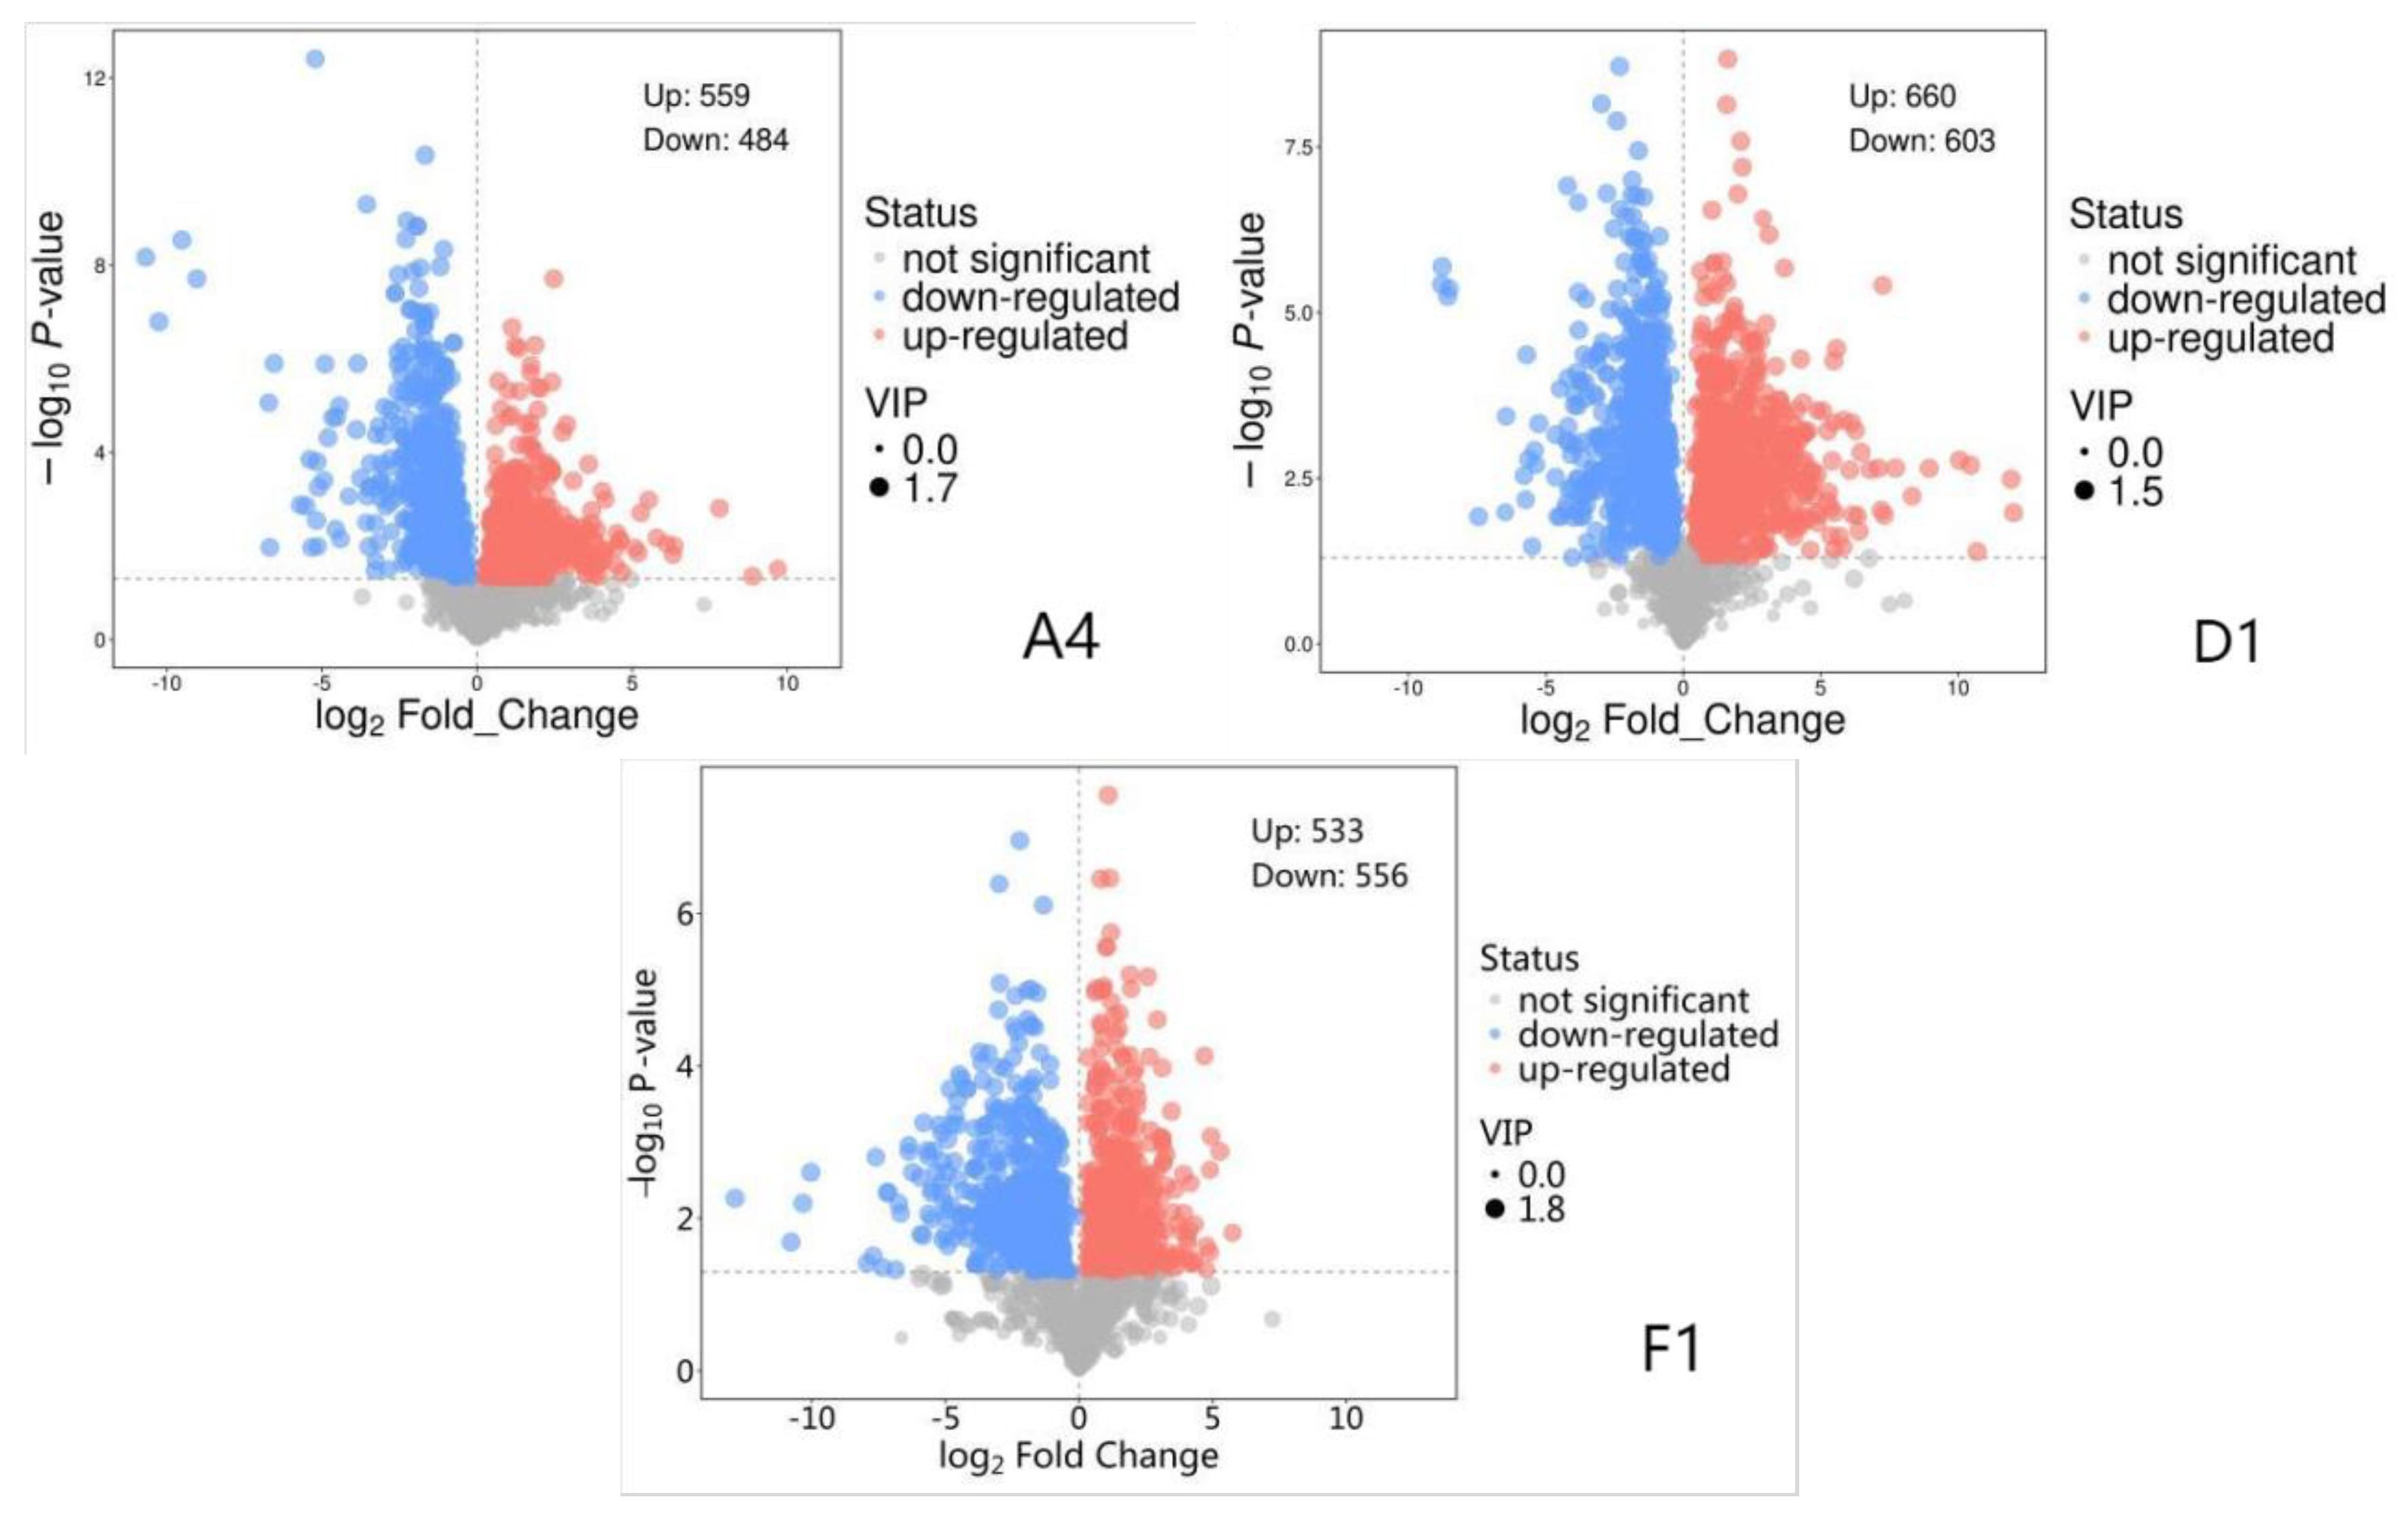
Figure 7.
KEGG Classification Diagram of Differentially Expressed Metabolites Across Strains. Note: The horizontal axis represents the percentage of annotated differentially expressed metabolites within a pathway relative to the total annotated differentially expressed metabolites. The vertical axis denotes the names of enriched KEGG metabolic pathways.
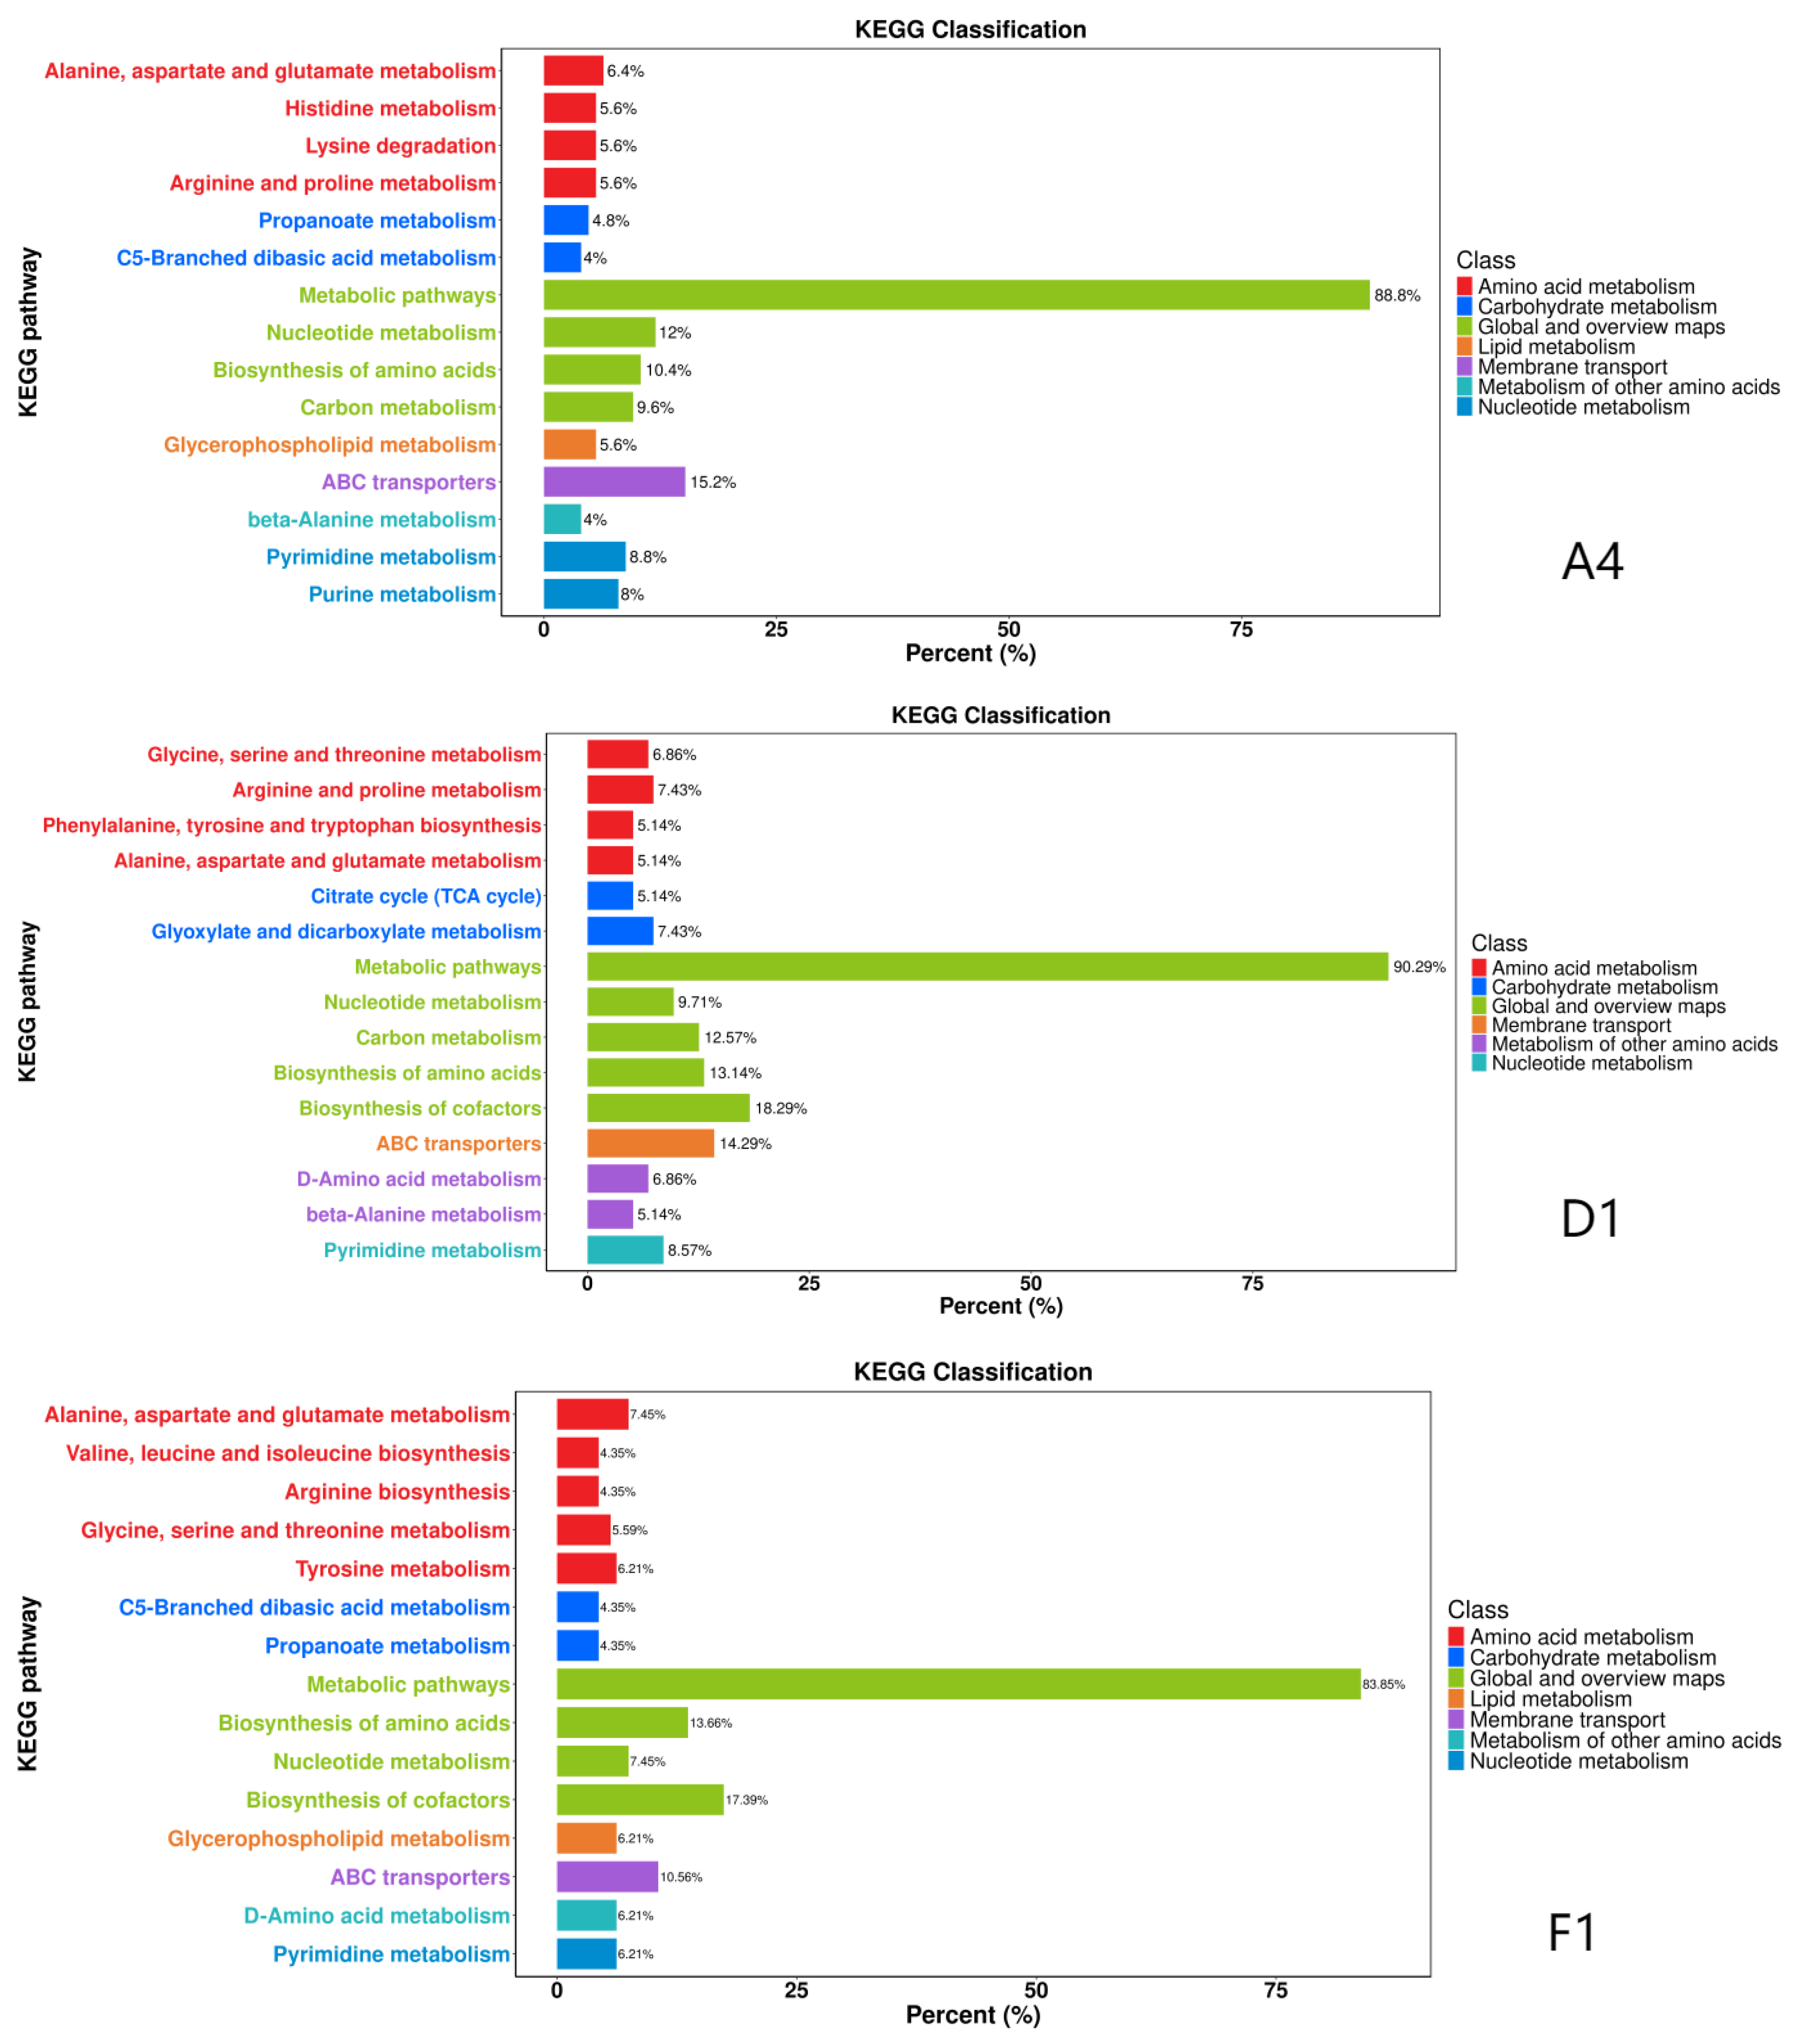
Figure 8.
Bar chart of pathways involving differentially expressed genes and metabolites across three strains. Note: The horizontal axis of the bar chart represents metabolic pathways. On the vertical axis, red indicates enrichment values for differentially expressed metabolites, while blue denotes enrichment values for differentially expressed genes.
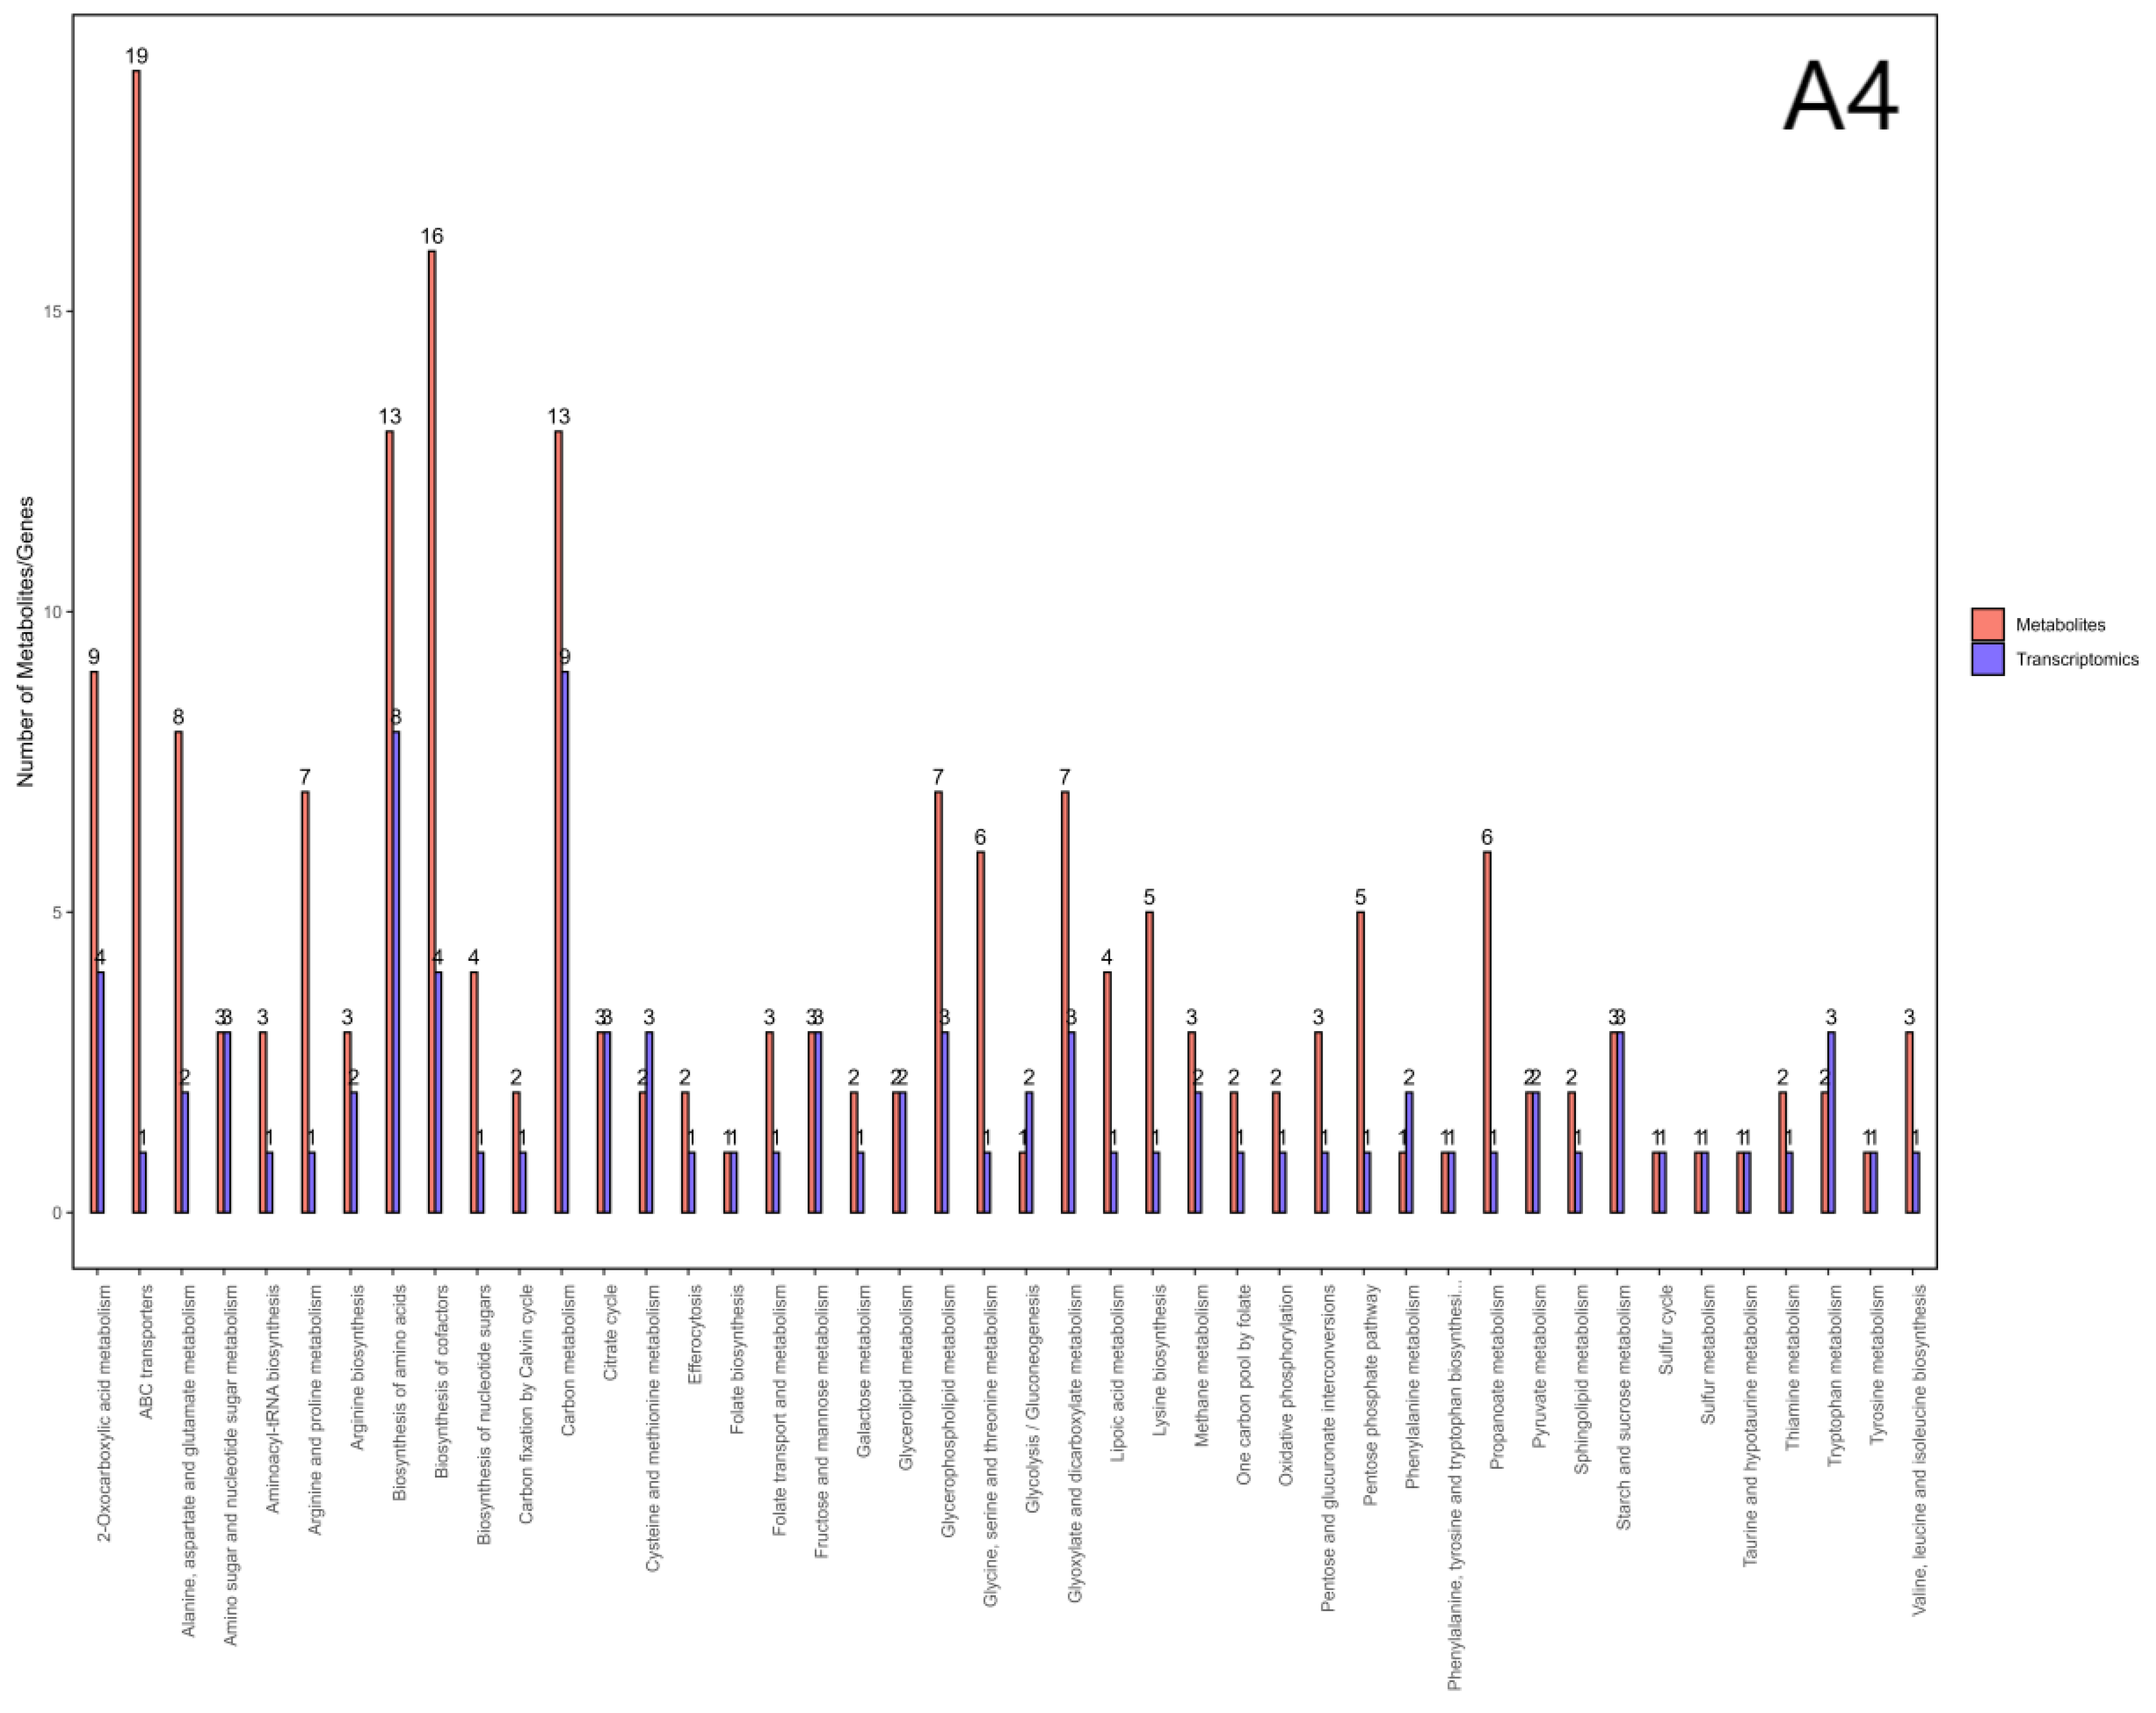
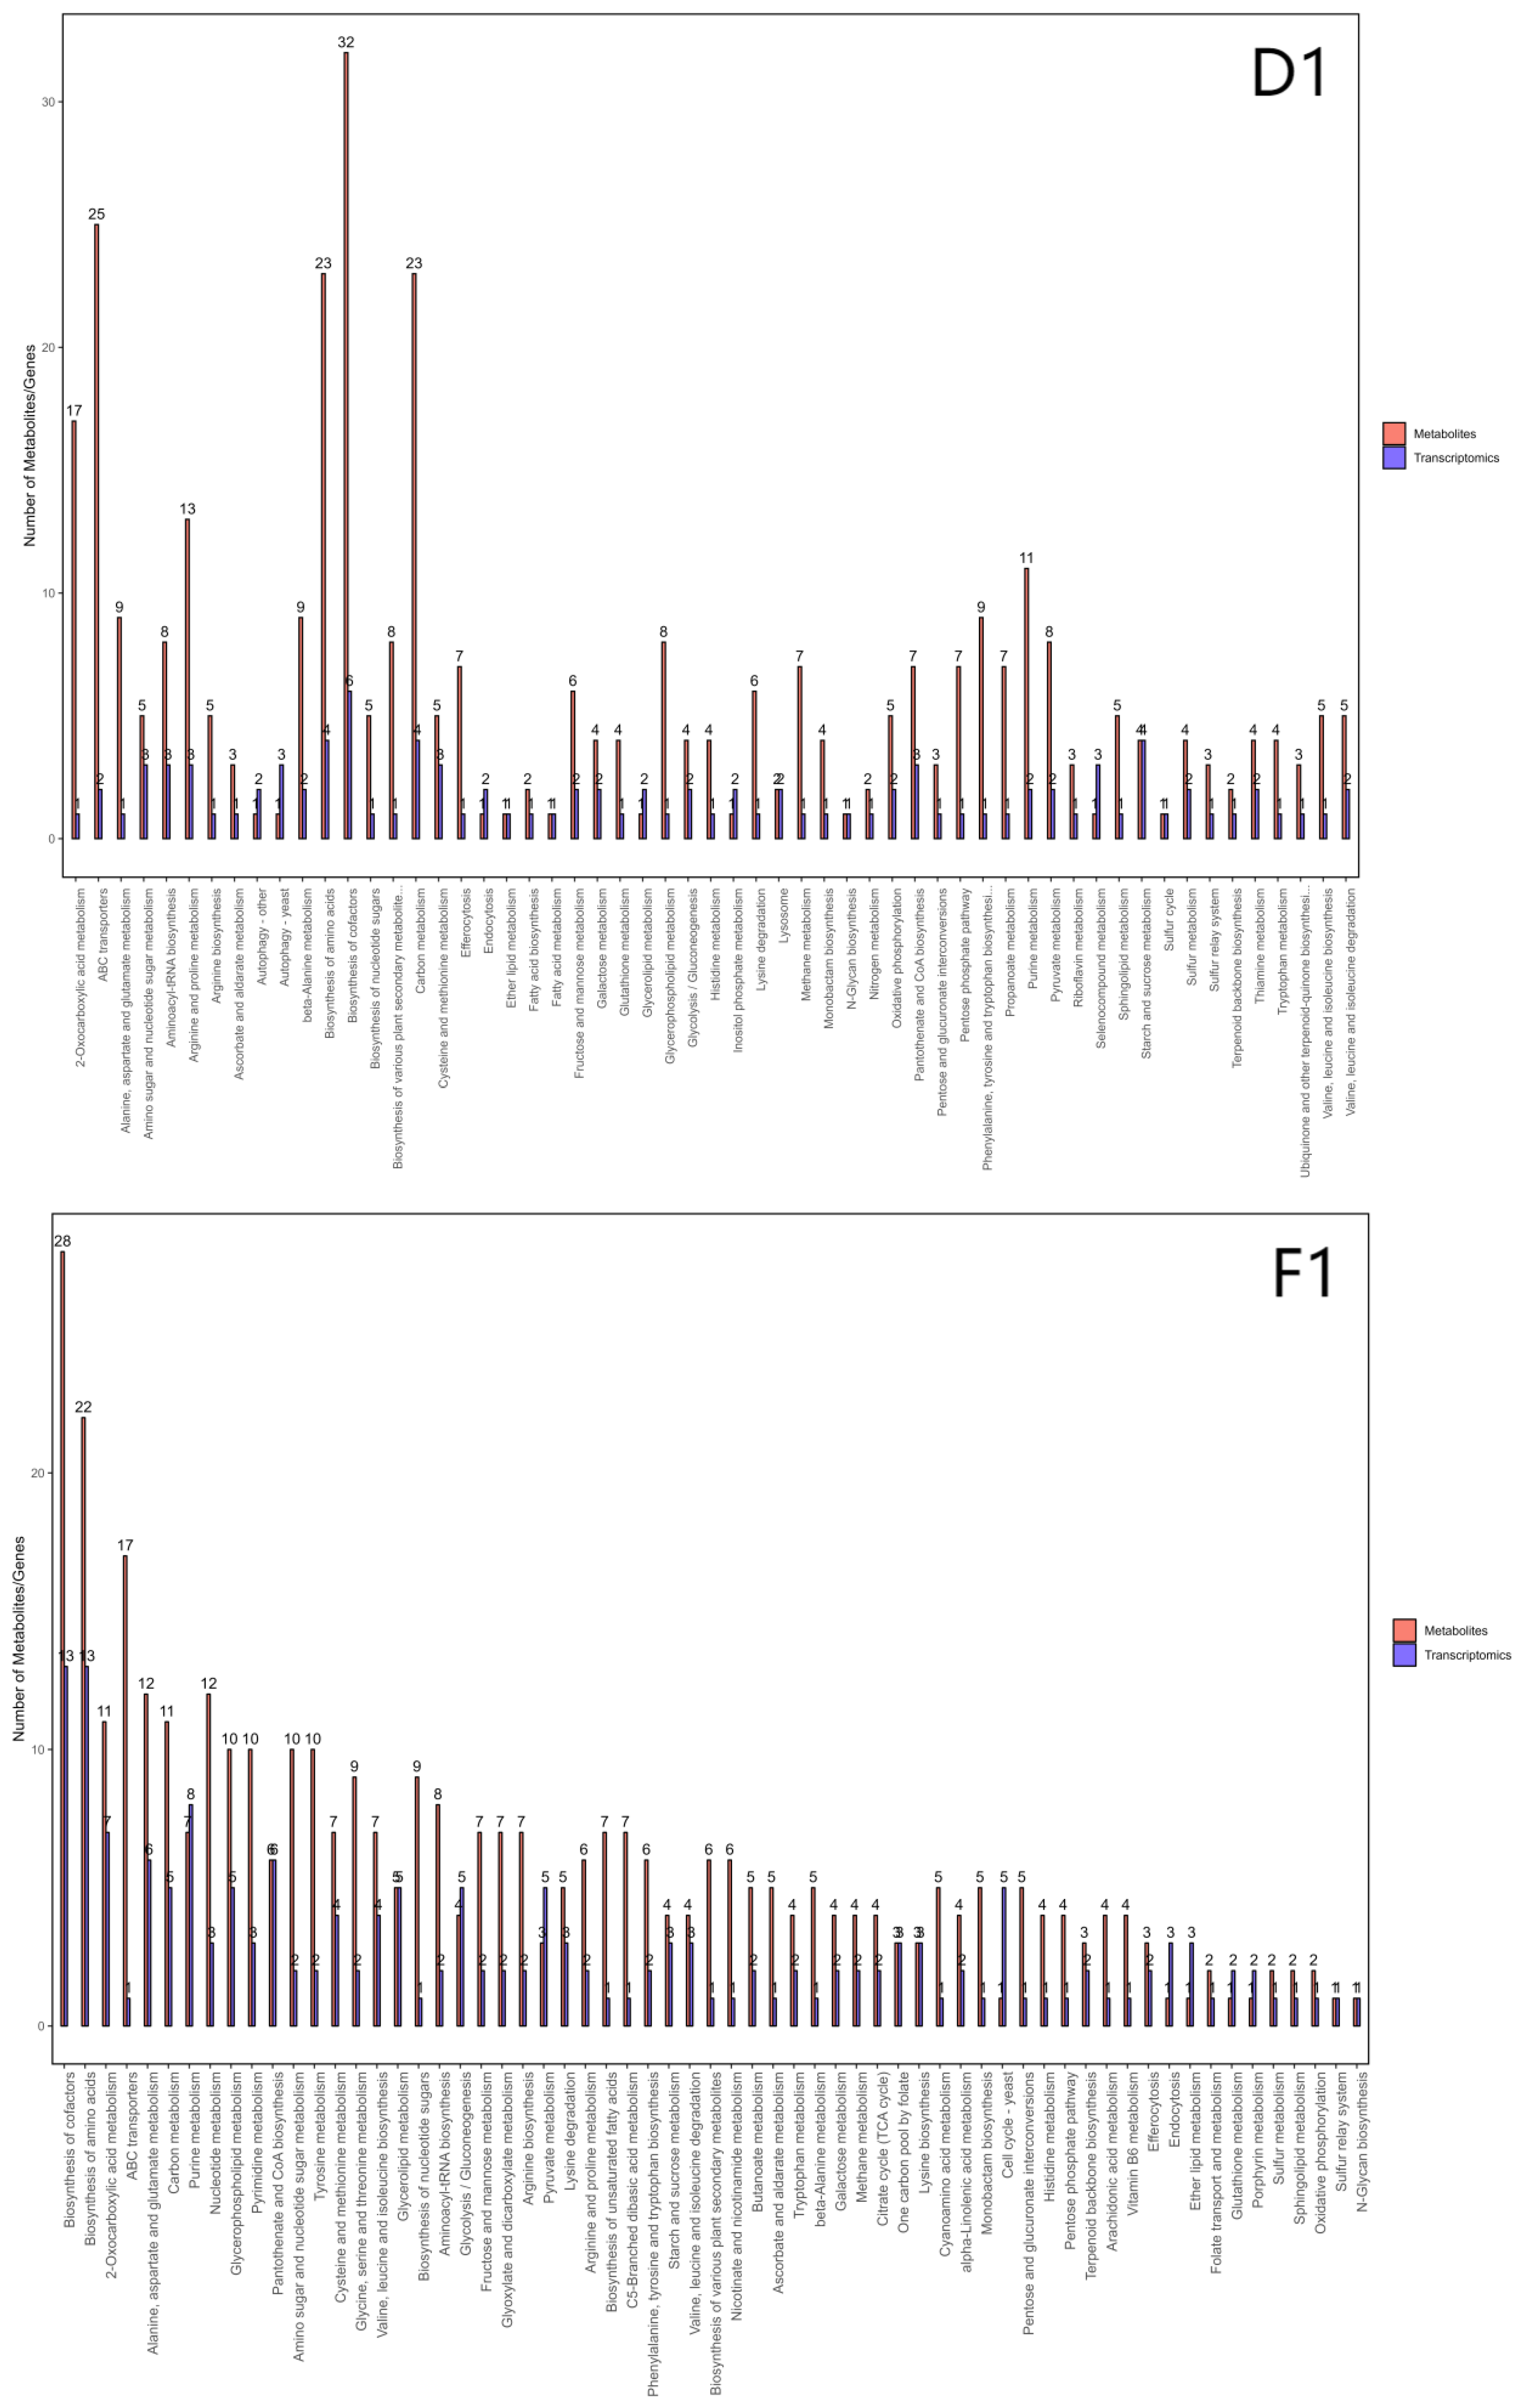

Table 1.
Common GO terms for the three strains.
| GO categories | Functional annotation |
| BP | Cellular process, metabolic process, biological regulation, response to stimulus, localization, reproductive process, developmental process, multicellular organismal process, homeostasis process, growth, biological process involved in interspecies interaction between organisms, locomotion, immune system process, biological process involved in intraspecies interaction between organisms. |
| CC | Cellular anatomical entity, protein-containing complex. |
| MF | Catalytic activity, binding, transporter activity, transcription regulator activity, molecular adaptor activity, ATP-dependent activity, molecular carrier activity, molecular function regulator activity, electron transfer activity, cytoskeletal motor activity. |
Table 2.
Common KEGG classification of three strains across various categories.
| KEGG categories | KEGG pathway annotation |
| Cellular processes | Cell growth and death, transport and catabolism, cell motility, cellular community-prokaryotes |
| Environmental information processing | Signal transduction, signaling molecules and interactions, membrane transport |
| Genetic information processing | Replication and repair, translation, folding, sorting and degradation, chromosome |
| Metabolism | Carbohydrate metabolism, amino acid metabolism, lipid metabolism, biosynthesis of other secondary metabolites, energy metabolism, metabolism of cofactors and vitamins, metabolism of other amino acids, glycan biosynthesis and metabolism, xenobiotics biodegradation and metabolism. |
| Organismal systems | Endocrine system, environmental adaptation, immune system, digestive system, excretory system, nervous system, development and regeneration. |
Table 3.
KEGG pathway enrichment for the three strains.
| KEGG pathway | Strain A4 | Strain D1 | Strain F1 |
|---|---|---|---|
| Starch and sucrose metabolism | √ | √ | √ |
| Glycerophospholipid metabolism | √ | ||
| Pentose and glucuronate interconversions | √ | √ | |
| Fructose and mannose metabolism | √ | ||
| Lysine degradation | √ | √ | |
| Glycine, serine and threonine metabolism | √ | ||
| Arginine biosynthesis | √ | ||
| Ubiquinone and other terpenoid-quinone biosynthesis | √ | ||
| Carbohydrate digestion and absorption | √ | √ | |
| Plant-pathogen interaction | √ | ||
| Tropane, piperidine and pyridine alkaloid biosynthesis | √ | ||
| Isoquinoline alkaloid biosynthesis | √ | √ | √ |
| Nitrogen metabolism | √ | ||
| Sphingolipid metabolism | √ | ||
| Neomycin, kanamycin and gentamicin biosynthesis | √ | ||
| Streptomycin biosynthesis | √ | ||
| Retinol metabolism | √ | ||
| Novobiocin biosynthesis | √ | ||
| Neuroactive ligand-receptor interaction | √ | ||
| Biosynthesis of unsaturated fatty acids | √ | ||
| Lysosome | √ | ||
| PI3K-Akt signaling pathway | √ | ||
| FoxO signaling pathway | √ | ||
| Steroid biosynthesis | √ | ||
| Fanconi anemia pathway | √ | ||
| Homologous recombination | √ | ||
| beta-Alanine metabolism | √ | ||
| Longevity regulating pathway-worm | √ | ||
| Pantothenate and CoA biosynthesis | √ | √ | |
| Tyrosine metabolism | √ | √ | |
| Ferroptosis | √ | ||
| Selenocompound metabolism | √ | ||
| Mineral absorption | √ | ||
| RIG-I-like receptor signaling pathway | √ | ||
| Cell adhesion molecules | √ | ||
| Glycolysis/ Gluconeogesis | √ | ||
| Biosynthesis of amino acids | √ | ||
| Purine metabolism | √ | ||
| 2-Oxocarboxylic acid metabolism | √ | ||
| Cysteine and methionine metabolism | √ | ||
| Alanine, aspartate and glutamato metabolism | √ | ||
| Pyruvate metabolism | √ | ||
| Steroid biosynthesis | √ | ||
| Valine, leucine and isoleucine biosynthesis | √ | ||
| Glutathione metabolism | √ | ||
| Glycerolipid metabolism | √ | ||
| Ether lipid metabolism | √ | ||
| Fatty acid degradation | √ | ||
| Butanoate metabolism | √ | ||
| lsoquinoine alkaloid biosynthesis | √ | ||
| Riboflavin metabolism | √ | ||
| Caffeine metabolism | √ |
Table 4.
Twenty-nine pathways jointly implicated in the integrated transcriptomic and metabolomic analysis of the three strains.
Table 4.
Twenty-nine pathways jointly implicated in the integrated transcriptomic and metabolomic analysis of the three strains.
| KEGG ID | Pathway Name |
|---|---|
| sce00010 | Glycolysis / Gluconeogenesis |
| sce00030 | Pentose phosphate pathway |
| sce00040 | Pentose and glucuronate interconversions |
| sce00051 | Fructose and mannose metabolism |
| sce00052 | Galactose metabolism |
| sce00190 | Oxidative phosphorylation |
| sce00220 | Arginine biosynthesis |
| sce00250 | Alanine, aspartate and glutamate metabolism |
| sce00270 | Cysteine and methionine metabolism |
| sce00290 | Valine, leucine and isoleucine biosynthesis |
| sce00330 | Arginine and proline metabolism |
| sce00380 | Tryptophan metabolism |
| sce00400 | Phenylalanine, tyrosine and tryptophan biosynthesis |
| sce00500 | Starch and sucrose metabolism |
| sce00520 | Amino sugar and nucleotide sugar metabolism |
| sce00561 | Glycerolipid metabolism |
| sce00564 | Glycerophospholipid metabolism |
| sce00600 | Sphingolipid metabolism |
| sce00620 | Pyruvate metabolism |
| sce00680 | Methane metabolism |
| sce00920 | Sulfur metabolism |
| sce00970 | Aminoacyl-tRNA biosynthesis |
| sce01200 | Carbon metabolism |
| sce01210 | 2-Oxocarboxylic acid metabolism |
| sce01230 | Biosynthesis of amino acids |
| sce01240 | Biosynthesis of cofactors |
| sce01250 | Biosynthesis of nucleotide sugars |
| sce02010 | ABC transporters |
| sce04148 | Efferocytosis |
Disclaimer/Publisher’s Note: The statements, opinions and data contained in all publications are solely those of the individual author(s) and contributor(s) and not of MDPI and/or the editor(s). MDPI and/or the editor(s) disclaim responsibility for any injury to people or property resulting from any ideas, methods, instructions or products referred to in the content. |
© 2026 by the authors. Licensee MDPI, Basel, Switzerland. This article is an open access article distributed under the terms and conditions of the Creative Commons Attribution (CC BY) license (http://creativecommons.org/licenses/by/4.0/).
Copyright: This open access article is published under a Creative Commons CC BY 4.0 license, which permit the free download, distribution, and reuse, provided that the author and preprint are cited in any reuse.


