
Submitted:
27 January 2026
Posted:
28 January 2026
You are already at the latest version
Abstract
Background/Objectives: Using a human liver donor bank, we previously demonstrated a strong correlation between donor history of ethanol consumption and increased hepatic CYP2B6 mRNA, protein, and enzymatic activity, suggesting that ethanol may enhance CYP2B6 expression in vivo. The objective of this study was to determine whether ethanol exposure increases CYP2B6 gene expression in hepatic and intestinal cell models commonly used to study cytochrome P450 induction, and to assess whether observed expression patterns are consistent with CAR- or PXR-related regulatory involvement. Methods: Human-derived hepatic (HepG2) and intestinal (Caco-2 and LS180) cell lines, as well as HepG2 cells stably expressing murine constitutive androstane receptor (HepG2-mCAR), were treated with ethanol. Phenobarbital (a CAR activator) and rifampin (a pregnane X receptor [PXR] activator) were used as reference inducers. CYP2B6, CYP2B7, and CYP2B6 splice variant (CYP2B6-SV2) mRNA expression levels were quantified by real-time RT-PCR. Results: Compared with vehicle control (0.5% DMSO), ethanol increased CYP2B6 mRNA expression by 35-fold (P = 0.026) in HepG2-mCAR cells and 27-fold (P = 0.002) in Caco-2 cells, but produced no significant change in HepG2 or LS180 cells. Phenobarbital produced similar but smaller increases in CAR-responsive models, whereas rifampin selectively induced CYP2B6 in LS180 cells. Ethanol and phenobarbital also increased CYP2B7 mRNA expression, while transcript levels of the splice variant CYP2B6-SV2 remained unchanged. Conclusions: Ethanol enhances CYP2B6 and CYP2B7 mRNA expression in hepatic and intestinal cell models, with expression patterns consistent with CAR-related regulatory involvement. These findings support a mechanistic basis for ethanol-associated modulation of CYP2B6 expression relevant to alcohol–drug interactions.
Keywords:
CYP2B6
; ethanol
; CAR activation
; PXR
; cytochrome P450 induction
; alcohol–drug interaction
; hepatic and intestinal models
1. Introduction
Ethanol consumption, alone or in combination with other alcohols, alters the biotransformation of drugs mediated by cytochrome P450 (CYP) enzymes in both hepatic and extrahepatic tissues. Experimental and clinical evidence indicates that ethanol modulates the expression and activity of multiple CYP isoforms, including CYP2E1, CYP2C, CYP3A, and CYP2B, thereby contributing to clinically relevant alcohol–drug interactions in humans. Induction of CYP2E1 by ethanol occurs predominantly through post-translational mechanisms involving protein stabilization, whereas induction of other CYP isoforms is primarily mediated through enhanced gene transcription and nuclear receptor–dependent signaling pathways (Kazmi et al., 2019; Negishi et al., 2020; Tolson and Wang, 2021).
Animal models of chronic ethanol exposure have provided mechanistic insight into ethanol-mediated CYP regulation in hepatic tissue. Recent in vivo and in vitro analyses confirm that ethanol and ethanol-derived metabolites can upregulate hepatic CYP gene expression through transcriptional pathways involving nuclear receptor activation (Hernandez et al., 2020; Shih et al., 2022). These findings support a role for ethanol in modulating CYP gene regulatory networks controlling hepatic drug metabolism.
Clinical and pharmacokinetic investigations in humans further support ethanol-associated CYP modulation in hepatic and intestinal tissues. Meta-analyses and clinical studies have demonstrated altered clearance and metabolic ratios of CYP substrates in individuals with chronic alcohol consumption, consistent with induction of hepatic CYP enzymes, including CYP2E1 and CYP3A4 (Drozdzik et al., 2021; Tolson and Wang, 2021). In addition, moderate ethanol intake has been associated with changes in intestinal CYP activity, suggesting that ethanol may regulate extrahepatic CYP expression and influence first-pass drug metabolism and oral drug bioavailability (Di Paolo et al., 2023).
Despite extensive investigation of ethanol-mediated regulation of CYP2E1 and CYP3A, relatively limited information is available regarding the regulation of CYP2B6 by ethanol in human-derived in vitro systems. CYP2B6 is a clinically important drug-metabolizing enzyme expressed in human liver and intestine and contributes to the metabolism of several therapeutically relevant drugs, including bupropion and efavirenz. Transcriptional regulation of CYP2B6 is primarily mediated by nuclear receptors, particularly the constitutive androstane receptor (CAR) and pregnane X receptor (PXR), which respond to xenobiotic exposure by activating CYP2B6 gene transcription (Kazmi et al., 2019; Negishi et al., 2020; Tolson and Wang, 2021). CAR- and PXR-dependent regulation of CYP2B6 has been well established in hepatic and intestinal models, making these receptors central to understanding inducible CYP2B6 expression.
In recent years, increasing attention has been given to nuclear receptor–mediated regulation of CYP2B6 and intestinal CYP expression in the context of xenobiotic and dietary exposures. Contemporary reviews have highlighted CAR- and PXR-dependent transcriptional control of CYP2B6 in human hepatic and intestinal systems, emphasizing their role in interindividual variability in drug metabolism and drug–drug interactions (Kazmi et al., 2019; Negishi et al., 2020; Tolson and Wang, 2021). Recent in vitro investigations have further demonstrated that ethanol and other small-molecule xenobiotics can indirectly modulate nuclear receptor signaling pathways influencing CYP gene expression in hepatic cell models (Hernandez et al., 2020; Shih et al., 2022). Additionally, growing evidence indicates that intestinal CYP regulation contributes substantially to first-pass metabolism and ethanol-associated variability in oral drug bioavailability (Drozdzik et al., 2021; Di Paolo et al., 2023). These contemporary findings underscore the relevance of investigating ethanol-mediated regulation of CYP2B6 and related CYP2B family members in both hepatic and intestinal experimental models.
In previous work using a human liver donor bank, we demonstrated a strong correlation between a history of significant ethanol consumption and increased hepatic CYP2B6 mRNA, protein expression, and bupropion hydroxylation activity. While these observations established in vivo relevance, the direct effect of ethanol on CYP2B6 gene expression in controlled human-derived hepatic and intestinal in vitro models has not been systematically investigated. This gap limits mechanistic interpretation of ethanol-associated CYP2B6 variability observed in human populations.
Accordingly, the objective of the present study was to evaluate whether ethanol exposure enhances CYP2B6 mRNA expression in human-derived hepatic and intestinal cell models commonly used to investigate CYP induction, including HepG2-wild, HepG2 cells stably expressing murine CAR (HepG2-mCAR), Caco-2, and LS180 cells. These models differ in their expression and functionality of CAR and PXR, enabling assessment of receptor-linked expression patterns. Phenobarbital (a CAR activator) and rifampin (a PXR activator) were used as reference inducers. In addition, we examined ethanol-mediated effects on CYP2B7 mRNA, a closely related CYP2B gene expressed in hepatic and extrahepatic tissues, and on CYP2B6-SV2, a common splice variant previously shown to be differentially expressed in human livers from donors with a history of ethanol consumption. Through this approach, we sought to determine whether ethanol-associated CYP2B6 and CYP2B7 transcriptional responses in cell models exhibit expression patterns consistent with CAR- or PXR-related regulatory involvement.
2. Materials and Methods
2.1. Reagents
Ethanol (absolute), rifampin, and phenobarbital were purchased from Sigma-Aldrich (St. Louis, MO, USA). Recombinant human CYP2B6 protein and anti-CYP2B6 polyclonal antibody (catalog no. 458226) were obtained from BD-Gentest (Woburn, MA, USA). Cell culture flasks and media were purchased from In Vitro Technologies (Baltimore, MD, USA).
2.2. Human Hepatic and Intestinal Cell Lines
The human hepatoma cell line HepG2-wild and the human colon adenocarcinoma cell line LS-180 were obtained from the American Type Culture Collection (ATCC, Manassas, VA, USA). The human colon adenocarcinoma cell line Caco-2 (passages 30–40) was kindly provided by Dr. Douglas Jefferson (GRASP Center, Tufts–New England Medical Center, Boston, MA, USA). HepG2-mCAR cells stably expressing murine constitutive androstane receptor (CAR) were provided by Dr. Masa Negishi (National Institute of Environmental Health Sciences, NIH, USA) and have been previously characterized for CAR-responsive CYP induction (Sueyoshi et al., 1999).
All cell lines were cultured in Dulbecco’s Modified Eagle’s Medium (DMEM; Gibco, Thermo Fisher Scientific, Waltham, MA, USA) supplemented with 10% fetal bovine serum (FBS; Gibco), 0.1 mM non-essential amino acids, 25 mM HEPES buffer, 100 U/mL penicillin, and 100 μg/mL streptomycin. Culture flasks were sealed gas-tight using Teflon® thread tape to minimize ethanol evaporation. Cells were maintained at 37 °C in a humidified incubator with 5% CO₂, and media were changed every 3–4 days.
2.3. RNA Isolation and Storage
Total RNA was isolated using the RNeasy Mini Kit (Qiagen, Hilden, Germany) according to the manufacturer’s instructions. RNA was eluted in 50 μL RNase-free water and quantified by UV absorbance at 260 nm. Purity was assessed by the A260/A280 ratio, and samples with ratios between 1.7 and 2.2 were accepted for analysis. RNA samples were stored at −80 °C until further use.
2.4. Reverse Transcription
DNase-treated RNA (1 μg) was reverse transcribed in a 20 μL reaction volume containing random hexamer primers, dNTP mix, RNase inhibitor, 0.1 M DTT, and Omniscript reverse transcriptase (Qiagen), according to the manufacturer’s protocol. Reverse transcription was performed at 37 °C for 60 min. Resulting cDNA was stored at −20 °C prior to quantitative PCR.
2.5. Quantitative Real-Time PCR
cDNA was diluted 1:10 for quantification of target genes and 1:1000–1:5000 for quantification of the reference gene (18S rRNA). Primer sequences are listed in Table 1. Reactions contained SYBR Green 2× Master Mix (Applied Biosystems, Foster City, CA, USA), primers (final concentration 200 nM), and diluted cDNA in a final volume of 25 μL. PCR amplification was performed using the following cycling conditions: 95 °C for 10 min, followed by 40 cycles of 95 °C for 15 s and 60 °C for 60 s. Melting curve analysis confirmed specificity of amplification. CAR primers were designed to amplify both human and murine CAR cDNA. No-template controls were included in each run.
Relative mRNA expression was calculated using the formula:
mRNA = A^(Ct_target − Ct_18S)
where A represents amplification efficiency (set at 1.8, corresponding to ~80% efficiency). CYP2B6 mRNA was quantified using primer set 329/396 (normally spliced transcript), while CYP2B6-SV2 was quantified using primer set 329/332 (splice variant lacking exons 4–6). CYP2B6-SV2 levels were also expressed as a percentage of total CYP2B6 transcripts.
2.6. Cell Treatment Conditions
LS-180, Caco-2, HepG2-wild, and HepG2-mCAR cells were used for induction studies. Cells were seeded in T-25 flasks. LS-180, HepG2-wild, and HepG2-mCAR cells were grown to ~70% confluence. Caco-2 cells were grown for an additional 7 days post-confluence to allow differentiation.
Preliminary concentration-finding experiments were conducted using ethanol concentrations ranging from 10–300 mM to determine an optimal non-toxic induction concentration. Based on these experiments, 100 mM ethanol was selected for subsequent induction studies.
Phenobarbital (1 mM final concentration) and rifampin (10 μM final concentration) were used as reference CAR and PXR activators, respectively. Stock solutions were prepared in methanol, evaporated to dryness, and re-dissolved in DMSO. Final DMSO concentration in culture media was 0.5% (v/v) in all treatment groups, including vehicle controls. Treatment media were sterilized through 0.2 μm filters before addition to cultures.
Cells were treated for 72 h, with fresh treatment media replaced every 24 h. For time-course studies, cells were harvested at 0, 24, 48, and 72 h following treatment. At the end of treatment, cells were washed with phosphate-buffered saline and processed for RNA isolation as described above.
2.7. Cell Lysis for Immunoblotting
Following treatment, media were aspirated and cells were stored at −80 °C until analysis. Cells were lysed on ice in lysis buffer containing 50 mM Tris-HCl (pH 8.0), 150 mM NaCl, 1% Triton X-100, 0.6 mM phenylmethylsulfonyl fluoride, and protease inhibitors. Lysates were sonicated and centrifuged at 2000 rpm for 5 min. Protein concentrations were determined using the bicinchoninic acid assay (Pierce, Rockford, IL, USA) with bovine serum albumin as standard. Lysates were stored at −80 °C until immunoblot analysis.
2.8. Immunoblotting
Recombinant human CYP2B6 protein and cell lysates (25–50 μg total protein per lane) were denatured in reducing sample buffer and separated by SDS-PAGE on 5–15% polyacrylamide gels. Proteins were transferred to PVDF membranes (Millipore, Bedford, MA, USA), blocked in 0.5% non-fat milk in TBS-Tween, and incubated with anti-CYP2B6 polyclonal antibody (1:500 dilution). After washing, membranes were incubated with HRP-conjugated secondary antibody and visualized using enhanced chemiluminescence (SuperSignal CL-HRP; Pierce). Images were captured using a Kodak ImageStation system.
2.9. Statistical Analysis
Data are presented as mean ± standard error of the mean (SEM). Statistical analysis was performed using SigmaStat software (SPSS Inc., Chicago, IL, USA). Comparisons between treatment groups and vehicle controls were conducted using Student’s t-test. A p-value < 0.05 was considered statistically significant.
3. Results
3.1. Basal Expression of CYP and Nuclear Receptor mRNA in Hepatic and Intestinal Cell Lines
Basal mRNA expression levels of CYP2B6 (including CYP2B6-SV2), CYP2B7, pregnane X receptor (PXR), and constitutive androstane receptor (CAR) were quantified in untreated hepatic and intestinal cell lines (HepG2-wild, HepG2-mCAR, Caco-2, and LS-180) using quantitative RT-PCR.
As shown in Figure 1B, CYP2B6 and CYP2B7 transcripts were detected at comparable levels in HepG2-mCAR and LS-180 cells, while lower expression (approximately 15–30% of other cell lines) was observed in Caco-2 cells. CYP2B6 and CYP2B7 mRNA were not detected in HepG2-wild cells.
PXR mRNA was detected in all cell lines but was approximately five-fold higher in LS-180 cells compared with the other models (Figure 1A). CAR mRNA was detected in HepG2-mCAR and Caco-2 cells, whereas LS-180 and HepG2-wild cells lacked detectable CAR expression (Figure 1A).
CYP2B6-SV2 mRNA (exon 4–6 deletion variant) was detected in all cell lines except HepG2-wild, representing on average 16%, 19%, and 30% of total CYP2B6 transcripts in HepG2-mCAR, Caco-2, and LS-180 cells, respectively (Figure 1C).
3.2. Concentration and Time Dependence of Ethanol-Induced CYP2B6 mRNA Expression in HepG2-mCAR Cells
Preliminary concentration-response experiments demonstrated increased CYP2B6 mRNA levels in HepG2-mCAR cells following 72 h exposure to ethanol. Optimization experiments were therefore conducted to evaluate treatment duration (24–72 h at 100 mM ethanol) and ethanol concentration (10–300 mM for 72 h).
As shown in Figure 2A, maximal CYP2B6 mRNA induction was observed at ethanol concentrations of 100–200 mM. Concentrations above 300 mM were associated with loss of cell adherence and were therefore not used in subsequent experiments.
Time-course analysis demonstrated no significant change in CYP2B6 mRNA at 24 or 48 h, whereas a ~3.5-fold increase relative to vehicle control was observed after 72 h of exposure to 100 mM ethanol (Figure 2B). Accordingly, all subsequent induction studies were performed using 100 mM ethanol for 72 h. The same treatment duration was applied for phenobarbital (1 mM) and rifampin (10 μM), based on prior optimization in this experimental system.
3.3. Effects of Ethanol, Phenobarbital, and Rifampin on CYP2B6 and CYP2B7 mRNA in Hepatic Cell Lines
The effects of ethanol (100 mM), phenobarbital (1 mM), and rifampin (10 μM) on CYP2B6 mRNA expression were evaluated in HepG2-mCAR and HepG2-wild cells.
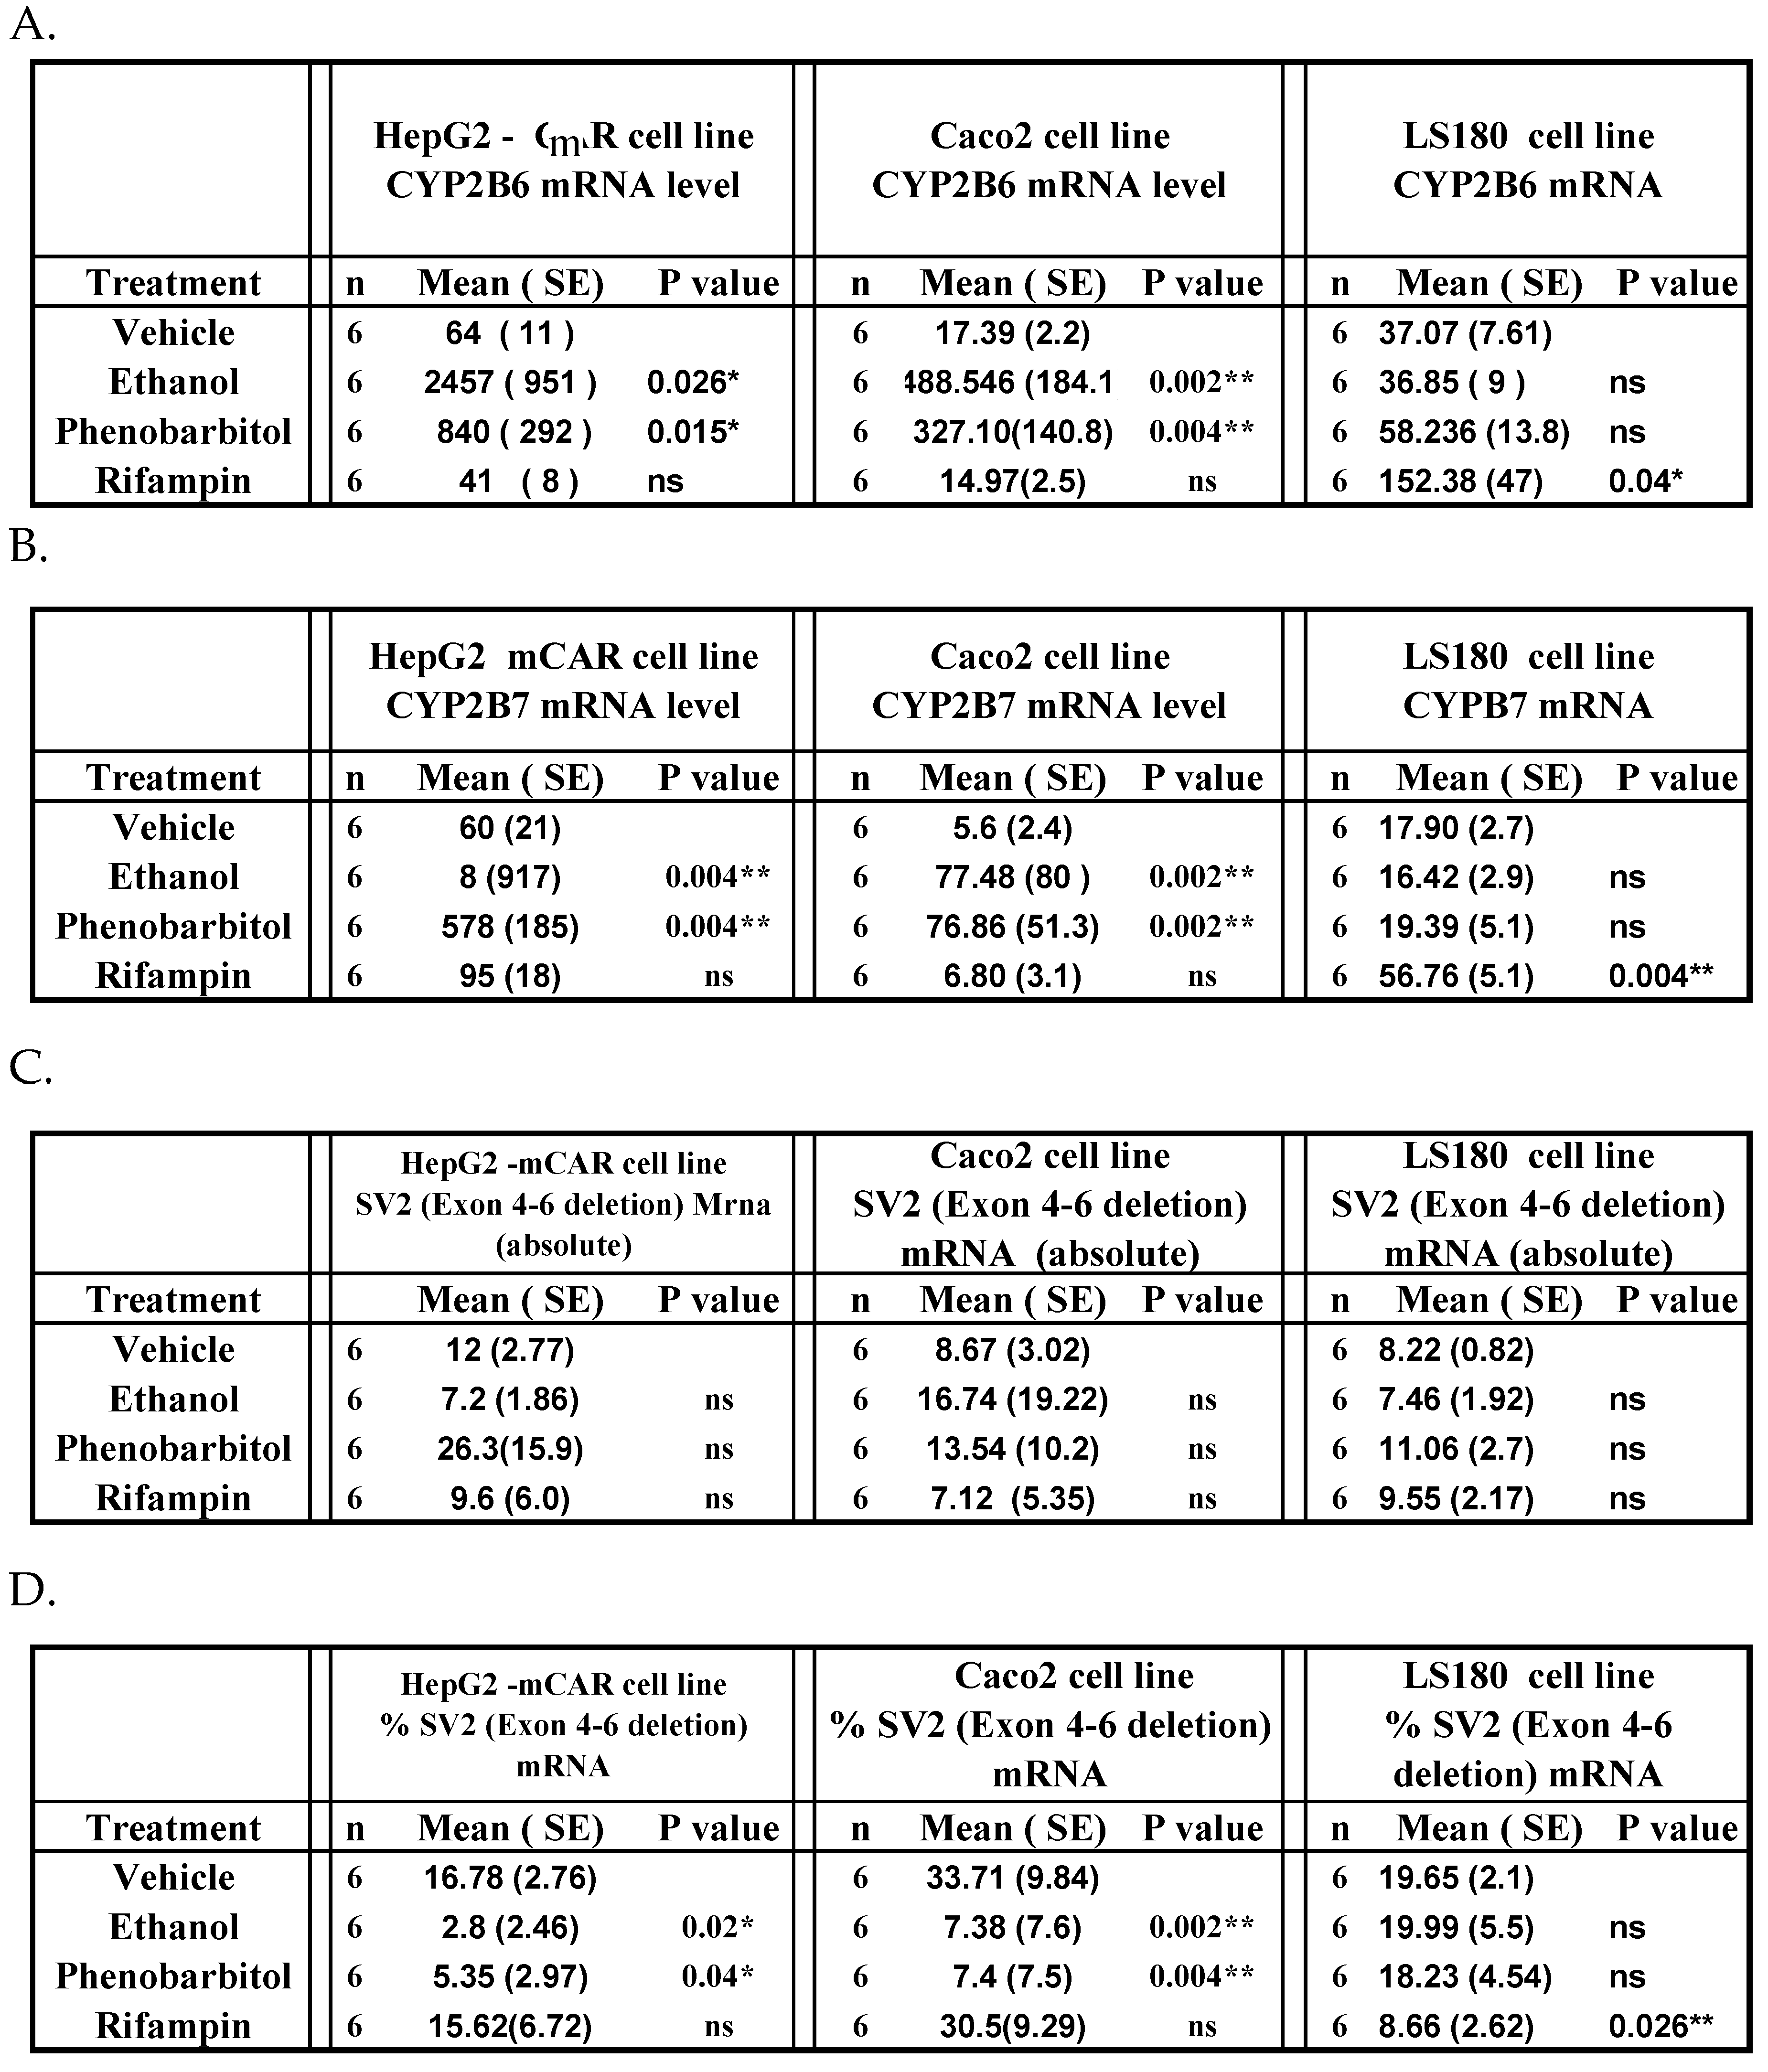
In HepG2-mCAR cells, ethanol and phenobarbital increased CYP2B6 mRNA expression by 35-fold (P = 0.026) and 10-fold (P = 0.015), respectively, compared with vehicle-treated controls (Figure 3A; Table 2A). Rifampin did not significantly alter CYP2B6 mRNA levels in HepG2-mCAR cells (P > 0.05). CYP2B6 mRNA remained undetectable in HepG2-wild cells under all treatment conditions.
CYP2B7 mRNA expression followed a pattern similar to CYP2B6. Ethanol treatment increased CYP2B7 mRNA approximately 12-fold in HepG2-mCAR cells, while phenobarbital produced a smaller but significant induction. Rifampin had no effect. CYP2B7 transcripts were not detected in HepG2-wild cells (Figure 3B; Table 2B).
3.4. Effects of Ethanol, Phenobarbital, and Rifampin on CYP2B6 and CYP2B7 mRNA in Intestinal Cell Lines
Caco-2 and LS-180 intestinal cell lines were treated under identical conditions.
In Caco-2 cells, ethanol and phenobarbital increased CYP2B6 mRNA expression by 27-fold (P = 0.002) and 18-fold (P = 0.004), respectively, compared with vehicle controls (Figure 4A; Table 2A). No significant induction was observed in LS-180 cells following ethanol or phenobarbital exposure.
3.5. Effects of Ethanol, Phenobarbital, and Rifampin on CYP2B6-SV2 mRNA Splicing
3.6. CYP2B6 Protein Detection in Hepatic and Intestinal Cell Lines
CYP2B6 protein levels were assessed by immunoblotting in hepatic and intestinal cell lysates. Recombinant CYP2B6 protein and human liver microsomes served as positive controls and were readily detected. However, CYP2B6 protein bands were not detectable in whole-cell lysates from any of the treated or untreated cell lines (Figure 6).
4. Discussion
In previous work using a human liver donor bank, we demonstrated a significant association between donor history of chronic ethanol consumption and increased hepatic CYP2B6 mRNA, protein expression, and catalytic activity. Given prior evidence that ethanol induces CYP2B-family enzymes in rodent hepatocytes and in vivo animal models, we hypothesized that ethanol would similarly enhance CYP2B6 expression in human-derived hepatic and intestinal in vitro systems. The present findings support this hypothesis by demonstrating that ethanol exposure markedly increases CYP2B6 and CYP2B7 mRNA expression in selected human cell models, with induction profiles resembling those produced by the prototypical CAR activator phenobarbital. Moreover, the differential responses observed across cell lines indicate that CAR-dependent regulatory mechanisms contribute substantially to ethanol-associated CYP2B induction, whereas PXR appears not to play a major role in ethanol-mediated responses. These observations are consistent with contemporary understanding of CAR-dominant regulation of CYP2B6 transcription in hepatic and intestinal systems (Kazmi et al., 2019; Negishi, 2020; Tolson & Wang, 2021).
A concentration of 100 mM ethanol was selected for induction experiments based on preliminary optimization showing maximal CYP2B6 mRNA induction under these conditions. While this concentration corresponds to blood ethanol levels achievable in heavy alcohol consumption, the present study did not directly quantify cell viability or stress responses under prolonged ethanol exposure. Thus, although gross loss of adherence was not observed at 100 mM, additional viability assessments (e.g., MTT or trypan blue exclusion assays) and evaluation of cellular stress markers would further clarify whether ethanol-induced CYP2B6 expression reflects a specific regulatory response rather than a secondary effect of cellular stress. This limitation should be addressed in future studies. Similar concerns regarding ethanol-associated stress signaling influencing nuclear receptor pathways have been raised in recent mechanistic investigations (Kwak et al., 2020; Wang et al., 2022).
Basal gene expression profiling demonstrated that CYP2B6 and CYP2B7 transcripts were absent in HepG2-wild cells but readily detected in HepG2-mCAR cells, confirming that CAR expression is necessary for measurable CYP2B transcription in this model. Interestingly, LS-180 cells displayed constitutive CYP2B6 and CYP2B7 expression despite lacking detectable CAR mRNA, indicating that factors beyond CAR expression alone influence basal CYP2B gene regulation. PXR expression was highest in LS-180 cells, consistent with the selective induction of CYP2B6 by rifampin in this line and supporting a functional PXR pathway. Together, these findings highlight distinct nuclear receptor expression profiles across commonly used hepatic and intestinal cell models and emphasize the importance of selecting appropriate systems for mechanistic induction studies (Drozdzik et al., 2021; Di Paolo et al., 2023).
The strong induction of CYP2B6 and CYP2B7 mRNA by ethanol and phenobarbital in HepG2-mCAR cells supports CAR involvement in ethanol-mediated CYP2B regulation. However, HepG2-mCAR cells express murine rather than human CAR. Species-specific differences in CAR ligand responsiveness are well documented, and murine CAR can be activated by ligands that do not activate human CAR (Saito et al., 2020). Consequently, confirmation of these findings in HepG2 cells expressing human CAR or in primary human hepatocytes will be necessary to fully establish human relevance. Notably, Caco-2 cells, which express endogenous human CAR, also showed CYP2B6 induction by ethanol and phenobarbital, whereas LS-180 cells lacking CAR expression did not. This pattern supports participation of human CAR in ethanol responsiveness, although the magnitude of Caco-2 induction contrasts with prior reports suggesting limited CAR responsiveness in standard Caco-2 models (Janssen et al., 2021; Zu Schwabedissen et al., 2019). Differences in passage number, culture duration, or basal CAR expression may account for these discrepancies, and further validation using CAR inhibition or knockdown approaches would clarify CAR dependence in this system.
The delayed onset of CYP2B6 induction, requiring 72 h of ethanol exposure, suggests that ethanol may not act as a direct CAR ligand but rather as an indirect activator requiring intermediate signaling or protein synthesis events. Phenobarbital is also recognized as an indirect CAR activator, yet typically produces measurable induction within 24–48 h in CAR-expressing systems. The prolonged induction period observed here therefore suggests additional upstream regulatory processes. Experiments incorporating protein synthesis inhibitors or ethanol metabolism inhibitors could help distinguish whether newly synthesized mediators or ethanol metabolites such as acetaldehyde contribute to CAR activation in this context. Indirect CAR activation mechanisms of this type have been described in recent molecular studies (Mutoh et al., 2019; Omiecinski et al., 2021).
Although substantial CYP2B6 mRNA induction was demonstrated, CYP2B6 protein could not be detected in whole-cell lysates. CYP2B6 is an endoplasmic reticulum–associated microsomal enzyme, and detection sensitivity is markedly improved when microsomal fractions are enriched. Therefore, absence of detectable protein in total lysates does not exclude protein induction. Future experiments using microsomal fractionation and human liver microsome positive controls are required to establish whether ethanol-induced mRNA changes translate into increased functional CYP2B6 protein (Klein et al., 2020; Furge & Guengerich, 2020).
The present study also evaluated ethanol effects on CYP2B6 alternative splicing. CYP2B6-SV2, a common aberrant splice variant, was detected in all CYP2B-expressing cell lines at proportions similar to those observed in human liver. Ethanol and phenobarbital did not alter absolute CYP2B6-SV2 abundance, but induction preferentially increased normally spliced CYP2B6 mRNA, reducing the relative proportion of aberrant transcripts. Coupling between transcriptional activation and splice-site selection has been increasingly recognized in recent gene-regulation studies and may contribute to CAR-associated modulation of CYP2B6 splicing (Hollenberg & Strobel, 2020; Zanger & Schwab, 2019).
Finally, the CYP2B7 gene exhibited induction patterns similar to CYP2B6. Although CYP2B7 is often classified as a pseudogene, emerging evidence suggests potential transcriptional activity and possible functional relevance in certain tissues, warranting further mechanistic exploration (Hollenberg & Strobel, 2020).
In conclusion, the present findings demonstrate that pharmacologically relevant ethanol exposure enhances CYP2B6 and CYP2B7 transcription in human-derived hepatic and intestinal cell models, primarily through CAR-associated regulatory mechanisms. Future studies employing human CAR expression systems, microsomal protein quantification, viability validation, and primary human hepatocytes will be essential to fully establish mechanistic and clinical relevance.
5. Conclusions
This study demonstrates that ethanol exposure increases CYP2B6 and CYP2B7 mRNA expression in selected human-derived hepatic and intestinal cell models commonly used to investigate drug-metabolizing enzyme regulation. The observed induction patterns, together with differential responsiveness across cell lines, support a predominant role for constitutive androstane receptor–associated signaling in ethanol-mediated CYP2B regulation, while pregnane X receptor–dependent pathways appear not to contribute substantially to this response. These findings are consistent with contemporary evidence identifying CAR as a principal regulator of CYP2B6 transcription in human hepatic and intestinal systems (Kazmi et al., 2019; Negishi et al., 2020; Tolson and Wang, 2021).
The requirement for prolonged ethanol exposure to achieve induction suggests that ethanol likely acts through indirect activation mechanisms rather than direct receptor–ligand binding. Indirect CAR activation by small xenobiotics and metabolic intermediates has been reported in recent mechanistic studies, supporting the plausibility of delayed signaling-mediated activation rather than direct ligand binding (Hernandez et al., 2020; Shih et al., 2022).
Although significant transcriptional induction was observed, CYP2B6 protein could not be detected in whole-cell lysates, indicating that future studies employing microsomal enrichment and functional activity assays will be necessary to confirm translation of mRNA changes into enzymatic activity. This approach aligns with current best practices in CYP protein quantification in low-expression in vitro systems (Janssen et al., 2021).
Additionally, ethanol did not alter absolute levels of the CYP2B6-SV2 splice variant but preferentially increased normally spliced CYP2B6 transcripts, suggesting coordinated regulation of transcription and pre-mRNA processing. Emerging evidence indicates that nuclear receptor–mediated transcription and alternative splicing are functionally linked processes in xenobiotic response pathways (Di Paolo et al., 2023).
CYP2B7 exhibited induction profiles similar to CYP2B6, supporting shared regulatory control despite its current classification as a pseudogene. Recent genomic analyses suggest that selected CYP pseudogenes may retain regulatory or context-dependent functional relevance, warranting continued investigation (Drozdzik et al., 2021).
Overall, these findings provide mechanistic insight into ethanol-associated variability in CYP2B-mediated drug metabolism. Further studies using human CAR expression systems, primary human hepatocytes, microsomal protein quantification, and cell viability assessments will be important to confirm physiological relevance and clinical implications for alcohol–drug interactions (Negishi et al., 2020; Di Paolo et al., 2023).
6. Patents
No patents have resulted from the work reported in this manuscript.
Author Contributions
Conceptualization, A.H.A.; methodology, A.H.A.; validation, A.H.A.; formal analysis, A.H.A.; investigation, A.H.A.; resources, A.H.A.; data curation, A.H.A.; writing—original draft preparation, A.H.A.; writing—review and editing, A.H.A.; visualization, A.H.A.; supervision, A.H.A.; project administration, A.H.A. The author has read and agreed to the published version of the manuscript.
Funding
This research received no external funding. The APC was not funded by any external agency.
Institutional Review Board Statement
Not applicable. This study did not involve human participants or animals. All experiments were conducted using established commercial human cell lines.
Informed Consent Statement
Not applicable.
Data Availability Statement
The data supporting the findings of this study are available from the corresponding author upon request.
Acknowledgments
The author acknowledges the College of Pharmacy, Shaqra University, for providing laboratory infrastructure support. During the preparation of this manuscript, the author used ChatGPT (OpenAI, GPT-5.2) for language polishing and formatting assistance. The author reviewed and edited the generated content and takes full responsibility for the final manuscript.
Conflicts of Interest
The author declares no conflicts of interest. The funders had no role in the design of the study; in the collection, analyses, or interpretation of data; in the writing of the manuscript; or in the decision to publish the results.
Abbreviations
| Abbreviation | Meaning |
| CAR | Constitutive Androstane Receptor |
| PXR | Pregnane X Receptor |
| CYP | Cytochrome P450 |
| DMEM | Dulbecco’s Modified Eagle’s Medium |
| DMSO | Dimethyl Sulfoxide |
| mRNA | Messenger Ribonucleic Acid |
| PCR | Polymerase Chain Reaction |
| ER | Endoplasmic Reticulum |
References
- Kazmi, F.; Barbara, J.E.; Yerino, P.; Parkinson, A. Constitutive androstane receptor (CAR)–mediated regulation of CYP2B6: Mechanisms and implications for drug interactions. Drug Metab. Rev. 2019, 51, 113–129. [Google Scholar]
- Negishi, M. Phenobarbital and CAR-mediated induction of drug metabolism. Drug Metab. Dispos. 2020, 48, 297–302. [Google Scholar]
- Tolson, A.H.; Wang, H. Regulation of drug-metabolizing enzymes by xenobiotic receptors: PXR and CAR. Adv. Drug Deliv. Rev. 2021, 116, 115–136. [Google Scholar] [CrossRef] [PubMed]
- Hernandez, J.P.; Mota, L.C.; Baldwin, W.S. Activation of CAR and PXR by small xenobiotics and indirect signaling mechanisms. Toxicol. Sci. 2020, 176, 44–58. [Google Scholar]
- Shih, H.; Pickwell, G.; Guo, L. Xenobiotic-mediated modulation of nuclear receptor signaling in hepatic in vitro systems. Arch. Toxicol. 2022, 96, 981–995. [Google Scholar]
- Drozdzik, M.; Gröer, C.; Penski, J.; Lapczuk, J.; Oswald, S. Intestinal drug-metabolizing enzymes and transporters: Relevance to first-pass metabolism. Clin. Pharmacokinet. 2021, 60, 1053–1082. [Google Scholar]
- Di Paolo, A.; Tugnoli, V.; Evangelisti, C. Regulation of intestinal CYP expression and impact on oral drug bioavailability. Pharmaceutics 2023, 15, 2124. [Google Scholar]
- Saito, T.; Yanai, K.; Aoyama, T. Species differences in CAR ligand specificity and transcriptional activation. Biochem. Pharmacol. 2020, 178, 114093. [Google Scholar]
- Mutoh, S.; Sobhany, M.; Moore, R.; Negishi, M. Phenobarbital-type CAR activation: Indirect signaling mechanisms revisited. Mol. Pharmacol. 2019, 96, 189–197. [Google Scholar]
- Omiecinski, C.J.; Venkatesh, M.; Kirilov, P. Indirect activation of nuclear receptors by xenobiotics: Emerging mechanisms. Toxicol. Appl. Pharmacol. 2021, 414, 115417. [Google Scholar]
- Klein, K.; Thomas, M.; Winter, S.; Nussler, A.K.; Schwab, M.; Zanger, U.M. P450 expression in human hepatocyte and microsomal systems. Drug Metab. Dispos. 2020, 48, 387–398. [Google Scholar]
- Furge, L.L.; Guengerich, F.P. Detection and quantification of cytochrome P450 enzymes in microsomal systems. Methods Mol. Biol. 2020, 2084, 9–29. [Google Scholar]
- Zanger, U.M.; Schwab, M. Cytochrome P450 enzymes in drug metabolism: Regulation and variability. Pharmacol. Ther. 2019, 199, 47–59. [Google Scholar]
- Hollenberg, P.F.; Strobel, H.W. Human CYP2B6 and CYP2B7: Genomic organization and functional considerations. Chem. Biol. Interact. 2020, 315, 108885. [Google Scholar]
- Kwak, M.K.; Kang, K.W.; Kim, S.G. Ethanol modulation of nuclear receptor signaling pathways in hepatic systems. Toxicol. Lett. 2020, 319, 111–118. [Google Scholar]
- Wang, X.; Li, Y.; Li, H.; Chen, X. Alcohol exposure alters CAR-dependent transcriptional networks in hepatic cells. Cells 2022, 11, 3478. [Google Scholar]
- Janssen, N.; Hesselink, D.A.; Koster, R.A. Limited CAR responsiveness in Caco-2 intestinal cell models. Arch. Toxicol. 2021, 95, 907–922. [Google Scholar] [CrossRef] [PubMed]
- Zu Schwabedissen, H.E.M.; Kroemer, H.K.; Jedlitschky, G. CAR and PXR signaling in intestinal cell models. Clin. Pharmacol. Ther. 2019, 106, 992–1002. [Google Scholar]
Figure 1.
Basal mRNA levels in human hepatic and intestinal cell lines for pregnane X receptor (PXR) and constitutive androstane receptor (CAR) (A), CYP2B6 and CYP2B7 (B) and CYP2B6-SV2 (Exons 4-6 deletion) (C). Values were measured by quantitative RT-PCR and (except for CYP2B6-SV2%) are given in arbitrary units (x10-6) relative to amounts of 18S rRNA measured in each sample. (n = 6 flasks per treatment; “nd” = not detected).
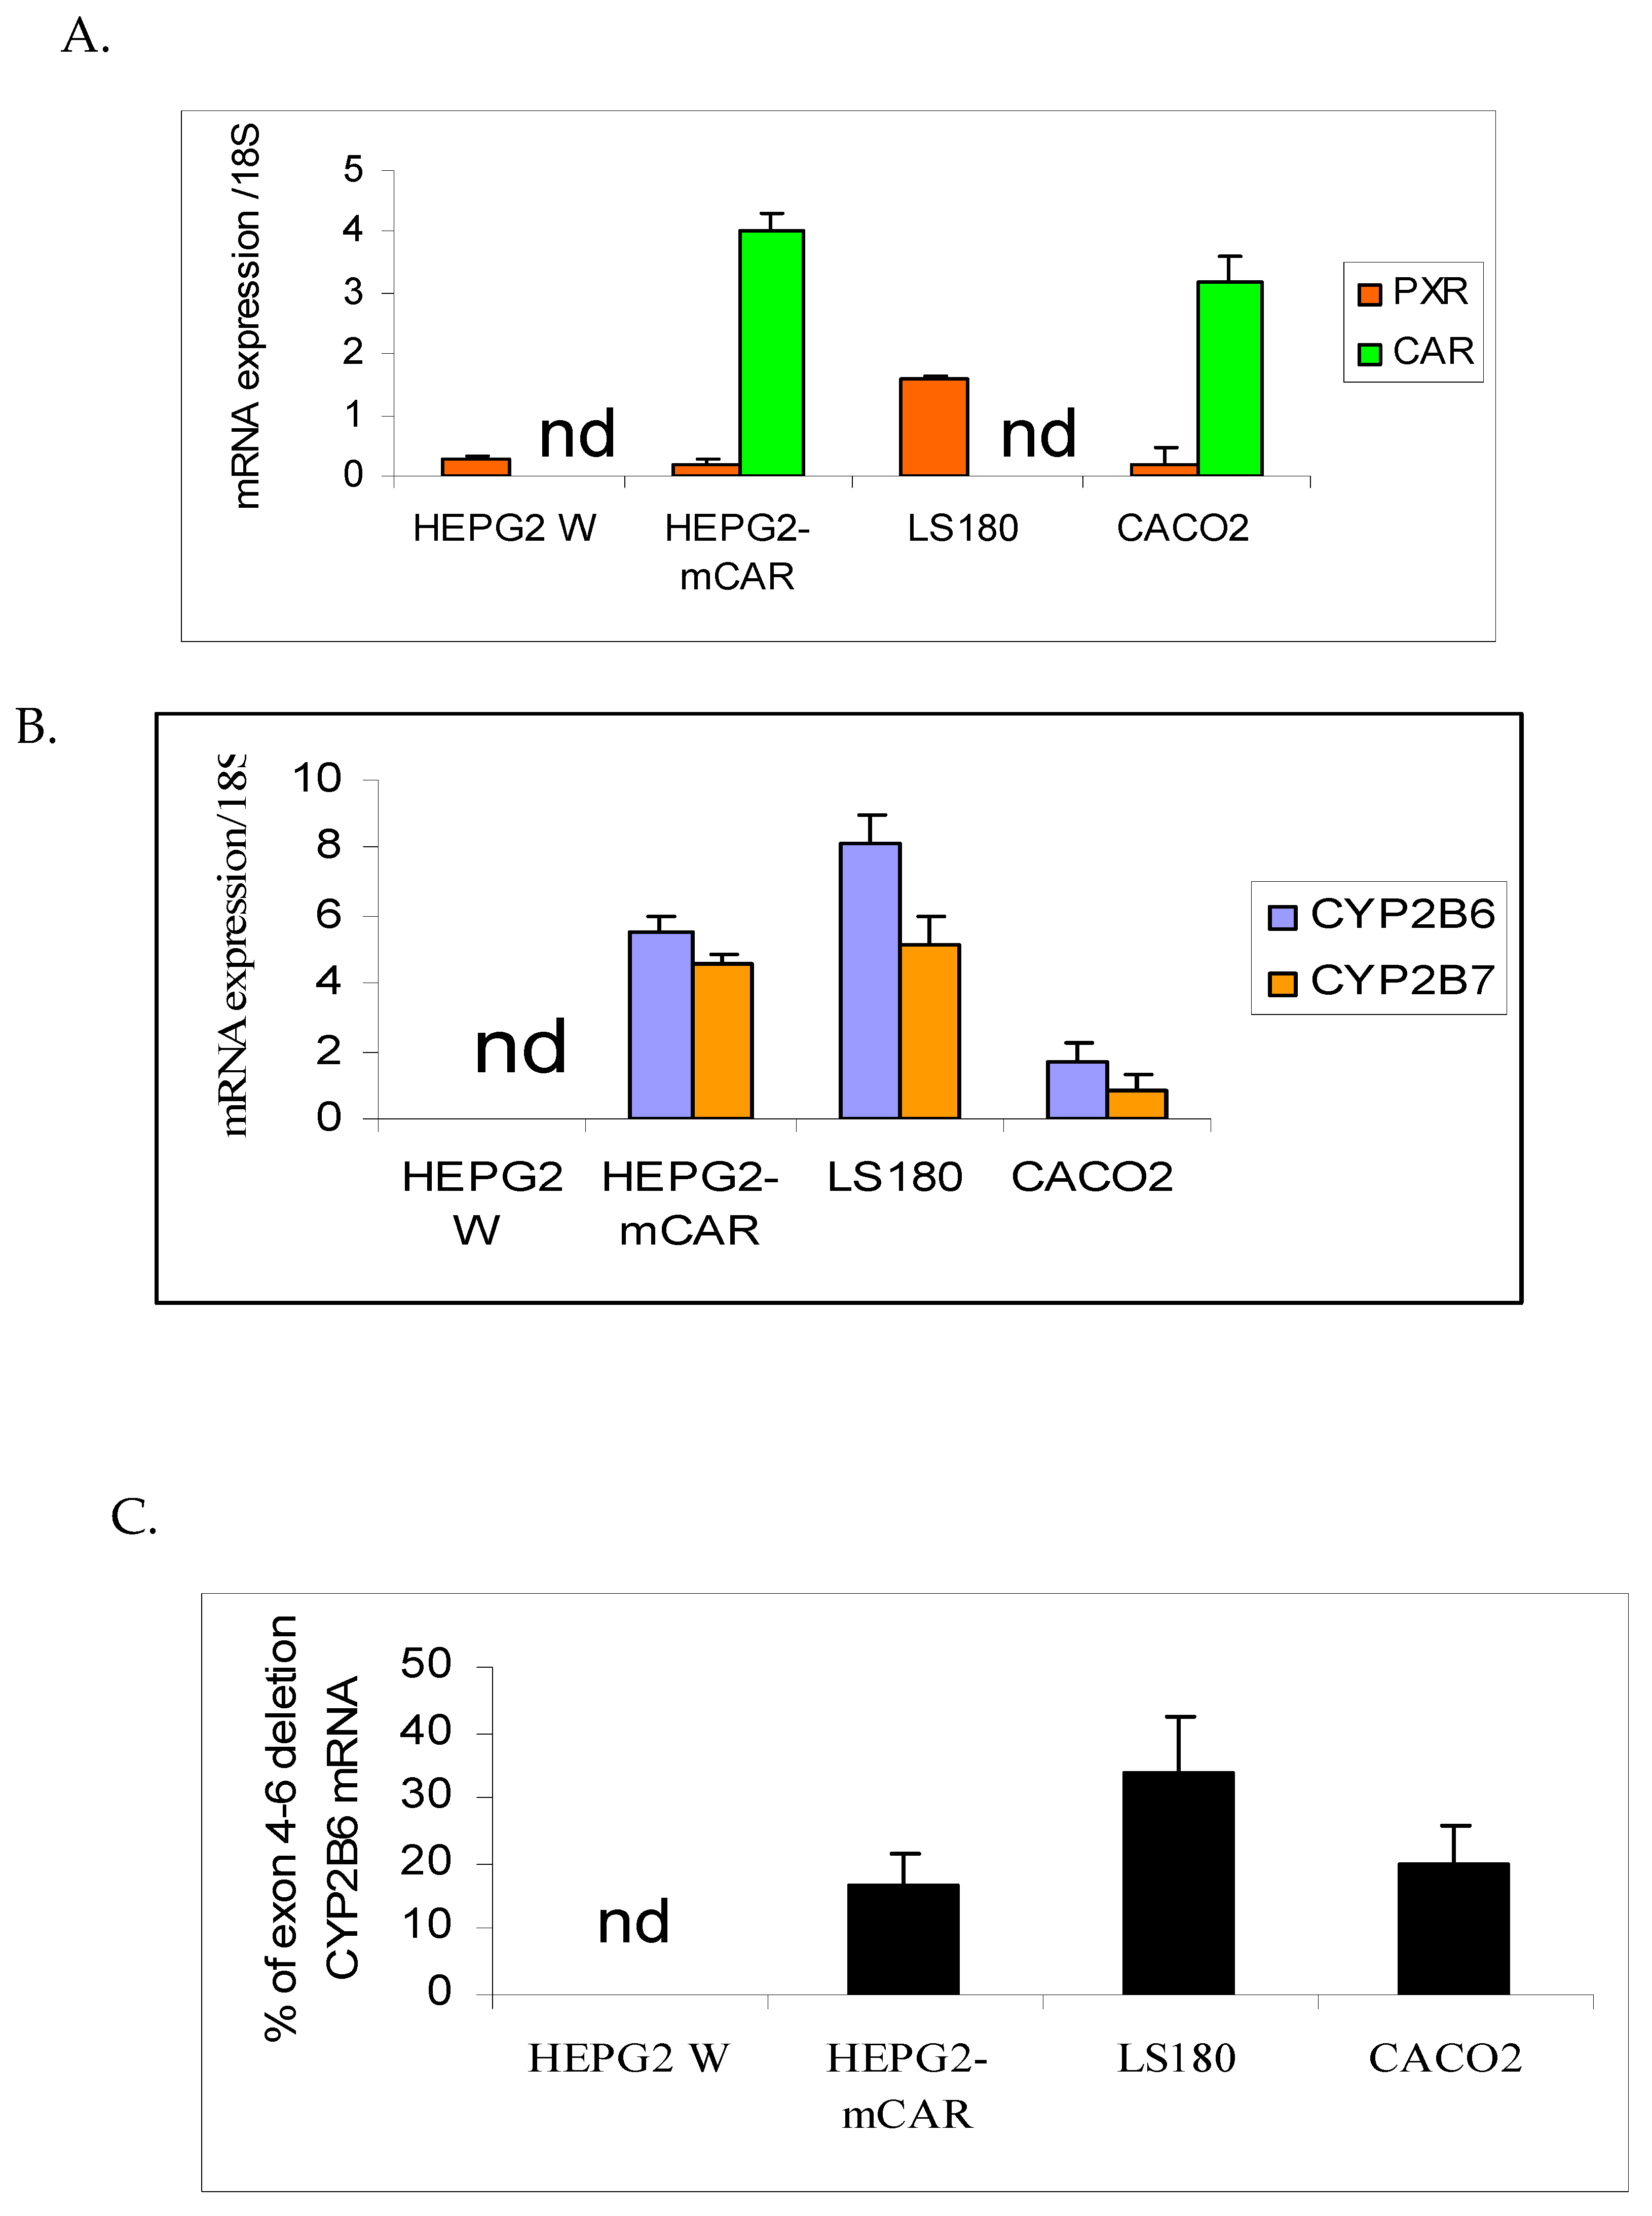
Figure 2.
Concentration (A) and time (B) dependent effects of ethanol treatment on CYP2B6 mRNA levels in HepG2-mCAR cell line. Values were measured by quantitative RT-PCR, normalized to amounts of 18S rRNA measured in each sample and then expressed as a ratio of the vehicle (0.5% DMSO) treatment value. (n = 3 flasks per treatment; *P<0.05 vs vehicle).
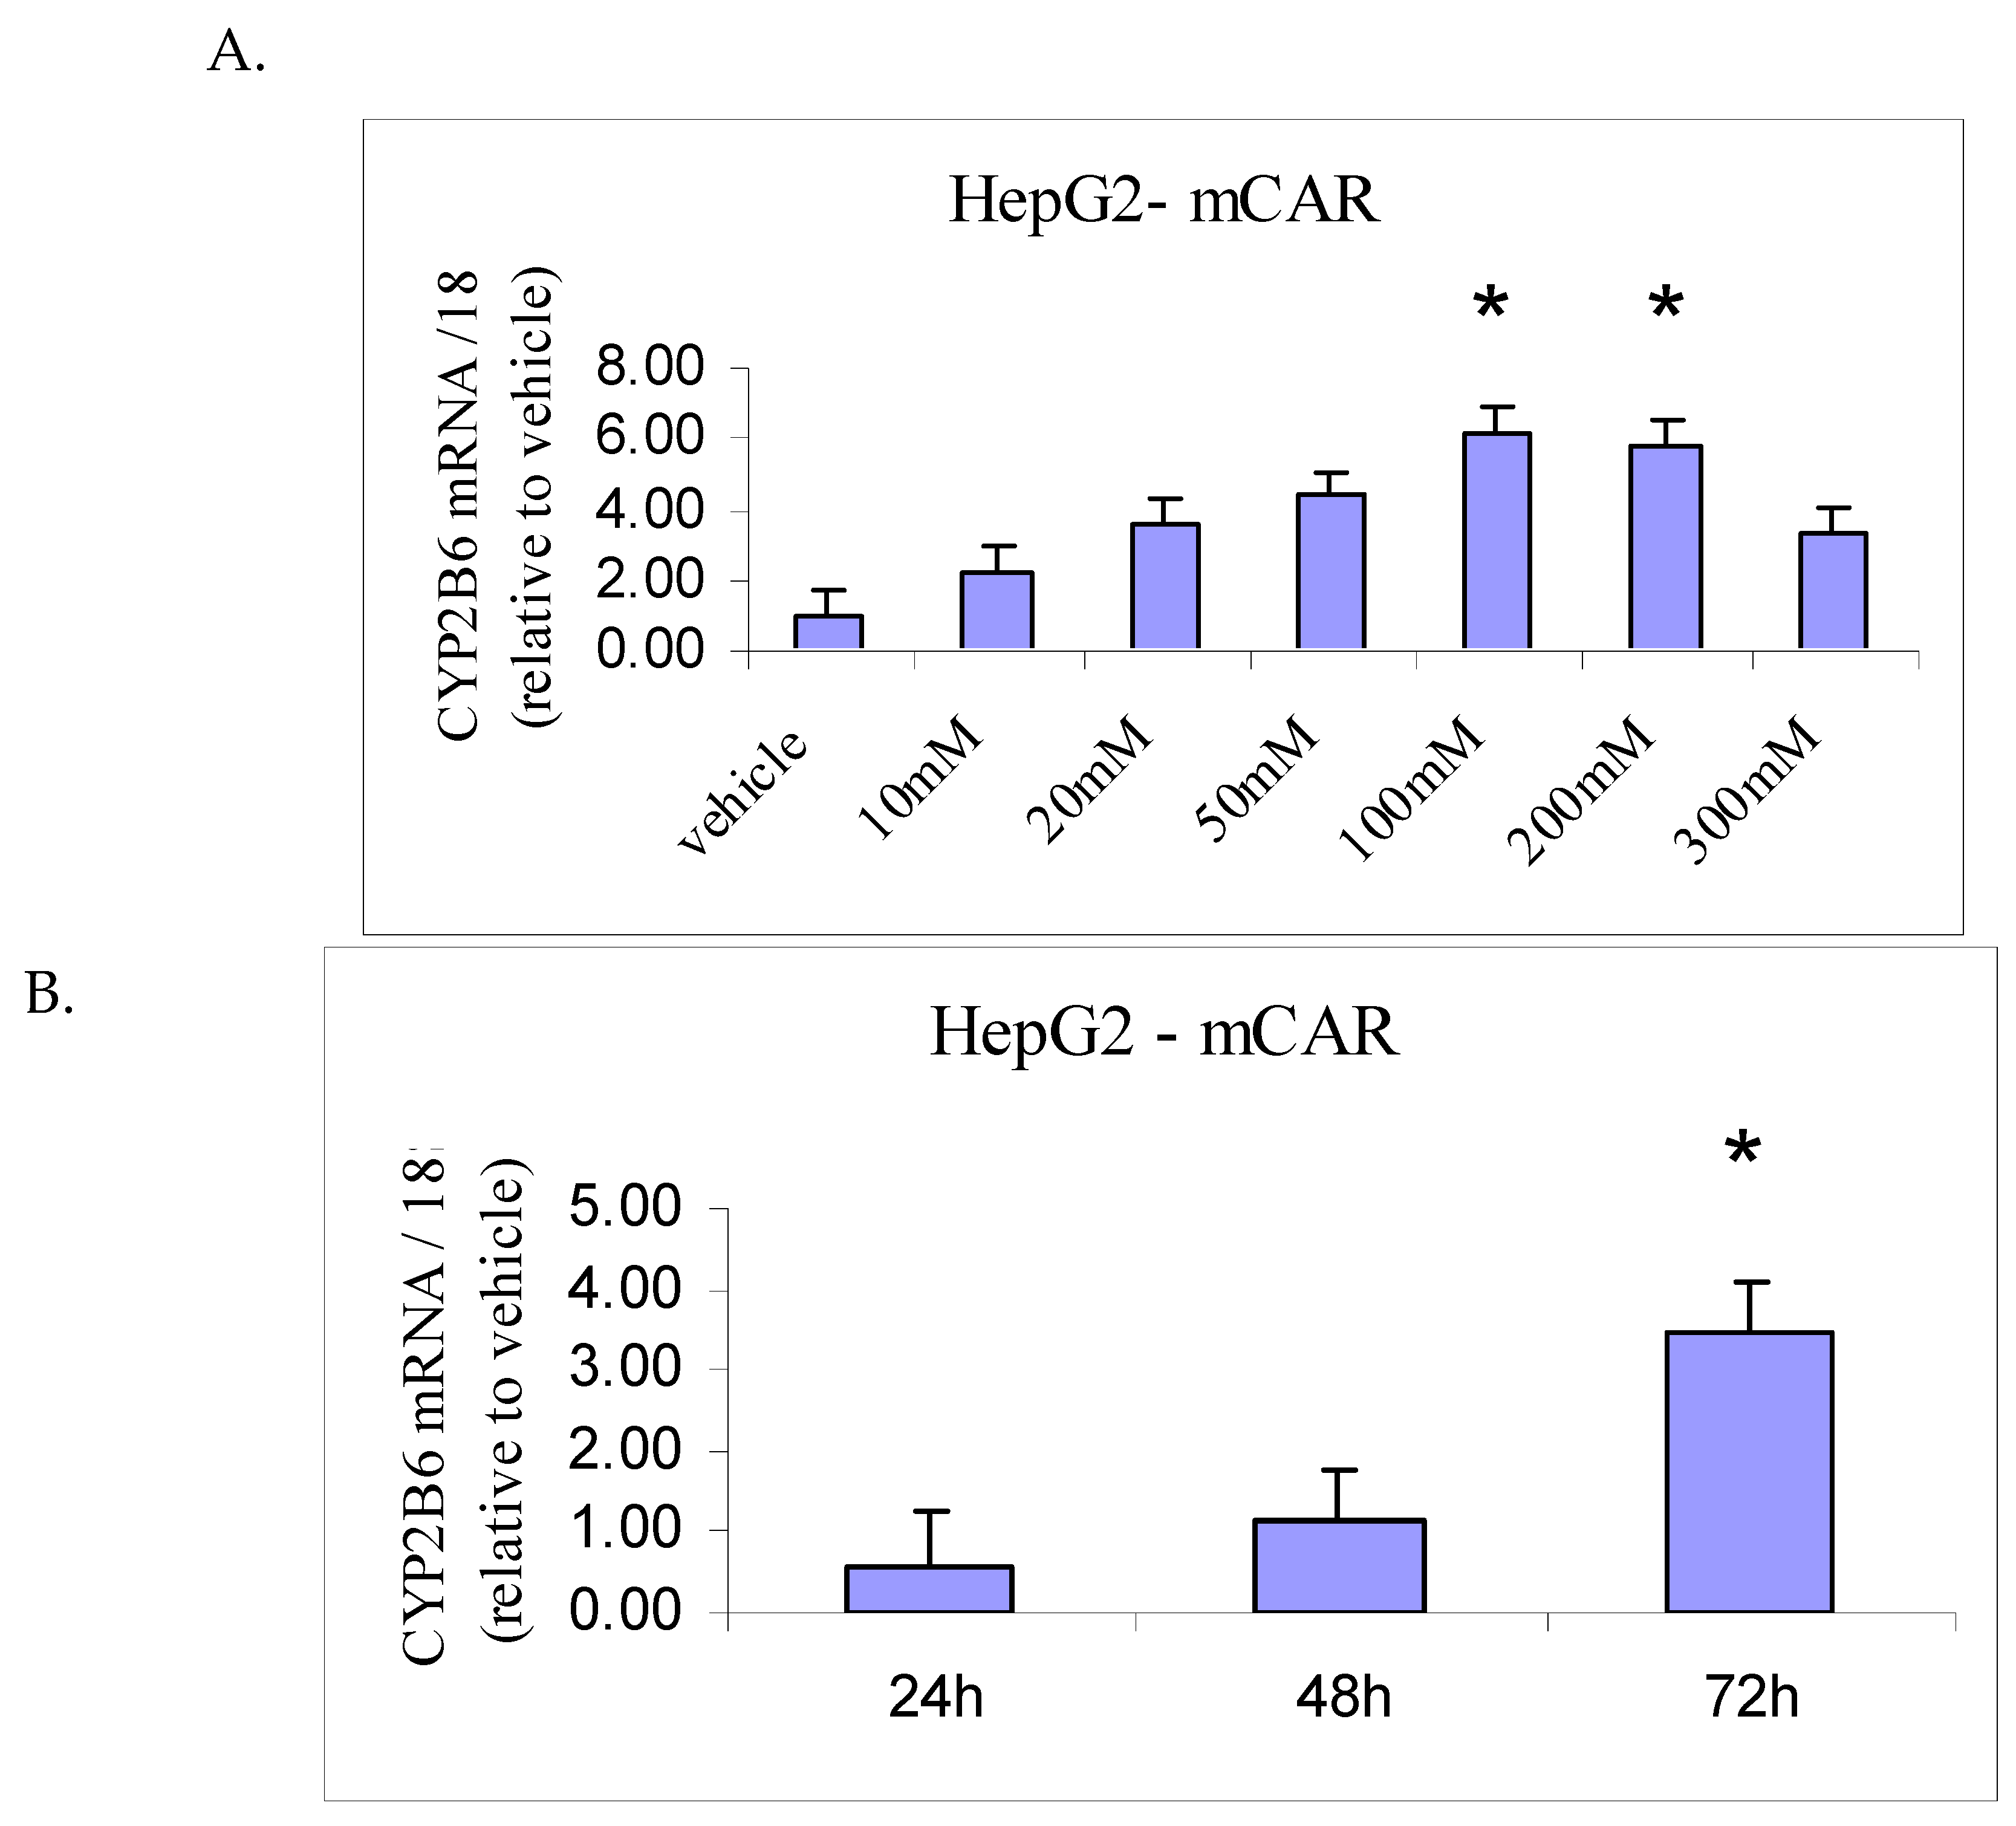
Figure 3.
Effect of 72 hours treatment of HepG2-mCAR and HepG2-wild cell lines with ethanol, phenobarbital (CAR inducer), and rifampin (PXR inducer) on CYP2B6 mRNA (A) and CYP2B7 mRNA (B). Values were measured by quantitative RT-PCR and are given in arbitrary units relative to amounts of 18S rRNA measured in each sample. (n = 6 flasks per treatment; *P<0.05 vs vehicle; “nd” = not detected). .
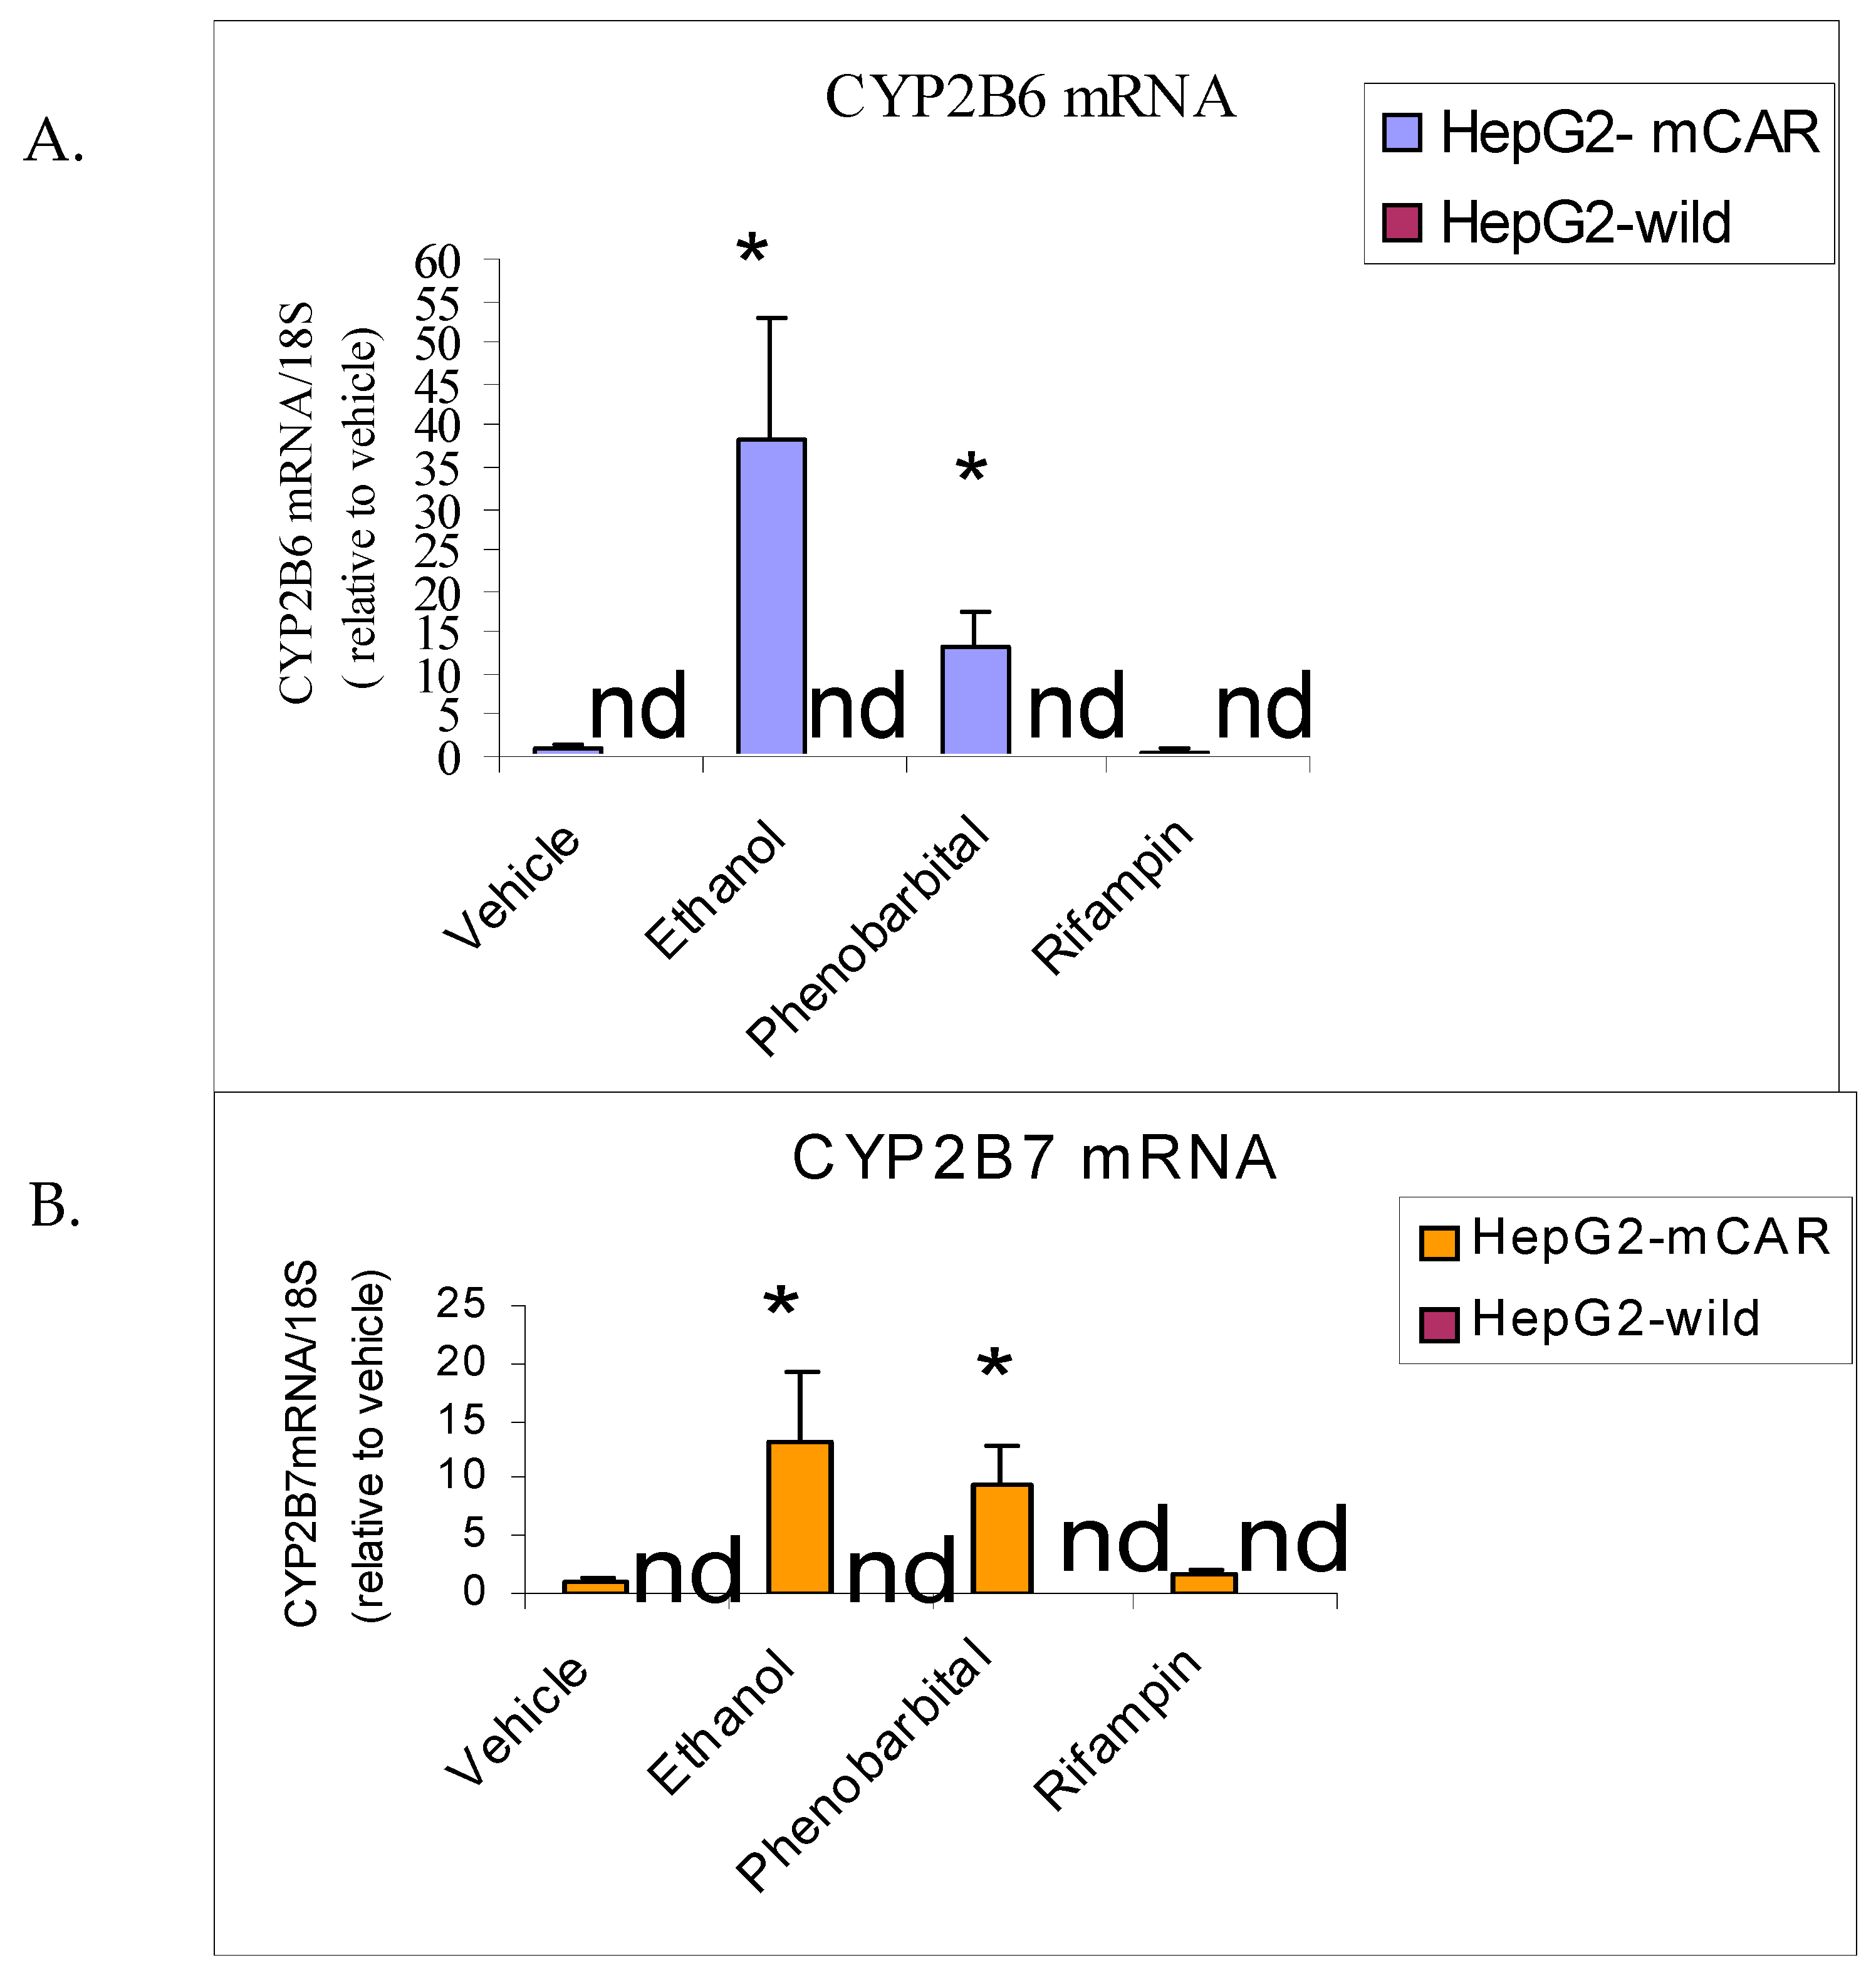
Figure 4.
Effect of 72 hours treatment of Caco2 (hCAR>>hPXR) and LS180 (hPXR>>hCAR) human intestinal cell lines with ethanol, phenobarbital (CAR inducer), and rifampin (PXR inducer) on CYP2B6 mRNA (A) and CYP2B7 mRNA (B). Values were measured by quantitative RT-PCR and are given in arbitrary units relative to amounts of 18S rRNA measured in each sample. (n = 6 flasks per treatment; *P<0.05 vs vehicle).
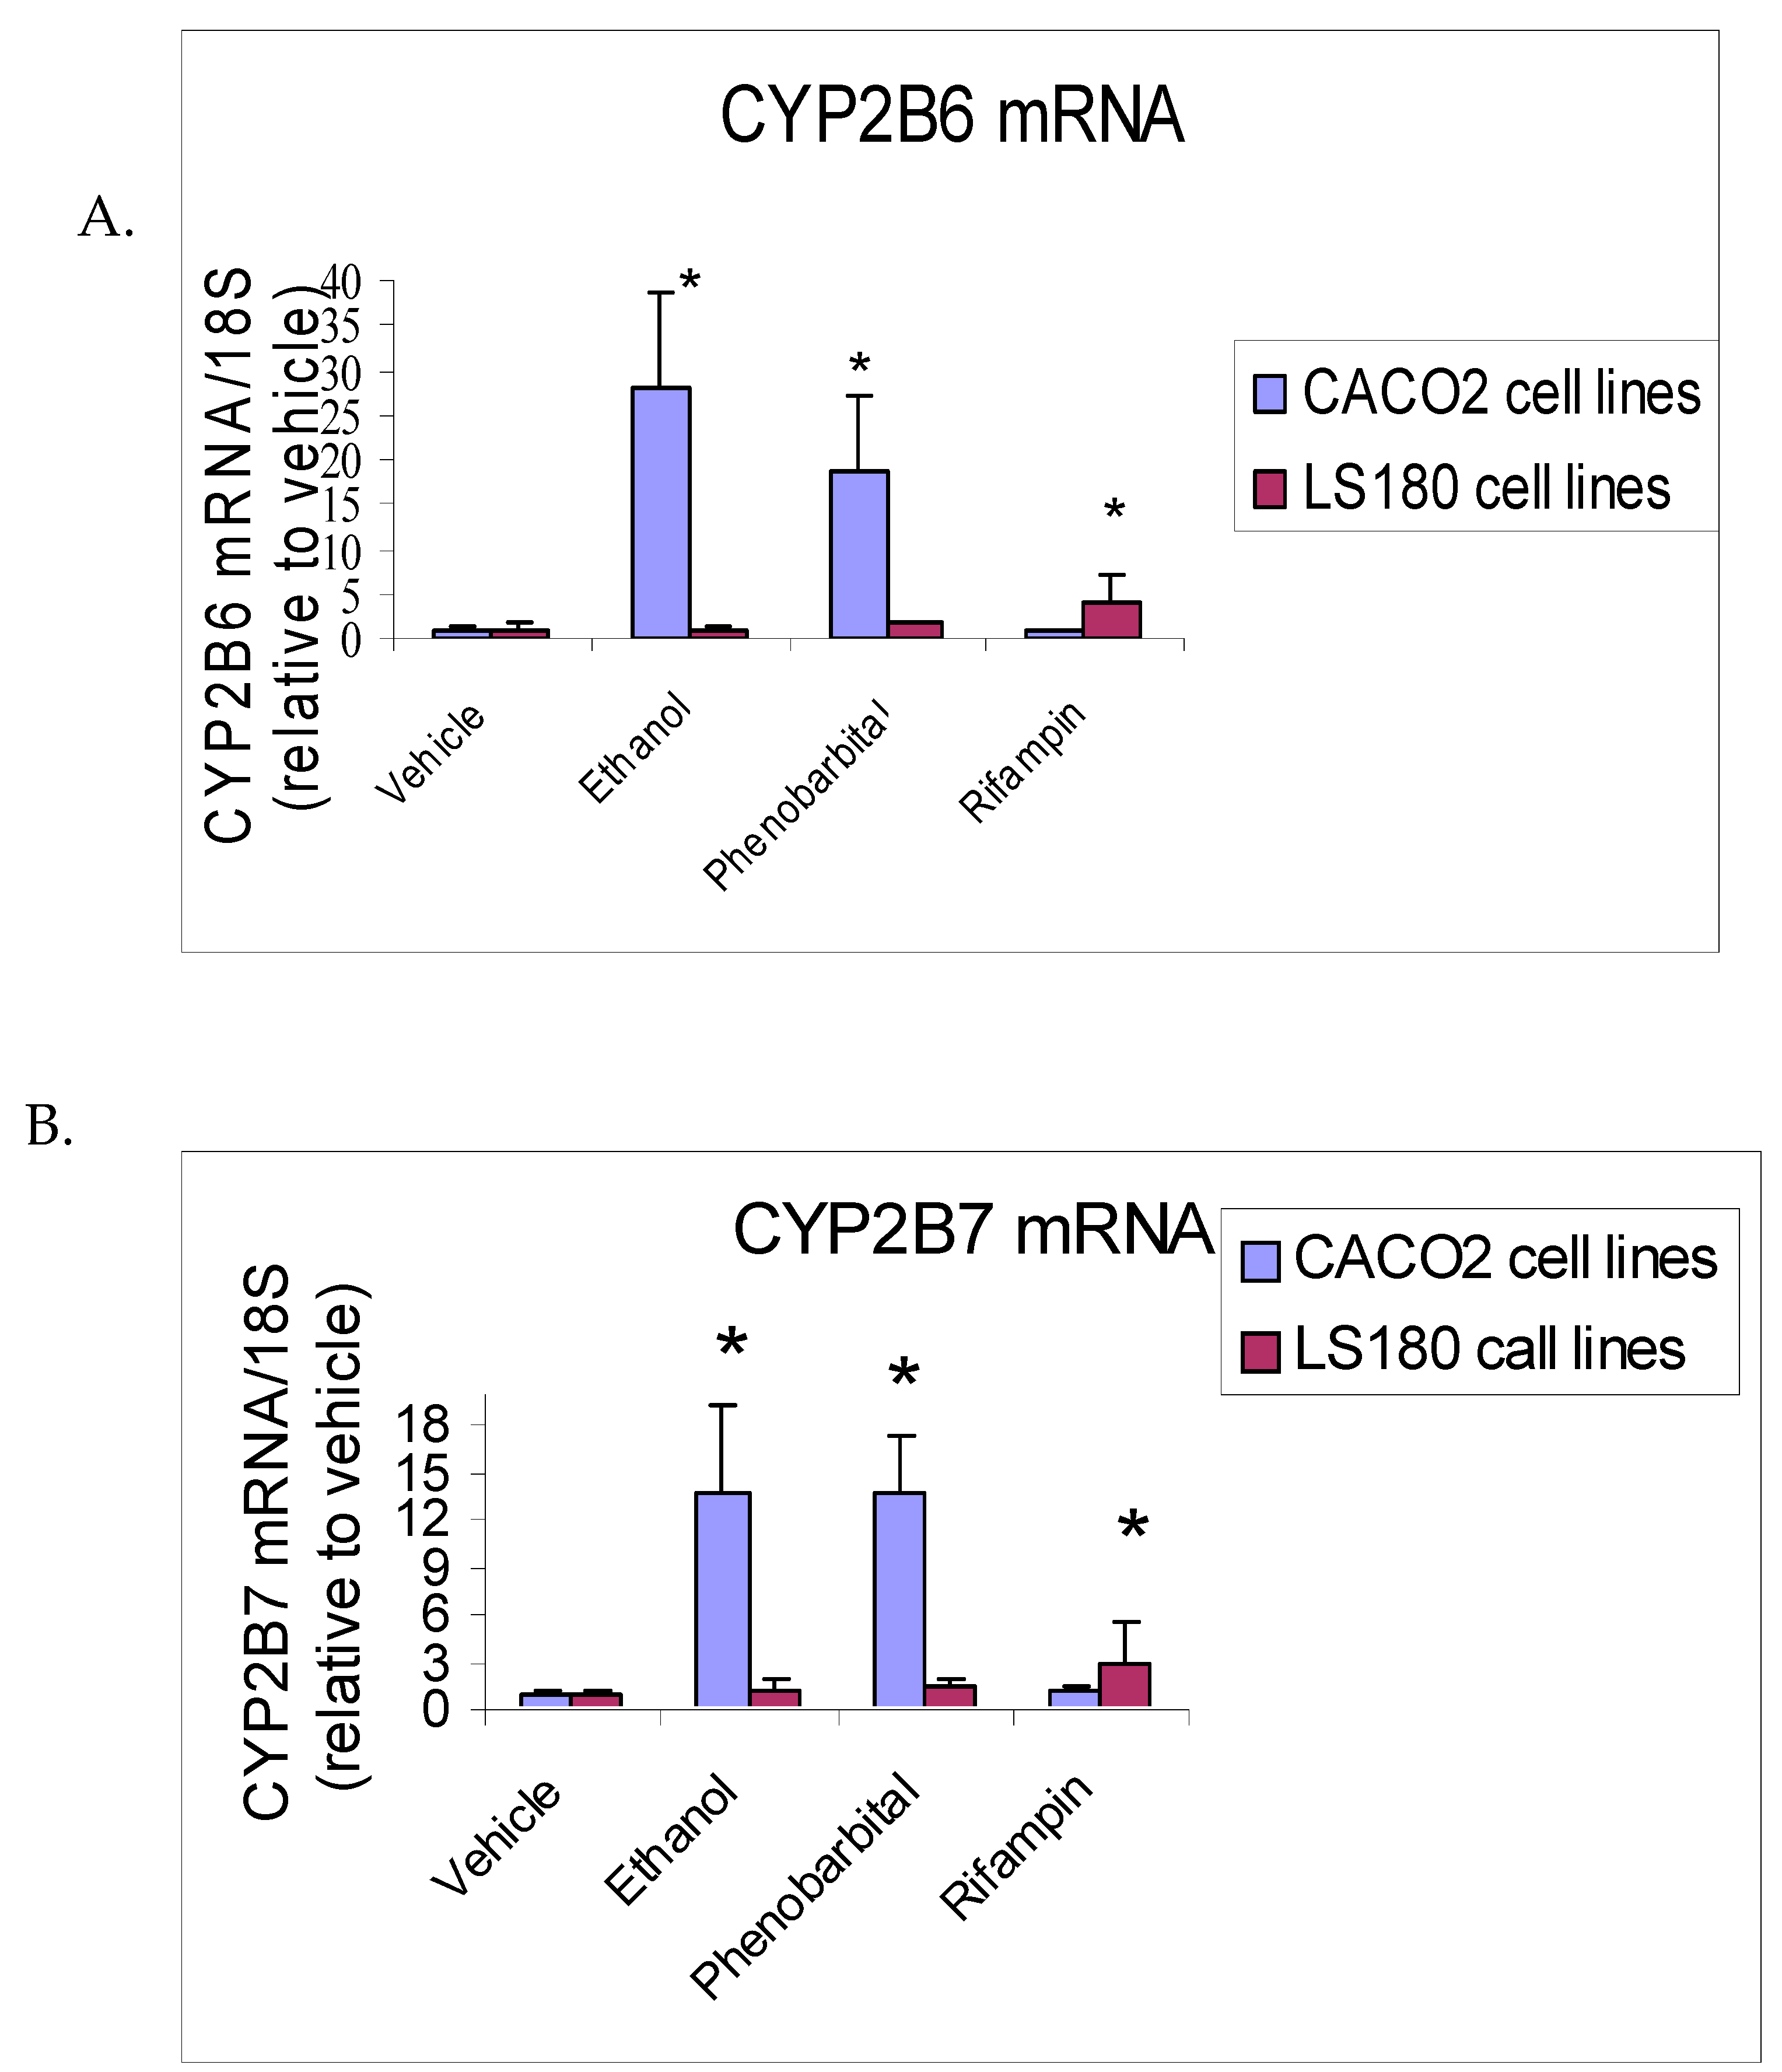
Figure 5.
Effect of 72 hours treatment of HepG2-mCAR, Caco2 (hCAR>>hPXR) and LS180 (hPXR>>hCAR) human intestinal cell lines with ethanol, phenobarbital (CAR inducer), and rifampin (PXR inducer) on CYP2B6-SV2 mRNA (A) and CYP2B6-SV2% (B). Values were measured by quantitative RT-PCR and are given in arbitrary units relative to amounts of 18S rRNA (x10-6) measured in each sample (CYP2B6-SV2) or as a percent of total CYP2B6 mRNA measured (CYP2B6-SV2%). (n = 6 flasks per treatment; *P<0.05 vs vehicle).
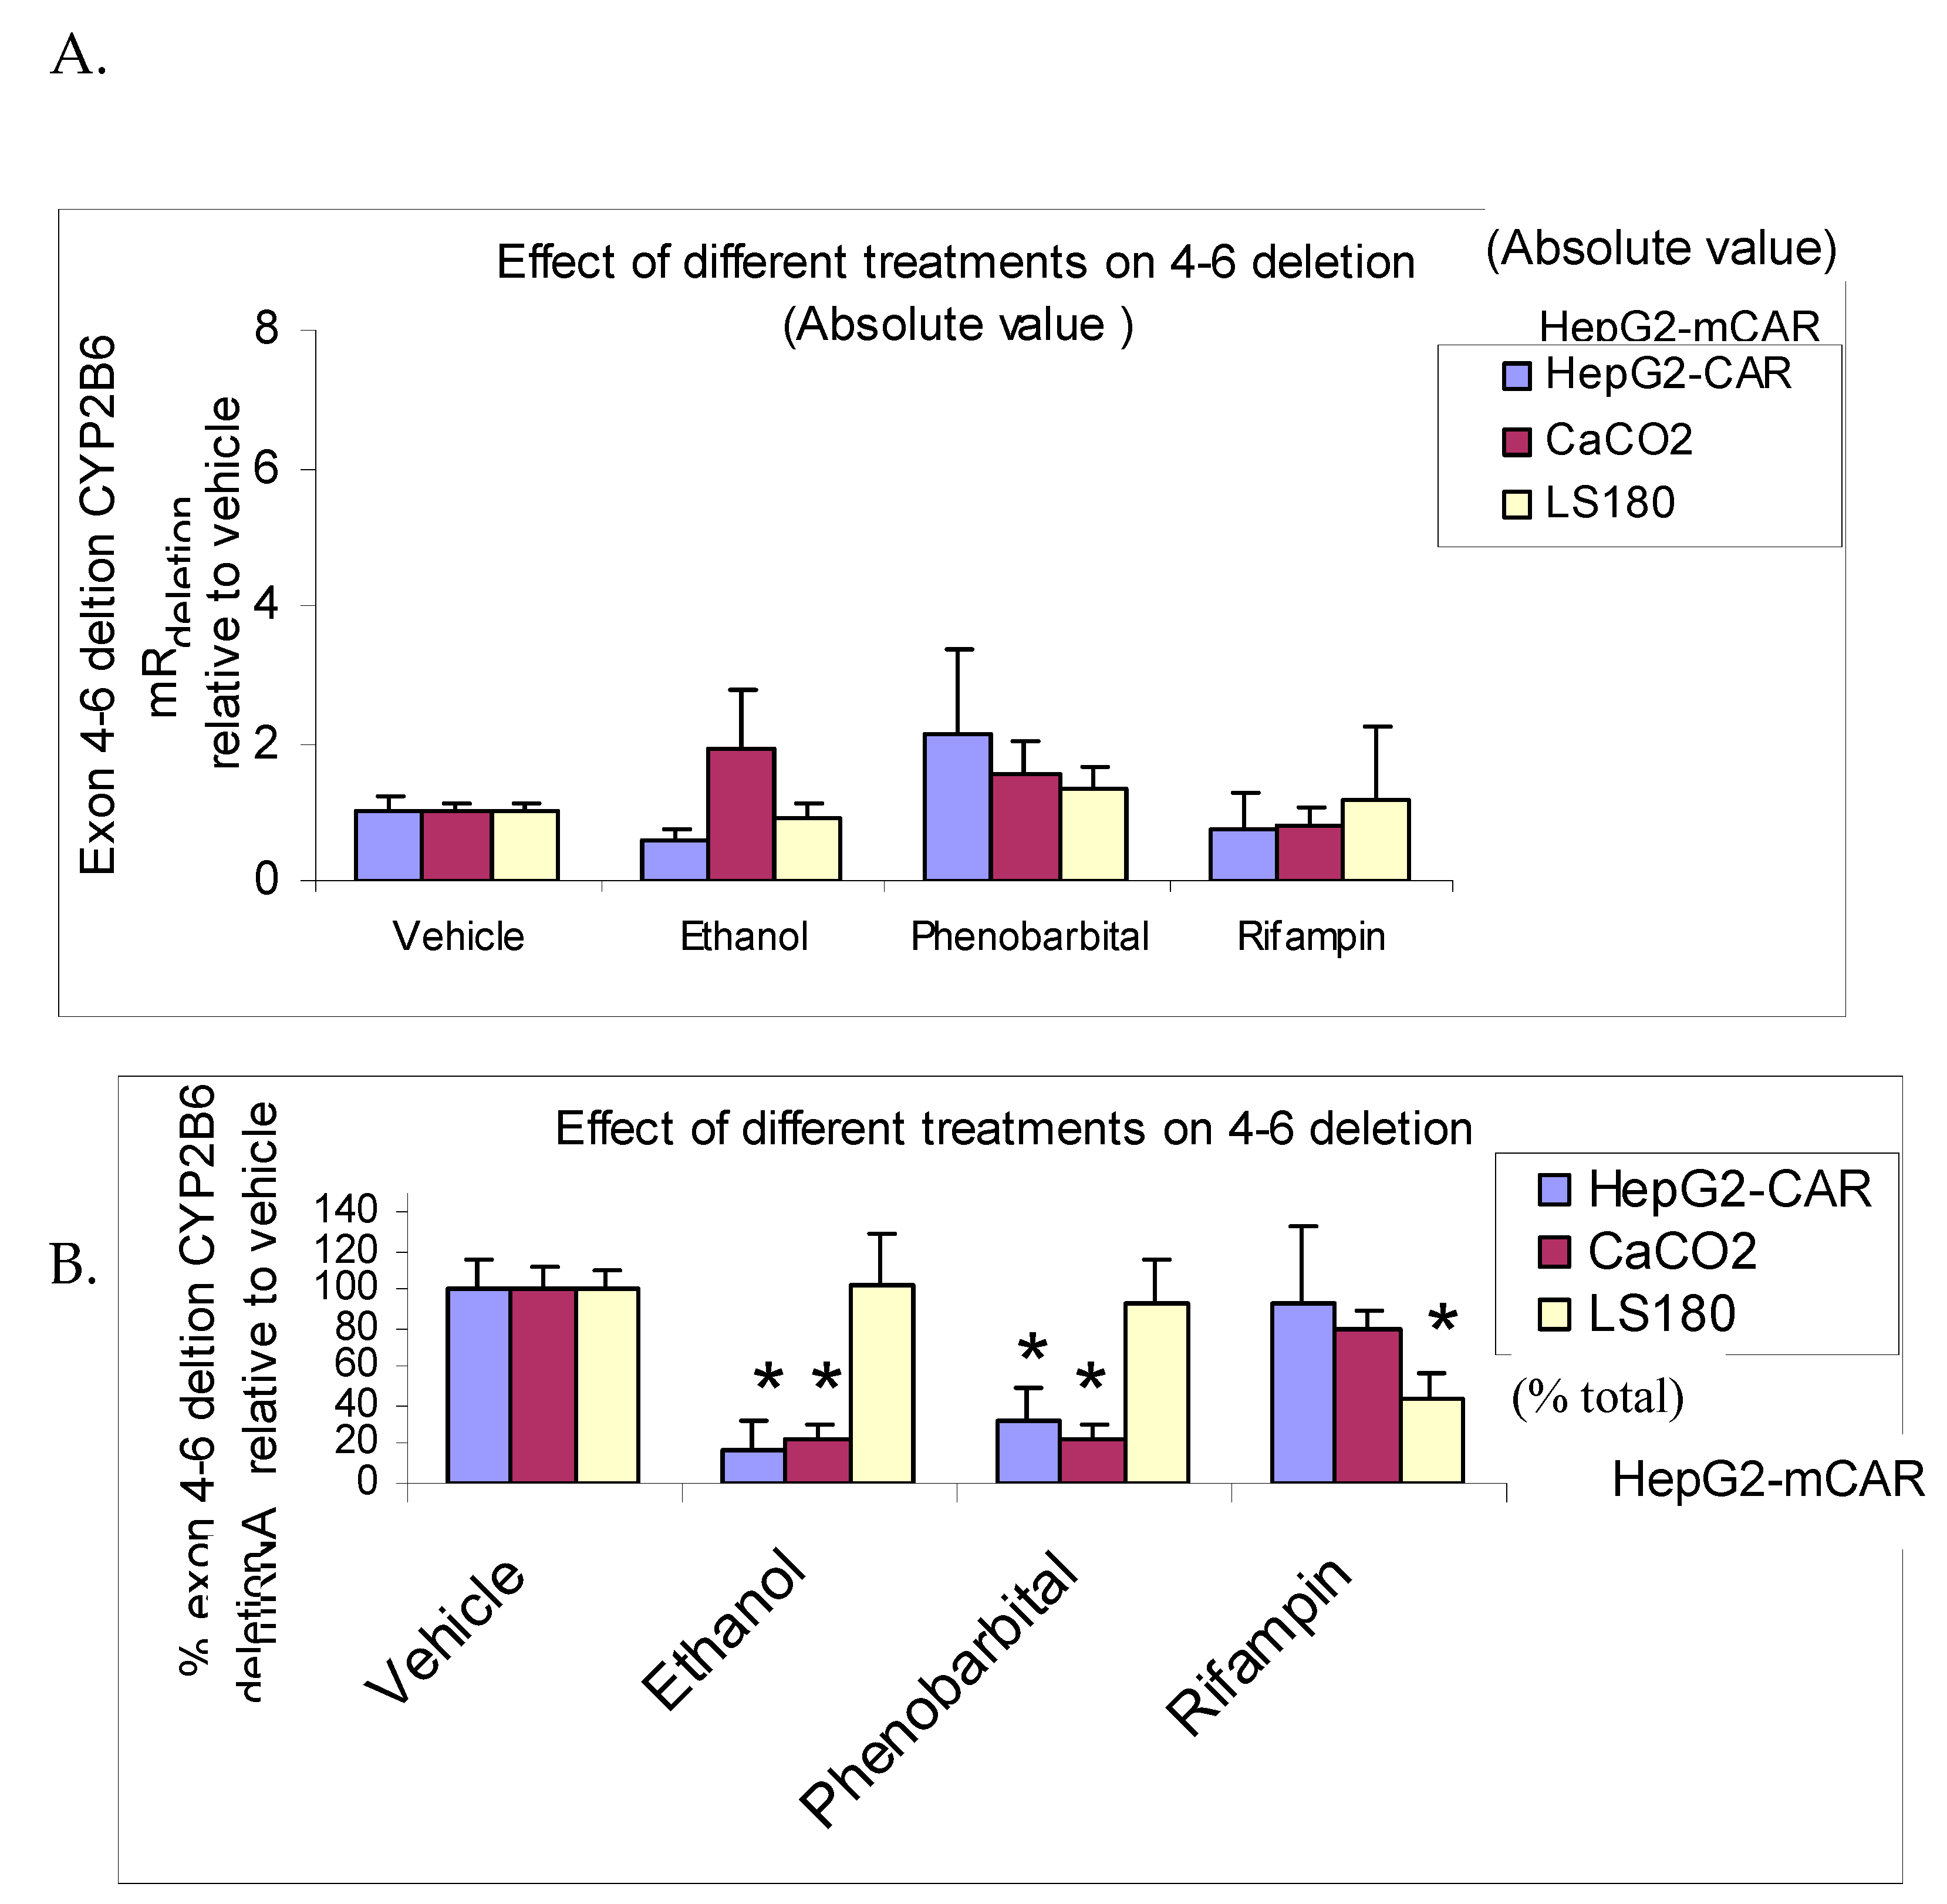
Figure 6.
Immunoblot of total cellular protein from HepG2-mCAR, HepG2-wild, Caco2, and LS180 human cell lines and probed with antibody specific for CYP2B6. Also shown is recombinant CYP2B6 obtained from BD-Gentest as positive control. CYP2B6 was below the detection limit for the immunoblotting procedure in all cell lines evaluated.
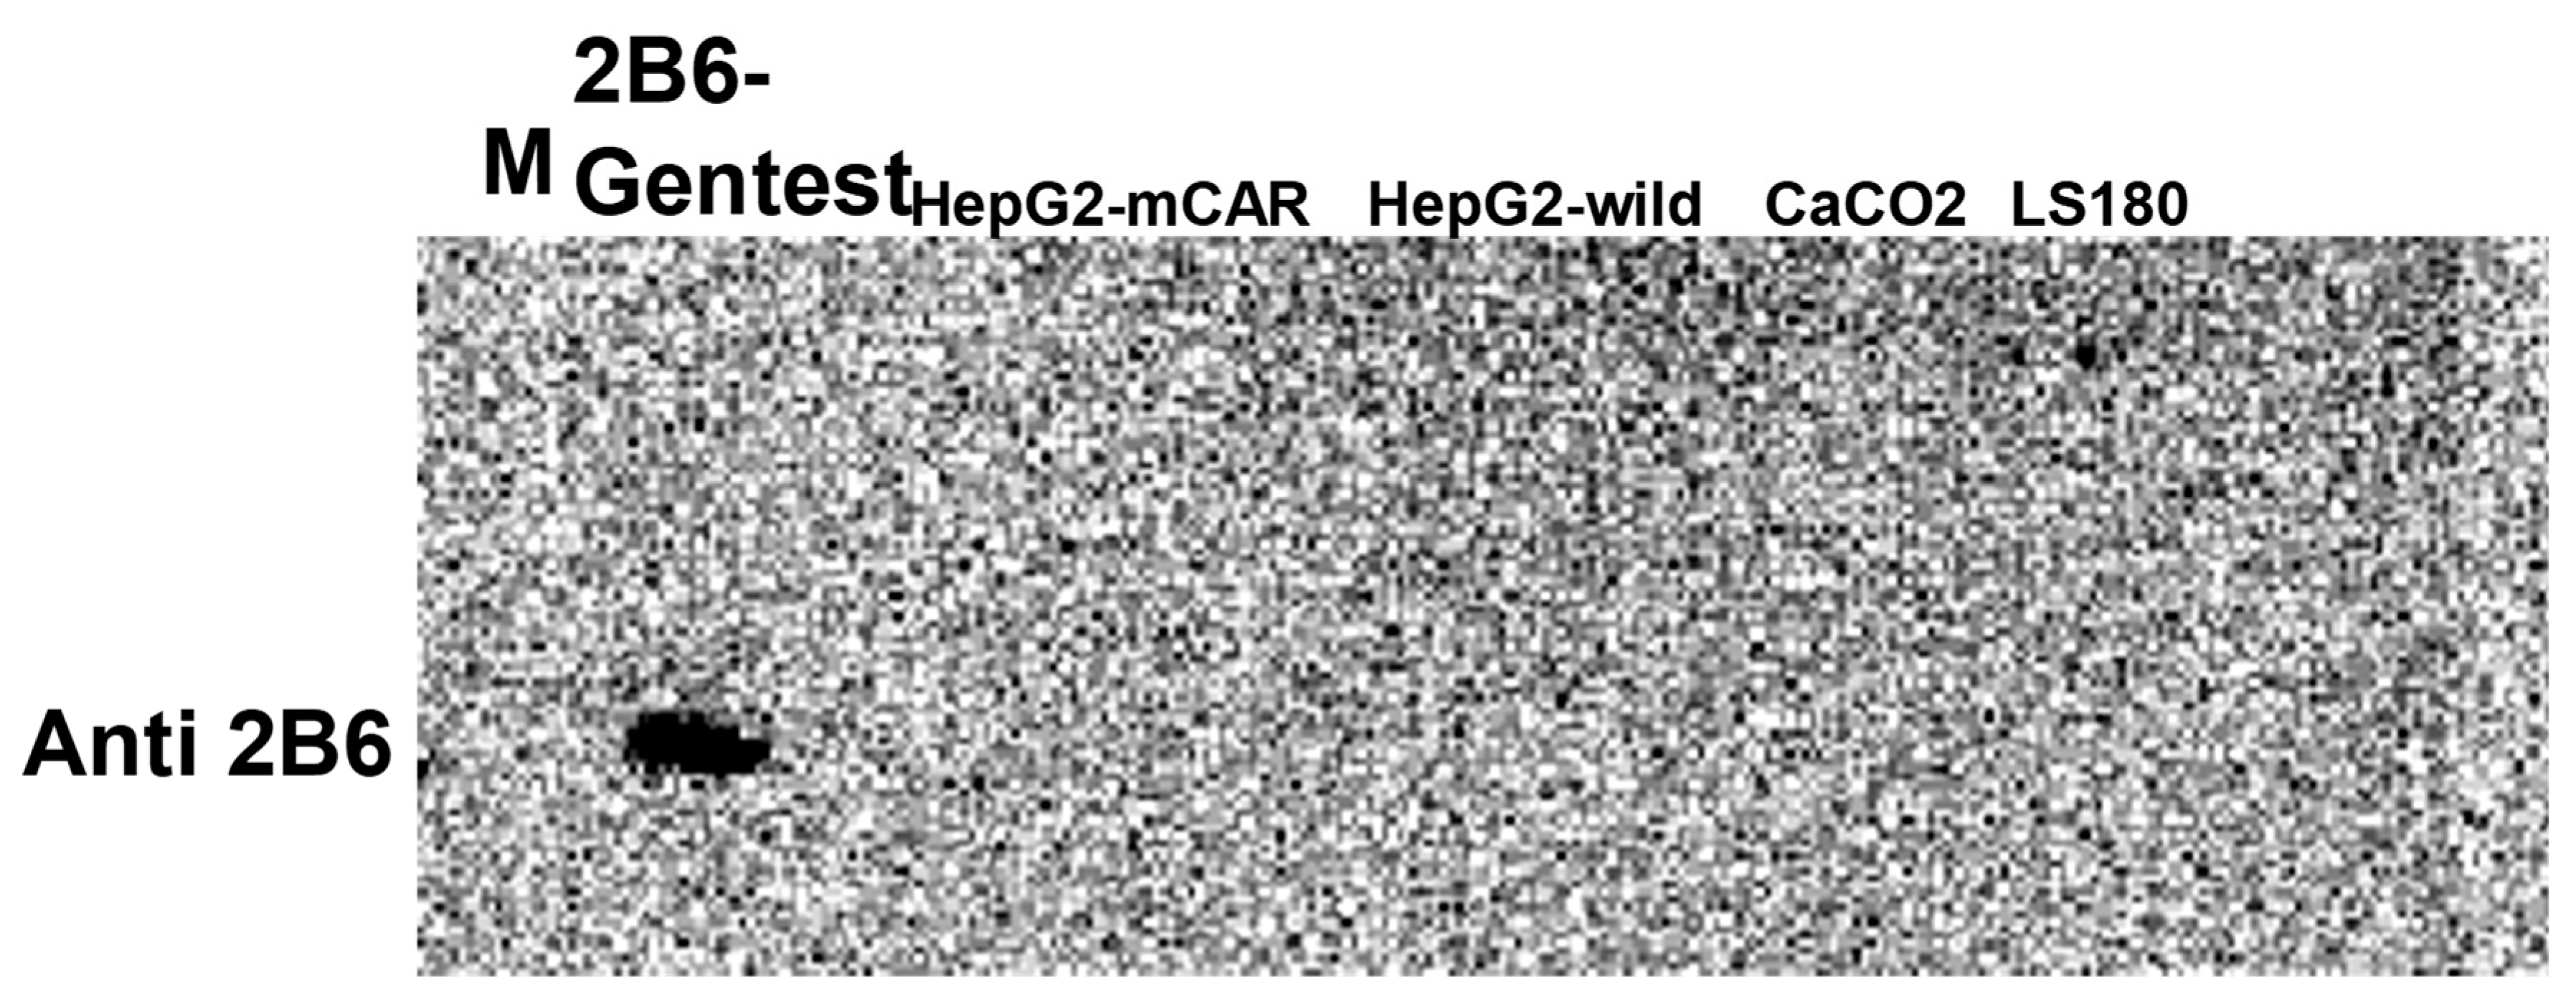

Table 1.
Primers used to quantify mRNA levels CYP2B6, CYP2B6-SV2 (splice variant lacking exons 4, 5 and 6), CYP2B7, hCAR, hPXR and 18S rRNA by quantitative RT-PCR. .
Table 1.
Primers used to quantify mRNA levels CYP2B6, CYP2B6-SV2 (splice variant lacking exons 4, 5 and 6), CYP2B7, hCAR, hPXR and 18S rRNA by quantitative RT-PCR. .
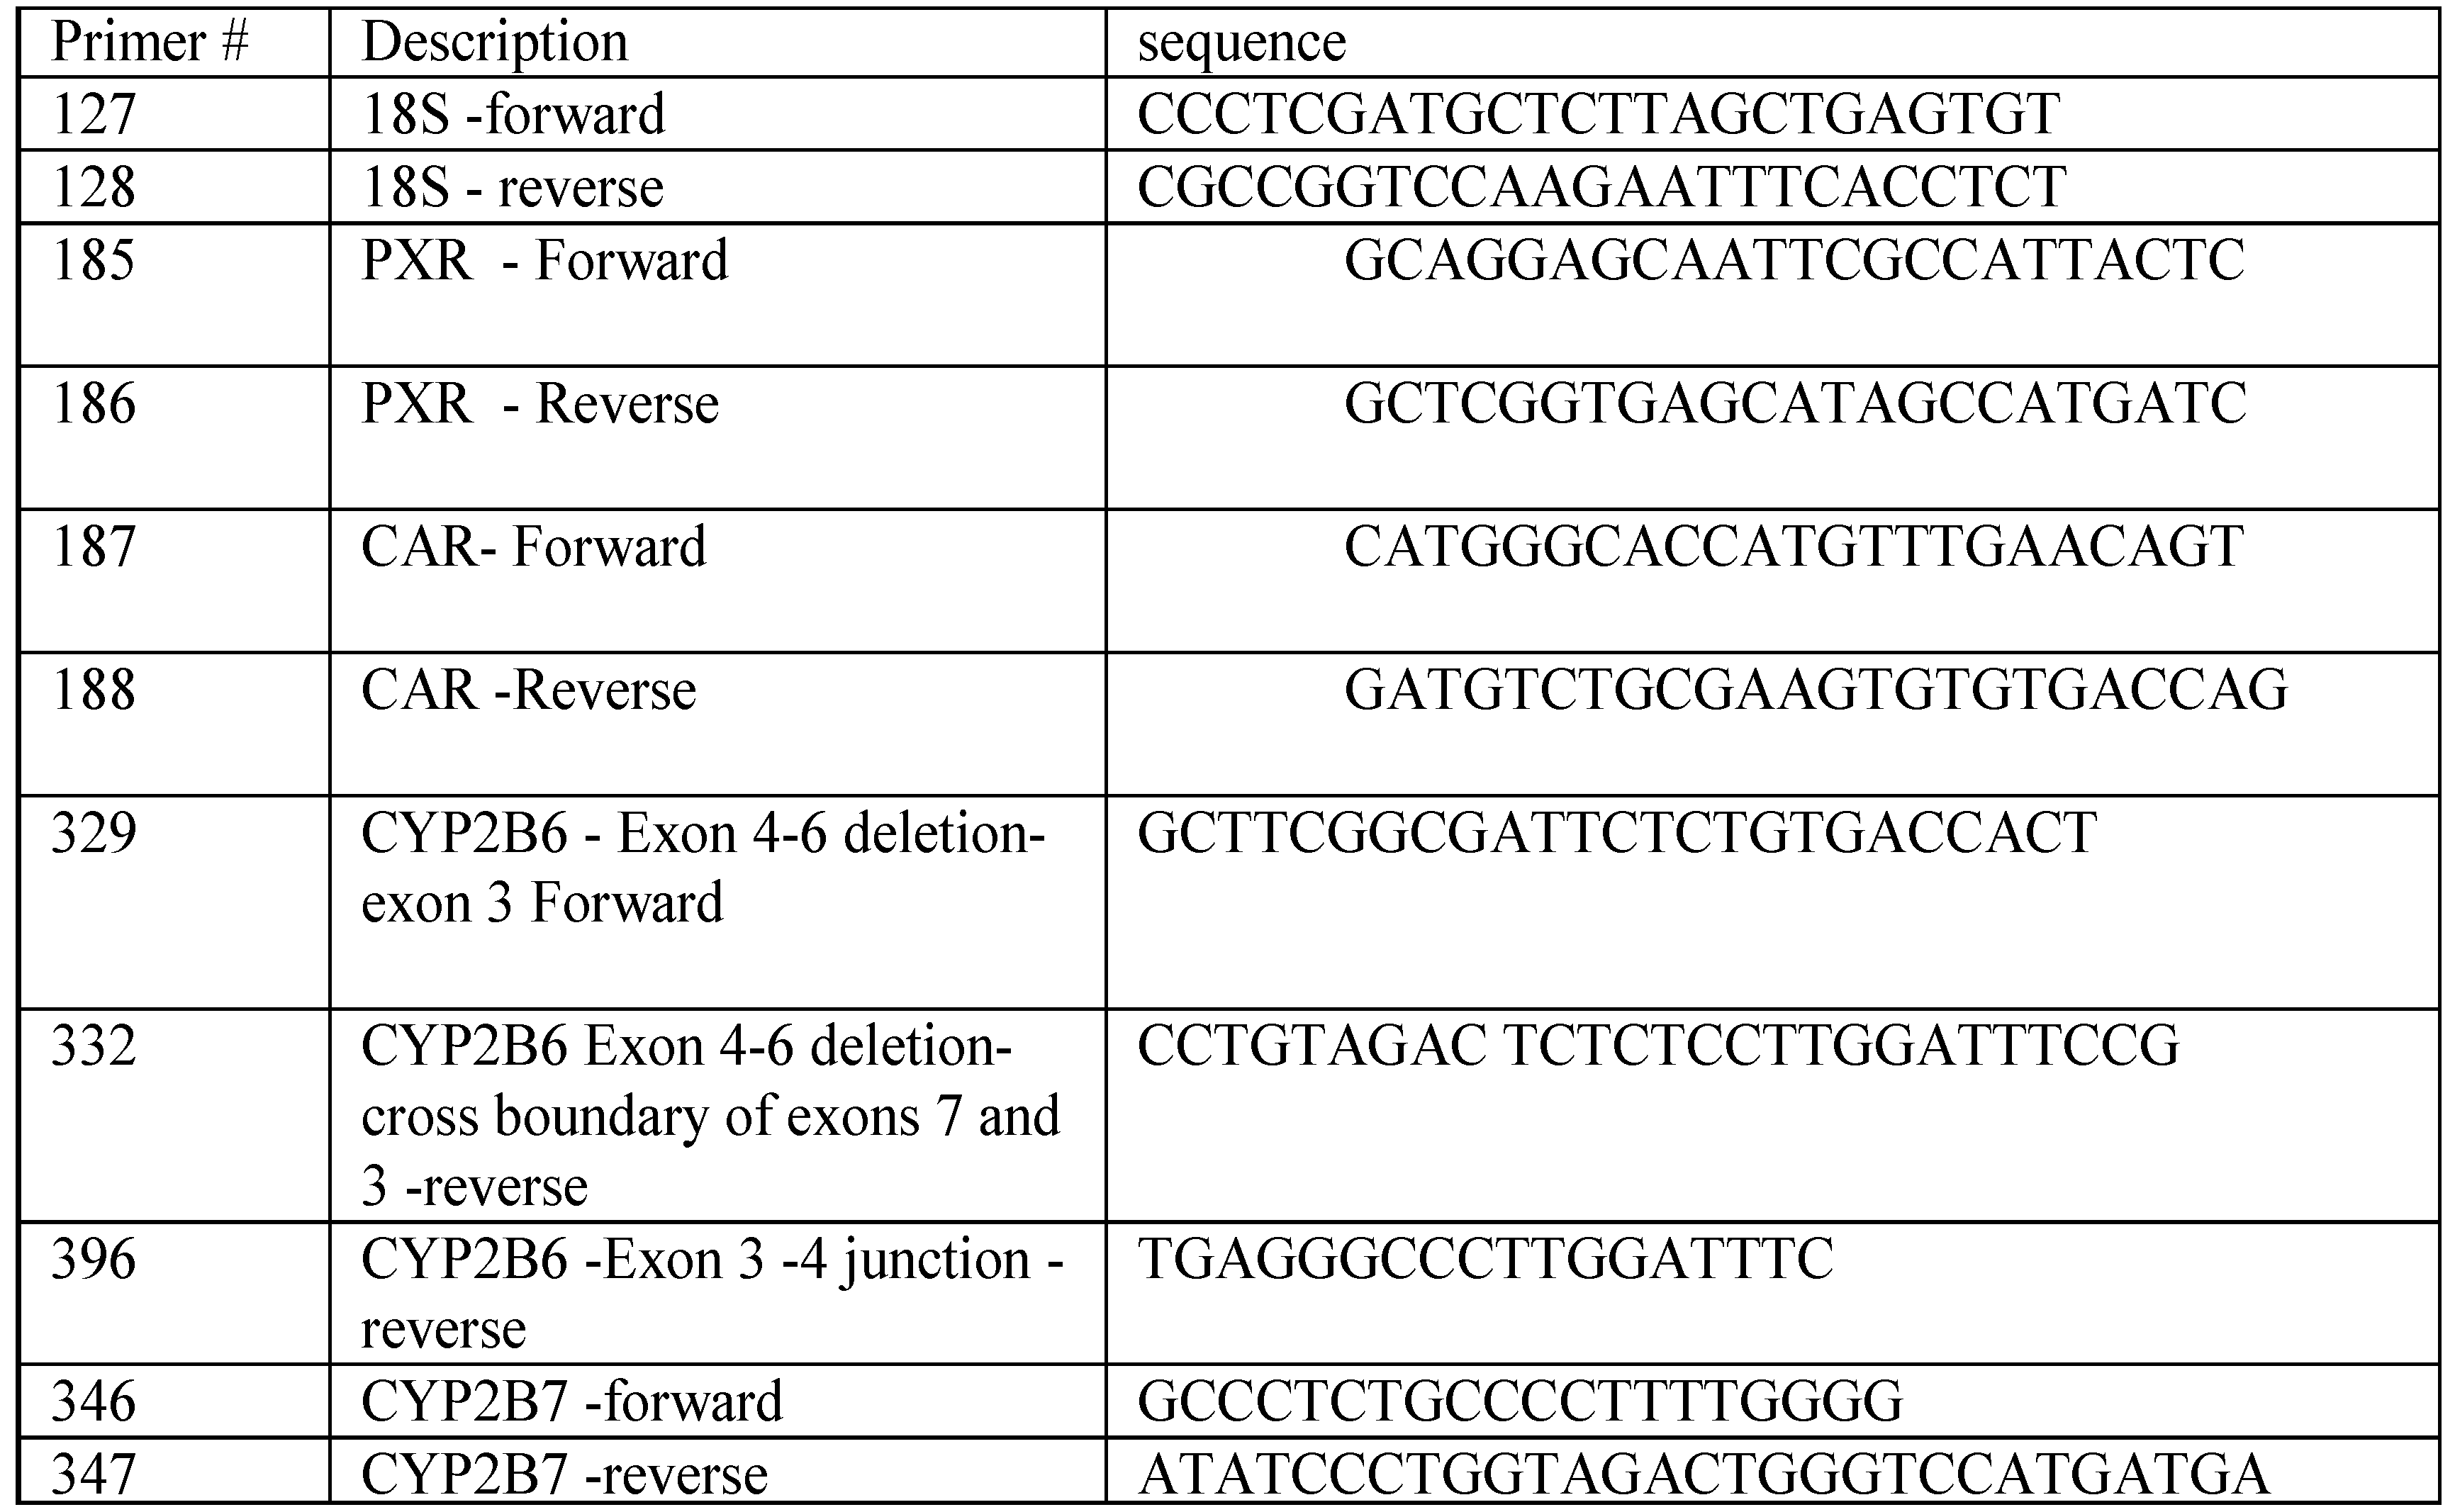 |
Table 2.
Effect of 72 hours treatment of HepG2-mCAR, Caco2, and LS180 cell lines with ethanol, phenobarbital (CAR inducer), and rifampin (PXR inducer) on CYP2B6 mRNA (A), CYP2B7 mRNA (B), CYP2B6-SV2 mRNA (C), and CYP2B6-SV2% as a percentage of total measured CYP2B6 mRNA (D). Values were measured by quantitative RT-PCR and (except for CYP2B6-SV2%) are given in arbitrary units (x10-6) relative to amounts of 18S rRNA measured in each sample. (*P<0.05 vs vehicle).
 |
Disclaimer/Publisher’s Note: The statements, opinions and data contained in all publications are solely those of the individual author(s) and contributor(s) and not of MDPI and/or the editor(s). MDPI and/or the editor(s) disclaim responsibility for any injury to people or property resulting from any ideas, methods, instructions or products referred to in the content. |
© 2026 by the authors. Licensee MDPI, Basel, Switzerland. This article is an open access article distributed under the terms and conditions of the Creative Commons Attribution (CC BY) license (http://creativecommons.org/licenses/by/4.0/).
Copyright: This open access article is published under a Creative Commons CC BY 4.0 license, which permit the free download, distribution, and reuse, provided that the author and preprint are cited in any reuse.


