Submitted:
27 January 2026
Posted:
28 January 2026
Read the latest preprint version here
Abstract
The increasing penetration of converter-interfaced renewable energy sources has led to a reduction in system inertia and has intensified frequency stability challenges in modern power systems. Battery energy storage systems (BESSs) can provide fast active power support. However, their effectiveness depends on installation location, power rating and network operating conditions. This paper proposes a power flow informed sensitivity based method for the placement and sizing of distributed BESSs to improve frequency nadir performance in low-inertia power systems. The proposed method combines marginal frequency sensitivity obtained from time domain screening simulations with network coupling information derived from power flow. These components are integrated into an optimization formulation subject to practical installation constraints and solved using particle swarm optimization. The method is evaluated using time domain simulations on the IEEE 39-bus New England test system under multiple generator outage contingencies. The results show that BESS locations exhibit non-uniform and nonlinear contributions to frequency nadir and rate of change of frequency improvement. The proposed optimal placement and sizing method distributes BESS capacity across multiple buses based on frequency impact and network coupling. Compared with the baseline case and a benchmark metaheuristic optimal placement and sizing method, the proposed method achieves higher frequency nadirs and lower RoCoF values across all evaluated contingencies. The performance is maintained under load variation scenarios and reduced system inertia due to renewable energy integration. The proposed method provides a physically meaningful and computationally efficient approach for allocating distributed BESSs to support frequency stability in low-inertia power systems.
Keywords:
battery energy storage systems
; frequency nadir
; frequency stability
; low-inertia power systems
; power flow analysis
; sensitivity analysis
1. Introduction
The increasing penetration of converter-interfaced renewable energy sources has led to the gradual displacement of synchronous generators and a corresponding reduction in system rotational inertia. In low-inertia power systems, frequency dynamics following large disturbances become faster, resulting in increased rates of change of frequency (RoCoF) and deeper frequency nadirs after generator outages. These characteristics pose challenges for maintaining frequency stability and secure operation in modern power systems with high shares of non-synchronous generation [1,2,3].
Battery energy storage systems (BESSs) have been extensively investigated as fast-acting resources for frequency support due to their rapid active-power response and flexible control capabilities. Early studies demonstrated that BESSs can provide effective primary frequency control and improve frequency nadir performance following large disturbances [4,5,6]. Subsequent studies showed that BESS-based frequency support can also reduce RoCoF and complement system inertia and conventional reserves in low-inertia power systems [7,8,9,10]. These findings collectively establish BESS as a technically viable solution for enhancing initial frequency response following a disturbance.
The effectiveness of BESS placement depends on both location and sizing decisions. Optimization based methods are therefore used to identify suitable locations and power ratings while considering system objectives and operational constraints [11,12]. Sensitivity-based methods have been proposed to provide computationally efficient alternatives for studying the relationship between BESS capacity and frequency response improvement [13]. Time domain simulation studies indicate that increasing BESS capacity enhances frequency nadir and RoCoF performance. However, the incremental enhancement diminishes as BESS sizes increase under severe contingencies [14,15]. This behaviour suggests that effective frequency support cannot be achieved through capacity increase alone and that more informed placement and sizing strategies are required.
The electrical network influences how injected active power propagates through the system. Network topology, impedance distribution and power flow patterns determine the extent to which a local injection contributes to system wide frequency stabilisation. Studies on coordinated control of multiple storage devices indicate that network interactions significantly influence both voltage and frequency behaviour in systems with high renewable penetration [16,17]. Other studies have incorporated impedance based indices and electrical distance metrics into placement formulations [18,19].
Recent optimization strategies have integrated power flow sensitivity information and operating conditions when addressing multiple objectives such as frequency support, voltage regulation and loss minimization. These studies reveal that incorporating power flow related information leads to robust BESS placement and sizing under changing operating conditions [20,21,22]. However, frequency sensitivity indices derived from dynamic simulations is often treated separately from power flow based metrics. [23,24]. The interaction between frequency response behaviour and the power system network remains insufficiently represented in current BESS placement and sizing methods.
More recent studies have applied optimisation techniques using detailed frequency performance metrics such as nadir, zenith, RoCoF and steady-state frequency [25,26,27]. while others have considered frequency stability margins and grid operational constraints when determining suitable locations for fast frequency response storage [6,28]. Sensitivity based methods have also been proposed to evaluate the impact of BESS injections across different buses using frequency stability indices such as nadir and RoCoF [29]. In high-renewable systems, hybrid storage placement methods that explicitly consider network constraints have been developed to enhance frequency performance [27].
A structured comparison of representative BESS placement and sizing methods for frequency stability enhancement is provided in Table 1. The comparison highlights differences in the frequency metrics employed, the treatment of network information and the placement and sizing strategies adopted in the literature. The table indicates that most existing methods rely either on frequency response indices or optimization techniques, while explicit integration of power flow informed sensitivity-based placement and sizing methods remains limited.
Motivated by the limitations identified in existing studies, this paper proposes a power flow informed sensitivity-based method for optimal placement and sizing of distributed BESSs aimed at improving frequency nadir performance under multiple generator outage contingencies. The proposed method combines marginal frequency sensitivity obtained from time domain screening simulations with network coupling information derived from the Power flow Jacobian. Practical installation constraints, including total BESS capacity and per-bus power limits, are explicitly considered, and the resulting optimization problem is solved using particle swarm optimization. The method is validated using time domain simulations on the IEEE 39-bus test system, and the results demonstrate consistent improvements in frequency nadir and RoCoF compared with baseline operation and a benchmark metaheuristic optimal placement and sizing method.
The remainder of this paper is organised as follows. Section 2 presents the materials and methods, including the frequency sensitivity formulation and the power flow informed optimization method. Section 3 discusses the simulation results and comparative performance analysis. Section 4 concludes the paper.
2. Materials and Methods
2.1. Study System and Data
The IEEE 39-bus test system is used as the study system to evaluate the proposed battery energy storage system (BESS) placement and sizing method. The system represents a large interconnected transmission network with multiple synchronous generators and load centres and is widely used in frequency stability studies. All dynamic simulations are conducted using DIgSILENT PowerFactory.
Time domain RMS simulations are performed to analyse system frequency response following large generation disturbances. Generator outage events are considered as disturbance scenarios and system frequency signals are recorded at each simulation time step. These signals are used to extract frequency nadir and rate of change of frequency (RoCoF) indices for subsequent analysis using Matlab.
2.2. Frequency Response Modelling
System frequency response is characterised using the system frequency signal obtained from time domain simulations. The baseline frequency nadir for a contingency , denoted by , is defined as the minimum frequency value observed following the disturbance in the absence of BESS support. The RoCoF is obtained from the initial slope of the frequency trajectory following the disturbance.
These frequency response indices are used to quantify the severity of each contingency and to evaluate the contribution of BESS injections under different operating conditions. Frequency measurements are obtained directly from DIgSILENT PowerFactory simulation outputs and analysed using a consistent post-processing procedure for all scenarios.
2.3. Sensitivity Based Frequency Screening
To evaluate the impact of BESS placement, dynamic simulations are conducted by placing a single BESS at each bus of the IEEE 39-bus system. Three predefined power ratings (10 MW, 30 MW and 50 MW) are used to evaluate the relationship between BESS size and frequency response.
For a BESS of size placed at bus under contingency the improvement in frequency nadir is defined as
where is the resulting frequency nadir.
A linear frequency sensitivity coefficient is obtained using a zero intercept least-square fit, expressed as
which represents the marginal frequency nadir improvement per megawatt of BESS power at bus . An analogous coefficient is obtained for RoCoF reduction.
Screening results indicate that the incremental frequency benefit of additional BESS power is not strictly linear. To capture this behaviour, a marginal frequency support efficiency is defined as
which quantifies the extent to which additional BESS power contributes to frequency nadir improvement relative to a linear extrapolation.
2.4. Power Flow Sensitivity Analysis
The effectiveness of BESS power injections is influenced by the electrical characteristics of the transmission network. To capture this effect, power flow sensitivity information is derived from the Power flow solution at the pre-disturbance operating point.
The Newton Raphson Jacobian matrix is used to relate incremental power injections to variations in voltage angles and magnitudes,
For buses , with and , the Jacobian elements are given by
Considering an active-power-dominant BESS response , the inverse Jacobian is used to evaluate voltage sensitivities to active power injections. The voltage sensitivity of bus with respect to an active power injection at bus is defined as
A bus-level network coupling weight is then obtained as
which represents the relative effectiveness of power transfer from bus to the network.
2.5. Optimization Problem Formulation
The BESS placement and sizing problem is formulated as an optimization problem aimed at improving frequency nadir performance across multiple contingencies. The decision variable is the BESS power allocation vector .
For a given BESS allocation, the aggregated marginal frequency efficiency and network effectiveness are defined as
where is the total installed BESS capacity. The overall effectiveness coefficient is given by
The frequency nadir under contingency is then expressed as
The optimization problem is formulated as
subject to
and
The optimization is solved using Particle Swarm Optimization (PSO), which is suitable for the nonlinear and constrained BESS placement and sizing problem. It has been shown to outperform Genetic Algorithms and to achieve superior performance compared with other swarm-based methods such as the Bat Algorithm [25,29]. Each particle represents a candidate BESS allocation vector
with velocity vector
The velocity and position update equations are
where is the inertia weight, and are acceleration coefficients, and and are random numbers in . Constraint handling is applied after each update to ensure feasibility. The global best solution obtained from PSO defines the optimal BESS placement and sizing strategy used for final time domain validation.
2.6. BESS and Control Models
The battery energy storage system (BESS) is modelled as an inverter-interfaced energy storage unit comprising a frequency controller, a PQ controller, a charge controller, a battery model, and a PWM-based power converter, as illustrated in Figure 1. This configuration enables fast modulation of active power in response to frequency disturbances while enforcing electrical and energy constraints.
The BESS receives system frequency, voltage, and power measurements as inputs. Based on these signals, the frequency controller generates an active-power reference command, which is processed by the PQ controller to regulate the active and reactive power exchanged between the BESS and the grid. The charge controller regulates the state of charge (SoC) and power limits using feedback from the battery model. The PWM converter executes the control commands and provides the interface between the BESS and the AC network. Figure 2 presents the frequency control structure implemented in the BESS. The measured system frequency is compared with the nominal reference frequency to generate a frequency deviation signal. A deadband is applied to suppress control action for small frequency deviations. When the frequency deviation exceeds the deadband threshold, a droop-based control law determines the required active-power adjustment. An offset term is included to allow flexible coordination of the BESS operating point.
The active-power reference generated by the frequency controller is supplied to the PQ controller, which regulates the active and reactive power exchanged between the BESS and the grid using measured voltage and power signals. The PQ controller operates within predefined power limits and ensures stable interaction between the inverter and the network.
An inertia emulation control structure is implemented to provide fast frequency support during the initial disturbance period, as shown in Figure 3. The COI frequency and the local bus frequency are independently differentiated to obtain their respective RoCoF signals. Each RoCoF signal is scaled by the same synthetic inertia gain . The resulting inertia contributions are weighted using a factor , such that the COI-based component is scaled by and the local bus–based component is scaled by .
The combined inertia-based active power contribution is expressed as
where controls the relative contribution of global and local frequency dynamics. The inertia-based power contribution is superimposed on the steady-state active power reference to generate the final active power command supplied to the PQ controller.
3. Results
3.1. Test System Description
The IEEE 39-bus New England test system is employed to evaluate the proposed BESS placement and sizing strategy using DIgSILENT PowerFactory, which enables detailed electromechanical modelling of synchronous generators, network components, and system frequency dynamics. The system represents a realistic large-scale transmission network derived from the New England power system and consists of multiple synchronous generators with non-uniform ratings and inertia constants interconnected through a meshed transmission network, as illustrated in Figure 4.
The generator ratings and inertia constants implemented in the DIgSILENT model are summarised in Table 2, resulting in a non-uniform inertia distribution across the network. This spatial variation in inertia plays a key role in shaping system frequency behaviour following disturbances and provides a suitable basis for assessing network-aware frequency support strategies.
System frequency performance is evaluated under a set of credible generator outage contingencies, corresponding to the disconnection of generators G01, G03, and G09, which represent disturbances of varying severity. These contingencies are applied consistently across all analysed cases to ensure a fair and systematic comparison between the baseline configuration, the metaheuristic based placement and sizing method, and the proposed power flow informed sensitivity based method. All contingencies are simulated as sudden generation losses at the nominal operating point, and the resulting frequency nadir and RoCoF responses are extracted from the DIgSILENT simulations for subsequent analysis.
3.2. Baseline Frequency Response Without BESS
The influence of BESS placement and sizing on frequency support performance is evaluated by placing storage units of varying sizes at selected candidate buses. Frequency nadir and RoCoF values corresponding to different BESS sizes are reported in Table 3 while corresponding frequency responses are shown in Figure 5.
Among the investigated contingencies, the G01 outage produces the most severe response, with a minimum frequency nadir of 55.923 Hz and a RoCoF of 0.2375 Hz/s, whereas the G03 outage results in a higher nadir of 57.958 Hz and a lower RoCoF of 0.0725 Hz/s. These differences arise from variations in generator inertia contribution and electrical coupling to the network, where the loss of a strongly coupled, high-inertia unit results in a larger instantaneous power imbalance and faster frequency decline. The baseline results therefore confirm the need for effective frequency support measures.
3.3. Frequency Contribution of BESS Locations
This section evaluates the influence of BESS power capacity on frequency performance while keeping the allocation location and control strategy unchanged. Table 4 summarises the frequency nadir and RoCoF values obtained for BESS sizes of 0 MW, 10 MW, 30 MW, and 50 MW under the selected generator outage.
With no BESS support, the frequency response shows a frequency nadir of 55.923 Hz and a RoCoF of 0.24006 Hz/s. When a 10 MW BESS is connected, the frequency nadir improves to 56.028 Hz and the RoCoF decreases to 0.23401 Hz/s. Increasing the BESS size to 30 MW increases the frequency nadir to 56.239 Hz and reduces the RoCoF to 0.22163 Hz/s, resulting in improvements of 0.316 Hz and 0.01843 Hz/s compared to the baseline case.
At a BESS size of 50 MW, the frequency nadir improves to 56.449 Hz while the RoCoF is reduced to 0.20923 Hz/s and these are the largest improvements. It can be observed that the improvements in frequency nadir and RoCoF do not increase linearly with increasing BESS size.
Figure 6 demonstrates the relationship between BESS size and frequency nadir improvement. The improvement is linear at a lower BESS size but diminishes as the BESS size is increased. It can be observed that increasing the BESS size from 10 MW to 30 MW improves the frequency nadir by 0.211 Hz and when increased from 30 MW to 50 MW results in a similar gain of 0.210 Hz. This reduction in marginal improvement reflects dynamic constraints that limit the effectiveness of additional BESS injection during transient frequency response.
It is observed that the BESS size has an influence on frequency nadir and frequency RoCoF. However, increasing only the BESS size does not result in proportional improvements. These observations emphasize the importance of coordinated sizing and placement methods to achieve enhanced frequency support.
3.4. Network Influence Based on Power Flow Information
The effect of network power flow characteristics on the performance of BESS based frequency support is examined using the proposed sensitivity-based network indices. The relationship between the derived network influence weights and the corresponding behaviour of the frequency response is illustrated in Figure 7 and summarised in Table 5.
Table 5 shows a clear variation in the weighting factors across the IEEE 39-bus system. The highest values are observed at buses 34, 38, 36, and 35. All these buses exceed 0.96 which shows strong electrical coupling with the rest of the network. By contrast, buses such as 31, 6, and 5 exhibit substantially lower weights reflecting weaker coupling to dominant power flow paths.
Buses associated with higher network influence weights provide stronger mitigation of frequency deviations when the same BESS capacity is applied. This behaviour is linked to the way transient active power injections propagate through the grid. Electrically well coupled locations allow injected power to reach a broader portion of the system more effectively which improves the system level frequency response.
These results show that the impact of BESS placement is not uniform across candidate buses. The electrical position of the location within the grid plays an important role in determining the effectiveness of frequency support. Accounting for network influence is therefore necessary when selecting suitable locations for BESS deployment.
3.5. Combined Network-Aware Effectiveness
The combined influence of frequency response sensitivities and network characteristics is assessed using the proposed impact index which integrates both dynamic response and power flow information. The ranking of candidate buses based on this index is illustrated in Figure 8 and the corresponding numerical values are reported in Table 6.
As shown in Table 6, buses 36, 35, and 30 achieve the highest impact index values, indicating that these locations provide the most favourable balance between frequency response effectiveness and network influence. Bus 36 is ranked first with an impact index of 3.8855, followed by buses 35 and 30 with values of 2.8480 and 2.7651, respectively. At the other end of the ranking, buses such as 27 and 16 exhibit noticeably lower index values, indicating reduced suitability for effective frequency support under the same BESS capacity.
The ranking presented in Figure 8 highlights that candidate buses are not uniformly suitable for BESS placement. Locations that perform well in terms of marginal frequency sensitivity alone do not always achieve the highest combined effectiveness once network characteristics are considered. The impact index therefore provides a more balanced measure for identifying candidate buses that are both dynamically effective and electrically well positioned.
The effectiveness of this network aware placement strategy is further reflected in the comparative frequency performance results presented in Table 8. For the most severe contingency, the proposed method improves the frequency nadir from 55.923 Hz in the baseline case to approximately 58.25 Hz, while the RoCoF is reduced from 0.37 Hz/s to 0.23 Hz/s. These improvements demonstrate that combining frequency response sensitivity with network influence leads to a more effective utilisation of the available BESS capacity than placement strategies that do not consider the underlying network structure.
3.6. Optimized BESS Placement and Sizing
The BESS placement and sizing problem is solved using Particle Swarm Optimization (PSO) with a constrained total BESS capacity of 300 MW. The per-bus power is limited to 50 MW, and the number of installation buses is also constrained. The resulting allocation is summarised in Table 7.
The optimized solution distributes the available BESS capacity across seven buses instead of allocating the maximum capacity to a single location. As shown in Table 7, the highest allocations are assigned to buses 19, 22 and 30, each with 50 MW. These are followed by buses 35 with 46 MW, 36 with 44 MW, and 23 with 40 MW. When a 3 MW BESS is installed at bus 25, it exhibits a low contribution to effective frequency support at this location.
The allocation trend reflects the combined influence of electrical coupling and frequency response effectiveness. Buses that have larger BESS sizes correspond to locations where injected active power produces higher frequency nadir and reduced RoCoF. This enables more efficient use of the constrained storage resource. The small allocation at bus 29 shows limited sensitivity of system frequency to power injection at this location which explains its reduced contribution to the improvement of frequency nadir and RoCoF.
Figure 8 shows the evolution of the objective function value across PSO iterations for the constrained BESS placement and sizing problem. The objective function decreases rapidly during the early iterations demonstrating effective exploration of the search space. As the iterations progress the rate of improvement decreases and the curve stabilises. The stabilisation of the objective function after convergence indicates that the algorithm does not exhibit significant oscillations or instability in the later stages of the optimization process. This behaviour reflects a suitable balance between exploration and exploitation within the PSO search mechanism. The convergence pattern observed in Figure 9 demonstrates that PSO is capable of efficiently navigating the solution space and producing a stable final solution for the constrained BESS allocation problem considered in this study.
3.7. BESS Placement and Sizing Obtained Using PSO
The frequency response of the IEEE 39-bus New England system with the optimized BESS allocation is evaluated using time domain simulations in DIgSILENT PowerFactory. A comparison between the baseline case (without BESS), the metaheuristic-based method [29] and the proposed method is reported in Table 8 for the selected contingencies (G01, G09, and G03).
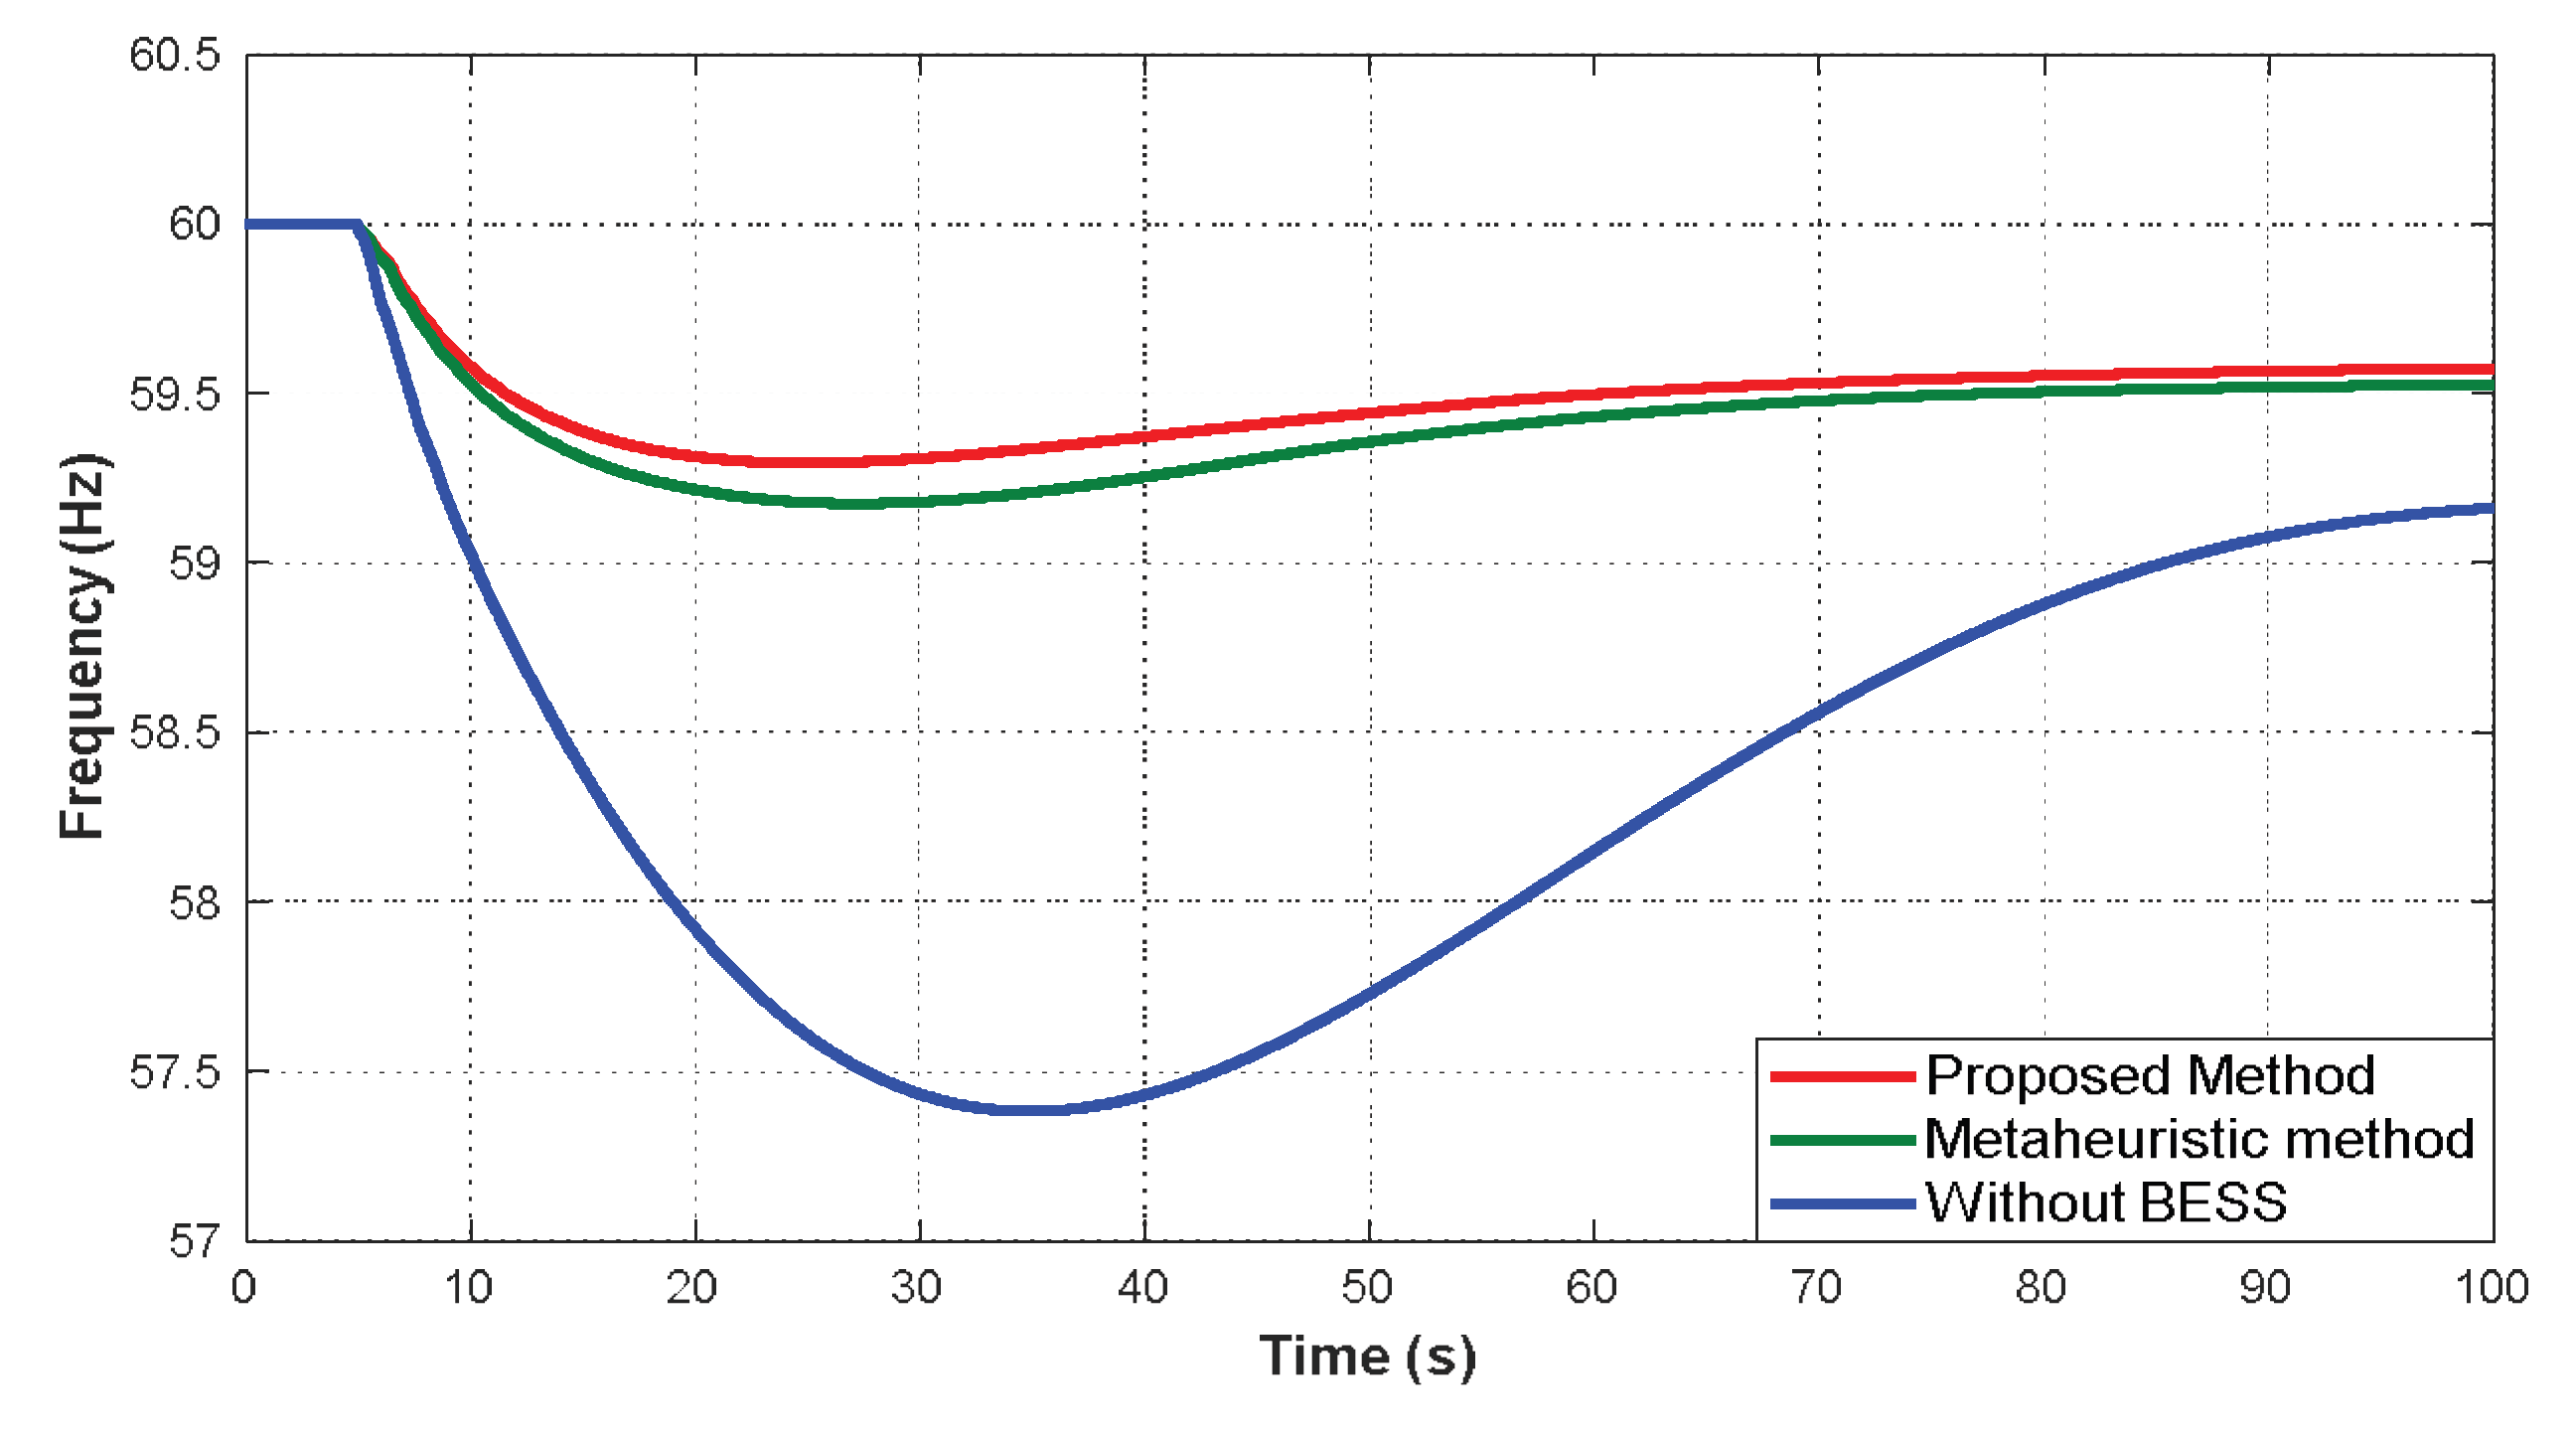
Across all contingencies, the proposed method achieves the highest frequency nadirs and the lowest RoCoF values. For the most severe disturbance (G01 outage), the frequency nadir increases from 55.9230 Hz in the baseline case to 58.6561 Hz with the proposed method, corresponding to an improvement of 2.7331 Hz (4.88%), while RoCoF decreases from 0.2404 Hz/s to 0.1224 Hz/s. The metaheuristic method achieves intermediate performance with a nadir of 58.4690 Hz and a RoCoF of 0.1365 Hz/s. Similar trends are observed for the G09 and G03 outages where the proposed method consistently delivers superior frequency performance.
Figure 9 presents the frequency response for the G01 outage. The proposed method exhibits a flatter initial decline and smoother recovery than both the baseline and the metaheuristic method. This indicates stronger containment of the disturbance and improved damping during the critical post-fault interval. Figure 10 shows the response for the G09 outage where the proposed method achieves faster stabilisation with reduced transient oscillations and reflects improved recovery dynamics. Figure 11 presents the G03 outage frequency response. The obtained allocation produces the smoothest trajectory and the quickest settling which indicates superior transient behaviour even under less severe disturbances.
The observed performance is consistent with the optimized allocation reported in Table 7, where higher BESS capacities are assigned to electrically influential buses. The results indicate that the PSO-based solution, together with the proposed power flow informed formulation, improves both quantitative frequency indices and qualitative dynamic behaviour under contingencies of varying severity.
3.8. Impact of Load Decrease Scenario
Section 3.7 demonstrated that the obtained allocation performs effectively under nominal operating conditions. The robustness of this placement is therefore evaluated under a 5% load decrease using the same contingencies. The corresponding frequency indices are reported in Table 9.
Figure 12 presents the G01 outage response, where the proposed method exhibits the flattest transient profile and fastest stabilisation, while the baseline case shows a steeper decline and slower recovery. Figure 13 presents the G09 response, where the proposed method achieves smoother recovery with reduced oscillatory behaviour compared to the other methods. Figure 14 presents the G03 response, where the proposed method yields the smoothest trajectory and quickest settling, even under mild disturbance conditions.
The trends in Table 9 and the transient profiles confirm that the proposed allocation maintains superior dynamic behaviour under reduced loading, demonstrating robustness to operating point variation.
3.9. Impact of Load Increase Scenario
Following the robustness assessment under reduced loading in Section 3.8, the allocation is further evaluated under a 5% load increase to represent stressed operating conditions. The corresponding frequency indices are reported in Table 10.
Figure 15 presents the G01 outage response under increased loading. The baseline case exhibits severe degradation in transient behaviour, while the proposed method maintains a smoother profile and faster stabilisation than the metaheuristic method. Figure 16 presents the G09 response, where deeper deviations are observed for all methods; however, the proposed method retains superior containment and recovery characteristics. Figure 17 presents the G03 response, where the proposed allocation again produces the smoothest trajectory and fastest settling.
The trends in Table 10 and the transient profiles indicate that increased loading amplifies frequency stress; however, the proposed method remains effective under these more demanding conditions. The inability of the baseline case to achieve acceptable recovery in some contingencies further highlights the importance of BESS integration under stressed operating points.
3.10. Renewable Energy Integration Scenario
Following the load variation assessments in Section 3.8 and Section 3.9, the robustness of the obtained allocation is further evaluated under reduced system inertia by replacing generator G08 with a wind power plant of equal capacity. The corresponding frequency stability indices are reported in Table 11.
Figure 18 illustrates the frequency response for G01 outage under wind integration. The baseline case shows a severe frequency decline with a nadir of 55.0461 Hz and a RoCoF of 0.2875 Hz/s which indicates high vulnerability under low inertia conditions. The obtained allocation improves the nadir to 58.0275 Hz and limits the RoCoF to 0.1306 Hz/s which demonstrates effective compensation for the loss of synchronous inertia. Figure 19 presents the G09 outage frequency response. Without BESS support, the system reaches a nadir of 56.2756 Hz. With the obtained allocation, the minimum frequency improves to 58.3296 Hz and the RoCoF is reduced from 0.1218 Hz/s to 0.0574 Hz/s which indicates enhanced disturbance containment under reduced inertia. Figure 20 presents the G03 outage frequency response. The obtained allocation achieves a nadir of 59.2946 Hz compared with 57.3814 Hz without BESS. The associated RoCoF is reduced from 0.0877 Hz/s to 0.0353 Hz/s which confirms improved dynamic performance even under less severe contingencies.
The frequency indices reported in Table 11 confirm that wind integration increases frequency stress in the absence of BESS. In contrast, the obtained allocation consistently mitigates the impact of reduced inertia. The results demonstrate that the proposed allocation remains effective under low-inertia operating conditions, which is essential for future systems with high renewable penetration.
Figure 21.
G03 outage with wind integration.
4. Conclusions
This paper presented a power flow informed sensitivity based method for the optimal placement and sizing of distributed battery energy storage systems (BESSs) to improve frequency stability in low-inertia power systems. The method integrates marginal frequency sensitivity obtained from time domain screening simulations with network coupling information derived from Power flow sensitivities. This integration enables a unified formulation that accounts for both dynamic frequency response and power transfer characteristics of the network.
The application of the proposed optimal placement and sizing method to the IEEE 39-bus New England test system illustrated that BESS locations exhibit non-uniform and nonlinear contributions to frequency nadir and RoCoF improvement. The dynamic simulation results demonstrated that increasing BESS capacity yields diminishing marginal frequency benefits at many buses. The power flow-based analysis further indicated that buses with high marginal frequency sensitivity do not necessarily provide effective network-wide frequency support. This is due to differences in electrical coupling across the network.
The optimization results confirmed that the proposed formulation distributes BESS capacity across multiple buses instead of concentrating capacity at a single location. This allocation reflects the combined influence of marginal frequency contribution and network coupling. Across all considered generator outage contingencies, the proposed method achieved higher frequency nadirs and lower RoCoF values than both the baseline case and the benchmark metaheuristic placement method.
Simulation results under load variation scenarios showed that the proposed placement strategy maintains consistent performance under both reduced and increased loading conditions. Under increased loading, the proposed method limited frequency deviations more effectively than the comparison methods. In the renewable energy integration scenario, where synchronous generation was replaced by wind generation, the proposed strategy compensated for the reduction in system inertia and maintained acceptable frequency responses across all outages.
The results demonstrate that incorporating power flow information into sensitivity-based BESS placement improves the physical relevance and effectiveness of frequency support. The proposed method provides a practical approach for enhancing frequency stability in low-inertia power systems using distributed BESSs. The methodology can be extended to larger networks and to formulations that jointly consider frequency and voltage support.
Author Contributions
Conceptualization, L.N. and J.M.; methodology, L.N.; software, L.N.; validation, L.N., J.M., and Y.H.; formal analysis, L.N.; investigation, L.N.; resources, J.M. and Y.H.; data curation, L.N.; writing—original draft preparation, L.N.; writing—review and editing, J.M. and Y.H.; visualization, L.N.; supervision, J.M. and Y.H. All authors have read and agreed to the published version of the manuscript.
Data Availability Statement
The data used in this study are available from the corresponding author upon request.
Abbreviations
The following abbreviations are used in this manuscript:
| BESS | Battery Energy Storage System |
| COI | Centre of Inertia |
| DIgSILENT | DIgSILENT PowerFactory |
| MW | Megawatt |
| PF | Power Flow |
| PSO | Particle Swarm Optimization |
| PQ | Active and Reactive Power |
| PWM | Pulse Width Modulation |
| RMS | Root Mean Square |
| RoCoF | Rate of Change of Frequency |
| SoC | State of Charge |
References
- Das, C.K. Optimal placement of distributed energy storage systems in distribution networks using artificial bee colony algorithm. Applied energy 2018, 232, 212–228. [Google Scholar] [CrossRef]
- Das, C.K. Optimal allocation of distributed energy storage systems to improve performance and power quality of distribution networks. Applied Energy 2019, 252, 113468. [Google Scholar] [CrossRef]
- Parajuli, A.; et al. Optimal Sizing and Placement of Battery Energy Storage Systems for Enhancement of Grid Frequency Stability. 2023 10th IEEE International Conference on Power Systems (ICPS), 2023; IEEE. [Google Scholar]
- Das, C.K. An optimal allocation and sizing strategy of distributed energy storage systems to improve performance of distribution networks. Journal of Energy Storage 2019, 26, 100847. [Google Scholar] [CrossRef]
- Thien, T. Real-world operating strategy and sensitivity analysis of frequency containment reserve provision with battery energy storage systems in the german market. Journal of energy storage 2017, 13, 143–163. [Google Scholar] [CrossRef]
- Okafor, C.E.; Folly, K.A. Optimal placement of BESS in a power system network for frequency support during contingency. Energy reports 2023, 10, 3681–3695. [Google Scholar] [CrossRef]
- Jani, V.; Abdi, H. Optimal allocation of energy storage systems considering wind power uncertainty. Journal of Energy Storage 2018, 20, 244–253. [Google Scholar] [CrossRef]
- Baniasadi, A. Optimal sizing design and operation of electrical and thermal energy storage systems in smart buildings. Journal of Energy Storage 2020, 28, 101186. [Google Scholar] [CrossRef]
- Lian, B. Optimizing LiFePO4 battery energy storage systems for frequency response in the UK system. IEEE Transactions on Sustainable Energy 2016, 8, 385–394. [Google Scholar] [CrossRef]
- Alhejaj, S.M.; Gonzalez-Longatt, F.M. Impact of inertia emulation control of grid-scale BESS on power system frequency response. 2016 International Conference for Students on Applied Engineering (ICSAE); IEEE, 2016. [Google Scholar]
- Njoka, G.M.; Mogaka, L.; Wangai, A. Enhancing grid stability and resilience through BESS optimal placement and sizing in VRES-dominated systems. Energy Reports 2025, 13, 1764–1779. [Google Scholar] [CrossRef]
- Abayateye, J. BESS Primary Frequency Control Strategies for the West Africa Power Pool. Energies 2022, 15(3), 990. [Google Scholar] [CrossRef]
- Akram, U. Sizing HESS as inertial and primary frequency reserve in low inertia power system. IET Renewable Power Generation 2021, 15, 99–113. [Google Scholar] [CrossRef]
- Amin, M.R. Application of battery energy storage systems for primary frequency control in power systems with high renewable energy penetration. Energies 2021, 14, 1379. [Google Scholar] [CrossRef]
- Apribowo, C.H.B. Optimal sizing and placement of battery energy storage system for maximum variable renewable energy penetration considering demand response flexibility: A case in Lombok power system, Indonesia. Energy Conversion and Management: X 2024, 23, 100620. [Google Scholar] [CrossRef]
- Assery, S.A.; Chen, N.; Zhang, X.-P. Capacity Optimization and Location of BESS-SC Hybrid System for Grid Inertia Support With High Wind Power Penetration. IEEE Access 2025. [Google Scholar] [CrossRef]
- Unigwe, O.; Okekunle, D.; Kiprakis, A. Smart coordination schemes for multiple battery energy storage systems for support in distribution networks with high penetration of photovoltaics. IET Smart Grid 2019, 2, 347–354. [Google Scholar] [CrossRef]
- ALAhmad, A.K. Voltage regulation and power loss mitigation by optimal allocation of energy storage systems in distribution systems considering wind power uncertainty. Journal of Energy Storage 2023, 59, 106467. [Google Scholar] [CrossRef]
- Conde, A. Frequency improvement in microgrids through Battery Management System control supported by a remedial action scheme. IEEE Access 2022, 10, 8081–8091. [Google Scholar] [CrossRef]
- Wang, S. Analysis of energy storage demand for peak shaving and frequency regulation of power systems with high penetration of renewable energy. Energy 2023, 267, 126586. [Google Scholar] [CrossRef]
- Castro, L.M.; Espinoza-Trejo, D.R. Optimal placement of battery energy storage systems with energy time shift strategy in power networks with high penetration of photovoltaic plants. Sustainable Energy, Grids and Networks 2023, 35, 101093. [Google Scholar] [CrossRef]
- Ghatuari, I. Controller design and optimal sizing of battery energy storage system for frequency regulation in a multi machine power system. Energy Reports 2024, 12, 4757–4776. [Google Scholar] [CrossRef]
- Giannitrapani, A. Optimal allocation of energy storage systems for voltage control in LV distribution networks. IEEE Transactions on Smart Grid 2016, 8, 2859–2870. [Google Scholar] [CrossRef]
- Atwa, Y.M.; El-Saadany, E. Optimal allocation of ESS in distribution systems with a high penetration of wind energy. IEEE Transactions on Power Systems 2010, 25, 1815–1822. [Google Scholar] [CrossRef]
- Gonzalez-Sanchez, J.W. Optimal Location and Sizing of BESS Systems with Inertia Emulation to Improve Frequency Stability in Low-Inertia Electrical Systems. Energies 2025, 18, 6552. [Google Scholar] [CrossRef]
- Jannesar, M.R.; Sadr, S.; Savaghebi, M. Optimal sitting, sizing and control of battery energy storage to enhance dynamic stability of low-inertia grids. IET Renewable Power Generation 2024, 18, 2925–2941. [Google Scholar] [CrossRef]
- Ruan, P. Optimal Siting and Sizing of Hybrid Energy Storage Systems in High-Penetration Renewable Energy Systems. Energies 2025, 18, 2196. [Google Scholar] [CrossRef]
- Lee, J.; Han, S.; Lee, D. Optimizing the location of frequency regulation energy storage systems for improved frequency stability. Batteries 2023, 9, 592. [Google Scholar] [CrossRef]
- Parajuli, A.; Gurung, S.; Chapagain, K. Optimal placement and sizing of battery energy storage systems for improvement of system frequency stability. Electricity 2024, 5, 662–683. [Google Scholar] [CrossRef]
Figure 1.
BESS Model.
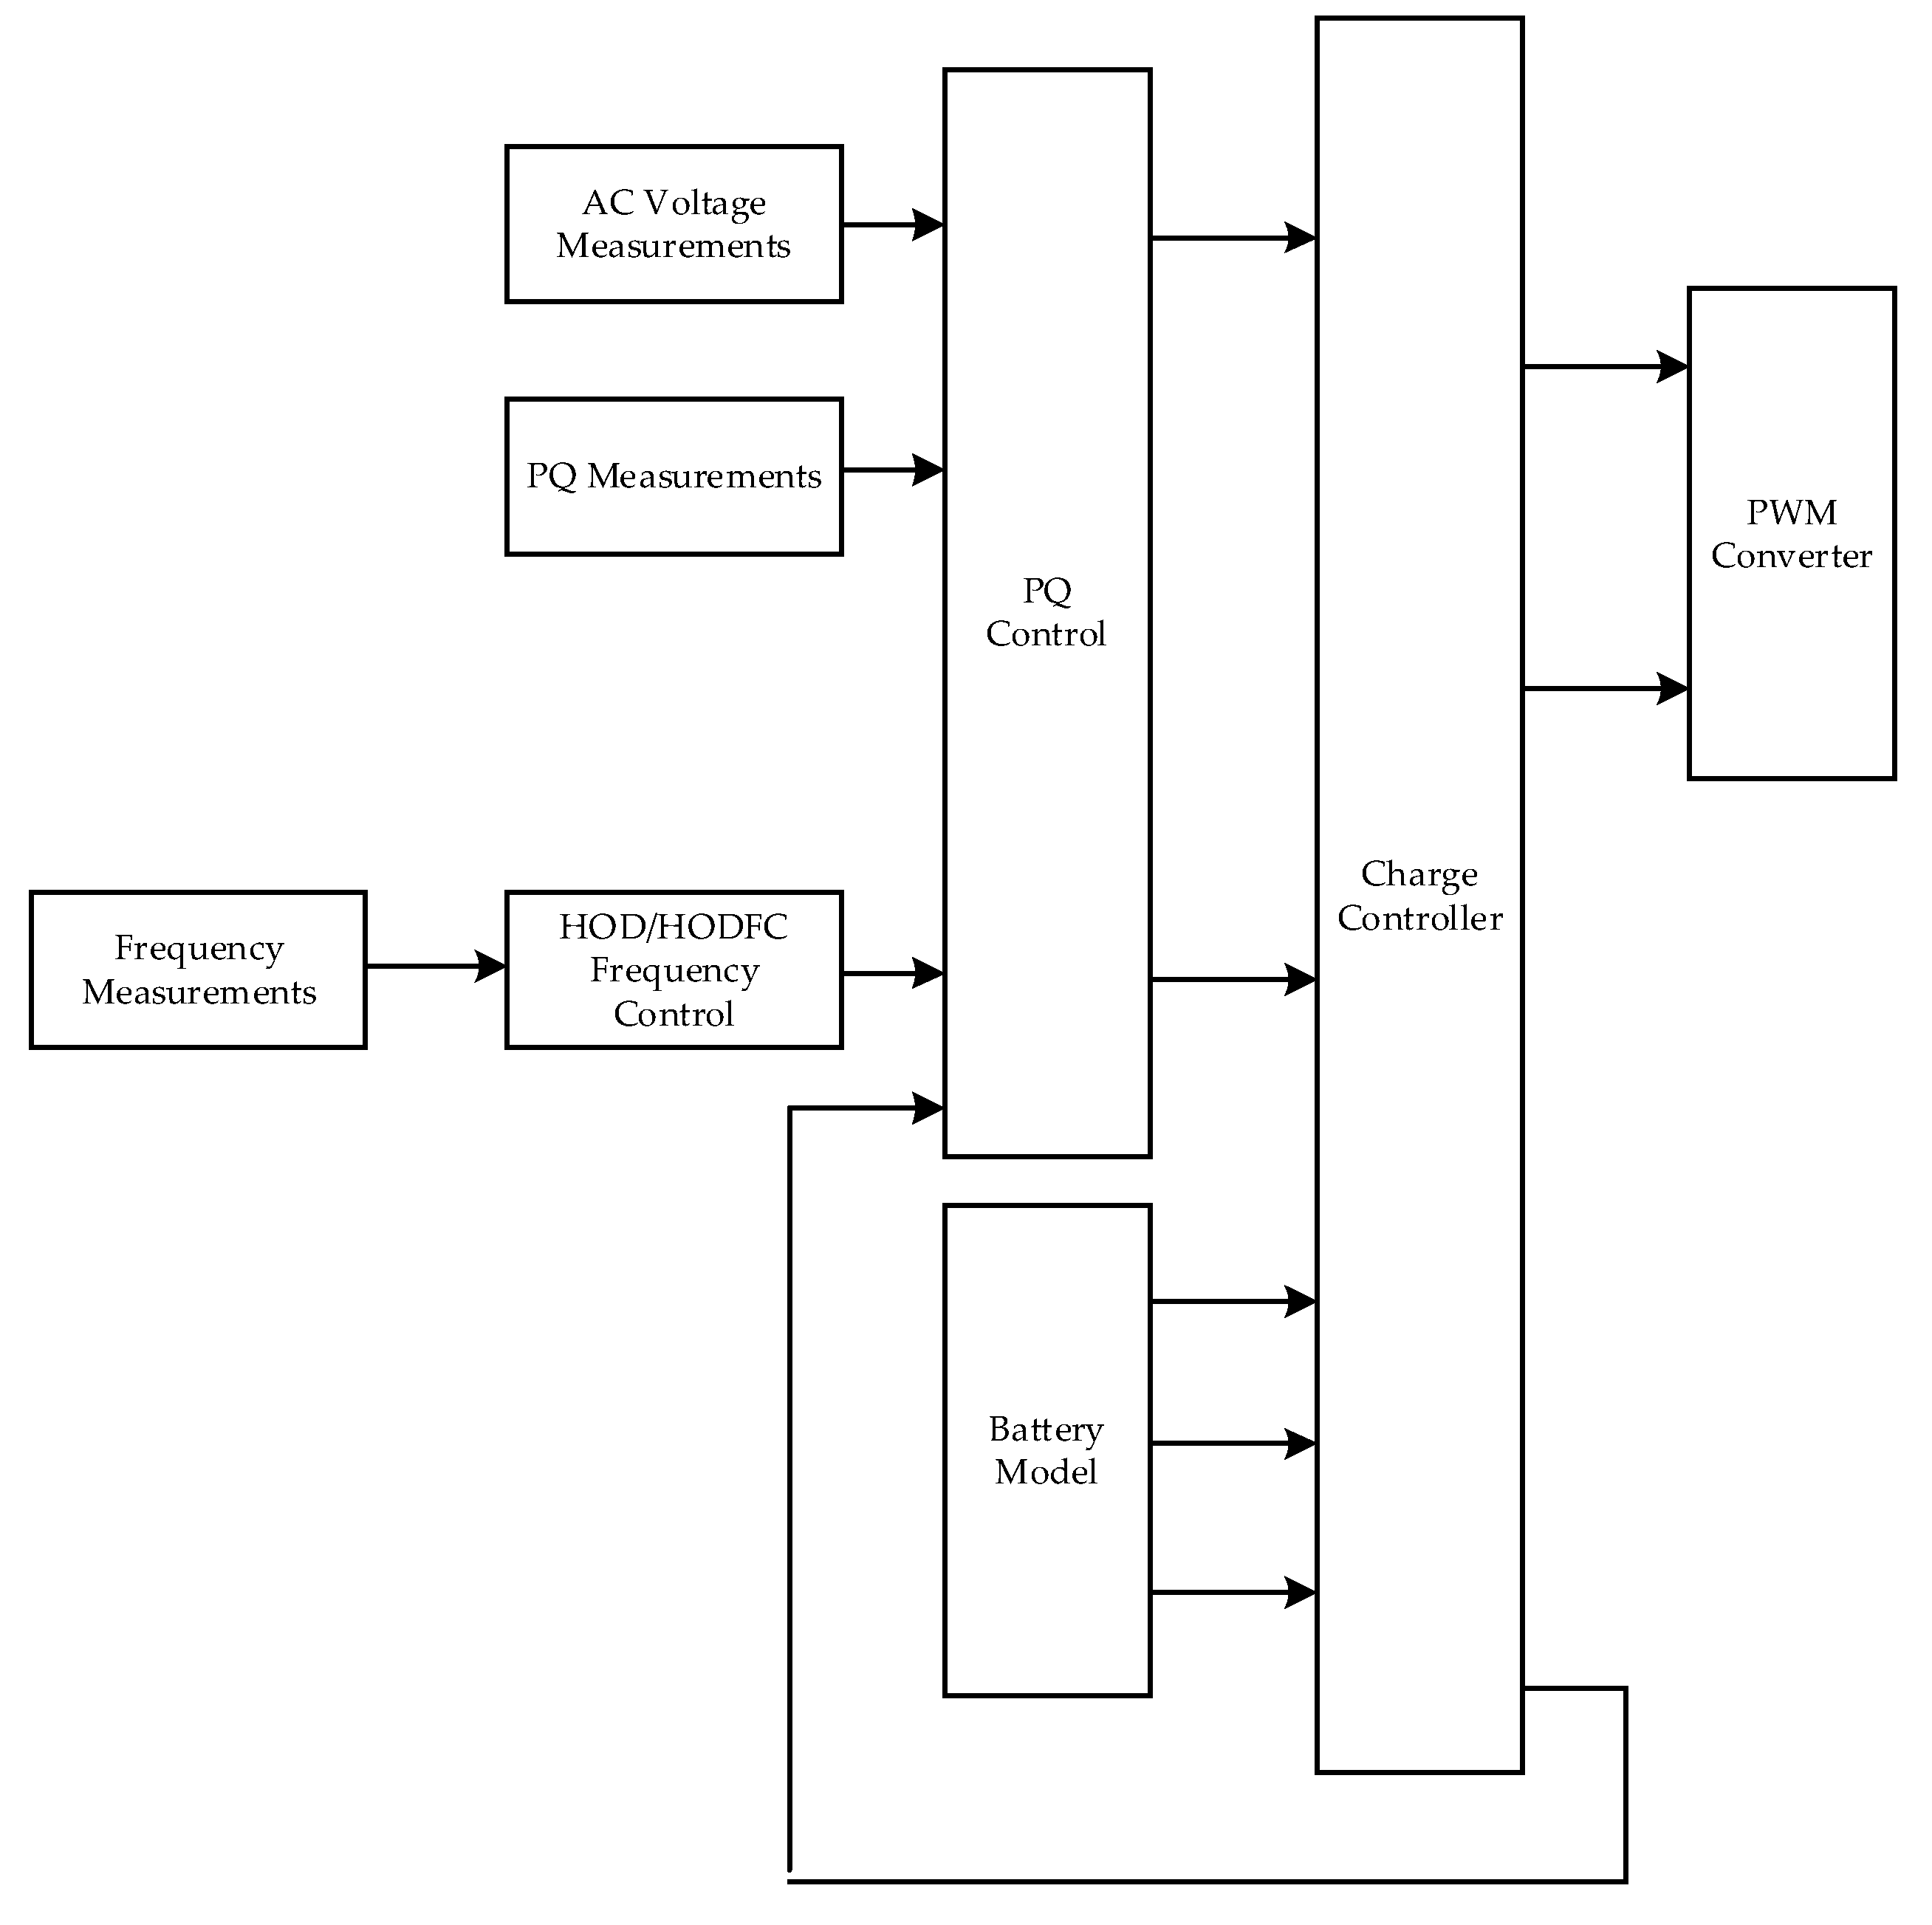
Figure 2.
BESS frequency control structure.
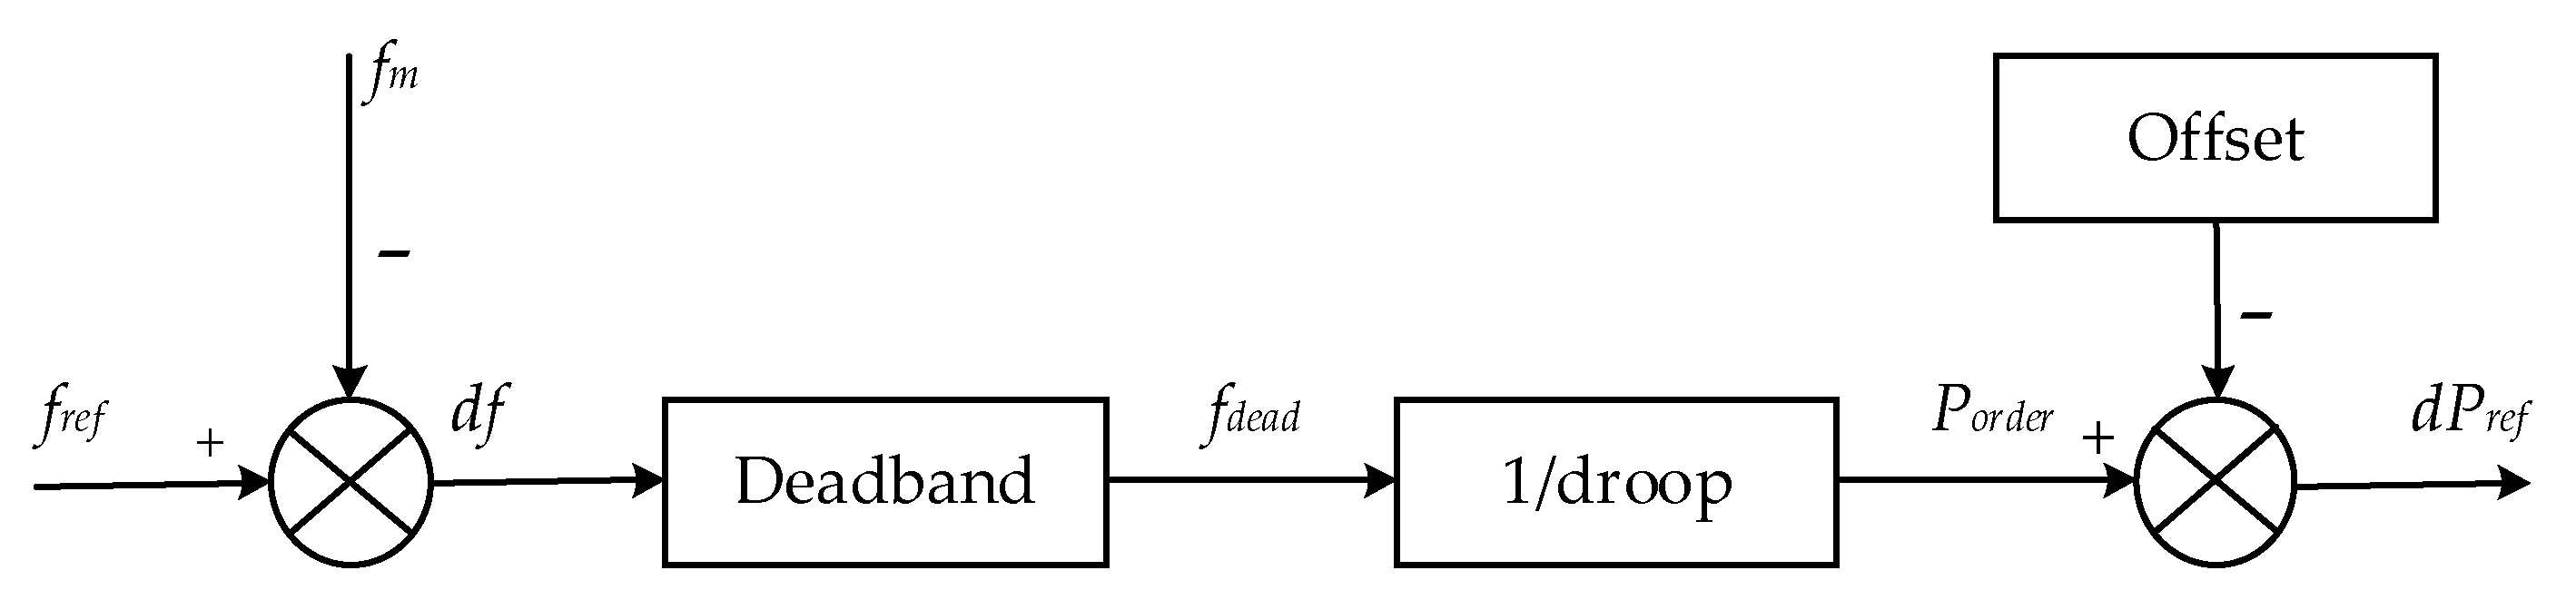
Figure 3.
BESS inertia emulation control.
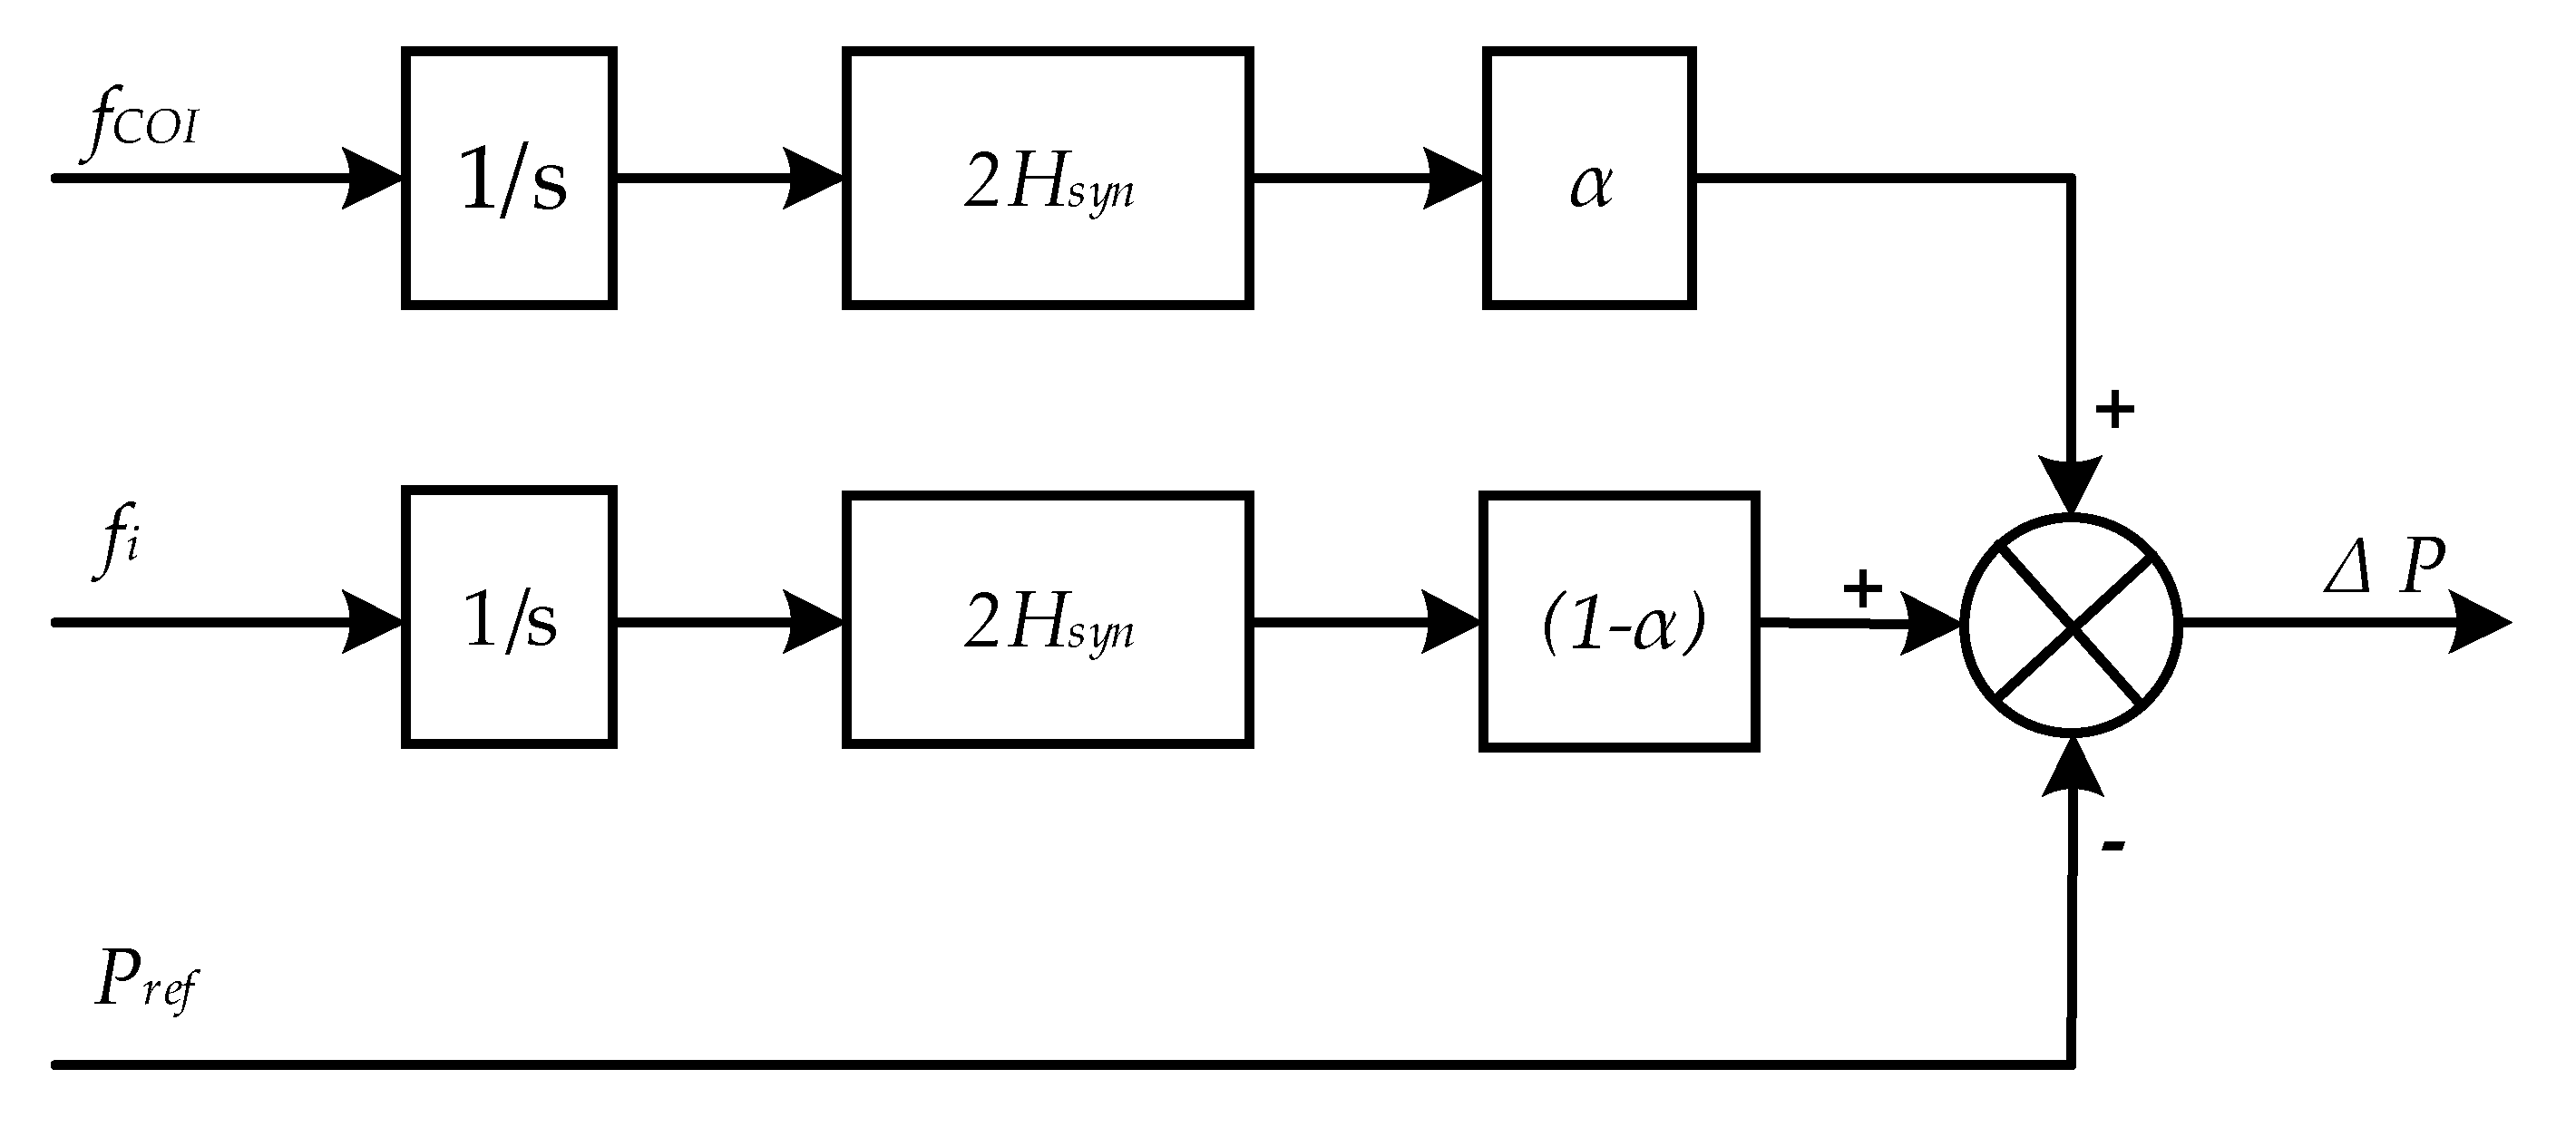
Figure 4.
IEEE 39 bus New England system.
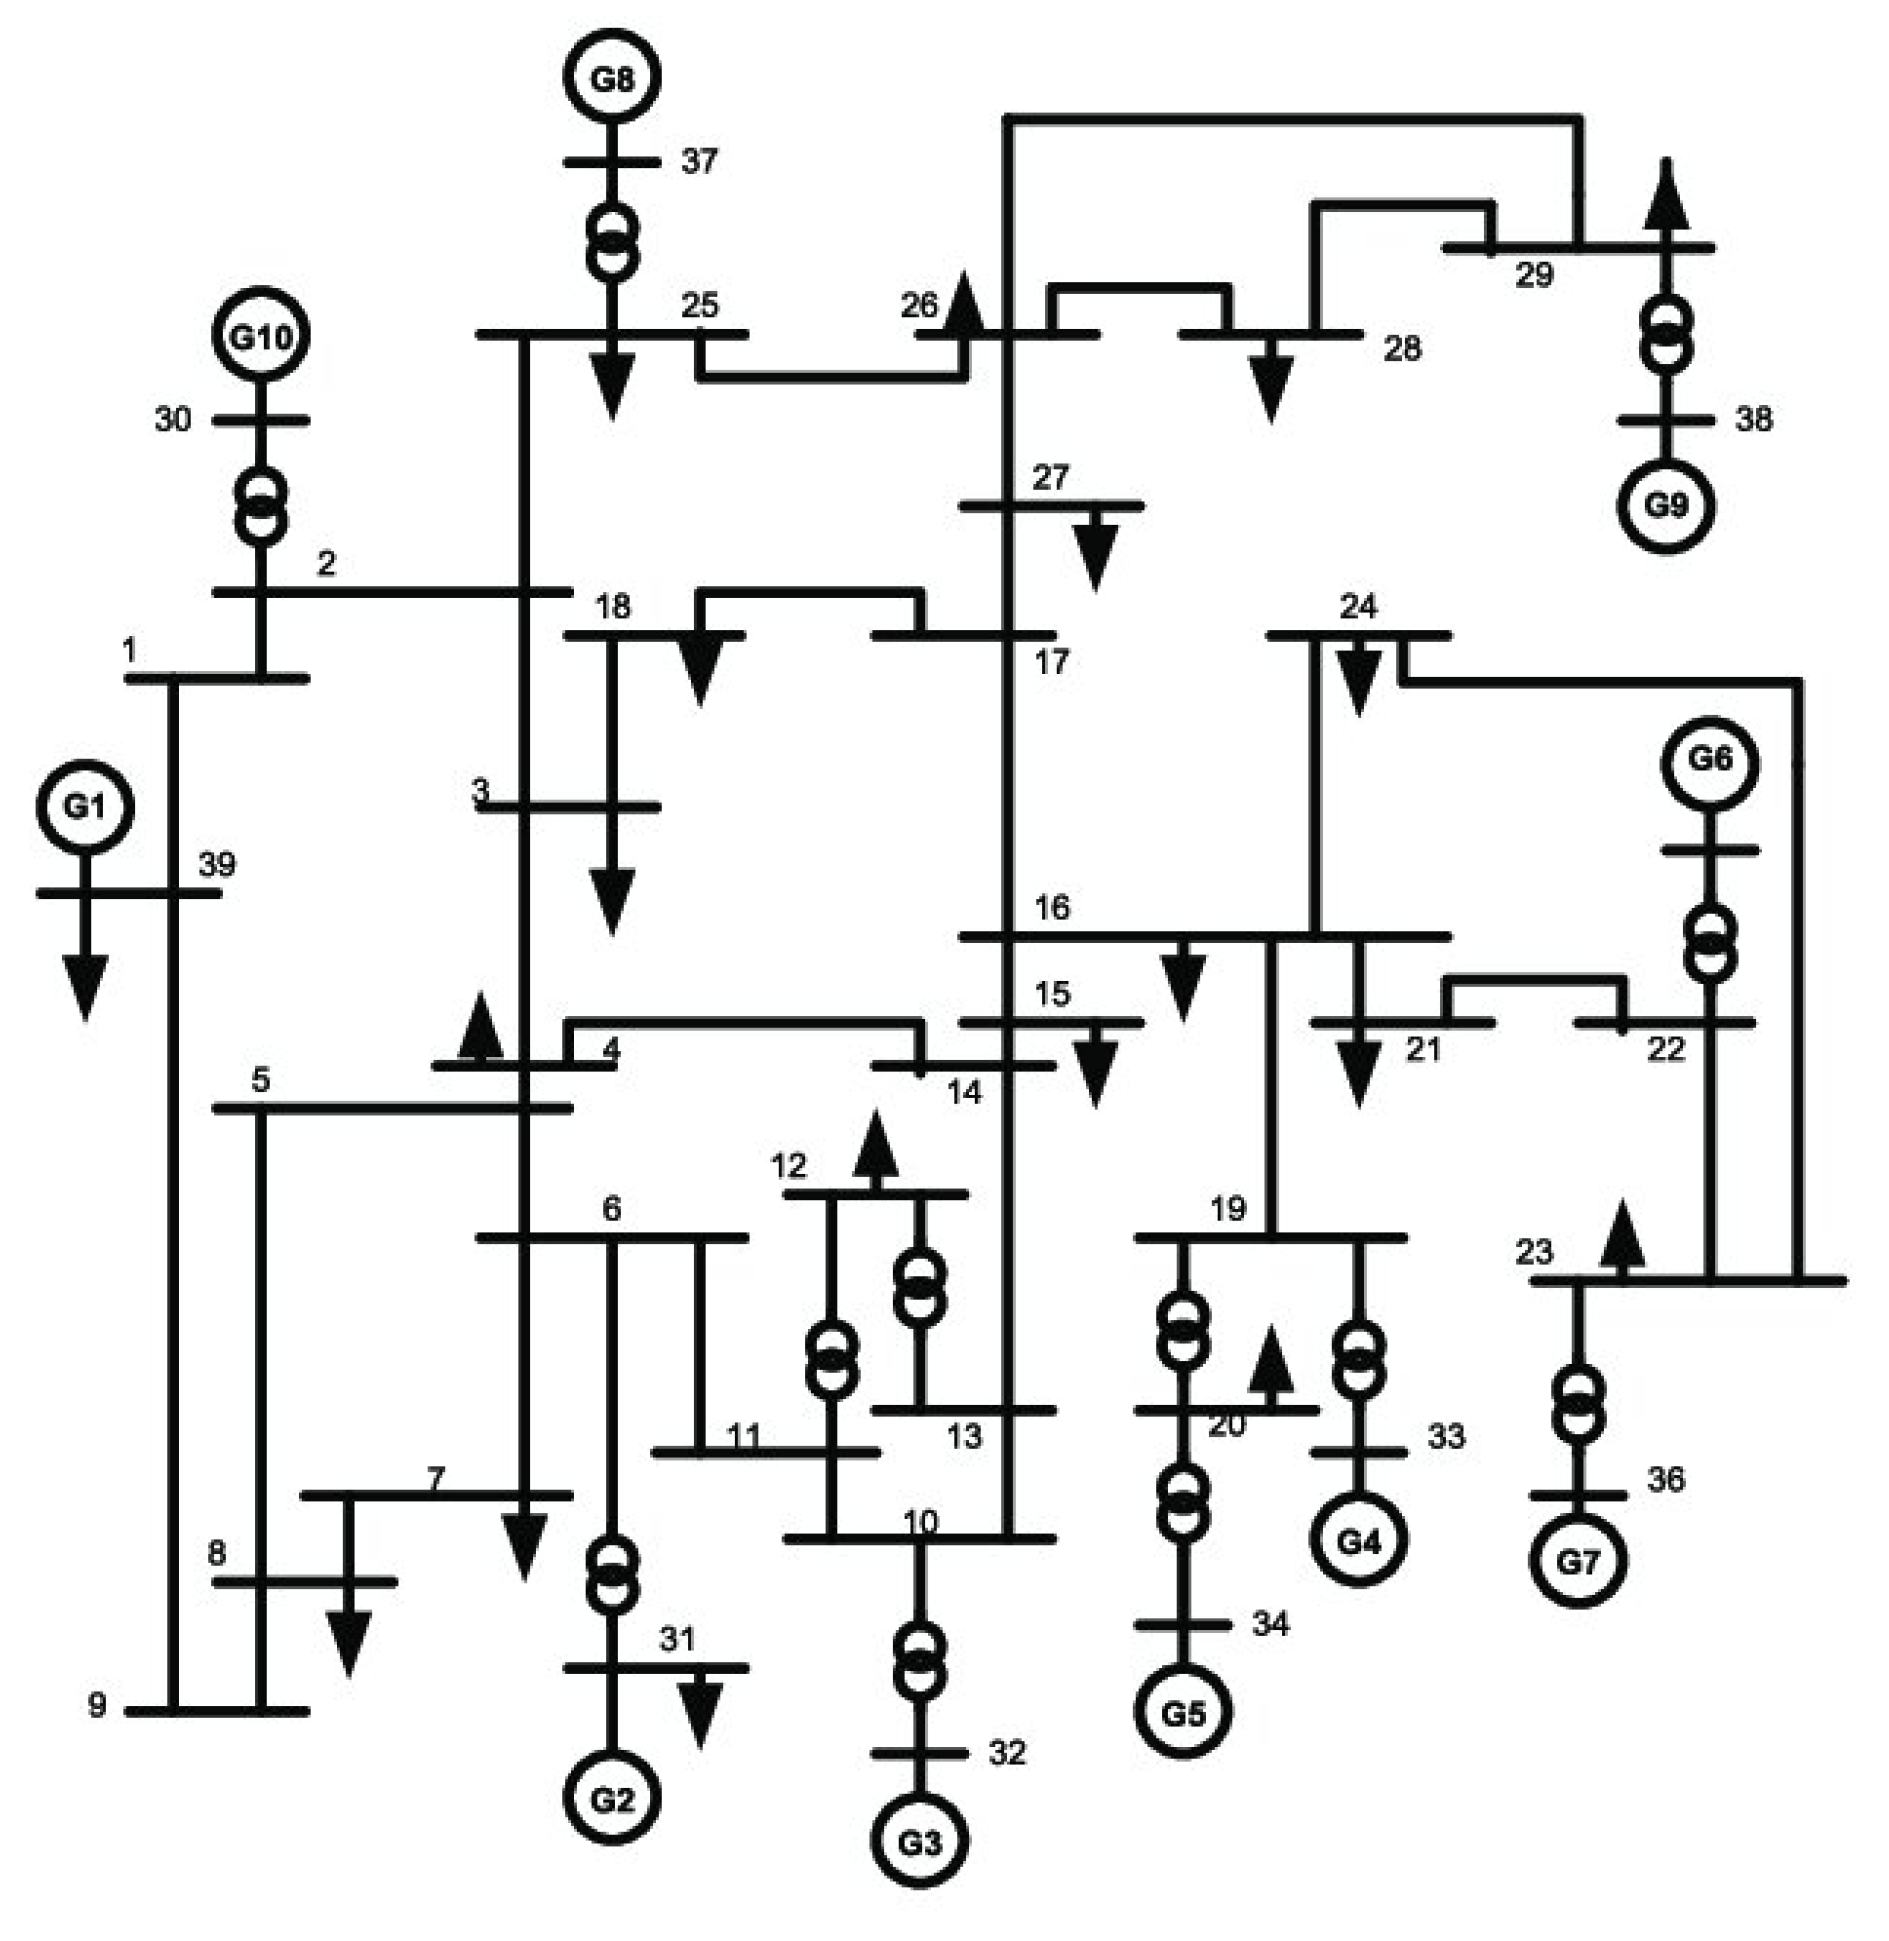
Figure 5.
Baseline system frequency response.
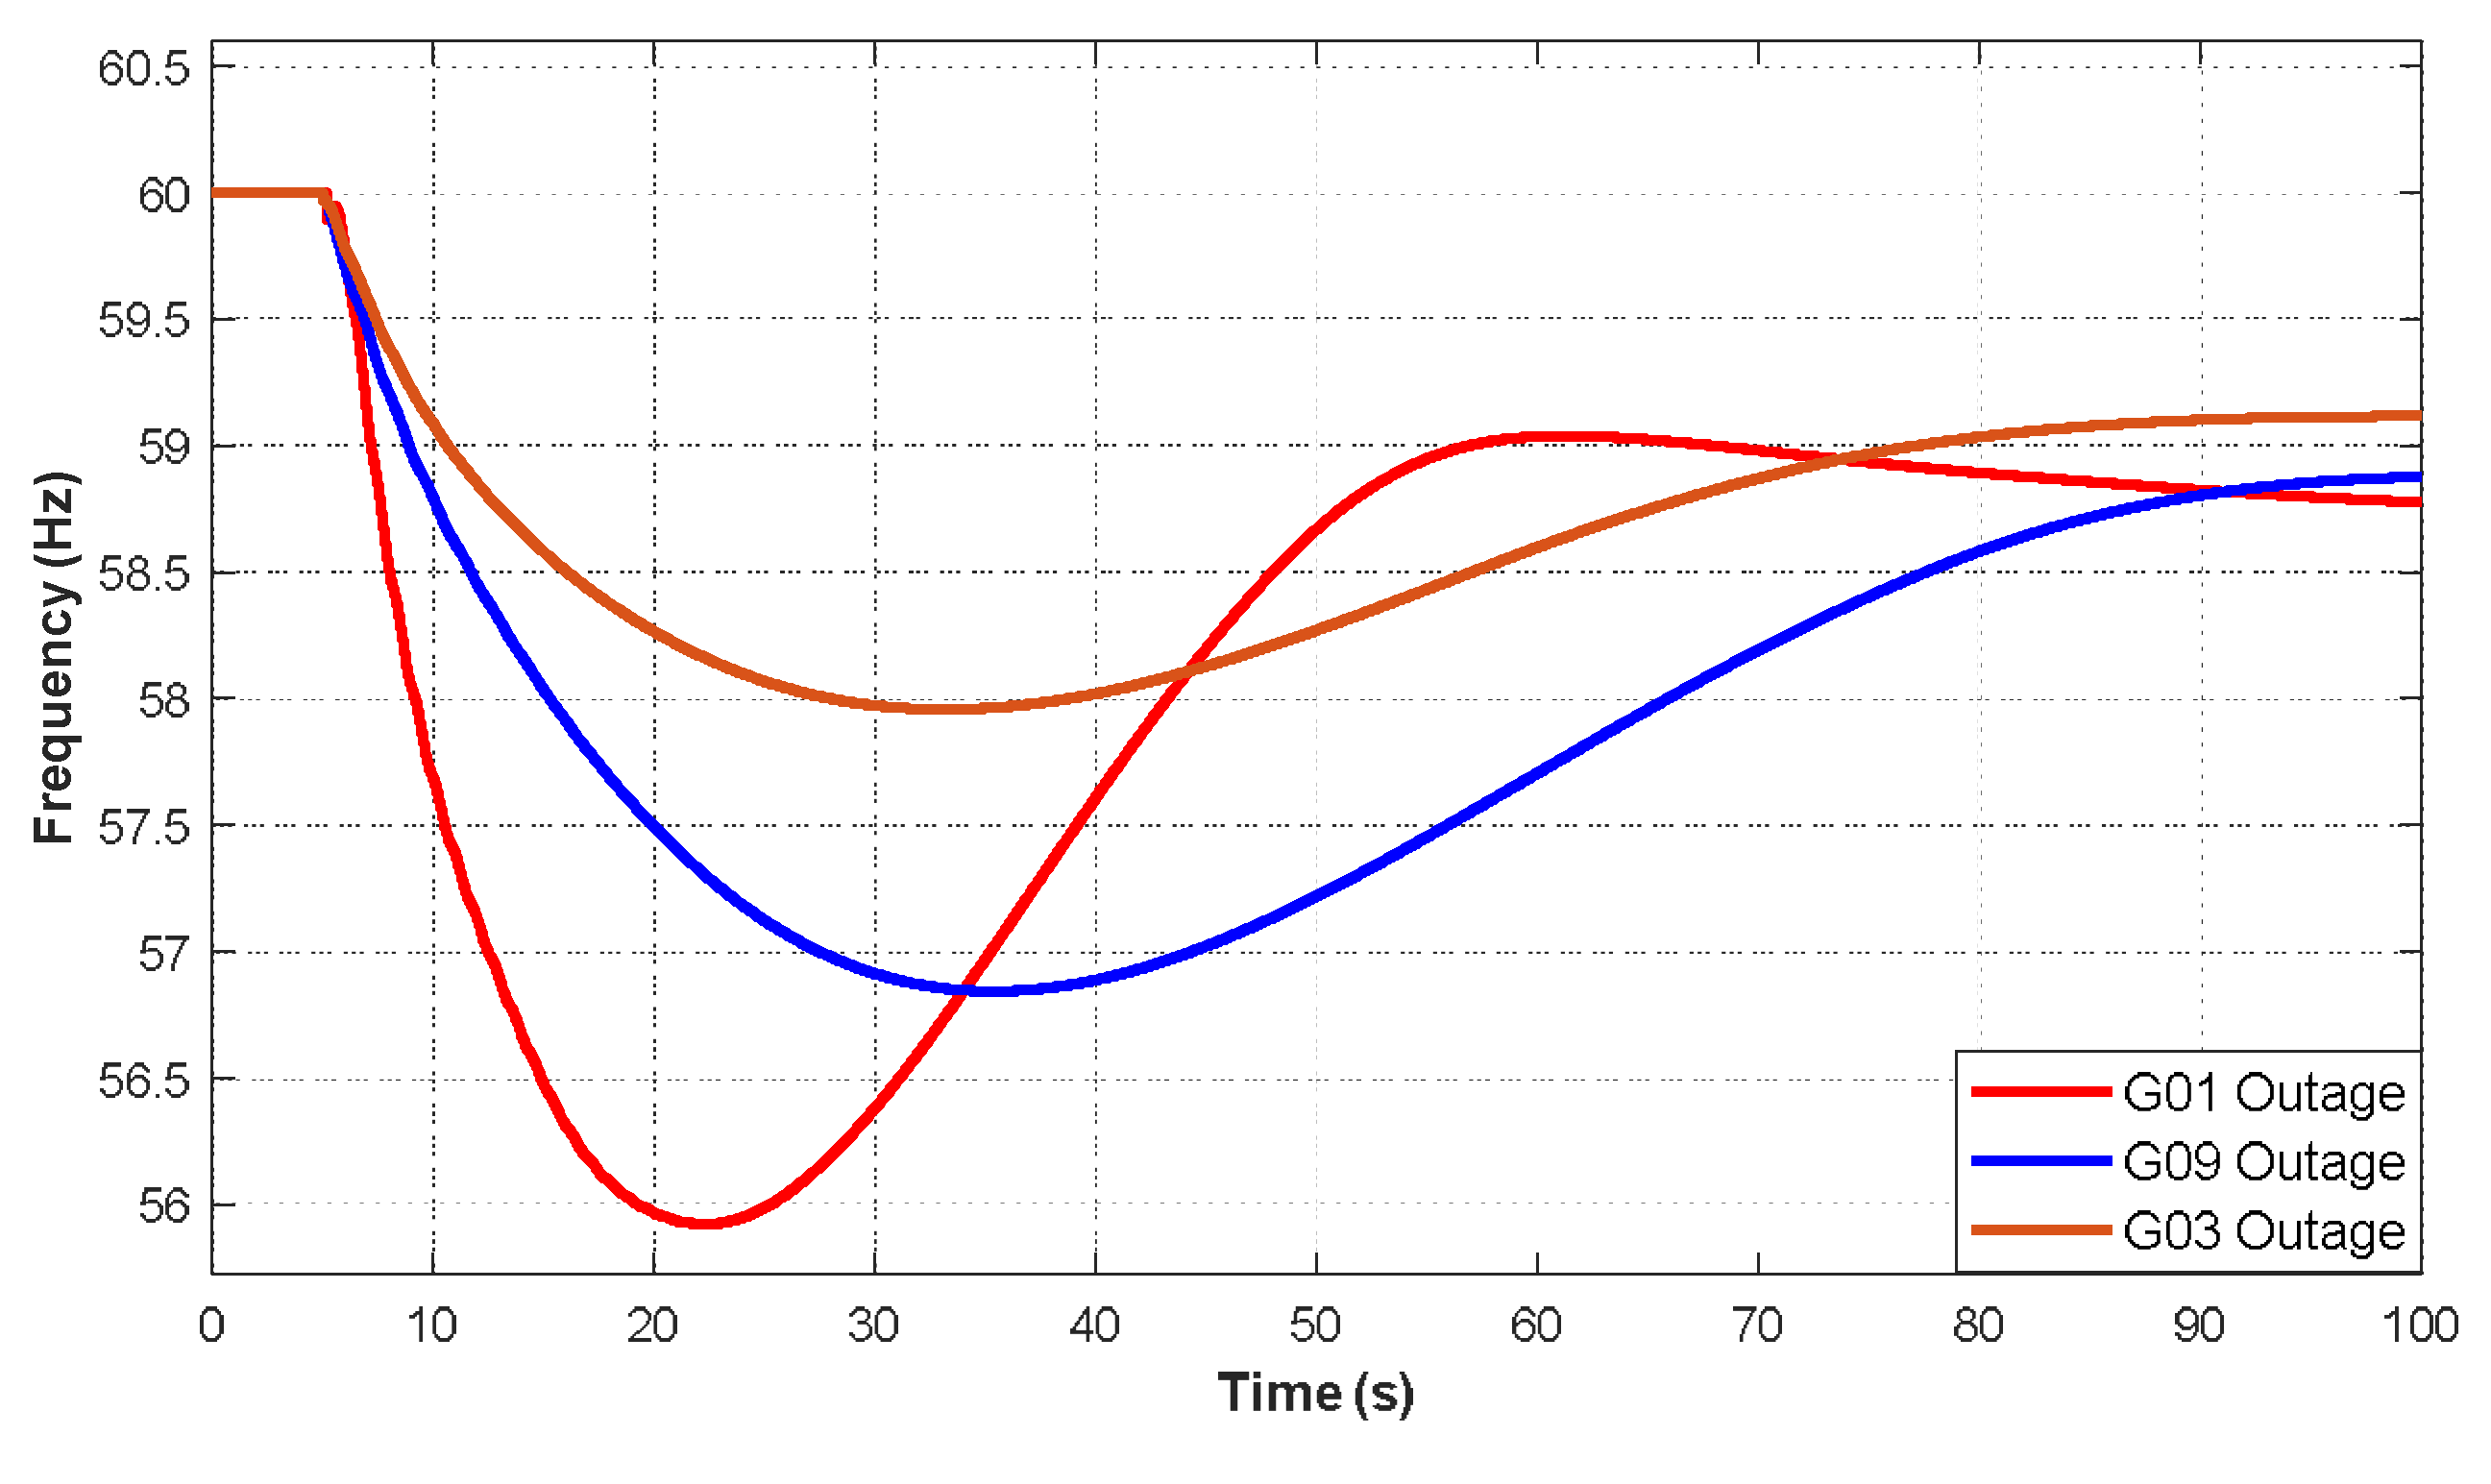
Figure 6.
BESS size and frequency nadir improvement.
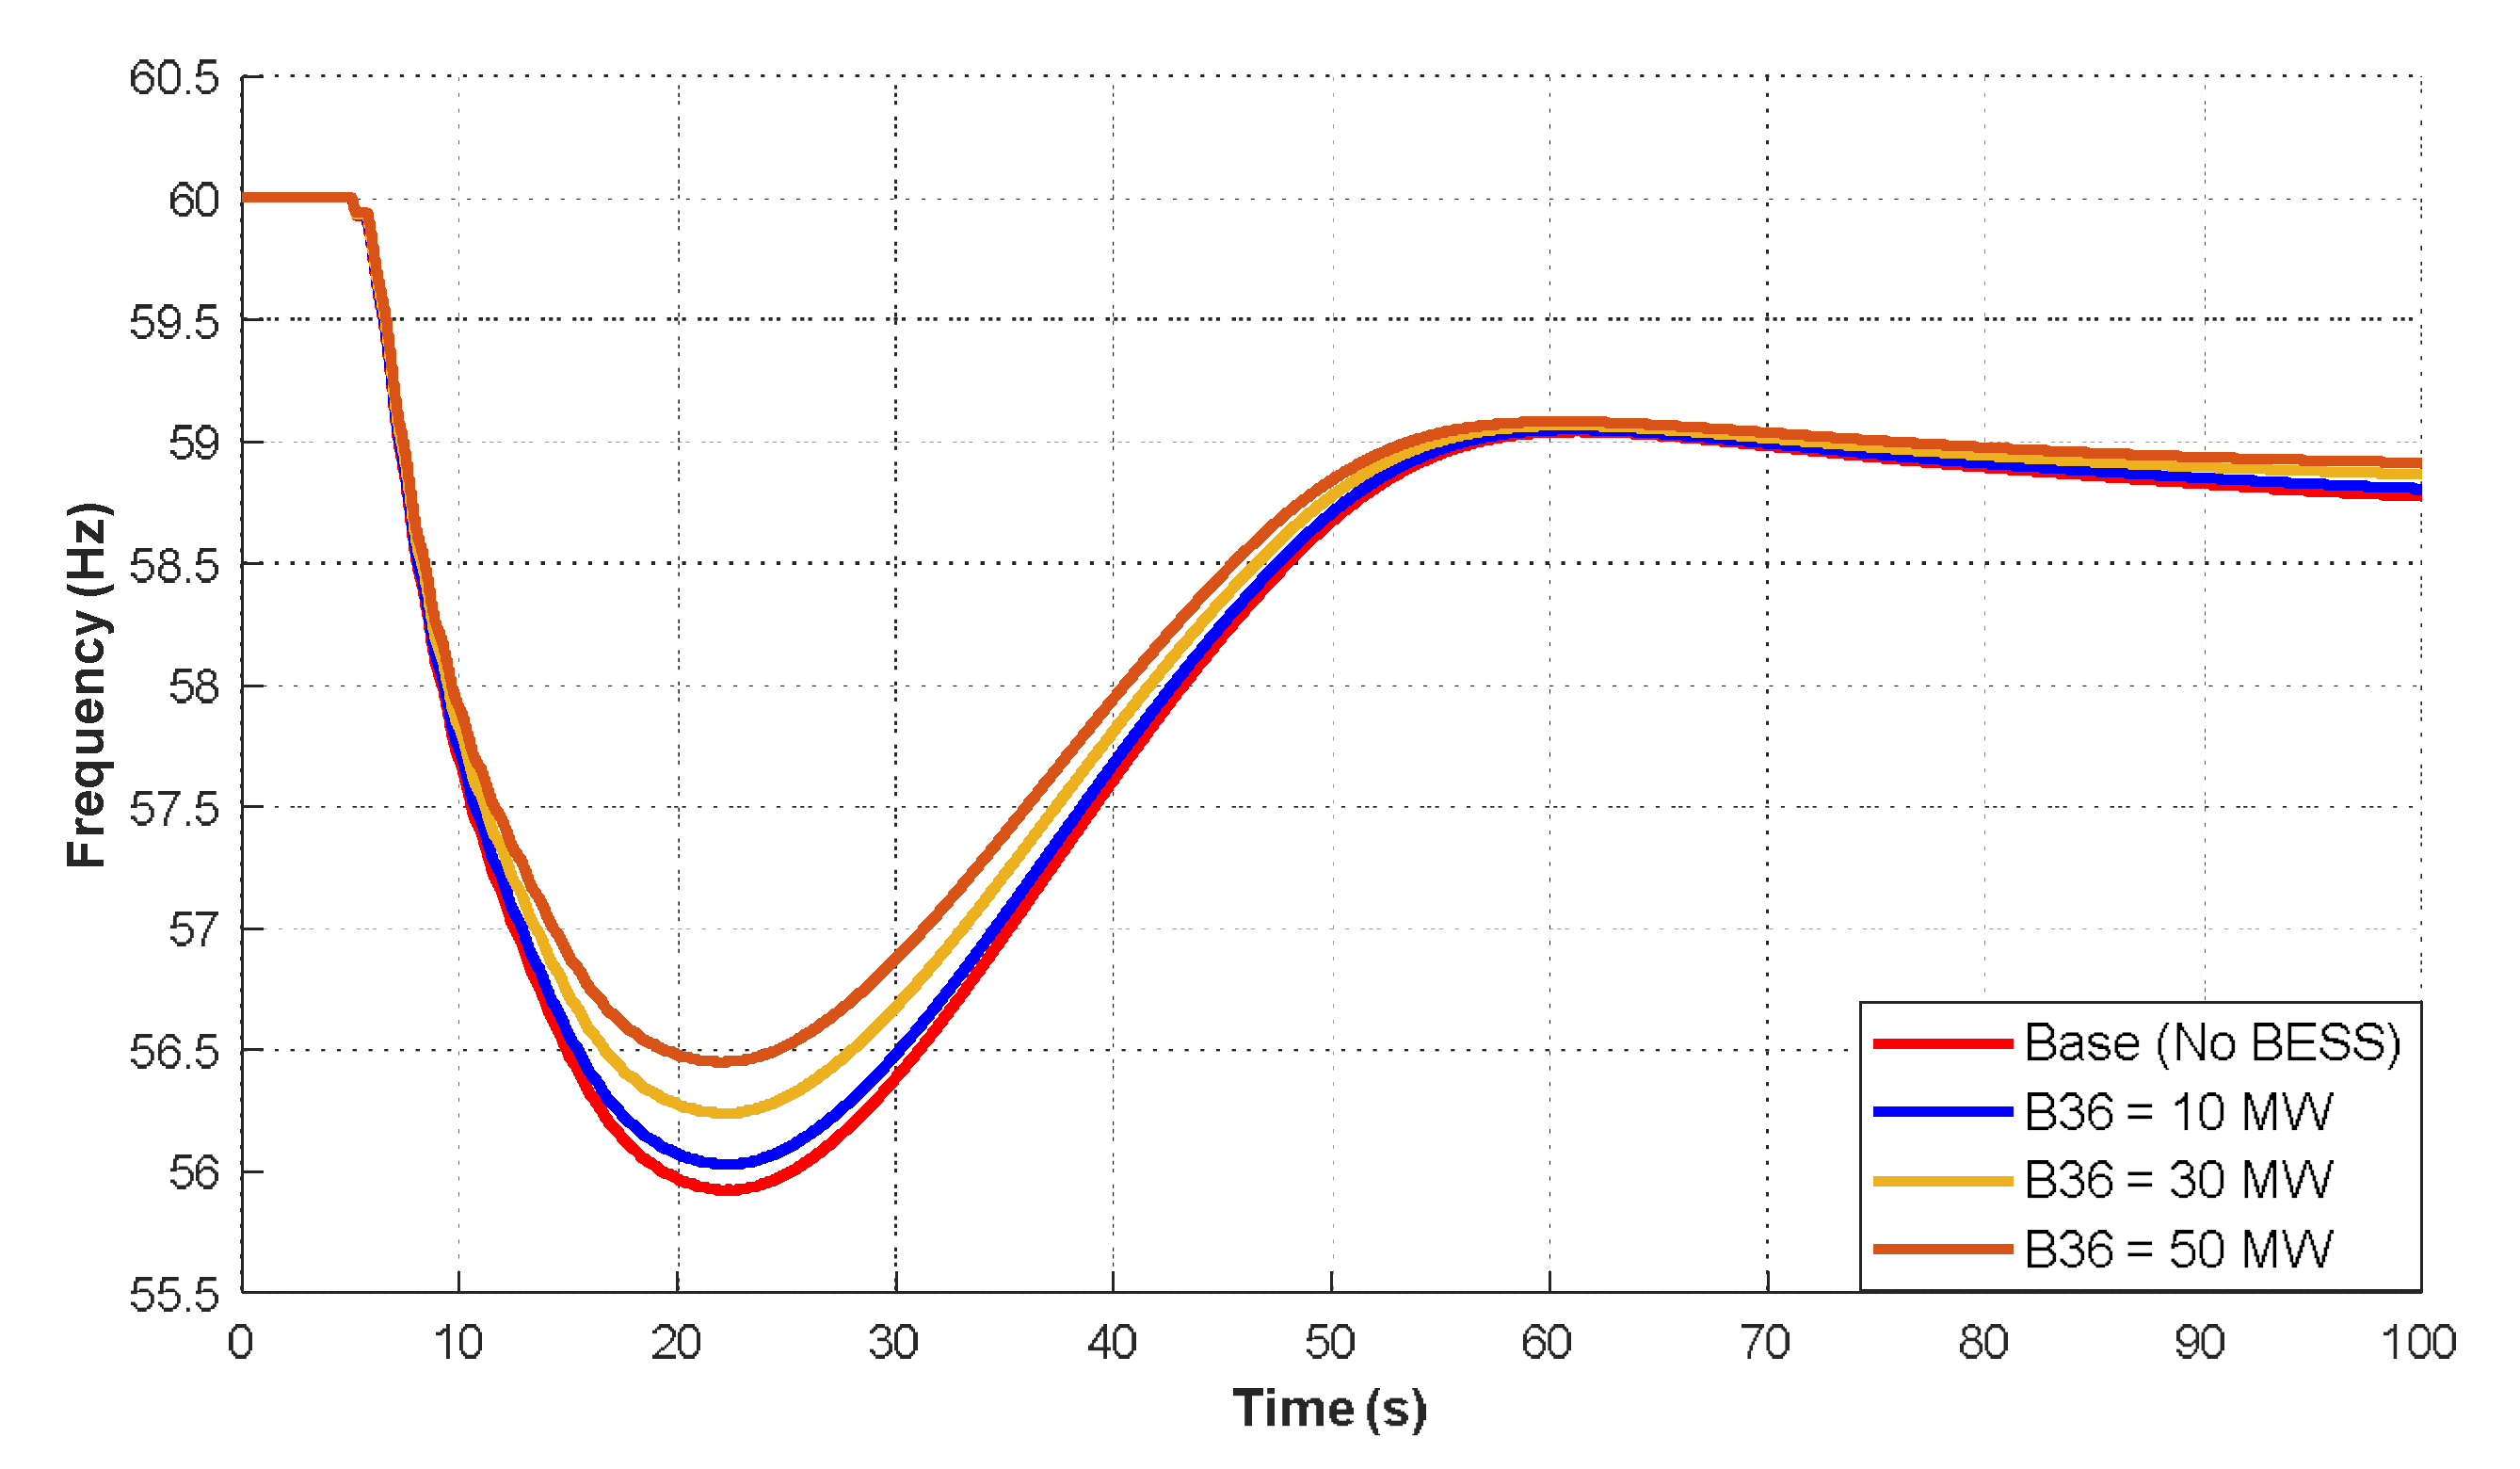
Figure 7.
Network influence weights.
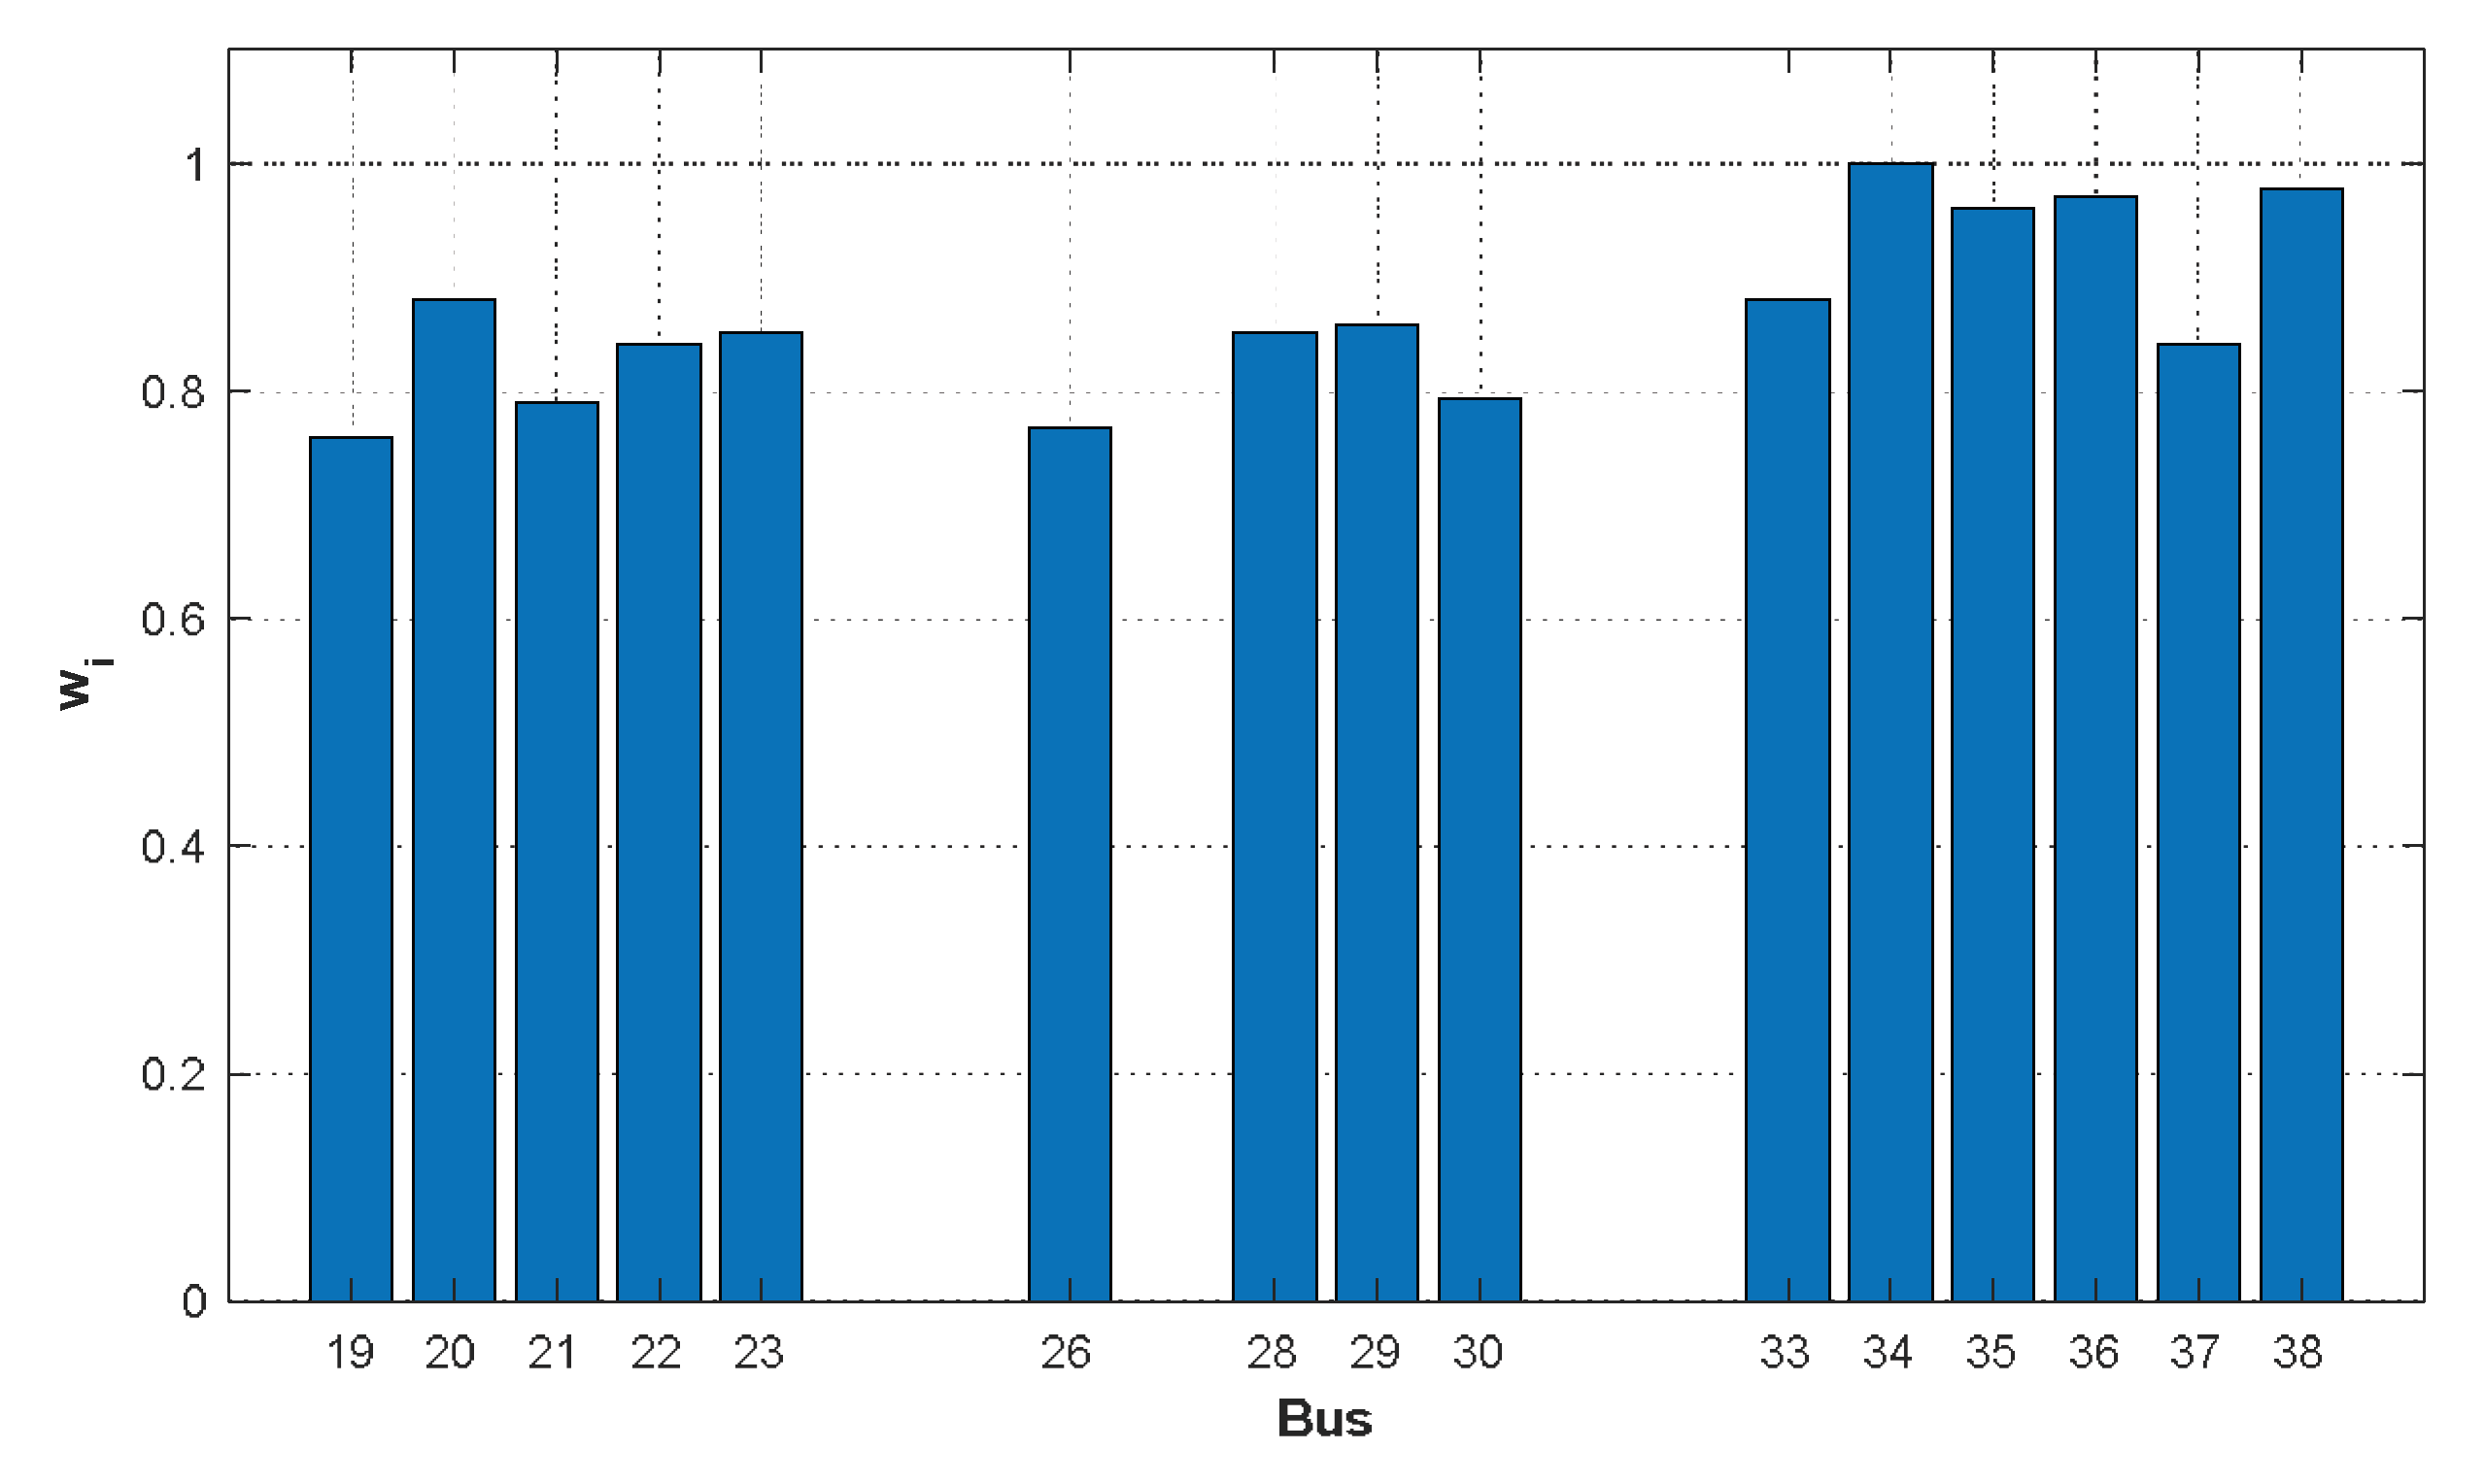
Figure 8.
Ranking of candidate buses according to the frequency impact index.
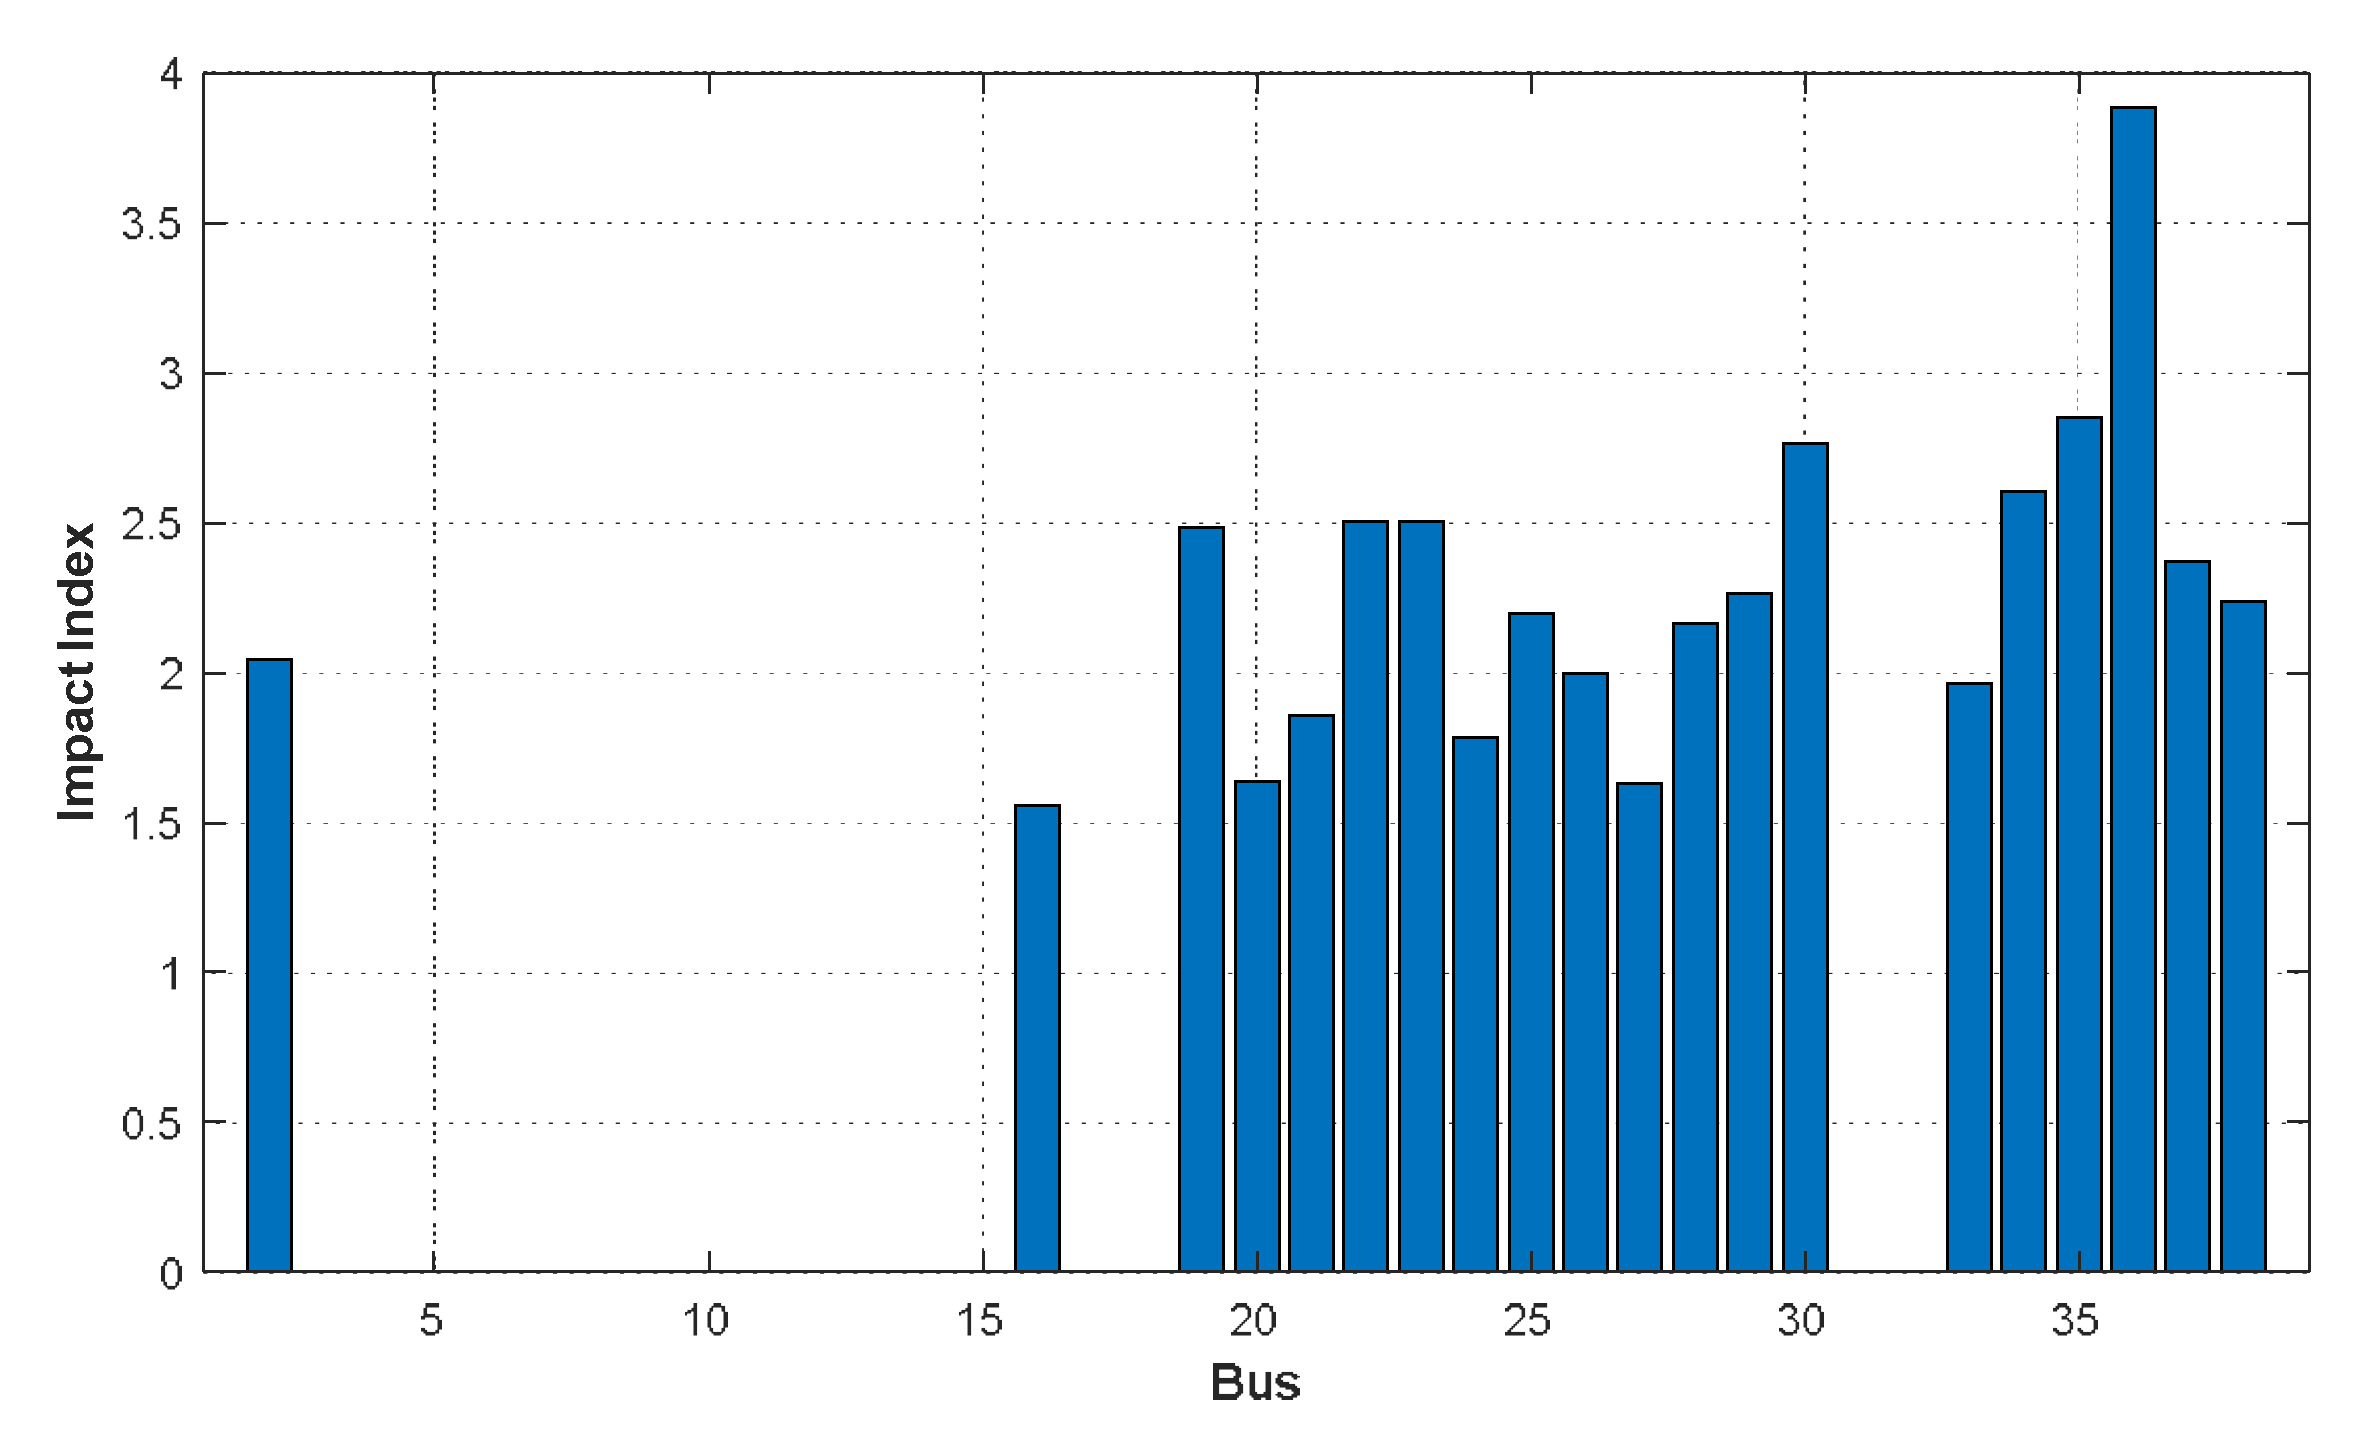
Figure 9.
PSO convergence.
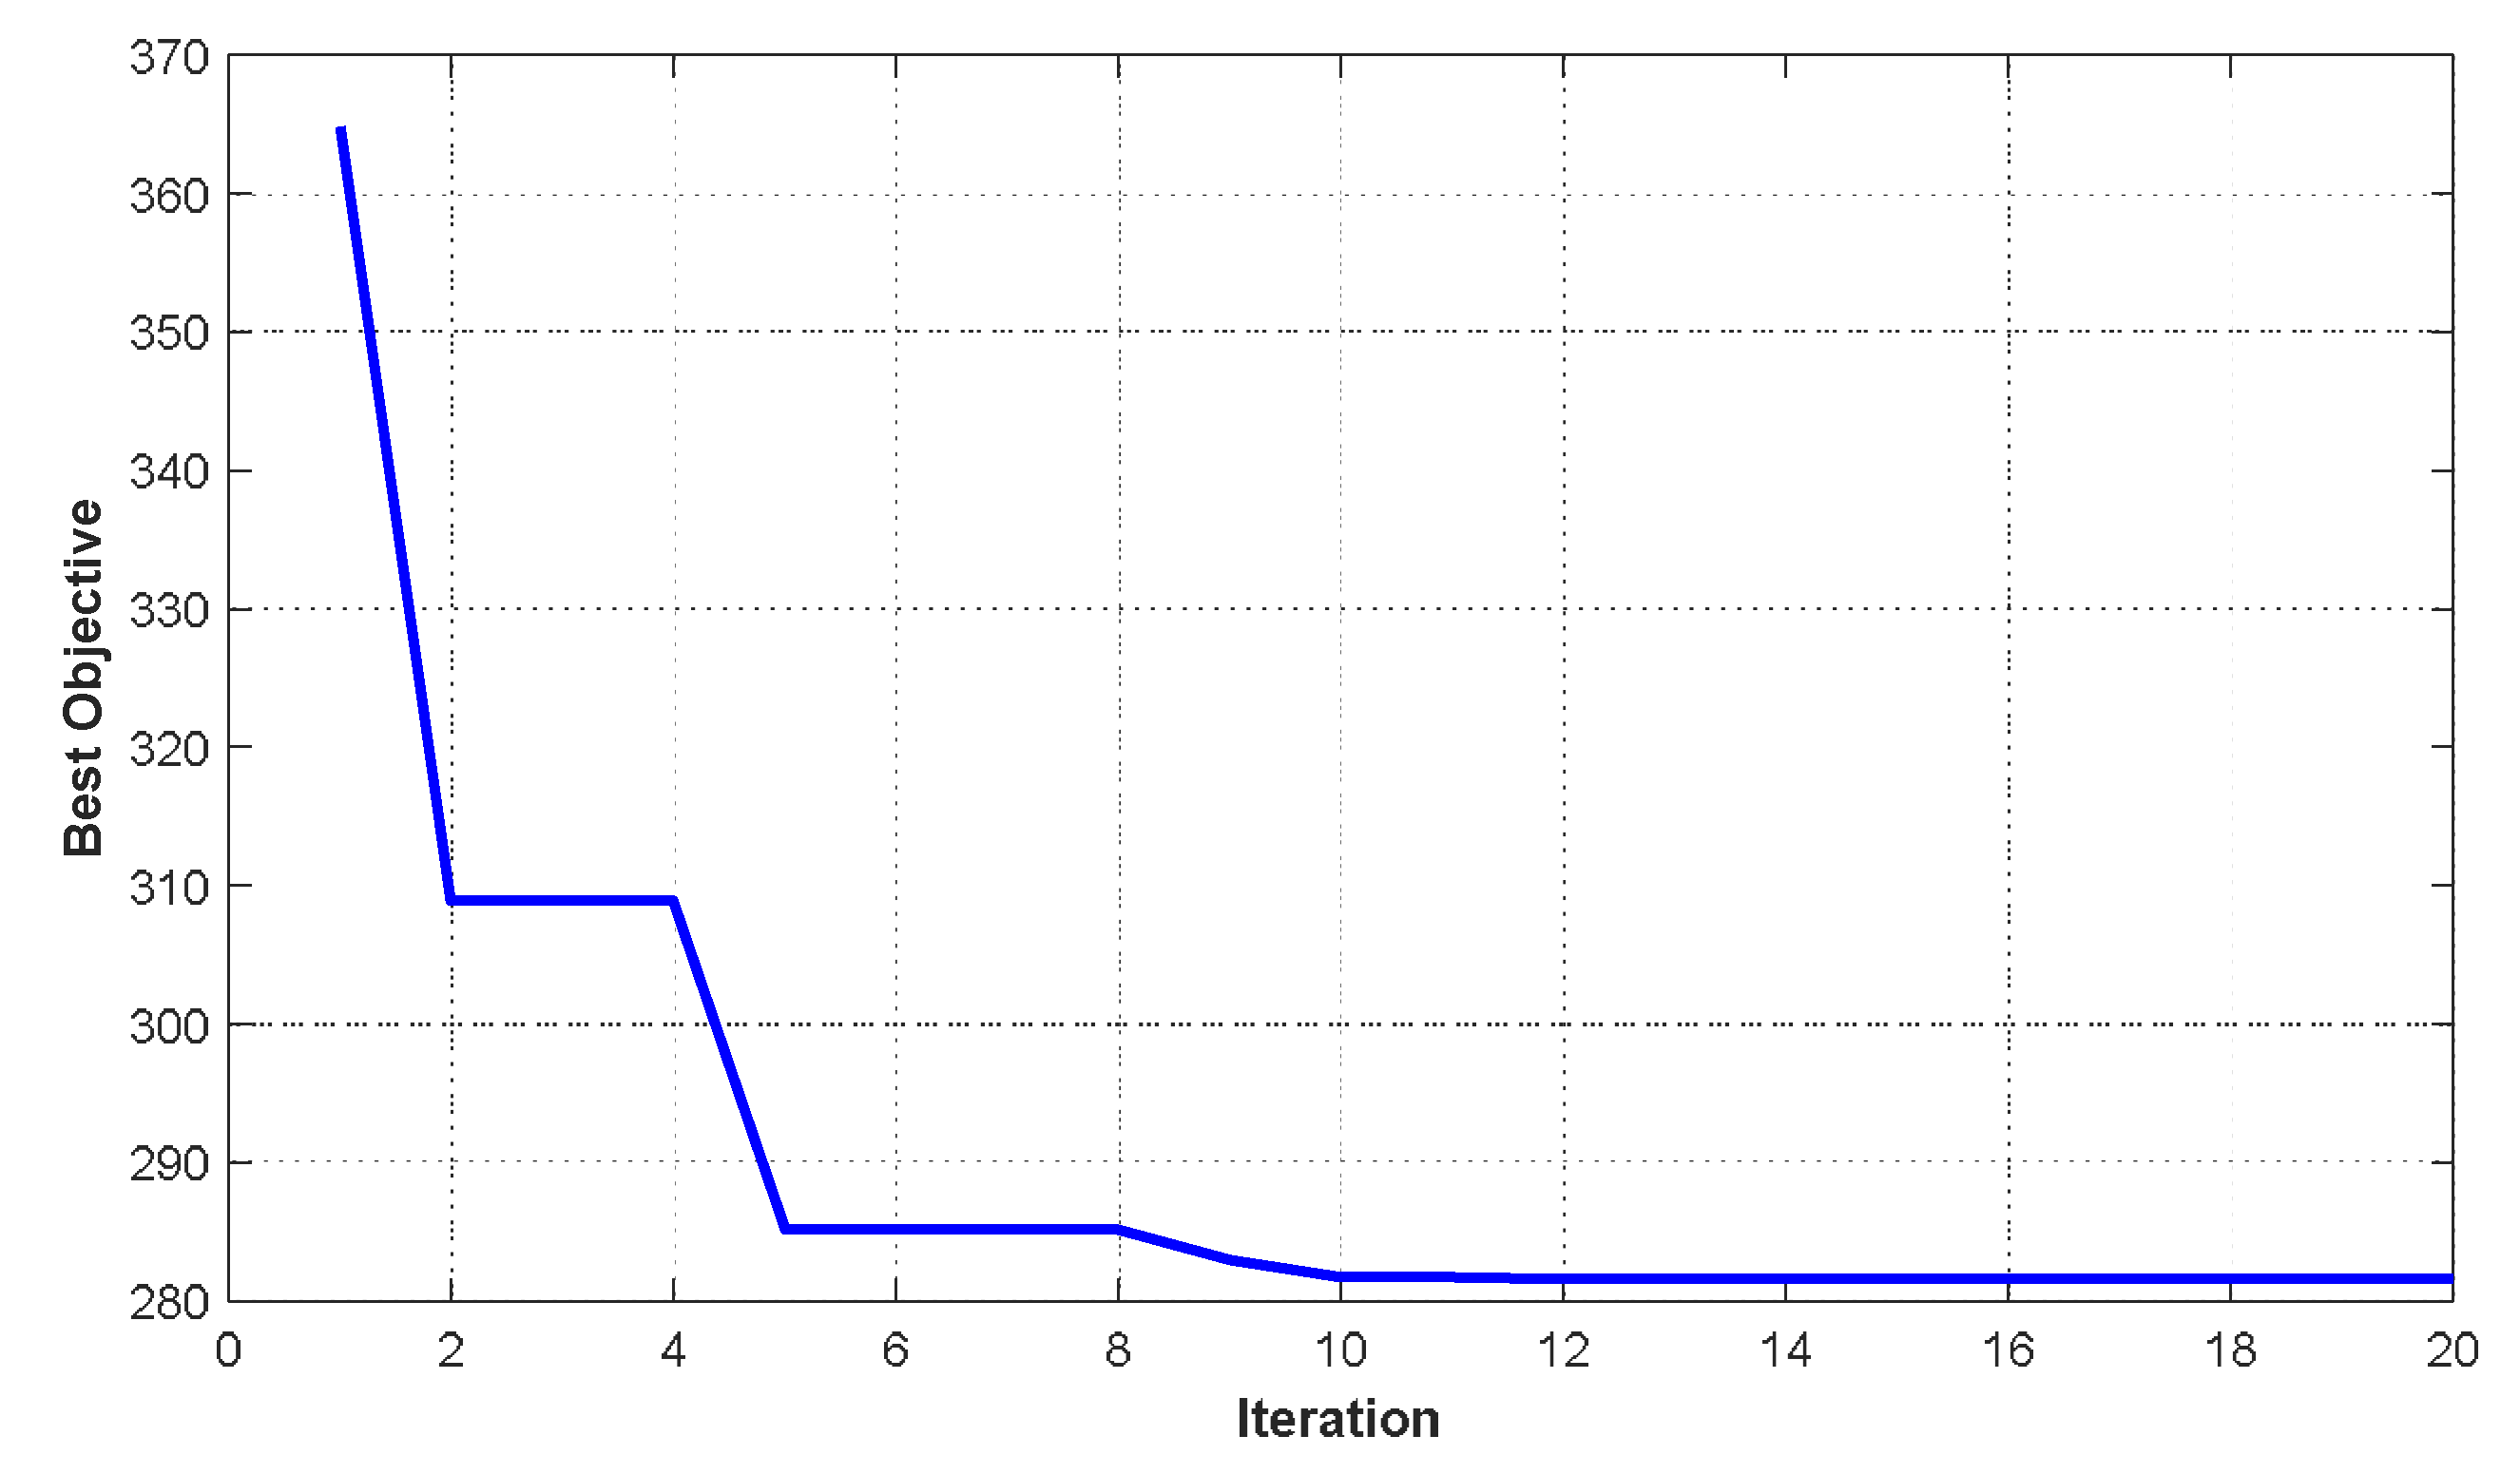
Figure 10.
G01 Outage frequency response.
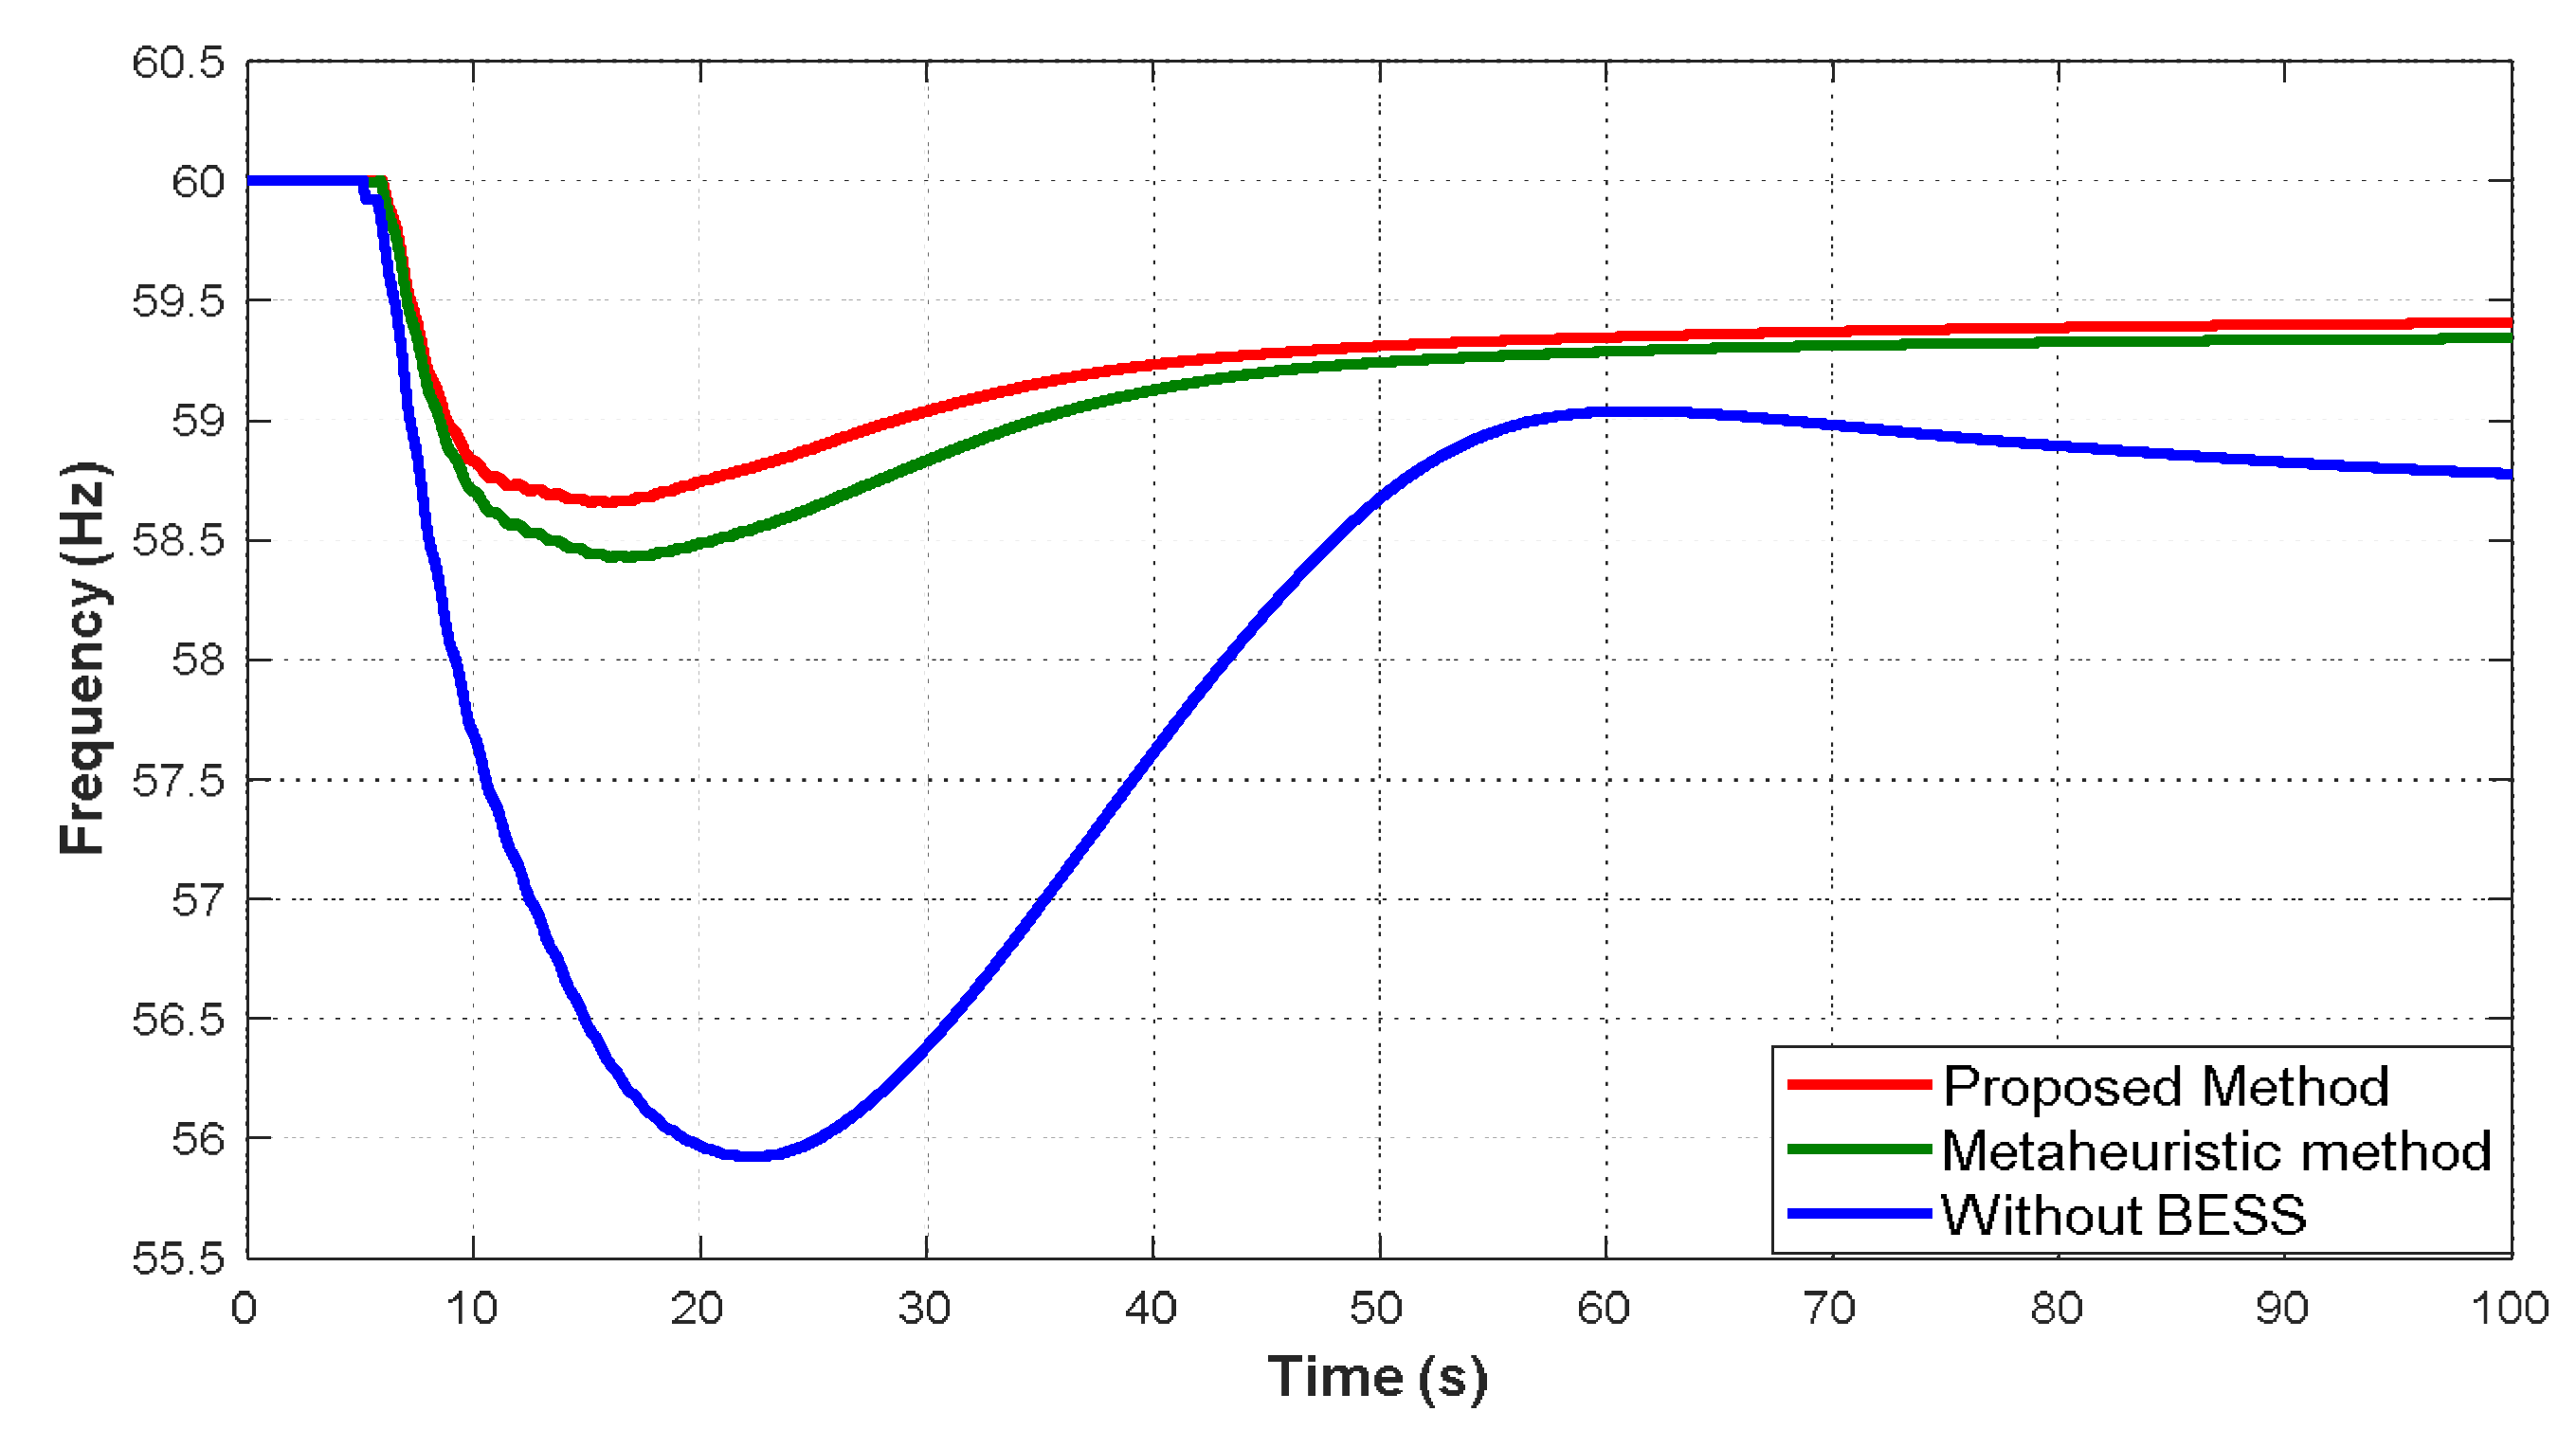
Figure 11.
G09 Outage frequency response.
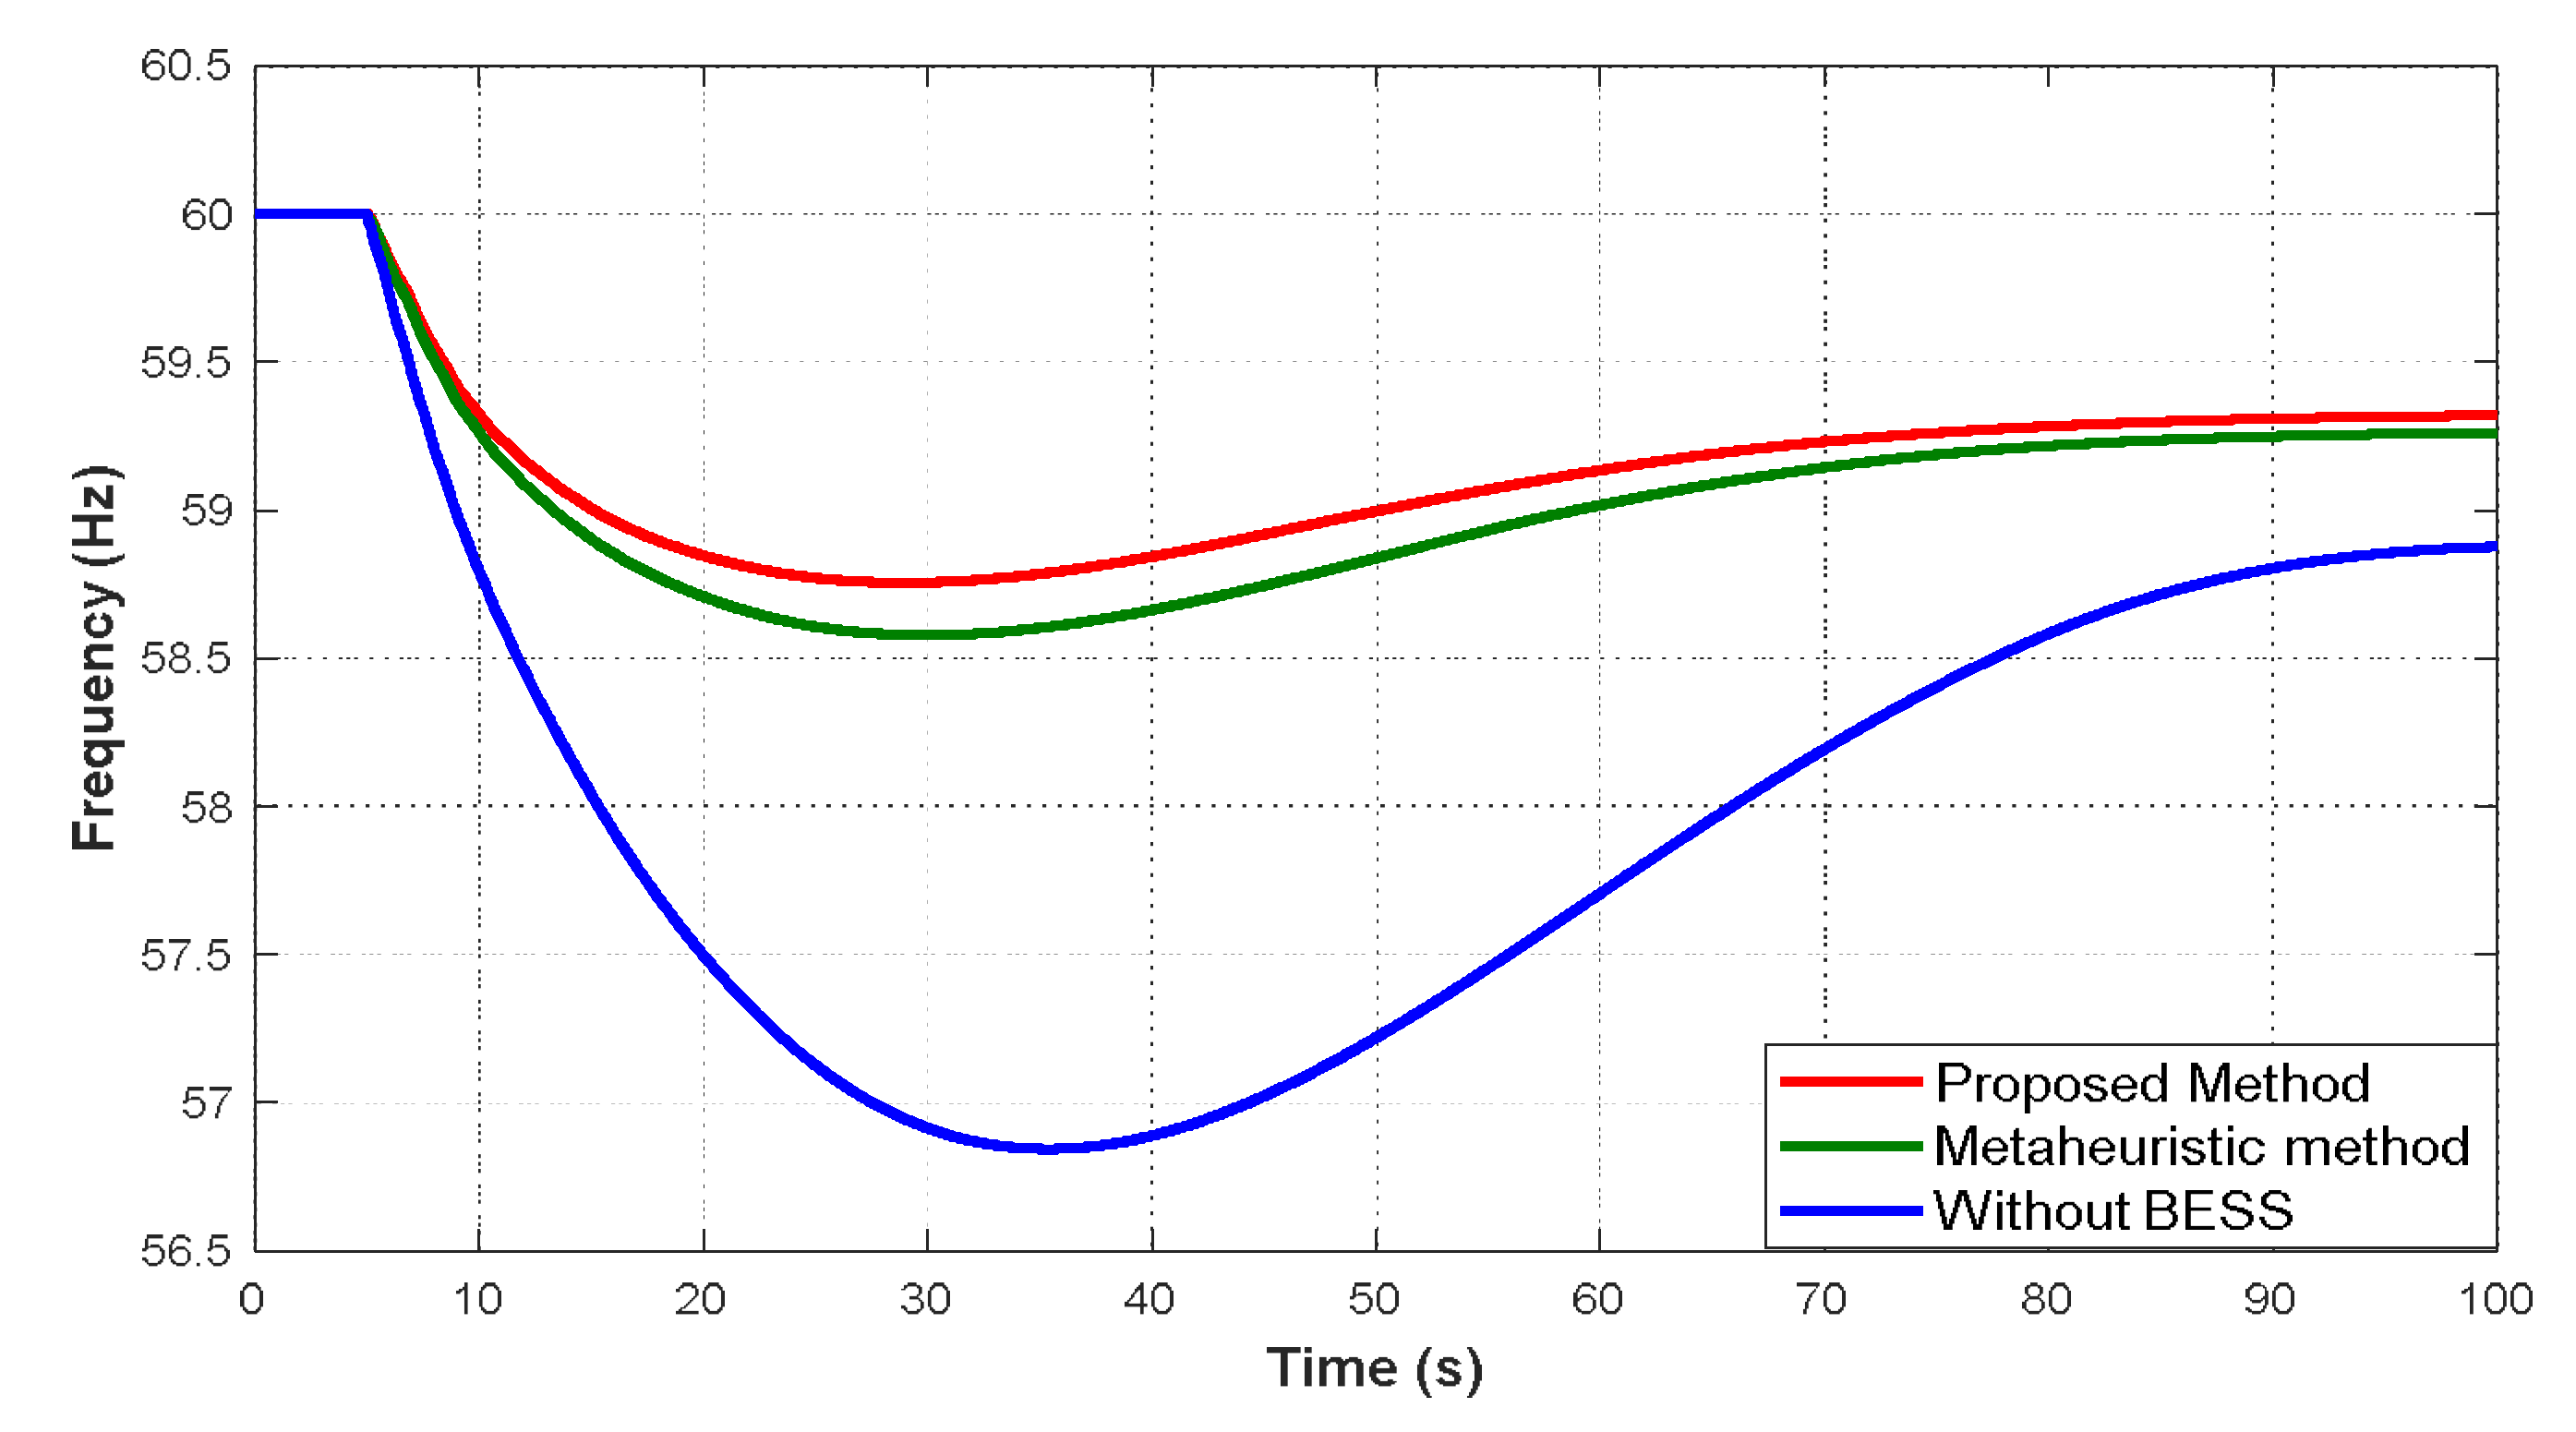
Figure 12.
G03 Outage frequency response.
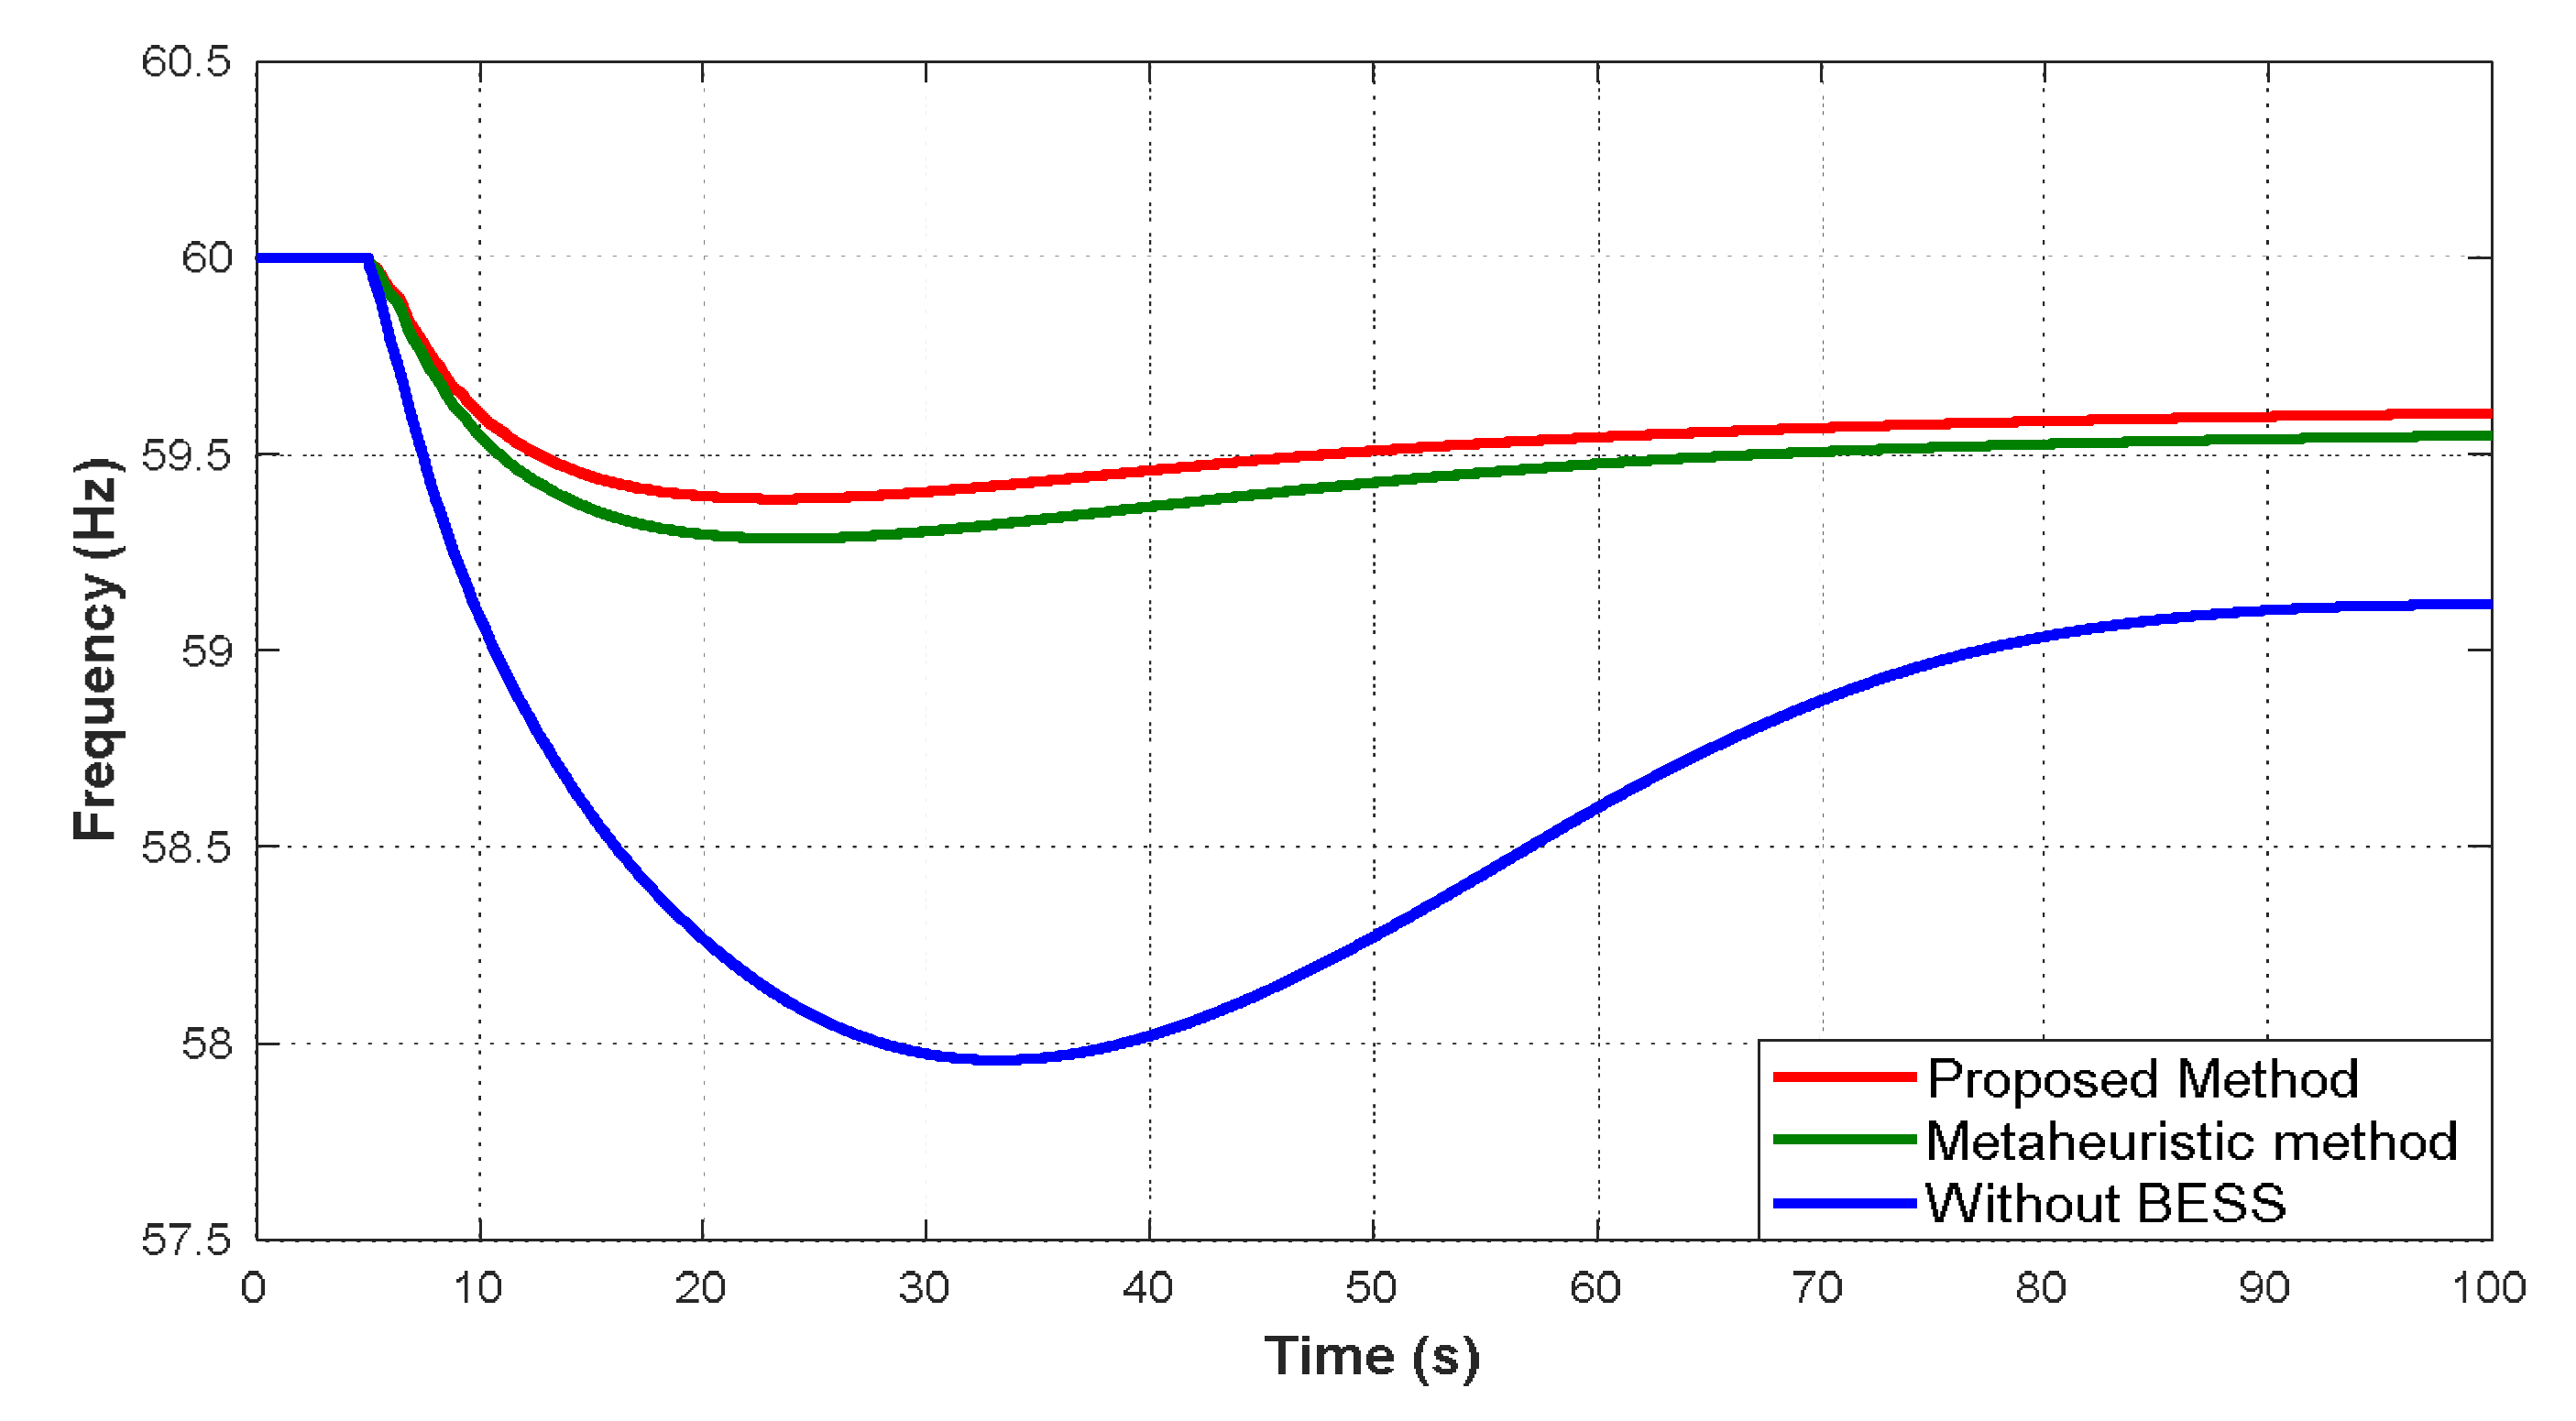
Figure 13.
G01 outage under load decrease.
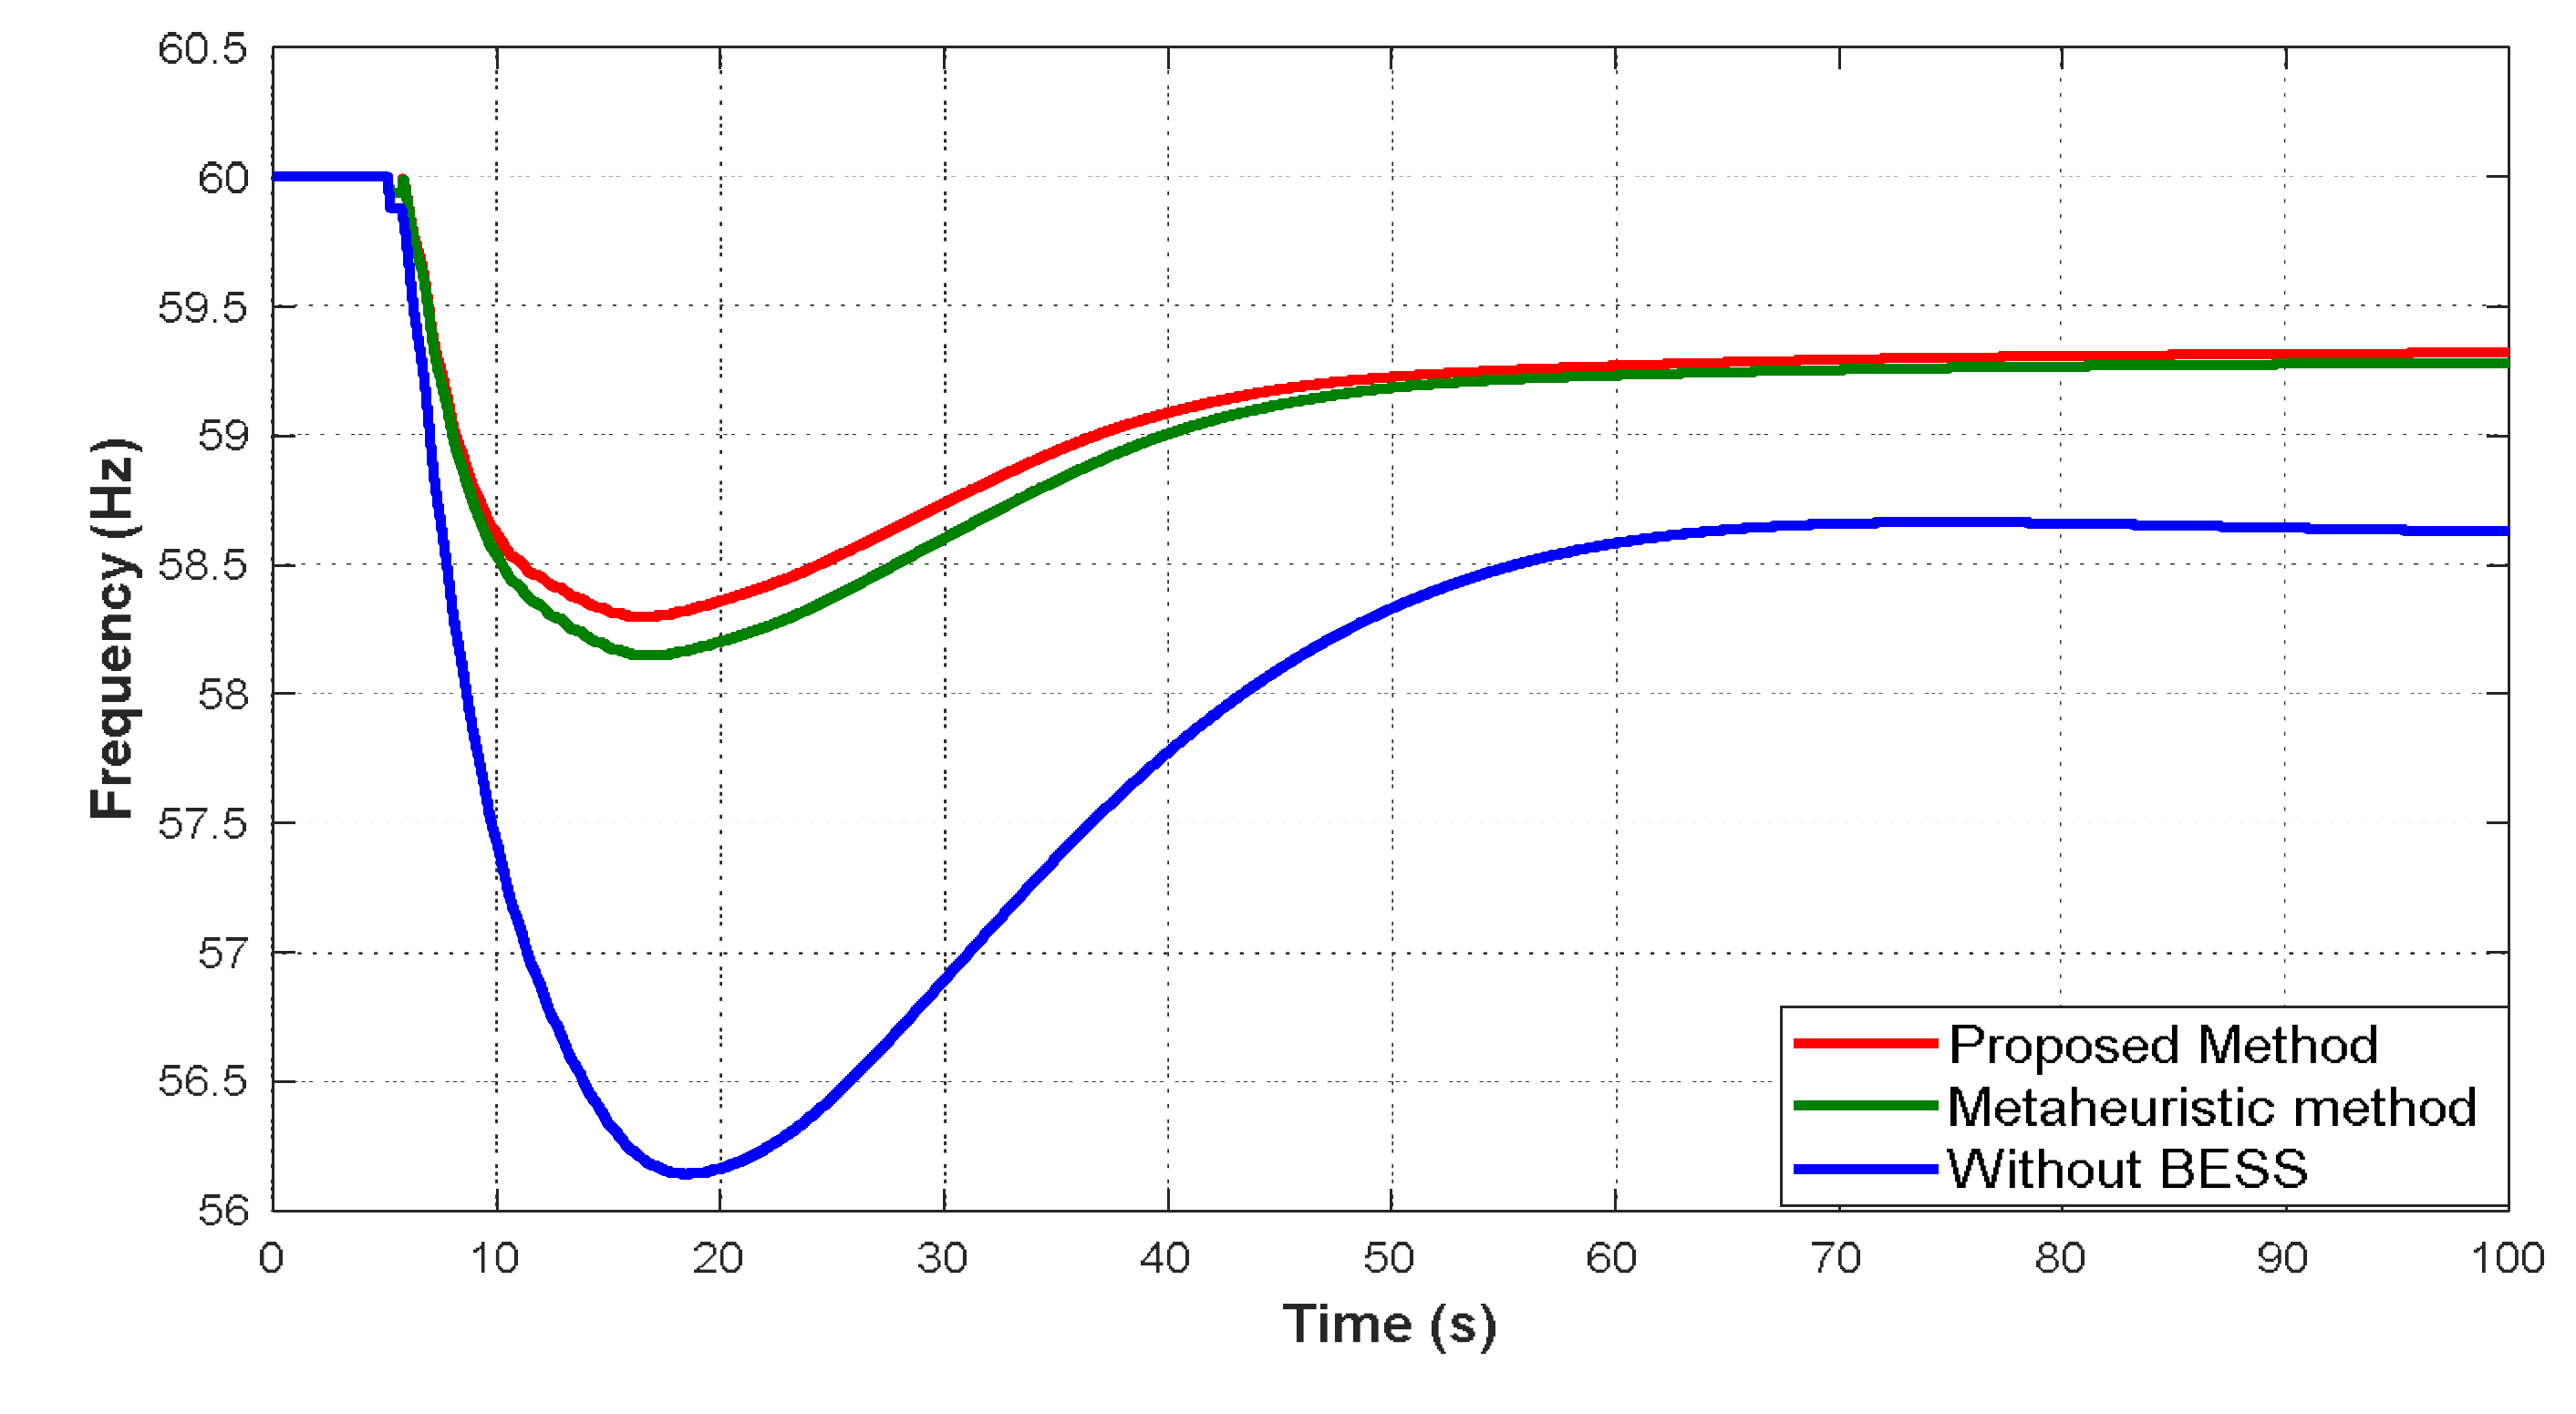
Figure 14.
G09 outage under load decrease.
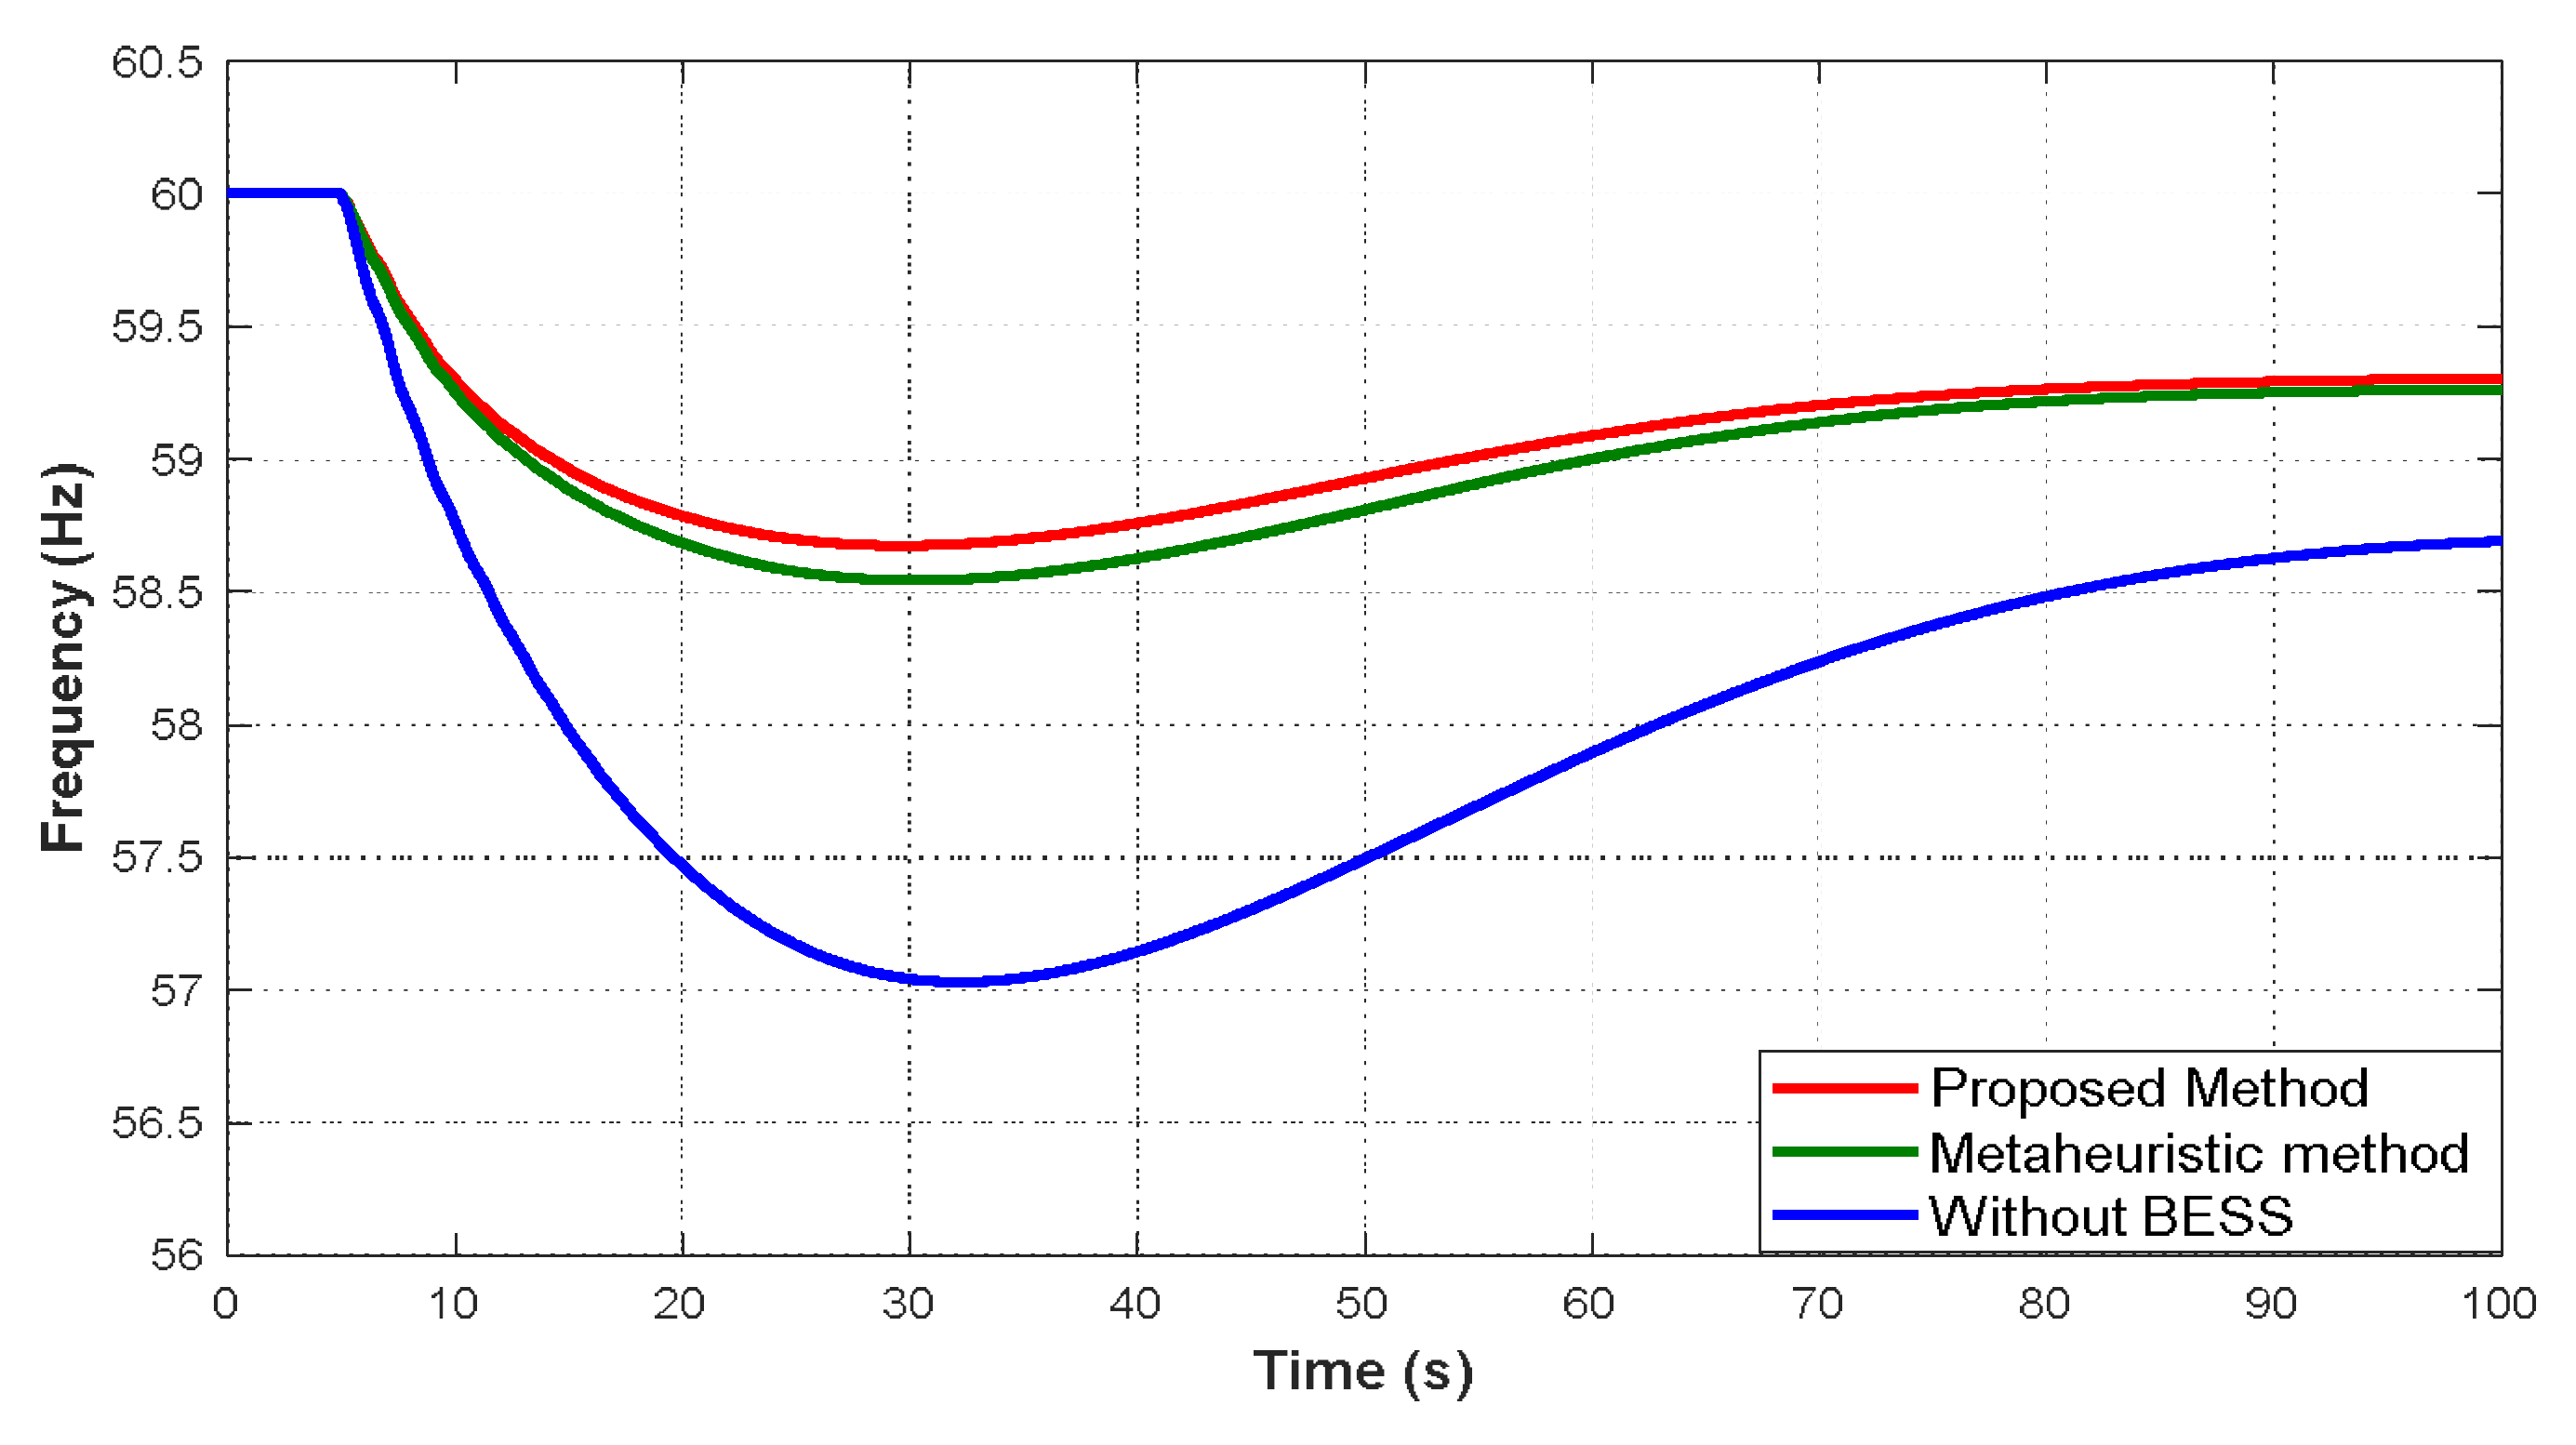
Figure 15.
G03 outage under load decrease.
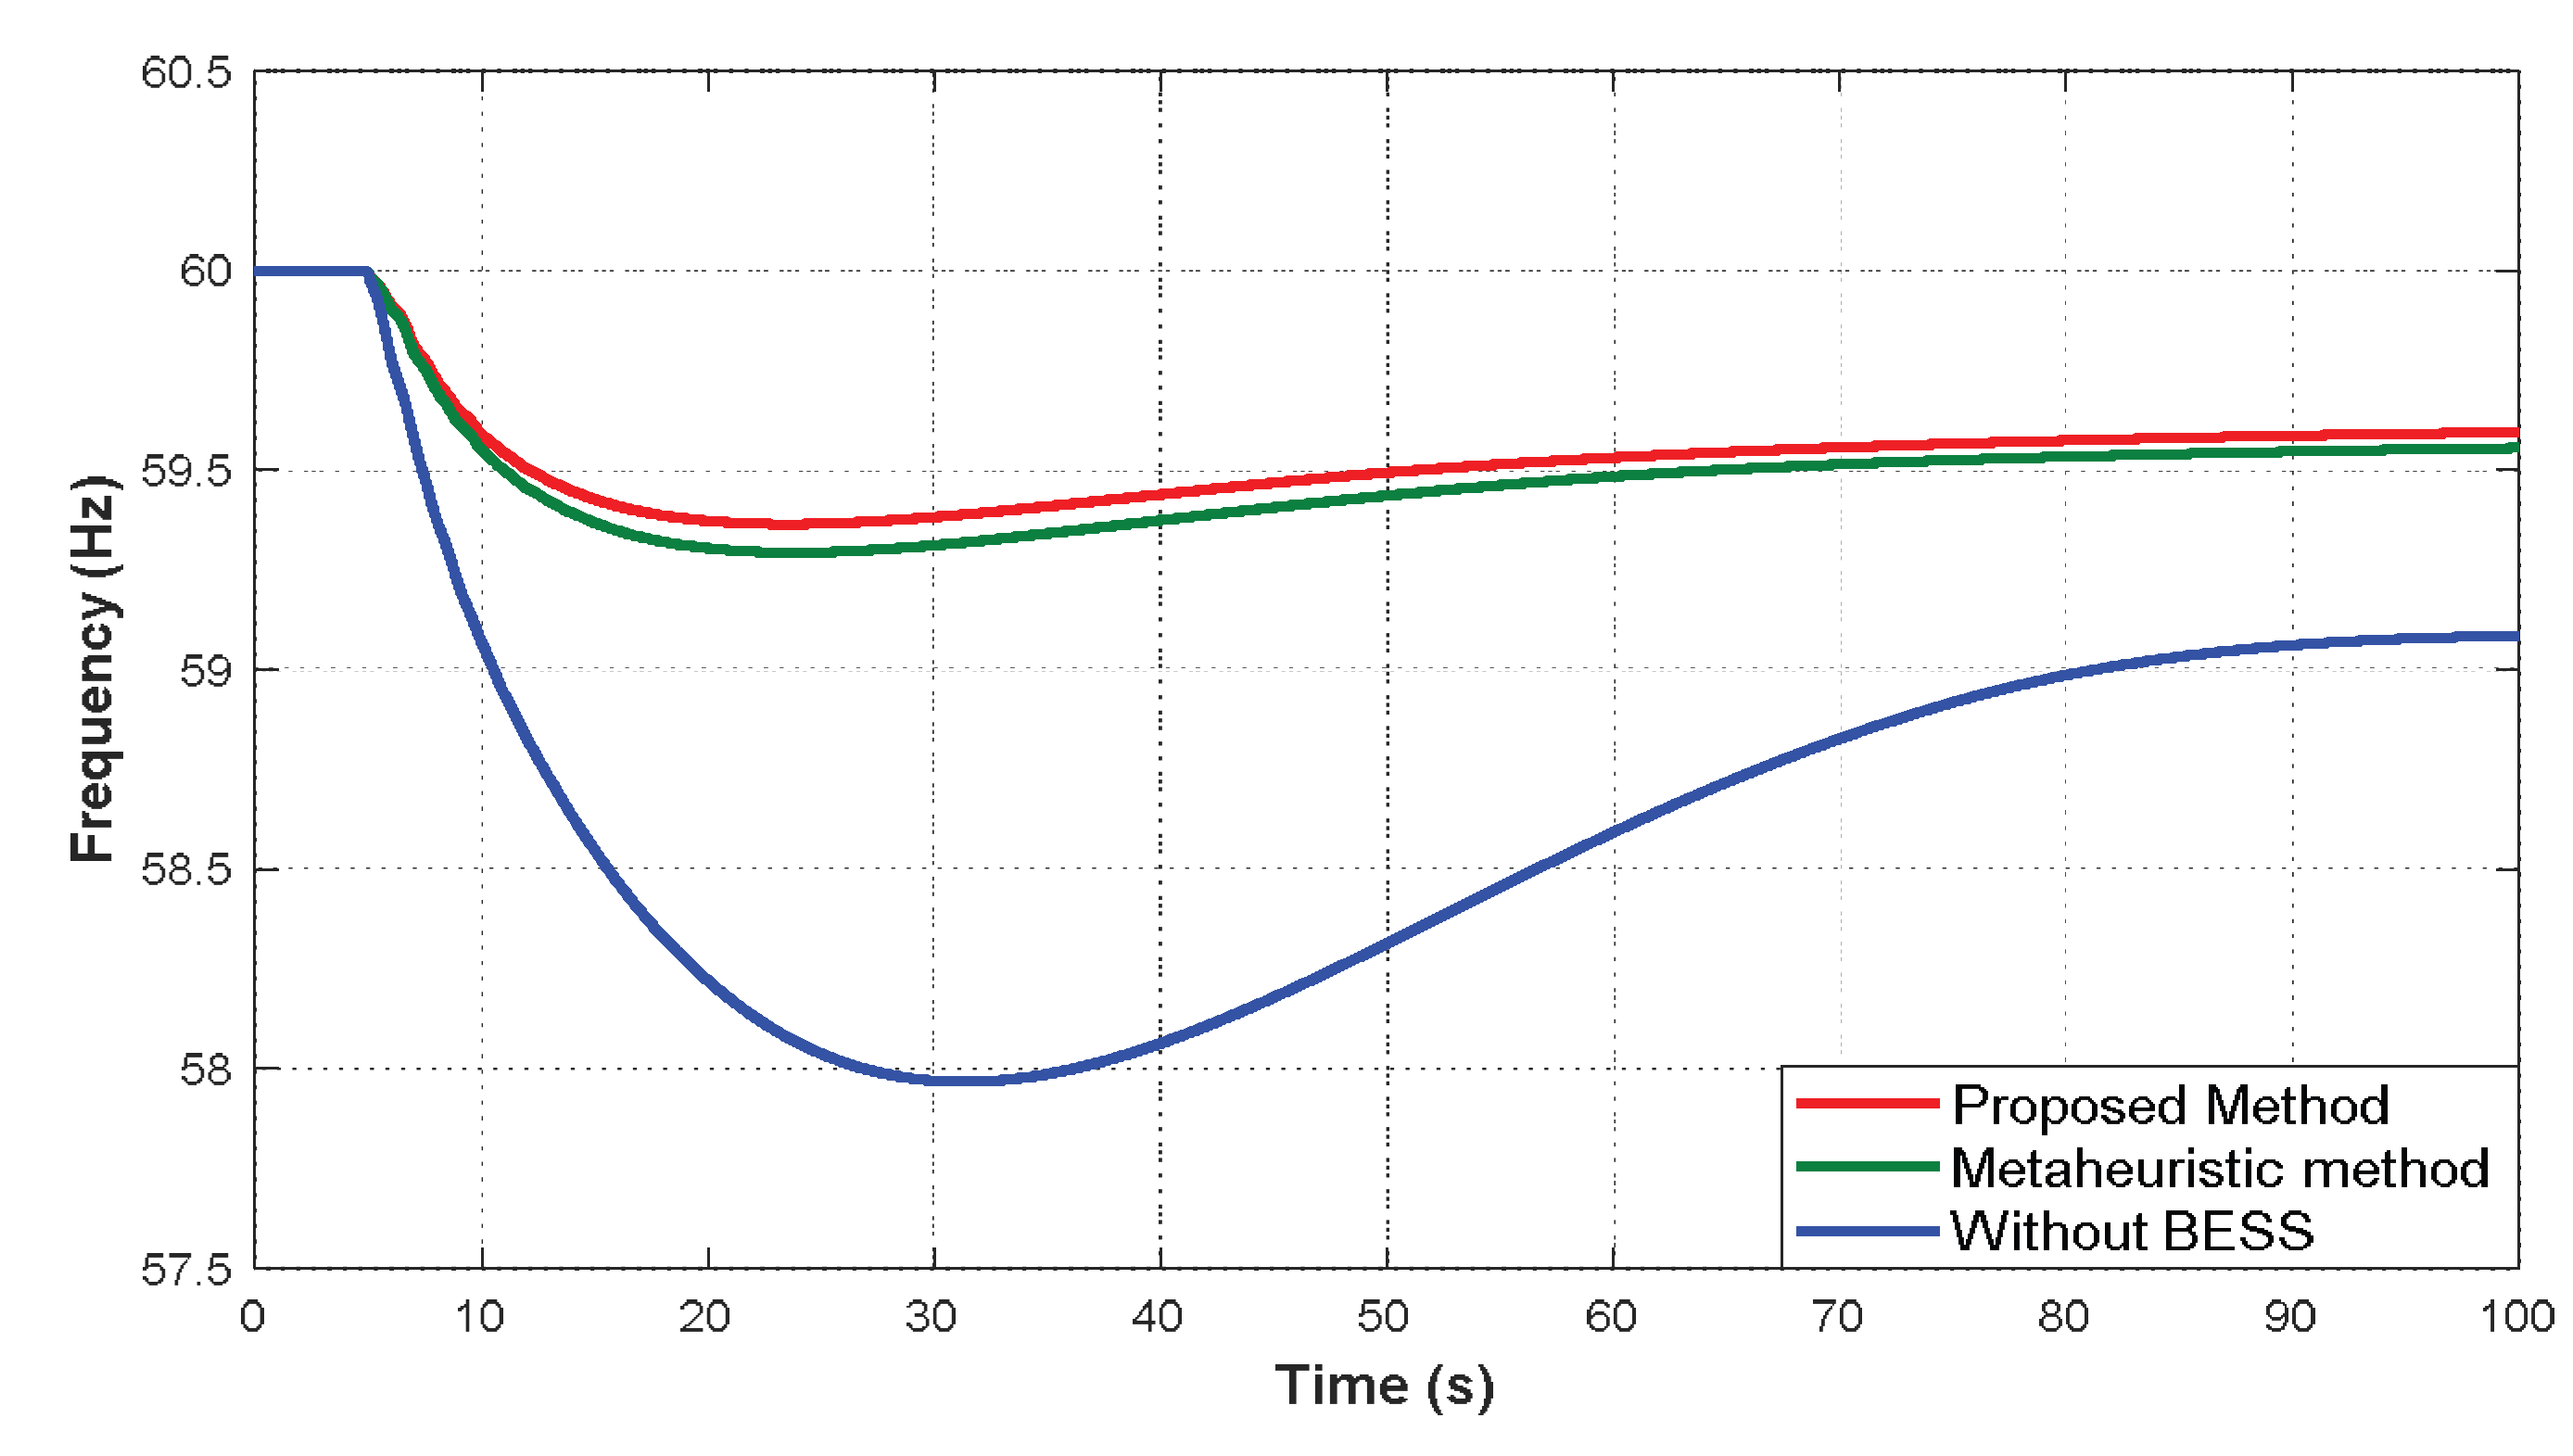
Figure 16.
G01 outage under load increase.
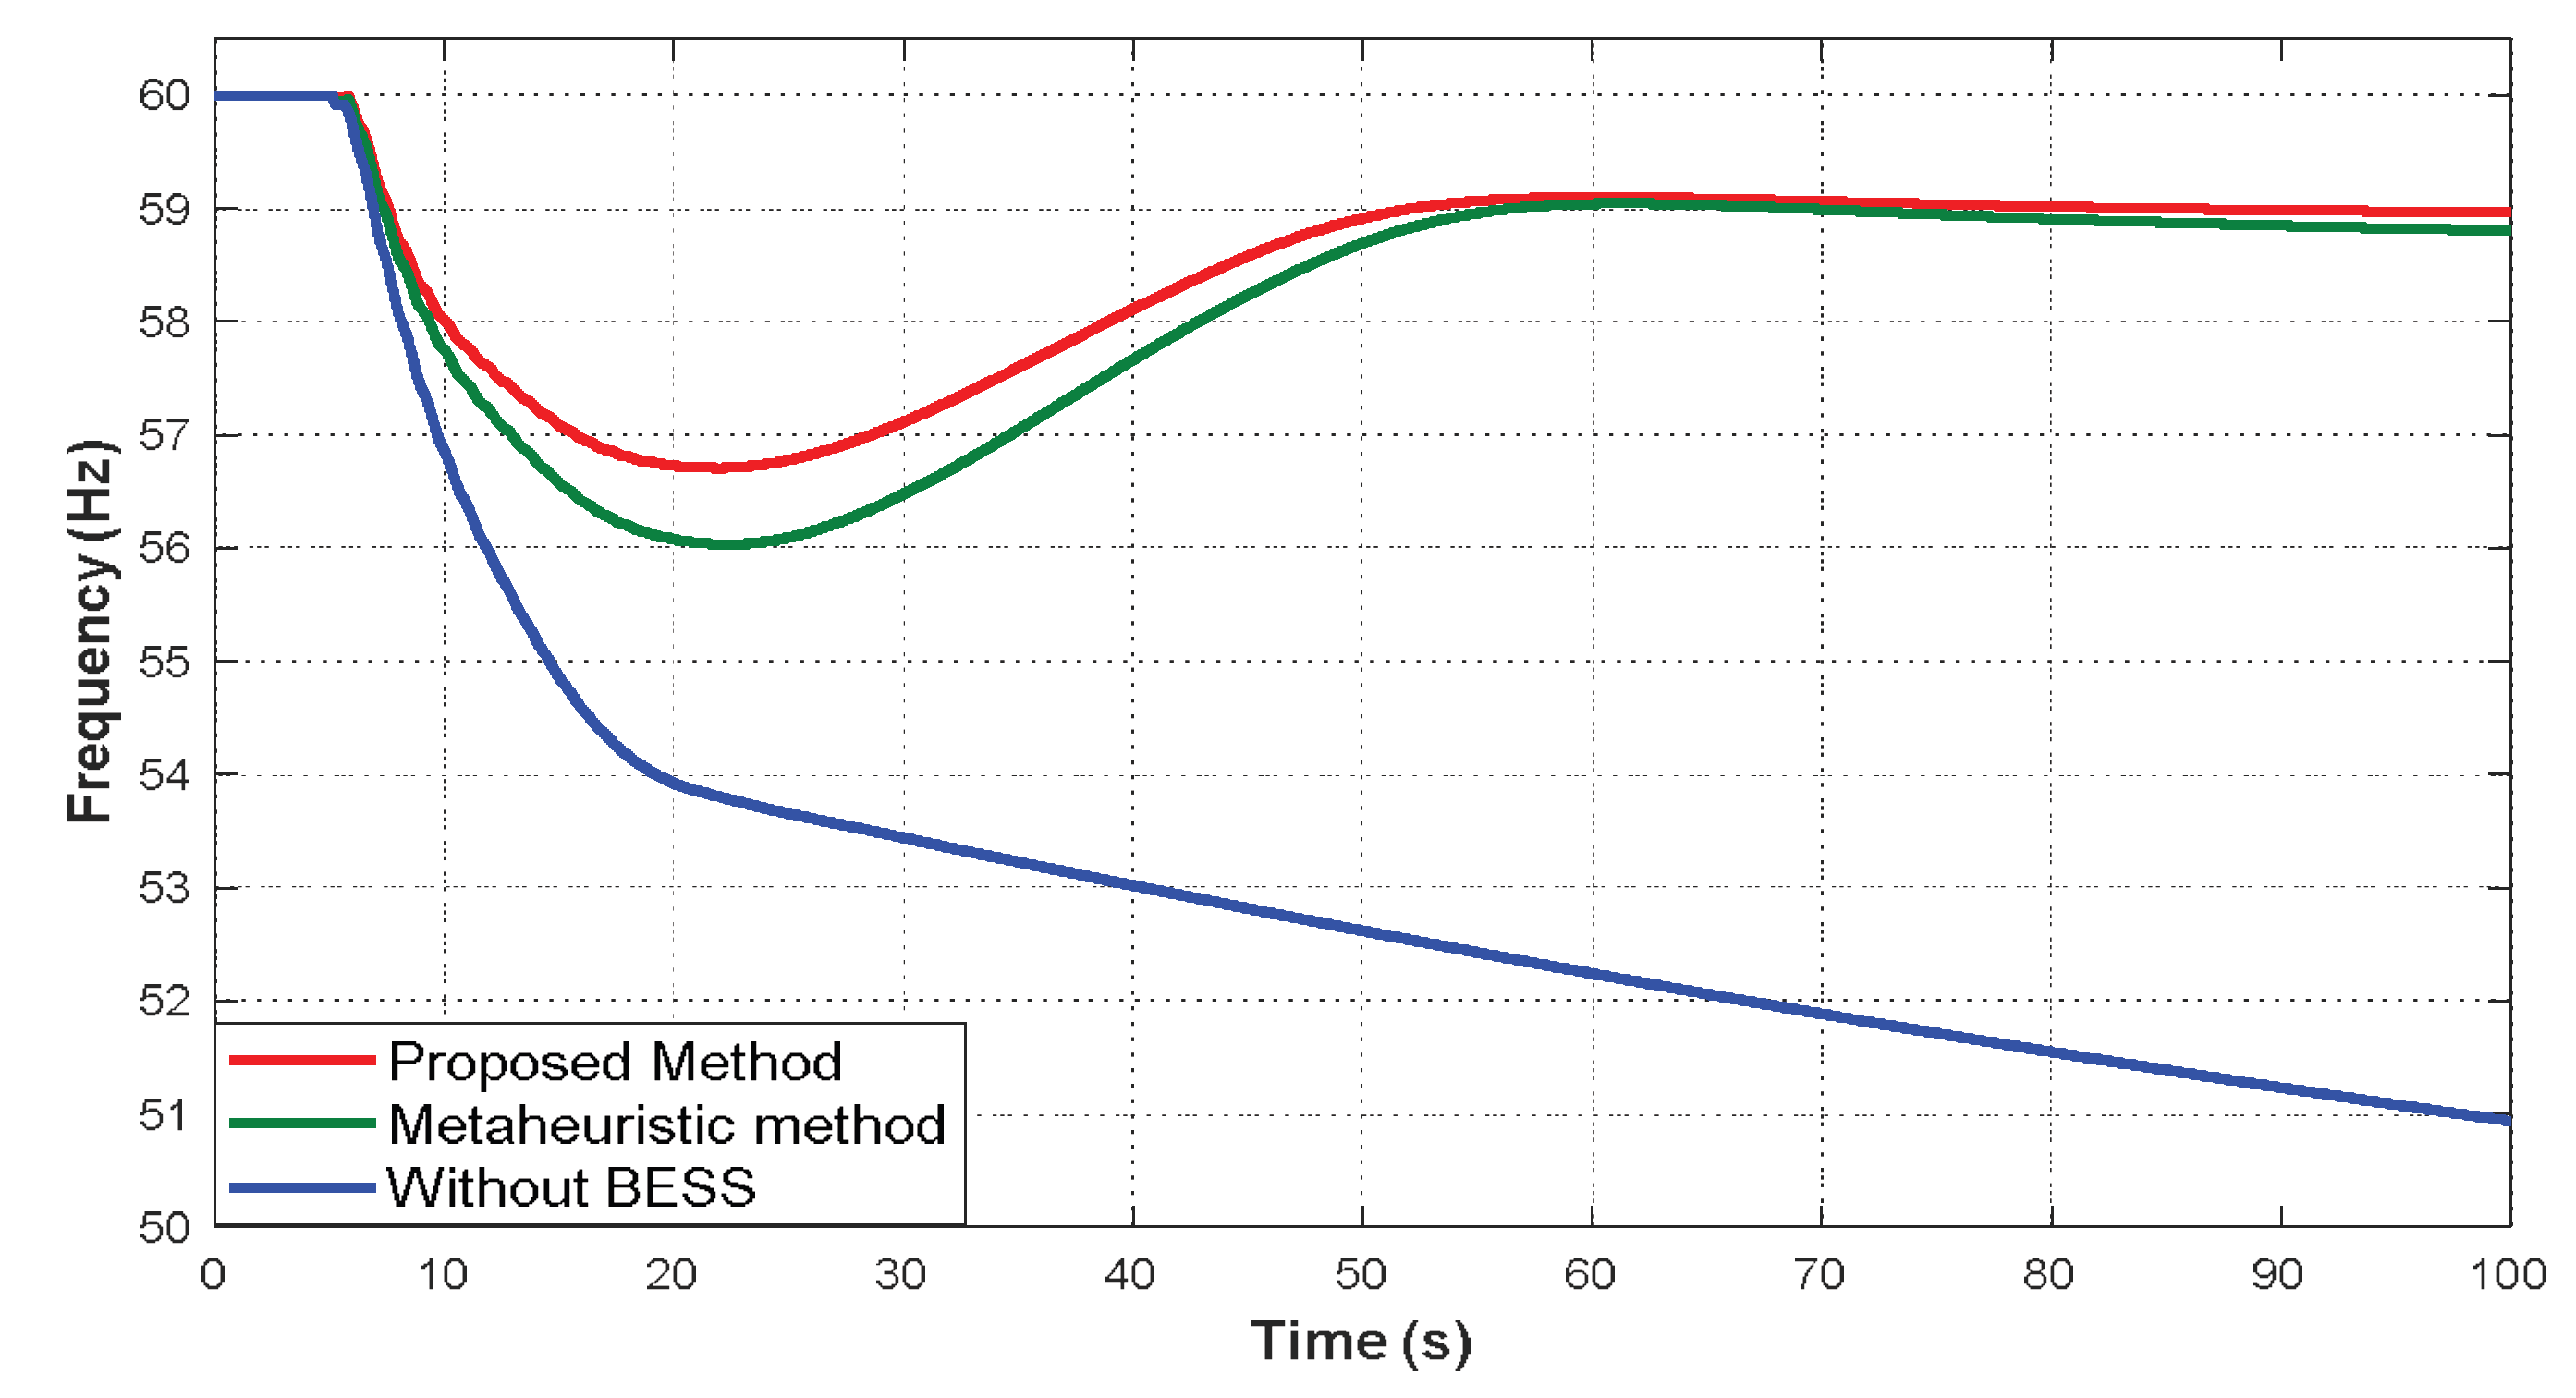
Figure 17.
G09 outage under load increase.
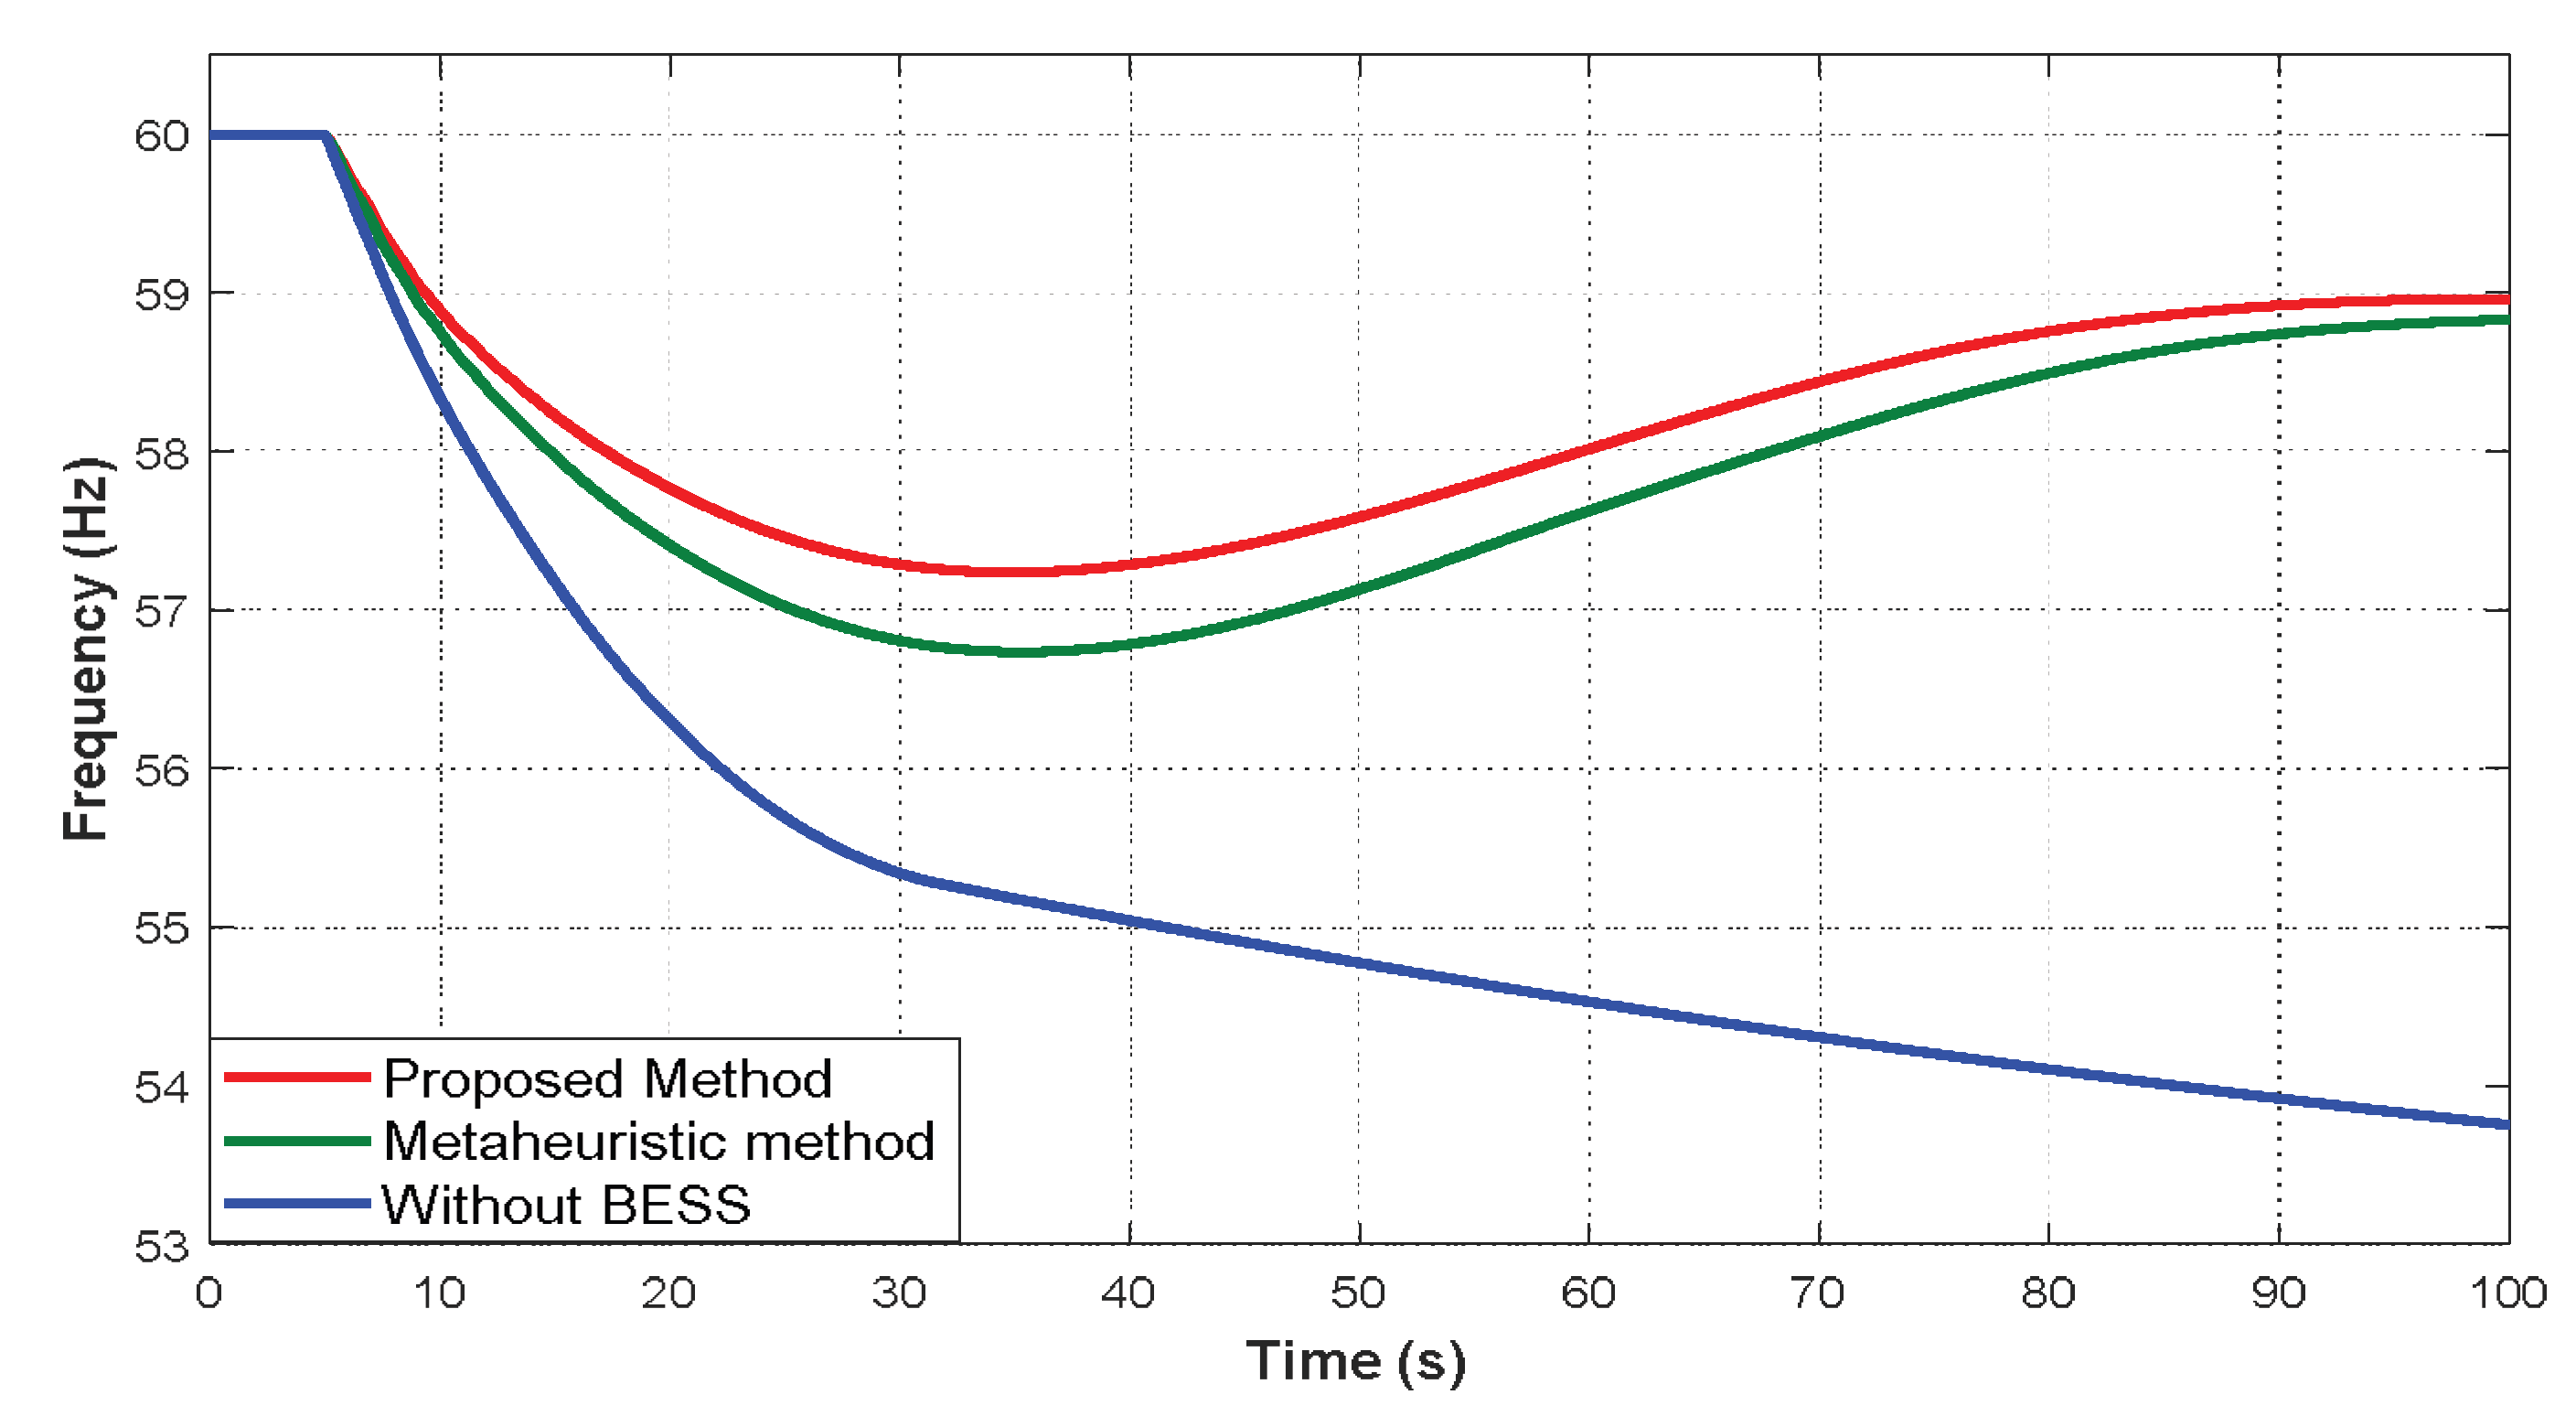
Figure 18.
G03 outage under load increase.
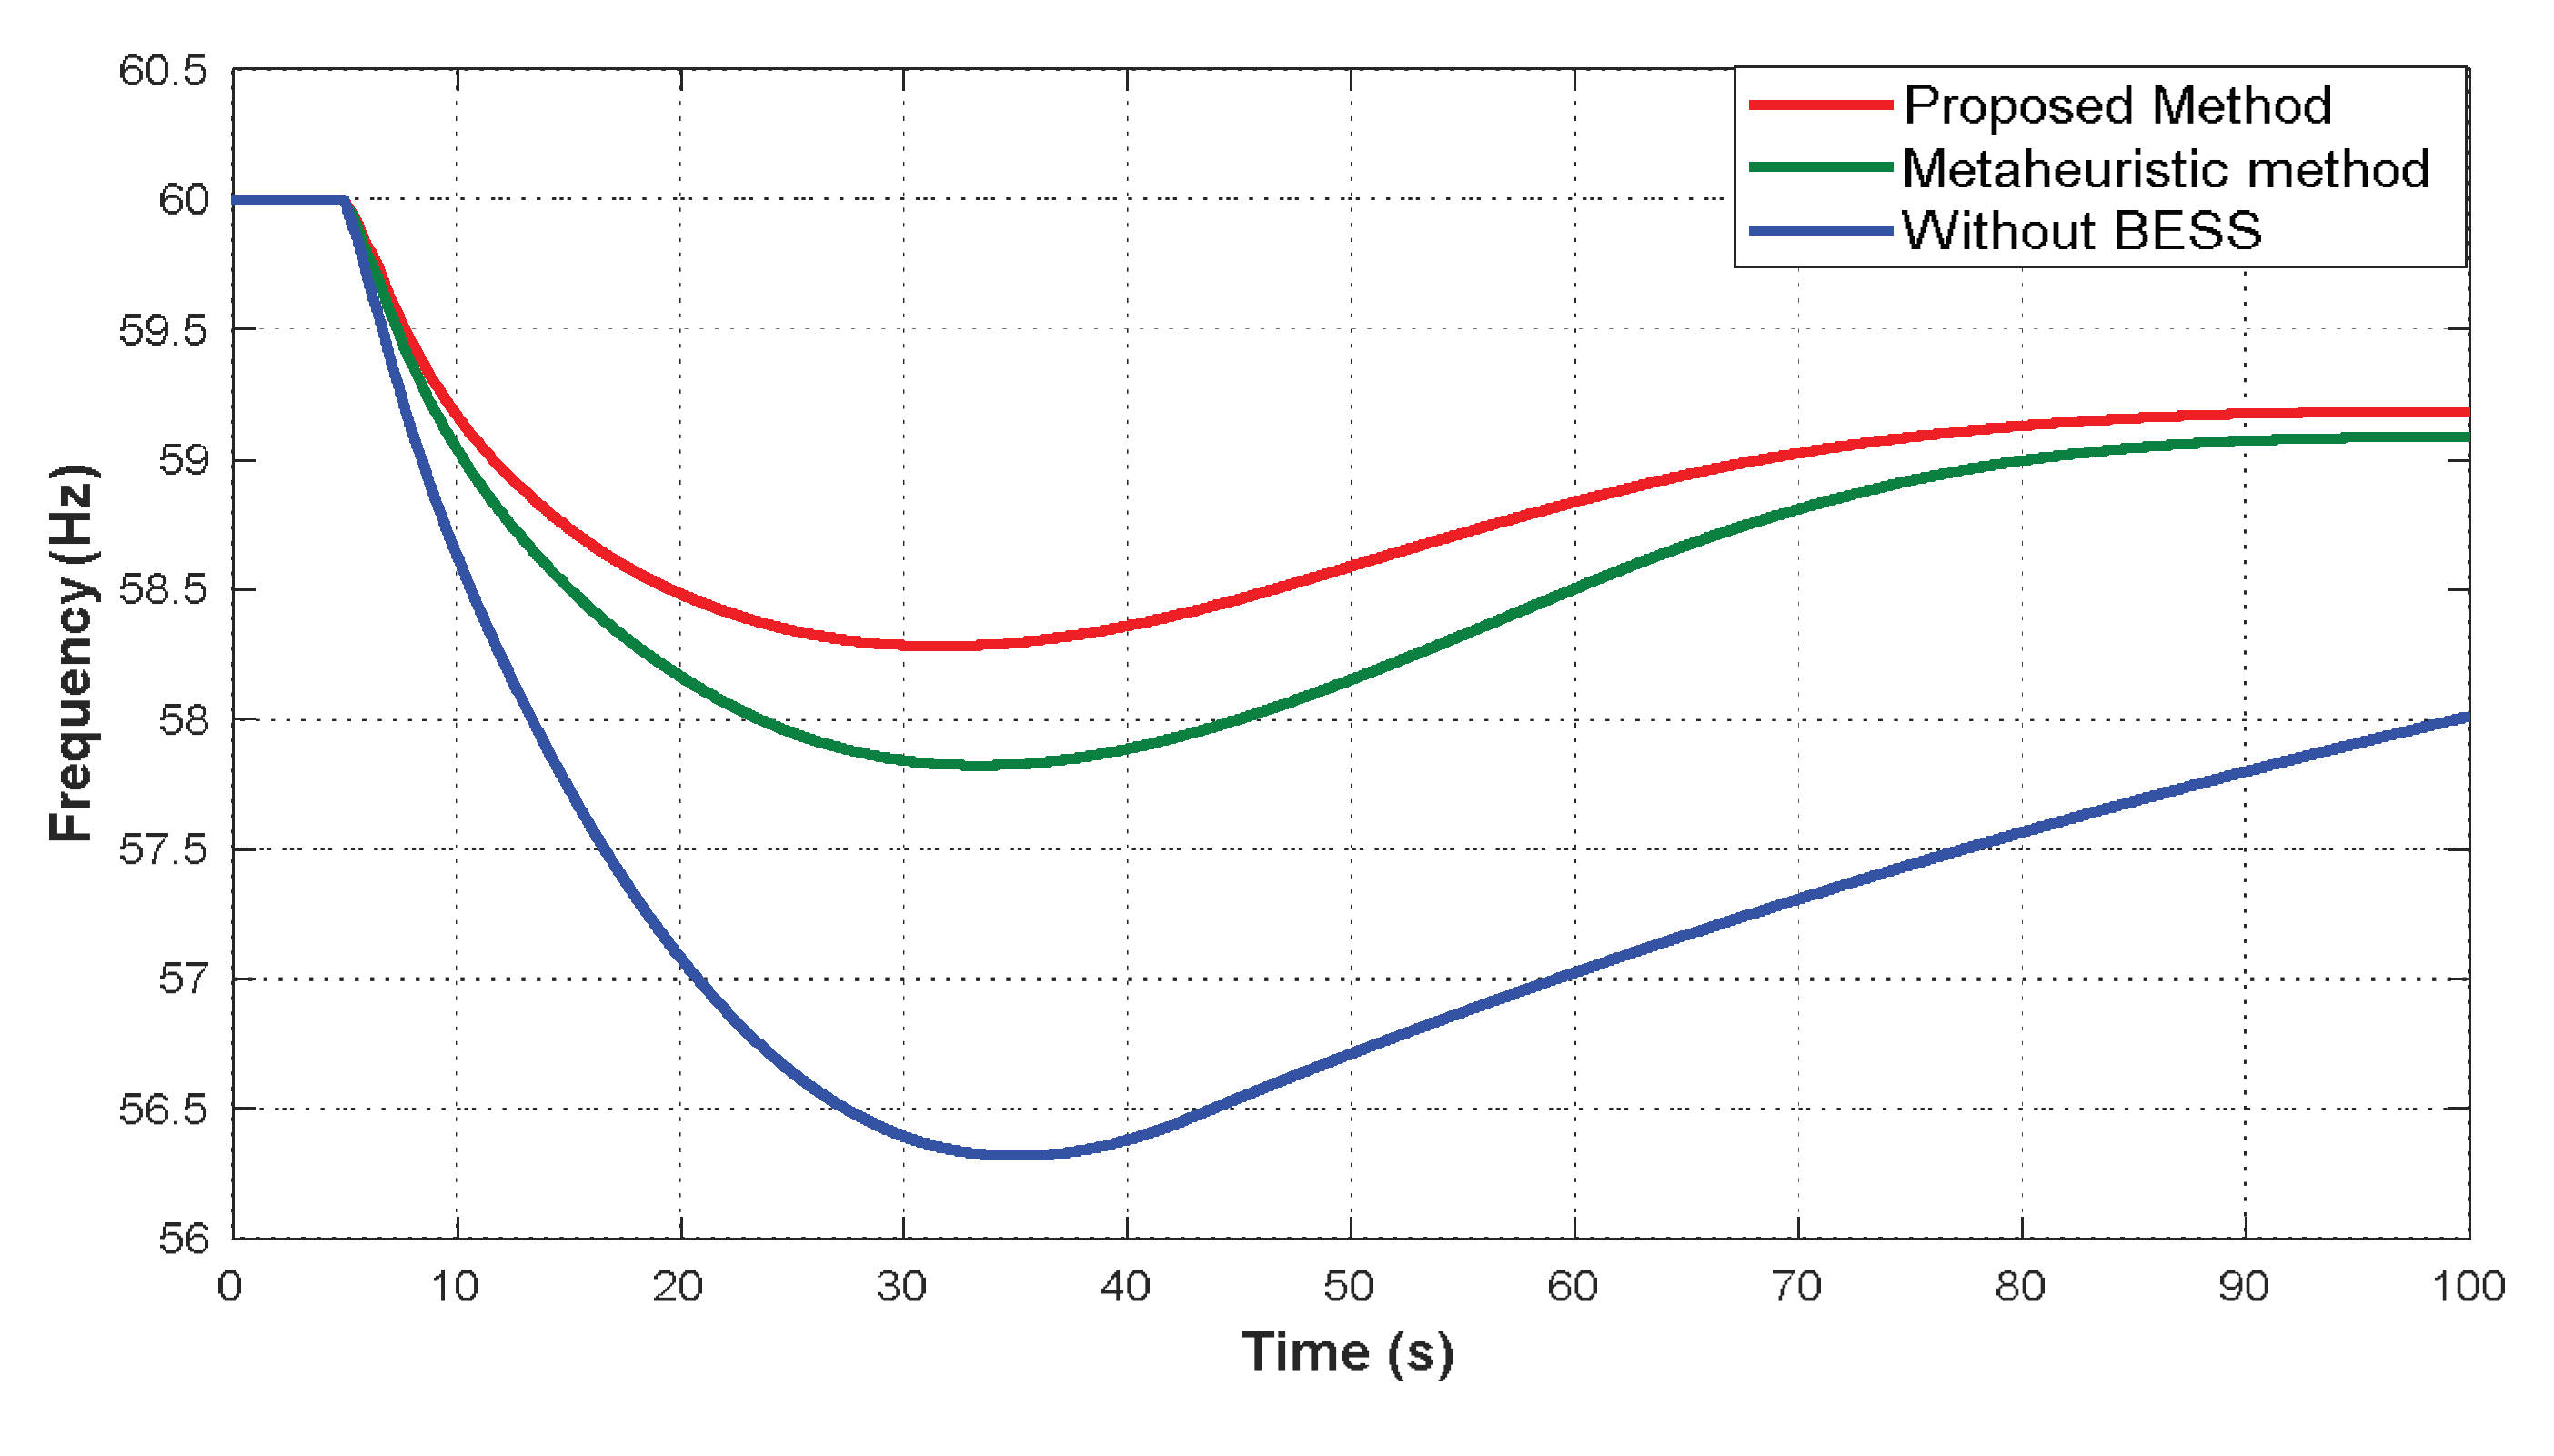
Figure 19.
G01 outage with wind integration.
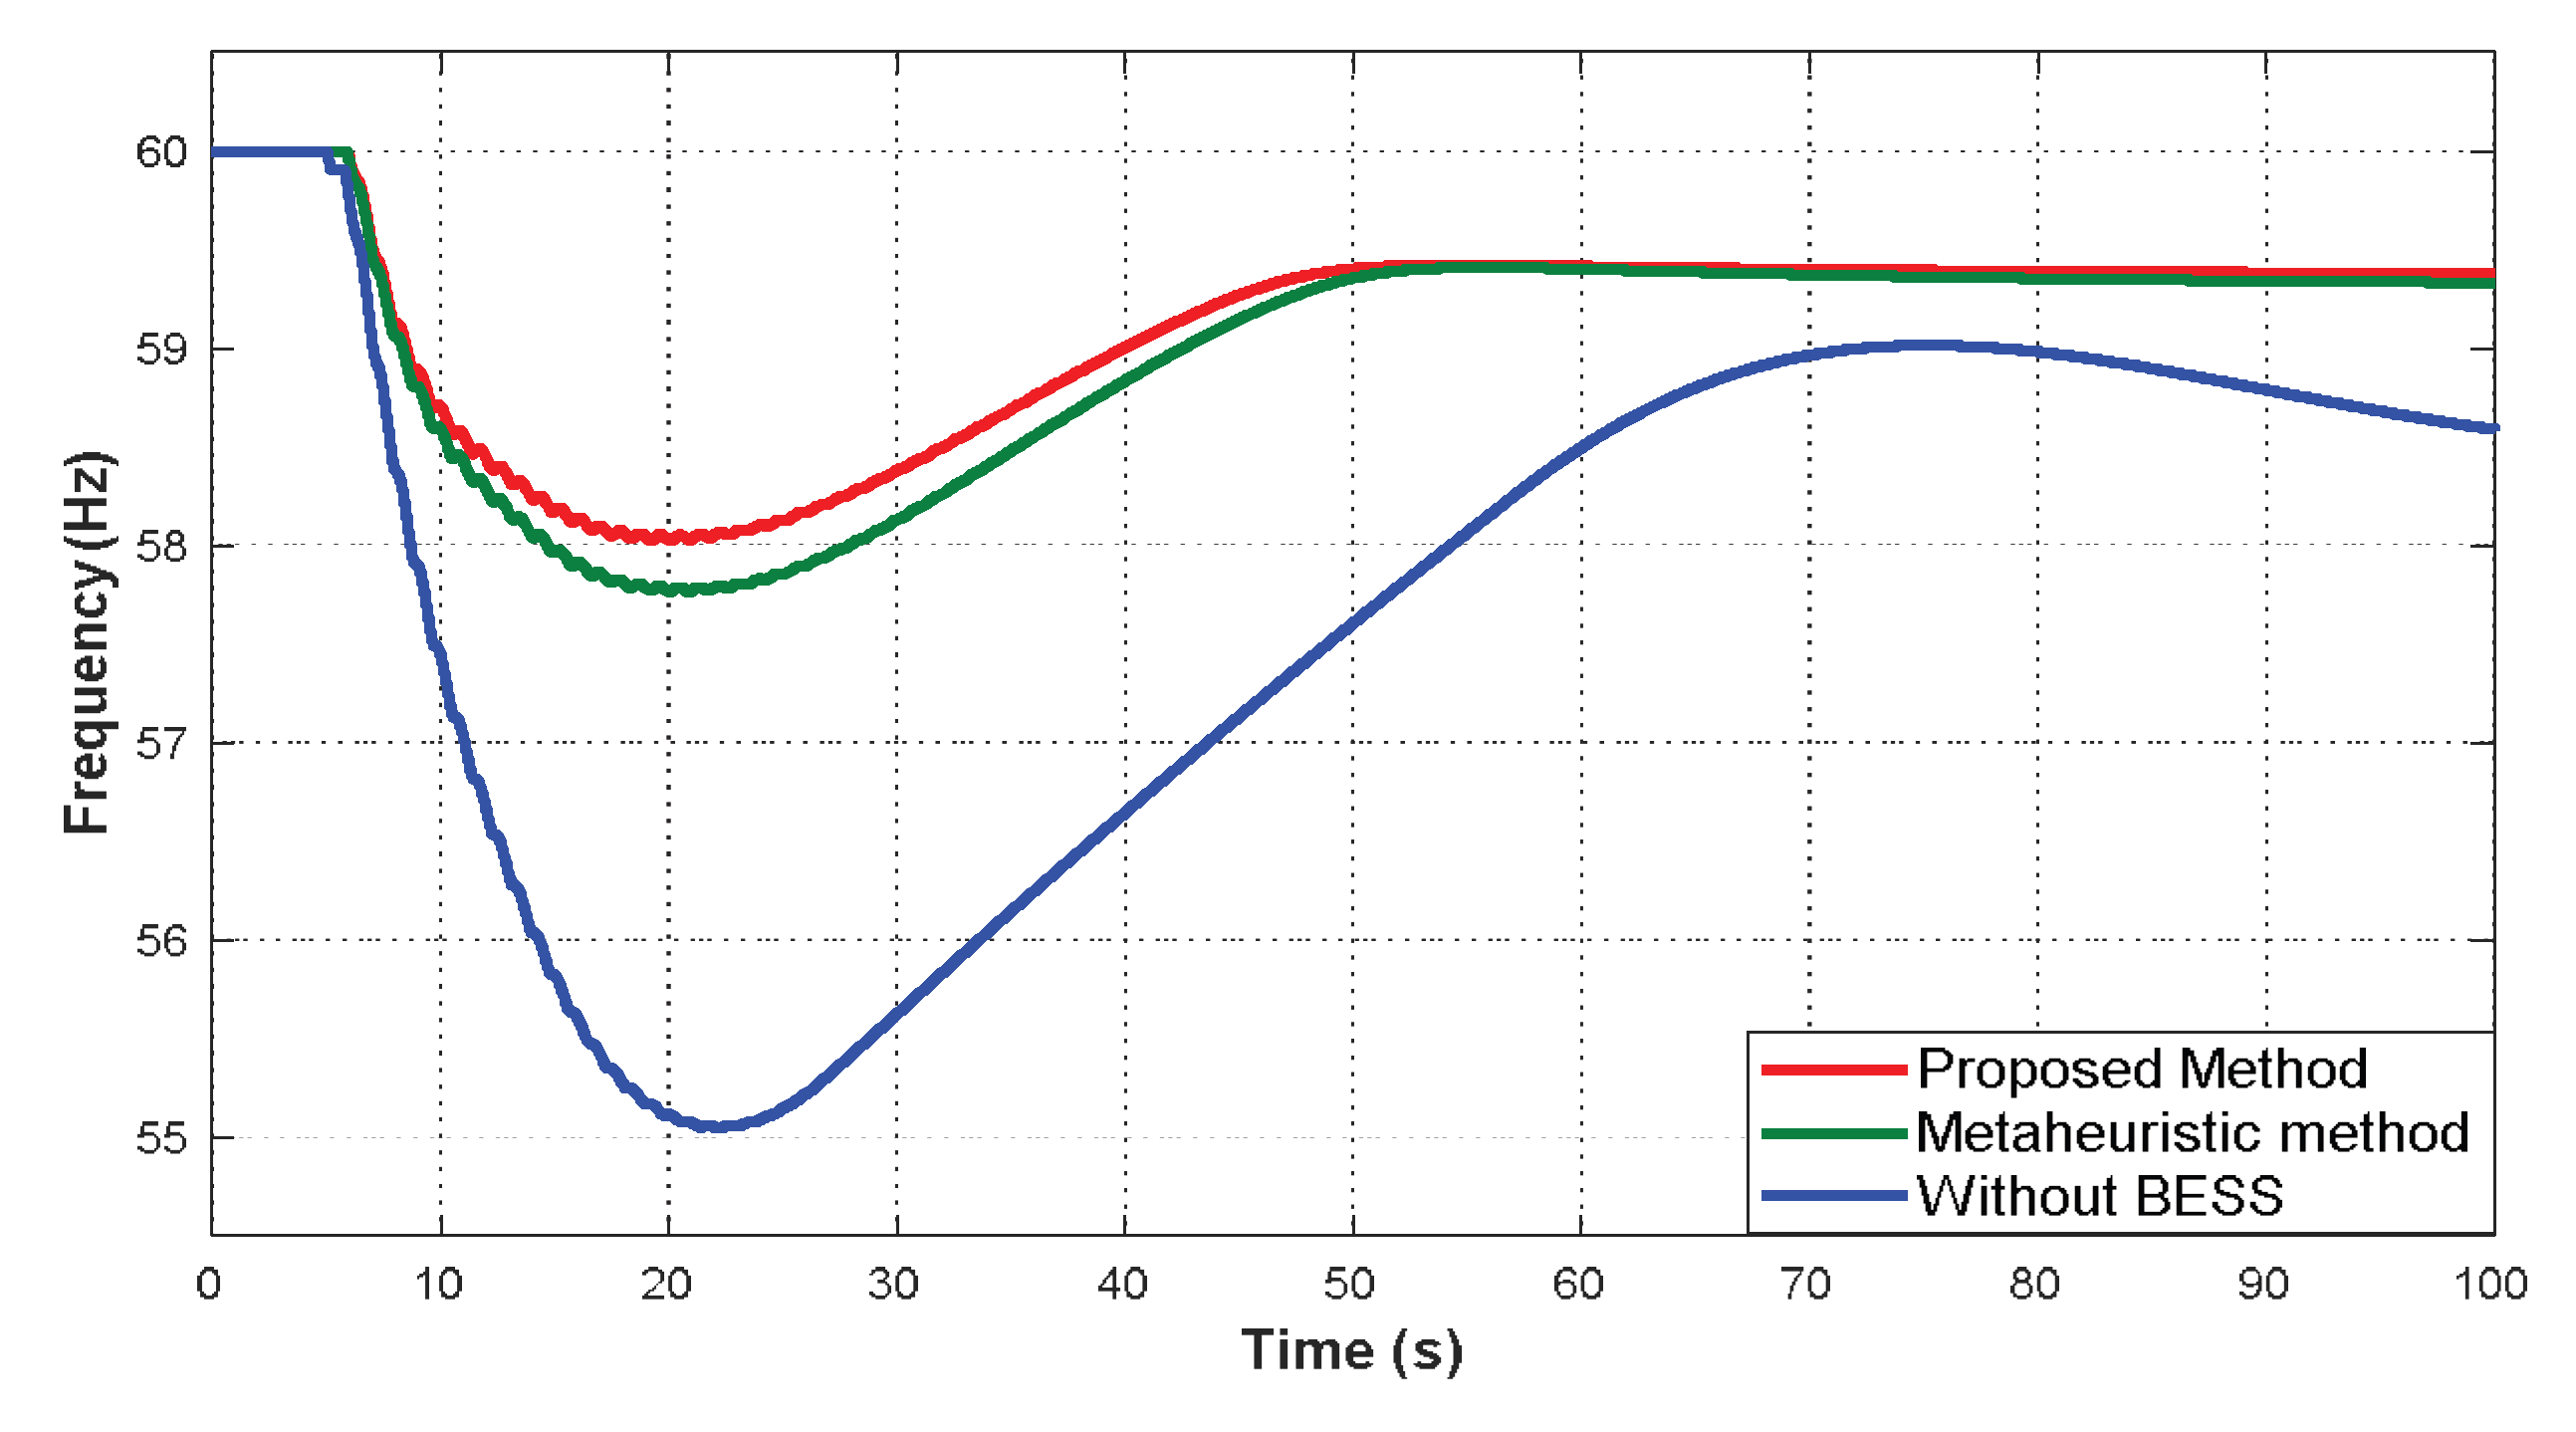
Figure 20.
G09 outage with wind integration.
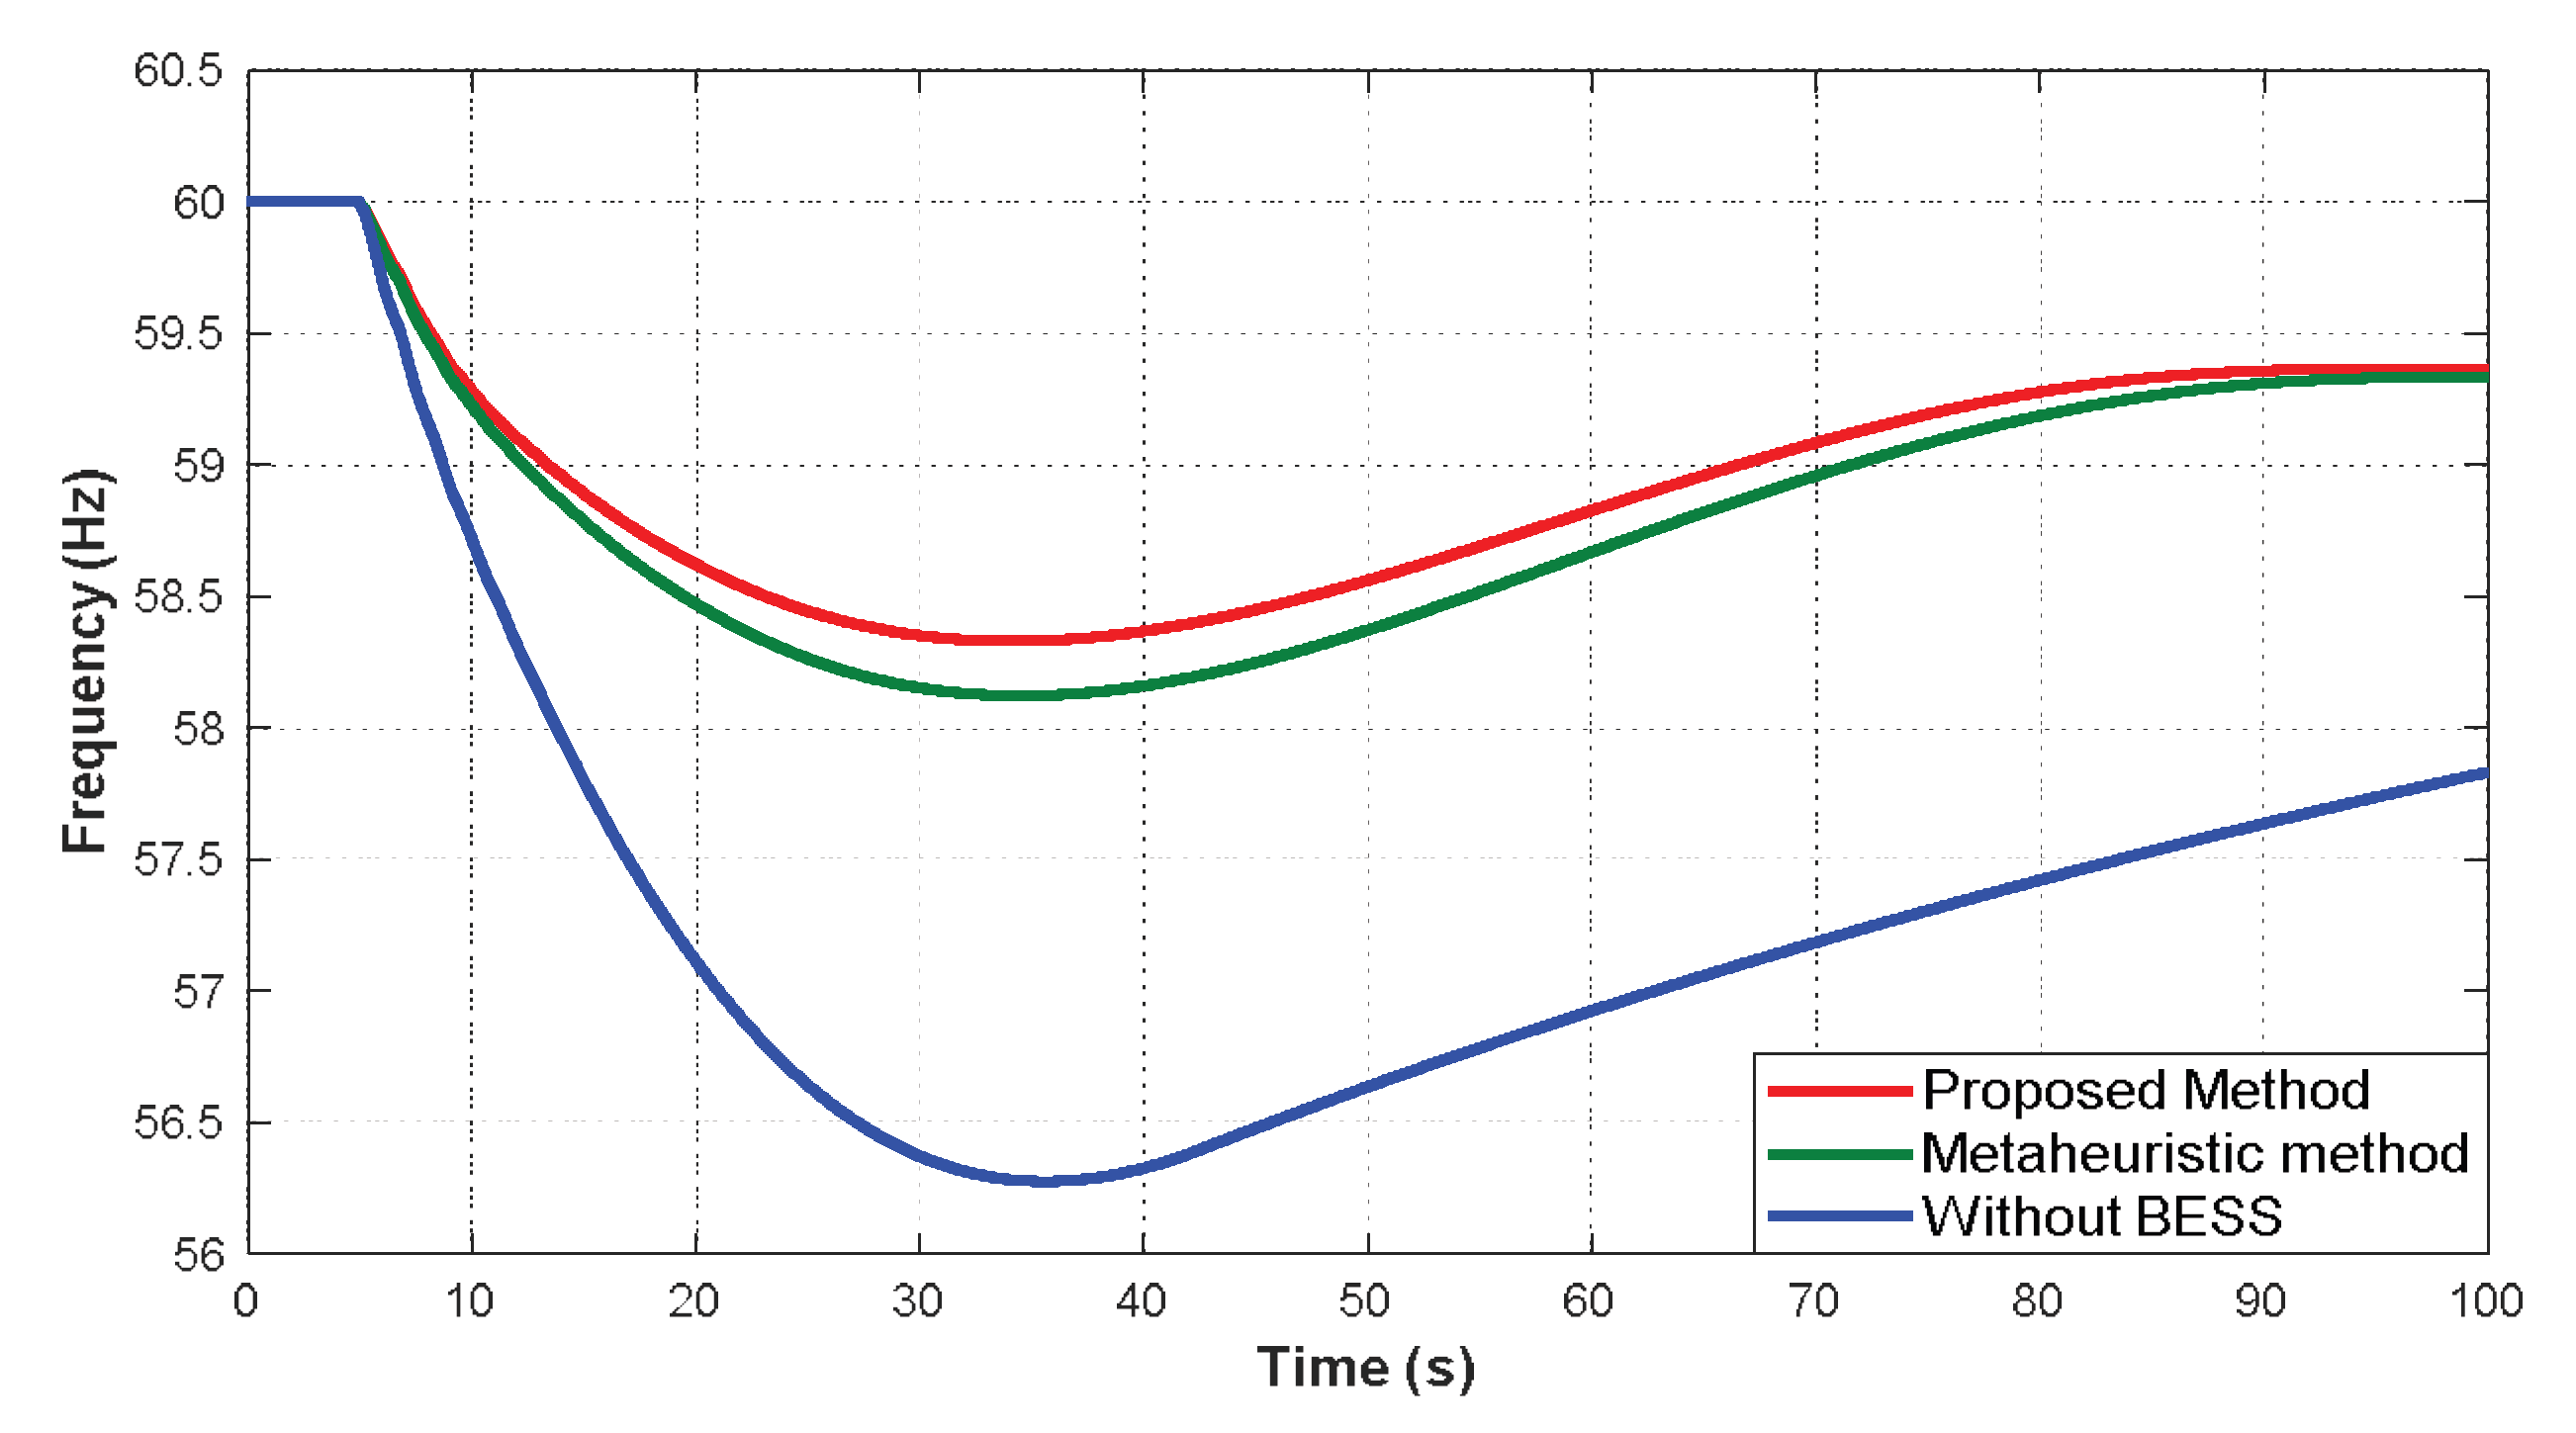

Table 1.
Comparison of BESS placement and sizing methods for frequency stability studies.
| Reference | Frequency Metric Used | Network Information | Placement and sizing Strategy |
|---|---|---|---|
| This study | Frequency nadir and RoCoF | Power flow sensitive | Sensitivity + PSO |
| [25] | Nadir, zenith, RoCoF, steady-state frequency | Frequency dynamics and inertia emulation | GA/PSO optimization |
| [28] | Frequency stability margin | Grid constraint (frequency regulation) | FFR location optimization |
| [29] | Frequency nadir and RoCoF | Network effects considered through placement impact across buses | Optimal placement and sizing |
| [27] | Frequency performance in high-renewable systems | Network constraints within hybrid storage placement method | Hybrid storage placement and sizing |
Table 2.
Generator ratings and inertia constants of the IEEE 39-bus New England test system.
| Generator | Bus No. | Rated Apparent Power (MVA) | Inertia, H (s) |
|---|---|---|---|
| G1 | 30 | 1000 | 5.00 |
| G2 | 31 | 700 | 4.33 |
| G3 | 32 | 800 | 4.48 |
| G4 | 33 | 800 | 3.58 |
| G5 | 34 | 300 | 4.33 |
| G6 | 35 | 800 | 4.35 |
| G7 | 36 | 700 | 3.77 |
| G8 | 37 | 700 | 3.47 |
| G9 | 38 | 1000 | 3.45 |
| G10 | 39 | 1000 | 4.00 |
Table 3.
Baseline frequency stability indices.
| Generator | Nadir (Hz) | RoCoF (Hz/s) |
|---|---|---|
| G01 | 55.923 | 0.2375 |
| G03 | 57.958 | 0.0725 |
| G09 | 56.844 | 0.1040 |
Table 4.
Frequency response versus BESS size.
| BESS Size (MW) |
|
|
|---|---|---|
| 0 | 55.923 | 0.24006 |
| 10 | 56.028 | 0.23401 |
| 30 | 56.239 | 0.22163 |
| 50 | 56.449 | 0.20923 |
Table 5.
Weighting factors for the IEEE 39-bus system.
| 1 | 34 | 1.00000 | 14 | 26 | 0.76787 | 27 | 32 | 0.59839 |
| 2 | 38 | 0.97845 | 15 | 19 | 0.75934 | 28 | 12 | 0.56679 |
| 3 | 36 | 0.97138 | 16 | 24 | 0.75479 | 29 | 9 | 0.55314 |
| 4 | 35 | 0.96105 | 17 | 27 | 0.75206 | 30 | 14 | 0.51229 |
| 5 | 20 | 0.87967 | 18 | 25 | 0.72151 | 31 | 13 | 0.50484 |
| 6 | 33 | 0.87967 | 19 | 16 | 0.69917 | 32 | 10 | 0.47806 |
| 7 | 29 | 0.85812 | 20 | 17 | 0.69679 | 33 | 4 | 0.47681 |
| 8 | 23 | 0.85105 | 21 | 1 | 0.68428 | 34 | 8 | 0.43631 |
| 9 | 28 | 0.85085 | 22 | 2 | 0.67263 | 35 | 11 | 0.42354 |
| 10 | 37 | 0.84184 | 23 | 18 | 0.66361 | 36 | 7 | 0.41915 |
| 11 | 22 | 0.84072 | 24 | 39 | 0.63658 | 37 | 5 | 0.37237 |
| 12 | 30 | 0.79296 | 25 | 3 | 0.62195 | 38 | 6 | 0.32033 |
| 13 | 21 | 0.79058 | 26 | 15 | 0.61733 | 39 | 31 | 0.20000 |
Table 6.
Ranked Impact Index values for all candidate buses.
| Rank | Bus | Impact Index |
|---|---|---|
| 1 | 36 | 3.8855 |
| 2 | 35 | 2.8480 |
| 3 | 30 | 2.7651 |
| 4 | 34 | 2.6033 |
| 5 | 22 | 2.5072 |
| 6 | 23 | 2.5064 |
| 7 | 19 | 2.4871 |
| 8 | 37 | 2.3725 |
| 9 | 29 | 2.2632 |
| 10 | 38 | 2.2360 |
| 11 | 25 | 2.1995 |
| 12 | 28 | 2.1656 |
| 13 | 2 | 2.0442 |
| 14 | 26 | 1.9957 |
| 15 | 33 | 1.9609 |
| 16 | 21 | 1.8553 |
| 17 | 24 | 1.7849 |
| 18 | 20 | 1.6398 |
| 19 | 27 | 1.6296 |
| 20 | 16 | 1.5587 |
Table 7.
Optimized BESS placement and sizing.
| Bus | Voltage (kV) | BESS Size (MW) |
|---|---|---|
| 36 | 16.5 | 46 |
| 35 | 16.5 | 34 |
| 30 | 16.5 | 32 |
| 34 | 16.5 | 30 |
| 22 | 345 | 29 |
| 23 | 345 | 29 |
| 19 | 345 | 29 |
| 37 | 16.5 | 28 |
| 29 | 345 | 26 |
Table 8.
Frequency stability comparison.
| Method | G01 Outage | G09 Outage | G03 Outage | |||
|---|---|---|---|---|---|---|
|
|
|
|
|
|
|
|
| Proposed Method | 58.6561 | 0.1224 | 58.7552 | 0.0519 | 59.3854 | 0.0333 |
| Metaheuristic | 58.4690 | 0.1365 | 58.5881 | 0.0576 | 59.2927 | 0.0401 |
| Without BESS | 55.9230 | 0.2404 | 56.8434 | 0.1040 | 57.9577 | 0.0725 |
Table 9.
Frequency stability under load decrease.
| Method | G01 Outage | G09 Outage | G03 Outage | |||
|---|---|---|---|---|---|---|
|
|
|
|
|
|
|
|
| Proposed Method | 58.2983 | 0.1438 | 58.6732 | 0.0538 | 59.3643 | 0.0342 |
| Metaheuristic | 58.1935 | 0.1524 | 58.5421 | 0.0579 | 59.2932 | 0.0378 |
| Without BESS | 56.2204 | 0.2793 | 57.0305 | 0.1091 | 57.9674 | 0.0773 |
Table 10.
Frequency stability under load increase.
| Method | G01 Outage | G09 Outage | G03 Outage | |||
|---|---|---|---|---|---|---|
|
|
|
|
|
|
|
|
| Proposed Method | 56.7043 | 0.1943 | 57.2366 | 0.0926 | 58.2813 | 0.0622 |
| Metaheuristic | 56.0187 | 0.2093 | 56.7194 | 0.1004 | 57.8106 | 0.0675 |
| Without BESS | - | - | - | - | 55.9587 | 0.1266 |
Table 11.
Frequency stability with wind integration.
| Method | G01 Outage | G09 Outage | G03 Outage | |||
|---|---|---|---|---|---|---|
|
|
|
|
|
|
|
|
| Proposed Method | 58.0275 | 0.1306 | 58.3296 | 0.0574 | 59.2946 | 0.0353 |
| Metaheuristic | 57.7677 | 0.1402 | 58.1223 | 0.0637 | 59.1749 | 0.0374 |
| Without BESS | 55.0461 | 0.2875 | 56.2756 | 0.1218 | 57.3814 | 0.0877 |
Disclaimer/Publisher’s Note: The statements, opinions and data contained in all publications are solely those of the individual author(s) and contributor(s) and not of MDPI and/or the editor(s). MDPI and/or the editor(s) disclaim responsibility for any injury to people or property resulting from any ideas, methods, instructions or products referred to in the content. |
© 2026 by the authors. Licensee MDPI, Basel, Switzerland. This article is an open access article distributed under the terms and conditions of the Creative Commons Attribution (CC BY) license.
Copyright: This open access article is published under a Creative Commons CC BY 4.0 license, which permit the free download, distribution, and reuse, provided that the author and preprint are cited in any reuse.


