
Submitted:
26 January 2026
Posted:
27 January 2026
You are already at the latest version
Abstract
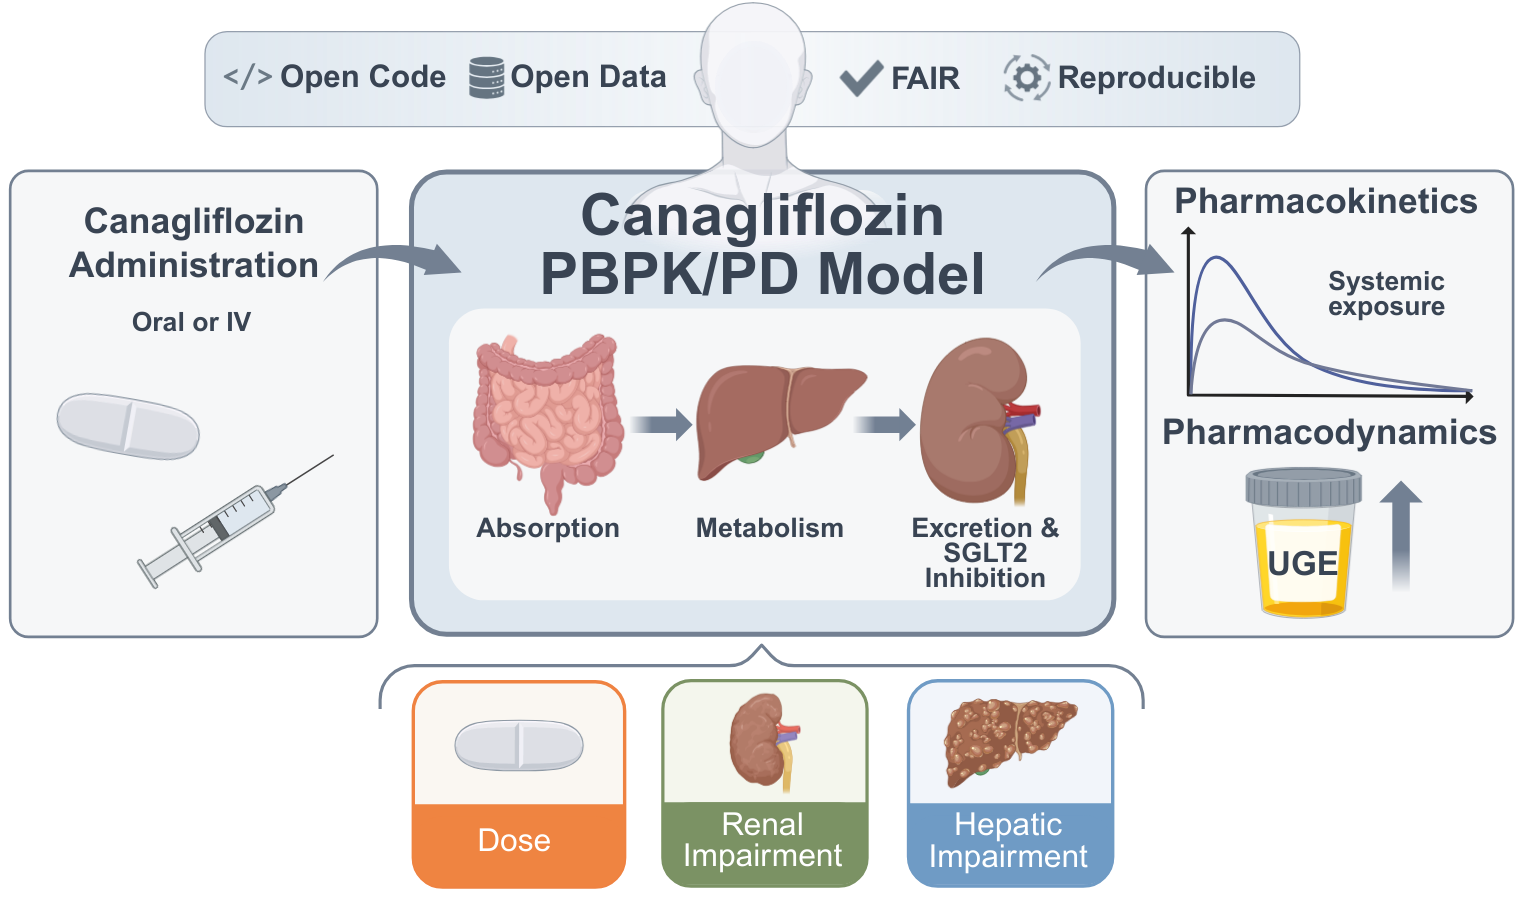
Canagliflozin is an SGLT2 inhibitor prescribed for the management of type 2 diabetes mellitus, lowering blood glucose by increasing urinary glucose excretion (UGE). However, pharmacokinetic (PK) and pharmacodynamic (PD) responses vary across patient populations, complicating dose selection under altered organ function. Here, we developed a whole-body PBPK/PD digital twin of canagliflozin that integrates absorption, distribution, metabolism, and excretion, and explicitly models renal glucose handling. The model represents canagliflozin and its major metabolites (M5, M7, M9) and was calibrated and evaluated using curated PK/PD data from 22 clinical studies spanning healthy individuals, patients with type 2 diabetes, and cohorts with renal or hepatic impairment. Simulations reproduced dose-dependent exposure and UGE across single- and multiple-dose regimens. Renal impairment produced modest changes in parent drug exposure but markedly reduced UGE and increased metabolite exposure, consistent with reduced glucose filtration and impaired metabolite clearance. Under hepatic impairment, simulations predicted increased canagliflozin exposure with altered metabolite profiles, while PD effects were minimal, although evaluation was limited by sparse clinical PD endpoints. All model files, simulation scripts, and curated datasets are provided in open SBML workflows in accordance with FAIR principles, enabling reproducible simulations and reuse for model-informed analyses of canagliflozin PK/PD variability.
Keywords:
digital twin
; canagliflozin
; type 2 diabetes mellitus
; physiologically based pharmacokinetic/ pharmacodynamic model (PBPK/PD)
; pharmacokinetics
; pharmacodynamics
; personalized medicine
1. Introduction
Type 2 diabetes mellitus (T2DM) is a chronic metabolic disorder and a major global health challenge. Persistent hyperglycemia can lead to severe complications, and many patients do not achieve sustained glycemic control despite the availability of multiple glucose-lowering therapies [1,2]. These challenges highlight the continued need for effective and well-characterized therapeutic strategies.
The kidney is central to glucose homeostasis by reabsorbing nearly all filtered glucose within the proximal tubule [3]. This process is mediated mainly by the sodium–glucose co-transporter 2 (SGLT2, 90%) and to a lesser extent by the sodium–glucose co-transporter 1 (SGLT1, 10%) [4,5]. Inhibition of SGLT2 lowers the renal threshold for glucose (RTG), thereby increasing urinary glucose excretion (UGE) and reducing plasma glucose concentrations [5]. This insulin-independent mechanism has been successfully exploited by SGLT2 inhibitors [6].
Canagliflozin is an orally active SGLT2 inhibitor approved for the treatment of adults with T2DM. Clinically, canagliflozin is administered once daily at doses of 100–300 mg, with dosing guided primarily by renal function and therapeutic response [7]. It is characterized by oral efficacy and sustained glucose-lowering effects.
The pharmacokinetics of canagliflozin are well characterized. Following oral administration, it is rapidly absorbed, reaching peak plasma concentrations within 1–2 h, and exhibits a terminal half-life of approximately 11–15 h [5]. Canagliflozin is predominantly metabolized by uridine 5′-diphospho-glucuronosyltransferases UGT1A9 and UGT2B4 to the inactive O-glucuronide metabolites M7 and M5, respectively, with a minor oxidative pathway via cytochrome P450 3A4 (CYP3A4) forming the hydroxylated metabolite M9 [5,6]. Several other metabolites have been identified, but these are generally considered to be of low significance and not major human metabolites. Most of the administered dose is recovered in feces as unchanged canagliflozin and M9, whereas urinary excretion occurs primarily in the form of the metabolites M5 and M7 [5,6]. Pharmacodynamically, canagliflozin produces dose-dependent increases in UGE, reflecting inhibition of renal glucose reabsorption.
Patients with T2DM exhibit substantial inter-individual variability in response to canagliflozin. Clinical studies have shown that renal and hepatic function can significantly influence the pharmacokinetics and pharmacodynamics of canagliflozin. Renal impairment increases systemic exposure to canagliflozin and its metabolites, while simultaneously reducing filtered glucose and UGE, leading to diminished glycemic efficacy [8]. Hepatic impairment can alter the formation and elimination of glucuronide metabolites, although effects on parent drug exposure are generally considered moderate in patients with mild to moderate impairment [9]. However, data on patients with severe hepatic impairment remain limited, and the impact on systemic exposure and therapeutic response is not well characterized. Consequently, dose recommendations for canagliflozin in the setting of hepatic dysfunction are less well defined. Together, these pathophysiological factors complicate dose selection in patients with impaired organ function. The impact of different dosing strategies in these populations cannot be comprehensively evaluated in clinical trials alone, highlighting the need for mechanistic approaches to assess drug exposure and response across diverse patient groups [6].
Several computational models of canagliflozin have been published, including population PK and PK/PD analyses, mechanistic PBPK and quantitative systems pharmacology models, and model-based meta-analyses addressing exposure–response relationships and class-wide glycemic effects [10,11,12,13,14,15,16]. While these studies provided valuable insights, they generally addressed specific sub-questions in isolation and did not offer an integrated, physiologically consistent description of canagliflozin pharmacokinetics and pharmacodynamics across populations.
A major limitation of existing canagliflozin models is their limited reusability and reproducibility. Most models are not openly available: the underlying software is closed, executable code is not provided, curated clinical datasets are inaccessible, and models and workflows do not follow FAIR principles. As a consequence, independent reproduction, long–term preservation, and systematic extension of these models are not ensured. In addition, many existing models rely on restricted or narrowly defined datasets, limiting their applicability across patient populations and clinical scenarios. Together, these limitations severely hamper reuse, cross–validation, and cumulative model development. A systematic overview of existing canagliflozin models, including their scope, availability, and reproducibility, is provided in Supplementary Table S1.
Reproducibility is a broader challenge in systems biology [17] and PBPK modeling more generally [18], with many published models lacking accessible equations, data, or executable workflows. To address these challenges, we developed the present model in accordance with FAIR principles [19] and Open Science practices, ensuring that all model files, simulation code, and curated datasets are openly available and reusable.
Physiologically based pharmacokinetic/pharmacodynamic (PBPK/PD) modeling provides a quantitative framework to integrate physiological, biochemical, and drug-specific data. By representing the processes of absorption, distribution, metabolism, and excretion (ADME) in mechanistic detail, such models can simulate the impact of organ dysfunction, and other patient-specific factors on exposure and response, offering insights beyond what can be obtained from clinical trials alone [20,21,22].
Here, we present a fully reproducible digital twin of canagliflozin developed using published clinical data from 22 studies (Table 1), including healthy individuals, patients with T2DM, and individuals with renal or hepatic impairment. The model is a physiologically based whole–body PBPK/PD framework that explicitly represents canagliflozin and its major metabolites M5, M7, and M9, as well as the key organs involved in absorption, metabolism, and elimination, in particular intestine, liver, and kidney, which are linked through the systemic circulation and renal glucose handling.
All clinical data are stored in a curated database, and the model is implemented in SBML [23] to ensure transparency and reproducible simulations. The digital twin was calibrated and evaluated across multiple datasets and applied to systematically investigate the effects of dose, renal impairment, and hepatic impairment on canagliflozin pharmacokinetics and pharmacodynamics. The model reproduces canagliflozin exposure and renal glucose handling across a wide range of clinical scenarios and quantitatively links parent drug and metabolites to pharmacodynamic response under normal and impaired organ function. This framework provides a mechanistic basis for analyzing inter-individual variability in drug response and supports future model–informed dose optimization.
2. Materials and Methods
The digital twin of canagliflozin was developed as a PBPK/PD model through a systematic workflow combining clinical data curation, mechanistic modeling, and in silico simulations. This involved a structured literature search, development an SBML-based model, parameter optimization with selected data subset, and simulation experiments reflecting clinical trial conditions. Pharmacokinetic and pharmacodynamic outcomes were then analyzed to characterize drug disposition and variability across physiological, pathophysiological and prandial states.
2.1. Systematic Literature Research and Data Curation
A systematic literature search was conducted to compile studies that reported pharmacokinetic and pharmacodynamic data of canagliflozin. PubMed was queried on 2024-07-02 using the terms canagliflozin AND pharmacokinetics, and the PKPDAI database was screened in parallel [24]. The clinical studies encompassed a diverse cohort of participants, including healthy volunteers, patients diagnosed with type 1 or type 2 diabetes, and studies investigating renal or hepatic impairment. Pediatric studies, animal studies, and reports lacking sufficient data were excluded from the analysis. The Supplementary Materials Figure S1 provides an overview of the literature review process. Data from eligible studies were curated in the open pharmacokinetics database PK-DB [25]. Information on demographics, disease status, dosing protocols, plasma and urine concentration-time profiles of canagliflozin and its metabolites, and pharmacodynamic outcomes such as UGE were extracted according to established protocols [25]. Figure-based data were digitized using WebPlotDigitizer [26], while tabular and textual data were reformatted into standardized PK-DB formats [25]. The curated dataset, including patient and study characteristics, dosing regimens, and PK/PD outcomes, provided the basis for PBPK/PD model development and is publicly available via PK-DB and within the model files. An overview of the curated studies is available in Table 1.
2.2. Computational Model
The PBPK/PD model was developed in the Systems Biology Markup Language (SBML) [23,27]. Programmatic model construction and visualization were performed using the sbmlutils [28] and cy3sbml [29,30] libraries. Numerical solutions of the underlying ordinary differential equations (ODEs) were obtained with sbmlsim [31], powered by the high-performance SBML simulation engine libRoadRunner [32,33]. The complete model, including simulation scripts and documentation, is available in SBML format under a CC-BY 4.0 license via GitHub (https://github.com/matthiaskoenig/canagliflozin-model) and archived on Zenodo 0.7.0 [34].
The model comprises a whole–body framework with submodels for the intestine, liver, and kidney, linked through the systemic circulation (Figure 1) to characterize canagliflozin absorption, distribution, metabolism, and excretion. The model has a hierarchical structure, with the whole–body model linking the individual organ submodels.
Key ADME processes include intestinal absorption, hepatic glucuronidation by UGT2B4 and UGT1A9 to form the major metabolites M5 and M7, respectively, and minor oxidative metabolism via CYP3A4 to form M9. The kidney submodel captures both metabolic and excretory processes, including additional renal glucuronidation by UGT1A9 and urinary excretion of canagliflozin and its metabolites M5 and M7. The pharmacodynamic component links canagliflozin plasma concentrations to UGE through inhibition of renal glucose reabsorption in the proximal tubule, parameterized by fasting plasma glucose and the RTG. Mathematical descriptions of the submodels and corresponding ordinary differential equations are provided in the Supplementary Materials Section S4.
Fractional organ volumes and blood flows were taken from literature sources [20]. The fractional compartment volumes were set to for the gut, for the kidneys, for the liver, and for the lungs. Fractional blood flows were defined as for the gut, for the kidneys, for the hepatic venous outflow, and for the lungs. Absolute organ volumes and blood flows were calculated by scaling the corresponding fractional values with body weight.
Tissue-to-plasma partition coefficients were assumed to be identical across all tissues for canagliflozin and its glucuronide metabolites. Fixed values of , , and were used. No tissue-to-plasma partition coefficient was defined for the minor metabolite M9. Transport processes of canagliflozin and its metabolites in the liver and kidneys were modeled explicitly.
Several key factors influencing pharmacokinetic and pharmacodynamic variability were implemented as scaling parameters.
Renal impairment was modeled as a progressive decline in renal function using the factor frenal, which was applied to glomerular filtration rate (GFR) and renal clearance of parent drug and metabolites. Scaling values were mapped from KDIGO categories: normal (eGFR ≥90 ml/min, ), mild (GFR 50–89 ml/min, ), moderate (GFR 30–49 ml/min, ), severe (GFR ≤30 ml/min, ), derived from KDIGO guidelines and related modeling studies [35,36].
Hepatic impairment was modeled using the scaling factor fcirrhosis, representing reduced functional liver parenchyma and blood shunting. Scaling values were mapped to Child–Turcotte–Pugh (CPT) classes: A (mild: 5–6 points, fcirrhosis = 0.40), B (moderate: 7–9 points, fcirrhosis = 0.70), and C (severe: 10–15 points, fcirrhosis = 0.80) [37,38,39,40].
Subject- and study-specific physiological and clinical parameters were incorporated when available, including body weight, glomerular filtration rate to adjust renal function, and fasting plasma glucose for the pharmacodynamic component.
Multiple-dose regimens were implemented by stepwise numerical integration between dosing intervals, with dosing events applied according to the study-specific protocols. Oral and intravenous doses were specified using the parameters PODOSEcan and IVDOSEcan, respectively. Simulation time horizons and post-dose sampling windows were selected to match the corresponding clinical study designs.
All simulations were performed deterministically using the optimized parameter set representing the typical (mean) individual. Inter-individual or between-subject variability was not included, as the objective was to evaluate typical pharmacokinetic and pharmacodynamic behavior across studies rather than to perform population-based variability analyses.
2.3. Model Assumptions
Additional details on model equations and assumptions are provided in Supplementary Material S4. The key model assumptions and simplifications are summarized below.
- Canagliflozin absorption was modeled as a first-order process.
- Diurnal variation in plasma glucose concentrations was not modeled explicitly. Instead, a constant fasting plasma glucose (FPG) concentration was assumed and used for the calculation of UGE. When reported, study-specific FPG values were used. Otherwise, FPG values of 5 mM for healthy subjects, 8.0 mM for subjects with T1DM, and 8.0 mM for subjects with T2DM were assumed.
- The RTG was parameterized using parameter optimization, with optimized values reported in Supplementary Table S3.
- Renal filtration and tubular glucose reabsorption were not modelled explicitly. Renal elimination of canagliflozin (CAN) and its metabolites was instead described using first-order processes, depending on kidney volume, renal function (GFR), and compound-specific excretion rate constants. The parameters KI__CANEX_k, KI__M5EX_k and KI__M7EX_k were estimated via parameter optimization.
- The conversion of CAN to M5 by UGT2B4 and to M7 by UGT1A9 in the liver and kidneys was modelled using irreversible Michaelis–Menten kinetics.
2.4. Model Parameterization
A subset of curated data from healthy subjects, patients with T2DM, and individuals with renal impairment following single-dose administration was used to optimize parameters using a local standard optimizer, with the optimal parameters used in the final model. The final optimized parameter set was applied consistently across all subsequent simulations without further study-specific refitting. Optimized parameter values and optimization diagnostics are reported in the Supplementary Materials Section S5, including fitted pharmacokinetic and pharmacodynamic parameter sets as well as convergence behavior and goodness-of-fit assessments for both model components.
The cost function, defined as a function of the parameter vector , minimized the sum of squared, weighted residuals across all time courses k and data points i. Time courses were weighted by the number of participants in each study , and individual time points were weighted by the inverse of the associated measurement uncertainty, represented by the standard deviation . This resulted in weights .
The weighting by uncertainty weights data points with smaller uncertainty higher, the weighting by participants weights data points depending on the number of subjects.
Multiple optimization runs () were performed using different initial parameter values. Optimization was conducted sequentially: pharmacokinetic parameters were estimated first, followed by pharmacodynamic parameters.
2.5. Simulations
For each curated clinical study (Table 1), a corresponding in silico experiment was implemented to reproduce the reported dosing regimen and study conditions. Parameters for oral and intravenous dosing, prandial state, bodyweight, fasting plasma glucose, and renal or hepatic function were adjusted according to study-specific information. Multiple dosing protocols were incorporated where applicable.
To further explore sources of variability, simulation experiments and parameter scans were performed across physiologically relevant ranges for renal function, hepatic function, and dose to enable systematic evaluation of the influence of key physiological and pathophysiological parameters on PK/PD outcomes.
2.6. Pharmacokinetic and Pharmacodynamic Parameters
Pharmacokinetic parameters of canagliflozin and its metabolites were calculated from plasma concentration-time curves and urinary excretion using standard non-compartmental methods. Pharmacodynamic outcomes were evaluated in terms of UGE, calculated from the simulated plasma concentration-time courses in combination with fasting plasma glucose and the renal threshold for glucose. Simulated profiles and derived pharmacokinetic and pharmacodynamic parameters were compared against the curated clinical data.
2.7. Sensitivity Analysis
The influence of model parameters on pharmacokinetic (PK) and pharmacodynamic (PD) outcomes was assessed using sensitivity analysis. A reference simulation corresponding to a single oral dose of 200 mg canagliflozin was used. PK readouts comprised the area under the concentration-time curve (AUC), maximum concentration (Cmax), half-life, volume of distribution (Vd), clearance (CL), and elimination rate constant () for canagliflozin, as well as AUC, Cmax, and half-life for its metabolites M5 and M7. PD readout was urinary glucose excretion (UGE) at 24 hours. Parameters representing physical constants, unit conversion factors, and dosing parameters were excluded from the analysis. Results are reported in Supplementary Materials, Section S7.
2.7.1. Sampling-Based Sensitivity Analysis
To quantify uncertainty in PK and PD outcomes arising from variability in model parameters, a sampling-based uncertainty analysis was performed. Model parameters were sampled uniformly within their predefined bounds using Latin hypercube sampling (LHS). A total of simulations were conducted, and the resulting distributions of PK and PD readouts were used to characterize parameter-induced uncertainty.
2.7.2. Local Sensitivity Analysis
Local sensitivities were computed by perturbing each parameter individually by relative to its reference value . Sensitivities were calculated using a symmetric midpoint approximation,
where . Sensitivities were subsequently normalized to obtain dimensionless measures,
representing the relative change in the model output per relative change in the parameter. Normalized sensitivities with absolute values below 0.1, as well as parameters without measurable effects on any PK or PD readout, were omitted from the heatmap visualization. For clarity, sensitivity matrices were hierarchically clustered by model parameters using single-linkage clustering.
2.7.3. Global Sensitivity Analysis
Global sensitivity analysis was performed using variance-based Sobol indices [41,42,43], as implemented in SALib [44,45]. First-order (S1) and total-effect (ST) indices were computed. Parameters with S1 and ST values below 0.05, as well as parameters without measurable effects on any readout, were omitted from the heatmap visualization. Samples were generated using Saltelli’s extension of the Sobol’ sequence with base samples.
3. Results
3.1. Canagliflozin Database
An extensive database of canagliflozin’s pharmacokinetics and pharmacodynamics was created to develop and validate the model. A systematic literature search initially yielded 152 records. After screening according to predefined inclusion and exclusion criteria, 22 studies were selected for detailed curation and formed the core dataset used to evaluate the PBPK/PD model. See Supplementary Materials Figure S1 for the study selection process. All curated pharmacokinetic and pharmacodynamic data of the 22 studies are publicly available in the model files and in the PK-DB database with unique study identifiers as referenced in the manuscript (Table 1).
3.2. Computational Model
Using the curated dataset, a digital twin in the form of a PBPK/PD model was developed to describe the ADME of canagliflozin and its primary metabolites, as well as its pharmacodynamic effect on UGE (Figure 1). The complete model, including simulation scripts and documentation, is available in SBML format under a CC-BY 4.0 license via GitHub (https://github.com/matthiaskoenig/canagliflozin-model) and archived on Zenodo 0.7.0 [34].
Simulations followed the respective clinical study designs, accounting for single- and multiple-dose regimens, and renal or hepatic impairment. All simulations are provided in Supplementary Materials Section S6 (Figures S7–S67).
The final parameter set is summarized in the Supplementary Materials Tables S2 and S3. Parameter convergence and goodness-of-fit metrics are shown in the Supplementary Materials Figure S5 and S6. All submodel visualizations are provided in Supplementary Materials Section S3 (Figures S2-S4), and all model equations and ODEs are given in Supplementary Materials Section S4.
3.3. Dose Dependency
The pharmacokinetic and pharmacodynamic effects of canagliflozin over an oral dose range of 0–800 mg are shown in Figure 2 and Figure 3. With increasing doses, plasma concentrations of canagliflozin and its primary metabolites increased, as did the amounts excreted in urine and feces. Canagliflozin reached peak plasma levels after approximately 3.5 h and has a half-life of approximately 8 h, whereas the metabolites showed a slightly delayed peak and elimination. The parameter scan showed a clear dose-dependent rise in exposure metrics ( and ), while and half-lives remained largely unchanged. Higher doses of canagliflozin were associated with lower RTG and a nonlinear increase in urinary glucose excretion.
Time-course simulations were performed for all curated clinical dose-dependency studies (Chen2015 [46], Devineni2012 [47], Devineni2013 [48], Devineni2015a [49], Devineni2016 [50], Iijima2015 [51], Sha2011 [52], Sha2014 [53], Tamborlane2018 [54]). Simulated canagliflozin, M5 and M7 plasma concentrations, urinary excretion, and UGE are shown for both single dose and multiple dose regimens.
3.4. Renal Impairment
The impact of renal impairment on canagliflozin disposition and pharmacodynamics is shown in Figure 4. Simulations were performed for four renal function groups (normal, mild, moderate, severe). Plasma concentrations of canagliflozin were minimally affected by renal dysfunction, whereas exposure to its main metabolites increased with declining renal function. Urinary excretion of canagliflozin, M5 and M7 decreased with impairment, while fecal excretion remained unchanged. Across renal function states, parent and changed modestly, while metabolite exposure increased with impairment.
The pharmacodynamic response showed a reduction in UGE with declining renal function, while RTG changed slightly. In severe impairment, simulated UGE was clearly lower than under normal function, whereas RTG was only minimally affected.
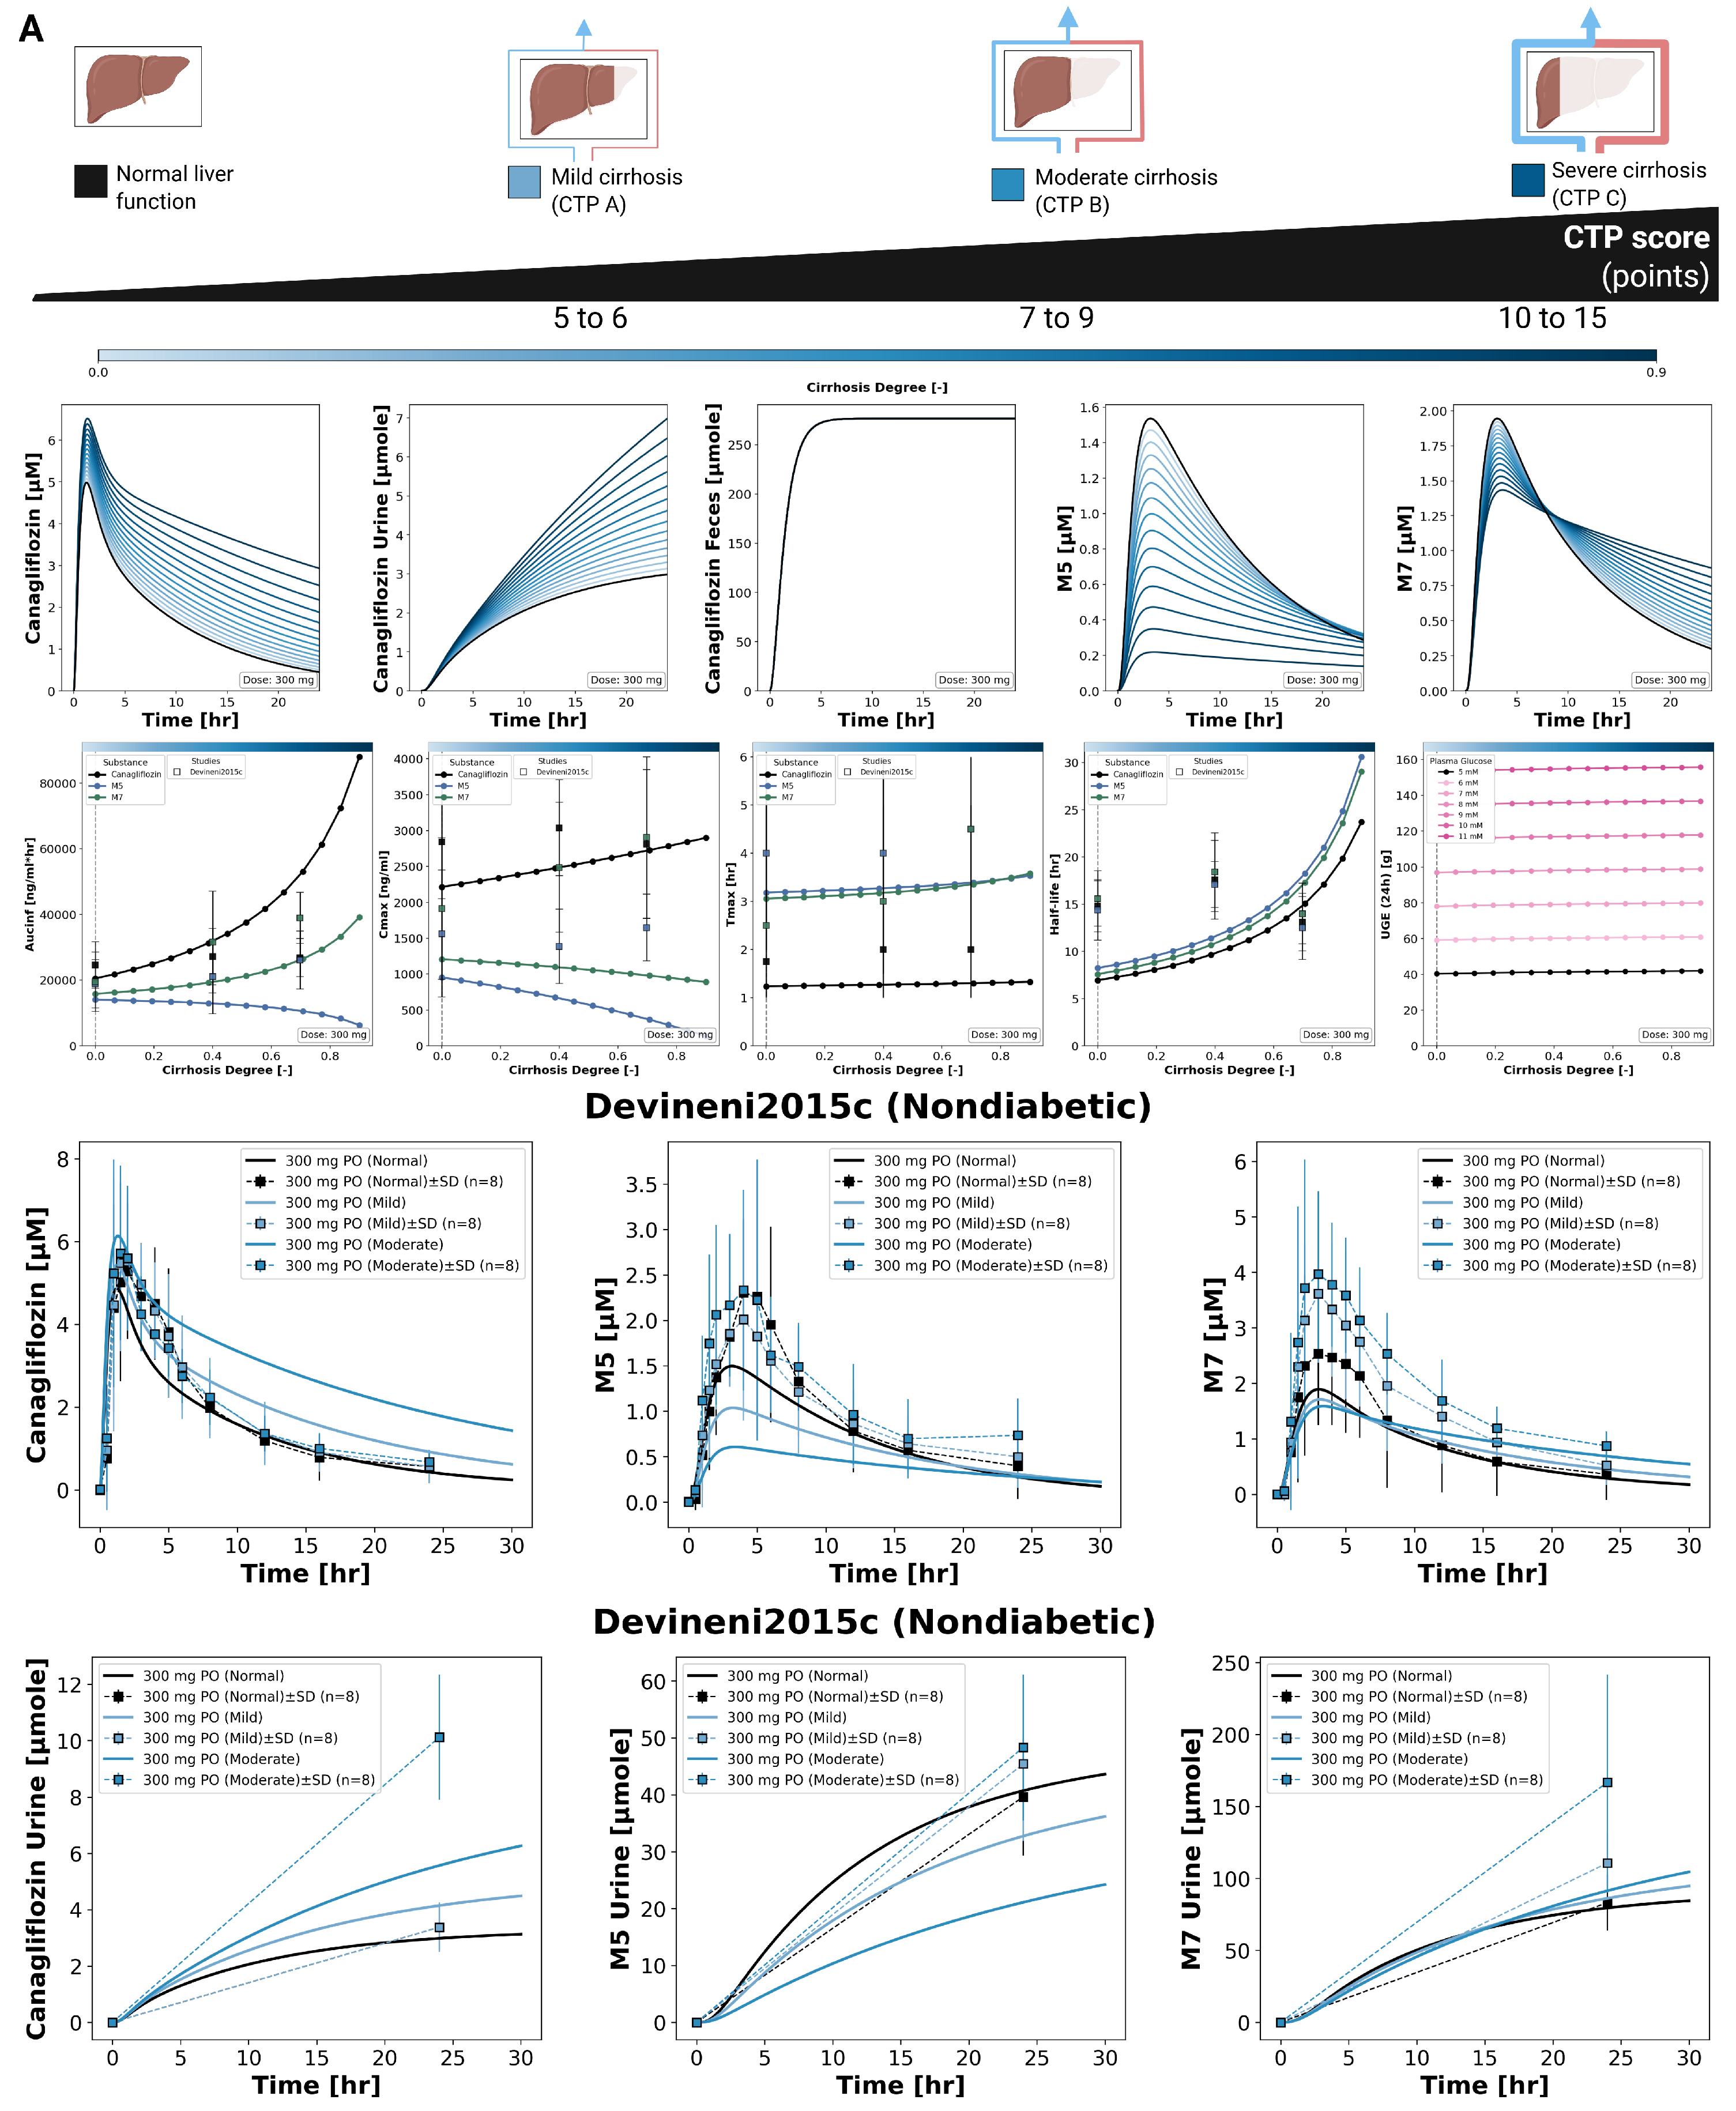
3.5. Hepatic Impairment
The effect of hepatic impairment on canagliflozin pharmacokinetics and pharmacodynamics is summarized in Figure 5. Simulations were performed for normal liver function and for mild, moderate, and severe cirrhosis. With increasing hepatic impairment, canagliflozin plasma exposure increased, reflected by higher values, increased , and a prolonged plasma time course. Urinary excretion of canagliflozin increased with higher plasma exposure, while fecal excretion of the parent drug remained unchanged across hepatic function states.
For the metabolite M5, plasma concentrations decreased with increasing hepatic impairment, with reductions in both and AUC. In contrast, M7 showed a reduced peak concentration but a prolonged exposure, resulting in lower values and increased AUC with increasing severity of cirrhosis. Time to maximum concentration () was stable for canagliflozin, M5, and M7 across all hepatic impairment categories. Parameter scans showed an increase in half-life for the parent drug and both metabolites with increasing hepatic impairment, without a linear relationship to cirrhosis severity.
Pharmacodynamic effects were minimal. UGE remained largely unchanged across hepatic function states. Simulated plasma concentration time courses and urinary excretion profiles for canagliflozin, M5, and M7 under different degrees of hepatic impairment are shown together with clinical data from Devineni2015c [9].

Table 1.
Summary of studies for modeling. Overview of study identifiers, PK-DB IDs, PMID, route, dosing, and subject characteristics, including health status, renal impairment, hepatic impairment and T2DM.
Table 1.
Summary of studies for modeling. Overview of study identifiers, PK-DB IDs, PMID, route, dosing, and subject characteristics, including health status, renal impairment, hepatic impairment and T2DM.
| Study | PK-DB | PMID | Route | Dosing | Dose [mg] | Healthy | Renal impairment | Hepatic impairment | T2DM |
|---|---|---|---|---|---|---|---|---|---|
| Chen2015 [46] | PKDB00858 | 26048186 | PO | single | 100, 300 | ✓ | |||
| Devineni2012 [47] | PKDB00874 | 22226086 | PO | single, multi | 100, 300 | ✓ | |||
| Devineni2013 [48] | PKDB00875 | 23670707 | PO | single, multi | 50, 100, 300 | ✓ | |||
| Devineni2014 [56] | PKDB00879 | 24726680 | PO | multi | 300 | ✓ | |||
| Devineni2015 [57] | PKDB00880 | 27140803 | PO | single | 300 | ✓ | |||
| Devineni2015a [49] | PKDB00876 | 25500487 | PO | single, multi | 50, 100, 300 | ✓ | |||
| Devineni2015b [58] | PKDB00877 | 27136910 | PO, IV | single | 0.010, 300 | ✓ | |||
| Devineni2015c [9] | PKDB00881 | 25659911 | PO | single | 300 | ✓ | ✓ | ✓ | |
| Devineni2015d [59] | PKDB00882 | 25407255 | PO | single, multi | 300 | ✓ | |||
| Devineni2015e [60] | PKDB00883 | 27136908 | PO | single | 50, 100, 300 | ✓ | |||
| Devineni2016 [50] | PKDB00884 | 26687552 | PO | single | 200, 300 | ✓ | |||
| Iijima2015 [51] | PKDB00885 | 26280756 | PO | single, multi | 25, 100, 200, 400 | ✓ | |||
| Inagaki2014 [55] | PKDB00878 | 25200141 | PO | single | 100, 200 | ✓ | ✓ | ||
| Kinoshita2015 [61] | PKDB00886 | 25424014 | PO | single, multi | 200 | ✓ | |||
| Mamidi2014 [62] | PKDB00887 | 24568888 | PO | single | 188 | ✓ | |||
| Mohamed2019 [63] | PKDB00888 | 31384829 | PO | single | 50 | ✓ | |||
| Murphy2015 [64] | PKDB00857 | 25546166 | PO | single | 150 | ✓ | |||
| Sha2011 [52] | PKDB00889 | 21457428 | PO | single, multi | 10, 30, 100, 200, 400, 600, 800 | ✓ | |||
| Sha2014 [53] | PKDB00890 | 25166023 | PO | single, multi | 30, 100, 200, 300, 400 | ✓ | |||
| Sha2015 [65] | PKDB00891 | 25421015 | PO | multi | 300 | ✓ | |||
| Tamborlane2018 [54] | PKDB00892 | 29271103 | PO | multi | 100, 300 | ✓ | |||
| Wattamwar2020 [66] | PKDB01127 | 32763846 | PO | multi | 150 | ✓ |
4. Discussion
In this study, we established a comprehensive clinical dataset of canagliflozin pharmacokinetics and pharmacodynamics and used it to develop a mechanistic PBPK/PD digital twin. In total, 22 clinical trials were curated, covering a broad spectrum of dosing regimens and study populations, including healthy individuals, patients with type 2 diabetes, and cohorts with renal and hepatic impairment. Overall, data availability was sufficient for model development and evaluation, with consistent reporting of plasma concentration time courses, urinary excretion, and UGE across both single dose and multiple dose designs. Fecal excretion data and RTG related endpoints were sufficient to support model calibration and validation.
The PBPK/PD framework integrates systemic distribution, hepatic metabolism, and renal elimination into a coherent representation of canagliflozin disposition and pharmacodynamic effect. Robust parameter optimization and good agreement between simulations and observed data across a wide range of studies support the reliability of the model. A key strength of this mechanistic approach is its ability to investigate scenarios that are difficult to address systematically in clinical trials, such as direct comparisons between renal and hepatic impairment or controlled exploration of dose dependent behavior across physiological states. Pharmacodynamic effects are driven by plasma canagliflozin concentrations through inhibition of SGLT2, resulting in a modulation of RTG and a mechanistic, physiologically interpretable link between exposure and UGE.
The simulations reproduced the expected dose dependent pharmacokinetic and pharmacodynamic behavior of canagliflozin, with increasing doses leading to higher plasma exposure and greater UGE. Across the investigated dose range, time to maximum concentration and elimination half life remained largely unchanged, indicating dose proportional kinetics within the therapeutic window. The modeled dose dependent increase in UGE reflects progressive inhibition of renal glucose reabsorption and is consistent with the observed nonlinear relationship between exposure and pharmacodynamic response reported in clinical studies.
The pharmacokinetics and pharmacodynamics of canagliflozin under conditions of hepatic impairment are less extensively characterized than in other clinical populations. Evaluation in this setting was constrained by the availability of clinical data, as only one study reported plasma concentration–time profiles. Corresponding pharmacodynamic measurements, including UGE and RTG, were not reported, which limited direct assessment of pharmacodynamic effects. In addition, the available plasma concentration–time profiles exhibited substantial variability, complicating quantitative comparisons between simulations and observations.
Clinical observations under hepatic impairment showed little to no change in parent canagliflozin plasma exposure across degrees of liver dysfunction. In contrast, metabolite behavior differed, with increased plasma exposure of M7, while M5 profiles were noisy and did not exhibit a consistent systematic trend. Model simulations predicted increased parent canagliflozin exposure with worsening hepatic impairment, reflecting reduced hepatic metabolic capacity. In parallel, simulated M5 exposure decreased due to diminished hepatic formation, whereas M7 showed prolonged exposure driven by reduced clearance and the additional formation pathway in the kidney. As a result, the clinical parent drug exposure was not fully reproduced by the model, and agreement for metabolite profiles remained qualitative and limited by data variability.
Renal metabolism was represented as part of the mechanistic model structure. Published studies report renal formation of M7, and this pathway was therefore implemented in the kidney submodel. Inclusion of renal M7 metabolism improved agreement between simulations and clinical data, particularly for urinary excretion and, to a lesser extent, for plasma concentration–time profiles. In contrast, renal metabolism of M5 was not implemented, consistent with reports indicating negligible renal conversion despite expression of the corresponding UGT enzymes in kidney tissue [67].
Despite these considerations, discrepancies between simulations and clinical observations persisted under hepatic impairment. These findings suggest that additional processes may contribute to canagliflozin disposition, for example altered renal handling, extrahepatic metabolism, or compensatory clearance pathways that are not captured by the current model.
Renal impairment had a pronounced influence on the pharmacodynamics of canagliflozin and represented an important source of variability in treatment response. Evaluation in this population was supported by two clinical studies reporting both pharmacokinetic and pharmacodynamic measurements. Across levels of renal impairment, parent canagliflozin plasma exposure changed only modestly, whereas exposure to the major metabolites increased with declining renal function. This pattern is consistent with reduced renal elimination of the metabolites, indicating that systemic exposure to the parent drug is relatively resistant to moderate reductions in renal function. The PBPK/PD model reproduced these trends, supporting the mechanistic representation of renal clearance pathways.
Unlike the limited pharmacokinetic changes, renal impairment strongly affected the pharmacodynamic effects. Both clinical data and simulations revealed a significant decrease in UGE as renal function declined, despite relatively stable parent drug concentrations. These results highlight the dependence of the pharmacodynamic response on renal glucose filtration and tubular handling, emphasizing the critical role of kidney function in determining the efficacy of SGLT2 inhibition.
Agreement between simulations and clinical observations under renal impairment was generally stronger than for hepatic impairment. Although the available studies were restricted to single–dose regimes, the presence of plasma, urinary, and pharmacodynamic endpoints allowed evaluation of both exposure and response. The consistent reproduction of these trends across renal function categories supports the validity of the renal impairment implementation within the PBPK/PD framework.
Future work should focus on improving the breadth and consistency of clinical data available for evaluating canagliflozin under organ impairment. In particular, more comprehensive pharmacokinetic and pharmacodynamic reporting under hepatic impairment is needed to enable mechanistic interpretation beyond plasma exposure alone. Standardized measurement of UGE and RTG would substantially strengthen assessment of pharmacodynamic behavior in this setting.
Although the model performed more robustly under renal impairment, the available evidence remains limited. A wider range of renal function datasets, including multiple-dose regimens and aligned pharmacokinetic and pharmacodynamic endpoints, would further support the refinement and validation of the model. Systematic reporting across impairment studies would enhance the utility of mechanistic PBPK/PD models and improve the general understanding of drug behavior and therapeutic response in patients with altered organ function.
Beyond the pharmacological findings, this study also addresses a broader challenge in computational pharmacology and systems biology related to model transparency and reproducibility. A substantial fraction of published PBPK models cannot be independently reproduced because essential components, such as model equations, executable code, and curated calibration datasets, are not publicly available [17,18]. This limits independent verification and substantially restricts reuse, extension, and cumulative model development within the community.
To address these limitations, reproducibility and accessibility were treated as core design principles in the present work. The complete modeling framework, including the SBML model, simulation scripts, and curated clinical datasets, is openly available and structured in accordance with FAIR principles [19,68]. This enables independent reproduction, transparent evaluation, and systematic reuse of the model across different contexts. All resources are released under permissive MIT and CC-BY licenses, lowering barriers to reuse in both academic and industrial settings and allowing straightforward integration into existing workflows, including commercial applications.
In summary, this PBPK/PD digital twin of canagliflozin integrates diverse clinical data into a mechanistic framework that captures key pharmacokinetic and pharmacodynamic behavior across dosing regimens and patient populations. The model provides quantitative insight into dose dependency and the effects of organ impairment, supporting analysis of variability in drug response under clinically relevant conditions. By providing full open access to the model, simulation code, and curated datasets, this work establishes a transparent and reproducible reference framework that supports independent validation, reuse, and future PBPK/PD model development.
Supplementary Materials
The following supporting information can be downloaded at the website of this paper posted on Preprints.org.
Author Contributions
Conceptualization, V.T. and M.K.; methodology, V.T. and M.K.; software, V.T., M.E. and M.K.; validation, V.T., M.E. and M.K.; formal analysis, V.T., M.E., and M.K.; investigation, V.T., M.E., and M.K.; resources, M.K.; data curation, V.T. and M.K.; writing—original draft preparation, V.T. and M.E.; writing—review and editing, V.T. and M.E. and M.K.; visualization, V.T., M.E. and M.K.; supervision, M.K.; project administration, M.K.; funding acquisition, M.K. All authors have read and agreed to the published version of the manuscript.
Funding
M.K. was supported by the Federal Ministry of Research, Technology and Space (BMFTR, Germany) within ATLAS by grant number 031L0304B and by the German Research Foundation (DFG) by the DFG grant number 436883643 and 465194077. Michelle Elias was supported by the German Research Foundation (DFG) within the Priority Programme SPP 2311, Subproject SimLivA by grant number 465194077.
Institutional Review Board Statement
Not applicable.
Informed Consent Statement
Not applicable.
Data Availability Statement
All curated pharmacokinetic data are publicly available in the PK-DB database (https://pk-db.com). The model and all associated materials (simulation scripts, parameters, and documentation) are publicly available in SBML format under a CC-BY 4.0 license at https://github.com/matthiaskoenig/canagliflozin-model [34].
Acknowledgments
This work was supported by the BMBF-funded de.NBI Cloud within the German Network for Bioinformatics Infrastructure (de.NBI) (031A537B, 031A533A, 031A538A, 031A533B, 031A535A, 031A537C, 031A534A, 031A532B). Figures created in https://BioRender.com. König, M. (2026) https://BioRender.com/5jzh8re.
Conflicts of Interest
The authors declare no conflicts of interest.
References
- American Diabetes Association Professional Practice Committee. 2. Diagnosis and Classification of Diabetes: Standards of Care in Diabetes-2024. Diabetes Care 2024, 47, S20–S42. [Google Scholar] [CrossRef]
- Institute for Health Metrics and Evaluation (IHME). Global Burden of Disease 2021: Findings from the GBD 2021 Study; Technical report; Institute for Health Metrics and Evaluation, University of Washington, 2021. [Google Scholar]
- Vallon, V. Glucose Transporters in the Kidney in Health and Disease. Pflugers Archiv: European Journal of Physiology 2020, 472, 1345–1370. [Google Scholar] [CrossRef]
- DeFronzo, R.A.; Hompesch, M.; Kasichayanula, S.; Liu, X.; Hong, Y.; Pfister, M.; Morrow, L.A.; Leslie, B.R.; Boulton, D.W.; Ching, A.; et al. Characterization of Renal Glucose Reabsorption in Response to Dapagliflozin in Healthy Subjects and Subjects with Type 2 Diabetes. Diabetes Care 2013, 36, 3169–3176. [Google Scholar] [CrossRef]
- Nisly, S.A.; Kolanczyk, D.M.; Walton, A.M. Canagliflozin, a New Sodium-Glucose Cotransporter 2 Inhibitor, in the Treatment of Diabetes. American journal of health-system pharmacy: AJHP: official journal of the American Society of Health-System Pharmacists 2013, 70, 311–319. [Google Scholar] [CrossRef]
- Deeks, E.D.; Scheen, A.J. Canagliflozin: A Review in Type 2 Diabetes. Drugs 2017, 77, 1577–1592. [Google Scholar] [CrossRef]
- U.S. Food and Drug Administration. Invokana (Canagliflozin) Tablets: Full Prescribing Information. 2024. [Google Scholar]
- Perkovic, V.; Jardine, M.; Vijapurkar, U.; Meininger, G. Renal Effects of Canagliflozin in Type 2 Diabetes Mellitus. Current medical research and opinion 2015, 31, 2219–2231. [Google Scholar] [CrossRef]
- Devineni, D.; Curtin, C.R.; Marbury, T.C.; Smith, W.; Vaccaro, N.; Wexler, D.; Vandebosch, A.; Rusch, S.; Stieltjes, H.; Wajs, E. Effect of Hepatic or Renal Impairment on the Pharmacokinetics of Canagliflozin, a Sodium Glucose Co-Transporter 2 Inhibitor. Clinical therapeutics 2015, 37, 610–628.e4. [Google Scholar] [CrossRef]
- Hoeben, E.; De Winter, W.; Neyens, M.; Devineni, D.; Vermeulen, A.; Dunne, A. Population Pharmacokinetic Modeling of Canagliflozin in Healthy Volunteers and Patients with Type 2 Diabetes Mellitus. Clinical pharmacokinetics 2016, 55, 209–223. [Google Scholar] [CrossRef]
- de Winter, W.; Dunne, A.; de Trixhe, X.W.; Devineni, D.; Hsu, C.H.; Pinheiro, J.; Polidori, D. Dynamic Population Pharmacokinetic-Pharmacodynamic Modelling and Simulation Supports Similar Efficacy in Glycosylated Haemoglobin Response with Once or Twice-Daily Dosing of Canagliflozin. British journal of clinical pharmacology 2017, 83, 1072–1081. [Google Scholar] [CrossRef]
- Dunne, A.; de Winter, W.; Hsu, C.H.; Mariam, S.; Neyens, M.; Pinheiro, J.; Woot de Trixhe, X. The Method of Averaging Applied to Pharmacokinetic/Pharmacodynamic Indirect Response Models. Journal of pharmacokinetics and pharmacodynamics 2015, 42, 417–426. [Google Scholar] [CrossRef]
- Mori, K.; Saito, R.; Nakamaru, Y.; Shimizu, M.; Yamazaki, H. Physiologically Based Pharmacokinetic-Pharmacodynamic Modeling to Predict Concentrations and Actions of Sodium-Dependent Glucose Transporter 2 Inhibitor Canagliflozin in Human Intestines and Renal Tubules. Biopharmaceutics & drug disposition 2016, 37, 491–506. [Google Scholar] [CrossRef]
- Mori-Anai, K.; Tashima, Y.; Nakada, T.; Nakamaru, Y.; Takahata, T.; Saito, R. Mechanistic Evaluation of the Effect of Sodium-Dependent Glucose Transporter 2 Inhibitors on Delayed Glucose Absorption in Patients with Type 2 Diabetes Mellitus Using a Quantitative Systems Pharmacology Model of Human Systemic Glucose Dynamics. Biopharmaceutics & drug disposition 2020, 41, 352–366. [Google Scholar] [CrossRef]
- Mamidi, R.N.V.S.; Dallas, S.; Sensenhauser, C.; Lim, H.K.; Scheers, E.; Verboven, P.; Cuyckens, F.; Leclercq, L.; Evans, D.C.; Kelley, M.F.; et al. In Vitro and Physiologically-Based Pharmacokinetic Based Assessment of Drug-Drug Interaction Potential of Canagliflozin. British journal of clinical pharmacology 2017, 83, 1082–1096. [Google Scholar] [CrossRef] [PubMed]
- Yao, X.; Zhou, J.; Song, L.; Ren, Y.; Hu, P.; Liu, D. A Model-Based Meta Analysis Study of Sodium Glucose Co-Transporter-2 Inhibitors. CPT: pharmacometrics & systems pharmacology 2023, 12, 487–499. [Google Scholar] [CrossRef]
- Tiwari, K.; Kananathan, S.; Roberts, M.G.; Meyer, J.P.; Sharif Shohan, M.U.; Xavier, A.; Maire, M.; Zyoud, A.; Men, J.; Ng, S.; et al. Reproducibility in Systems Biology Modelling. Molecular Systems Biology 2021, 17, e9982. [Google Scholar] [CrossRef]
- Domínguez-Romero, E.; Mazurenko, S.; Scheringer, M.; Martins Dos Santos, V.A.P.; Evelo, C.T.; Anton, M.; Hancock, J.M.; Županič, A.; Suarez-Diez, M. Making PBPK Models More Reproducible in Practice. Briefings in Bioinformatics 2024, 25, bbae569. [Google Scholar] [CrossRef]
- Wilkinson, M.D.; Dumontier, M.; Aalbersberg, I.J.J.; Appleton, G.; Axton, M.; Baak, A.; Blomberg, N.; Boiten, J.W.; da Silva Santos, L.B.; Bourne, P.E.; et al. The FAIR Guiding Principles for Scientific Data Management and Stewardship. Scientific Data 2016, 3, 160018. [Google Scholar] [CrossRef]
- Jones, H.; Rowland-Yeo, K. Basic Concepts in Physiologically Based Pharmacokinetic Modeling in Drug Discovery and Development. CPT: Pharmacometrics & Systems Pharmacology 2013, 2, 1–12. [Google Scholar] [CrossRef]
- Sager, J.E.; Yu, J.; Ragueneau-Majlessi, I.; Isoherranen, N. Physiologically Based Pharmacokinetic (PBPK) Modeling and Simulation Approaches: A Systematic Review of Published Models, Applications, and Model Verification. Drug Metabolism and Disposition 2015, 43, 1823–1837. [Google Scholar] [CrossRef]
- Hartmanshenn, C.; Scherholz, M.; Androulakis, I.P. Physiologically-Based Pharmacokinetic Models: Approaches for Enabling Personalized Medicine. Journal of Pharmacokinetics and Pharmacodynamics 2016, 43, 481–504. [Google Scholar] [CrossRef]
- Hucka, M.; Bergmann, F.T.; Chaouiya, C.; Dräger, A.; Hoops, S.; Keating, S.M.; König, M.; Novère, N.L.; Myers, C.J.; Olivier, B.G.; et al. The Systems Biology Markup Language (SBML): Language Specification for Level 3 Version 2 Core Release 2. Journal of Integrative Bioinformatics 2019, 16, 20190021. [Google Scholar] [CrossRef] [PubMed]
- Gonzalez Hernandez, F.; Carter, S.J.; Iso-Sipilä, J.; Goldsmith, P.; Almousa, A.A.; Gastine, S.; Lilaonitkul, W.; Kloprogge, F.; Standing, J.F. An Automated Approach to Identify Scientific Publications Reporting Pharmacokinetic Parameters. Wellcome Open Research 2021, 6, 88. [Google Scholar] [CrossRef]
- Grzegorzewski, J.; Brandhorst, J.; Green, K.; Eleftheriadou, D.; Duport, Y.; Barthorscht, F.; Köller, A.; Ke, D.Y.J.; De Angelis, S.; König, M. PK-DB: Pharmacokinetics Database for Individualized and Stratified Computational Modeling. Nucleic Acids Research 2021, 49, D1358–D1364, [33151297. [Google Scholar] [CrossRef] [PubMed]
- Rohatgi, A. WebPlotDigitizer. 2024. [Google Scholar]
- Keating, S.M.; Waltemath, D.; König, M.; Zhang, F.; Dräger, A.; Chaouiya, C.; Bergmann, F.T.; Finney, A.; Gillespie, C.S.; Helikar, T.; et al. SBML Level 3: An Extensible Format for the Exchange and Reuse of Biological Models. Molecular Systems Biology 2020, 16, e9110. [Google Scholar] [CrossRef]
- König, M. Sbmlutils: Python Utilities for SBML; Zenodo, 2024. [Google Scholar] [CrossRef]
- König, M.; Dräger, A.; Holzhütter, H.G. CySBML: A Cytoscape Plugin for SBML. Bioinformatics (Oxford, England) 2012, 28, 2402–2403, [22772946]. [Google Scholar] [CrossRef]
- König, M. Cy3sbml - SBML for Cytoscape; Zenodo, 2025. [Google Scholar] [CrossRef]
- König, M. Sbmlsim: SBML Simulation Made Easy. [object Object]. 2021. [Google Scholar] [CrossRef]
- Somogyi, E.T.; Bouteiller, J.M.; Glazier, J.A.; König, M.; Medley, J.K.; Swat, M.H.; Sauro, H.M. libRoadRunner: A High Performance SBML Simulation and Analysis Library. Bioinformatics (Oxford, England) 2015, 31, 3315–3321. [Google Scholar] [CrossRef]
- Welsh, C.; Xu, J.; Smith, L.; König, M.; Choi, K.; Sauro, H.M. libRoadRunner 2.0: A High Performance SBML Simulation and Analysis Library. Bioinformatics 2023, 39, btac770. [Google Scholar] [CrossRef]
- Tereshchuk, V.; Elias, M.; König, M. Physiologically Based Pharmacokinetic/ Pharmacodynamic (PBPK/PD) Model of Canagliflozin. Zenodo 2026. [Google Scholar] [CrossRef]
- Stevens, P.E.; Ahmed, S.B.; Carrero, J.J.; Foster, B.; Francis, A.; Hall, R.K.; Herrington, W.G.; Hill, G.; Inker, L.A.; Kazancıoğlu, R.; et al. KDIGO 2024 Clinical Practice Guideline for the Evaluation and Management of Chronic Kidney Disease. Kidney International 2024, 105, S117–S314. [Google Scholar] [CrossRef] [PubMed]
- Mallol, B.S.; Grzegorzewski, J.; Tautenhahn, H.M.; König, M. Insights into Intestinal P-glycoprotein Function Using Talinolol: A PBPK Modeling Approach. 2023. [Google Scholar] [CrossRef]
- Child, C.G.; Turcotte, J.G. Surgery and Portal Hypertension. Major Problems in Clinical Surgery 1964, 1, 1–85. [Google Scholar]
- Pugh, R.N.; Murray-Lyon, I.M.; Dawson, J.L.; Pietroni, M.C.; Williams, R. Transection of the Oesophagus for Bleeding Oesophageal Varices. The British Journal of Surgery 1973, 60, 646–649. [Google Scholar] [CrossRef] [PubMed]
- Köller, A.; Grzegorzewski, J.; König, M. Physiologically Based Modeling of the Effect of Physiological and Anthropometric Variability on Indocyanine Green Based Liver Function Tests. Frontiers in Physiology 2021, 2043. [Google Scholar] [CrossRef]
- Köller, A.; Grzegorzewski, J.; Tautenhahn, H.M.; König, M. Prediction of Survival After Partial Hepatectomy Using a Physiologically Based Pharmacokinetic Model of Indocyanine Green Liver Function Tests. Frontiers in physiology 2021, 12, 730418. [Google Scholar] [CrossRef]
- Sobol′, I. Global Sensitivity Indices for Nonlinear Mathematical Models and Their Monte Carlo Estimates. Mathematics and Computers in Simulation 2001, 55, 271–280. [Google Scholar] [CrossRef]
- Saltelli, A. Making Best Use of Model Evaluations to Compute Sensitivity Indices. Computer Physics Communications 2002, 145, 280–297. [Google Scholar] [CrossRef]
- Saltelli, A.; Annoni, P.; Azzini, I.; Campolongo, F.; Ratto, M.; Tarantola, S. Variance Based Sensitivity Analysis of Model Output. Design and Estimator for the Total Sensitivity Index. Computer Physics Communications 2010, 181, 259–270. [Google Scholar] [CrossRef]
- Herman, J.; Usher, W. SALib: An Open-Source Python Library for Sensitivity Analysis. The Journal of Open Source Software 2017, 2. [Google Scholar] [CrossRef]
- Iwanaga, T.; Usher, W.; Herman, J. Toward SALib 2.0: Advancing the Accessibility and Interpretability of Global Sensitivity Analyses. Socio-Environmental Systems Modelling 2022, 4, 18155. [Google Scholar] [CrossRef]
- Chen, X.; Hu, P.; Vaccaro, N.; Polidori, D.; Curtin, C.R.; Stieltjes, H.; Sha, S.; Weiner, S.; Devineni, D. Pharmacokinetics, Pharmacodynamics, and Safety of Single-Dose Canagliflozin in Healthy Chinese Subjects. Clinical therapeutics 2015, 37, 1483–1492.e1. [Google Scholar] [CrossRef] [PubMed]
- Devineni, D.; Morrow, L.; Hompesch, M.; Skee, D.; Vandebosch, A.; Murphy, J.; Ways, K.; Schwartz, S. Canagliflozin Improves Glycaemic Control over 28 Days in Subjects with Type 2 Diabetes Not Optimally Controlled on Insulin. Diabetes, obesity & metabolism 2012, 14, 539–545. [Google Scholar] [CrossRef]
- Devineni, D.; Curtin, C.R.; Polidori, D.; Gutierrez, M.J.; Murphy, J.; Rusch, S.; Rothenberg, P.L. Pharmacokinetics and Pharmacodynamics of Canagliflozin, a Sodium Glucose Co-Transporter 2 Inhibitor, in Subjects with Type 2 Diabetes Mellitus. Journal of clinical pharmacology 2013, 53, 601–610. [Google Scholar] [CrossRef]
- Devineni, D.; Vaccaro, N.; Polidori, D.; Stieltjes, H.; Wajs, E. Single- and Multiple-Dose Pharmacokinetics and Pharmacodynamics of Canagliflozin, a Selective Inhibitor of Sodium Glucose Co-Transporter 2, in Healthy Participants. International journal of clinical pharmacology and therapeutics 2015, 53, 129–138. [Google Scholar] [CrossRef]
- Devineni, D.; Polidori, D.; Curtin, C.; Stieltjes, H.; Tian, H.; Wajs, E. Single-Dose Pharmacokinetics and Pharmacodynamics of Canagliflozin, a Selective Inhibitor of Sodium Glucose Cotransporter 2, in Healthy Indian Participants. Clinical therapeutics 2016, 38, 89–98.e1. [Google Scholar] [CrossRef] [PubMed]
- Iijima, H.; Kifuji, T.; Maruyama, N.; Inagaki, N. Pharmacokinetics, Pharmacodynamics, and Safety of Canagliflozin in Japanese Patients with Type 2 Diabetes Mellitus. Advances in therapy 2015, 32, 768–782. [Google Scholar] [CrossRef] [PubMed]
- Sha, S.; Devineni, D.; Ghosh, A.; Polidori, D.; Chien, S.; Wexler, D.; Shalayda, K.; Demarest, K.; Rothenberg, P. Canagliflozin, a Novel Inhibitor of Sodium Glucose Co-Transporter 2, Dose Dependently Reduces Calculated Renal Threshold for Glucose Excretion and Increases Urinary Glucose Excretion in Healthy Subjects. Diabetes, Obesity & Metabolism 2011, 13, 669–672. [Google Scholar] [CrossRef]
- Sha, S.; Devineni, D.; Ghosh, A.; Polidori, D.; Hompesch, M.; Arnolds, S.; Morrow, L.; Spitzer, H.; Demarest, K.; Rothenberg, P. Pharmacodynamic Effects of Canagliflozin, a Sodium Glucose Co-Transporter 2 Inhibitor, from a Randomized Study in Patients with Type 2 Diabetes. PloS one 2014, 9, e110069. [Google Scholar] [CrossRef]
- Tamborlane, W.V.; Polidori, D.; Argenti, D.; Di Prospero, N.A. Pharmacokinetics and Pharmacodynamics of Canagliflozin in Pediatric Patients with Type 2 Diabetes. Pediatric diabetes 2018, 19, 649–655. [Google Scholar] [CrossRef]
- Inagaki, N.; Kondo, K.; Yoshinari, T.; Ishii, M.; Sakai, M.; Kuki, H.; Furihata, K. Pharmacokinetic and Pharmacodynamic Profiles of Canagliflozin in Japanese Patients with Type 2 Diabetes Mellitus and Moderate Renal Impairment. Clinical drug investigation 2014, 34, 731–742. [Google Scholar] [CrossRef]
- Devineni, D.; Vaccaro, N.; Polidori, D.; Rusch, S.; Wajs, E. Effects of Hydrochlorothiazide on the Pharmacokinetics, Pharmacodynamics, and Tolerability of Canagliflozin, a Sodium Glucose Co-Transporter 2 Inhibitor, in Healthy Participants. Clinical therapeutics 2014, 36, 698–710. [Google Scholar] [CrossRef] [PubMed]
- Devineni, D.; Manitpisitkul, P.; Murphy, J.; Skee, D.; Wajs, E.; Mamidi, R.N.V.S.; Tian, H.; Vandebosch, A.; Wang, S.S.; Verhaeghe, T.; et al. Effect of Canagliflozin on the Pharmacokinetics of Glyburide, Metformin, and Simvastatin in Healthy Participants. Clinical pharmacology in drug development 2015, 4, 226–236. [Google Scholar] [CrossRef]
- Devineni, D.; Murphy, J.; Wang, S.S.; Stieltjes, H.; Rothenberg, P.; Scheers, E.; Mamidi, R.N.V.S. Absolute Oral Bioavailability and Pharmacokinetics of Canagliflozin: A Microdose Study in Healthy Participants. Clinical pharmacology in drug development 2015, 4, 295–304. [Google Scholar] [CrossRef]
- Devineni, D.; Vaccaro, N.; Murphy, J.; Curtin, C.; Mamidi, R.N.V.S.; Weiner, S.; Wang, S.S.; Ariyawansa, J.; Stieltjes, H.; Wajs, E.; et al. Effects of Rifampin, Cyclosporine A, and Probenecid on the Pharmacokinetic Profile of Canagliflozin, a Sodium Glucose Co-Transporter 2 Inhibitor, in Healthy Participants. International journal of clinical pharmacology and therapeutics 2015, 53, 115–128. [Google Scholar] [CrossRef]
- Devineni, D.; Manitpisitkul, P.; Murphy, J.; Stieltjes, H.; Ariyawansa, J.; Di Prospero, N.A.; Rothenberg, P. Effect of Food on the Pharmacokinetics of Canagliflozin, a Sodium Glucose Co-Transporter 2 Inhibitor, and Assessment of Dose Proportionality in Healthy Participants. Clinical pharmacology in drug development 2015, 4, 279–286. [Google Scholar] [CrossRef]
- Kinoshita, S.; Kondo, K. Evaluation of Pharmacokinetic and Pharmacodynamic Interactions of Canagliflozin and Teneligliptin in Japanese Healthy Male Volunteers. Expert opinion on drug metabolism & toxicology 2015, 11, 7–14. [Google Scholar] [CrossRef]
- Mamidi, R.N.V.S.; Cuyckens, F.; Chen, J.; Scheers, E.; Kalamaridis, D.; Lin, R.; Silva, J.; Sha, S.; Evans, D.C.; Kelley, M.F.; et al. Metabolism and Excretion of Canagliflozin in Mice, Rats, Dogs, and Humans. Drug metabolism and disposition: the biological fate of chemicals 2014, 42, 903–916. [Google Scholar] [CrossRef] [PubMed]
- Mohamed, D.; Elshahed, M.S.; Nasr, T.; Aboutaleb, N.; Zakaria, O. Novel LC-MS/MS Method for Analysis of Metformin and Canagliflozin in Human Plasma: Application to a Pharmacokinetic Study. BMC chemistry 2019, 13, 82. [Google Scholar] [CrossRef]
- Murphy, J.; Wang, S.S.; Stieltjes, H.; Wajs, E.; Devineni, D. Effect of Food on the Pharmacokinetics of Canagliflozin/Metformin (150/1,000 Mg) Immediate-Release Fixed-Dose Combination Tablet in Healthy Participants. International journal of clinical pharmacology and therapeutics 2015, 53, 256–264. [Google Scholar] [CrossRef] [PubMed]
- Sha, S.; Polidori, D.; Farrell, K.; Ghosh, A.; Natarajan, J.; Vaccaro, N.; Pinheiro, J.; Rothenberg, P.; Plum-Mörschel, L. Pharmacodynamic Differences between Canagliflozin and Dapagliflozin: Results of a Randomized, Double-Blind, Crossover Study. Diabetes, obesity & metabolism 2015, 17, 188–197. [Google Scholar] [CrossRef]
- Wattamwar, T.; Mungantiwar, A.; Gujar, S.; Pandita, N. Development of LC-MS/MS Method for Simultaneous Determination of Canagliflozin and Metformin in Human Plasma and Its Pharmacokinetic Application in Indian Population under Fast and Fed Conditions. Journal of chromatography. B, Analytical technologies in the biomedical and life sciences 2020, 1154, 122281. [Google Scholar] [CrossRef] [PubMed]
- Francke, S.; Mamidi, R.N.V.S.; Solanki, B.; Scheers, E.; Jadwin, A.; Favis, R.; Devineni, D. In Vitro Metabolism of Canagliflozin in Human Liver, Kidney, Intestine Microsomes, and Recombinant Uridine Diphosphate Glucuronosyltransferases (UGT) and the Effect of Genetic Variability of UGT Enzymes on the Pharmacokinetics of Canagliflozin in Humans. Journal of clinical pharmacology 2015, 55, 1061–1072. [Google Scholar] [CrossRef] [PubMed]
- Balaur, I.; Nickerson, D.P.; Welter, D.; Wodke, J.A.; Ancien, F.; Gebhardt, T.; Grouès, V.; Hermjakob, H.; König, M.; Radde, N.; et al. FAIRification of Computational Models in Biology. 2025. [Google Scholar] [CrossRef] [PubMed]
Figure 1.
Whole-body PBPK/PD model of canagliflozin and key factors influencing its disposition. A) Whole-body model showing canagliflozin (CAN) administration (oral and intravenous), systemic circulation, and key organs (liver, kidney, GI tract) involved in metabolism, distribution, and excretion. B) Intestine model illustrating CAN absorption by enterocytes and fecal excretion, accounting for approximately 51.7% of the dose, primarily as parent drug and to a lesser extent as metabolites M7 and M9. C) Hepatic model showing CAN uptake by hepatocytes and conversion to the primary metabolites M5 and M7 via UGT2B4 and UGT1A9, respectively, with minor oxidative metabolism to M9 via CYP3A4. Metabolites M7 and M9 are excreted into bile and enter the intestinal lumen. D) Renal model showing uptake and urinary excretion of CAN, M5, and M7, renal metabolic conversion of CAN to M7 via UGT1A9, and CAN-mediated inhibition of SGLT2, reducing renal glucose reabsorption and increasing UGE. E) Key factors influencing CAN disposition included in the model include administered dose, renal impairment, and hepatic impairment (cirrhosis).
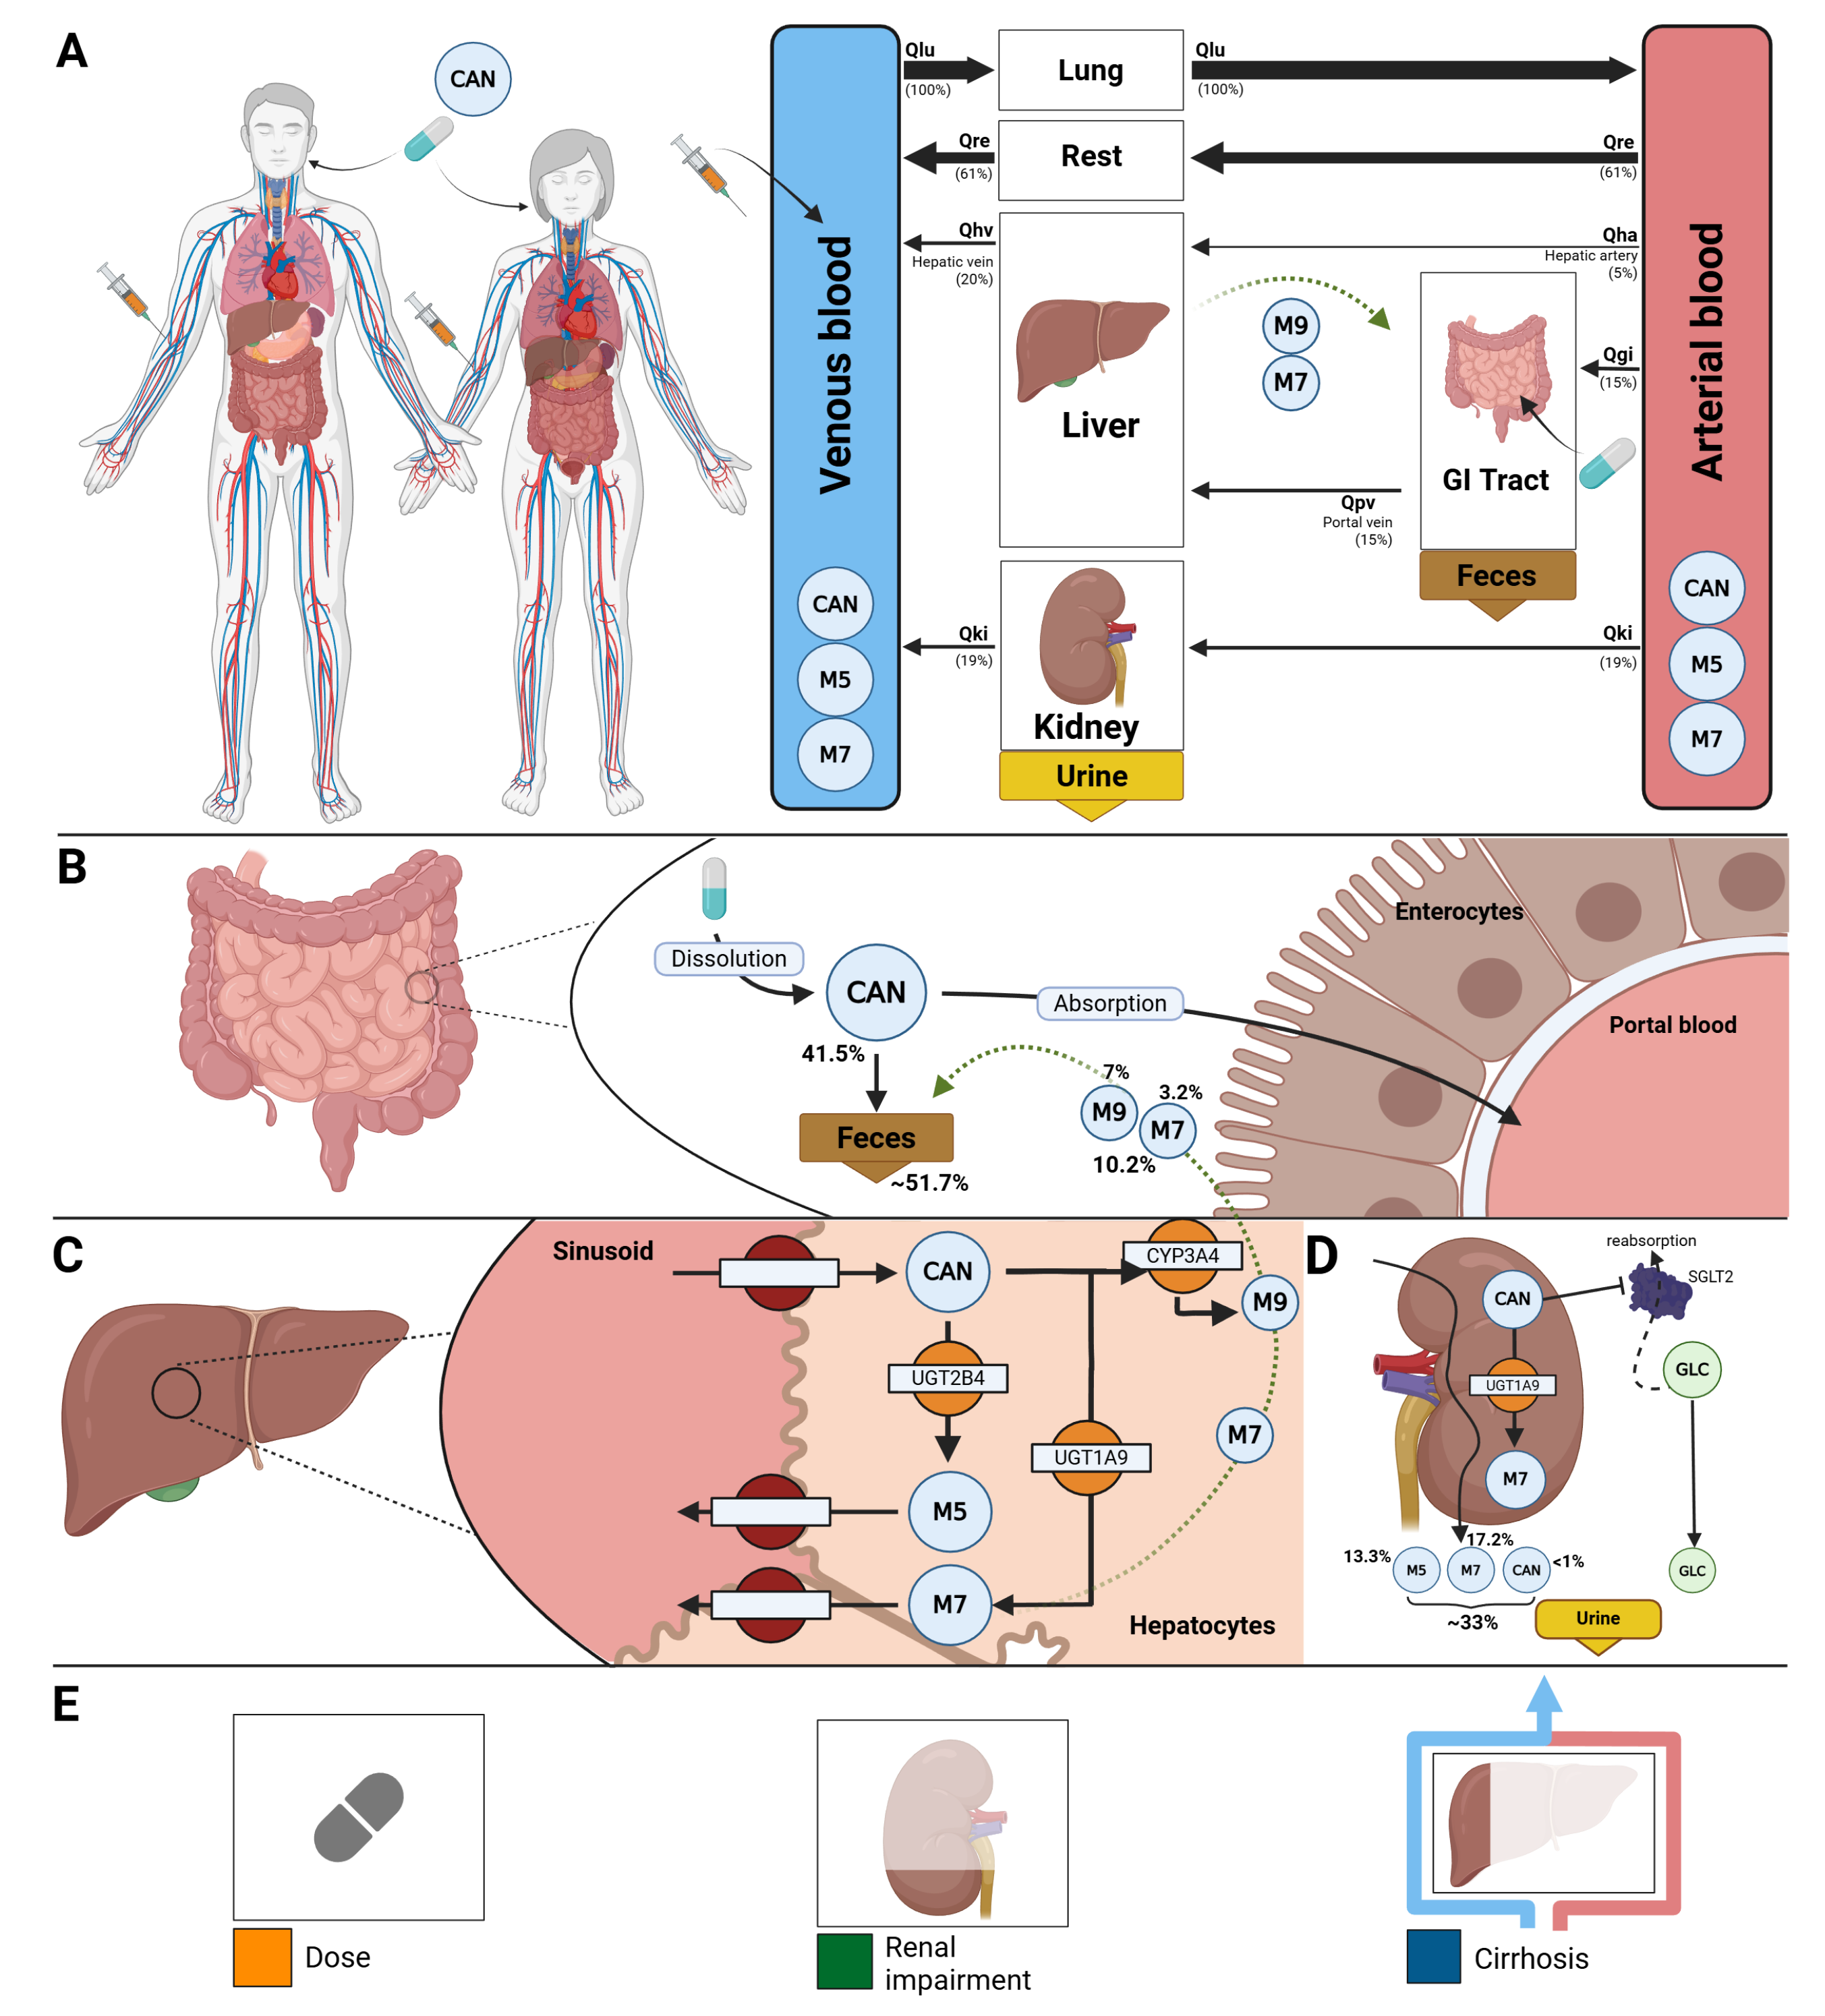
Figure 2.
Dose-dependent pharmacokinetics and pharmacodynamics of canagliflozin. A) Oral dose range (0–800 mg). B) Pharmacokinetic time courses of canagliflozin in plasma, urine, and feces, and of metabolites M5 and M7 in plasma. C) Pharmacokinetic parameters (, , , and half-life) for canagliflozin, M5, and M7, and 24 h UGE; observed parameters overlaid where available. D) Comparison of simulations with study data [46,47,48,49,50]. Simulations are shown as solid lines and study data as symbols with SDs where available.
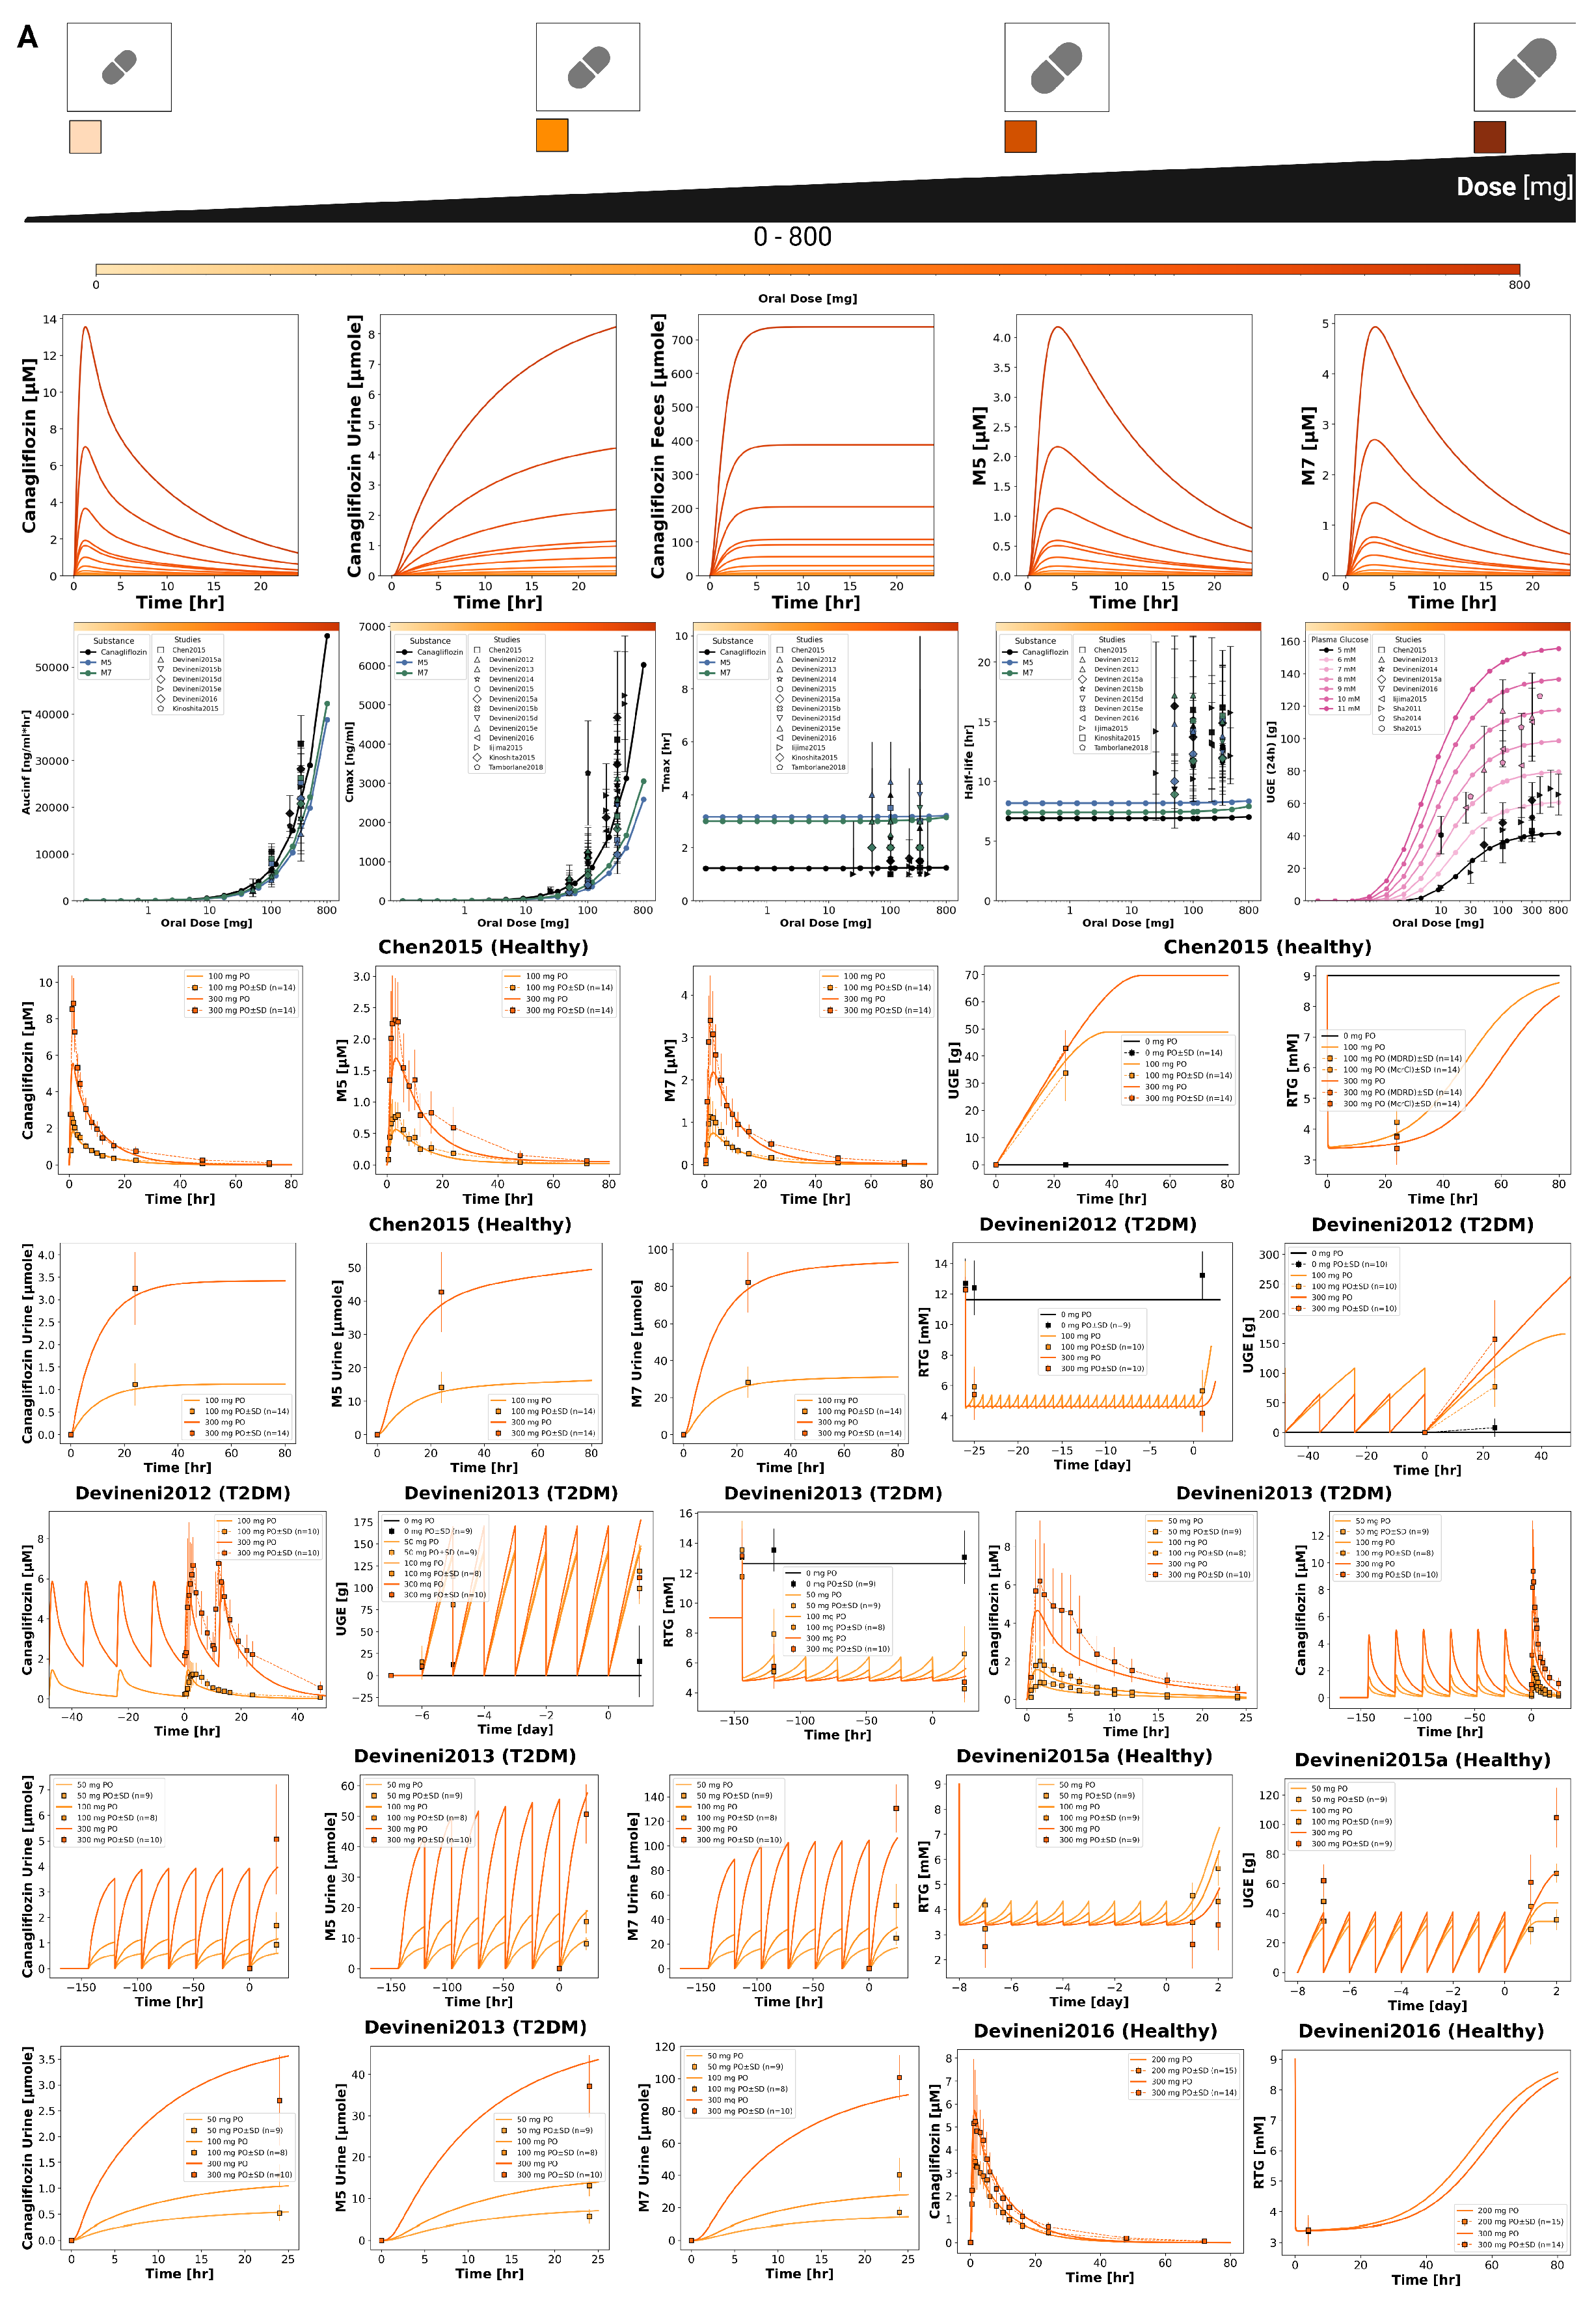
Figure 3.
Additional dose-dependent clinical studies of canagliflozin. Comparison of simulations with clinical studies [51,52,53,54]. Simulations are shown as solid lines, and study data are shown as dashed lines with squares and SDs where available.
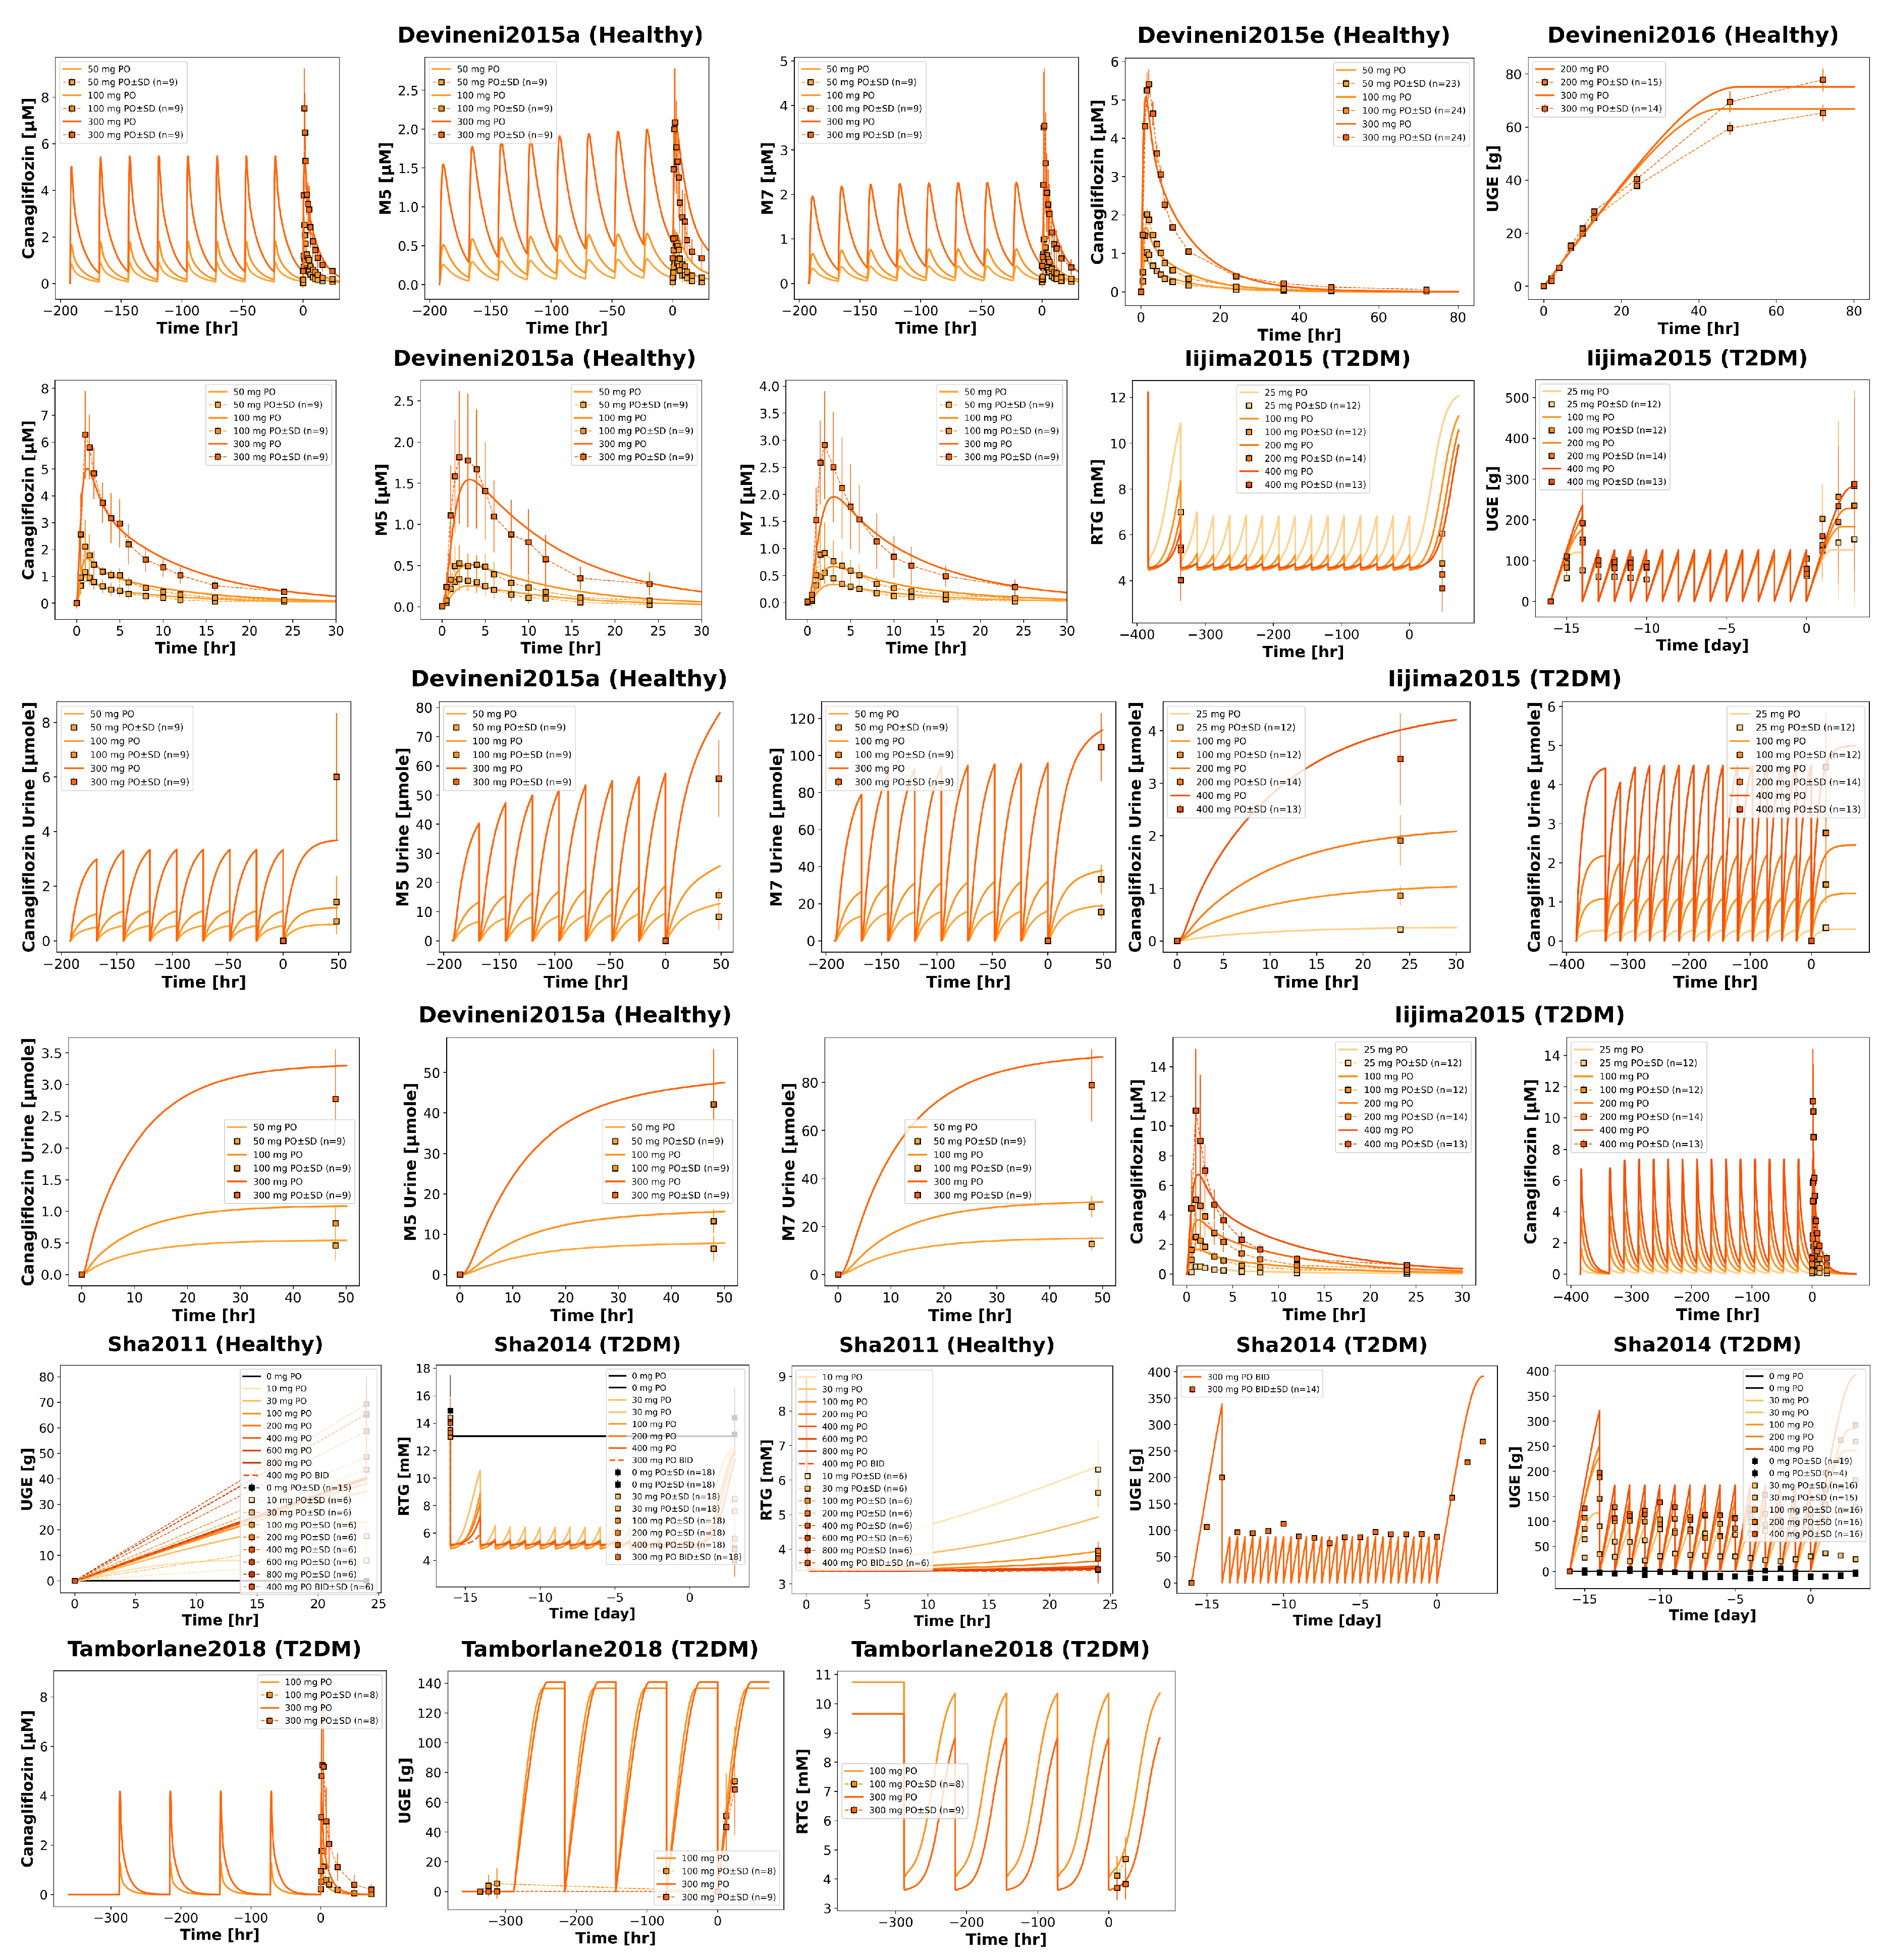
Figure 4.
Effect of renal impairment on pharmacokinetics and pharmacodynamics of canagliflozin. A) Renal function categories from normal to severe impairment used in simulations. B) Pharmacokinetic time courses of canagliflozin in plasma, urine, and feces, and of metabolites M5 and M7 in plasma. C) Pharmacokinetic parameters (, , , and half-life) for canagliflozin, M5, and M7, and 24 h UGE; observed parameters overlaid where available. D) Comparison of simulations with study data [9,55]. Simulations are shown as solid lines, and study data as symbols with SDs where available.
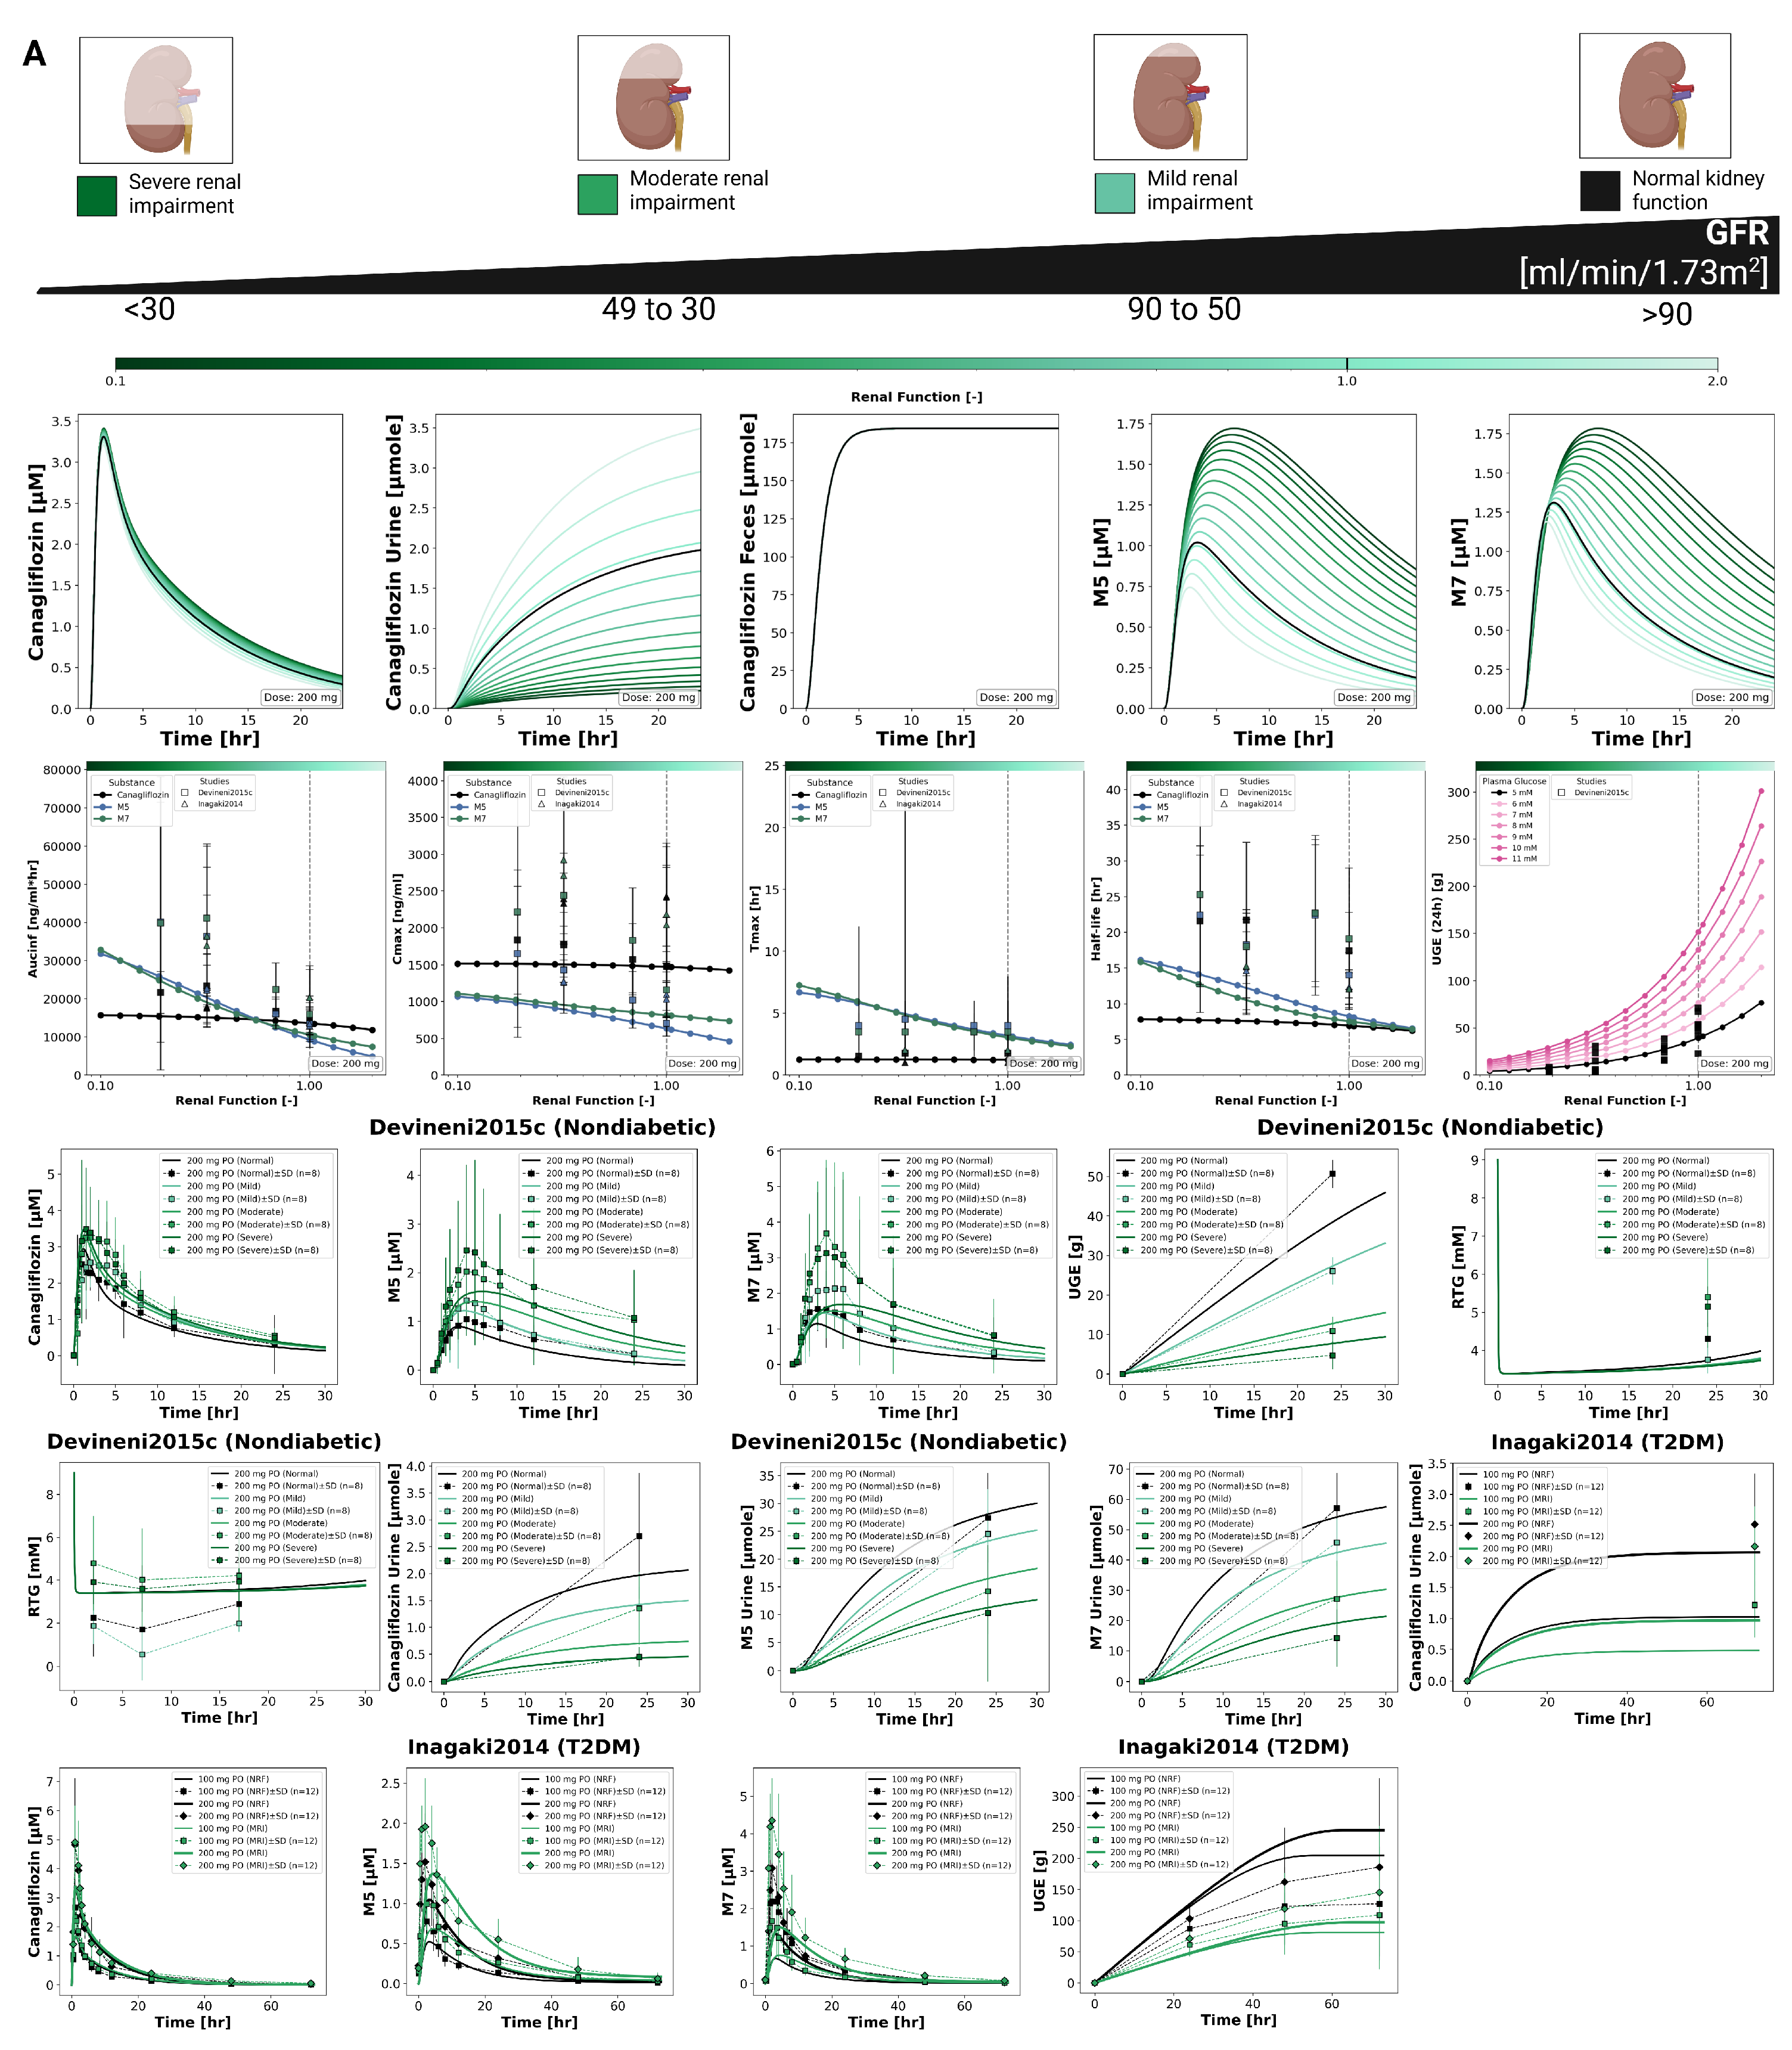
Figure 5.
Effect of hepatic impairment on pharmacokinetics and pharmacodynamics of canagliflozin. A) Liver function categories used in simulations. B) Pharmacokinetic time courses of canagliflozin in plasma, urine, and feces, and of metabolites M5 and M7 in plasma. C) Pharmacokinetic parameters (, , , and half-life) for canagliflozin, M5, and M7, and 24 h UGE; observed parameters overlaid where available. D) Comparison of simulations with study data [9]. Simulations are shown as solid lines, and study data as symbols with SDs where available.
Disclaimer/Publisher’s Note: The statements, opinions and data contained in all publications are solely those of the individual author(s) and contributor(s) and not of MDPI and/or the editor(s). MDPI and/or the editor(s) disclaim responsibility for any injury to people or property resulting from any ideas, methods, instructions or products referred to in the content. |
© 2026 by the authors. Licensee MDPI, Basel, Switzerland. This article is an open access article distributed under the terms and conditions of the Creative Commons Attribution (CC BY) license (http://creativecommons.org/licenses/by/4.0/).
Copyright: This open access article is published under a Creative Commons CC BY 4.0 license, which permit the free download, distribution, and reuse, provided that the author and preprint are cited in any reuse.


