Submitted:
25 January 2026
Posted:
27 January 2026
You are already at the latest version
Abstract
Space exploration has witnessed accelerated progress over the past twentyfive years, leading to scientific and technological breakthroughs that have reshaped humanity’s understanding of the universe beyond Earth. What began with basic satellite deployments has evolved into complex interplanetary missions supported by both national space agencies and private enterprises. This study analyses a comprehensive dataset of global space missions conducted between 2000 and 2025, including launch dates, participating nations, mission categories, objectives, launch vehicles, and mission outcomes. Using data mining and knowledge discovery techniques, the research identifies recurring patterns in mission frequency, geographic distribution, technological advancement, and international collaboration. Temporal analysis reveals shifts in satellite strategies, scientific priorities, and human spaceflight trends, while clustering methods highlight groups of countries with similar mission profiles. The study further examines the relationship between mission complexity and success rates, the growing adoption of reusable launch systems, and the expanding role of commercial organizations. The findings provide valuable insights for policymakers, space agencies, and researchers, supporting strategic planning and future mission development. Overall, the research demonstrates how data-driven methods enhance the understanding of global space exploration trends and emphasize the dynamic, collaborative nature of space activities between 2000 and 2025.
Keywords:
space exploration
; data mining
; knowledge discovery
; space missions
; international collaboration
; private space companies
; reusable launch vehicles
; mission analysis
1. Introduction
Space exploration has transitioned from a government-driven scientific endeavor into a globally interconnected and commercially influenced domain. Over the last two and a half decades, the nature of space missions has expanded beyond traditional satellite launches to include crewed missions, deepspace exploration, planetary research, and commercial satellite constellations. Nations once absent from the space race have established independent programs, while private enterprises have redefined cost efficiency, launch frequency, and technological innovation.
The increasing availability of mission data presents an opportunity to study space exploration as a data-driven ecosystem rather than isolated historical events. Understanding how mission frequency, technological choices, international cooperation, and commercial involvement evolve over time is critical for shaping future space strategies. However, despite the growing volume of mission data, systematic analytical studies covering longterm global trends remain limited.
This research addresses this gap by applying data analytics, visualization, and predictive modelling techniques to a comprehensive dataset spanning from 2000 to 2025. By examining temporal trends, geographic participation, mission success rates, and collaborative networks, the study aims to uncover patterns that define the modern era of space exploration.
2. Problem Statement
Despite the rapid growth of space exploration activities, a systematic understanding of long-term global trends in mission strategies, technological evolution, and international collaboration remains limited. Existing studies often focus on individual missions, specific agencies, or short time periods, leaving gaps in the analysis of how space exploration has evolved as a coordinated global effort over multiple decades. Furthermore, the increasing participation of private organizations introduces new dynamics that are not yet fully understood in terms of mission success, technological innovation, and policy implications. There is a need for a comprehensive, data-driven framework that integrates mission records across countries and organizations to uncover hidden patterns, assess technological progress, and support informed decisionmaking for future space initiatives.
3. Related Work
Previous studies in space research have primarily focused on mission-specific achievements, policy evolution, or technological advancements. Logsdon [1] emphasized sustainability and innovation as central to future space programs, while Handberg and Peters [2] analyzed the growing influence of commercial actors on national space policies. Studies on CubeSat missions by Woellert et al. [3] highlighted how low-cost platforms democratized access to space for emerging nations.
Research on space debris mitigation and orbital sustainability by Pelton [4] addressed the increasing risks associated with higher launch frequencies. Reports from the United Nations Office for Outer Space Affairs [5] documented international cooperation trends but lacked predictive and analytical depth.
Unlike prior work, this study integrates mission-level data across multiple countries and organizations using data mining techniques. It combines descriptive analytics, clustering, regression, and visualization to provide a holistic view of global space activity over twenty-five years.
4. Dataset Description
The Global Space Exploration Dataset (2000–2025) consists of structured mission records collected from verified open sources. Each record represents a distinct space mission and includes attributes such as:
- Country
- Year
- Mission Name
- Mission Type • Launch Site
- Satellite Type
- Budget (in Billion $)
- Success Rate (%)
- Technology Used
- Environmental Impact
- Collaborating Countries
- Duration (in Days)
The dataset captures a wide spectrum of missions, including satellite deployments, crewed missions, planetary exploration, scientific experiments, and commercial launches. The time span allows for meaningful trend analysis, particularly in observing shifts from government-led initiatives to private and collaborative ventures.
5. Exploratory Data Analysis
Exploratory Data Analysis (EDA) was conducted to identify underlying patterns and relationships within the dataset.
A. Mission Frequency Trends
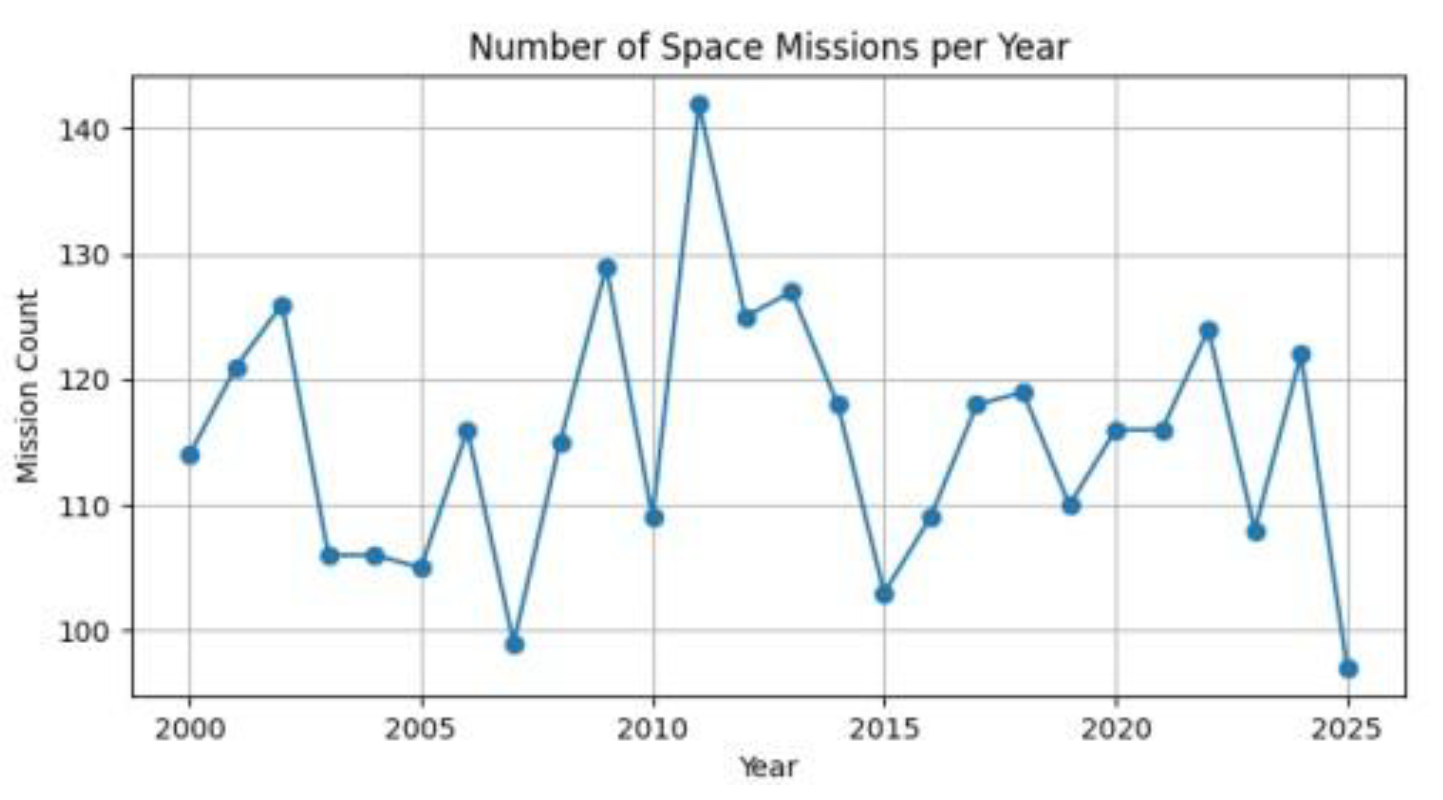
Time-series analysis was used to examine variations in the annual number of space missions. The mission count for each year was computed using frequency aggregation.
Formula: Mission Count
𝑛
𝑁𝑦 = ∑ 𝐼( Year𝑖 = 𝑦)
𝑖=1
where:
- Nyrepresents the total number of missions in year y
- I(⋅)is an indicator function
Analysis reveals fluctuations in annual mission activity, with notable growth after 2010. This increase aligns with the emergence of private space companies and the expansion of satellite constellations. Periods of reduced activity correspond to global economic slowdowns and geopolitical disruptions.
Figure 1.
Number of space missions per year.
B. Budget and Success Rate Relationship
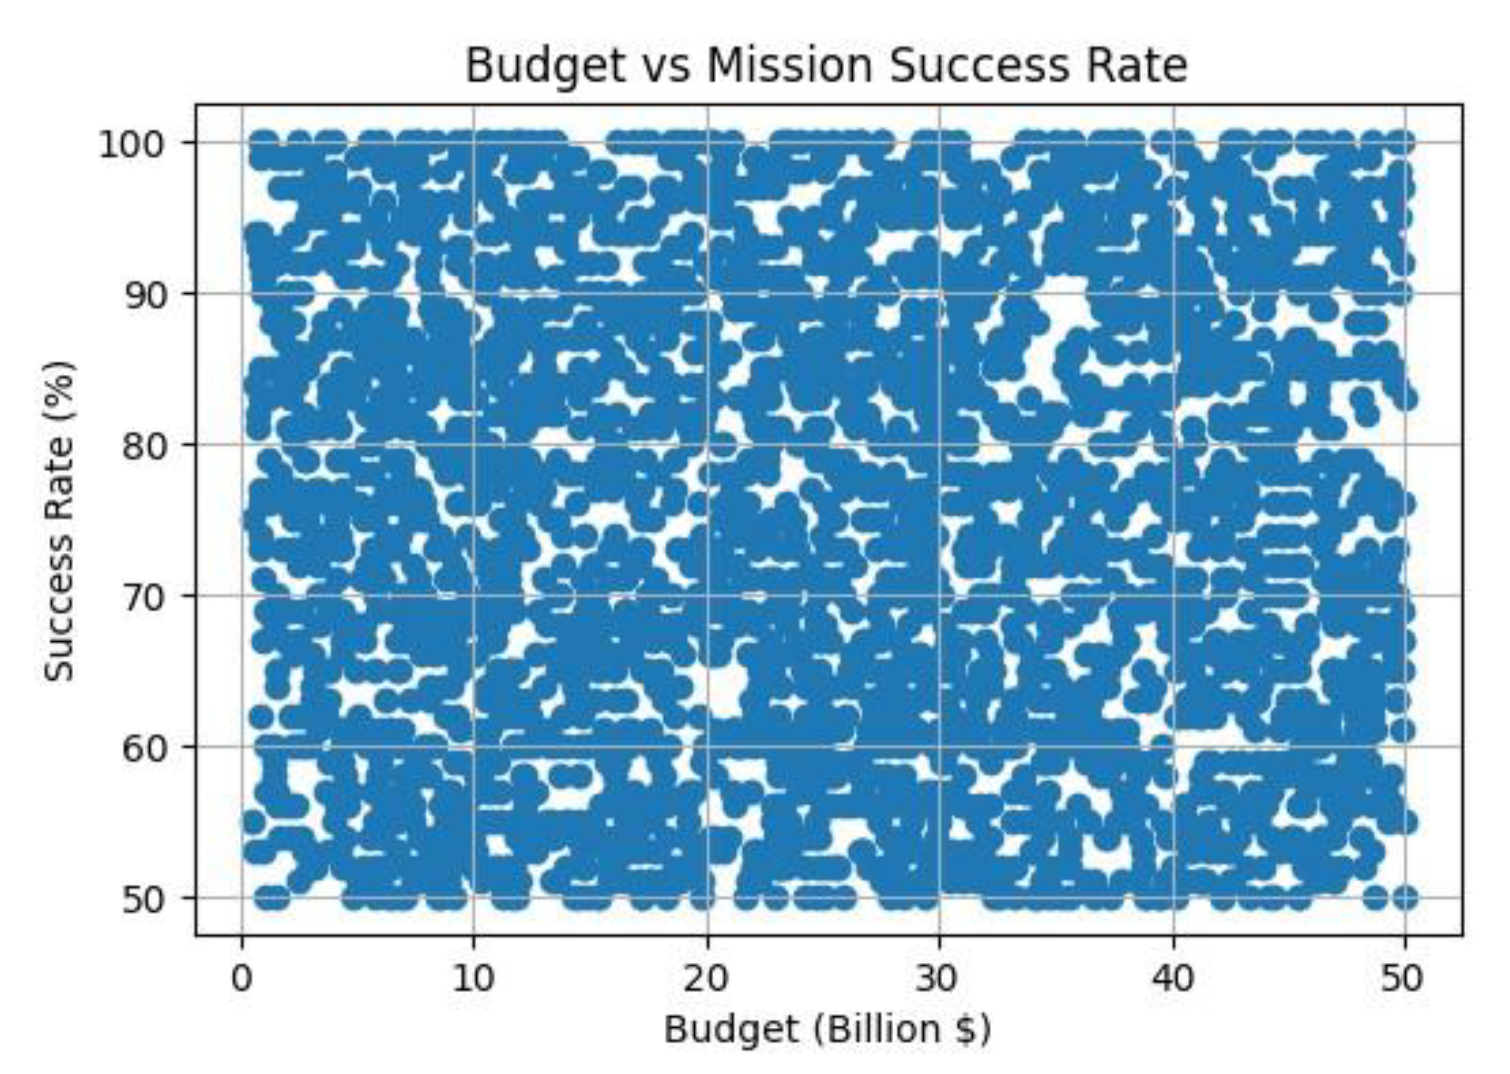
A scatter-based correlation analysis was performed to study the relationship between mission budget and success rate.
Formula: Pearson Correlation Coefficient
where:
- xidenotes mission budget
- yidenotes mission success rate
The analysis indicates that higher mission budgets do not necessarily guarantee higher success rates. Instead, mission planning efficiency, technological maturity, and specialization play a more critical role in determining outcomes.
Figure 2.
Budget versus mission success rate.
C. Mission Type Distribution
The distribution of mission types was analyzed to understand dominant space activities.
Formula: Percentage Distribution
where:
- Nt is the number of missions of type t
- N is the total number of missions Satellite missions dominate the dataset, reflecting the increasing demand for communication, navigation, and Earth observation. Crewed and planetary missions, though fewer, demonstrate higher technological complexity and strategic value.
6. Clustering and Pattern Discovery
Clustering techniques were applied to categorize countries based on mission count, average budget, and success rate.
Formula: Euclidean Distance (K-Means Clustering)
where:
- xiand yirepresent feature values of two countries
- kis the number of features
Three major clusters were identified:
- High-activity nations with frequent launches and advanced technologies.
- Emerging space nations with moderate budgets and rising success rates.
- Low-frequency participants focused on collaborative missions.
Figure 3.
Country clustering by space performance.
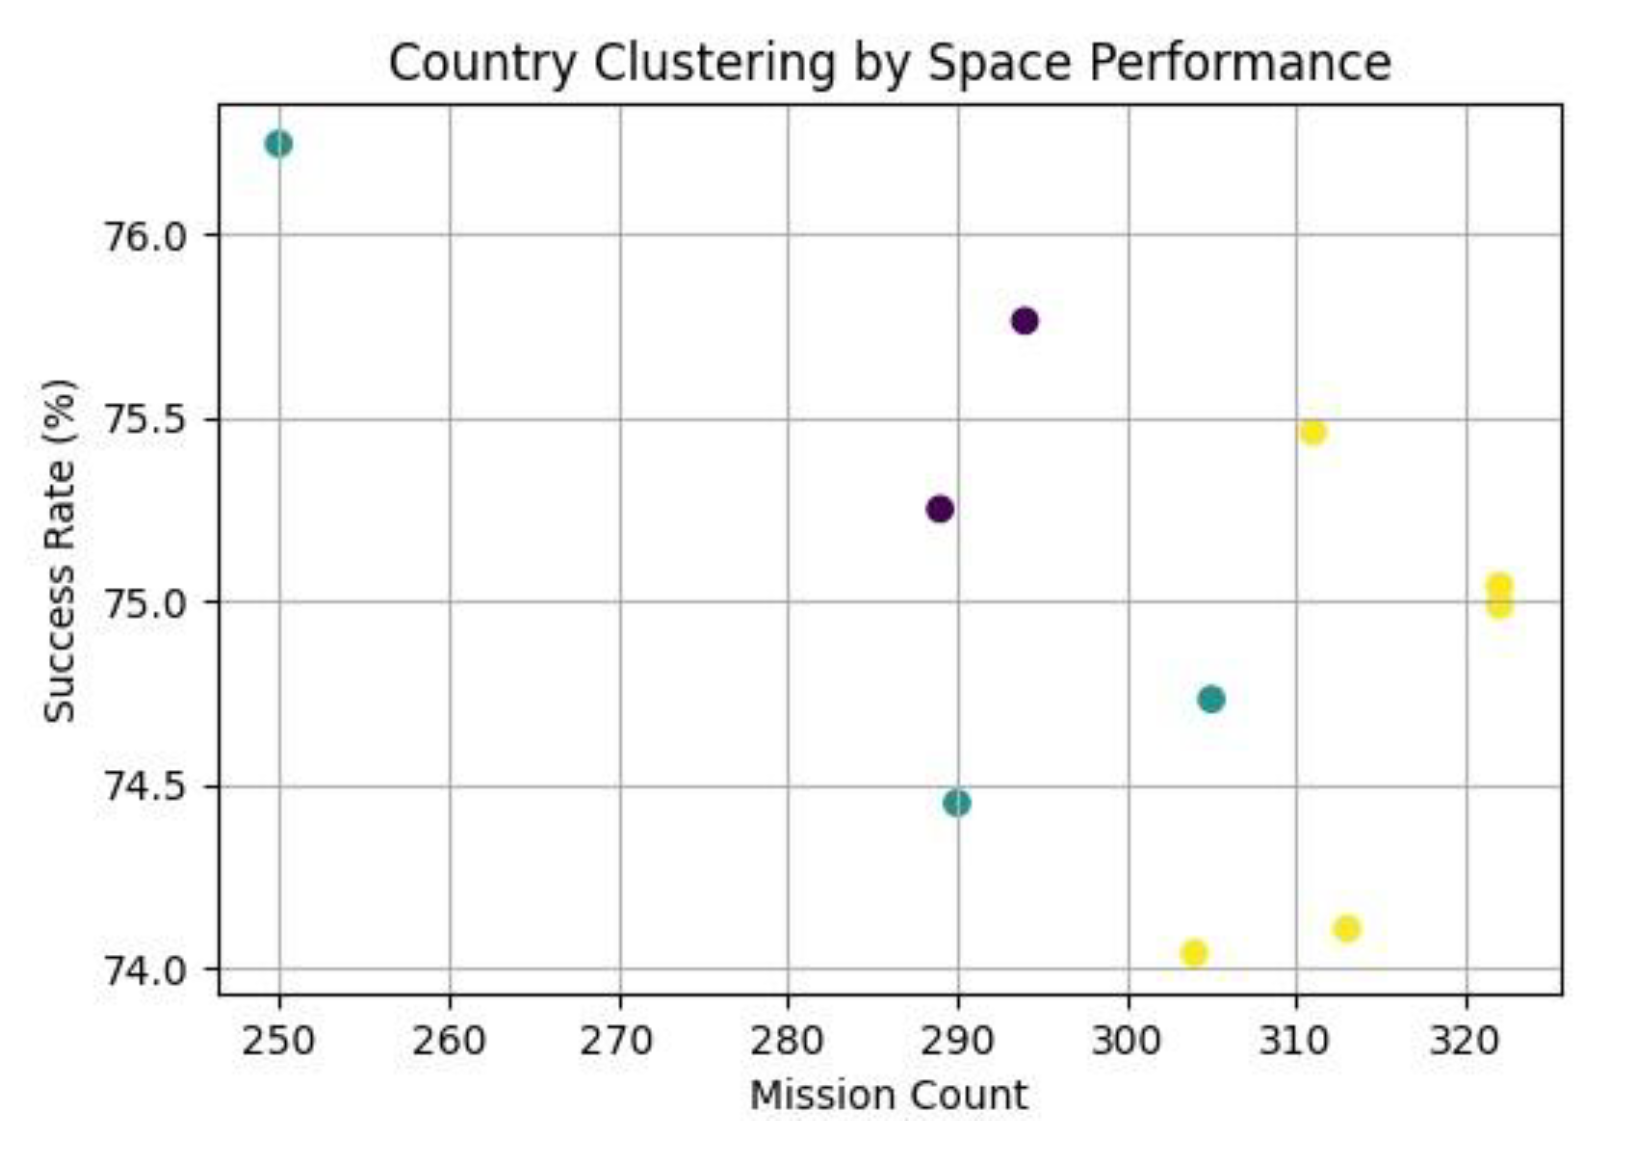
The results highlight that international collaboration enables emerging nations to participate in space exploration without excessive financial burden.
7. Predictive Modelling and Forecasting
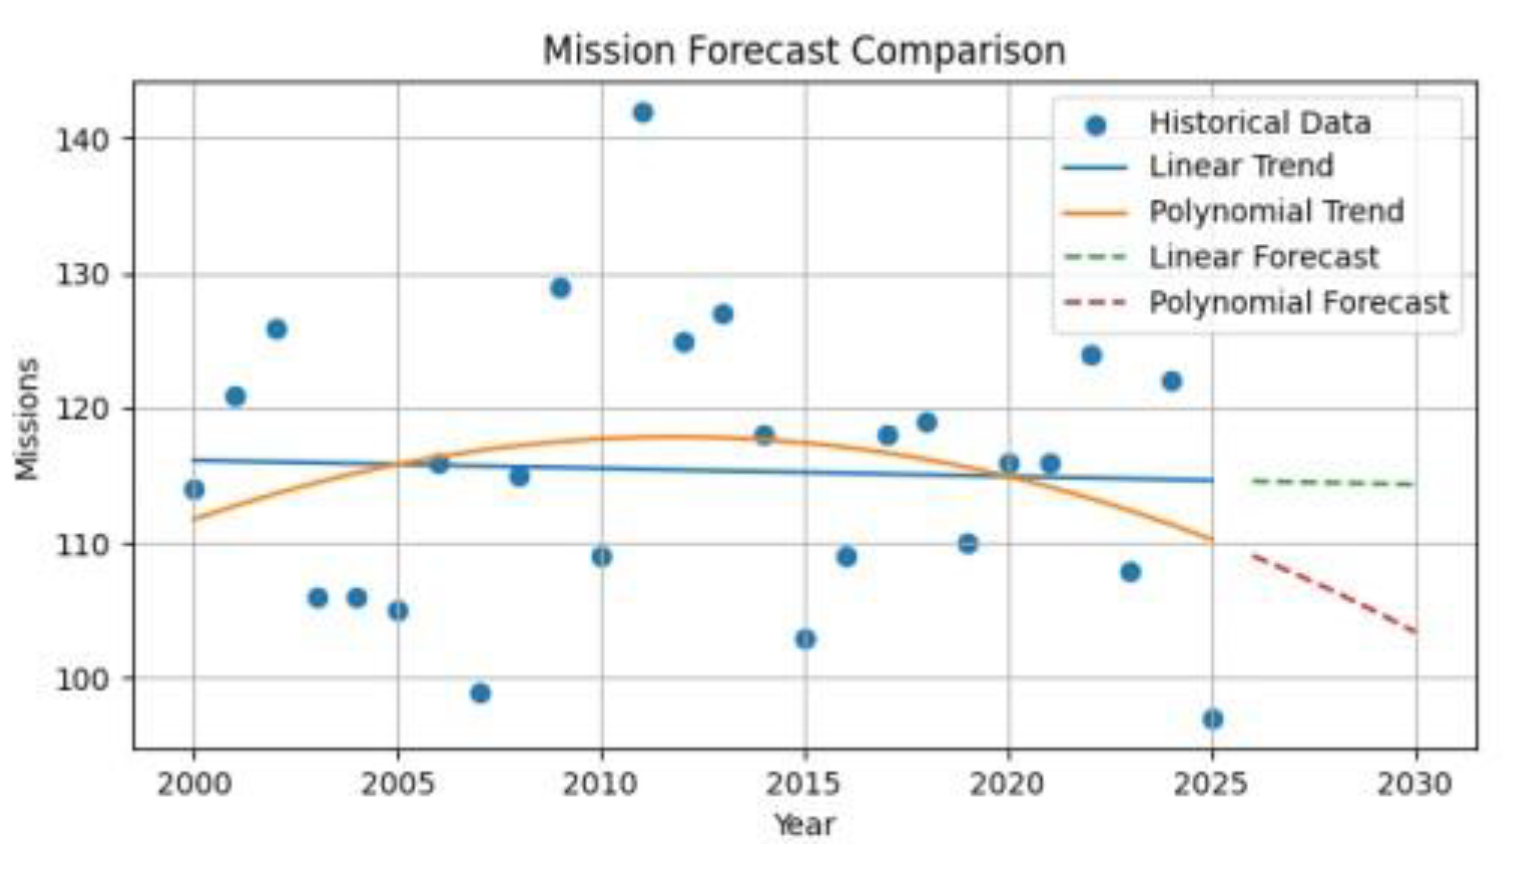
Linear regression models were developed to forecast mission frequency for the years 2026–2030. While the slope of the regression line indicates a gradual stabilization in mission counts, forecasts suggest sustained activity driven by commercial satellite launches and international partnerships. Polynomial regression was evaluated but showed limited improvement due to the relatively stable historical trend. Performance metrics such as RMSE and R² confirm that simple linear models sufficiently capture longterm mission behavior.
To forecast future mission trends (2026–2030), regression-based predictive models were implemented.
A. Linear Regression
Formula: Linear Regression Model
y = mx + c where:
- yis the predicted mission count
- xrepresents the year
- mis the slope
- cis the intercept
The slope indicates a gradual stabilization in mission frequency. Predictions suggest sustained activity driven by commercial satellite launches and multinational partnerships.
B. Polynomial Regression
𝑦 = 𝑎𝑥2 + 𝑏𝑥 + 𝑐
Polynomial regression was evaluated to capture non-linear trends; however, only marginal improvement was observed due to the relatively stable historical data.
C. Model Evaluation
Formula: Root Mean Square Error (RMSE)
Formula: Coefficient of Determination (R²)
Evaluation metrics confirm that linear regression sufficiently captures long-term mission trends.
Figure 4.
Mission forecast Comparison Rate.
8. Discussion
The findings highlight a shift toward commercialization, collaboration, and datadriven decision-making in space exploration. Private organizations increasingly complement government agencies, reducing costs while increasing launch frequency. International cooperation emerges as a key factor in managing mission complexity and risk.
The analysis demonstrates that space exploration is no longer dominated by a few nations but has evolved into a distributed global ecosystem. Data analytics provides the tools necessary to understand this complexity and anticipate future developments.
9. Limitations and Future Work
While comprehensive, the dataset may not capture classified missions or proprietary commercial data. Budget estimates are approximate and may vary across sources. Future work could incorporate real-time mission telemetry, satellite orbital data, and machine learning models for deeper predictive accuracy.
Expanding the dataset beyond 2025 and integrating environmental sustainability metrics would further strengthen future analyses.
10. Conclusions
This study presents a data-driven exploration of global space missions from 2000 to 2025, revealing patterns in mission frequency, collaboration, technology adoption, and commercial growth. Through analytics, visualization, and forecasting, the research demonstrates how historical mission data can guide future space strategies.
The integration of predictive models and interactive dashboards highlights the value of analytics in understanding complex global systems. As space exploration continues to evolve, data-centric approaches will remain essential for sustainable and collaborative progress.
References
- Logsdon, J.M. The Future of Space Exploration: Discovery, Innovation, and Sustainability; Springer, 2020. [Google Scholar]
- United Nations Office for Outer Space Affairs (UNOOSA). Global Spac Activities and International Cooperation Report; United Nations Publications, 2024. [Google Scholar]
- Handberg, R.; Peters, A. Commercial Space and the Transformation of Space Policy. Space Policy 2019, 47, 1–8. [Google Scholar]
- Han, J.; Kamber, M.; Pei, J. Data Mining: Concepts and Techniques, 3rd ed.; Morgan Kaufmann, 2012. [Google Scholar]
- Jain, A.K. Data Clustering: 50 Years Beyond K-Means. Pattern Recognition Letters 2010, 31, 651–666. [Google Scholar] [CrossRef]
- Montgomery, D.C.; Peck, E.A.; Vining, G.G. Introduction to Linear Regression Analysis; Wiley, 2012. [Google Scholar]
Disclaimer/Publisher’s Note: The statements, opinions and data contained in all publications are solely those of the individual author(s) and contributor(s) and not of MDPI and/or the editor(s). MDPI and/or the editor(s) disclaim responsibility for any injury to people or property resulting from any ideas, methods, instructions or products referred to in the content. |
© 2026 by the author. Licensee MDPI, Basel, Switzerland. This article is an open access article distributed under the terms and conditions of the Creative Commons Attribution (CC BY) license.
Copyright: This open access article is published under a Creative Commons CC BY 4.0 license, which permit the free download, distribution, and reuse, provided that the author and preprint are cited in any reuse.


