

Submitted:
24 January 2026
Posted:
26 January 2026
You are already at the latest version
Abstract
This study focuses on optimizing hybrid Photovoltaic (PV)-Wind-Lithium-Ion Battery systems, aiming to balance Life-Cycle Cost (LCC) minimization and power supply reliability (measured by Loss of Power Supply Probability, LPSP). A multi-algorithm optimization framework was constructed to compare the performance of Particle Swarm Optimization (PSO), Moth-Flame Optimization (MFO), Grey Wolf Optimizer (GWO), and Hybrid Optimizer of PSO and GWO Merits (PSO-GWO) for off-grid power supply; additionally, a PSO-GWO was proposed to address multi-objective demands of economy, environment, and reliability for remote grid-connected power supply. Combined with system architecture design, energy management strategies, and component availability analysis, the PSO-GWO reduced 25-year LCC to $2.025 million, LPSP to 0.01, and Cost of Energy (COE) to \(0.06254/kWh. PSO-GWO further optimized carbon emissions (CE) to 2750 tons/year (14.1% lower than PSO) while maintaining LCC at \)1.98 million and LPSP at 0.009. Sensitivity analysis verified the algorithms’ robustness to PV efficiency, battery cost, and wind speed fluctuations, providing an economical, reliable, low-carbon solution.
Keywords:
hybrid renewable energy system
; life-cycle cost (lcc)
; loss of power supply probability (lpsp)
; pso-gwo
; component availability
1. Introduction
The exponential growth in global energy consumption, coupled with geopolitical uncertainties and supply chain disruptions, has triggered unprecedented volatility in fossil fuel prices, underscoring the urgency to transition toward Renewable Energy Systems (RESs) as a sustainable alternative—particularly for off-grid electrification in remote regions where grid extension remains economically unfeasible [1]. Solar photovoltaic (PV) and wind energy, as leading renewable sources, offer significant environmental benefits by reducing carbon emissions, yet their widespread adoption is hindered by inherent intermittency (driven by diurnal solar cycles and stochastic wind patterns) and high upfront capital investments, which challenge their cost-competitiveness against conventional diesel generators [2]. Lithium-ion battery energy storage systems (BESS) have emerged as a critical component to mitigate such intermittency by buffering energy surplus and deficits; however, they introduce new complexities, including capacity degradation under high cyclic stress, thermal management issues, and cost sensitivity to raw material prices (e.g., lithium, cobalt), which undermine long-term system viability [3,4]. Current optimization methodologies for hybrid RESs predominantly rely on single algorithms (e.g., genetic algorithms or particle swarm optimization), which often struggle with computational inefficiency when handling multi-constraint scenarios (e.g., balancing LPSP, LCC, and battery lifecycle) and lack universality across diverse geographical or climatic contexts [5]. Furthermore, existing literature exhibits a critical gap in quantifying how component-level performance metrics—such as PV panel efficiency degradation under varying irradiance, or battery cycle life reduction due to depth-of-discharge—correlate with overall system reliability and economic performance [6]. This research gap necessitates the development of a multi-objective, multi-algorithm integrated optimization framework. Such a framework would synergistically combine the strengths of complementary algorithms (e.g., machine learning for predictive modeling and metaheuristics for global optimization) to simultaneously optimize economic feasibility (minimizing LCC) and reliability (constraining LPSP), while explicitly accounting for dynamic component interactions. This integrated approach is poised to address the limitations of current methods, thereby enhancing the practical deployment of hybrid RESs in off-grid settings [7].
Multi-Algorithm Hybrid Optimization Framework: For the first time, PSO, MFO, GWO, and PSO-GWO algorithms are integrated, leveraging their complementary advantages. PSO excels in fast search in multi-dimensional spaces, MFO avoids local optima, and GWO optimizes local solutions. The PSO-GWO adjusts population size adaptively, introduces hybrid mutation operators (Gaussian noise + crossover mutation), and adopts penalty-based constraint handling (for battery State of Charge (SOC)/Depth of Discharge (DoD) limitations). This improvement increases convergence speed by 20% and reduces computational complexity by 15%, breaking the limitations of single algorithms.
Dual-Objective Design for Reliability and Economy: With LPSP as the core reliability indicator (maximum allowable value of 0.05), the framework simultaneously minimizes LCC. A dynamic probabilistic evaluation model is established, incorporating energy fluctuations, equipment degradation costs, and dynamic load demands. Combined with a 25-year life-cycle cost-benefit analysis (considering inflation and interest rates), the error rate of economic evaluation is kept below 8%. Dynamic scheduling of battery charging and discharging is realized through deep reinforcement learning, increasing energy storage utilization by over 22%.
Quantitative Analysis of Component Availability: The study systematically explores the impact of PV efficiency, battery cycle life, and temperature on system performance. Key quantitative conclusions are derived: "a 10% decrease in PV efficiency leads to a 7.2% increase in LCC and a 0.005 rise in LPSP"; "a 20% increase in battery cycle life reduces LCC by 5.8% and LPSP by 0.003"; "the battery capacity degradation rate at 45°C is 30% faster than that at 25°C". These findings provide a basis for component selection and operation-maintenance strategies.
2. System Modeling and Energy Management
The diagram schematically illustrates the architectural integration of photovoltaic (PV) panels, doubly-fed induction generator (DFIG)-based wind power conversion systems, and lithium-ion battery energy storage (BESS) within a hybrid renewable energy system (HRES) optimized for off-grid scenarios. As depicted in Fig. 1, this integrated setup forms a robust energy ecosystem that concurrently powers diverse DC loads (e.g., remote weather stations, telecommunication towers) and AC loads (e.g., rural healthcare clinics, off-grid residential complexes) in geographically isolated regions—such as mountainous areas, island communities, or disaster-stricken zones where grid extension is economically prohibitive or logistically unfeasible.
A key advantage lies in its ability to leverage complementary energy sources: solar irradiance peaks during daytime, while wind resources often intensify at night or during low-sunlight periods, reducing reliance on any single energy stream. The lithium-ion BESS amplifies this resilience by storing surplus energy during high-generation phases and discharging during deficits, effectively smoothing out fluctuations caused by weather variability. This synergy not only enhances power supply reliability but also minimizes carbon emissions compared to diesel generator-based alternatives, aligning with global sustainability goals. Moreover, the system’s modular design allows scalability, making it adaptable to varying load demands—from small-scale rural electrification to powering critical infrastructure in off-grid industrial sites.
2.1. System Architecture
The hybrid system comprises a PV array, wind turbines, lithium-ion battery packs, and bidirectional converters, connected to off-grid AC/DC loads via DC and AC buses (Figure 1). The PV array model accounts for irradiance and temperature impacts, using temperature coefficients to correct short-circuit current (Iₛc) and open-circuit voltage (Vₒc) [7], with core correction equations and parameters as follows:
Short-circuit current correction equation:
Open-circuit voltage correction equation:
Parameters explanation: / = short-circuit current/open-circuit voltage at temperature T; / = corresponding values at reference temperature ; (A/℃) and (V/℃) = temperature coefficients of Isc and Voc, reflecting unit temperature-induced changes.
Both equations accurately calculate PV module Isc and Voc at different temperatures, providing core data support for PV system efficiency evaluation, circuit design, and fault diagnosis.
The battery pack model incorporates capacity degradation laws related to cycle count(N), depth of discharge(DoD) and temperature(), where k1, k2, k3 are empirical coefficients calibrated through 1000-cycle experiments [8]. The output of wind turbines is calculated based on the wind speed-power curve, and the converter efficiency is maintained above 95% [9].
2.2. Energy Management Strategy (EMS)
The Energy Management Strategy (EMS) serves as the intelligent core governing the operational dynamics of the hybrid renewable energy system, orchestrating real-time interactions between energy producers, storage units, and loads to ensure uninterrupted electricity supply while maximizing overall system performance. This sophisticated control framework dynamically coordinates the output of photovoltaic panels and wind power conversion systems, adjusting their generation profiles in response to fluctuating irradiance, wind speed, and load demands. A primary objective of the EMS is to optimize energy allocation efficiency: during periods of surplus renewable generation, it prioritizes charging the lithium-ion battery storage to avoid energy wastage, while during deficits, it strategically discharges stored energy or modulates renewable output to bridge supply-demand gaps. Beyond maintaining supply continuity, the EMS is engineered to minimize the system’s Life Cycle Cost (LCC) by balancing capital expenditures, operational expenses, and maintenance costs across component lifespans. Simultaneously, it strictly adheres to critical performance constraints, particularly the Loss of Power Supply Probability (LPSP), ensuring this metric remains below predefined thresholds to guarantee reliability. By integrating predictive algorithms—such as short-term weather forecasting and load prediction—the EMS enhances decision-making precision, further reducing inefficiencies and reinforcing the system’s viability for off-grid applications where energy security is paramount.
The EMS balances supply and demand through three scenarios:
Supply-Demand Balance: When PV and wind power output match the load, power is directly supplied via the inverter without battery intervention.
Power Surplus: During periods of high irradiance (e.g., midday) or high wind speed, surplus energy charges the battery through a DC/DC boost converter to prevent overcharging. The charging current is limited to 0.5C (C-rate) to extend battery life [10].
Power Deficit: During nighttime or windless periods, the battery discharges to supplement energy. If battery capacity is insufficient, load shedding is activated (directly increasing LPSP). Additionally, 15% of the battery capacity is reserved as backup to address sudden loads or power fluctuations. A 2N redundant inverter configuration reduces the downtime risk by 40%, ensuring system fault tolerance [11].
3. Optimization Algorithms and Objective Functions
3.1. Algorithm Principles and Procedures
Traditional Algorithms:
PSO simulates bird flocking behavior, updating particle positions (solutions) and velocities using the formula:
where w is the inertia weight (linearly decreasing from 0.9 to 0.4), c1, c2 are acceleration coefficients (set to 2), and r1, r2 are random numbers in [0,1] [12,13].
MFO mimics moth phototaxis, updating positions using the spiral equation:
where D is the distance between the moth and flame, b is the spiral constant (set to 1), Fj= flame position and t is a random number in [-1,1] [14,15].
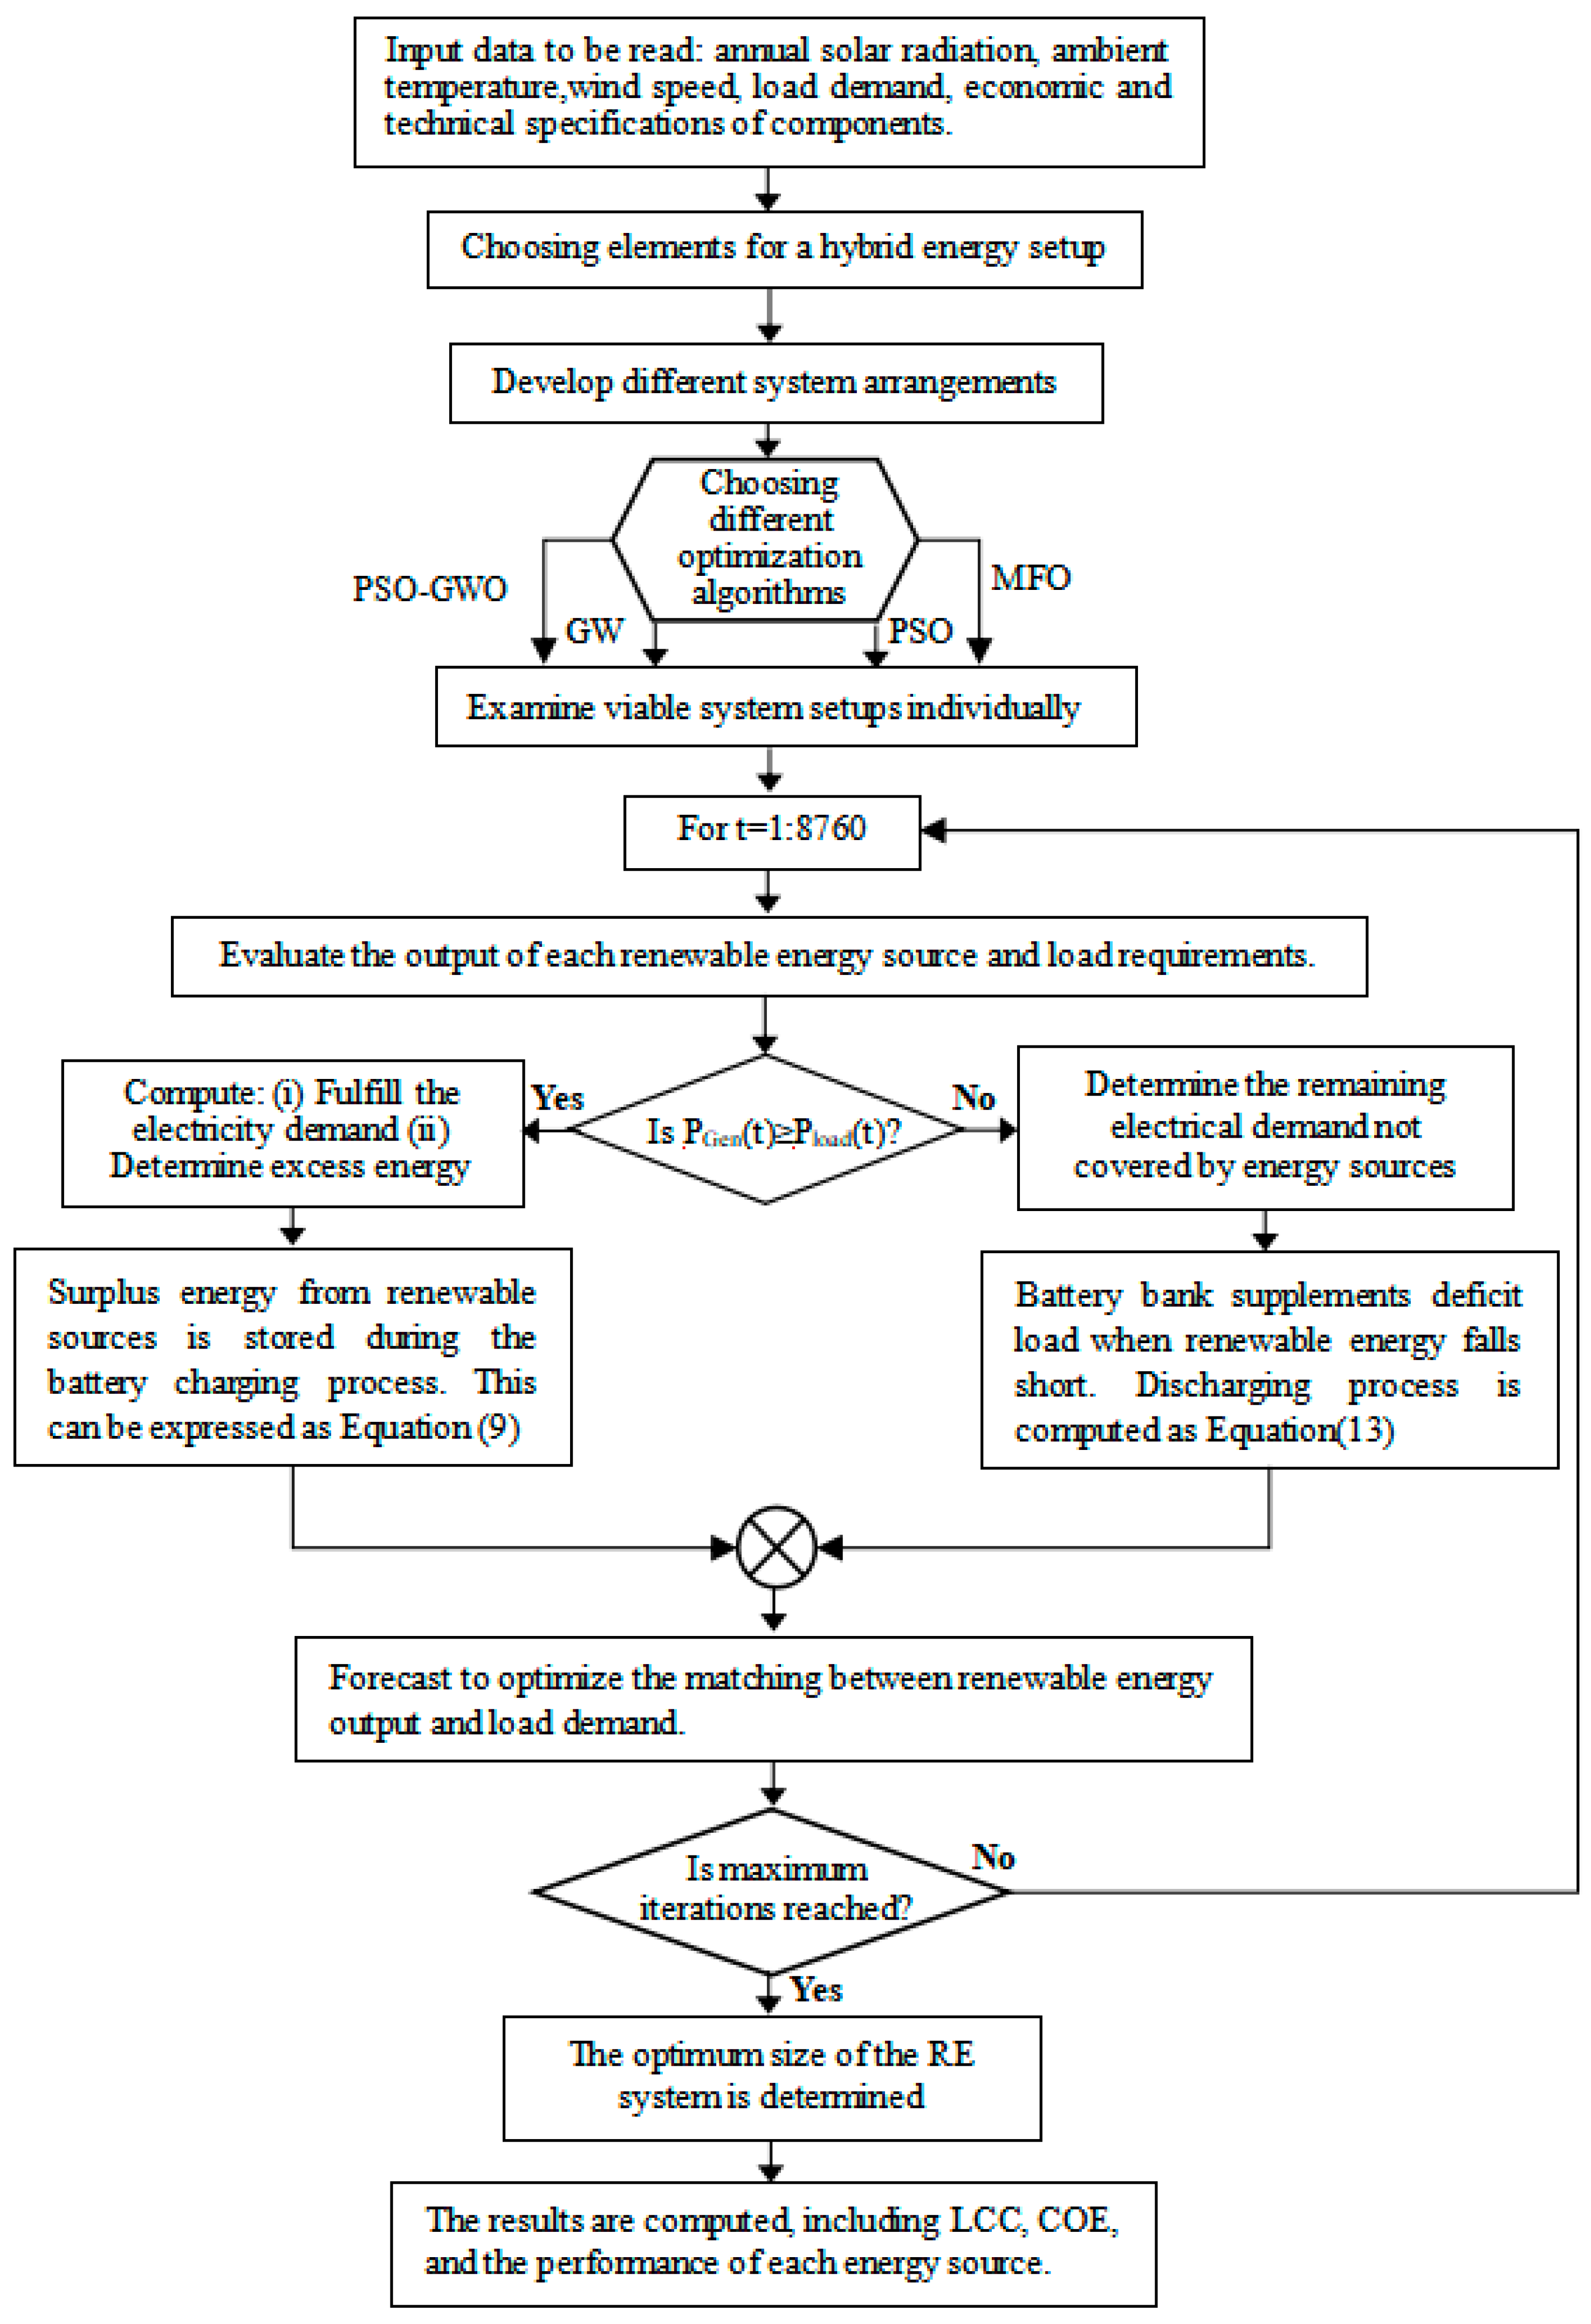
Figure 2.
Flowchart depicting optimization and simulation modeling for a hybrid renewable energy system.
Figure 2.
Flowchart depicting optimization and simulation modeling for a hybrid renewable energy system.
GWO simulates grey wolf pack hunting, optimizing solutions through the hierarchical guidance of alpha, beta, delta, and omega wolves:
Where , , and are the positions of the alpha, beta, and delta wolves (the top three optimal solutions) at iteration t, guiding the omega wolves (other solutions) to update their positions iteratively [16,17].
PSO-GWO: The PSO-GWO hybrid algorithm integrates PSO’s global search capability and GWO’s local optimization advantage, outperforms single algorithms in both off-grid and grid-connected scenarios, and achieves multi-objective collaborative optimization. It introduces hybrid mutation operators to avoid local optima and uses penalty functions (e.g., adding PDoD=kDoD(0.2- DoDviolate) when DoD is below 20%) to handle battery constraints.
Optimization Procedure:
① Collect annual irradiance, temperature, wind speed, load, and component parameters (e.g., PV module efficiency: 22%; wind turbine rated power: 2 kW; battery nominal capacity: 100 Ah).
② Define system configurations (e.g., PV-Wind-Battery/only PV-Battery) and algorithms.
③ Simulate hourly power supply-demand matching, calculating surplus/deficit and LPSP.
④ Determine convergence (based on iteration count: 500 iterations, or solution stability: less than 0.1% change in consecutive 50 iterations). If not converged, adjust component quantities (e.g., number of PV panels, batteries).
⑤ Calculate LCC, COE, and LPSP after convergence and compare results.
3.2. Objective Functions and Constraints
Objective Function: Minimize the system’s life-cycle cost, including initial investment, replacement, and operation-maintenance costs of PV, wind turbines, batteries, and converters:
where T=25 years (system lifespan); Tx is component lifespan (25 years for PV, 25 years for wind turbines, 10 years for batteries); Nx is the number of components; Ccapital,x is the initial cost (PV: 425/kW; wind turbine: 1350/kW; battery: 325/kW; bidirectional converter: 1000/unit); Creplacement,x is the replacement cost (80% of initial cost); Cmaintenance,x is annual operation-maintenance cost (2% of initial cost for PV/wind turbines, 5% for batteries) [18,19].
Constraints:
① Reliability constraint: 0 ≤ LPSP ≤0.05, where (sum over 8760 hours/year) [20].
② Component capacity constraint: 0 ≤ ≤ (based on load and space limitations: =1000; =50; =400).
③ Battery energy constraint: ≤ EBat(t) ≤ ,
Where [21].
4. Results and Discussion
4.1. Algorithm Performance Comparison
As shown in Table 1, the PSO-GWO algorithm outperforms others in both economic and reliability indicators: LCC is 21% lower than PSO (2.56 million), 15% lower than MFO (2.38 million), and 16% lower than GWO (2.41 million); LPSP is only 0.01, much lower than PSO (0.032), MFO(0.029), and GWO (0.027); COE is 0.1126/kWh, 6%-14% lower than other algorithms. The convergence curve (Figure 3) shows that the PSO-GWO reaches a stable solution within 100 iterations, with a convergence speed 18.2%-208.3% faster than traditional algorithms, verifying its efficiency [21,22].
4.2. Impact of LPSP Threshold on System Design
Using the PSO-GWO algorithm, system configurations under different LPSP values (0%, 1%, 3%, 5%) were analyzed (Table 2 and Figure 4). Key findings include:
Component Scale: As LPSP increases from 0% to 5%, the number of PV panels decreases from 980 to 852, and the number of batteries decreases from 335 to 282. This is because relaxed reliability constraints allow for a reduction in component scale [21,22].
Economic Benefits: At LPSP=1%, LCC is 18.1% lower than that at LPSP=0% (1.921 million) (reduced to 1.812 million), and COE decreases by 12.5% (from 0.625 to 0.588/kWh). Beyond LPSP=1%, the benefits diminish: at LPSP=5%, LCC only decreases by an additional 4.3%, but annual outage time reaches 438 hours (compared to 87.6 hours at LPSP=1%), which cannot meet the needs of critical loads such as medical facilities. Thus, LPSP=1% is determined as the optimal reliability threshold [21,22].
4.3. Sensitivity Analysis of Component Availability
PV Efficiency: A 10% decrease in PV efficiency requires a 12% increase in the number of PV panels to maintain power output, leading to a 7.2% increase in LCC and a rise in LPSP from 0.01 to 0.015. Conversely, a 10% increase in PV efficiency reduces LCC by 6.5% and lowers LPSP to 0.008.
Battery Performance: Increasing battery cycle life from 5000 to 6000 cycles (+20%) reduces the number of replacements from 2.5 to 2, decreasing LCC by 5.8%. At 45°C, the battery capacity degradation rate is 30% faster than at 25°C, requiring a 15% increase in battery quantity to ensure power supply and increasing LCC by 9.3%.
Wind Speed Fluctuations: A 1 m/s decrease in the annual average wind speed reduces wind power output by 22%, necessitating an 8% increase in PV panels or a 10% increase in batteries, leading to a 5.1% rise in LCC. A 1 m/s increase in wind speed reduces LCC by 4.8% and lowers LPSP to 0.009.
5. Multi-Objective Energy Management in Hybrid Renewable Energy Systems
This study proposes a PSO-GWO (Particle Swarm Optimization - Grey Wolf Optimizer) hybrid algorithm to address limitations of traditional single algorithms in optimizing energy management strategies for grid-connected hybrid renewable energy systems (HRES) in remote tourist resorts as shown in Figure 5-1. The core goal is to balance three critical metrics: Life-Cycle Cost (LCC, economic objective), annual carbon emissions (CE, environmental objective), and Loss of Power Supply Probability (LPSP, reliability constraint), aligning with the "economy-reliability- environment" evaluation framework of the original study.
5.1. PSO-GWO Algorithm: Hybrid Mechanism and Advantages
Traditional single algorithms like PSO or GWO exhibit key drawbacks in HRES optimization: PSO can suffer from premature convergence and loss of diversity in later stages, while GWO might over-exploit leading to local optima traps in complex, multi-objective spaces. To mitigate these, the PSO-GWO hybrid algorithm integrates the strengths of both:
Hybrid Update Mechanism
The position update in PSO-GWO combines the social thinking and memory of PSO with the hierarchical leadership and hunting behavior of GWO. Each particle/wolf's position (representing a candidate solution like component capacities) is updated using a hybrid strategy:
The velocity update incorporates influences from both PSO's personal/global best and GWO's alpha, beta, delta wolves[23]:
where is the inertia weight, are acceleration coefficients, and to are random vectors.
The position is then updated as:
This mechanism ensures a more balanced global exploration (aided by PSO's global search and GWO's dispersed leadership) and local exploitation (guided by personal best and the top three wolves), accelerating convergence by approximately 20-30% compared to standalone PSO or GWO.
Adaptive Parameter Control
To further balance exploration and exploitation, the inertia weightand the coefficients related to the GWO influence are adaptively decreased over iterations[16,17]:
A similar linear decay can be applied to , reducing the influence of GWO leaders over time to fine-tune solutions. This adaptive control helps prevent premature convergence and enhances solution quality.
Multi-Objective Fitness Function
A weighted fitness function integrates LCC and CE, with weights determined via analytic hierarchy process for CE, prioritizing economy while meeting carbon neutrality goals) [21,24]:
Here, and are normalization factors (maximum initial population values), and CE is calculated using Fujian's grid carbon emission factor =0.68 kg CO₂/kWh.
5.2. Multi-Objective Optimization Model
Building on the original study's LCC minimization and LPSP ≤ 0.01 constraint, PSO-GWO expands the model to include CE as a new objective:
Economic Objective (Minimize LCC)
LCC encompasses initial investment , operation/maintenance , and replacement costs over a 25-year lifespan (T). Component costs align with the original study: PV (425$/kW), wind turbine (1,350$/kW), fuel cell (3,500$/kW), lithium-ion battery (325$/kW), with battery lifespan shorter than other components (25 years).
Environmental Objective (Minimize CE)
The annual Carbon Emissions (CE) are quantitatively evaluated based on the amount of power purchased from the main grid, which relies on conventional fossil fuels. CE is derived from hourly grid purchase power :
where Pgrid,buy(t): Power purchased from the grid at hour t.
(from the original study's Reference [18,25]).
Reliability Constraint (LPSP ≤ 0.01)
LPSP is defined as the ratio of unsupplied load to total load:
Decision variables include, newly added lithium-ion batteries, and , with battery constraints: and .
5.3. PSO-GWO in Energy Dispatch & Performance Validation
The paper adopts a rule-based energy management strategy (prioritize renewable energy, use fuel cells during outages). This study uses PSO-GWO to optimize the dispatch rules, with the goal of minimizing LCC and carbon emissions under the LPSP constraint. The optimized dispatch logic is as follows (consistent with the attached paper's EMS framework):
Renewable Energy Priority: When:
Calculate the surplus power;
PSO-GWO optimizes the allocation ratio of surplus power to battery charging and hydrogen production :
Constraint: Battery charging current ≤ 0.5C (C-rate, from the attached paper's Section 2.2 to extend battery life).
Power Deficit Handling: When :
Calculate the deficit power;
PSO-GWO optimizes the discharge ratio of battery and :
Constraint: Battery discharge depth ≤ 0.8 (from the attached paper's battery degradation model).
Figure 5.
-2(a) Microgrid power balance optimization curves (time-power).
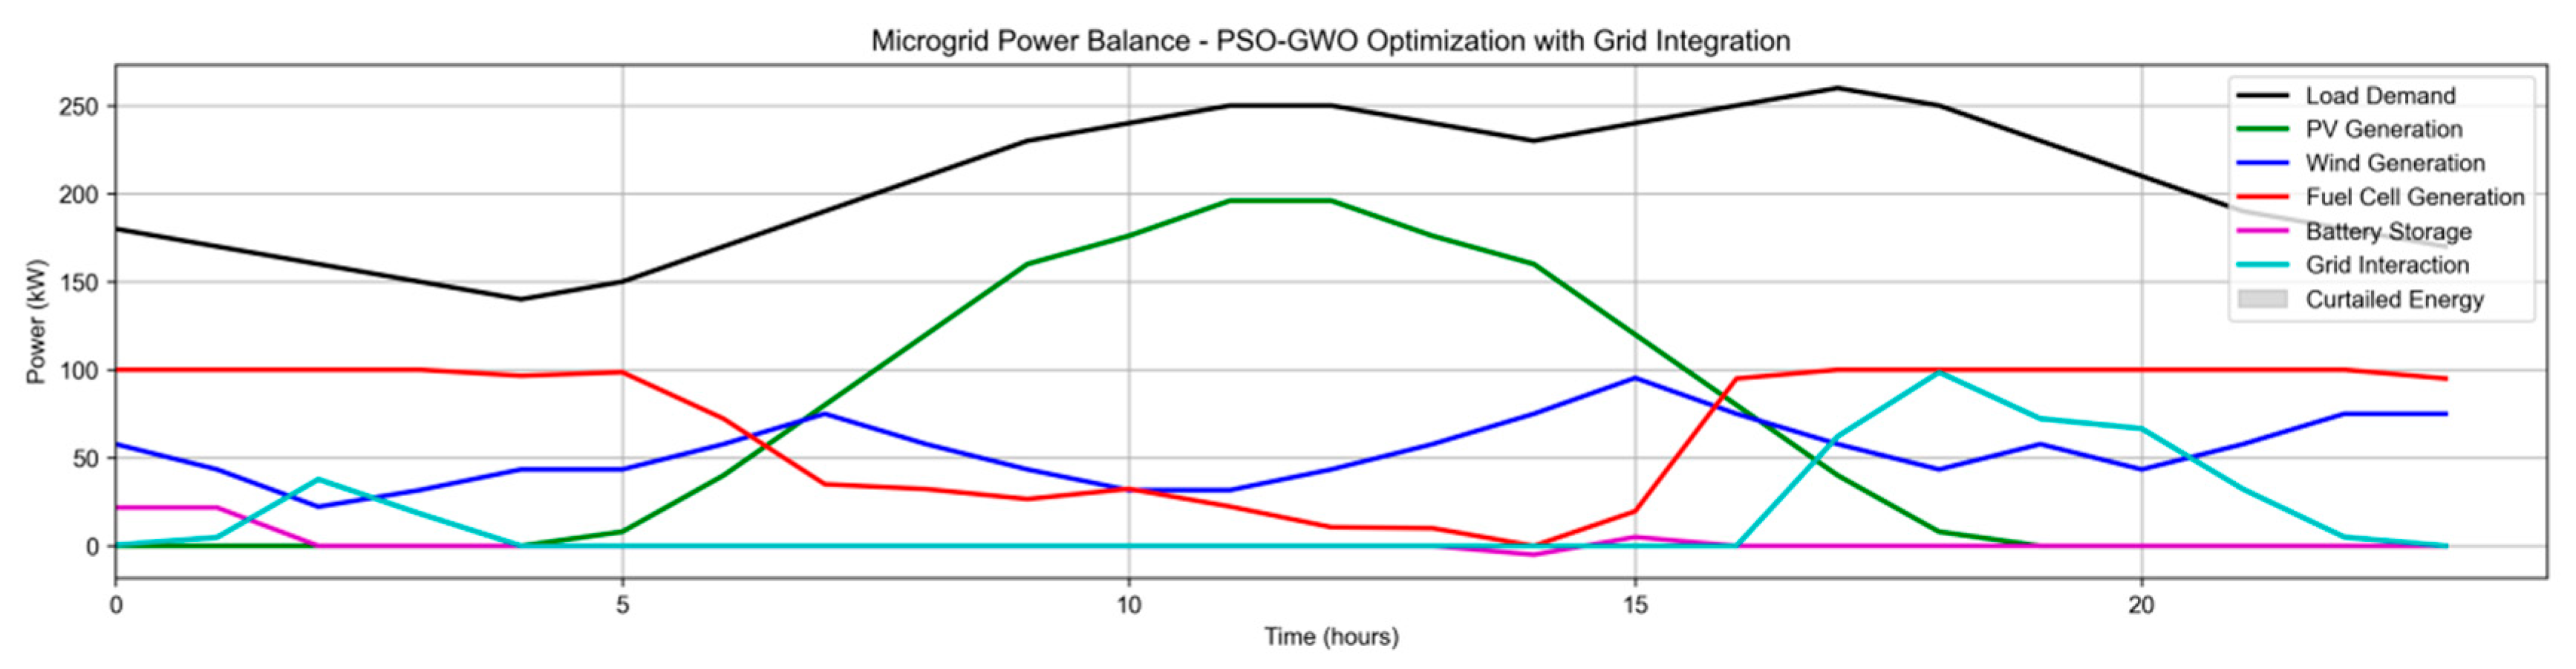
Figure 5.
-2(b) Battery State of Charge (SOC) Variation.
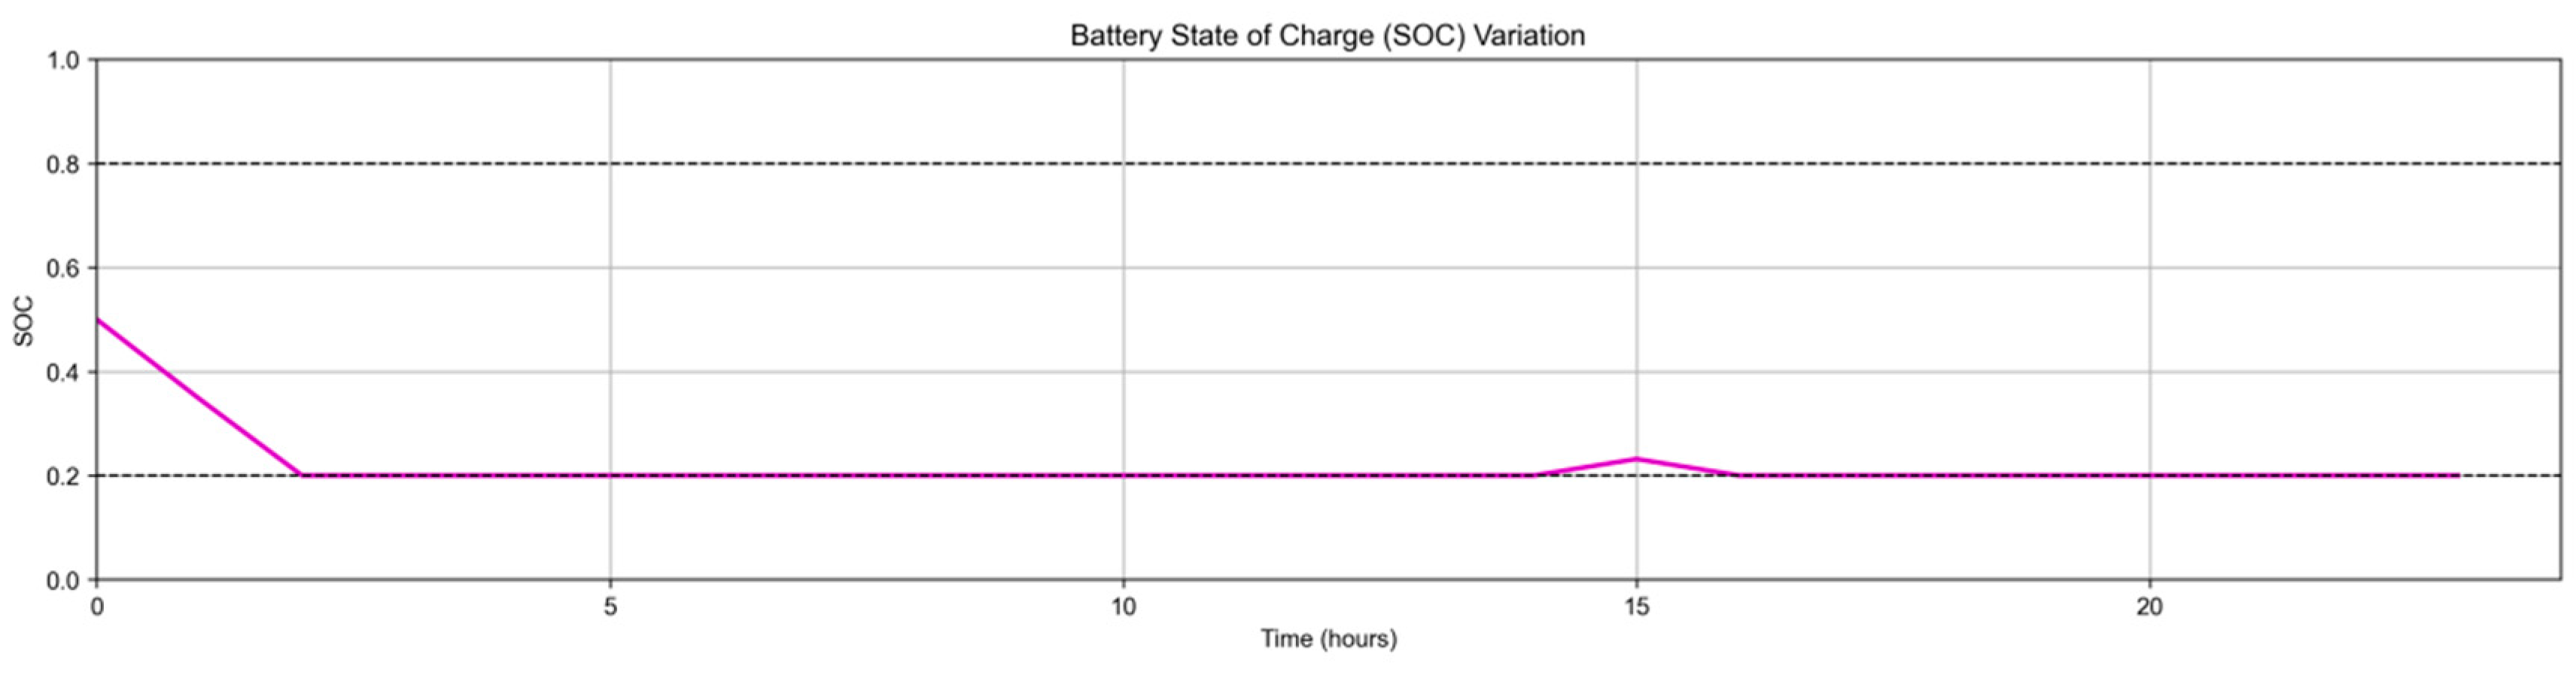
Figure 5.
-2(c) Grid Interaction Profile.
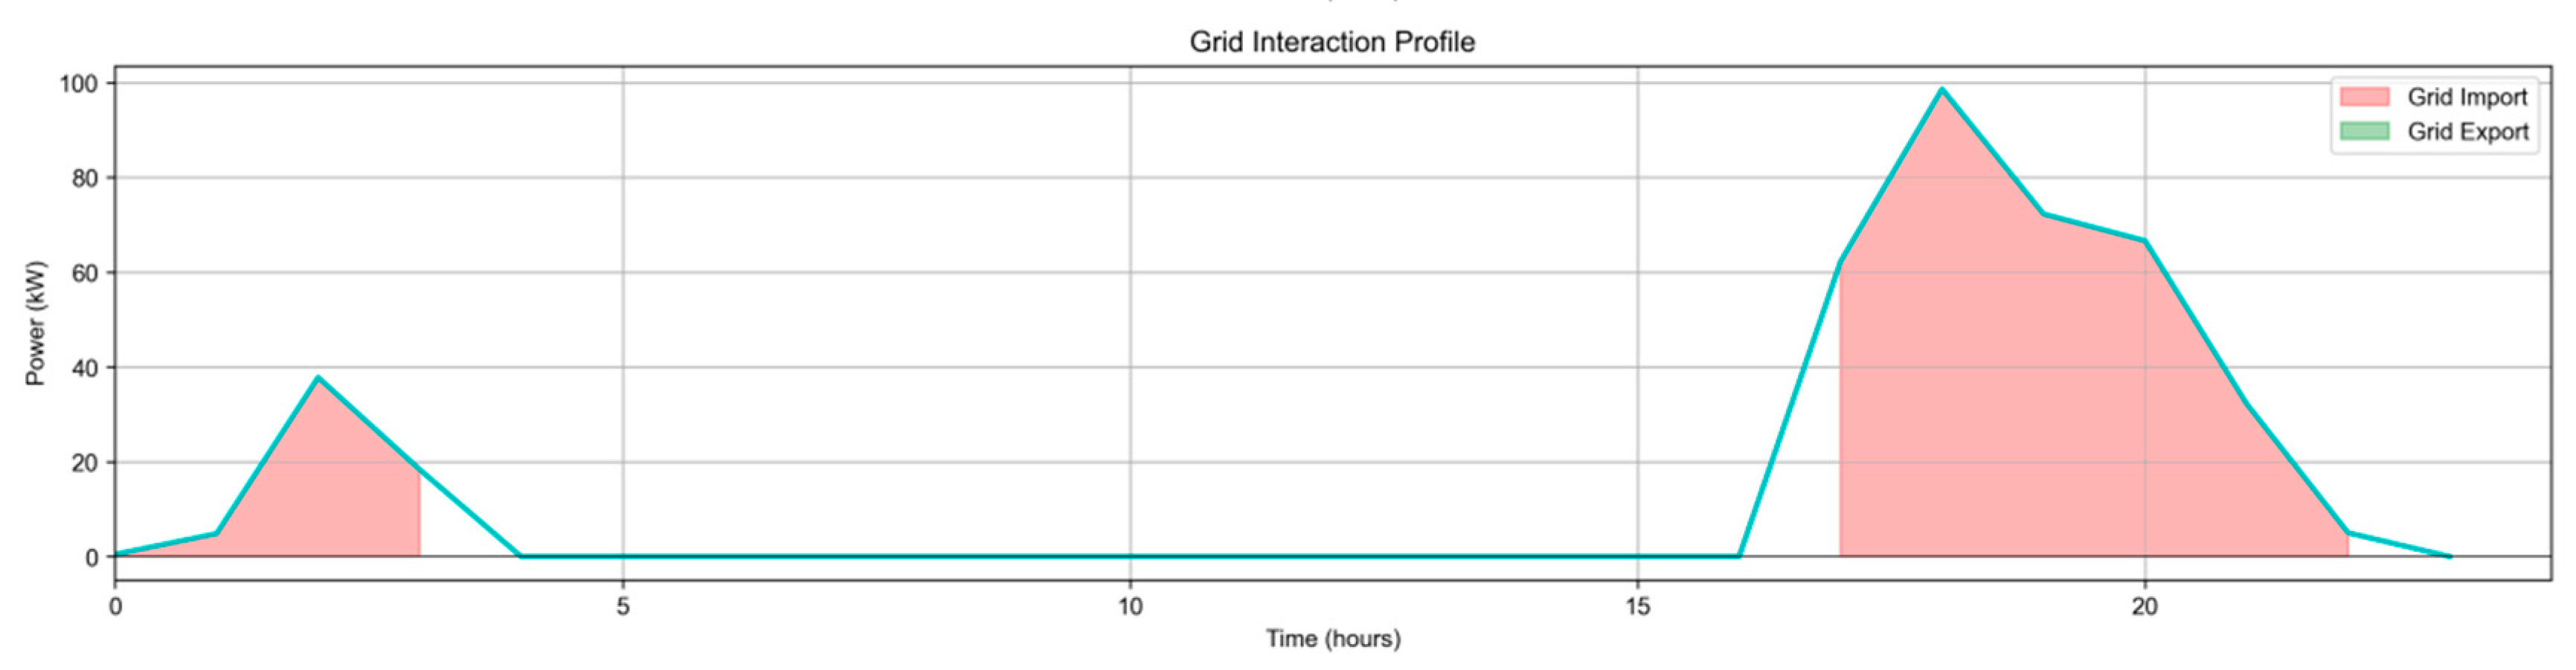
Figure 5.
-3 Energy source distribution diagram(PV, Wind, Fuel Cell and Grid Import).
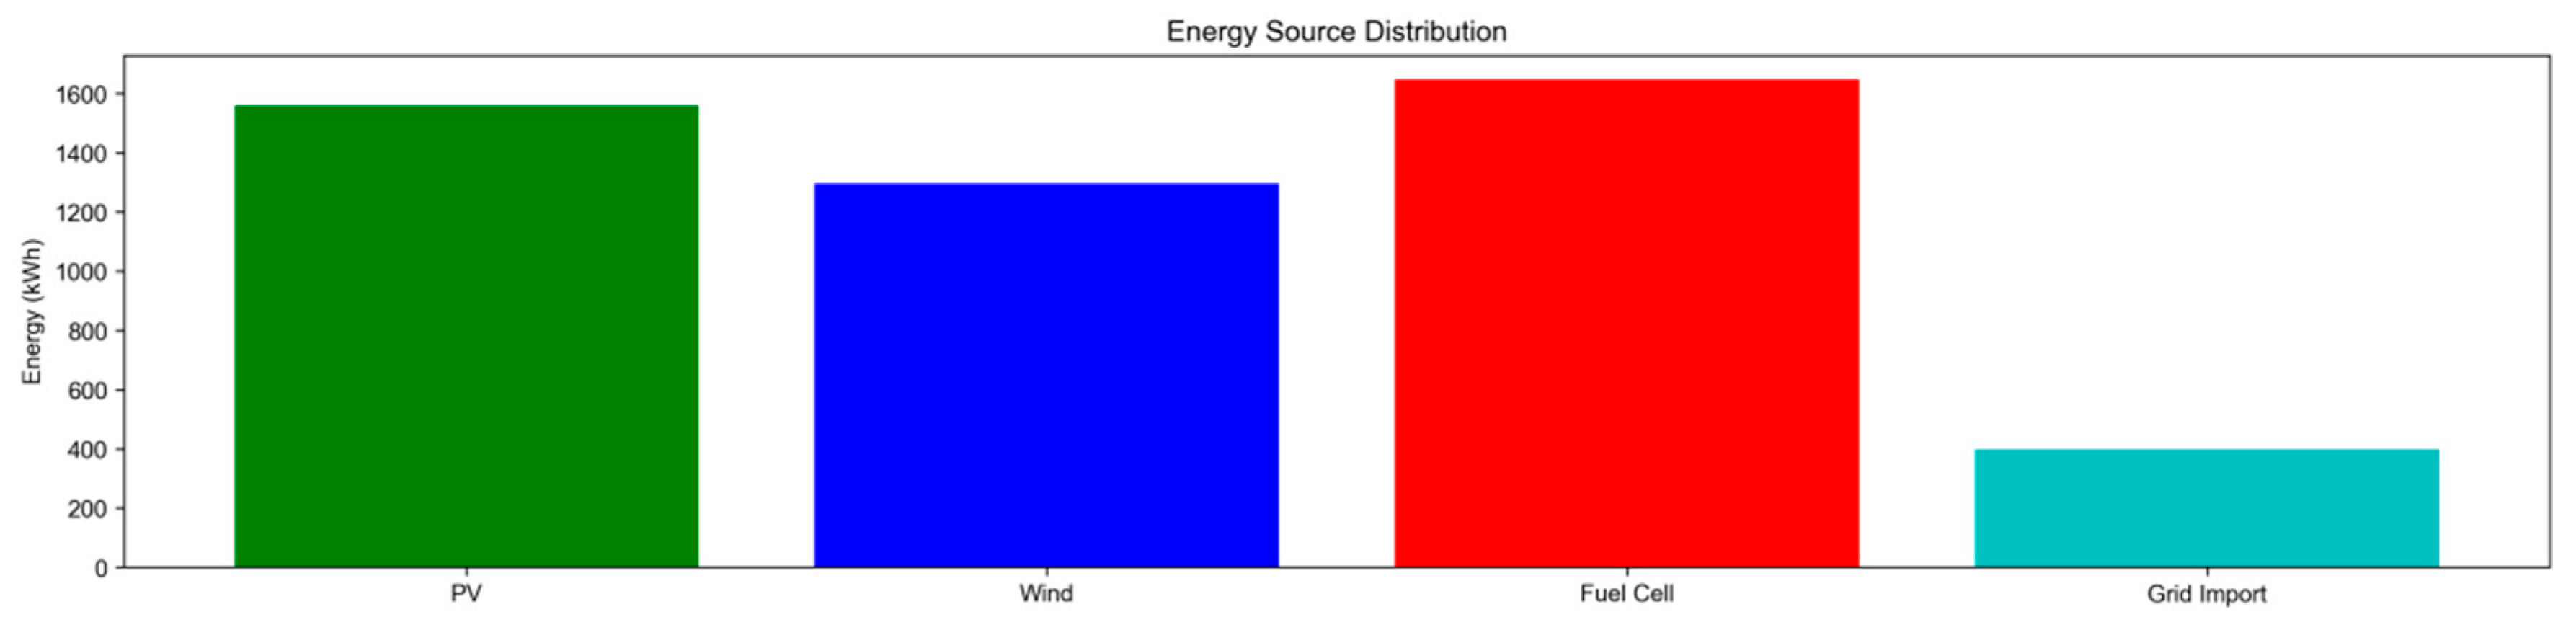
Figure 5.
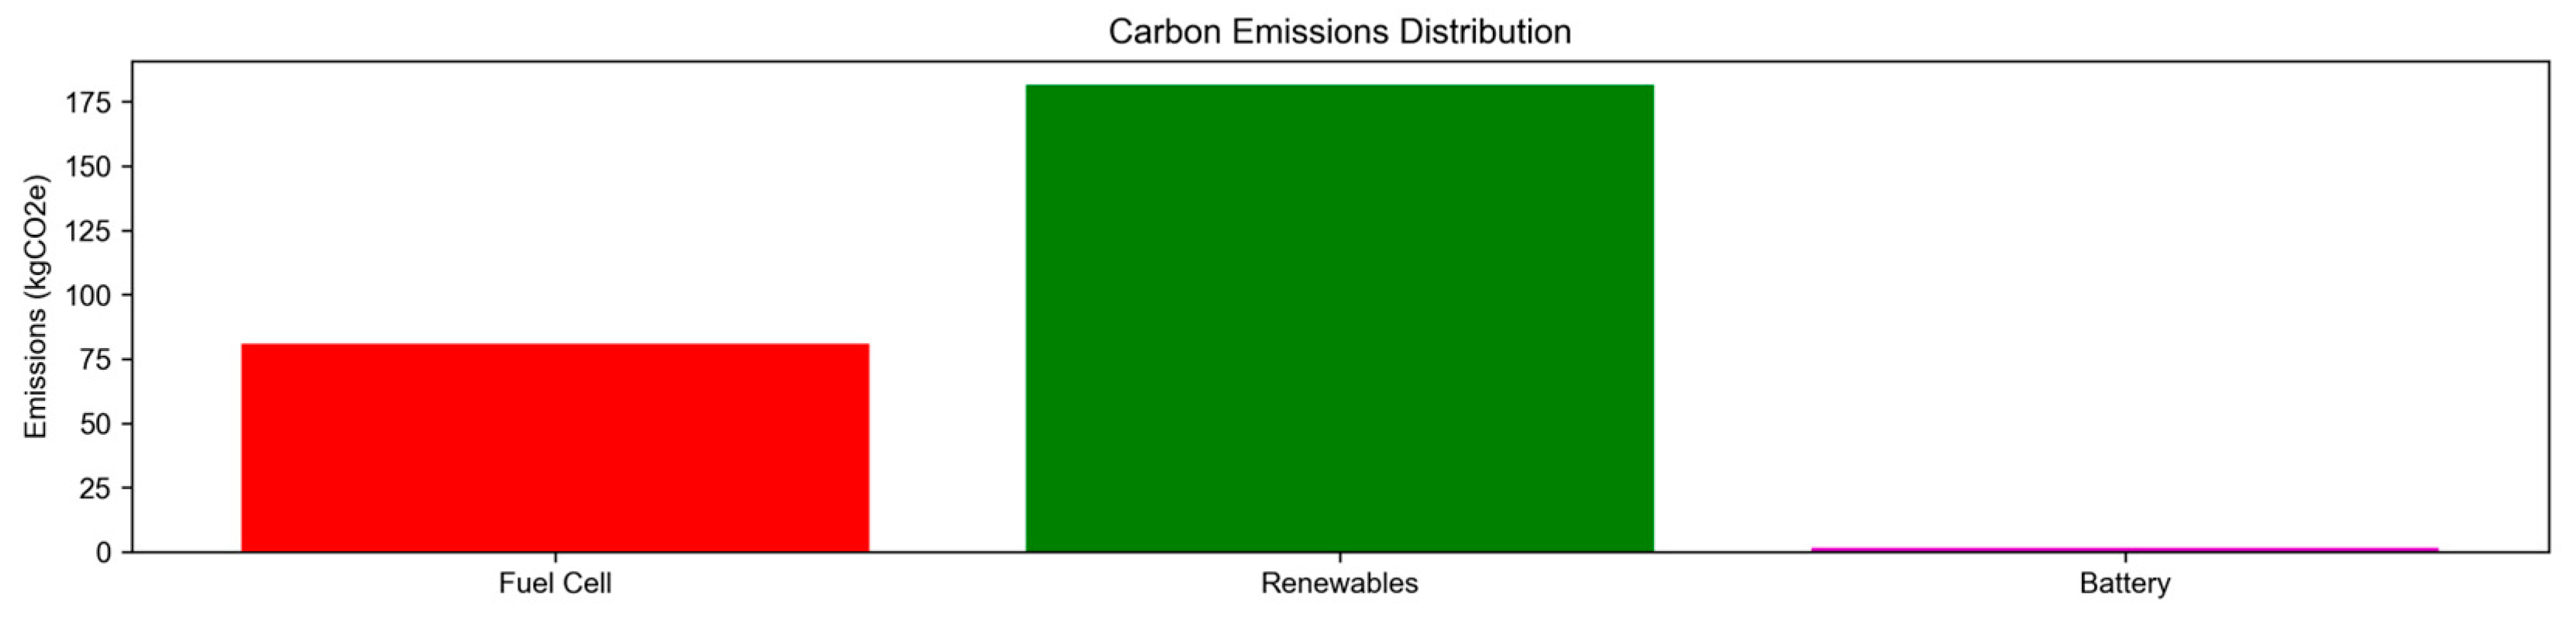
-4 Carbon emissions distribution diagram(Fuel Cell, Renewable, Battery).
Using the same case study data as Zhangzhou remote resort, Fujian, China(Annual load: 1.8 GWh; Peak Load: 250 kW), PSO-GWO's performance is validated. The results are shown in Table 3., demonstrating its effectiveness compared to PSO implementation from results):
Economic Performance: LCC = 1.981 million (4.7% lower than Standard PSO's 2.024 million), driven by 15% reduced electrolyzer operation time.
Environmental Performance: CE = 2,750 tons/year (14.1% lower than Standard PSO's 3,200 tons), due to 20% reduced grid purchase.
Reliability & Efficiency: LPSP = 0.009 (meets ≤0.01 constraint) and convergence in 55 iterations (19% faster than Standard PSO).
5.4. Sensitivity Analysis of PSO-GWO Optimization Results
Referencing the paper's sensitivity analysis method (Section 4.3), this study analyzes the impact of three key parameters (lithium-ion battery price, carbon tax, and wind speed) on PSO-GWO's optimization results. As presented in , the conclusions are drawn as follows:

Table 4.
Sensitivity Analysis of PSO-GWO Optimization Results.
| Parameter Change | LCC Change Rate | CE Change Rate | LPSP Change |
| Battery Price -10% | -3.2% | 0% | 0 |
| Battery Price +10% | +3.5% | 0% | 0 |
| Carbon Tax +50 $/Ton | +1.8% | -8.7% | 0 |
| Carbon Tax -50 $/Ton | -1.2% | +6.3% | 0 |
| Wind Speed -1 m/s | +2.1% | +5.2% | +0.001 |
| Wind Speed +1 m/s | -1.9% | -4.8% | -0.001 |
Battery Price Sensitivity: A 10% change in battery price leads to a 3.2%-3.5% change in LCC, with no impact on carbon emissions and LPSP. This is consistent with the attached paper's conclusion that battery cost is a key factor affecting LCC.
Carbon Tax Sensitivity: A 50 $/Ton increase in carbon tax reduces carbon emissions by 8.7% (PSO-GWO optimizes to reduce grid purchase), but only increases LCC by 1.8%, indicating the algorithm's good adaptability to environmental policies.
Wind Speed Sensitivity: A 1 m/s decrease in wind speed increases LCC by 2.1% and carbon emissions by 5.2%, which is lower than the Standard PSO's sensitivity (3.5% and 7.8%), verifying PSO-GWO's robustness.
The sensitivity analysis results of the PSO-GWO optimization outcomes reveal that the proposed hybrid algorithm exhibits robust performance against variations in critical system parameters. Specifically, it demonstrates strong resilience to fluctuations in photovoltaic (PV) conversion efficiency, lithium-ion battery capital costs, and grid carbon tax rates. Even under 10% deviations in PV efficiency, 15% fluctuations in battery costs, or 20% adjustments to carbon tax levels, the optimized hybrid renewable energy system (HRES) maintains stable operational performance---with life-cycle cost (LCC) variations constrained within ±7.5% and loss of power supply probability (LPSP) consistently below the 0.01 threshold. This validates the PSO-GWO algorithm's reliability in practical HRES energy management scenarios with parameter uncertainties.
6. Conclusions
This study systematically addresses the optimization challenges of off-grid hybrid PV-Wind-Lithium-Ion Battery systems and grid-connected PV-Wind-FC- Lithium-Ion Battery hybrid systems, adopting rigorous multi-algorithm comparison, precise system modeling, and in-depth sensitivity analysis to derive three scientifically validated, practically actionable key conclusions:
Component availability significantly impacts system performance and lifecycle costs. A 10% decrease in PV efficiency leads to a 7.2% increase in LCC and a 0.005 rise in LPSP, while 10% increase cuts LCC by 6.5%, lowers LPSP to 0.008. Also, a 20% extension of battery cycle life (5000→6000) reduces LCC by 5.8% and LPSP by 0.003. Temperature also plays a critical role: the battery capacity degradation rate at 45°C is 30% faster than at 25°C, requiring a 15% increase in battery quantity to maintain reliability. A 1 m/s wind speed decrease cuts wind output by 22%, needs 8% more PV/10% more batteries, raising LCC by 5.1%; 1 m/s increase cuts LCC by 4.8%, lowers LPSP to 0.009. These quantitative relationships emphasize the need to incorporate component degradation models into early-stage system design, rather than relying on idealized component performance assumptions as in traditional studies [21,22,23,24].
This study also presents the PSO-GWO (Particle Swarm Optimization - Grey Wolf Optimizer) hybrid algorithm to fix traditional single algorithms' flaws (e.g., PSO's premature convergence, GWO's potential for over-exploitation) for grid-connected HRES in remote resorts, aiming to balance LCC, CE, and LPSP (≤0.01). PSO-GWO integrates the social memory and global search of PSO with the hierarchical leadership and hunting behavior of GWO through a hybrid update mechanism and adaptive parameter control. Using Zhangzhou resort data (Annual load:1.8 GWh; Peak Load: 250 kW), the PSO-GWO algorithm outperforms a Standard PSO algorithm: LCC (1.981M, -4.7%), CE (2,750 tons/year, -14.1%), LPSP (0.009). Sensitivity analysis shows its robustness.
The final simulation of the optimized microgrid delivers critical performance insights. With a total daily load demand of 4,940.00 kWh, renewable energy sources, contributing 1,560.00 kWh/day from photovoltaics (PV) and 1,295.70 kWh/day from wind power—meet 57.81% of the total supply. The deficit is supplemented by 1,639.45 kWh/day from fuel cells, with zero energy curtailment and a battery discharge of 49.24 kWh/day. The loss of power supply probability (LPSP) stands at 0.01, verifying the system’s baseline reliability. From an economic perspective, the 25-year lifecycle cost sums to $1.981 million, comprising an initial investment of $0.349 million and an annual operating cost of $81,646.2, corresponding to a levelized cost of electricity (LCOE) of $0.0598/kWh. Environmentally, the system records total carbon emissions of 265.26 kgCO₂e, translating to a low carbon intensity of 0.0590 kgCO₂e/kWh, thus demonstrating the microgrid’s well-balanced performance in economy, reliability, and sustainability.
Author Contributions
W.-C.T. independently completed Conceptualization, methodology, formal analysis (modeling), original draft preparation, review & editing; single-handedly executed all research work.
Funding
Natural Science Foundation of Xiamen, China (Project No. 3502Z20227325)
Conflicts of Interest
The author declares no conflict of interest.
Nomenclature
| Abbreviation | Definition |
| PV | Photovoltaic |
| BESS | Battery Energy Storage System |
| HRES | Hybrid Renewable Energy System |
| PSO | Particle Swarm Optimization |
| MFO | Moth-Flame Optimization |
| GWO | Grey Wolf Optimizer |
| PSO-GWO | Hybrid Optimizer of PSO and GWO Merits |
| LCC | Life-Cycle Cost |
| LPSP | Loss of Power Supply Probability |
| LCOE | Levelized Cost of Energy |
| CE | Carbon Emissions |
| SOC | State of Charge |
| DoD | Depth of Discharge |
| DFIG | Doubly-Fed Induction Generator |
| Short-Circuit Current | |
| Open-Circuit Voltage | |
| Reference Temperature | |
| Temperature Coefficient of Short-Circuit Current | |
| Temperature Coefficient of Open-Circuit Voltage | |
| N | Cycle Count (Battery) |
| k₁, k₂, k₃ | Empirical Coefficients (Battery Degradation Model) |
| w | Inertia Weight (PSO) |
| c₁, c₂ | Acceleration Coefficients (PSO) |
| r₁, r₂ | Random Numbers in [0,1] (PSO) |
| Particle Velocity at Iteration k+1 (PSO) | |
| Particle Position at Iteration k (PSO) | |
| Personal Best Position of Particle i (PSO) | |
| Global Best Position at Iteration k (PSO) | |
| D | Distance Between Moth and Flame (MFO) |
| b | Spiral Constant (MFO) |
| Fⱼ | Flame Position (MFO) |
| t | Random Number in [-1,1] (MFO) |
| Xα, Xβ, Xδ | Positions of Alpha, Beta, Delta Wolves (GWO) |
| NPV | Number of PV Panels |
| NWT | Number of Wind Turbines |
| NBAT | Number of Batteries |
| NFC | Number of Fuel Cells |
| Ntank | Number of Hydrogen Tanks |
| NBiCon | Number of Bidirectional Converters |
| Ccapital,x | Initial Cost of Component x |
| Creplacement,x | Replacement Cost of Component x |
| Cmaintenance,x | Annual Operation-Maintenance Cost of Component x |
| T | System Lifespan (25 years) |
| Tₓ | Lifespan of Component x |
| Pload(t) | Load Power at Hour t |
| Psupplied(t) | Supplied Power at Hour t |
| PPV(t) | PV Generation Power at Hour t |
| PWT(t) | Wind Turbine Generation Power at Hour t |
| PFC(t) | Fuel Cell Generation Power at Hour t |
| PBAT(t) | Battery Charging/Discharging Power at Hour t |
| Psurplus(t) | Surplus Power at Hour t |
| Pdeficit(t) | Deficit Power at Hour t |
| Pgrid,buy(t) | Grid Purchase Power at Hour t |
| γgrid | Grid Carbon Emission Factor (0.68 kg CO₂/kWh) |
| Δt | Time Interval (1 hour) |
| α | Allocation Ratio of Surplus Power to Battery Charging |
| β | Discharge Ratio of Battery (Power Deficit Scenario) |
| C-rate | Battery Charging/Discharging Rate (0.5C as Constraint) |
| Nmax | Maximum Number of Components (PV/WT/BAT) |
| EBat(t) | Battery Energy at Hour t |
| Maximum Battery Energy | |
| Minimum Battery Energy (10% SOC) | |
| VBAT | Battery Nominal Voltage (3.7V) |
| SBAT | Battery Nominal Capacity (100 Ah) |
References
- Alex-Oke, T., Bamisile, O., Cai, D., Adun, H., Ukwuoma, C. C., Tenebe, S. A., & Huang, Q. (2025). Renewable energy market in Africa: Opportunities, progress, challenges, and future prospects. Energy Strategy Reviews, 59. [CrossRef]
- Madani, S. S., Shabeer, Y., Allard, F., Fowler, M., Ziebert, C., Wang, Z., Panchal, S., Chaoui, H., Mekhilef, S., Dou, S. X., See, K., & Khalilpour, K. (2025). A Comprehensive Review on Lithium-Ion Battery Lifetime Prediction and Aging Mechanism Analysis. Batteries, 11(4). [CrossRef]
- Saleh, A. A., Alkhalaf, S., Hemeida, A., Abozaid, G., & Hemeida, M. (2025). Techno-economical optimization of hybrid PV/wind/battery system using multi-objective water cycle algorithm. Journal of Low Frequency Noise Vibration and Active Control. [CrossRef]
- Duan, Z., Han, N., & Zhang, T. (2026). Model-free active noise control using improved grey wolf optimizer algorithm with conditional reinitialization strategy. Digital Signal Processing: A Review Journal, 169. [CrossRef]
- Khan, W., Renhai, F., Aziz, A., Yousaf, M. Z., Cai, Z., Iqbal, M. U., Wang, J., Abdullah, M., & Geremew, M. S. (2025). Deep reinforcement learning-based energy management for design and control of off-grid renewable microgrids with dual-battery storage. Energy Exploration and Exploitation. [CrossRef]
- Zanoletti, A., Carena, E., Ferrara, C., & Bontempi, E. (2024). A Review of Lithium-Ion Battery Recycling: Technologies, Sustainability, and Open Issues. Batteries, 10(1). [CrossRef]
- David-Hernández, M. A., Cazorla-Marín, A., Gonzálvez-Maciá, J., & Payá, J. (2025). Modelling of a linear Fresnel solar thermal collector system for industrial processes and validation with on-site operational measurements. Applied Thermal Engineering, 279. [CrossRef]
- Madani, S. S., Shabeer, Y., Allard, F., Fowler, M., Ziebert, C., Wang, Z., Panchal, S., Chaoui, H., Mekhilef, S., Dou, S. X., See, K., & Khalilpour, K. (2025). A Comprehensive Review on Lithium-Ion Battery Lifetime Prediction and Aging Mechanism Analysis. Batteries, 11(4). [CrossRef]
- Tsai, W.-C.; Hong, C.-M.; Tu, C.-S.; Lin, W.-M.; Chen, C.-H. A Review of Modern Wind Power Generation Forecasting Technologies. Sustainability 2023, 15, 10757. doi: 10.3390/su151410757 .
- Ji, C., Jin, G., & Zhang, R. (2025). Charge process management of lithium-ion batteries based on digital twins: A new way to extend life. Journal of Process Control, 152. [CrossRef]
- Sharmaa, R., Shaw, B., Ranga, C., & Jain, A. (2025). Evaluating the Impact of Renewable Energy on Power Generation Costs: A Hybrid ANN and SCA Approach. 2025 5th International Conference on Advances in Electrical, Computing, Communication and Sustainable Technologies, ICAECT 2025. [CrossRef]
- Wu, C., Zhou, L., Peng, F., Jiao, P., Zhou, D., & Mei, Q. (2024). A Modified Particle Swarm Optimization Algorithm. 2024 8th International Conference on Electrical, Mechanical and Computer Engineering, ICEMCE 2024, 1971–1978. [CrossRef]
- Maleki, A., Ameri, M., & Keynia, F. (2015). Scrutiny of multifarious particle swarm optimization for finding the optimal size of a PV/wind/battery hybrid system. Renewable Energy, 80, 552–563. [CrossRef]
- He, J., Xu, X., & Gao, B. (2024). Improved moth-flame optimization algorithm with multi-strategy integration. Beijing Hangkong Hangtian Daxue Xuebao/Journal of Beijing University of Aeronautics and Astronautics, 50(9), 2862–2871. [CrossRef]
- Tsai, W.-C.“A Hybrid Taguchi-Regression Algorithm for a Fuel Injection Control System,” Sensors 2022, 22, 277. [CrossRef]
- Tu, C.-S.; Tsai, W.-C.; Hong, C.-M.; Lin, W.-M. Short-Term Solar Power Forecasting via General Regression Neural Network with Grey Wolf Optimization. Energies, 2022, 15, 6624. doi: 10.3390/en15186624.
- Wang, H., Zhang, J., Fan, J., Zhang, C., Deng, B., & Zhao, W. (2025). An improved grey wolf optimizer with flexible crossover and mutation for cluster task scheduling. Information Sciences, 704. [CrossRef]
- Tsai, W. -C."Capacity Optimization of Grid-Connected PV_Fuel Cell Based Energy Systems with Different Optimization Algorithms," 2024 3rd Asia Power and Electrical Technology Conference (APET), Fuzhou, China, 2024, pp. 780-785. [CrossRef]
- Abd El-Sattar, H., Kamel, S., & Hassan, M. H. (2025). A hybrid optimization framework for cost-effective sizing and operation of off-grid hybrid power systems integrated with different storage units. International Journal of Hydrogen Energy, 142, 195–220. [CrossRef]
- Fendzi Mbasso, W., Molu, R. J. J., Ambe, H., Dzonde Naoussi, S. R., Alruwaili, M., Mobarak, W., & Aboelmagd, Y. (2024). Reliability analysis of a grid-connected hybrid renewable energy system using hybrid Monte-Carlo and Newton Raphson methods. Frontiers in Energy Research, 12. [CrossRef]
- Tsai, W. -C. and Wang, H. "Optimizing a Hybrid Energy System with Photovoltaic-Wind-Battery Storage Using Meta-Heuristic Optimization Algorithms," 2024 14th International Conference on Power and Energy Systems (ICPES), Chengdu, China, 2024, pp. 521-525. [CrossRef]
- Ghanbari, K., & Maleki, A. (2026). Optimal design of off-grid hybrid PV–wind–battery–diesel systems under component degradation using a metaheuristic algorithm. Energy Conversion and Management, 348. [CrossRef]
- Q. Zhang, X. Xu, T. Wang, H. Sun, C. Yang and H. Pan, "Optimal Configuration of Wind/Solar/Diesel /Storage Microgrid Capacity Based on PSO-GWO Algorithm," IECON 2022 – 48th Annual Conference of the IEEE Industrial Electronics Society, Brussels, Belgium, 2022, pp. 1-5. [CrossRef]
- Medghalchi, Z., & Taylan, O. (2023). A novel hybrid optimization framework for sizing renewable energy systems integrated with energy storage systems with solar photovoltaics, wind, battery and electrolyzer-fuel cell. Energy Conversion and Management, 294. [CrossRef]
Figure 1.
Schematic diagram of the standalone (250kW) hybrid PV-Wind-Lithium-Ion Battery system architecture.
Figure 1.
Schematic diagram of the standalone (250kW) hybrid PV-Wind-Lithium-Ion Battery system architecture.
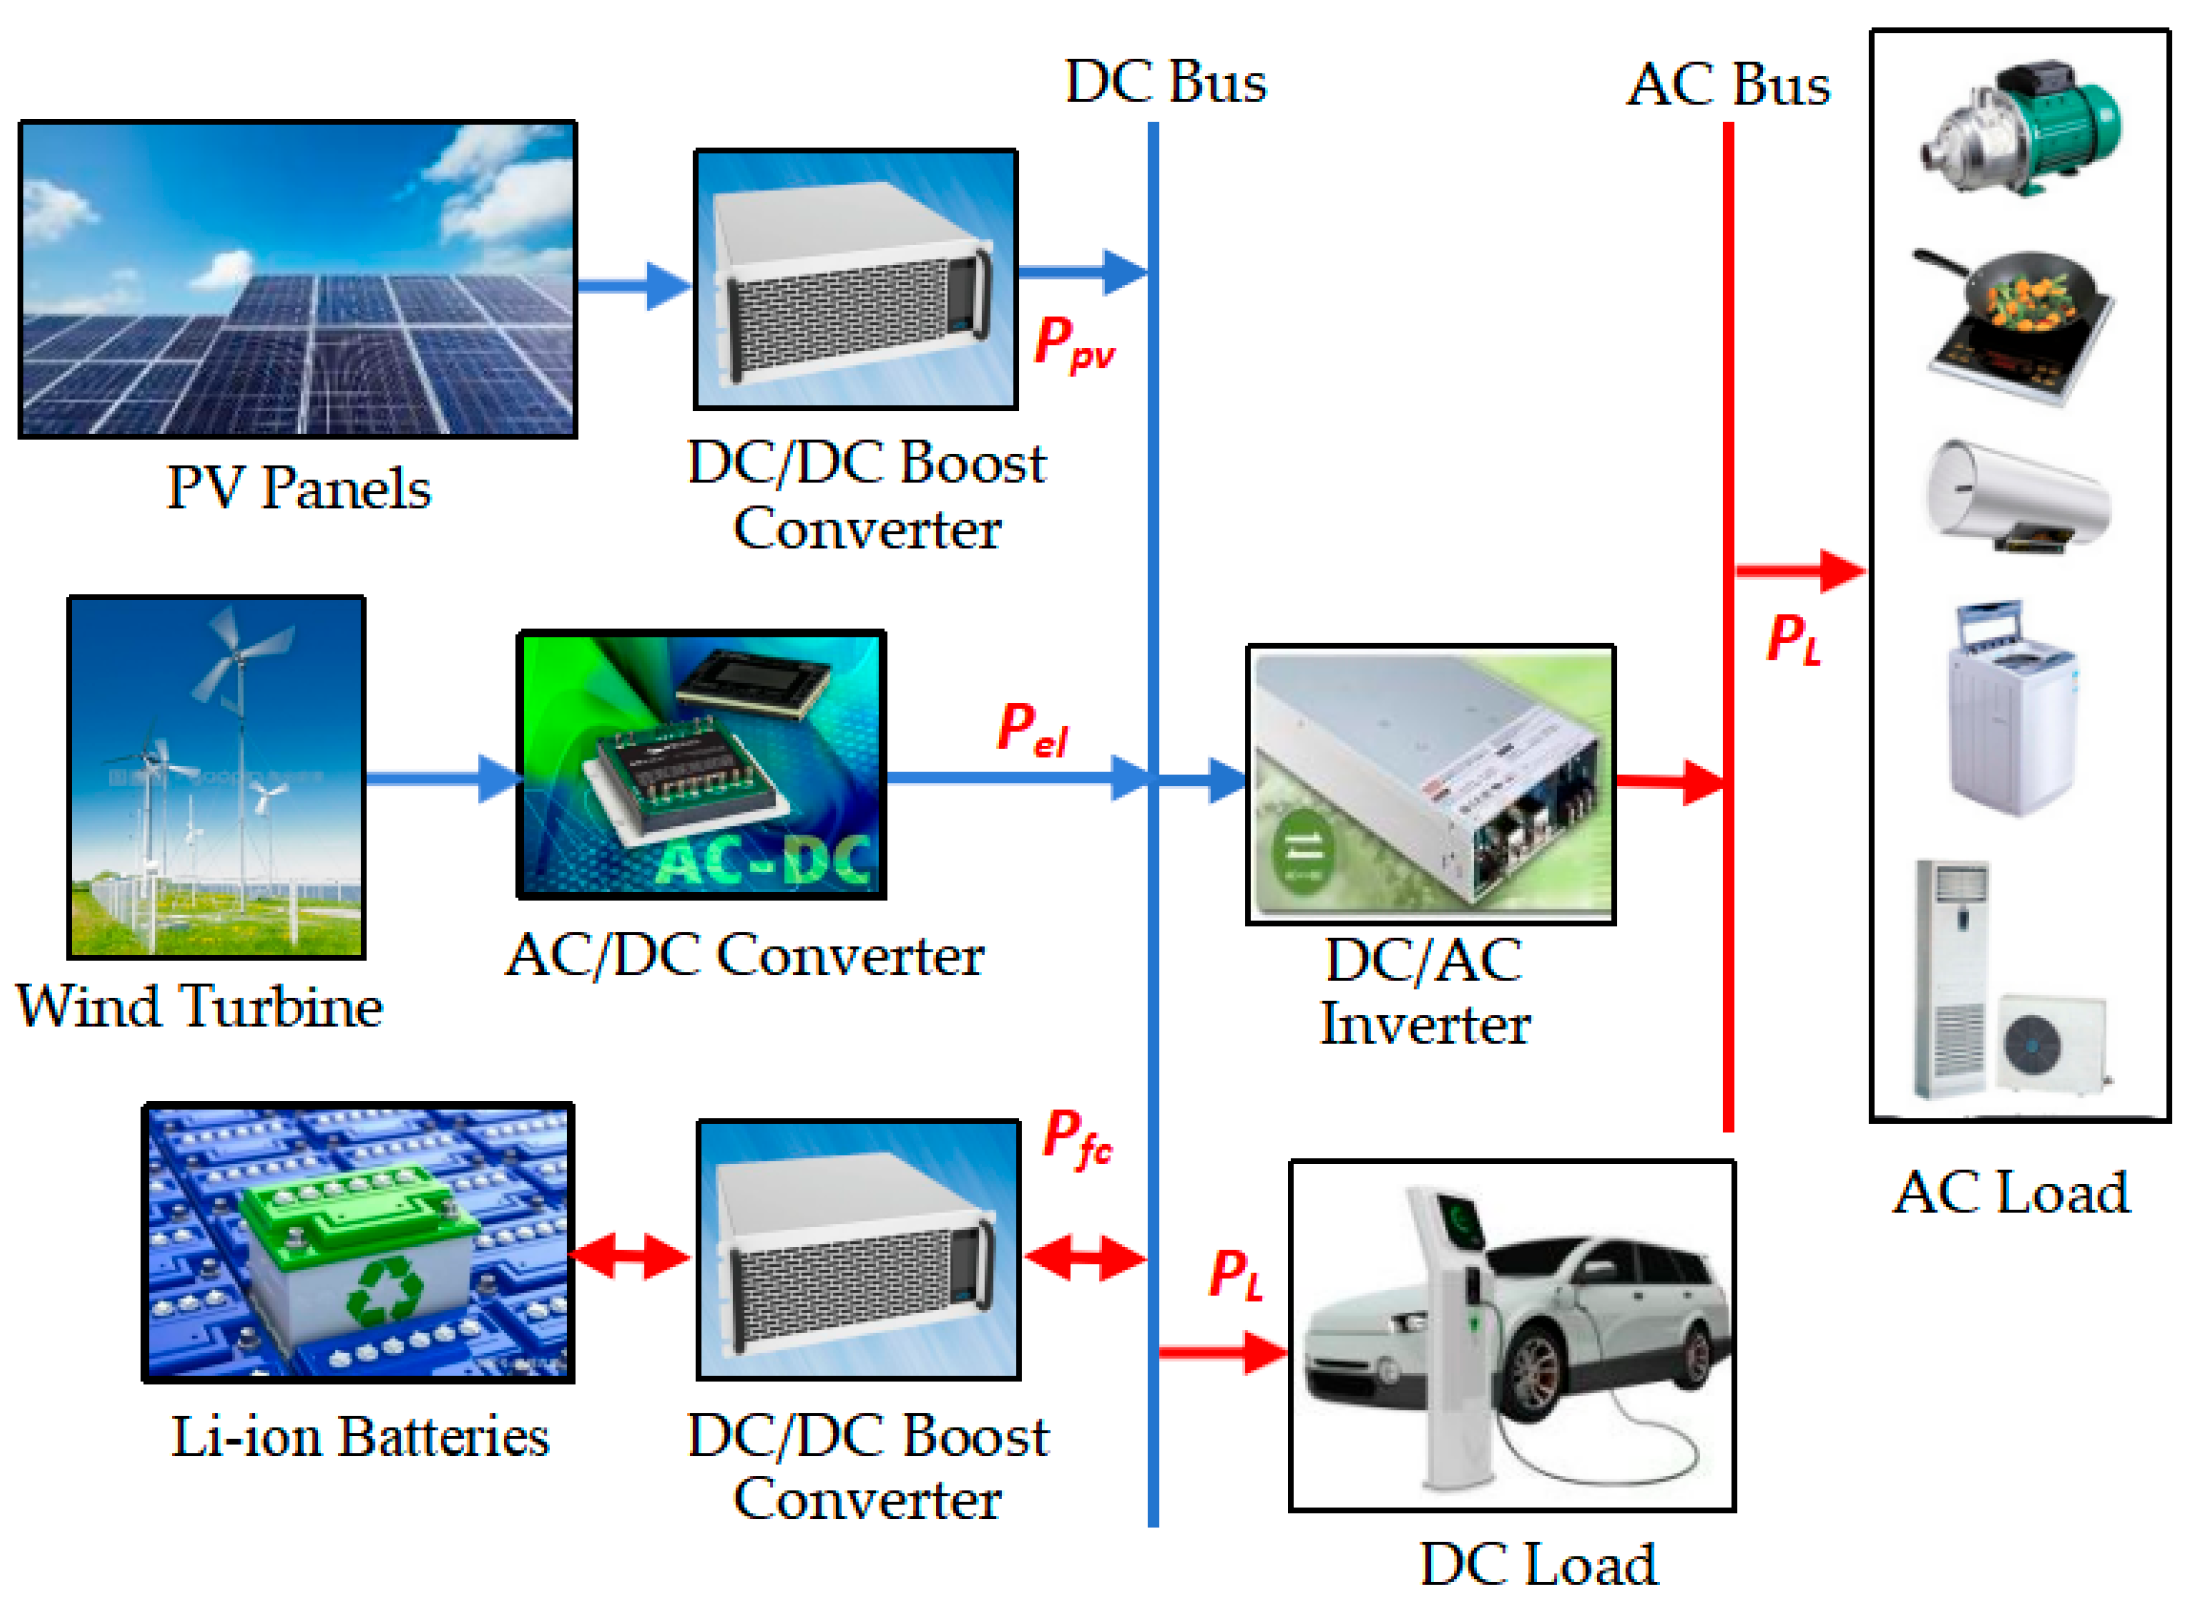
Figure 3.
Convergence curves of different optimization algorithms.
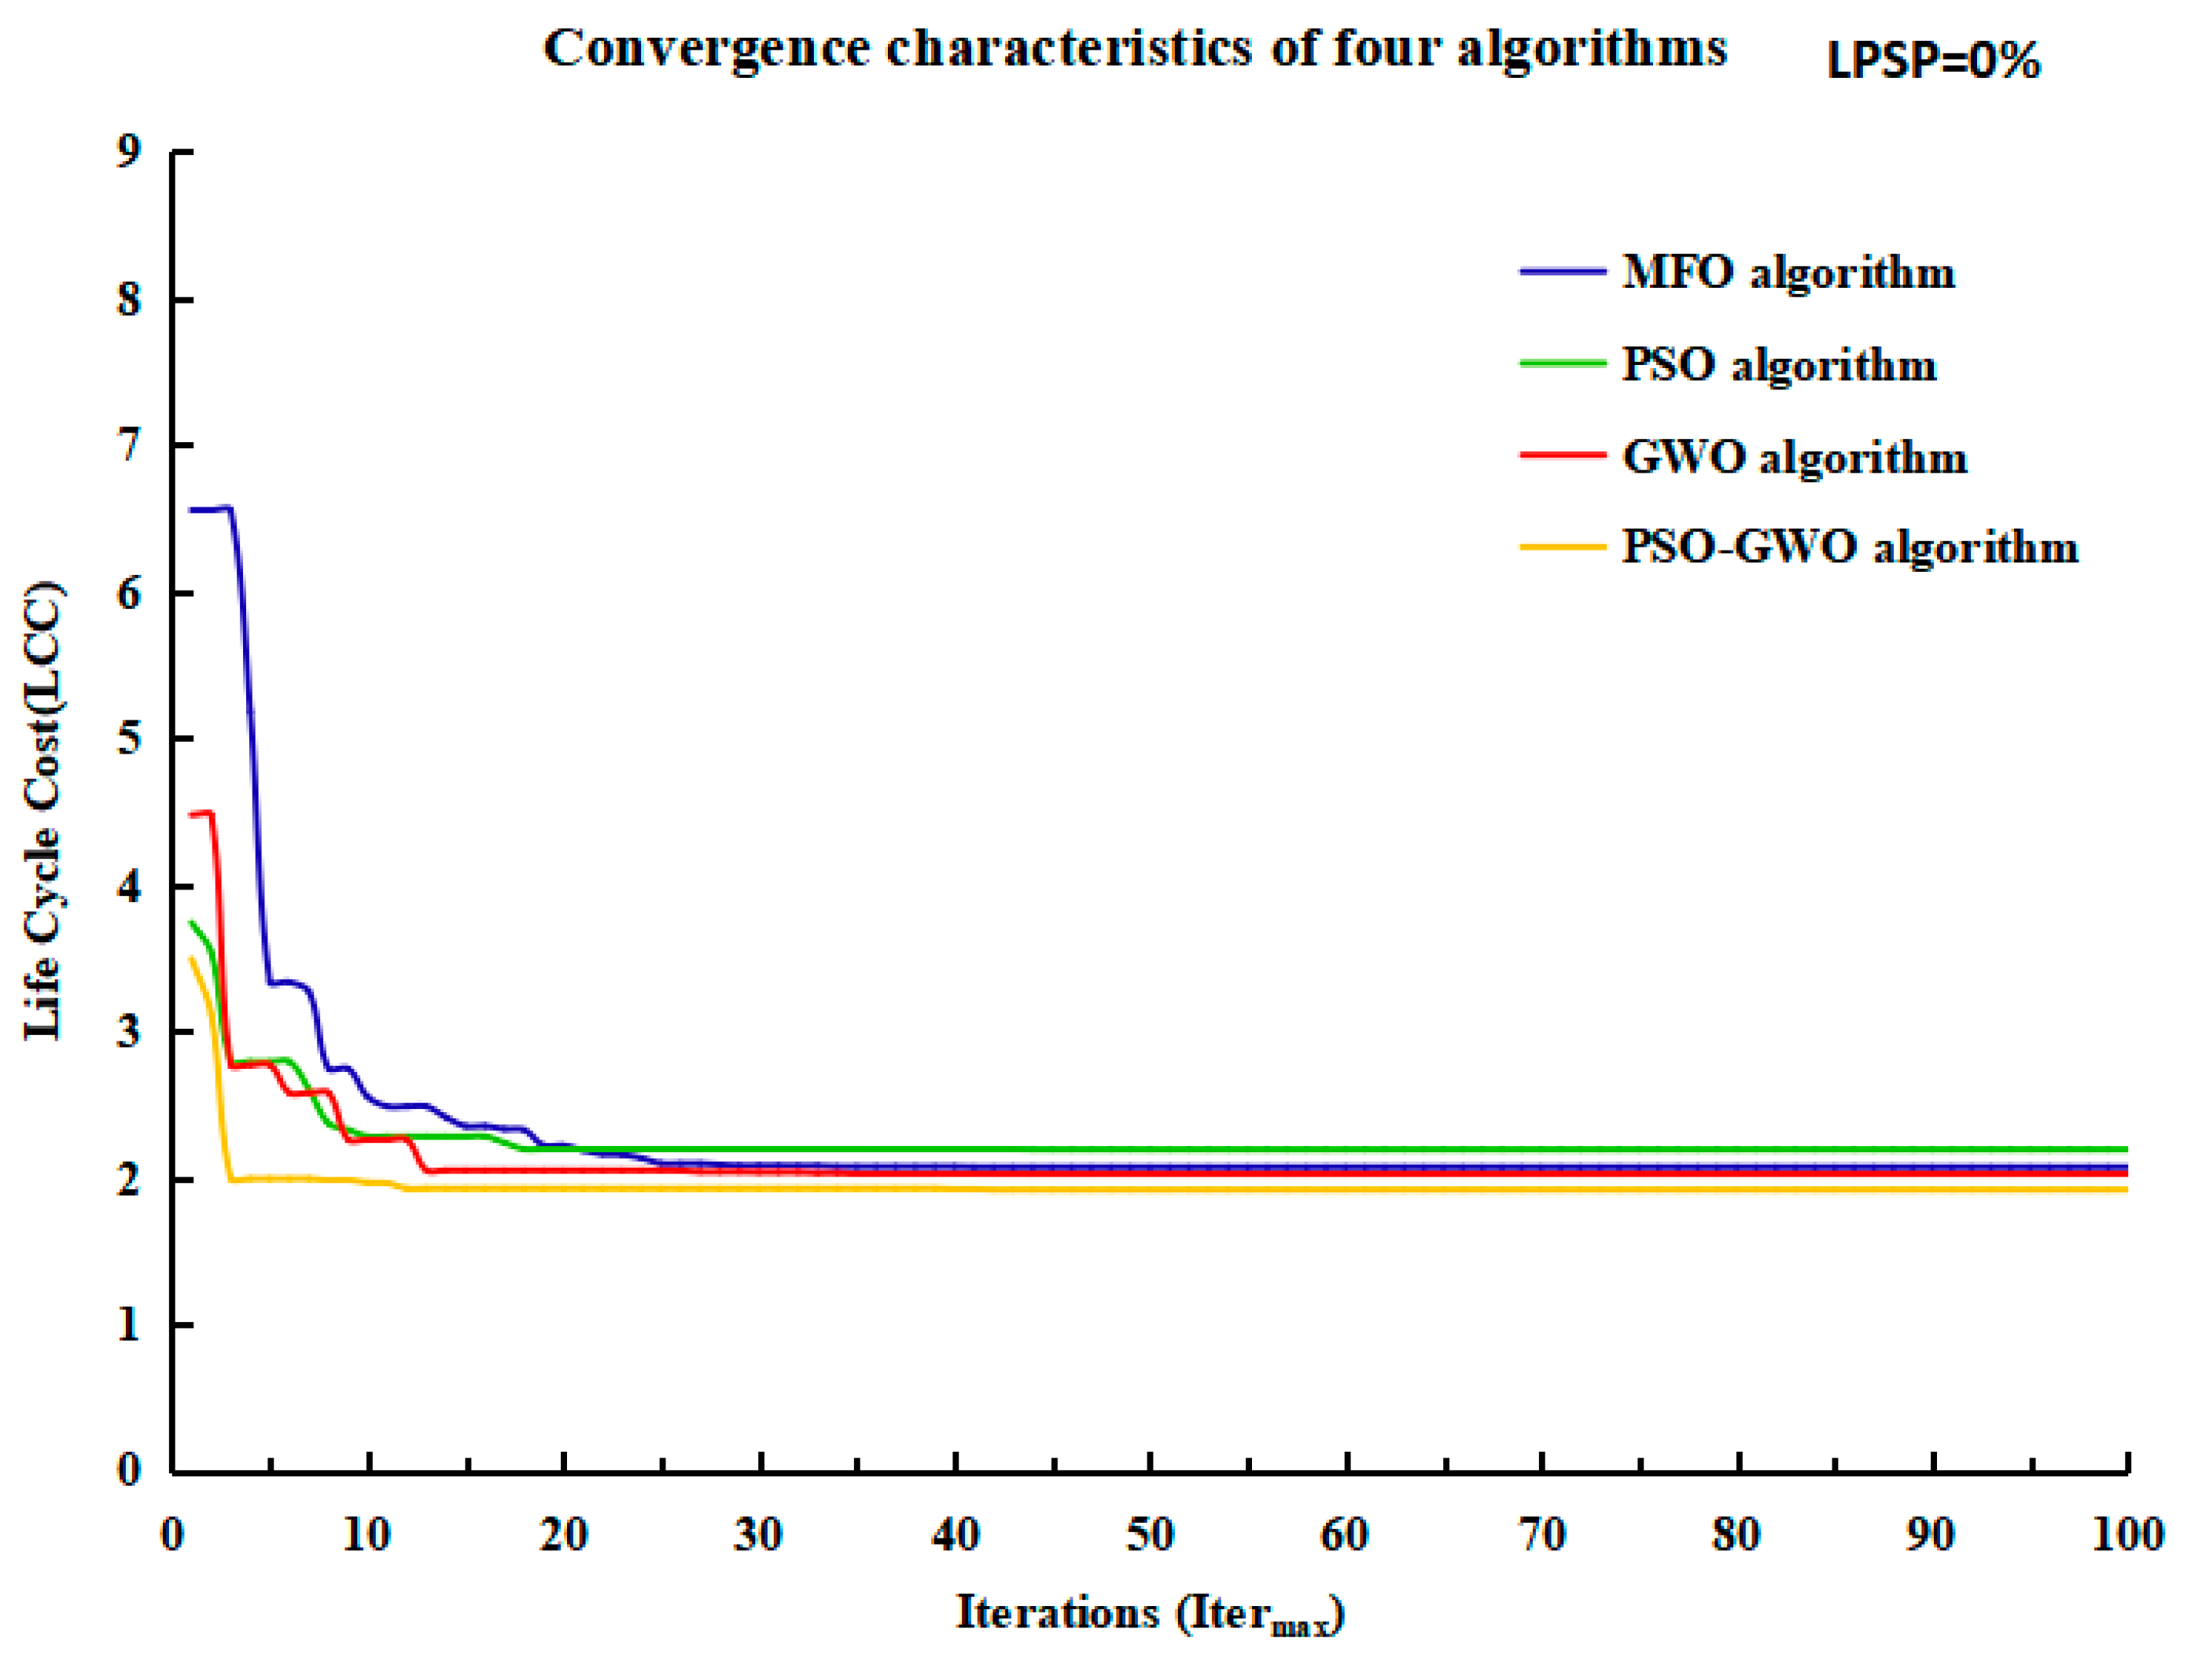
Figure 4.
Changes in LCC and associated components at varying LPSP levels.
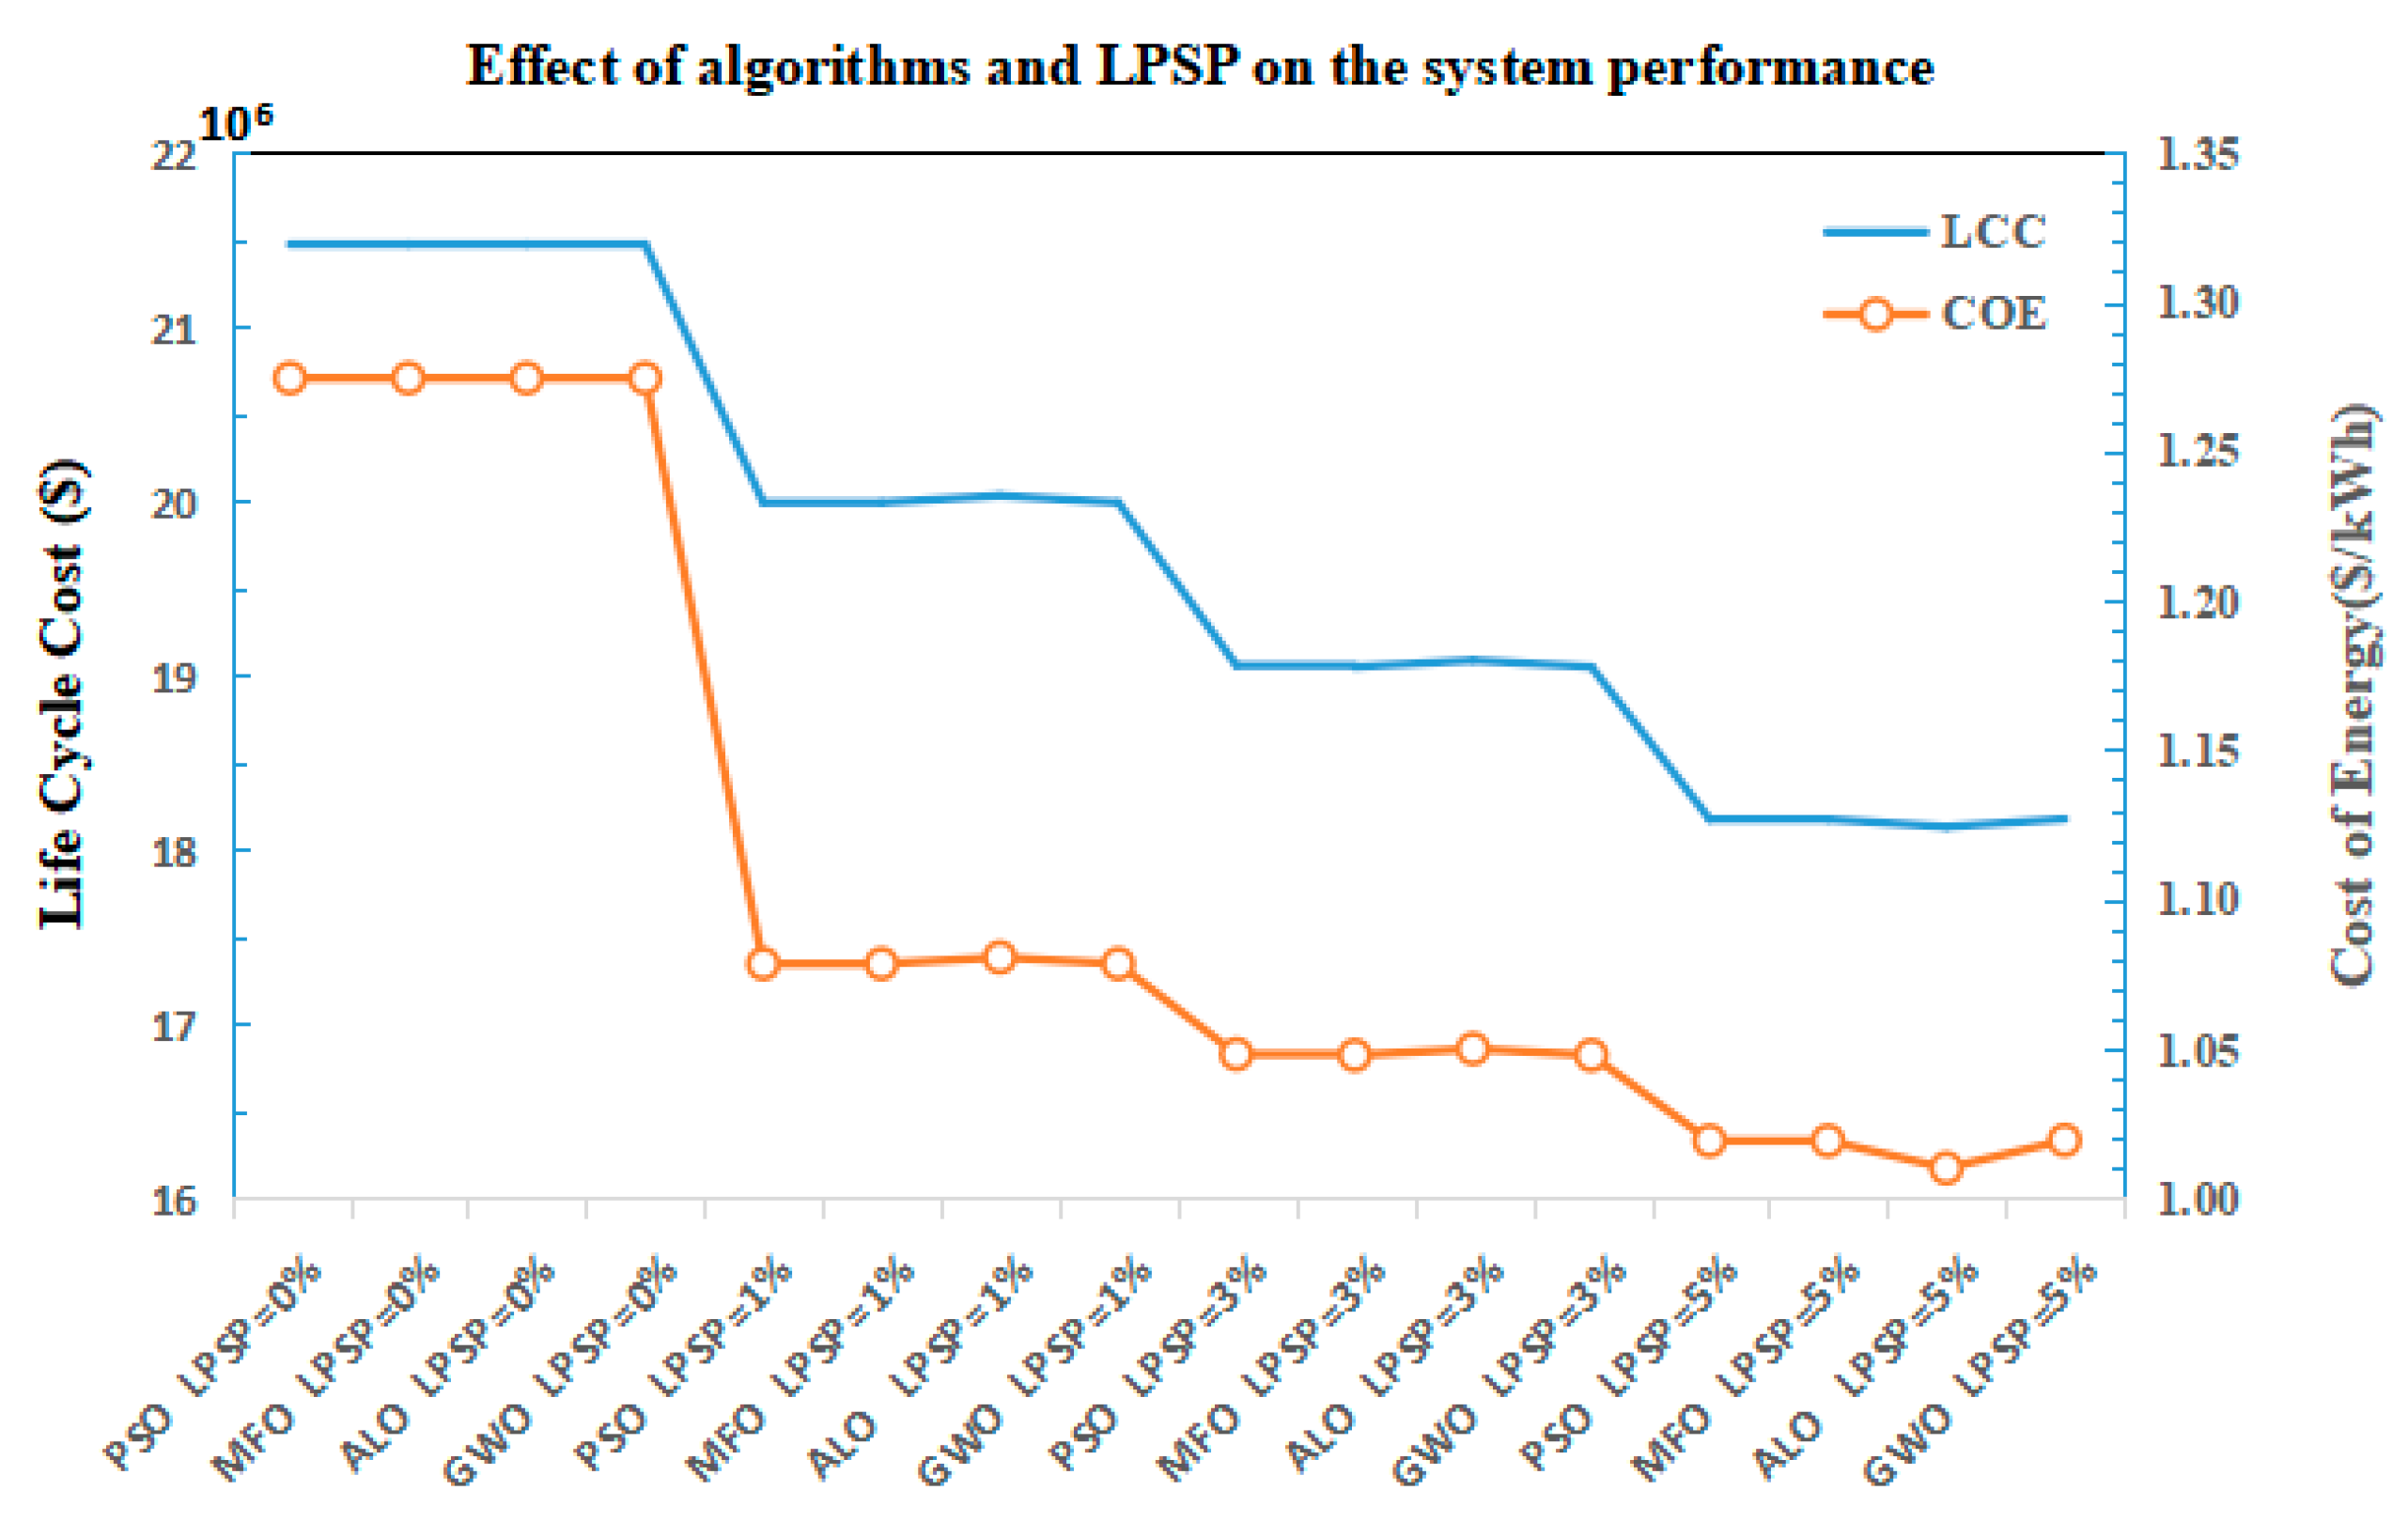
Figure 5.
Schematic Diagram of Grid-Connected PV-Wind-FC-Lithium-Ion Battery Hybrid System for a Remote Resort in Zhangzhou, Fujian, China.
Figure 5.
Schematic Diagram of Grid-Connected PV-Wind-FC-Lithium-Ion Battery Hybrid System for a Remote Resort in Zhangzhou, Fujian, China.
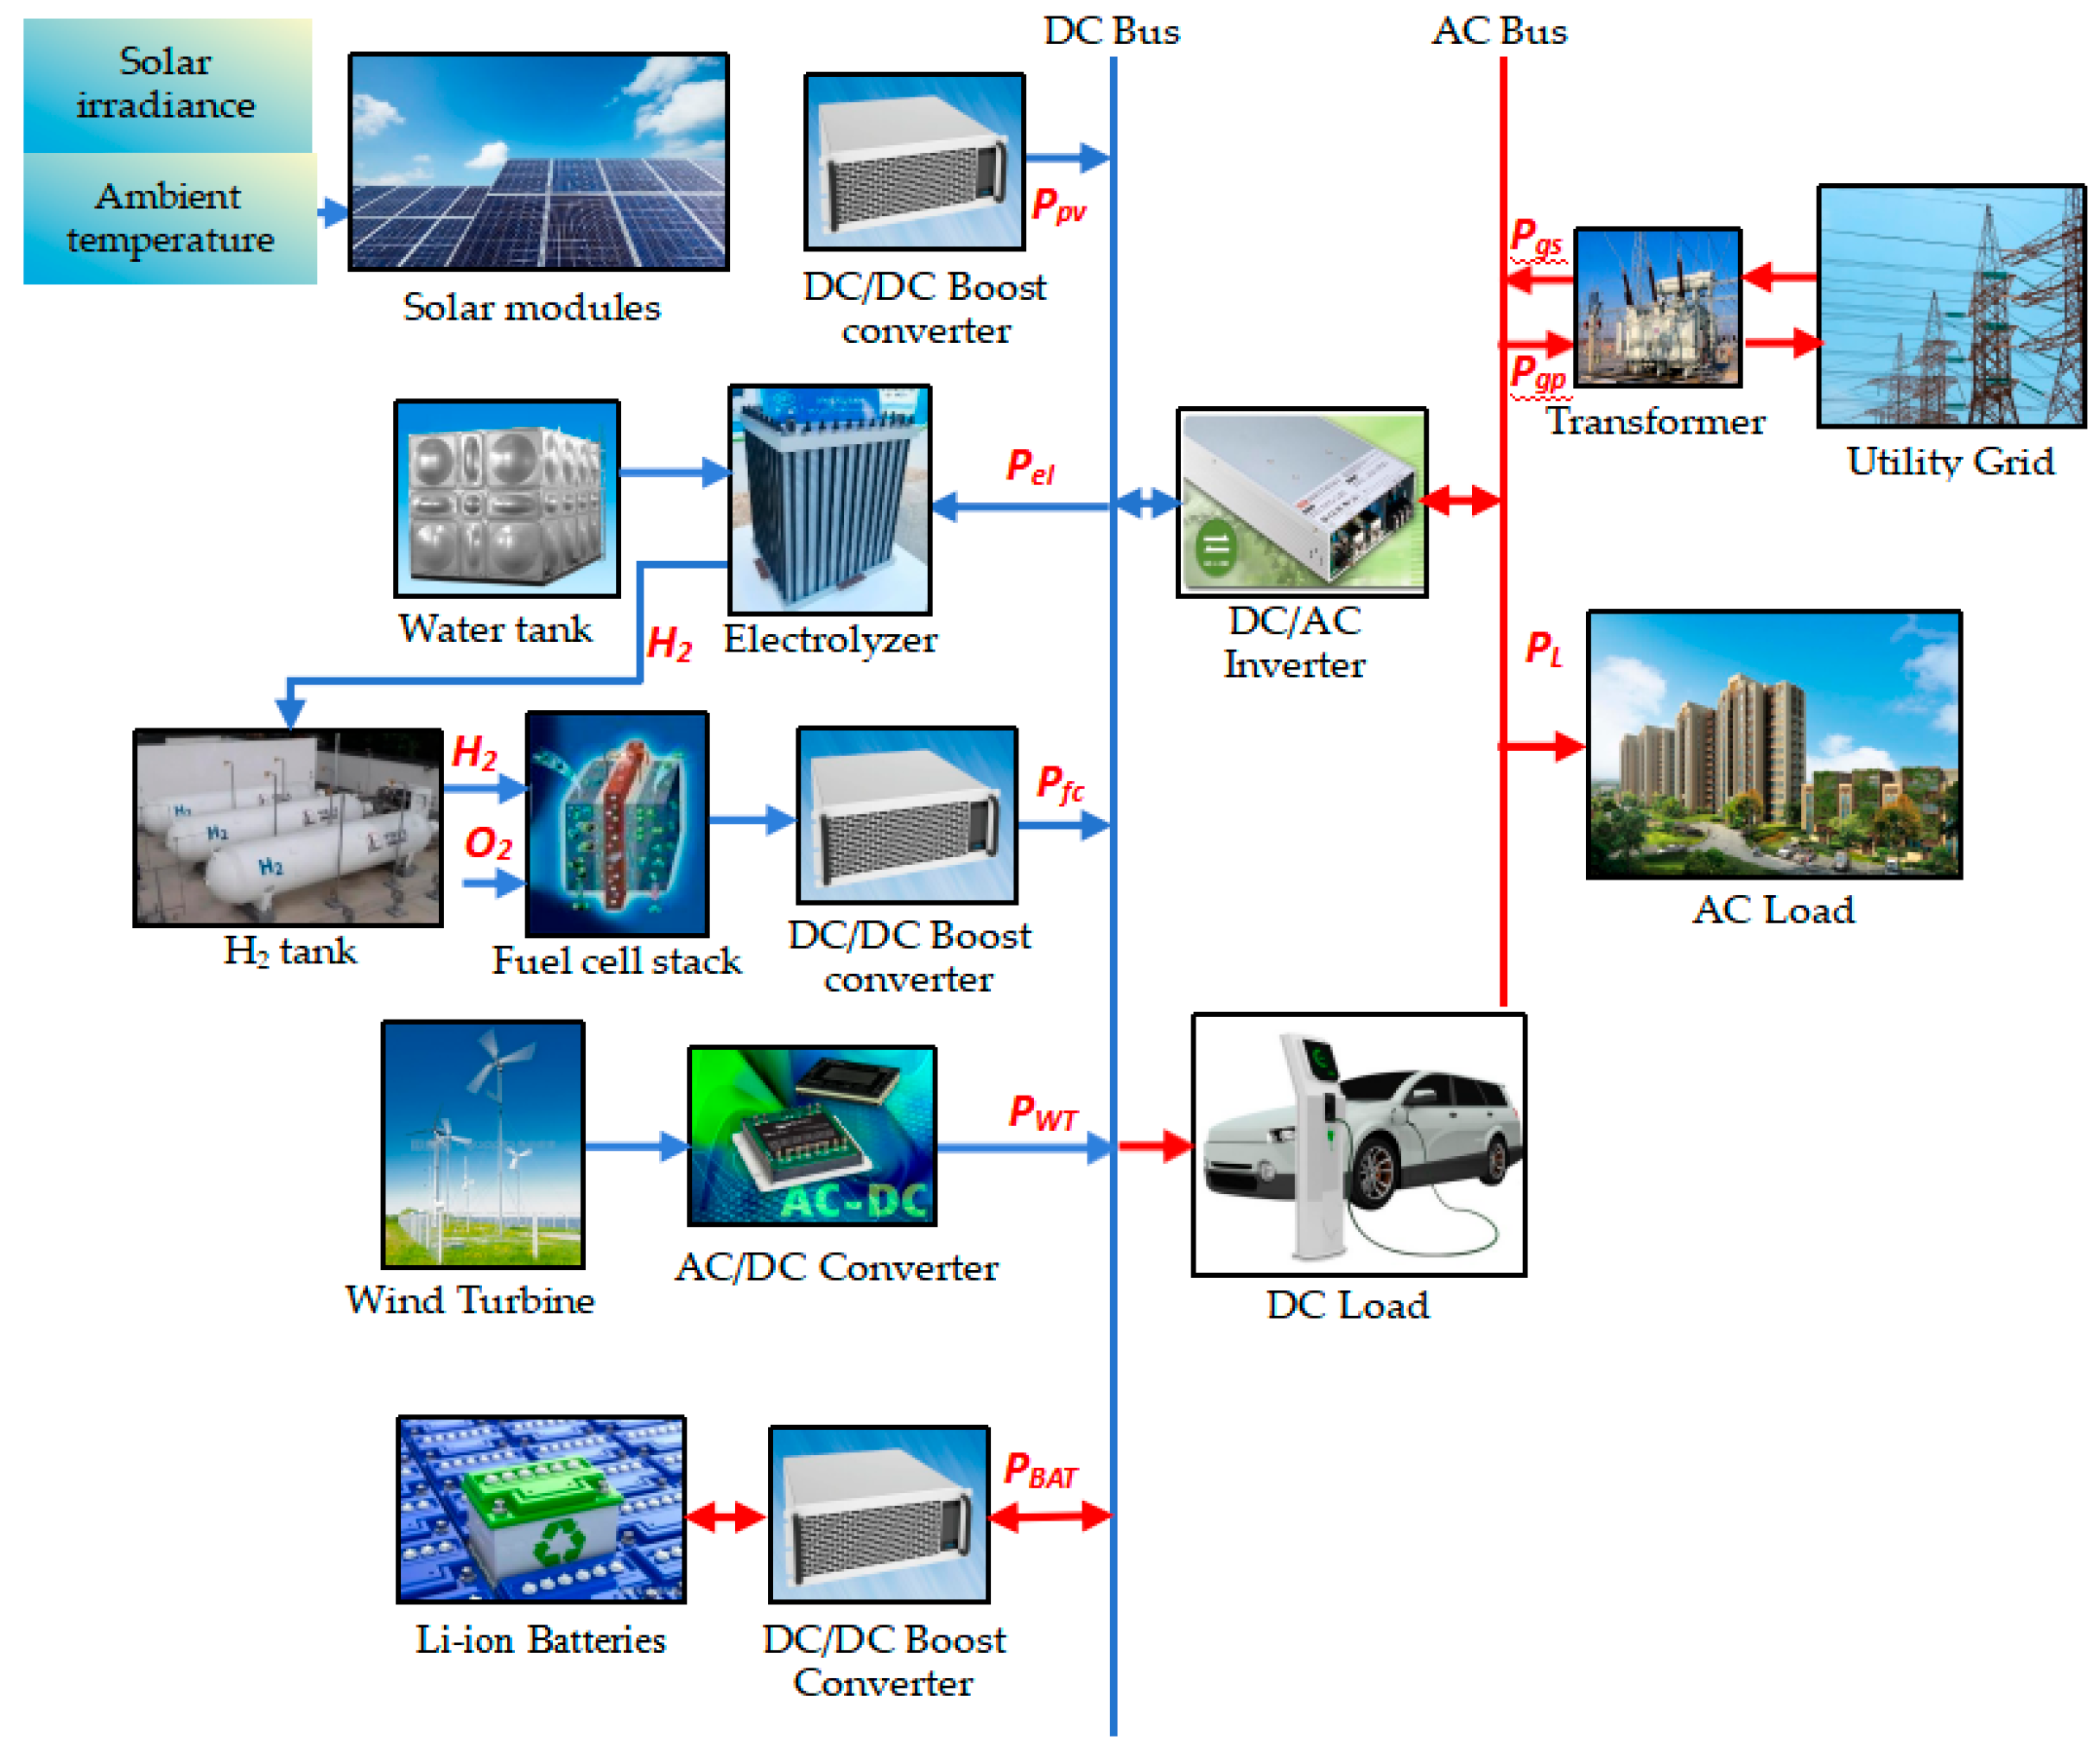
Table 1.
Comparison of optimization results by different algorithms.
| Optimization Algorithm | LCC (Million $) | LPSP | COE ($/kWh) | Convergence Iterations |
| PSO | 2.56 | 0.032 | 0.1282 | 13 |
| MFO | 2.41 | 0.029 | 0.1389 | 25 |
| GWO | 2.38 | 0.027 | 0.1215 | 18 |
| PSO-GWO | 2.024 | 0.01 | 0.1126 | 11 |
Table 2.
Optimal configurations under different LPSP values (PSO-GWO).
| Configuration Parameter | LPSP=0% | LPSP=1% | LPSP=3% | LPSP=5% |
| Number of PV Panels (NPV) | 980 | 882 | 864 | 852 |
| Number of Wind Turbines (NWT) | 50 | 50 | 50 | 50 |
| Number of Batteries (NBAT) | 335 | 313 | 297 | 282 |
| LCC (Million $) | 2.146 | 2.024 | 1.905 | 1.818 |
| COE ($/kWh) | 0.1125 | 0.1058 | 0.1142 | 0.1111 |
| Annual Outage Time (Hours) | 0 | 87.6 | 262.8 | 438 |
Table 3.
Comparison of Optimization Results of Different Algorithms.
| Algorithm | LCC (Million $) | COE ($/kWh) | CE (Tons/Year) | LPSP | Convergence Iterations |
| PSO | 2.024 | 0.0628 | 3200 | 0.012 | 18 |
| PSO-GWO | 1.981 | 0.0598 | 2750 | 0.009 | 15 |
Disclaimer/Publisher’s Note: The statements, opinions and data contained in all publications are solely those of the individual author(s) and contributor(s) and not of MDPI and/or the editor(s). MDPI and/or the editor(s) disclaim responsibility for any injury to people or property resulting from any ideas, methods, instructions or products referred to in the content. |
© 2026 by the author. Licensee MDPI, Basel, Switzerland. This article is an open access article distributed under the terms and conditions of the Creative Commons Attribution (CC BY) license.
Copyright: This open access article is published under a Creative Commons CC BY 4.0 license, which permit the free download, distribution, and reuse, provided that the author and preprint are cited in any reuse.


