
Submitted:
26 January 2026
Posted:
27 January 2026
You are already at the latest version
Abstract
Spectrum Sensing (SS) is expected to play a crucial role in forthcoming 6G Cognitive Radio Networks (CRNs), where unlicensed users will be able to dynamically access the spectrum and perform opportunistic transmissions without causing interference to licensed users. In this work, we investigate multiple-antenna SS techniques by analyzing the performance of several widely used detection schemes—namely, Roy’s Largest Root Test (RLRT), Generalized Likelihood Ratio Test (GLRT), Eigenvalue Ratio Detector (ERD), and Energy Detector (ED)—under varying false alarm probabilities and signal-to-noise ratios (SNRs). The study assumes a fixed number of sensors at the secondary user receiver, equal to four. To evaluate the behavior of these detectors in realistic conditions, we developed a software-defined radio (SDR) testbed using Universal Software Radio Peripherals (USRPs), enabling both primary user signal transmission and secondary user data acquisition. The experimental results, illustrated through Receiver Operating Characteristic (ROC) and performance curves, are compared with simulation outcomes. The analysis is complemented by a detailed state-of-the-art listing of the available analytical characterizations of the false alarm probabilities, for the considered SS schemes. In particular, the GLRT false alarm probability, previously unavailable in explicit form for a four antenna equipped receiver, is computed as well. These results validate the superior detection capability of RLRT over the other tested schemes, confirming its effectiveness not only in theoretical analysis but also in practical SDR-based implementations.
Keywords:
software-defined radio
; 6G-CRN
; spectrum sensing
; RLRT
; GLRT
; URSP
1. Introduction
1Cognitive Radio Networking (CRN) [1] was conceived as a paradigm to counteract the growing shortage of available spectrum resources by promoting the intelligent coexistence of licensed and unlicensed users [2]. Through dynamic sensing and adaptation, CRNs allow secondary systems to opportunistically exploit underused frequency bands without causing harmful interference to primary users. Owing to these capabilities, CRNs are expected to become a key enabling technology for future 6G communication infrastructures, which will demand unprecedented flexibility, spectrum efficiency, and context awareness.
At the heart of CRN functionality lies Spectrum Sensing (SS), a critical process responsible for identifying whether a given frequency band is occupied by a primary transmitter (busy condition) or is currently vacant (idle state). The reliability of this sensing process directly impacts spectrum utilization efficiency and interference avoidance. As such, the development of accurate, fast, and robust SS algorithms has remained one of the cornerstone challenges in cognitive radio research over the past two decades [3,4,5]. These efforts have led to a wide range of techniques capable of coping with low Signal-to-Noise Ratios (SNRs), channel variability, and practical hardware constraints.
The present work focuses on a measurement-based evaluation of several well-established SS strategies that operate based on the statistical properties of the received signal covariance matrix [6,7,8,9]). In systems equipped with multiple antennas, such eigenvalue-based approaches exploit spatial diversity to enhance detection reliability. The algorithms considered throughout this work include both statistically grounded procedures, such as the Generalized Likelihood Ratio Test (GLRT) [10], the Roy’s Largest Root Test (RLRT) [11], and more heuristic alternatives, such as the Energy Detector (ED) [12] and the Eigenvalue Ratio Detector (ERD) [6]. While the former rely on rigorous estimation-theoretic principles, the latter are often favored for their implementation simplicity and interpretability in practical scenarios. In particular, in this work, we extend the contents of [13] in two main directions: on the one hand, with reference to statistically grounded procedures, we provide a detailed analytical characterization of the false alarm probabilities for all presented SS schemes both at finite-size as well as in the asymptotic regime, and especially for GLRT, we elaborate on the findings of [14] to provide more explicit performance expression for finite case. On the other hand, we add to the investigation a further heuristic scheme, the above mentioned ERD, and, after reporting on a semi-asymptotic analysis of its performance, we carry on a performance evaluation of such a SS algorithm both from the experimental (i.e., measurement-based) as well as via simulations.
The practical realization of CRN principles is fostered by the advent of Software-defined radio (SDR) technology, which provides a versatile, reconfigurable platform for real-time signal acquisition and processing. SDR devices, by translating signal-processing operations into software rather than fixed hardware, make it possible to dynamically reconfigure the radio front-end in response to environmental changes—an essential feature for CRN operation. Among available platforms, the Universal Software Radio Peripheral (USRP) stands out for its cost-effectiveness, modularity, and compatibility with open-source frameworks, making it a widely adopted tool for prototyping and testing CRN functionalities. The synergy between CRN concepts and SDR platforms enables experimental validation of theoretical sensing strategies, bridging the gap between analytical modeling and real-world performance analysis. This convergence represents a decisive step toward more adaptable and intelligent radio systems capable of self-optimization.
Extensive experimental research has been reported in the literature to validate SS algorithms using SDR-based setups, particularly focusing on well-known implementations of the ED [12,15,16] and cyclostationary feature detectors [17]. Building upon such foundational studies, the present contribution offers a comparative performance analysis of eigenvalue-based detection schemes, including the GLRT, the RLRT and the ERD, alongside the classical ED, using both simulated and experimentally collected datasets. The experimental framework, designed around a USRP-based receiver, facilitates reproducible real-world testing while capturing the stochastic nature of wireless propagation and hardware-induced imperfections.
From an analytical perspective, the statistical performance of the above detectors has been rigorously studied under various assumptions regarding the number of antennas, observation samples, and channel conditions. Random Matrix Theory has emerged as a powerful instrument for deriving closed-form or asymptotic characterizations of key performance indicators, notably the probabilities of false alarm and detection. These analyses typically fall into two complementary regimes. The first corresponds to the finite-sample setting (see, e.g., [18][and references therein]), where both the number of antennas and the number of time-domain snapshots are limited, allowing for exact, but often cumbersome, derivations. The second regime considers the large-system limit [19], in which the number of sensors and samples grows simultaneously while maintaining a constant ratio. This asymptotic framework provides insightful scaling laws and compact expressions for detection thresholds, offering valuable guidance for system design and parameter tuning.
Both the finite-sized as well as the asymptotic approaches offer insight into the dependence of sensing performance on the SNR, the number of antennas, and the observation interval length. However, due to its simplicity with respect to the finite sample settings, asymptotic formulations have become an indispensable analytical tool, complementing experimental investigations and serving as the foundation for robust CRN algorithm design. The present study contributes to this ongoing research line by combining theoretical understanding, numerical simulation, and real-world measurements to provide a comprehensive assessment of eigenvalue-based spectrum sensing within a practical multiple-antenna SDR framework.
The work is articulated as follows: Section 2 develops the system model and the sensing schemes description, along with an outline of the corresponding analytical performance computation. Experimental setup and numerical results are reported in Section 4, while Section 5 concludes the work.
Notation: Throughout the paper, we denote vectors and matrices with boldface lowercase and uppercase letters, respectively. A hat on the variable denotes an estimated quantity (either numerically or measurements-based). By we denote the statistical expectation, while , with positive integer N, stands for the unitary group of matrices of size N. denotes the Euclidean norm of a vector, the Frobenius norm of a matrix, while by we denote the trace of a square matrix. For matrices and vectors, indicates the conjugate-transpose. Finally, is the determinant of a square matrix.
2. System Model
We focus on a SS setting, where a receiver equipped with K antennas collects N time samples from each antenna. We denote by the received vector at time , with generic entry denoting the discrete baseband complex sample at the k-th receive antenna.
Under , namely in absence of a primary signal, is a vector of complex Gaussian noise samples with zero mean and variance
where . Under , instead, both primary signal and noise are present, therefore
where is the transmitted signal sample, modeled without loss of generality as Gaussian distributed with zero mean and variance , while is the unknown complex channel vector, affected by Rayleigh flat fading. The channel is assumed to be memoryless, and constant during the detection time, i.e., block fading is assumed. Under , we define the Signal-to-Noise Ratio (SNR) at the receiver as
The detector collects the received samples in the matrix
where is a signal vector and is a noise matrix. The sample covariance matrix of the received samples is therefore given by
In our subsequent analysis, we shall make reference to the spectral decomposition of , with denoting the random unitary matrix of the eigenvectors, and the diagonal matrix of the random eigenvalues, whose largest is denoted by , and smallest by , throughout the work.
Crucial to our signal detection task is, in particular, the exploitation of the largest eigenvalue. Indeed, with reference to the scenario where a primary signal is present, and upon defining, for given system parameters, the quantities
and
one can describe a phase transition the largest eigenvalue of undergoes (see [20]), depending on the relative strength of the primary signal, such that, almost surely (a.s.)
3. Spectrum Sensing Schemes and Performance Computation
The test statistic employed by the detector to discriminate between the null hypothesis and the presence of primary signal is denoted by T; to take a decision, the detector compares it against a pre-defined threshold t: if it decides for , otherwise for . As a consequence, the probability of false alarm is defined as
and the detection probability as
Hereinafter, we detail the SS schemes exploited in the experimental setups. The first one, the ED, exploits the difference in energy levels corresponding to the two alternative scenarios of presence vs. absence of primary signal. In turn, the ERD relies on the increased value of the ratio between the largest and the smallest eigenvalue under , w.r.t. . The remaining two schemes are based on classical estimation-theoretic criteria, and depends on the statistical behavior of the largest eigenvalue of the sample covariance matrix of the collected data.
3.1. Energy Detector
The test statistic computes the average energy of the received signal over the N collected samples, normalized by the noise variance , namely
Note that, since, by definition of Frobenius norm, , can be expressed in terms of the spectrum of the sample covariance, as follows
For this test, since the law of the normalized trace can be found, e.g. in [14][Eq.(8)] as
the corresponding can be written as
Receiver Operating Characteristics (ROC) are computed based on both the values of the and the ; while the inversion of (15) leads to a proper threshold setting for performance computation, for eigenvalue-based schemes, as anticipated in the Introduction, there will be the need to resort to an asymptotic approach, to carry on performance analysis.
3.2. ERD
The idea behind the ERD is that the presence of a primary user signal impacts more on the largest eigenvalue of the covariance of the collected samples, than on the corresponding smallest one [6][and references therein].
As a consequence, the test statistic of this sensing scheme is cast as
Therefore, its probability law coincides with that of the so-called standard condition number of the matrix .
While the statistical distribution of (16) for a dual-antenna receiver (i.e. when ) is known since [21], its closed-form expression for arbitrary values of K can be found in [22][Theorem I].
The corresponding false-alarm probability, for a given threshold , can be written as
where
and the matrix has entries
In order to assess the analytical performance of ERD, we resort to an asymptotic approach, where both the number of samples N and the number of receive antennas K are assumed to grow large at the same rate, namely the so-called aspect ratio of the random matrix , say , is a number between 0 and 1 (for our purposes, indeed, ).
Under this assumption, we can exploit convergence results for the extreme eigenvalues of stating that2,
while, in distribution, upon defining the scaling parameters
and
both the random variables
and
converge to a random variable distributed according to a second order Tracy-Widom distribution (TW2), whose Cumulative Distribution Function (CDF) for the Gaussian Unitary Ensemble (GUE) is explicitly given by:
where is the unique solution to the Painlevé II differential equation
satisfying the boundary condition
where denotes the Airy special function, one of the two linearly independent solutions to the following differential equation:
As a consequence of the above analysis, the Probability Density Function (PDF) of can be written as per [6][Eqq.(12)-(13)], relying on proper linear transformations of the law for the involved eigenvalues, namely
and approximating, for the sake of simplicity, the behavior of and as if they were independent random variables, in order to obtain the PDF and, therefore, the CDF of , say .
Indeed, the PDF of , say , can be obtained, due to the approximation above, via [6][Eq.(14)]
with the indicator function of the inner interval. As a consequence of the above computation, threshold setting for ERD is performed upon computing .
3.3. GLRT
In case of GLRT-based SS, the test statistic, derived applying the GLR criterion to our detection problem, reads as
Its analytical characterization turns out to be challenging; however, even though the correlation between and the normalized trace at the denominator of (31) is intractable, as observed in [23], (31) and (13) are statistically independent. Therefore, the computation of an exact expression for both the PDF as well as the CDF for finite values of K and N has been provided in [14,24] (a thorough analysis of the literature in the asymptotic case can be found, e.g. in [10,25].). With reference to [14][(14)], the false alarm probability of the GLRT corresponding to a threshold can be expressed as
where
and the expressions of the ’s are reported in the Appendix A. Under , the finite-sample statistical analysis of the GLRT can be performed exploiting the results from [26], where the random variable is characterized. This is subject of ongoing work. The setting of the threshold for GLRT is discussed later, after the introduction of the last sensing scheme, namely the RLRT, since they both are affected by the phase transition phenomenon, impacting signal detectability.
3.4. RLRT
Roy’s test exploits as test statistics the largest eigenvalue of the sample covariance, normalized by the noise variance. Since, therefore,
can be immediately computed, for this sensing scheme, as
with as in (18), and where
Let us recall that, under , the CDF of is provided in [27][Corollary 2], while, under , it assumes the expression derived in [28].
As former discussed, a phase transition threshold exists for identifiability of a signal with RLRT or GRLT, which can take place only if
After phase transition, i.e. in case signals are actually identifiable, the scaled and normalized largest eigenvalue converges in distribution to a standard real Gaussian random variable [29], i.e.
In the remainder of the Section, for ease of notation, we drop the dependence on and in both the expressions of and .
As a consequence of the recalled convergence results for the largest eigenvalue, it turns out that an approximate expression for the threshold of RLRT, for a given tolerated false-alarme rate of , is
where is the inverse of the TW2 CDF (24). We also remark that, for single signal detection, the presence of a phase transition phenomenon for detectability under the alternate hypothesis can be explicitly formulated in terms of a critical detection threshold, depending on the SNR as
As to the GLRT, an effective approximation for its can be found in [19]:
an equation that can be numerically inverted in efficient way, to find the required threshold .
4. Experimental Setup and Numerical Results
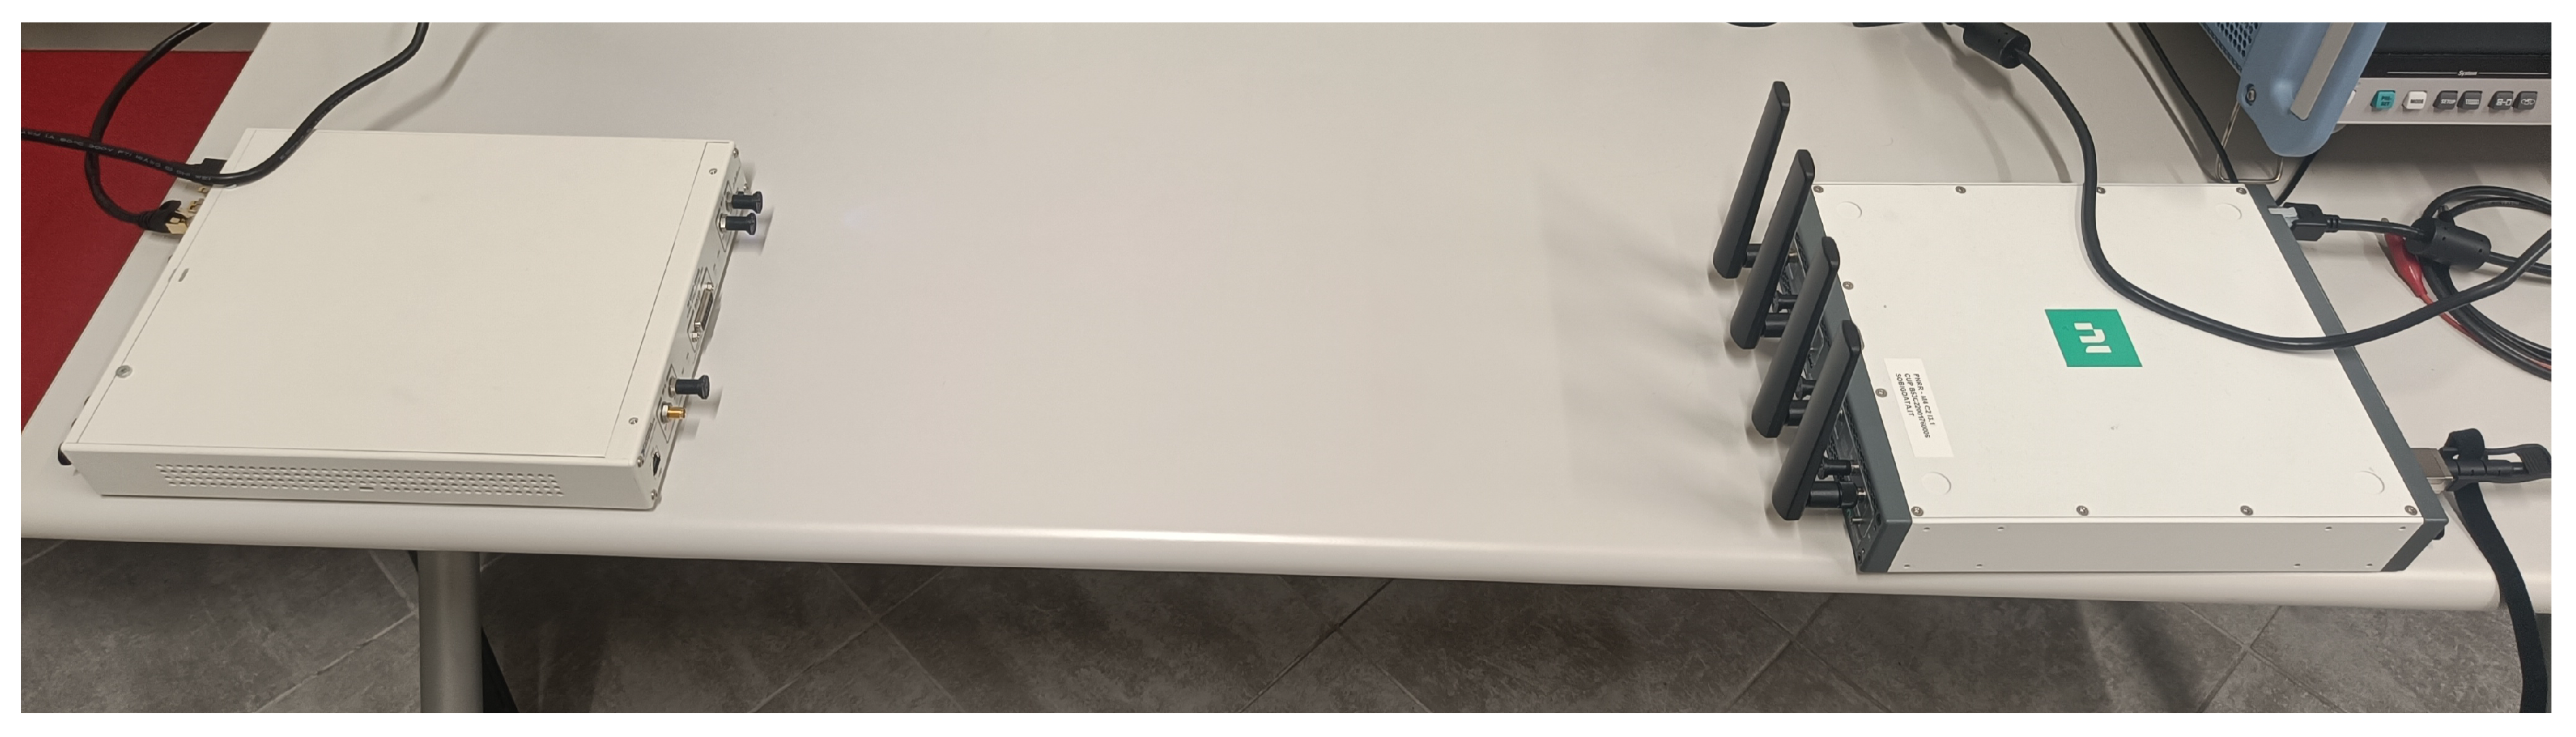
Figure 1 and Figure 2 show the SDR experimental setup in which the multi-antenna SS algorithms have been tested and validated through over-the-air signal transmission and acquisition, and subsequent data processing and performance evaluation. The setup is composed of three main components:
- a host computer, the SiComputer Extrema Workstations W200, equipped with CPU Intel Core i9-14900K, 3200 MHz and 24 cores, 64 GB DDR4 RAM, and a Mellanox ConnectX-5 100 Gbps Ethernet adapter. The installed SDR software is MATLAB R2024b together with the Wireless Testbench support package for NI USRP radios.
- Ettus Research USRP X310, equipped with a Xilinx Kintex-7 FPGA, 2 independent TX/RX channels, able to stream up to 200 MSamples/s per channel. The USRP X310 is used as single antenna transmitter and is connected to to the workstation through a 10 Gbps Ethernet adapter. Notice that there is no external antenna connected to the transmitter, in order to obtain sufficiently low SNR levels, suitable to test the SS schemes at hand.
- NI Ettus USRP X410, equipped with a Xilinx Zynq Ultrascale+ ZU28DR RF System on Chip (RFSoC), 4 independent TX/RX channel, able to stream up to 250 MSamples/s per channel. The USRP X410 is used as multi-antenna receiver and is connected to the workstation through the QSFP28 interface to the 100 Gbps Ethernet adapter.
In order to assess the performance of RLRT, GRLT, ERD and ED SS schemes, we assumed as primary user signal a single carrier QPSK modulated signal at carrier frequency GHz with a baud rate of 1 MBd/s. We used 4 samples per symbol, therefore the USRPs radio have been set to a sample rate Msamples/s. The narrowband choice for the primary signal has been made to ensure a flat fading channel. Given the 4 channels of the USRP X410, , while we performed the experiment for both and samples.
Thresholds have been previously computed for several values of and stored offline in a lookup table. While for ED, it is quite straightforward, for RLRT we used Momar Dieng’s MATLAB package “RMLab” [31] which provides the CDF of the TW2 distribution, we computed the centering and scaling parameters as in (20) and (22), and then we used the bisection method to retrieve the correct threshold value for any input . For ERD, we first used the same “RMLab” package to compute the scaled and centered PDFs and of the TW2 distribution as defined in (28) and (29), respectively, for different values of t; secondly, we obtained the PDF of ERD as in (30) by means of numerical integration for each value of t; lastly, we obtained the CDF of ERD by numerically integrating the pdf and we used once more the bisection method to retrieve the correct threshold value for any input . Finally, for GLRT we used the routines in [19], which provides the inverted modified distribution of (39).
The SDR experiment could be summarized into 3 phases:
- 1.
- Noise variance estimation under : in this phase, no transmission occurs and the USRP X410 aquires samples over its 4 channels for a total duration of s. Under null hypothesis, the Maximum Likelihood estimation of the noise variance can be written as:
- 2.
- Primary user signal transmission and multi-antenna acquisition under : the USRP X310 is set up to continuously transmit the QPSK modulated signal, and simultaneously the USRP X410 acquires samples under again for s. We can estimate the SNR at the receiver as:
- 3.
- Performance evaluation and comparison with simulated data: in the last phase, we process the acquired samples into slots of N samples, and we compute the RLRT, ERD, GLRT, and ED test statistics. The results are generated through error counting by means of ROC curves for a specific SNR value, and by means of vs. SNR curve for a specific value. In particular, for fixed , the points of each curve are obtained, from the experimental setup by progressively increasing the transmit gain of dB at each step, and repeating the procedure detailed in these three steps. Experimental results are compared against simulated ones, i.e., we perform a parallel Monte Carlo simulation by generating Gaussian samples with signal variance and we apply the same test statistics and metrics evaluation.
ROC curves, for and , are reported in Figure 3 and, respectively, in Figure 6 for all the considered schemes. Nonidealities in the experimental setup (such as interference during noise estimation, uneven noise floor levels among the 4 antennas, quantization noise, etc.) clearly impact on the corresponding performance, which results poorer than the simulated counterparts. As expected, RLRT outperforms all the other schemes, i.e., GLRT, which has no prior knowledge of the noise variance, and ERD, which suffers from high noise sensitivity. Another relevant issue affecting ERD is the underestimation of the denominator, with respect to the case of test statistics based on estimation-theoretic criteria, such as the best performing RLRT, and the GLRT as well.
Figure 3.
ROC curve, , , dB.
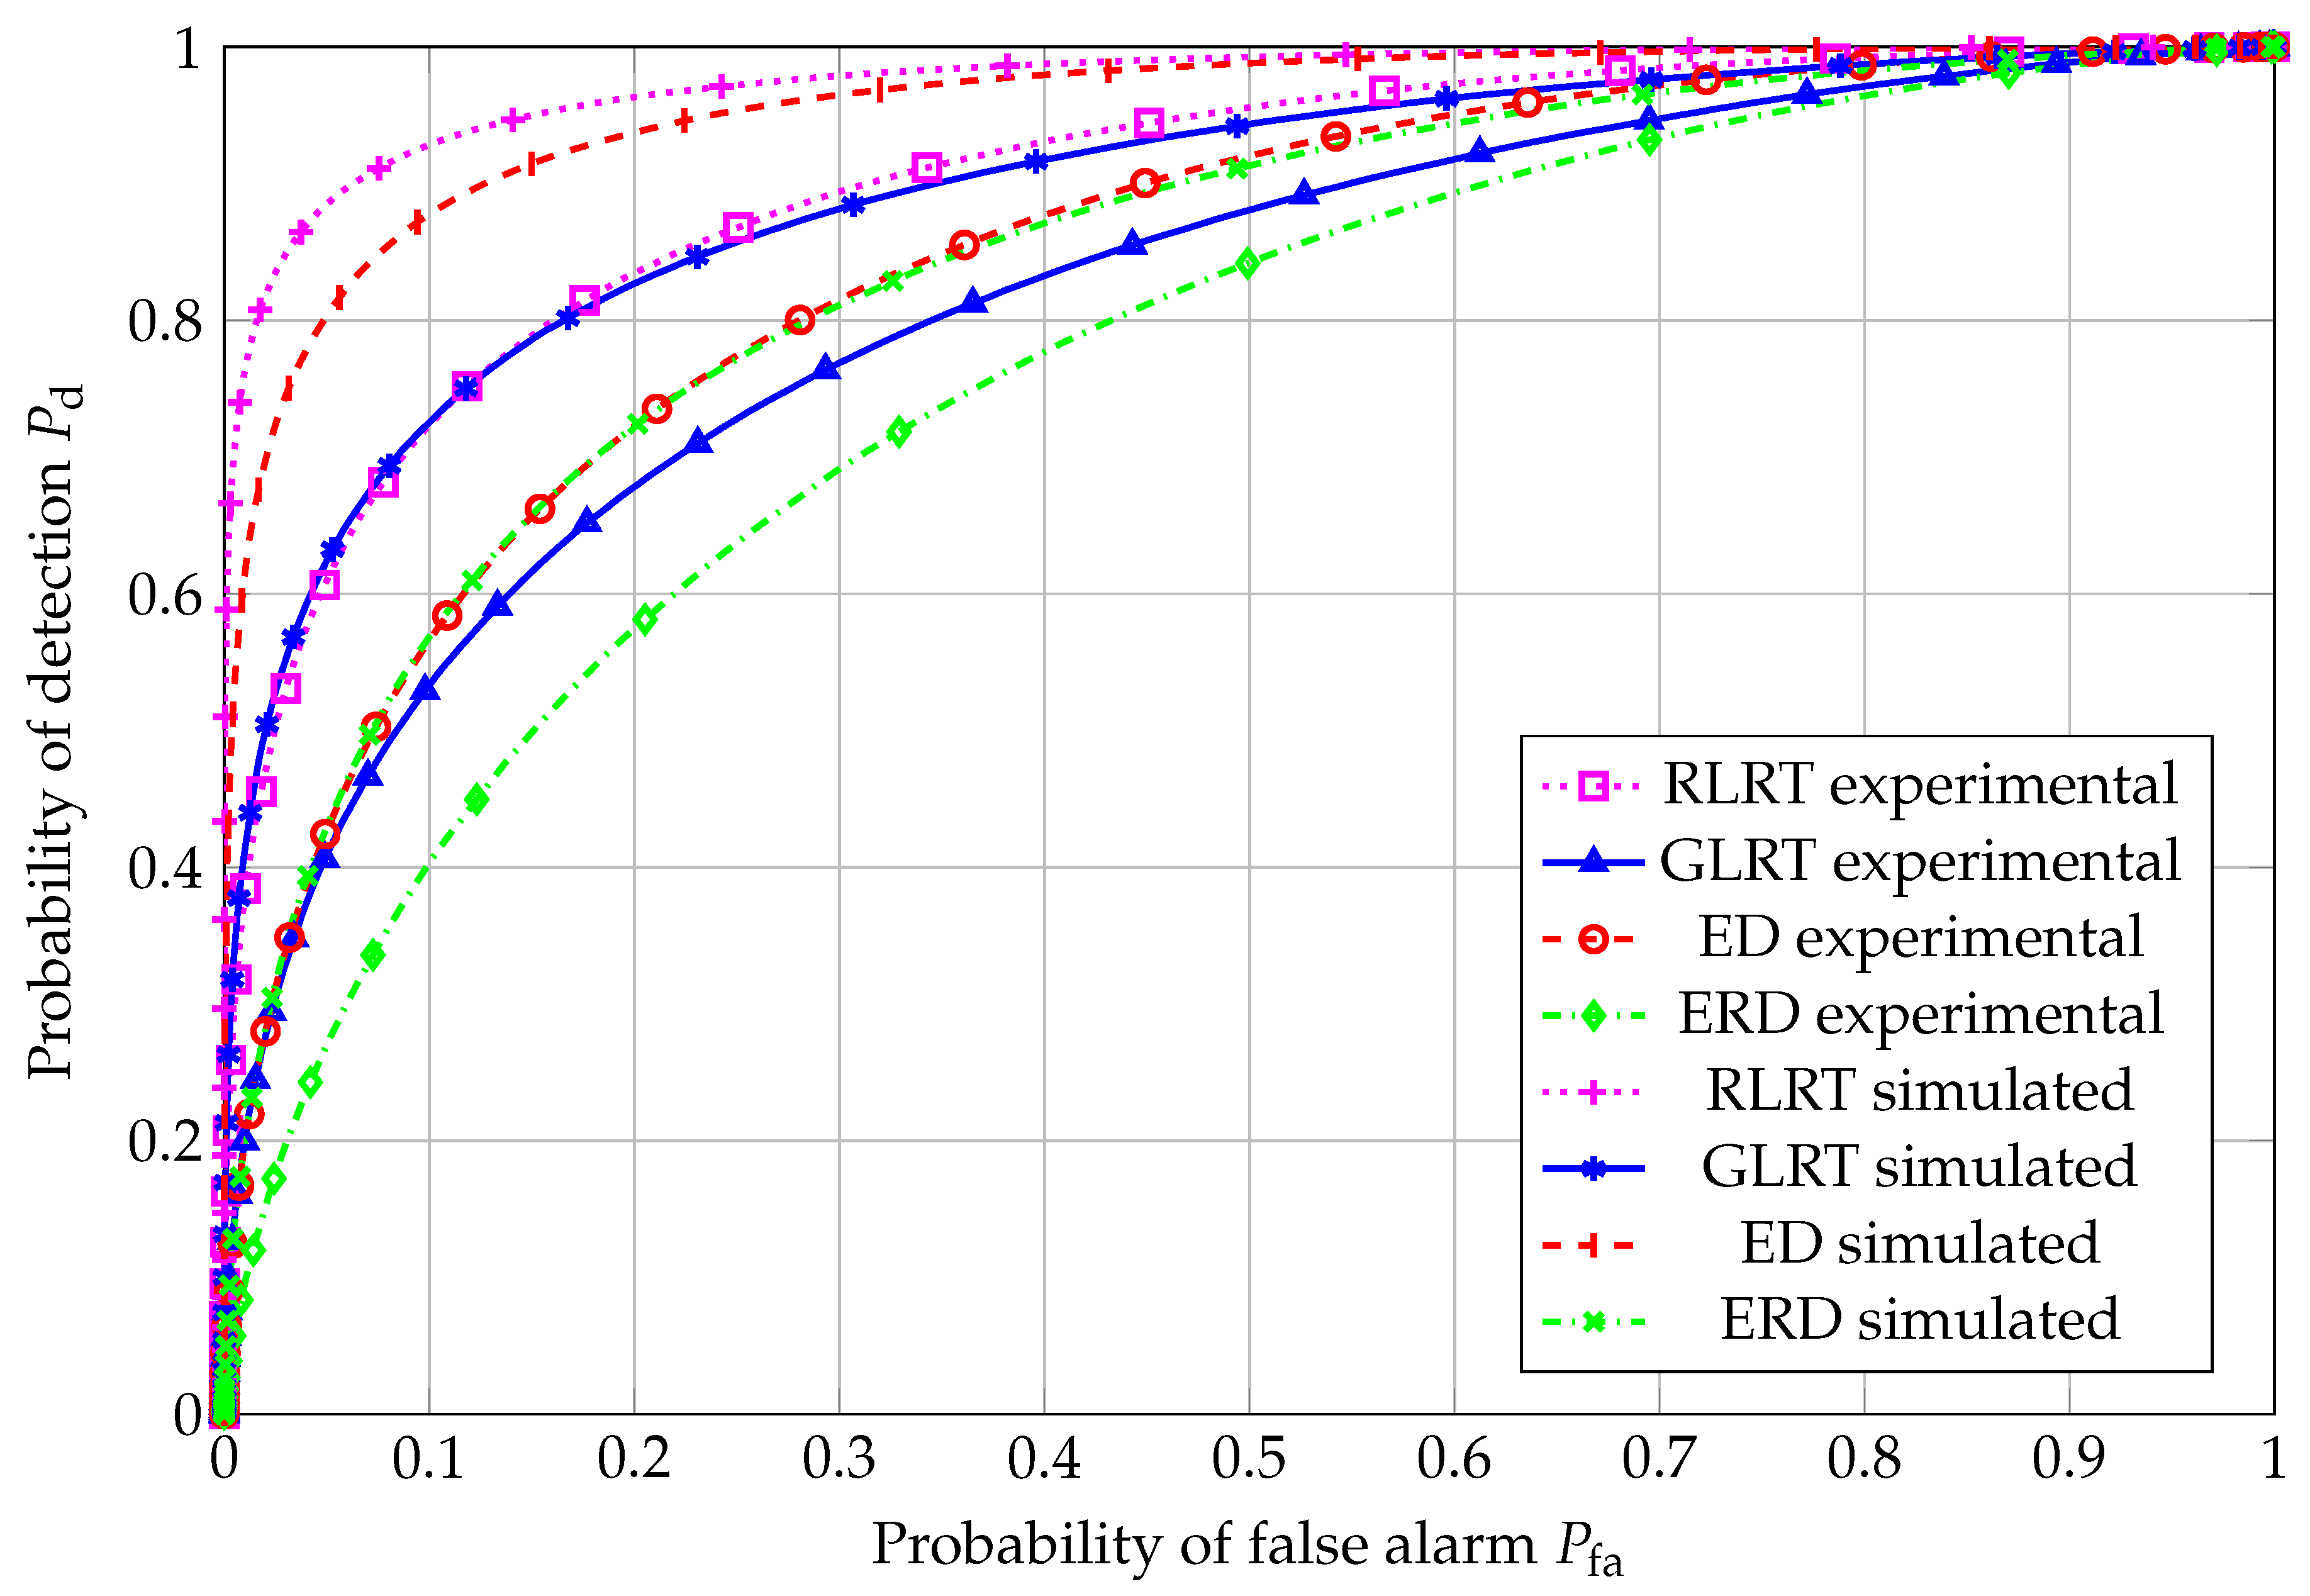
Figure 4.
vs. SNR, , , .
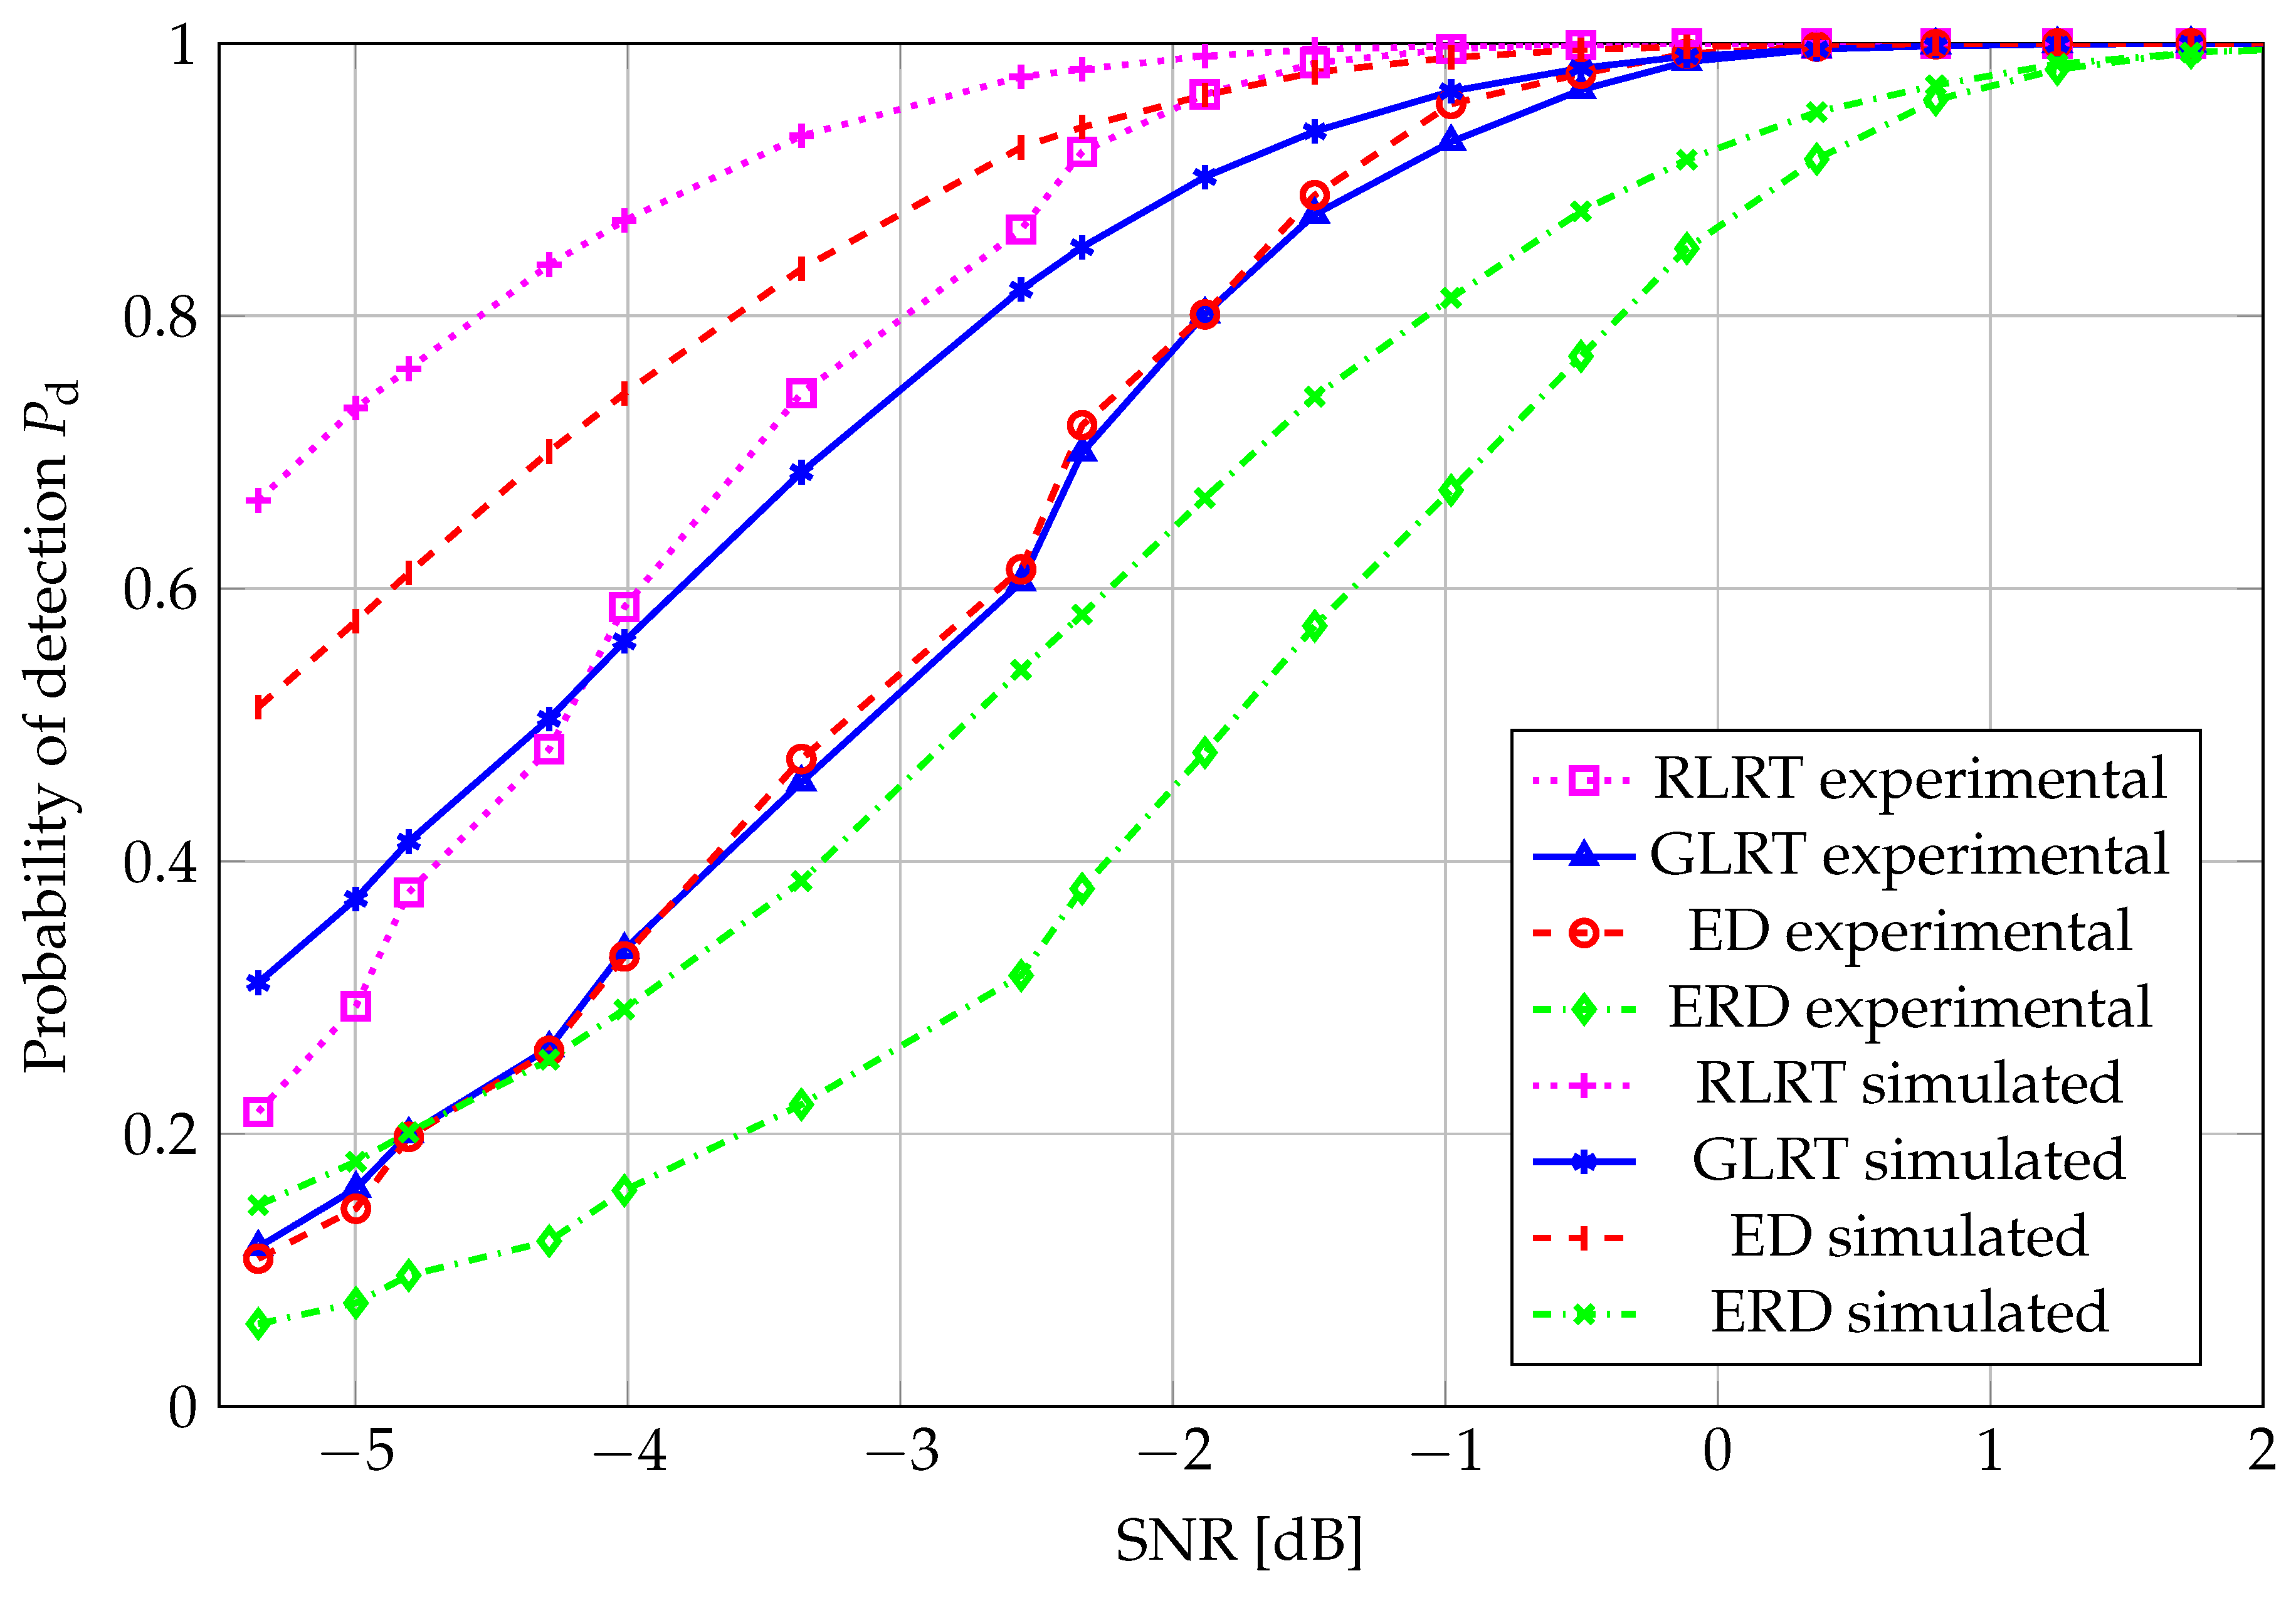
Figure 5.
vs. SNR, , , .
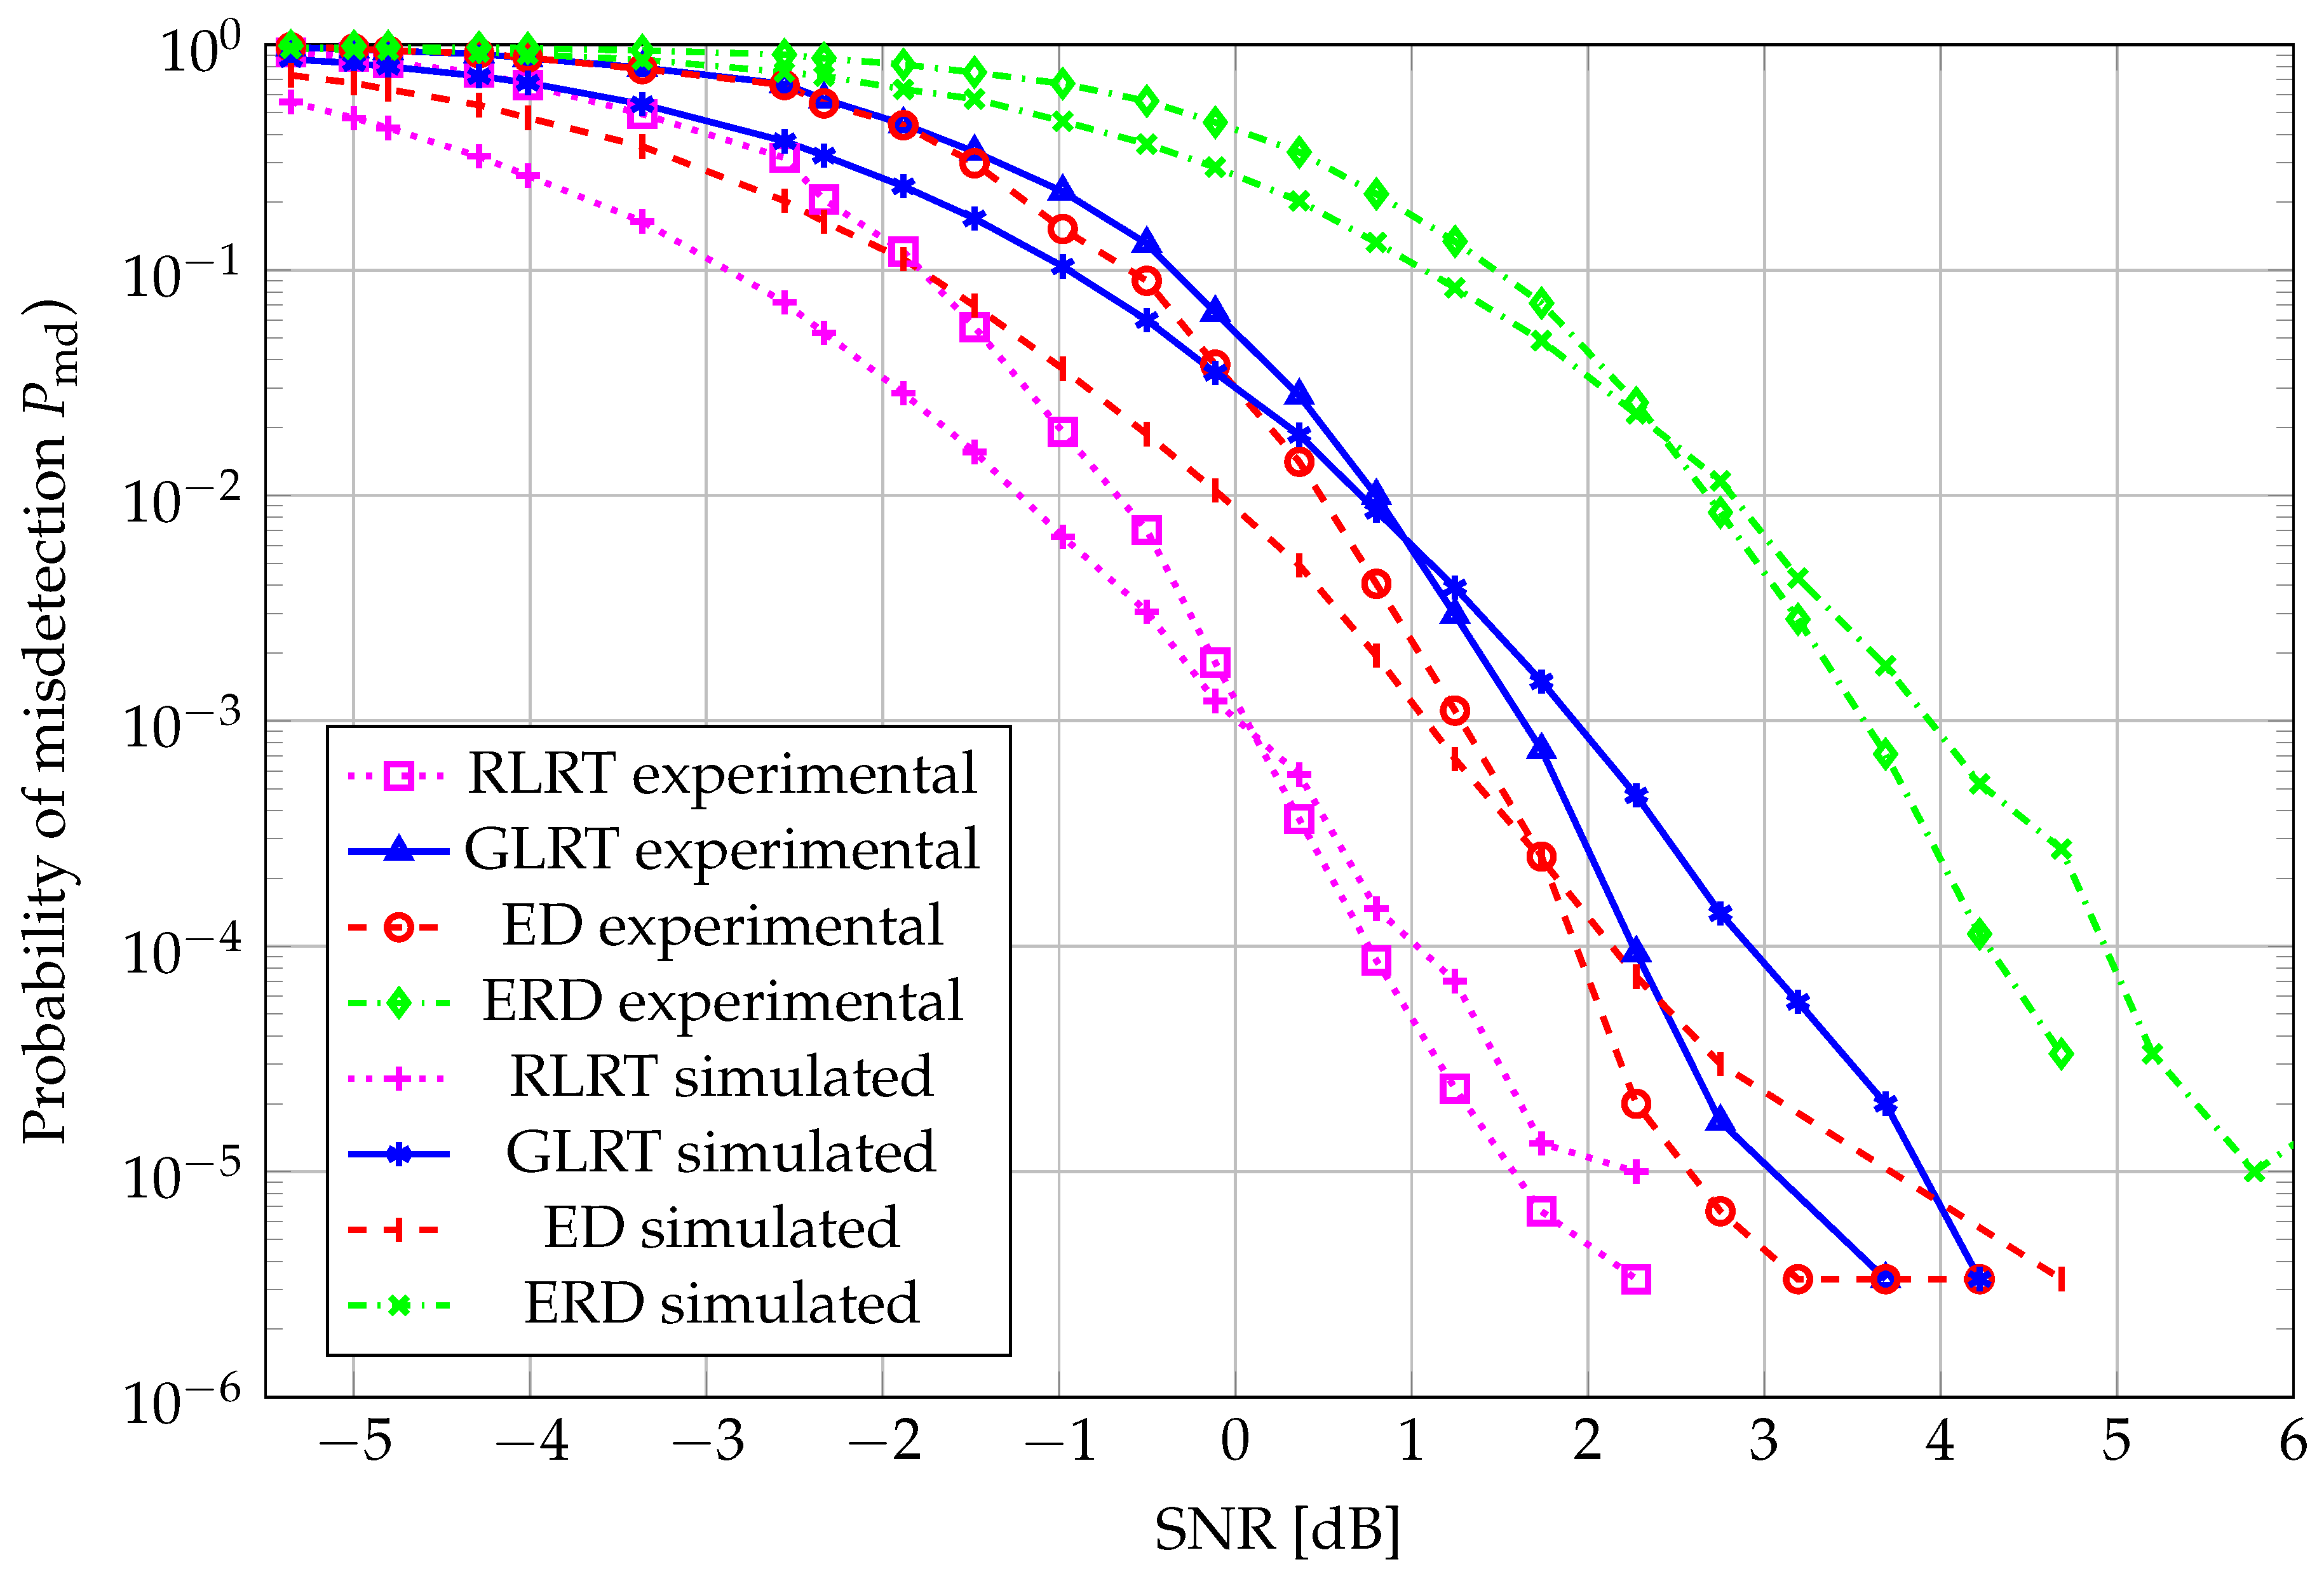
Figure 6.
ROC curve, , , dB.
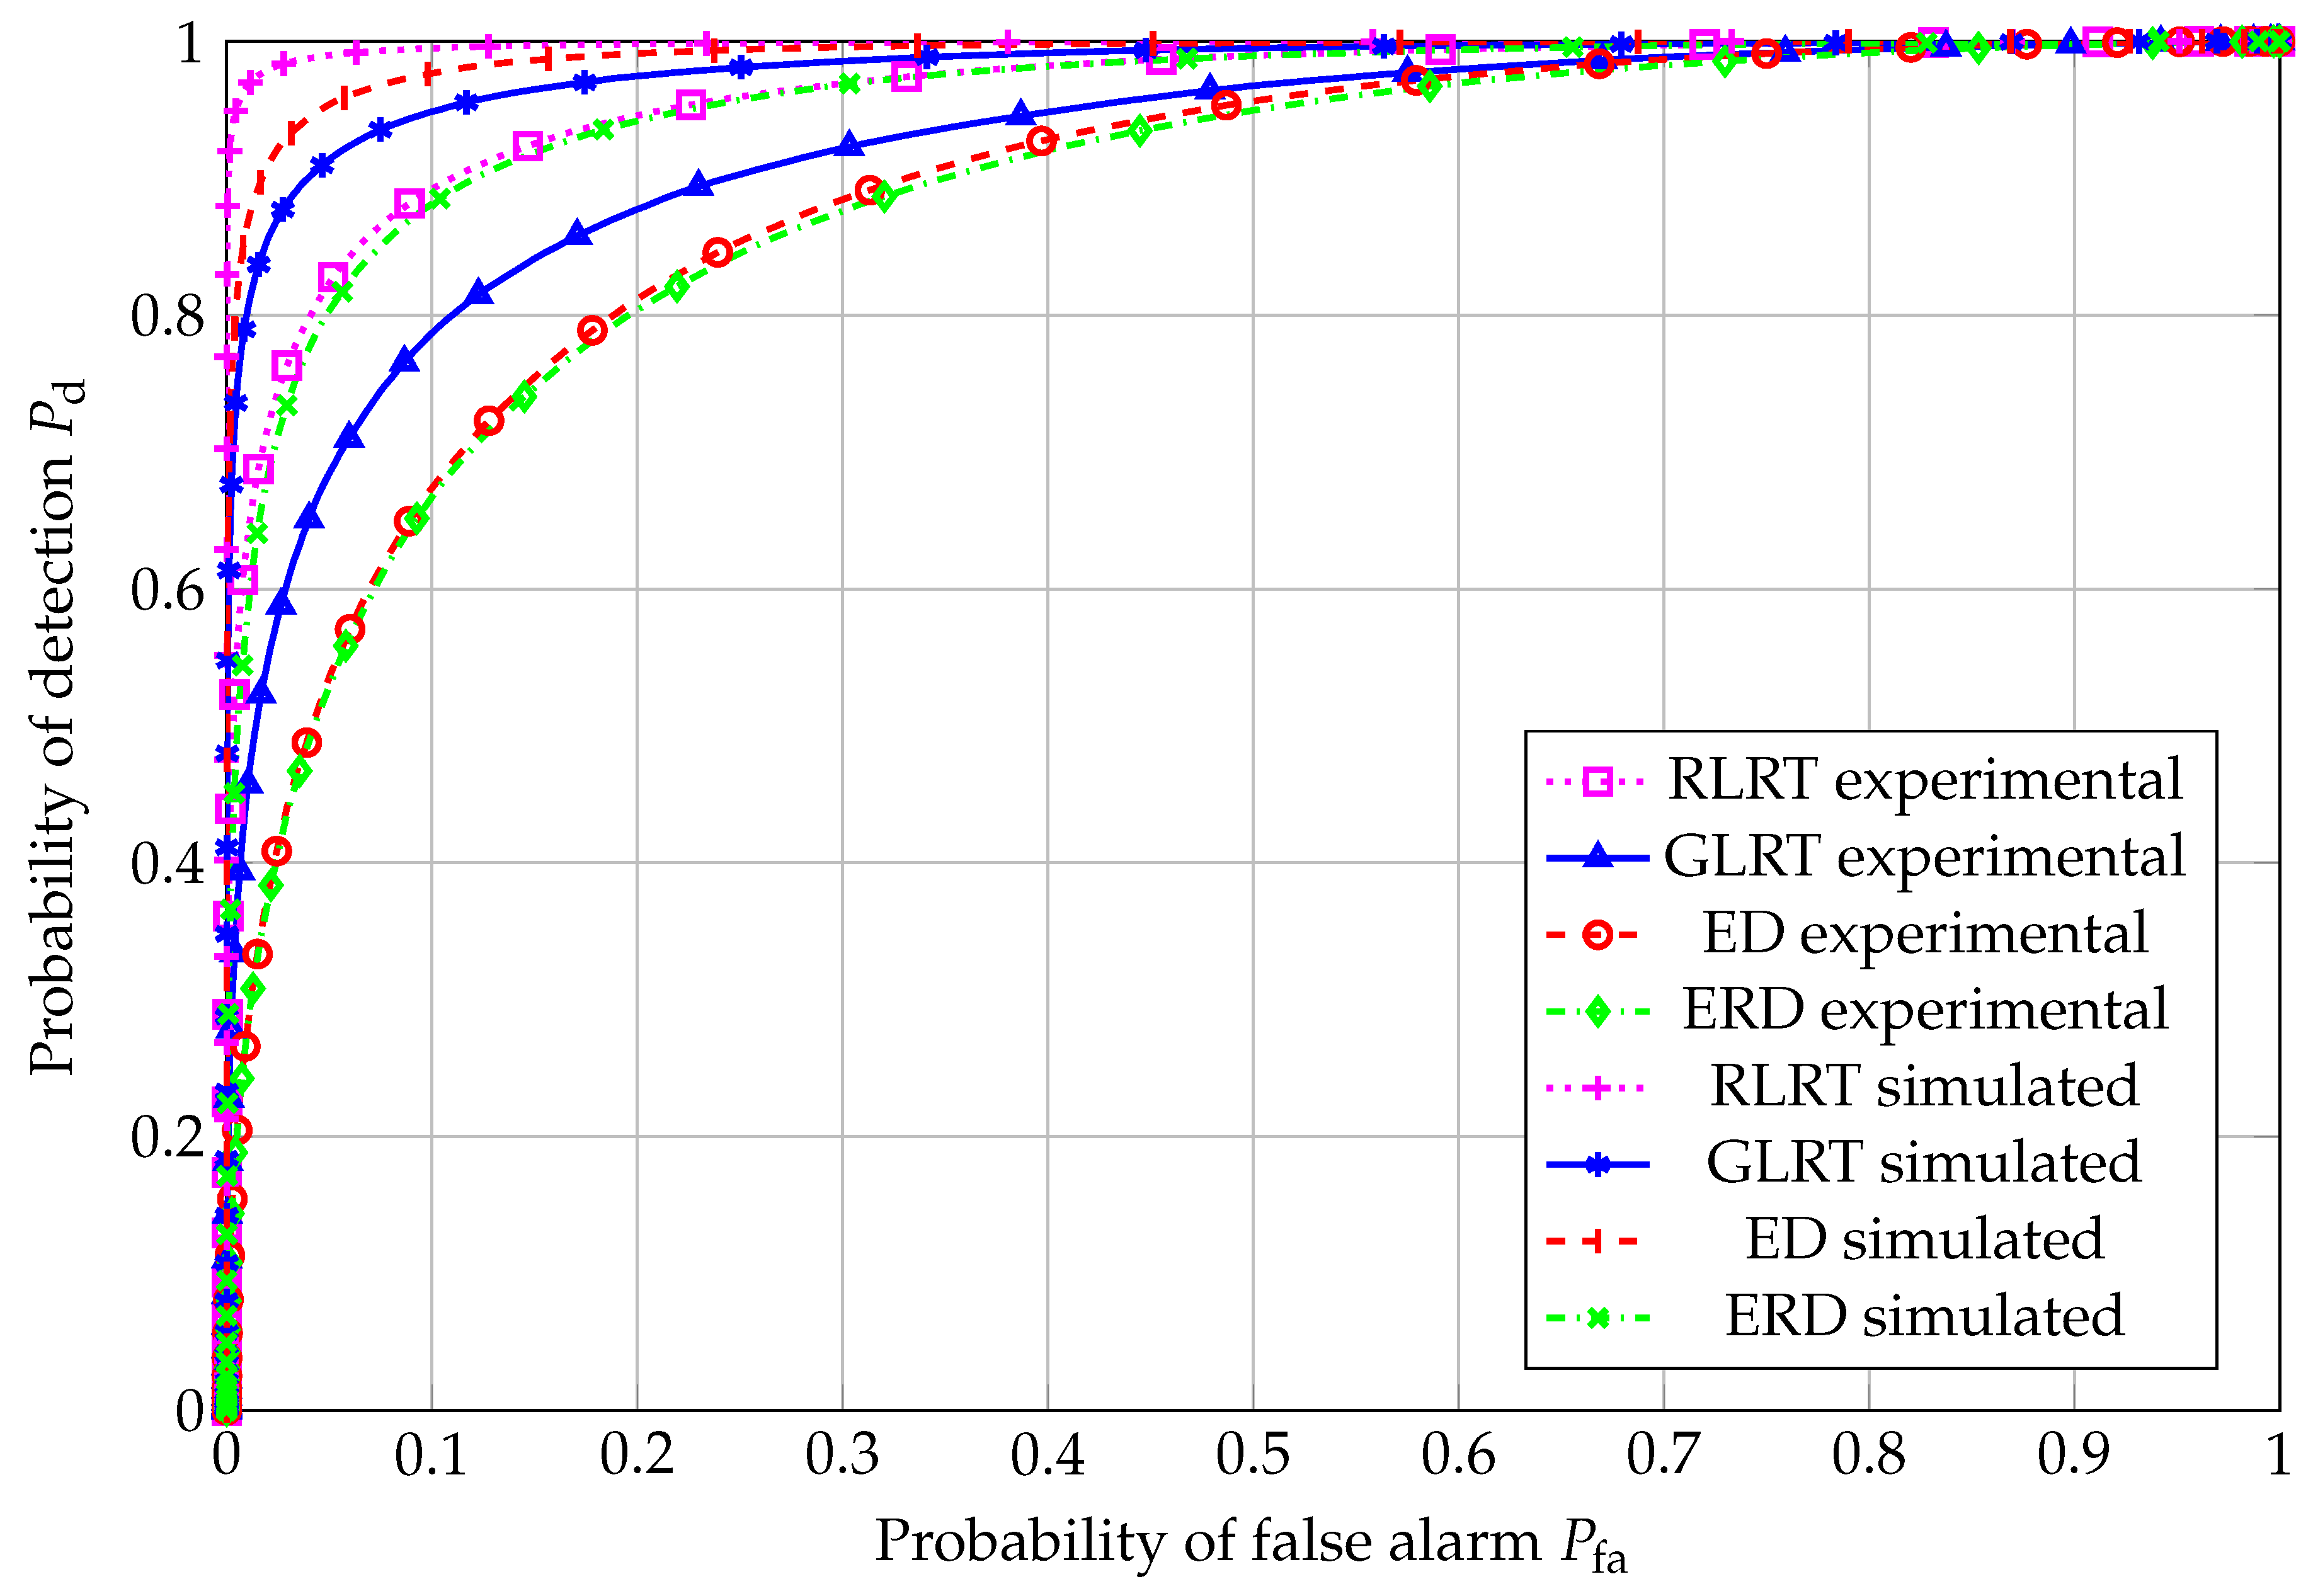
Figure 7.
vs. SNR, , , .
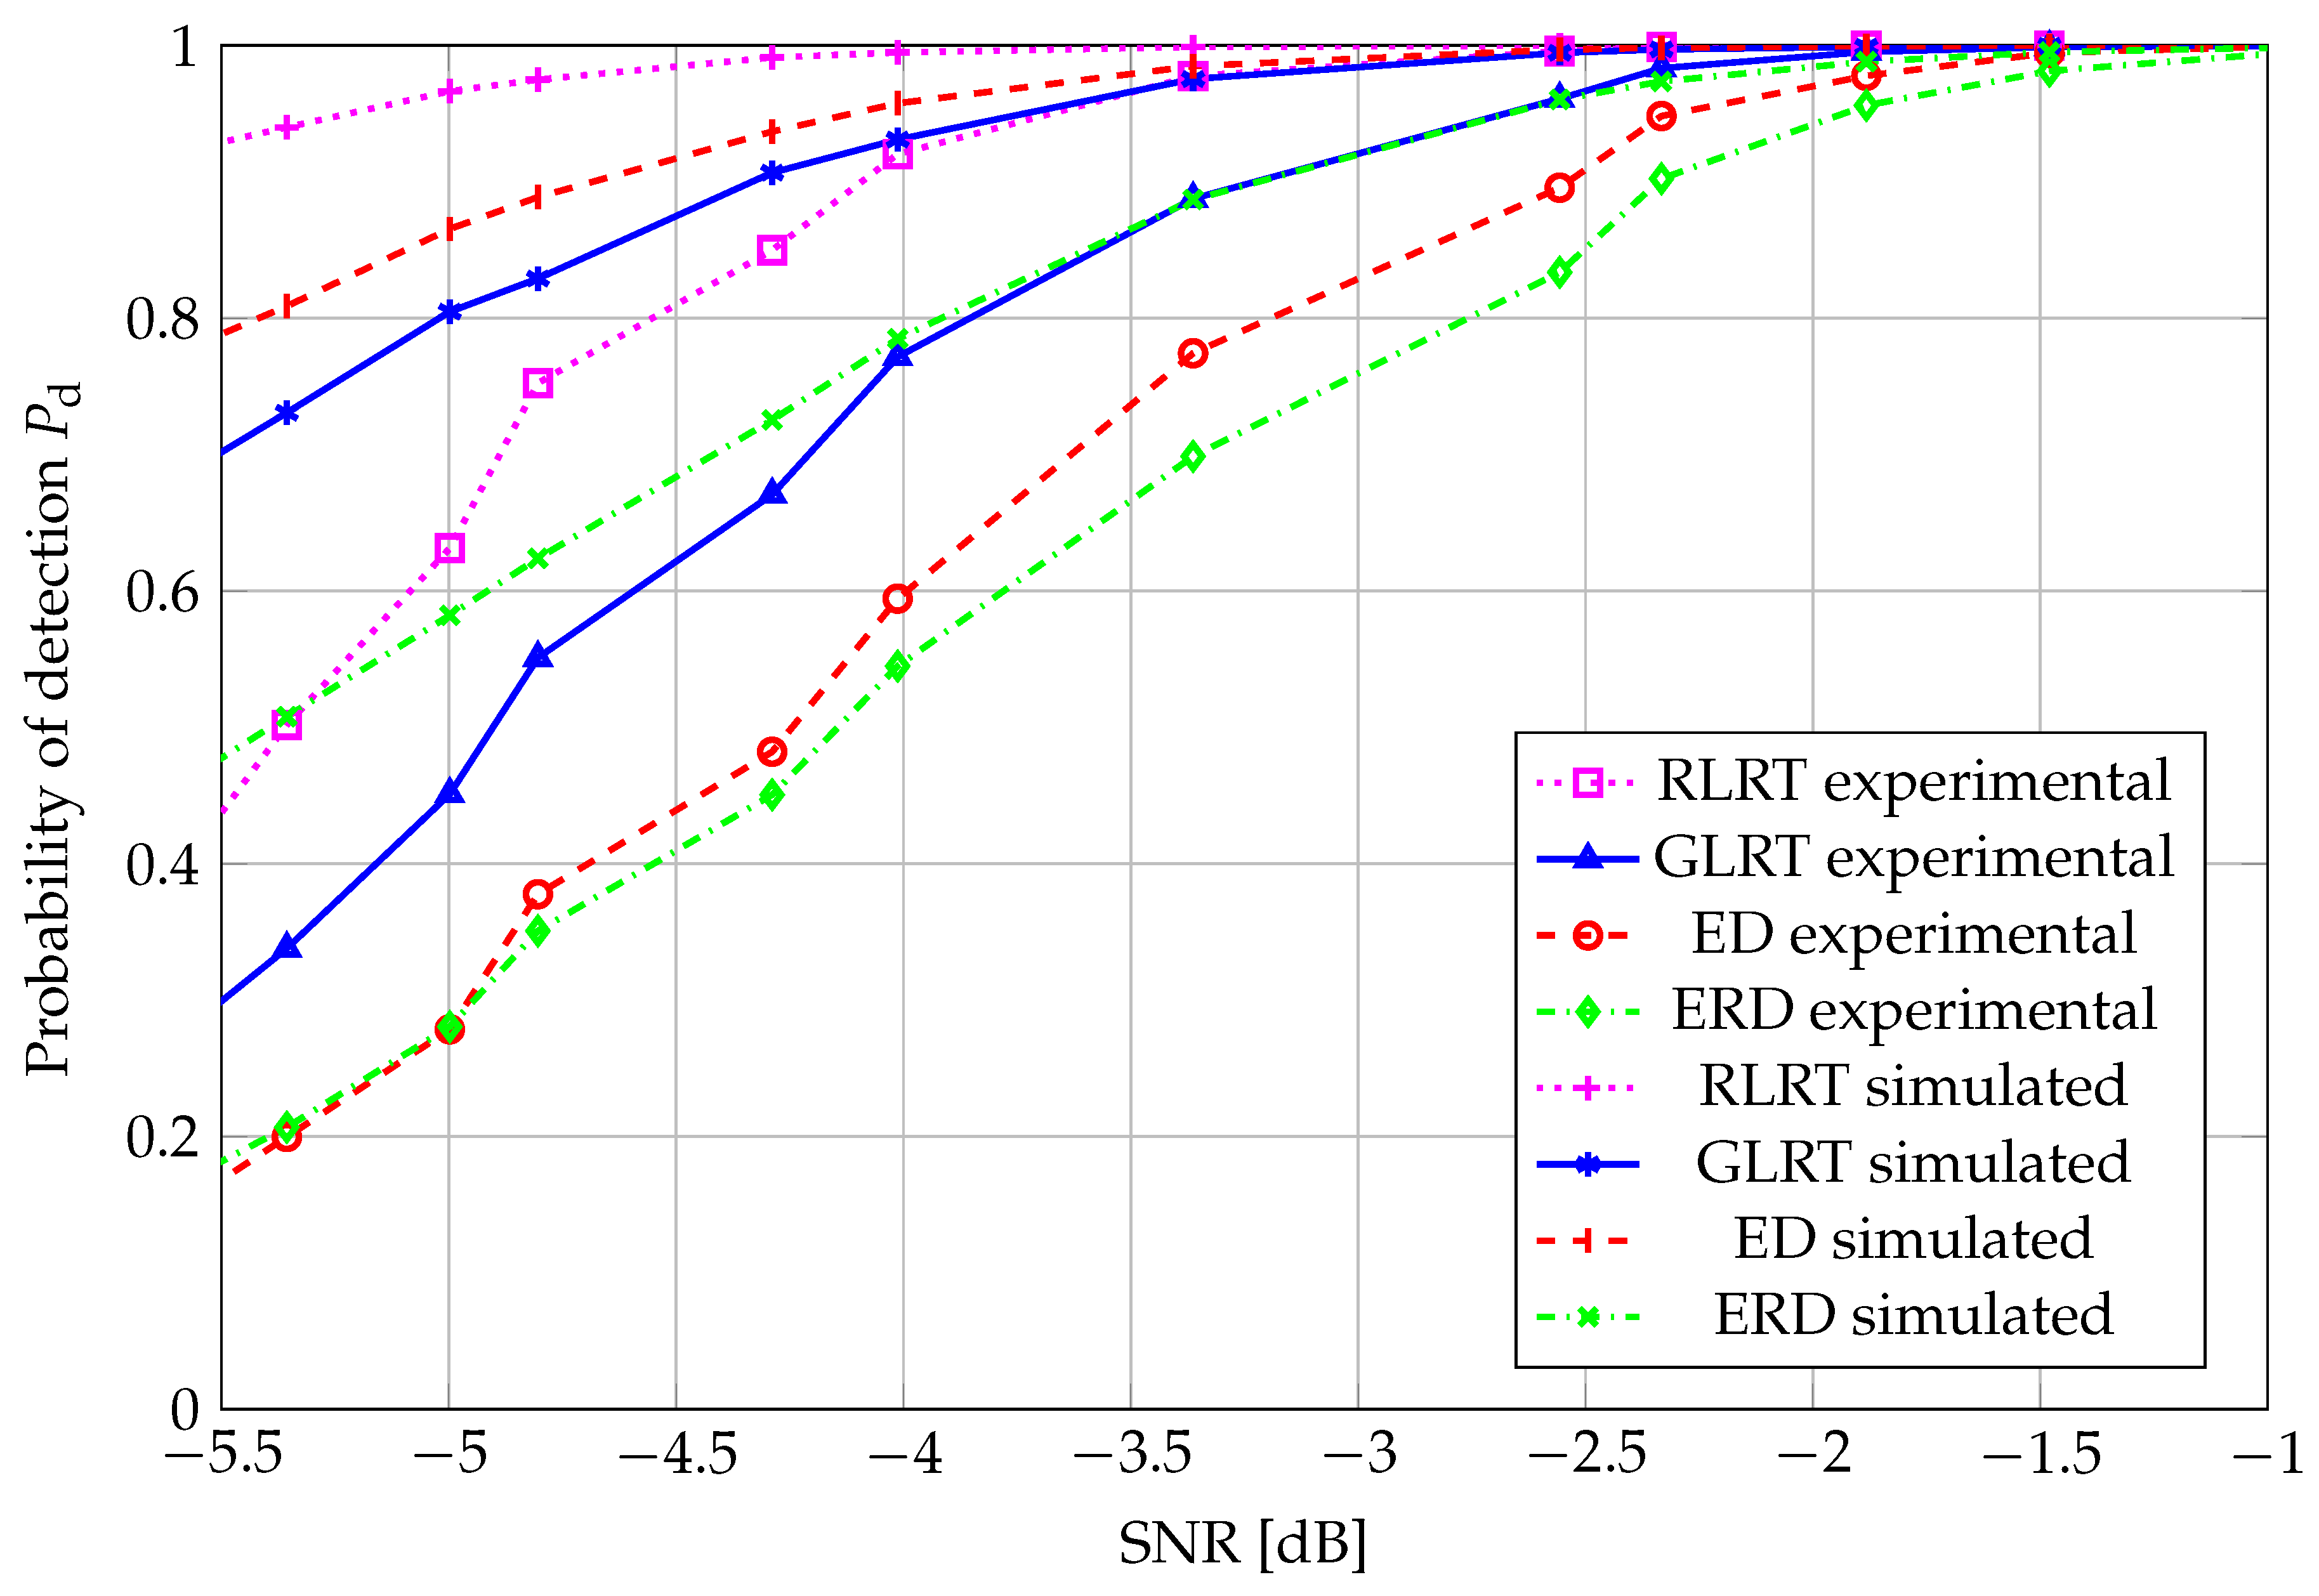
Figure 8.
vs. SNR, , , .
The performance curves representing the behavior of the detection probability vs. SNR, at a target false-alarm probability of , are drawn in Figure 4, referring to the case of , and, respectively, in Figure 7 for . A very similar behavior of all tests as in Figure 3 and Figure 6 can be observed, as performance ranking among the analyzed algorithms is retained.
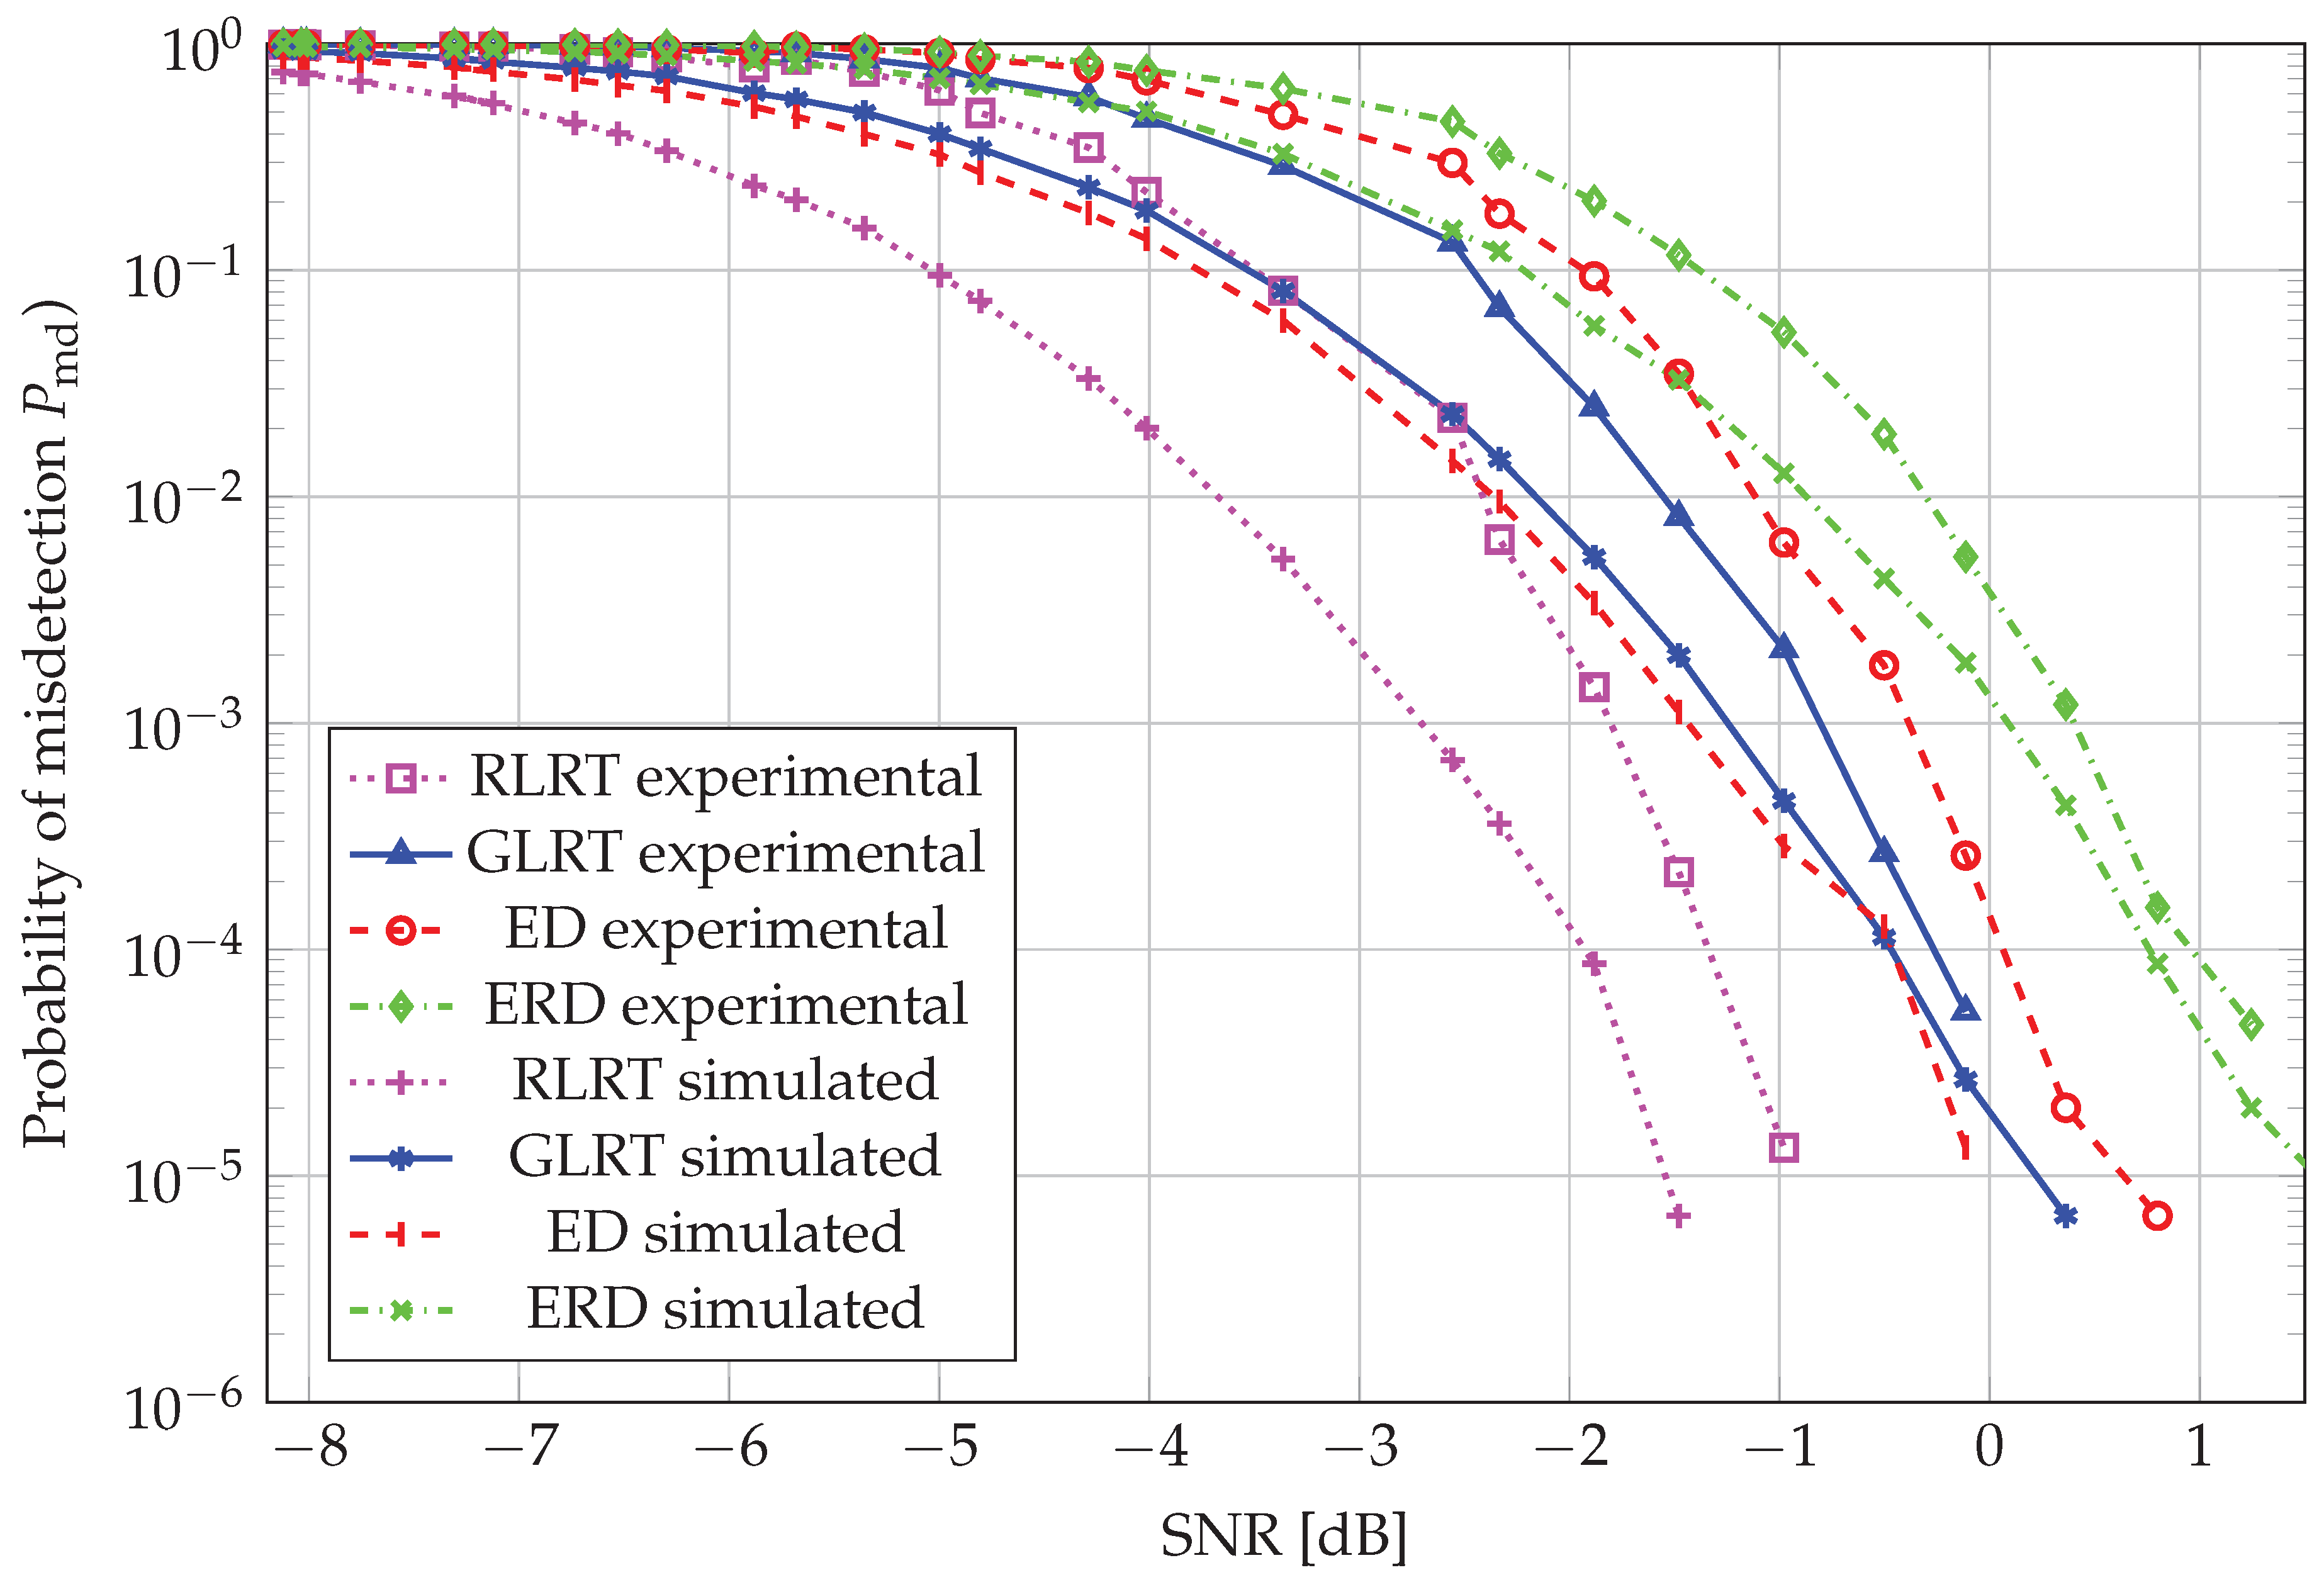
A complementary perspective, i.e. the misdetection probability () vs. SNR, with , is reported in Figure 5 and Figure 8, wherein performance ranking is fully retained for , whereas, for , curves do not harden to the already observed behavior on the whole SNR range, due to the highly demanding target false alarm, combined with the processing of a smaller number of samples. However, RLRT still outperforms the remaining schemes, and ERD offers poorest performance also in this case.
Overall, the experimental test statistics, with data acquired through SDR platforms, require approximately 0.5-1 dB more to achieve the same performance of the corresponding simulated ones.
5. Conclusion
An SDR-based experimental setup has been developed to evaluate the performance of multi-antenna SS algorithms under realistic conditions. In this framework, a secondary user terminal equipped with receive antennas was employed to collect measurement data. The acquired signals were processed to estimate the false-alarm and detection probabilities associated with four SS scheme, namely ED, ERD, GLRT, and RLRT. A thorough review of the mathematical literature has been carried out, to individuate, whenever available, explicit expressions for the false-alarm performance of each considered scheme, both in the finite-size as well as in an asymptotic regime where the number of collected samples and that of receiving sensors tend both to infinity at the same rate. On top of that, an explicit characterization for the GLRT test statistics in the case of four-sensor equipped receiver is provided. The measurement-based performance curves were then compared with the results obtained from numerical simulations. The comparison demonstrates a very close match between experimental and simulated data, confirming the reliability of the proposed setup and the validity of the adopted simulation models.
Author Contributions
All authors have contributed equally. All authors have read and agreed to the published version of the manuscript.
Funding
The work of Daniel Gaetano Riviello was partially supported by the European Union—NextGenerationEU—National Recovery and Resilience Plan (Piano Nazionale di Ripresa e Resilienza, PNRR) through the Project: “SoBigData.it—Strengthening the Italian RI for Social Mining and Big Data Analytics”, under Grant Prot. IR0000013—Avviso n. 3264 del 28/12/2021. The work of G. Alfano has been funded by the European Union—NextGenerationEU under the project NRRP RESTART, RESearch and innovation on future Telecommunications systems and networks, to make Italy more smART PE 00000001—Cascade Call SMART project, with CUP E63C22002040007.
Institutional Review Board Statement
Not applicable.
Informed Consent Statement
Not applicable.
Data Availability Statement
The data that support the findings of this study are available from the first author, D.G.R., upon reasonable request.
Conflicts of Interest
The authors declare no conflicts of interest.
Appendix A
For any positive integer m, let us define the polynomial [14][(29)]
and recall the expression of the normalizing constant, corresponding to the case of our interest, namely
In [14], the suggested roadmap to obtain the explicit expression of the coefficients of interest requires to expand first all products of polynomials appearing in (A3); otherwise stated, products of polynomials of type
with , are to be simplified with the help of [14][(34)]:
Collecting all coefficients for each term of the type , , and applying the identity principle of polynomials to the newly grouped coefficients and to the expression [14][(6)], it turns out that the required value of the ’s in (32), for and all the corresponding values of j, is given by the coefficient of in the polynomial simplified according to (A3).
We remark that this procedure works only for . For lower values of K, fully explicit expressions of the ’s are reported in [14][(23-26)], wherein the procedure to obtain the expressions for is also outlined, without identifying the degree of the coefficients to take into account to finalize the computation.
References
- J. Mitola and G. Q. Maguire, “Cognitive radio: making software radios more personal”, IEEE Personal Communications, vol. 6, no. 4, pp. 13–18, Aug. 1999, doi: 10.1109/98.788210.
- A. Ivanov, K. Tonchev, V. Poulkov, and A. Manolova, “Probabilistic spectrum sensing based on feature detection for 6G cognitive radio: a survey,” IEEE Access, vol. 9, pp. 116994–117026, Aug. 2021. [CrossRef]
- A. Kortun, T. Ratnarajah, M. Sellathurai, C. Zhong, and C. B. Papadias, “On the performance of eigenvalue-based cooperative spectrum sensing for cognitive radio,” IEEE Journal on Selected Topics Signal Processing, vol. 5, no. 1, pp. 49–55, Feb. 2011. [CrossRef]
- P. Salvo Rossi, D. Ciuonzo, and G. Romano, “Orthogonality and Cooperation in Collaborative Spectrum Sensing through MIMO Decision Fusion,” IEEE Transactions on Wireless Communications, vol. 12, no. 11, pp. 118–125, Nov. 2013. [CrossRef]
- Y. Li, W. Zhang, C.-X. Wang, J. Sun, and Y. Liu, “Deep reinforcement learning for dynamic spectrum sensing and aggregation in multi-channel wireless networks,” IEEE Transactions on Cognitive Communications and Networking , vol. 6, no. 2, pp. 464–475, June 2020. [CrossRef]
- F. Penna, R. Garello, and M. A. Spirito, “Cooperative Spectrum Sensing based on the Limiting Eigenvalue Ratio Distribution in Wishart Matrices,” IEEE Communications Letters, vol. 13, no. 7, pp. 507–509, July 2009. [CrossRef]
- F. Penna, R. Garello and M. A. Spirito, “Probability of Missed Detection in Eigenvalue Ratio Spectrum Sensing,” 2009 IEEE International Conference on Wireless and Mobile Computing, Networking and Communications, Marrakech, Morocco, 2009, pp. 117–122. [CrossRef]
- L. Wei, and O. Trikkonenn, “Spectrum Sensing in the Presence of Multiple Primary Users,” IEEE Transactions on Communications , vol. 60, no. 5, pp. 1268–1277, March 2012. [CrossRef]
- G. Alfano, D. G. Riviello and R. Garello, “Quadratic Form-Based Spectrum Sensing Algorithm for 6G Cognitive Radio Networks,” 2025 IEEE Wireless Communications and Networking Conference (WCNC), Milan, Italy, 2025, pp. 1–6. [CrossRef]
- P. Bianchi, et al. “Performance of Statistical Tests for Source Detection using Random Matrix Theory,” IEEE Transactions on Information Theory, vol. 57, no. 4, pp. 2400–2419, April 2011. [CrossRef]
- S. N. Roy, “On a heuristic method of test construction and its use in multivariate analysis,” Annals of Mathematical Statistics, vol. 24, no. 2, pp. 220–238, June 1953.
- H. Urkowitz, “Energy detection of unknown deterministic signals,” Proceedings of the IEEE, vol. 55, no. 4, pp. 523–531, April 1967. [CrossRef]
- D. G. Riviello and G. Alfano, “Software-Defined Radio Experimental Setup for Multi-Antenna Spectrum Sensing Algorithms,” 2025 IEEE-APS Topical Conference on Antennas and Propagation in Wireless Communications (APWC), Palermo, Italy, 2025, pp. 301–306. [CrossRef]
- L. Wei, O. Tirkkonen, P. Dharmawansa, and M. R. McKay, “On the exact distribution of the scaled largest eigenvalue,” 2012 IEEE International Conference on Communications (ICC), Ottawa, ON, Canada, 2012, pp. 2422–2426. [CrossRef]
- W. Zhang, R. K. Mallik, and K. B. Letaief, “Optimization of cooperative spectrum sensing with energy detection in cognitive radio networks,” IEEE Transactions on Wireless Communications, vol. 8, no. 12, pp. 5761-–5766, Dec. 2009. [CrossRef]
- V. S. Muradi, R. K. Paithane, A. Ahmed and A. Pawar, “Spectrum sensing in cognitive radio using Labview and NI USRP,”, 2018 2nd International Conference on Inventive Systems and Control (ICISC), Coimbatore, India, 2018, pp. 1316–1319. [CrossRef]
- A. Nafkha, M. Naoues, K. Cichon and A. Kliks, “Experimental spectrum sensing measurements using USRP Software Radio platform and GNU-radio,” 2014 9th International Conference on Cognitive Radio Oriented Wireless Networks and Communications (CROWNCOM), Oulu, Finland, 2014, pp. 429–434. [CrossRef]
- D. G. Riviello, G. Alfano, R. Garello, “Quadratic Forms in Random Matrices with Applications in Spectrum Sensing,” Entropy: Special Issue Random Matrix Theory and Its Innovative Applications vol. 27, no. 1, Jan. 2025. [CrossRef]
- B. Nadler, “On the distribution of the ratio of the largest eigenvalue to the trace of a Wishart matrix,” Journal of Multivariate Analysis, vol. 102, no. 2, pp. 363–371, Feb. 2011. [CrossRef]
- J. Baik and Jack W. Silverstein, “Eigenvalues of large sample covariance matrices of spiked population models,” Journal of Multivariate Analysis, vol. 97, no. 6, pp. 1382–1408, July 2006. [CrossRef]
- A. Edelman, “Eigenvalues and Condition Numbers of Random Matrices,” SIAM Journal on Matrix Analysis and Applications, vol. 9, no. 4, pp. 543–560, 1988. [CrossRef]
- M. Matthaiou, M. R. Mckay, P. J. Smith and J. A. Nossek, “On the condition number distribution of complex Wishart Matrices," IEEE Transactions on Communications, vol. 58, no. 6, pp. 1705–1717, June 2010. [CrossRef]
- O. Besson, and L. L. Scharf, “CFAR matched direction detector,” IEEE Transactions on Signal Processing, vol. 54, no. 7, pp. 2840–2844, July 2006. [CrossRef]
- A. Kortun, M. Sellathurai, T. Ratnarajah and C. Zhong, “Distribution of the Ratio of the Largest Eigenvalue to the Trace of Complex Wishart Matrices,” IEEE Transactions on Signal Processing, vol. 60, no. 10, pp. 5527–5532, Oct. 2012. [CrossRef]
- B. Nadler, “On the distribution of the ratio of the largest eigenvalue to the trace of a Wishart matrix,” Journal of Multivariate Analysis, vol. 102, no. 2, pp. 363–371, Feb. 2011. [CrossRef]
- P. Dissanayake, P. Dharmawansa and Y. Chen, “Distribution of the Scaled Condition Number of Single-Spiked Complex Wishart Matrices,” IEEE Transactions on Information Theory, vol. 68, no. 10, pp. 6716–6737, Oct. 2022. [CrossRef]
- Ming Kang, and M.-S. Alouini, “Largest eigenvalue of complex Wishart matrices and performance analysis of MIMO MRC systems,” IEEE Journal on Selected Areas in Communications, vol. 21, no. 3, pp. 418–426, April 2003. [CrossRef]
- A. Zanella and M. Chiani, “On the Distribution of the ℓ-th Largest Eigenvalue of Spiked Complex Wishart Matrices,” Acta Physica Polonica B, vol. 51, pp. 1687–1705, 2020. [CrossRef]
- D. Féral, S. Péché, “The largest eigenvalues of sample covariance matrices for a spiked population: diagonal case,” Journal of Mathematical Physics, vol. 50, no. 7, 2009. [CrossRef]
- J. Baik, G. Ben Arous, G. and S. Péché, “Phase transition of the largest eigenvalue for non-null complex sample covariance matrices,” The Annals of Probability, vol. 33 no. 5, pp. 1643–1697, Sep. 2005 .
- M. Dieng, “Distribution functions for edge eigenvalues in orthogonal and symplectic ensembles: Painlevé representations,” in International Mathematics Research Notices, vol. 2005, no. 37, pp. 2263–2287, 2005. [CrossRef]
- A. Maaref and S. Aissa, “Closed-form expressions for the outage and ergodic Shannon capacity of MIMO MRC systems,” IEEE Transactions on Communications, vol. 53, no. 7, pp. 1092–1095, July 2005. [CrossRef]
- P. A. Dighe, R. K. Mallik, and S. R. Jamuar, “Analysis of transmit-receive diversity in Rayleigh fading,” IEEE Transactions on Communications, vol. 51, no. 4, pp. 694–703, April 2003. [CrossRef]
| 1 | This manuscript is an extended version of the conference paper: D. G. Riviello, G. Alfano, “Software-Defined Radio Experimental Setup for Multi-Antenna Spectrum Sensing Algorithms”, 2025 IEEE-APS Topical Conference on Antennas and Propagation in Wireless Communications (APWC), Palermo, Italy, 2025, pp. 301-306, doi: 10.1109/APWC65665.2025.11190420. |
| 2 | We neglect, in the analysis of ERD, the multiplicative factor in front of the eigenvalues a.s. limits, along the lines of [6], because this terms simplifies by definition of . |
Figure 1.
Host computer SiComputer Extrema Workstations W200.
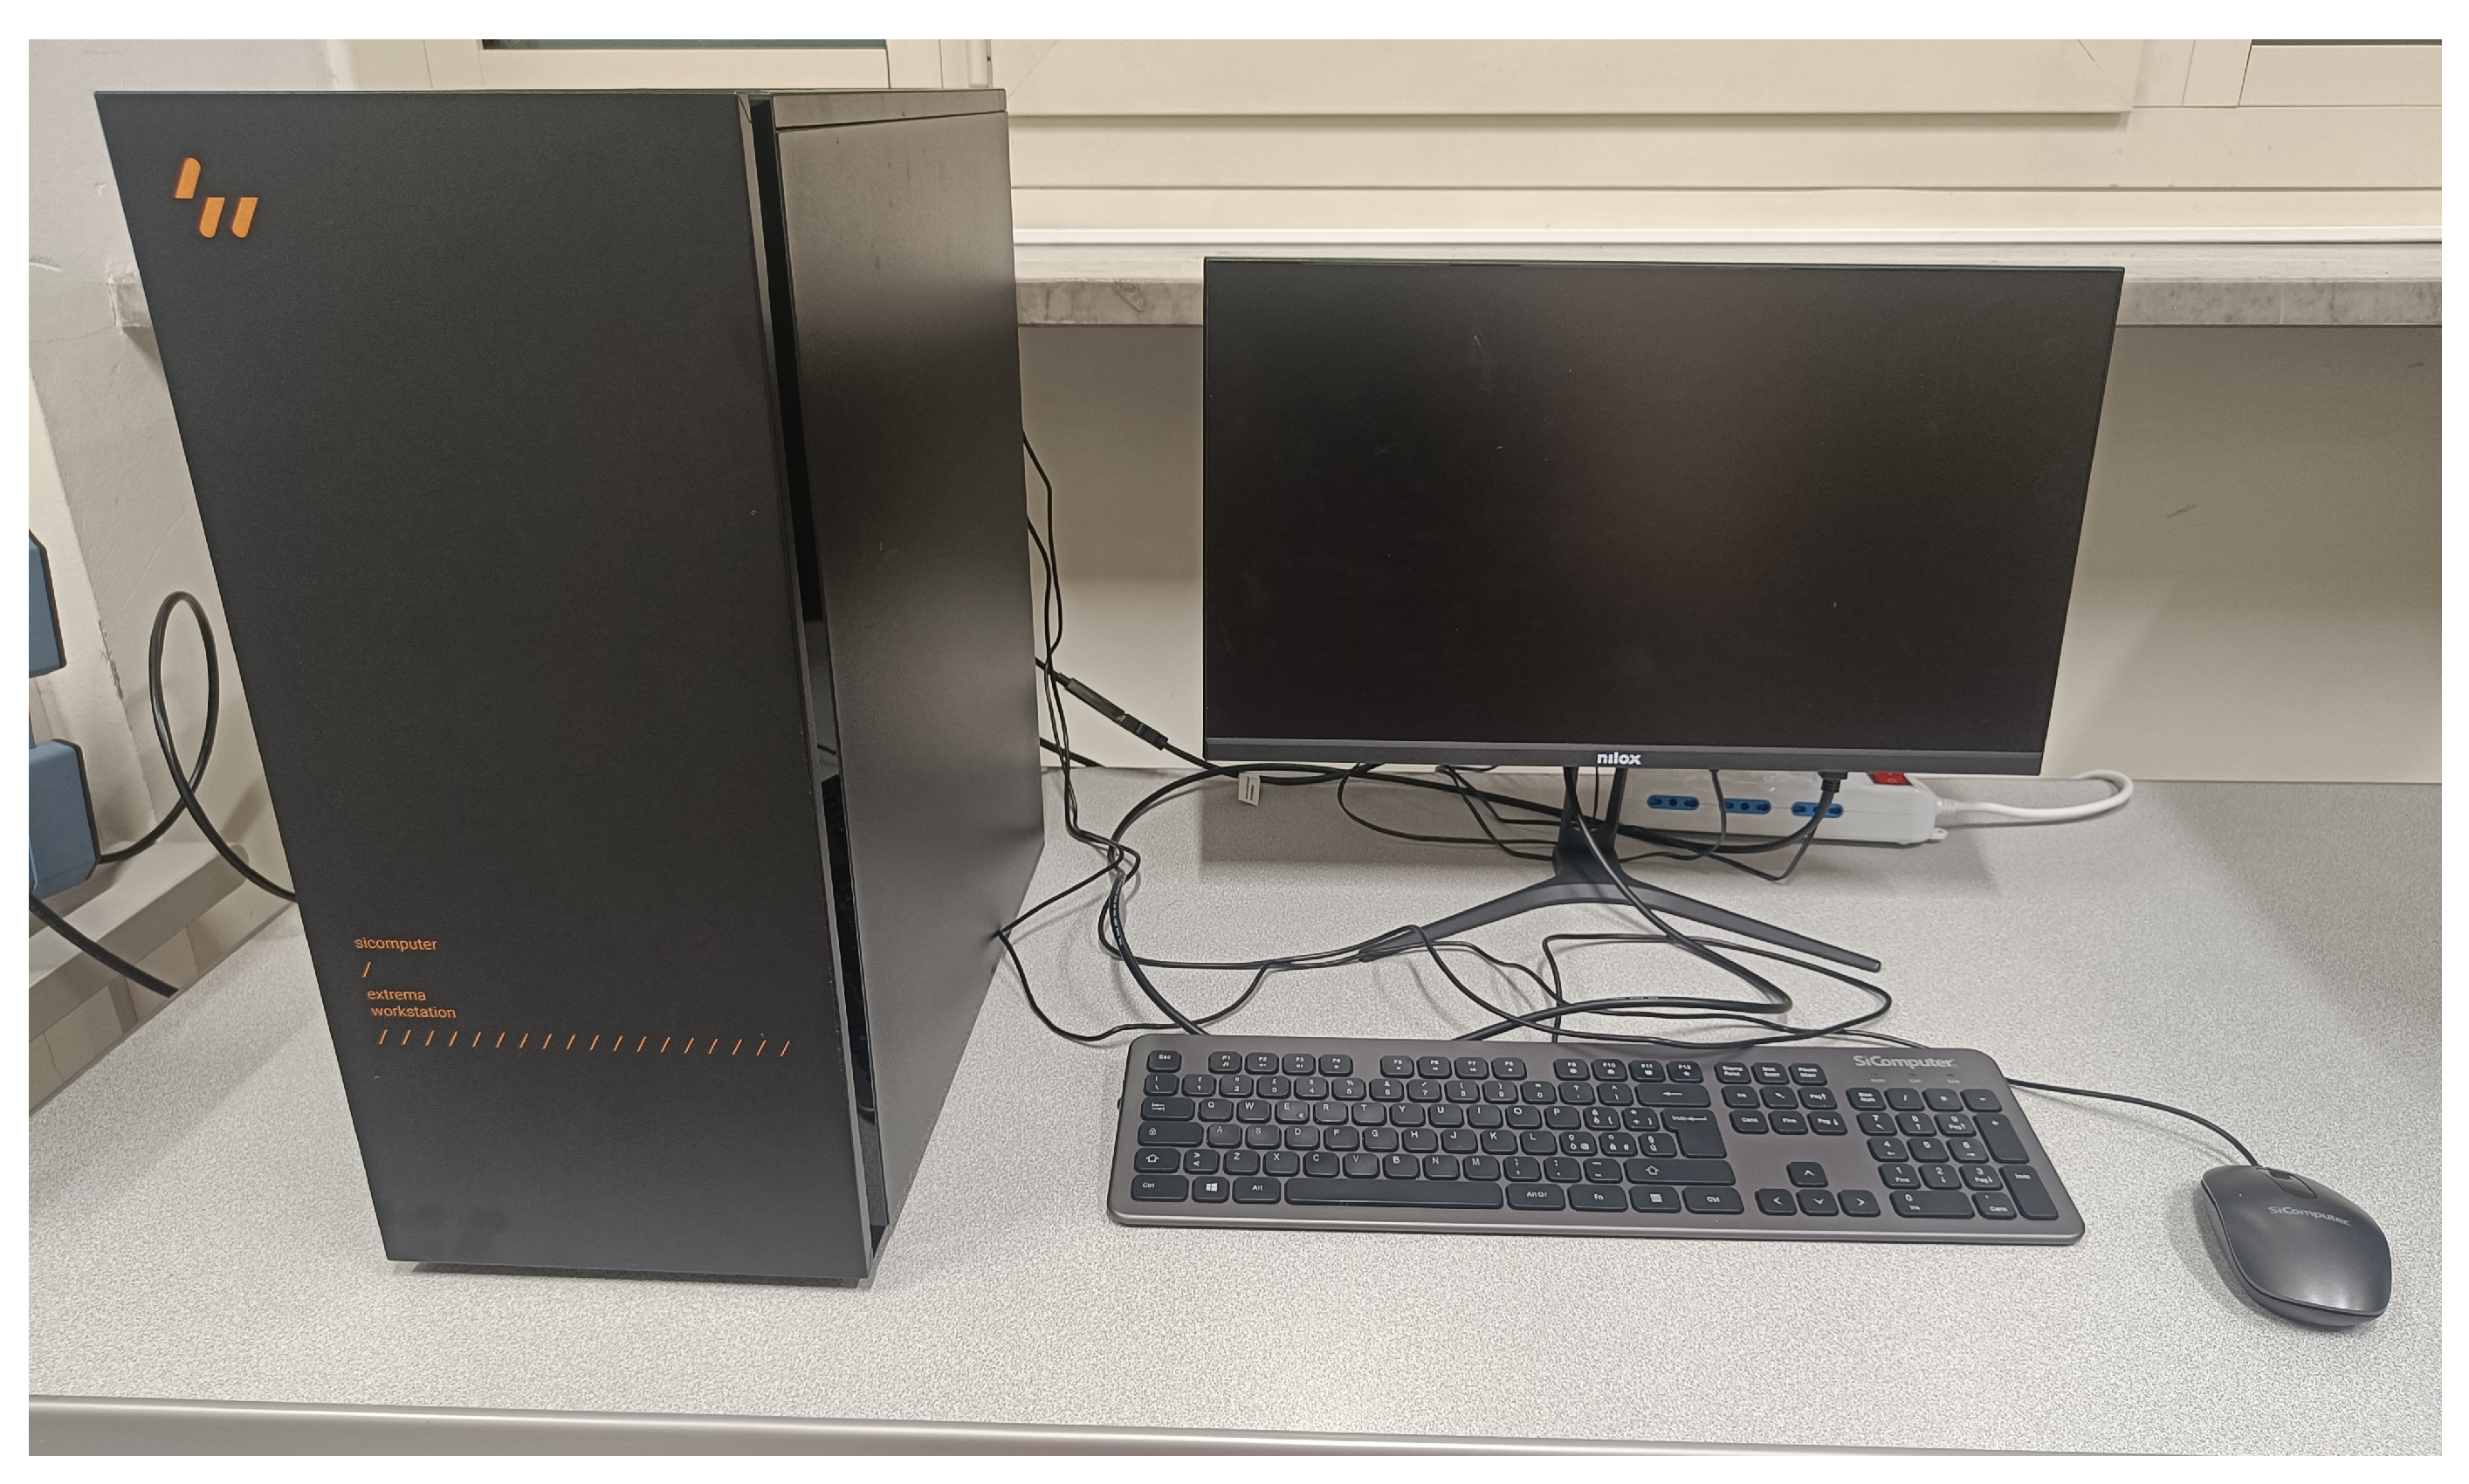
Figure 2.
Ettus Research USRP X310 and NI Ettus USRP X410 on the right.
Disclaimer/Publisher’s Note: The statements, opinions and data contained in all publications are solely those of the individual author(s) and contributor(s) and not of MDPI and/or the editor(s). MDPI and/or the editor(s) disclaim responsibility for any injury to people or property resulting from any ideas, methods, instructions or products referred to in the content. |
© 2026 by the authors. Licensee MDPI, Basel, Switzerland. This article is an open access article distributed under the terms and conditions of the Creative Commons Attribution (CC BY) license (http://creativecommons.org/licenses/by/4.0/).
Copyright: This open access article is published under a Creative Commons CC BY 4.0 license, which permit the free download, distribution, and reuse, provided that the author and preprint are cited in any reuse.


