

Submitted:
08 April 2026
Posted:
09 April 2026
You are already at the latest version
Abstract
The rapid evolution of urban environments and the growing demand for efficient transportation systems have accelerated the transition toward smart cities. In this context, traffic modeling and urban mobility analysis play a critical role in understanding, predicting, and optimizing complex transportation dynamics. This study explores contemporary approaches to traffic modeling, integrating data-driven methodologies, simulation techniques, and intelligent transportation systems to enhance urban mobility in Petrosani city from Romania. Emphasis is placed on the use of big data, Internet of Things (IoT) technologies, and machine learning algorithms for real-time traffic monitoring, demand forecasting, and adaptive traffic management. The paper examines the interaction between traditional modeling frameworks and emerging smart city infrastructures, highlighting how advanced analytics can improve congestion mitigation, reduce environmental impact, and support sustainable mobility solutions. Furthermore, it discusses multimodal transportation integration, user behavior analysis, and policy implications for urban planners and decision-makers. A conceptual framework is proposed to bridge the gap between theoretical models and practical implementations within smart city ecosystems. The findings suggest that the convergence of digital technologies and traffic modeling significantly enhances the resilience, efficiency, and sustainability of urban mobility systems. The study contributes to the ongoing discourse by identifying key challenges, opportunities, and future research directions in the development of intelligent, data-driven transportation networks.
Keywords:
traffic modeling
; urban mobility
; traffic flow
; optimization
; smart city
1. Introduction
The rapid urbanization of the 21st century has intensified the demand for efficient, sustainable, and safe transportation systems. Modern cities face unprecedented challenges, including traffic congestion, air pollution, energy inefficiency, and the complex interactions of multimodal transport networks. In response, the concept of smart cities has emerged, integrating digital technologies, data analytics, and intelligent infrastructure to optimize urban mobility and enhance citizens’ quality of life. Traffic modeling and urban mobility analysis are central to this transformation. Traffic modeling involves simulating the flow of vehicles and pedestrians within a transportation network, allowing planners and policymakers to anticipate congestion, evaluate infrastructure changes, and design adaptive control strategies. Urban mobility analysis extends this approach by incorporating data from diverse sources such as GPS, mobile devices, public transport systems, and Internet of Things (IoT) sensors to understand travel patterns, mode preferences, and temporal demand variations. The transition toward smart cities leverages these tools to enable proactive traffic management, reduce environmental impact, and support sustainable urban development. By combining advanced modeling techniques with real-time data analytics, cities can implement adaptive traffic signal systems, optimize public transportation routes, and promote alternative mobility solutions such as shared mobility and micro-mobility options. Ultimately, this integration fosters a resilient, data-driven urban ecosystem capable of meeting the dynamic demands of contemporary urban life. [1,2,3,4,5]
Petrosani city, located in the southern central area of Hunedoara County, faces a number of challenges associated with the urban road network, such as localized congestion, rush hour agglomerations, the lack of advanced traffic monitoring solutions and the need for infrastructure reorganization in order to support the socio-economic development of the area. Recent developments in the field of computerized traffic modeling and simulation provide an opportunity to assess mobility scenarios and test improvement measures without directly affecting the real dynamics of the city.
In this context, the analysis, modeling and simulation of traffic flows in Petrosani, are essential tools for understanding the behavior of the road network and for substantiating decisions regarding the optimization of urban mobility. The use of traffic models allows assessing the impact of infrastructural changes, reorganizing intersections, implementing roundabouts, optimizing traffic lights, or promoting alternative transportation. Such approaches can contribute to reducing travel times, reducing pollutant emissions, and increasing road safety.
This paper aims to systematically investigate traffic flows in Petrosani, to develop a representative model of urban circulation and to test through computer simulations a series of solutions aimed at improving general mobility. The integrated approach, based on quantitative methods and specialized software tools, provides a solid basis for formulating viable, sustainable proposals adapted to the local specifics of the municipality. [6,7,8,9,10]
2. Analysis of the City of Petroșani
2.1. PESTEL Analysis
- A. Political
- Political stability: Romania is an EU member, providing a stable framework; however, local decisions can be influenced by county-level politics and the depopulation of mining areas;
- Government investments: Petroșani has been closely linked to the mining industry; the government offers professional retraining programs and funding for urban regeneration;
- EU projects: Access to European funds for infrastructure, environment, tourism, and economic development.
- B. Economic
- Economic structure: The city has relied heavily on mining and heavy industry. Currently, the decline of the extractive industry is being felt, with effects on employment;
- Unemployment and migration: High unemployment rates and the migration of young people to larger cities or abroad affect local consumption and economic dynamics;
- Opportunities: Development of mountain tourism (Retezat, Parâng), renewable energy, and small local businesses.
- C. Social
- Demographics: Declining and aging population due to migration and low birth rates;
- Education and Training: The presence of the University of Petroșani offers potential for innovation and research, especially in the energy and mining sectors;
- Culture and Identity: A community with a strong mining tradition, which can be leveraged for tourism and cultural events.
- D. Technological
- Digitalization and connectivity: Limited access to high-performance IT infrastructure compared to major cities; however, there are university centers that can stimulate innovation;
- Local industry: Mining and traditional heavy industry have been slower to adopt modern technologies; there is potential for implementing smart city solutions and digitalizing local administration;
- Research: Petroșani University can serve as a driver for technological development, particularly in the fields of energy and engineering.
- E. Ecological
- Environment: The area is surrounded by the Parâng Mountains, offering high tourism and ecological potential;
- Pollution: Mining history has left its mark on air and water quality; issues with industrial waste persist;
- Sustainability: Significant opportunities exist for developing ecotourism and green urban regeneration projects.
- F. Legal
- National and European regulations: EU legislation imposes strict standards regarding the environment, occupational safety, and urban development;
- Investment incentives: There is legislation supporting SMEs, professional retraining, and local development projects;
- Constraints: Bureaucratic procedures and administrative obstacles that can slow down private investments.
- Conclusion: Petroșani is undergoing a transition from a mining-industrial city to a community focused on tourism, education, and energy. The major challenges are negative demographics, unemployment, and infrastructure, while the opportunities come from EU funding, mountain tourism, and university potential. [1,2,3,4]
2.2. SWOT Analysis
- A. Strengths
- 1. Strategic geographical position:
- Located in the Jiu Valley, close to the main road and railway lines connecting Transylvania and Oltenia;
- Easy access to Retezat National Park and other attractive natural tourist areas.
- 2. Natural resources and industrial tradition:
- Long-standing tradition in mining and extractive industries, with experience in the energy sector;
- Existing industrial infrastructure and a skilled workforce in certain sectors.
- 3. Higher education and academic institutions:
- Presence of a university campus or branches of larger university centers (focused on technical and engineering specializations).
- 4. High natural tourism potential:
- Proximity to mountains, forests, hiking trails, and protected areas;
- Opportunities for developing mountain tourism, outdoor sports, and eco-tourism.
- 5. Stable local community:
- Strong cultural identity linked to the history of mining;
- Active social networks and community organizations.
- B. Weaknesses
- 1. Historical dependence on mining:
- Economy affected by the restructuring of the extractive industry;
- High unemployment and lack of strong alternative economic sectors.
- 2. Deteriorated urban infrastructure:
- Problems with roads, outdated or under-capacity utility networks;
- Residential areas requiring major rehabilitation investments.
- 3. Labor migration and “brain drain”:
- Young people and specialists leaving for larger urban centers or abroad.
- 4. Limited private investment:
- Attracting external investors is hindered by the post-industrial image and insufficient infrastructure.
- 5. Dependence on public budget:
- Development projects are slow to implement due to insufficient funding or difficult access to EU sources.
- C. Opportunities
- 1. Economic Diversification:
- Development of mountain, cultural, and adventure tourism;
- Support for innovative startups and SMEs.
- 2. European Funds and Conversion Programs:
- Access to EU programs for urban regeneration, environment, energy, and innovation;
- Potential projects for the transition to clean energy.
- 3. Regional and International Partnerships:
- Cooperation with EU cities for the transfer of best practices;
- Development of economic clusters in new sectors (technology, logistics, education).
- 4. Leveraging Natural Heritage:
- Promotion of Retezat National Park and other protected areas as tourist attractions;
- Development of infrastructure for mountain biking, hiking, and winter sports.
- 5. Urban Rehabilitation and Community Revitalization:
- Projects for regenerating neighborhoods and public spaces;
- Improving quality of life through modern services and cultural facilities.
- D. Threats
- 1. Accelerated depopulation:
- Decrease in the number of residents due to migration and low birth rates.
- 2. Competition from other regions:
- More dynamic urban centers (Cluj, Timișoara, Sibiu) attract investments and talent.
- 3. Effects of climate change:
- Environmental risks (floods, landslides) and impact on tourism.
- 4. Economic and investment fluctuations:
- Reduced investment inflows due to global economic instability.
- 5. Environmental issues and pollution:
- The impact of extractive industries on air and soil quality may discourage investments.
- Conclusion: Petroșani has significant potential for recovery and reinvention, primarily through economic diversification, leveraging its tourism and natural potential, and accessing EU funds. However, success depends on the quality of strategic planning, the involvement of the local community, and the consistent attraction of investment and talent. [1,2,3,4]
3. Essential Information
3.1. Purpose, Role and Object of the Traffic Study
The main objective of transport policies is to create a transport system that ensures sustainable urban mobility in the study area. Urban mobility defines the ensemble of people's movements for daily activities related to work, social activities and/or needs, shopping and leisure activities, within an urban or metropolitan space.
According to the “White Paper on Transport”, developed by the European Commission, the basic condition for mobility is the provision of adequate infrastructure and its intelligent use. Infrastructure must be planned in such a way as to support and boost economic growth, social and environmental development, as well as to increase the safety of road users. By maximizing the positive impact on economic growth and minimizing the negative impact on the environment, investments in transport infrastructure actually lead to an increase in the quality of life of citizens in the area covered by the road network. [11,12,13,14,15]
The study contains a package of proposals (regarding infrastructure and means of transport/operational/organizational) that will contribute to improving the transport of passengers, goods and/or non-motorized modes of transport, including encouraging and facilitating the transfer to them from individual car transport and reducing CO2 equivalent emissions resulting from transport activity.
Achieving sustainable urban mobility is possible by creating an efficient and planned integrated transport system, which has the least impact on the environment. This traffic study is a document that can be the basis for future investments that can be made both by attracting non-reimbursable funds and from the Petrosani City Hall's own funds.
Reducing carbon emissions in urban areas is based on sustainable urban mobility plans, which encourage investment in alternative transport options to private cars. These alternatives are public transport and the use of non-motorized transport, all of which lead to reduced greenhouse gas emissions.
The benefits pursued by implementing such projects are as follows:
- shortening travel time for public transport without making traffic conditions more difficult;
- improving the quality of public transport and non-motorized modes by increasing quality and safety standards in the use of these modes of transport;
- reducing road traffic congestion, accidents and negative environmental impact by decreasing the modal quota of private transport by personal cars;
- increasing the frequency of public transport.
The purpose of the traffic study is to analyze the current situation of the road traffic in Petrosani, its assessment and the estimation of the effects generated by the implementation of new transport infrastructure, using a transport model. The transport model is prepared on the basis of information obtained from the field by road infrastructure assessment. [16,17,18]
The object of the work is the development of a study on road traffic management in Petrosani and its role is to establish the characteristics of current and future traffic, as well as the equipment and organization of the traffic system, depending on the street networks, road infrastructure arrangements and specific transport facilities.
The study aimed to establish the objectives and actions of developing communication routes at the local level, including by making medium-term, respectively 8-year forecasts.
3.2. Methodology of Conducting the Traffic Study
3.2.1. Analysis of Existing Documents
In order to carry out the analysis of the existing situation, the identification and preliminary definition of the problems affecting road transport in the study area, as well as to identify the measures and projects envisaged in the following stages, it was necessary to analyze the existing programmatic documents, as well as other documentation relevant to the subject of the traffic study. [19]
Thus, the documents analyzed in this first stage of the traffic study are the following:
- Sustainable Urban Mobility Plan of Petrosani;
- The integrated strategy for sustainable development of Petrosani;
- General Urban Plan;
- Other relevant documents obtained directly from the beneficiary.
By studying the documents presented above, the information necessary for the preparation of this study was extracted. This data refers to:
- Location in the territory and accessibility;
- Administrative organization;
- Demographic data;
- Socio-economic data;
- The configuration of the major street network of the city;
- Information on urban and county public transport (vehicle park, routes and traffic charts);
- Parking regulations;
- Heavy traffic regulations;
- Aspects related to alternative means of transport (bicycle, walking).
3.2.2. Collecting Data
Field data is of particular importance in traffic studies, as shown in the previous section. The main elements that were determined on the occasion of field measurements are the following:
-
Geometric configuration of the analyzed road arteries:
- ➢
- Dividing road arteries into road sections or segments, where the characteristics influencing traffic remain constant; determining the sizes of the segments;
- ➢
- Traffic lane sizes and their number on the road sections between points of interest;
- ➢
- Curvature radii and gradients of established road segments;
- ➢
- The existence of a median strip to separate the directions;
- ➢
- Type of road surface and its condition;
- ➢
- Geometric configuration of intersections (number of arms, type, orientation, curvature radii, sizes, etc.);
- ➢
- The existence of side alveoli for parking spaces or stations for public transport;
- Dynamic factors regarding the distribution of traffic by direction (the way in which traffic is predominantly carried out on the road artery);
- Traffic composition (the share of vehicles of different sizes and with different traffic dynamics);
- Road signalling (static: road markings and indicators, or dynamic: traffic lights and traffic information systems, toll or access control systems, video or radar surveillance systems, etc.);
- Traffic measurements at established intersections, with marking of turns and types of vehicles.
3.2.3. Realization of the Transport Model
In order to carry out the traffic study for Petrosani, a traffic model was developed which takes into account a road network that is sufficiently detailed to meet the modeling needs of an urban network.
The basic network introduced into the traffic model consists of segments (arcs) of different types, each segment presenting specific characteristics relevant to the traffic impact model, such as: number of lanes, capacity of each segment, segment length, permitted traffic speed, traffic rules (one-way, two-way traffic).
Network nodes are represented by intersections, which were modeled according to the existing geometry in the field. Also, depending on the situation, for each node, the type of intersection was introduced into the model: without traffic lights, roundabout, traffic lighted. For the latter, the diagrams and traffic light plans in operation at the time of data collection were collected and introduced. Additionally, traffic lighted pedestrian crossings were introduced, in the appropriate position and with the corresponding traffic light cycle. [19]
The next step was to introduce the traffic volumes determined in the data collection phase, followed by the calibration and validation of the transport model.
The purpose of the model calibration is to ensure that the transport model reflects existing conditions in the current transport network.
A distinction is required between „calibration” and „validation”:
- Calibration is an iterative process, whereby the model is continuously revised to ensure that it is a sufficiently accurate replica of the conditions of the base year;
- The validation process uses independent data from locations other than those used for calibration, in order to verify the model for the reference year.
A purpose-appropriate model meets the required standards for both calibration and validation, based on the criteria and assessed data.
The model calibration process includes successive checking of the model transport network, to best represent existing conditions, such as the typology of various road segments, capacities and speed limits.
The calibration model used, followed the calibration standards in the guide „JASPERS Appraisal Guidance (Transport) – The Use of Transport Models in Transport Planning and Project Appraisal” (2014).
The traffic model calibration was performed based on data recorded in traffic surveys. Calibration was done by comparing the affected traffic and the census traffic, until the admissible error margins were obtained. After calibrating the transport demand with observed volumes, the model was compared with independent validation data, namely volumes measured on the arcs of the model's transport network graph and records of travel times on the arcs.
3.2.4. Analysis of Results and Identification of Malfunctions, in the Short and Medium Term
Following the running of the transport model for 2025, in the variants that will be described in the chapter on traffic diagnosis, values were obtained for a number of significant parameters, which allowed the assessment of traffic on the road network of Petrosani. The parameters analyzed were the following::
- Average traffic speed;
- Average delay / vehicle;
- Number of stops / vehicle;
- Level of Service or network performance index.
The results of the transport model were correlated and integrated with the other information resulting from the analysis stage of the current situation, identifying a series of malfunctions specific to road traffic on the transport network of Petrosani, at the current time.
As a result of the analysis of the medium-term traffic evolution (7 years), variants of the transport model were developed to allow the assessment of the parameters mentioned for the 2030 forecast year and the estimation of the effect of the detected malfunctions. [19]
3.2.5. Identifying Solutions and Testing Them Through Case Studies
The next stage, after identifying the malfunctions, as well as the characteristics of the infrastructure and road traffic in Petrosani for the base year and the forecast year, consisted in proposing solutions that would lead to reducing the negative aspects and their effect on general traffic. Those solutions were tested in the transport model and reports were issued on the effect of the proposed changes on the above mentioned traffic parameters, both in the short and medium term, for all modeled scenarios.
3.2.6. Conclusions and Recommendations
As a result of the analyses developed on the current situation and forecasts for 2030, as well as the case studies conducted, conclusions and recommendations were issued on possible interventions/actions/proposals/projects whose implementation will lead to the reduction and/or elimination of the observed malfunctions. [19]
4. General Characteristics of the Analyzed Area
4.1. Location
Location: Petrosani is located in the central part of Romania, in the south of Hunedoara County, at the confluence of East Jiu with West Jiu, the administrative territory of the municipality having an area of 195.56 km2. The city is situated at an altitude of 615-620 m, the highest altitude in the area being recorded at Parangul Mare Peak, i.e. 2,519 m, according to Figure 1. [19]
The entrance into depression is made:
- from the south, through the Jiu , from Targu Jiu;
- from the north, on the national road NR 66, from Simeria;
- from the west, in perspective, through the Butii Gorges, from Herculane.
4.2. Transport Infrastructure
Traffic on public roads: According to the census carried out by the Ministry of Transport, the following traffic intensities are recorded on the main road axes of the county (values available for 2021): NR 7 (E 68) 22300 – 70600 Vt/day; NR 7A 1200 – 3100 Vt/day; NR 66 (E79) 8800 – 53600 Vt/day; NR 66A 4800 – 30100 Vt/day; NR 68 11450 Vt/day; NR 68A 7300 – 10600 Vt/day; NR 68B 25000 Vt/day; NR 74 12500 – 15800 Vt/day; NR 76 (E79) 8400 – 16500 Vt/day.
The low degree of modernity of the communication infrastructure, its structure and operating parameters require immediate adaptations to the requirements of national and European traffic. [19]
The main identified malfunctions are:
- due to the small number of category II streets and the absence of category I streets, the traffic does not have an appropriate flow, and the overall capacity of the major network is reduced;
- although Petrosani runs an important industrial traffic, it does not have a completely bypassing artery that can take over the heavy transit;
- the city penetrations (NR 66 north and south, NR 7A, NR 66A) are arranged on category II arteries with insufficient traffic capacity (e.g. Maleia Street, Daranesti Street);
- a whole series of streets have insufficient road widths (Eminescu, Cuza Voda, Maiorescu, Stefan cel Mare, etc.);
- an important malfunction is the existence of a single car access from the new part to the old part of the city (over the railway), that is, from the east to the west, the railway dividing Petrosani in two in the north-south direction. This access (Timisoara Street) is not only unique, but also has a completely unfavorable configuration, with the underpass of the new transit artery immediately followed by a level crossing, with barriers, over the railway and then a cross intersection with Anton Pann Street;
- the lack or discontinuity of sidewalks on many streets.
The street network of Petrosani is composed of 163 streets with a total length of 286,890 m. Of these, over 80% have been rehabilitated in the last 5 years, carrying out repair works through asphalt fillings, pouring asphalt carpet, restoring sidewalks with pebbles, installing road signs and road markings, street repair and maintenance works aimed at maintaining the geometric parameters of the road surface in order to improve the conditions for road traffic in Petrosani.
In Petrosani, the roads total 120 km, of which only 4 km are 4-lane roads (category II roads). Jiu Valley is poorly connected to the neighboring areas with tourist potential. The road connections in the East-West direction, Petrosani – Obarsia Lotrului (NR7A), Petrila – Taia – Auselu - Sureanu Ski Resort (DJ709K) and Jiu Valley – Cernei Valley – Baile Herculane resort are either in advanced degradation or impassable.
In terms of road access, Jiu Valley is crossed from north to south by the national road NR 66 - which crosses Petrosani and passes through the proximity of Petrila, connecting the region with Targu-Jiu (to the south), Hunedoara and Deva (to the north), as well as with the A1 motorway, by the national road NR 66A - which crosses the region from east to west, parallel to the West Jiu River, crossing Petrosani, Aninoasa, Vulcan, Lupeni and Uricani, over a distance of approximately 34 km and by the national road NR 7A - which connects Petrosani and Petrila to the Parang massif and the Transalpina ski area. The roads are mostly single-lane, mountainous and sub-mountainous, making it difficult to transport goods with large and heavy equipment. With the exception of NR 66, the roads are not modernized, which makes it difficult for tourists and business people to travel in the area.
The length of the existing national roads within the municipality is 10.01 km for NR66 and 3.55 km for NR7A. Inside the municipality, the road network has a longitudinal configuration, this major road network developing along the directions of penetration and transit of the municipality.
These roads constitute the skeleton of the major road network, to which are added the connections between them. Taking into account the size of the municipality, the number of inhabitants and the degree of motorization, it can be assessed that the major road network is relatively sufficient. A series of upgrades were made to the road network, following the initiatives of the City Hall and the City Police, the arrangement of intersections, the restoration of road markings, the equipment with traffic light installations.
Petrosani is located on two important road communication routes: NR 66, Targu Jiu – Simeria, at the intersection with NR 66A Petrosani – Uricani – Campul lui Neag, with extension to Herculane and NR 7A, which connects the municipality to Oltului Valley (Petrosani – Voineasa – Brezoi).
Most of the county transport routes connected with Petrosani have as terminal the Victory Square, where the conditions do not meet the standards regarding the safety and comfort of the passengers.
The inter-county passenger transport routes have a single stop in Jiu Valley, in the Siva Trans Bus Station in Petrosani, located on NR 66. Currently, the bus station is not connected to local public transport routes, which is a serious problem for travelers who are forced to use additional means of travel to make the connection between the stopping point of inter-county routes and those of the local transport network.
From Petrosani Railway Station, in order to reach public transportation, it is necessary to cross a footbridge, which is very difficult for elderly or disabled people.
Petrosani benefits from favorable positioning in relation to the A1 motorway, with Sibiu, Timisoara, Craiova and Cluj-Napoca and their international airports.
Local public transport is provided by the company S.C. ZMK S.R.L., maxi-taxi transport being an efficient way to travel in the Jiu Valley. The minibuses transport passengers to the towns in Jiu Valley as well as to and from Deva.
The minibuses that provide local transport in Petrosani depart with a frequency of between 5 and 10 minutes and the price of a ticket for public transport in Petrosani is 3 lei. The minibuses that provide transport on the Petrosani - Hateg - Deva route circulate with a frequency of 45 minutes, starting at 6 in the morning.
In Petrosani, 20 vehicles operate with a frequency of 5 to 15 minutes and a capacity of 19-28 seats. Their movement is organized on 3 lines: the main line, the secondary line 1 and the secondary line 2. The interval of succession of the vehicles differs depending on the lines, on the main line varying between 5 and 10 minutes, while on the secondary lines 1 and 2 the interval is 60 minutes and 120 minutes, respectively. There are also 3 private taxi companies operating within the city. Interurban transport is provided by 100 cars operating in Maxi-Taxi regime, with a frequency of 5-15 minutes.
In order to develop public transport, the “Green Line Jiu Valley “ project with 2 components was launched, which provides for the creation of a green regional line of electric buses between Petrila, Petrosani, Aninoasa, Vulcan, Lupeni and Uricani.
Local routes: [19]
- Victory Square – Airport neighborhood;
- Airport neighborhood – Colonie;
- Enel – Jiet.
Interurban routes:
- Petrosani – Hateg – Deva;
- Petrosani – Vulcan – Lupeni – Uricani;
- Petrosani – Aninoasa.
Currently, Petrosani does not have enough parking spaces for private cars, which often forces residents to park illegally. Recently, the municipal administration has built several parking spaces in areas where their existence had become mandatory.
The parking system in Petrosani consists of free parking spaces (within the limits of traffic regulations), free of charge and paid parking spaces. The latter are located in the Central Square area, and the fee is 2 lei. The charging is made between 8:00 and 16:00, from Monday to Friday and between 8:00 and 15:00 on weekends. The disadvantages of the current parking system are represented by the small number of parking spaces, especially in the central area of the municipality.
NR66 national road, which connects Hateg and Targu Jiu, crosses the city of Petrosani, decongests the traffic inside the city, due to its separate route, on which the traffic of international and national circulation is carried out. The existence of this belt along the city congests traffic in the roundabouts at the entrance and exit of the city of Petrosani, as these roundabouts connect both the bypass belt and the inner arteries of the city. These traffic congestion can be seen in the 7:30-9:00 and 15:30-17:00 time intervals.
Walking is the simplest and most common form of mobility, with a positive impact on health and minimal impact on the environment. In order to maintain and increase the quality of life of the inhabitants of the city, the deciding factors must create the necessary framework for simple, efficient and safe mobility. The basis of sustainable urban mobility is walking. [19]
Improving the quality of pedestrian spaces is one of the strategies aimed at achieving sustainable mobility. There are two categories of pedestrian facilities: interrupted (pedestrian crossings) and uninterrupted (alleys). The latter can be classified as: hallways, alleys, courtyards, sidewalks, public roads and trails, pedestrian streets and squares.
In order to create appropriate pedestrian spaces, the following principles must be observed:
- Pedestrian spaces must be designed with pedestrian safety as a primary consideration.;
- Accessible streets to support all types of pedestrians;
- Direct pedestrian routes to satisfy the desire for linear routes and promote more walking;
- Attractive streets and spaces to make walking a pleasant experience.
Analyzing the existing situation of the municipality, appropriately sized pedestrian spaces are identified, protected by vegetation and bollards. At the same time, in other areas of the municipality, the lack of a pedestrian route is noted, which negatively contributes to the level of accessibility and connectivity to points of interest in the area.
Also, the undersizing of pedestrian space can be observed in several areas of the municipality, which contributes to the creation of exposed pedestrian routes, decreasing the transit safety of residents.
The main problems with pedestrian movements are obstruction of movement by parked cars and the lack of devices for blocking the parking of vehicles on the sidewalk.
This substantiates the urgent need for the rehabilitation of sidewalks and the installation of devices to prevent parking of vehicles on sidewalks, thus ensuring safe and unobstructed movement. To increase pedestrian safety, it is necessary to expand the video monitoring system, as well as additional arrangements for pedestrian crossings (markings, signals, shelters and speed limiters).
In Petrosani, approximately 10% of residents own a bicycle, which means that this means of transport is not very popular among residents, and 70% of residents own at least one car. Promoting this mode of transport, namely cycling, as an alternative to the one that involves burning fossil fuels, can be a priority for decongesting traffic during peak hours, as well as for increasing air quality in the city.
Summarizing, the main malfunctions identified by the analysis of existing documents are the following: [19]
- Low number of parking spaces, especially in the central area, compared to the size of the existing car park;
- A small part of the road infrastructure on the city's street network requires rehabilitation and modernization works;
- Reduced modal quota of public transport;
- Failure to implement, in all areas of the municipality, measures that would allow the transition to public transport of people with electric buses, alongside the GreenLine Jiu Valley Project, to increase the population's accessibility to this means of transport;
- The current bicycle lane segments are insufficient and isolated;
- The absence of smart traffic lights in several points where they are strictly necessary:
- The conclusions of the analysis carried out on the relevant existing documents will be integrated with those resulting from the traffic study.
5. Data Collection
5.1. Methodology
The traffic measurements were carried out taking into account the recommendations of the AND normative 557/2015 – “Instructions for recording road traffic on public roads”, approved by Order of the Minister of Transport no. 481/233.03.2015.
To carry out traffic measurements in Petrosani, the technique of filming traffic sequences was used, followed by subsequent analysis of the footage and extraction of the necessary information. The respective technique presents a number of advantages, especially due to the precision of counting and separation by vehicle types and directions of travel. Given that the counting operation is carried out in the office and there is the possibility of stopping and reviewing, if necessary, certain sequences, the errors that occur if the counting is carried out directly by the operator in the field are eliminated.
Also, the positions where the video cameras were placed and the favorable weather conditions allowed for a quality recording of the traffic sequences, so that all directions of travel at the intersection could be observed.
The vehicles in the traffic flow composition were classified into the following categories: bicycles; motorcycles; cars; taxis; vans; minibuses; intercity buses; trucks and similar with 2 axles; trucks and similar with 3 and 4 axles; trucks and similar with 5 and over 5 axles; special vehicles.
The survey forms recorded all types of turns allowed at the respective intersections, for each entry artery, on the previously mentioned vehicle types. These vehicle categories were compacted so that the table of results obtained would be as relevant as possible.
In order to obtain data that would lead to the creation of a representative transport model, both analyses of existing relevant documents and direct field observations were carried out. As a result of these observations, the time periods and days that present peak road traffic values were established, as well as the intersections where information on traffic flows is required, so that they can be integrated into the transport model and lead to the shaping of general car traffic at the municipal level.
The locations were chosen both to obtain all the data necessary to create the transport model for the entire road network of Petrosani, and to validate and calibrate the data for special points of interest, taking into account the individual projects analyzed.
Therefore, the traffic measurements were carried out on working days and weekends, in the morning and afternoon peak intervals, in the following intersections: the Daranesti roundabout; the Victory Square roundabout; the Sancta Barbara roundabout; the BCR roundabout; Jiul intersection; the 1 Decembrie 1918 – St. O. Iosif Str. intersection; the Emergency Hospital roundabout; the Lidl intersection; the Airplane roundabout; Timisoara Street – Carol Schreter Street intersection; Anton Pann Street – Timisoara Street intersection; Central Square – Police intersection; Aviatorilor Street – NR 66 (the Rompetrol area) intersection; Aviatorilor Street – NR 66 (the Lukoil area) intersection; the Kaufland roundabout. The results of the traffic surveys carried out are presented in graphical form in the following chapters.
5.2. Coding of Road Arteries
Table 1 specifies the codings used for each of the locations where traffic surveys were conducted.
6. Critical Review – Traffic Flow Analysis, Modeling and Transport Model
6.1. General Presentation
6.1.1. Use of Information Technology in Traffic Studies
Traffic studies analyze the movement of vehicles on road networks in the form of traffic flows. From this point of view, it is found that road traffic can be carried out in “continuous flow” (without stops or delays) or in the form of “interrupted flow”.
In practice, the first category of traffic corresponds to travel outside localities, on national roads or motorways. The second category (interrupted flow) represents the situation of traffic in the urban environment. Consistent with the above, it results that urban traffic is characterized, for the most part, by mathematical models that are part of the theory of calculating the interrupted flow. The fragmentation of vehicle movements on urban road arteries is determined by the existence of intersections and pedestrian crossings.
It follows that the movement of vehicles through intersections determines a limitation on the time in which a traffic flow can cross the intersection within a unit of time (hour). Given these general theoretical considerations, the present traffic study primarily analyzed the conditions for the development of vehicle traffic at the intersections of the road network in the analyzed area. The movement of vehicles between intersections has been analyzed in terms of identifying possible obstacles affecting the course of traffic, affecting by obstructing or limiting the cross-section of the road. As part of the global analysis of road traffic in the area, arteries that ensure vehicle movement, as well as the related intersections, were assessed. Achieving efficient transport constantly requires careful analysis and assessment of the way travel is carried out.
It is noted that in order to establish a fair and rational transport solution, the decision-making process in transport policy must be based on analyses and optimizations of possible variants. Under these conditions, the adoption of the transport organization solution can be regarded as a managerial decision with multidisciplinary contributions from specialists engineers, urbanists, economists, environmental specialists, computer scientists, sociologists, etc.
The use of information technology and specialized programs for traffic engineering is a field of activity with multiple advantages in terms of analysis and optimization of transport solutions. In this regard, we signal the possibility of conducting analyses of the way road traffic is carried out using the concept of numerical modeling. This approach offers specialists the possibility of computer modeling of urban road networks (arteries and intersections) by generating geometric elements and introducing at intersections the traffic values for which the traffic study is intended.
The choice of calculation programs requires, on the one hand, knowledge of the beneficiary's requirements, and on the other hand, a detailed assessment of the performance of the calculation programs that will be used as working tools. The calculation programs used in the field of traffic studies offer the possibility of performing dynamic analyses, in real time, on the variants proposed for analysis. Under these conditions, the program represents a valuable analysis tool, both in terms of creating traffic models and in terms of optimizing solutions for traffic on urban road networks.
6.1.2. Presentation of the Modeling Program
A transport model must represent, to an acceptable level, the existing transport situation in terms of travel demand and operating conditions. This is measured in terms of travel modes, number of vehicles on the network, travel time and the location and magnitude of the congestion phenomenon. A simple transport model was used to develop the traffic study, based on the Synchro and SimTraffic software programs.
Synchro is a macroscopic traffic analysis and optimization application, based on the Highway Capacity Manual methodology (2000 and 2010 methods) for signalized intersections and roundabouts.
SimTraffic is a traffic microsimulation software application that also allows for the modeling of individual vehicles. SimTraffic can model traffic lighted intersections and intersections without traffic lights, as well as road sections with cars, trucks, pedestrians, and buses. The analysis of the results obtained through traffic modeling is done using the simulation and visualization programs SimTraffic or CORSIM. The results can also be exported for the H.C.S. (Highways Capacity Software) program.
In this regard, the following categories of information can be analyzed: total delay of vehicles at intersection entrance (sec); vehicle parking time at the intersection entrance (sec/veh); average traffic speed (km/h); fuel consumption (l/km); number of vehicles that cannot enter the intersection on the green light; length of the column of vehicles that accumulate at the intersection entrance. [19]
6.2. Analysis of the Study Area
In the analysis in this chapter, the study area is represented by the entire Petrosani municipality, the purpose being to create a transport model for the current situation and to make forecasts that will be presented in the next chapter. In the case of the analyzed individual proposals, the study area will be specified for each case. A detailed analysis of the study area, specifying the identified malfunctions, was carried out in the previous chapters.
As previously mentioned, the realization of the transport model is based on the formalization of the considered transport network, through graph theory. Thus, the transport network modeled in the traffic study for Petrosani includes the main street network, as well as the configuration and type of intersections control.
Modeling the transport network involved a complex analysis process, which included: conducting a survey on all streets and roads in the considered area, to determine the geometric configuration of each street/intersection; the functionality of the traffic artery/intersection in the network; the type and condition of the roadway; the mode of traffic regulation; other characteristics: parking spaces, public transport routes, prohibitions for certain types of vehicles, etc.
For each segment (traffic artery) and node (intersection) of the network, data were entered regarding: the number of lanes per direction; the width of the traffic lanes; the maximum permitted speed; the modes of transport to which access is allowed; the traffic regulations in force; other relevant data.
The following are the sketches of the intersections extracted from the transport model, with the representation of the traffic volumes (in standard vehicles) resulting from the stages of model development, calibration and validation. This chapter presents the intersections where traffic counts were carried out. Depending on the need, additional sketches of other intersections were presented in the chapter where proposals are presented, as a result of all the analyses carried out. [19]
6.3. Traffic Volumes and Parameters – 2025
In the traffic model created by introducing the road network in Petrosani, traffic volumes by direction of travel resulting from traffic measurements were introduced.
To equate physical vehicles to passenger car-type standard vehicles, Standard SR7348/2001 – Road Works was used.
The provisions of this standard are used in traffic and circulation studies carried out for the purpose of systematizing the road network, as well as in investment projects for roads, including streets. The provisions of the standard are applicable to all categories and technical classes of roads and streets.
By properly choosing the intersections in which traffic analyses were carried out and by processing the data using the transport model, a distribution of vehicle flows throughout the entire road network of the municipality was carried out.
In order to model the vehicle traffic flow as accurately as possible, the following parameters were selected for the comparative analysis between the models produced:
- Intersection Capacity Utilization (ICU) Factor and Intersection Level of Service;
- The intersection capacity utilization factor is calculated based on the volume/capacity ratio and provides an indication of the degree of congestion of the intersection on each entry artery.
The ICU coefficient can indicate the available capacity reserve of the intersection or the extent to which this reserve has been exceeded. The coefficient cannot estimate delays, but it can be used to indicate cases in which an intersection will be congested. It can also be used for an intersection without traffic lights to assess traffic conditions and traffic capacity.
The level of service of intersections according to the capacity utilization factor provides a picture of how an intersection operates and the value of additional capacity it is capable of taking on.
The level of service can be used to assess the quality of travel at intersections, as follows:
- Level A. The intersection does not show traffic congestion. The movement of the vehicles is done without delays and most arriving vehicles can cross the intersection. Most vehicles do not stop at all. This intersection can support up to 40% higher traffic volumes;
- Level B expresses the fact that the intersection works with minor delays. The estimated value of the delays is between 10 s/veh and 20 s/veh. The intersection can support up to 30% higher traffic volumes;
- Level C describes vehicle movements at the intersection with limited delays, ranging from 20 s/veh to 35 s/veh. These delays may result from vehicles moving at a moderate speed. Under these conditions, lane overload may occur. The intersection can support traffic volumes up to 20% higher;
- Level D describes vehicle movements at the intersection with controlled delays greater than 35 s/veh, up to 55 s/veh. Within this level of service, the influence of congestion in traffic becomes noticeable. The intersection can support up to 10% higher traffic volumes;
- Level E describes the driving conditions of vehicles at the intersection with controlled delays between 55 s/veh - 80s/veh. The high delay values indicate reduced intersection travel speeds and high volume/capacity (v/c) indicator rates. The intersection has less than 10% higher capacity reserve;
- Level F indicates a level of delays greater than 80 s/veh. This level, considered unacceptable by most drivers, often occurs in traffic jam situations. In terms of the flows that determine this high level of delays, it can be noted that this situation occurs when the rate of arrival flow exceeds the capacity of the traffic lane groups. For this level of service, the speed of vehicles is reduced and stops in the flow are often observed;
- Level G: The intersection is 10% - 20% above its capacity and congestion periods of 60 to 120 minutes per day, are likely. Queues are long and frequent traffic jams may occur;
- Level H: The intersection is more than 20% over traffic capacity and congestion of more than 120 minutes per day may occur. Queues are long and frequent traffic jams may occur.
Average delay/vehicle: The parameter indicates the average delay recorded by each vehicle when crossing a certain intersection, compared to the ideal situation, in which the movement would have taken place without stops, at the maximum permitted speed.
Number of stops/vehicle: The number of stops/vehicle is calculated by dividing the total number of stops by the number of vehicles crossing the intersection per unit of time, with a stop being counted when the vehicle speed drops below 3 m/s. The vehicle is considered to have started again when its speed exceeds 4.5 m/s.
Average speed: It represents the value resulting from dividing the total distance by the total travel time of a certain portion of the transport model (artery, intersection, area, etc.). [19]
The traffic parameters corresponding to the current situation are shown in the table below.

Table 2.
Traffic parameters, working day, peak hour, 2025.
| Intersection name | Delay / Veh (s/veh.) | No. of stops / vehicle. | Average speed (km/h) |
| Daranesti Roundabout | 23,6 | 0,2 | 22 |
| Victory Square Roundabout | 22,5 | 1,0 | 23 |
| Sancta Barbara Roundabout | 21,5 | 1,0 | 25 |
| BCR Roundabout | 35,7 | 1,0 | 20 |
| Jiul Intersection | 53,9 | 1,0 | 14 |
| 1 Decembrie 1918 Street – St. O. Iosif Street Intersection | 41,3 | 1,0 | 17 |
| Emergency Hospital Roundabout | 36,1 | 0,97 | 19 |
| Lidl Intersection | 19,1 | 0,43 | 28 |
| Airplane Roundabout | 20,3 | 0,95 | 25 |
| Timisoara Street – Carol Schreter Street Intersection | 25,1 | 0,63 | 21 |
| Anton Pann – Timisoara Street Intersection | 24,7 | 0,92 | 18 |
| Central Square – Police Intersection | 47,0 | 1,0 | 15 |
| Aviatorilor Street – NR 66 (Rompetrol area) Intersection | 11,2 | 0,08 | 34 |
| Aviatorilor Street – NR 66 (Lukoil area) Intersection | 13,5 | 0,10 | 31 |
| Kaufland Roundabout | 12,7 | 1,0 | 24 |
6.4. Traffic Volumes and Parameters – 2030
To analyze the situation for the medium-term forecast year, 2030, the forecasts made in the previous chapter were used and the vehicle volumes in the transport network were modified accordingly.
After running the model for the year 2030, the same traffic parameters were generated and analyzed, as for the base year. The traffic parameters corresponding to the year 2030 are presented below.
Table 3.
Traffic parameters, work day, peak hour, 2030.
| Intersection name | Delay / Veh (s/veh.) | No. of stops / vehicle. | Average speed (km/h) |
| Daranesti Roundabout | 28,8 | 0,40 | 20 |
| Victory Square Roundabout | 27,5 | 1,0 | 21 |
| Sancta Barbara Roundabout | 26,3 | 1,0 | 23 |
| BCR Roundabout | 43,9 | 1,0 | 18 |
| Jiul Intersection | 66,9 | 1,0 | 13 |
| 1 Decembrie 1918 Street – St. O. Iosif Street Intersection | 51,2 | 1,0 | 15 |
| Emergency Hospital Roundabout | 44,4 | 1,0 | 17 |
| Lidl Intersection | 23,5 | 0,54 | 25 |
| Airplane Roundabout | 25,0 | 1,0 | 23 |
| Timisoara Street – Carol Schreter Street Intersection | 31,4 | 0,76 | 19 |
| Anton Pann – Timisoara Street Intersection | 30,7 | 1,0 | 16 |
| Central Square – Police Intersection | 57,8 | 1,0 | 13 |
| Aviatorilor Street – NR 66 (Rompetrol area) Intersection | 13,7 | 0,11 | 30 |
| Aviatorilor Street – NR 66 (Lukoil area) Intersection | 16,6 | 0,14 | 27 |
| Kaufland Roundabout | 15,7 | 1,0 | 21 |
The deterioration of traffic parameters compared to the situation in the base year, 2023, is evident, due to the increase in the motorization index and the average number of trips, given that no measures/projects are implemented to contribute to reducing/eliminating their negative impact. [19]
6.5. Identifying Malfunctions
Based on the parameters generated using the transport module, both for the base year, 2023, and for the medium-term forecast year, 2030, a detailed analysis of traffic conditions and road infrastructure within Petrosani was carried out. In order to obtain graphic images that would help in the comparative analysis of the different scenarios analyzed, charts were created, presenting details regarding:
- Average speed on each lane;
- Average delay on each lane
Below are the corresponding charts for the two years analyzed (the reference year, 2025 and the medium-term forecast year, 2030), in the version in which the current situation continues, respectively without the implementation of projects supporting sustainable urban mobility. In order to obtain sufficient clarity of the images, they have been rendered by areas of the municipality.
As a result of the traffic diagnosis carried out, the following results were obtained:
- The highest traffic volumes are recorded on working days, AM peak hour;
- The traffic capacity of some important intersections in the municipality is approaching its limit or is even exceeded during peak hours, which leads to traffic congestion and vehicle columns, with a negative effect on travel time and greenhouse gas emissions.
The main intersections in this situation and the corresponding capacity index are presented in the following table:
Table 4.
Volume/capacity ratio by intersections.
| Intersection name | Capacity utilization index (2025) | Capacity utilization index (2030) |
| Daranesti Roundabout | 66,3 | 89,0 |
| Victory Square Roundabout | 65,4 | 88,3 |
| Sancta Barbara Roundabout | 64,7 | 87,7 |
| BCR Roundabout | 73,2 | 96,4 |
| Jiul Intersection | 81,2 | 104,6 |
| 1 Decembrie 1918 Street – St. O. Iosif Street Intersection | 75,4 | 98,5 |
| Emergency Hospital Roundabout | 73,8 | 97,2 |
| Lidl Intersection | 62,9 | 85,6 |
| Airplane Roundabout | 64,2 | 87,1 |
| Timisoara Street – Carol Schreter Street Intersection | 67,4 | 89,8 |
| Anton Pann – Timisoara Street Intersection | 67,0 | 89,6 |
| Central Square – Police Intersection | 78,6 | 101,9 |
| Aviatorilor Street – NR 66 (Rompetrol area) Intersection | 56,8 | 79,9 |
| Aviatorilor Street – NR 66 (Lukoil area) Intersection | 58,5 | 81,3 |
| Kaufland Roundabout | 57,6 | 80,8 |
As can be seen in the table above, if the current situation continues and there is no intervention in the field of sustainable urban mobility, a large number of important intersections will become blocked, due to the increase in motorization.
Thus, in 2025 there is no intersection with an exceeded value (over 100%) and 3 intersections with ICU > 75% (high potential for congestion, high delays, low traffic speed), while in 2030 there will be 5 intersections with ICU > 75%, and of these 2 will have ICU > 100% and 3 will have ICU> 90%, reaching Level of Service F.
The average traffic speed at the network level is relatively low, the situation deteriorating further with the increase in the degree of motorization and the average number of trips by 2030. [19]
The main causes of this situation are:
- The relatively inadequate state of the public transport infrastructure, which leads to the lack of attractiveness of this mode of transport for citizens, with effects on operating efficiency, travel time and commercial travel speeds;
- High modal quota of car trips, including due to the lack of elements to stimulate sustainable urban mobility, namely public transport, bicycle and pedestrian travel;
- Reduced traffic capacity of certain arteries/intersections, leading to low traffic speeds and the generation of vehicle columns, with strong negative effects on the quality of the environment and the quality of life of citizens;
- The traffic light system is not a modern system that ensures adaptive traffic management and correlation of traffic lights, including those at pedestrian crossings with buttons;
- Bicycle-travel specific infrastructure is insufficient; the existing bicycle lanes are partially occupied by irregularly parked cars; reduced accessibility to this clean mode of transport due to the lack of a bike-sharing system;
- Several sidewalks are degraded or partially occupied by illegally parked vehicles, with negative effects on pedestrian safety;
-
The high traffic volumes during peak hours are due to:
- ➢
- The low level of use of public transport; the lack of attractiveness of this mode of transport;
- ➢
- Lack of accessibility to cycling, due to the lack of a coherent network of bike lanes.
- Reduced capacity to use roadways due to vehicles parked on the lanes. In the case of streets with one lane per direction, parking of vehicles on both sides makes it impossible to travel in both directions simultaneously, which leads to frequent stops and a decrease in average traffic speed. [19]
7. Proposals for Traffic Fluidization – Solutions
7.1. Organization of Public Passenger Transport with Electric Buses
Green line of electric buses in Petrosani, connected to the GreenLine Jiu Valley Project (according with Figure 4)
The proposal connects to the Zonal Development Project “Green Line of Electric Buses between Petrila – Petrosani – Aninoasa – Vulcan – Lupeni – Uricani – GreenLine Jiu Valley”, planned to be implemented in a short term and involves:
- A. Establishing a mini depot in Petrosani that will contain:
- Garage - loading - maintenance – washing buildings;
- Purchase of installations and equipment for charging - maintenance - washing electric buses;
- Administrative building;
- Fast charging station;
- 2000 kVA transformer power station;
- Electricity supply system for charging power stations;
- Utility power supply;
- Premises arrangement, including perimeter lighting;
- Secure fencing.
- B. ITS facilities:
- AVL subsystem - Vehicle monitoring and dispatching solution;
- E-ticketing subsystem – toll solution based on the use of contactless cards and paper tickets;
- In-vehicle passenger information subsystem - information panels in LED technology and infotainment;
- Vehicle passenger counting subsystem (video technology);
- Security subsystem - vehicle-level video monitoring solution.
- C. Purchase of electric buses of approximately 8-10 m length;
- D. Establishing an end station at Victory Square;
- E. Establishing an end station opposite OMV;
- F. Establishment and modernization of local passenger stations.
The objectives expected to be achieved by the implementation of this proposal are as follows:
- A. General objective of the proposal:
- Reducing carbon emissions in Petrosani, according to the Sustainable Urban Mobility Plan, including promoting urban mobility based on the use of clean, improved public passenger transport and reducing the number of trips by private car.
- B. Specific objectives of the proposal:
- Developing high-quality, attractive and efficient public passenger transport in Petrosani, by establishing a public transport service, expanding the routes currently covered by private operators;
- Modernizing the transport system and increasing its attractiveness for the general public by introducing intelligent coordination, information and ticket issuance/validation (“e-ticketing”) systems;
- Ensuring a direct positive impact on the reduction of CO2 equivalent emissions in Petrosani by using environmentally friendly, clean buses within the public passenger transport system;
- Promoting the use of the non-polluting public passenger transport system in Petrosani, instead of private car transport, by informing the public about the advantages and benefits of using public transport, as well as other information on the measures taken to contribute to increase the attractiveness of public transport;
- Regulating parking policy, while promoting the use of public transport.
7.2. Optimization of Road Traffic in the Area Delimited by 1 Decembrie 1918 Boulevard and St.O.Iosif, 22 Decembrie, 6 August, Muncii and General Dragalina Streets
Proposal regarding the systematization of road traffic and traffic fluidization in Petrosani – the area delimited by 1 Decembrie 1918 Boulevard and St.O.Iosif, 22 Decembrie, 6 August, Muncii and General Dragalina streets (according with Figure 5)
Due to the reported malfunctions regarding the smooth flow of road traffic in the area delimited by 1 Decembrie 1918 Boulevard and St.O.Iosif, 22 Decembrie, 6 August, Muncii and General Dragalina streets, an analysis of the traffic in this area was conducted, an analysis that highlighted the following aspects:
- traffic jams occur especially during periods of high traffic flows, namely on working days, around 8 am, 12 pm, 2 pm and 4 pm;
- the increase in road flow is influenced by the geometry of the street layout in this central area of the city and the existence of an educational establishment. (according with Figure 6)
- the streets in the mentioned area have a low width, which does not allow two-way traffic. (according with Figure 7)
- due to the small number of available parking spaces and the narrow width of the roadway, vehicles are parked longitudinally, in most cases occupying one lane. (according with Figure 8)
- the impossibility of relocating vehicles parked in adjacent parking spaces to free up one lane of traffic. (according with Figure 9)
The measurements carried out revealed the high number of critical situations that occurred in this area and the obvious shortcomings that arise regarding the traffic safety and the comfort of the road users.
The following figure shows the situation of the weighted average number of traffic jams occurring on each portion of the studied area, the measurements being made on working days, on non-working days, during and outside school holidays.
Taking into account all these aspects, as well as those related to the geometry of the street layout, the possibilities of relocating parked vehicles, the possibility of using adjacent streets, maintaining easy access for vehicle owners in the area to nearby parking spaces and, last but not least, the fact that we have educational units and public institutions in the immediate vicinity (I.G.Duca General School and Petrosani City Hall), we conclude that the most efficient solution that can be applied in order to optimize road traffic and eliminate traffic jams is the implementation of a set of one-way streets on the streets in this area, as presented below:
7.3. Development of a Network of Lanes Dedicated to Bicycle Traffic, Implementation of a Bike-Sharing System
7.3.1. Context
The proposed proposal “Development of a network of lanes dedicated to bicycle traffic, implementation of a bike-sharing system” has as its main objective the increase of the attractiveness, accessibility and safety of users of this mode of transport, with positive effects on reducing the level of pollution in Petrosani.
The main actions to be taken to implement the proposal are the following:
- Creating bicycle lanes on the territory of Petrosani so that these create an integrated system, which ensures the movement of users of this mode of transport between the main points of attraction/generation of trips, to the detriment of the use of personal vehicles;
- Implementing a bike-sharing system that will increase the attractiveness and accessibility of this mode of transport, as well as to promote intermodality, by locating rental points near public transport stations.
From the analysis of the current situation, the following malfunctions resulted:
- High modal quota of car trips, including due to the lack of elements to stimulate sustainable urban mobility, namely public transport, bicycle and pedestrian travel;
- The traffic light system is not a modern system, that ensures a specific signaling for velo users;
- Bicycle-travel specific infrastructure is insufficient; existing bicycle lanes are partially occupied by irregularly parked cars; reduced accessibility to this clean mode of transport due to the lack of a bike-sharing system;
-
The high traffic volumes during peak hours due to:
- ➢
- The low level of use of public transport due to the lack of attractiveness of this mode of transport;
- ➢
- Lack of accessibility to cycling, due to the lack of a coherent network of bike lanes;
- ➢
- Lack of measures leading to the promotion of intermodality and alternative means of transport;
- ➢
- The current network of bicycle lanes does not ensure safe cycling between the main areas of attraction and generation of trips;
- ➢
- There are no bike-sharing centers to encourage the use of this clean mode of transport.
This proposal involves the implementation of a network of bicycle lanes at the level of the road infrastructure of Petrosani, in order to achieve the following objectives:
- Increasing the degree of population mobility;
- Reducing travel expenses and time spent in urban traffic jams;
- Reducing pollution and urban noise;
- Increasing accessibility and safety of the population;
- Creating an alternative urban transport solution;
- Ensuring intermodality, through the transfer between public transport and cycling;
- Increasing the quality of the environment and the quality of life of citizens.
7.3.2. Study Area of the Proposal
The study area of the project is considered to be the entire area covered by the urban road transport network in Petrosani, due to the locations proposed for the bicycle lane network and its influence on all movements within the municipality, regardless of the mode of travel used, but especially on public transport, by bicycle and on foot.
Also, the assessment of the effects at the level of the entire road network, through the results extracted from the transport model, allows the issuance of conclusions from which the positive impact of the proposal can emerge.
The proposed network of bicycle lanes is designed to provide the main connections with residential areas, main educational institutions and areas with services of interest at the level of the municipality, recreation areas. The network of bicycle lanes created will ensure the connection between the central area and residential neighbourhoods with high population density, as well as the connection with the area of the railway station and bus station.
The bicycle lanes proposed to be implemented are marked in the figure below and will have a total length of 3.3 km, estimated to serve about 25% of the population.
These bicycle lanes will be built on Aviatorilor Street, 1 Iunie Street, Independentei Street, Unirii Street, Oituz Street, 1 Decembrie 1918 Street, Carpati Street, Carol Schreter Park, Victory Square and Avram Iancu Street, with the role of ensuring the connection with the areas of interest of the municipality.
From the analysis of the proposed routes for the creation of bicycle lanes, it is observed that they overlap with the road network on which public transport vehicles circulate. Taking into account this aspect, as well as the objective of increasing accessibility to bicycle travel and promoting intermodality, the proposal must be complemented by the implementation of a bike-sharing system. The stations included in the bicycle rental network will be arranged especially in the vicinity of public transport stations, so as to allow and stimulate a convenient and fast intermodal transfer between these modes of travel. [19]
7.4. Construction of Footbridges in the Lunca and Parangul Areas
The construction of two footbridges could make access to and from the Livezeni Mine, the Livezeni Halt, the car repair shops located on the western side of the railway and the block district in the Parangul area much easier, respectively to and from the Stadium area, the southern part of the Petrosani Colony, the area of the Sunday Fair and the Carpati neighbourhood, according to Figure 10 and Figure 11.
7.5. Constructive Modifications to the Intersection Between Closca Street and 1 Decembrie 1918 Boulevard in Order to Create Parking Spaces and Improve Accessibility
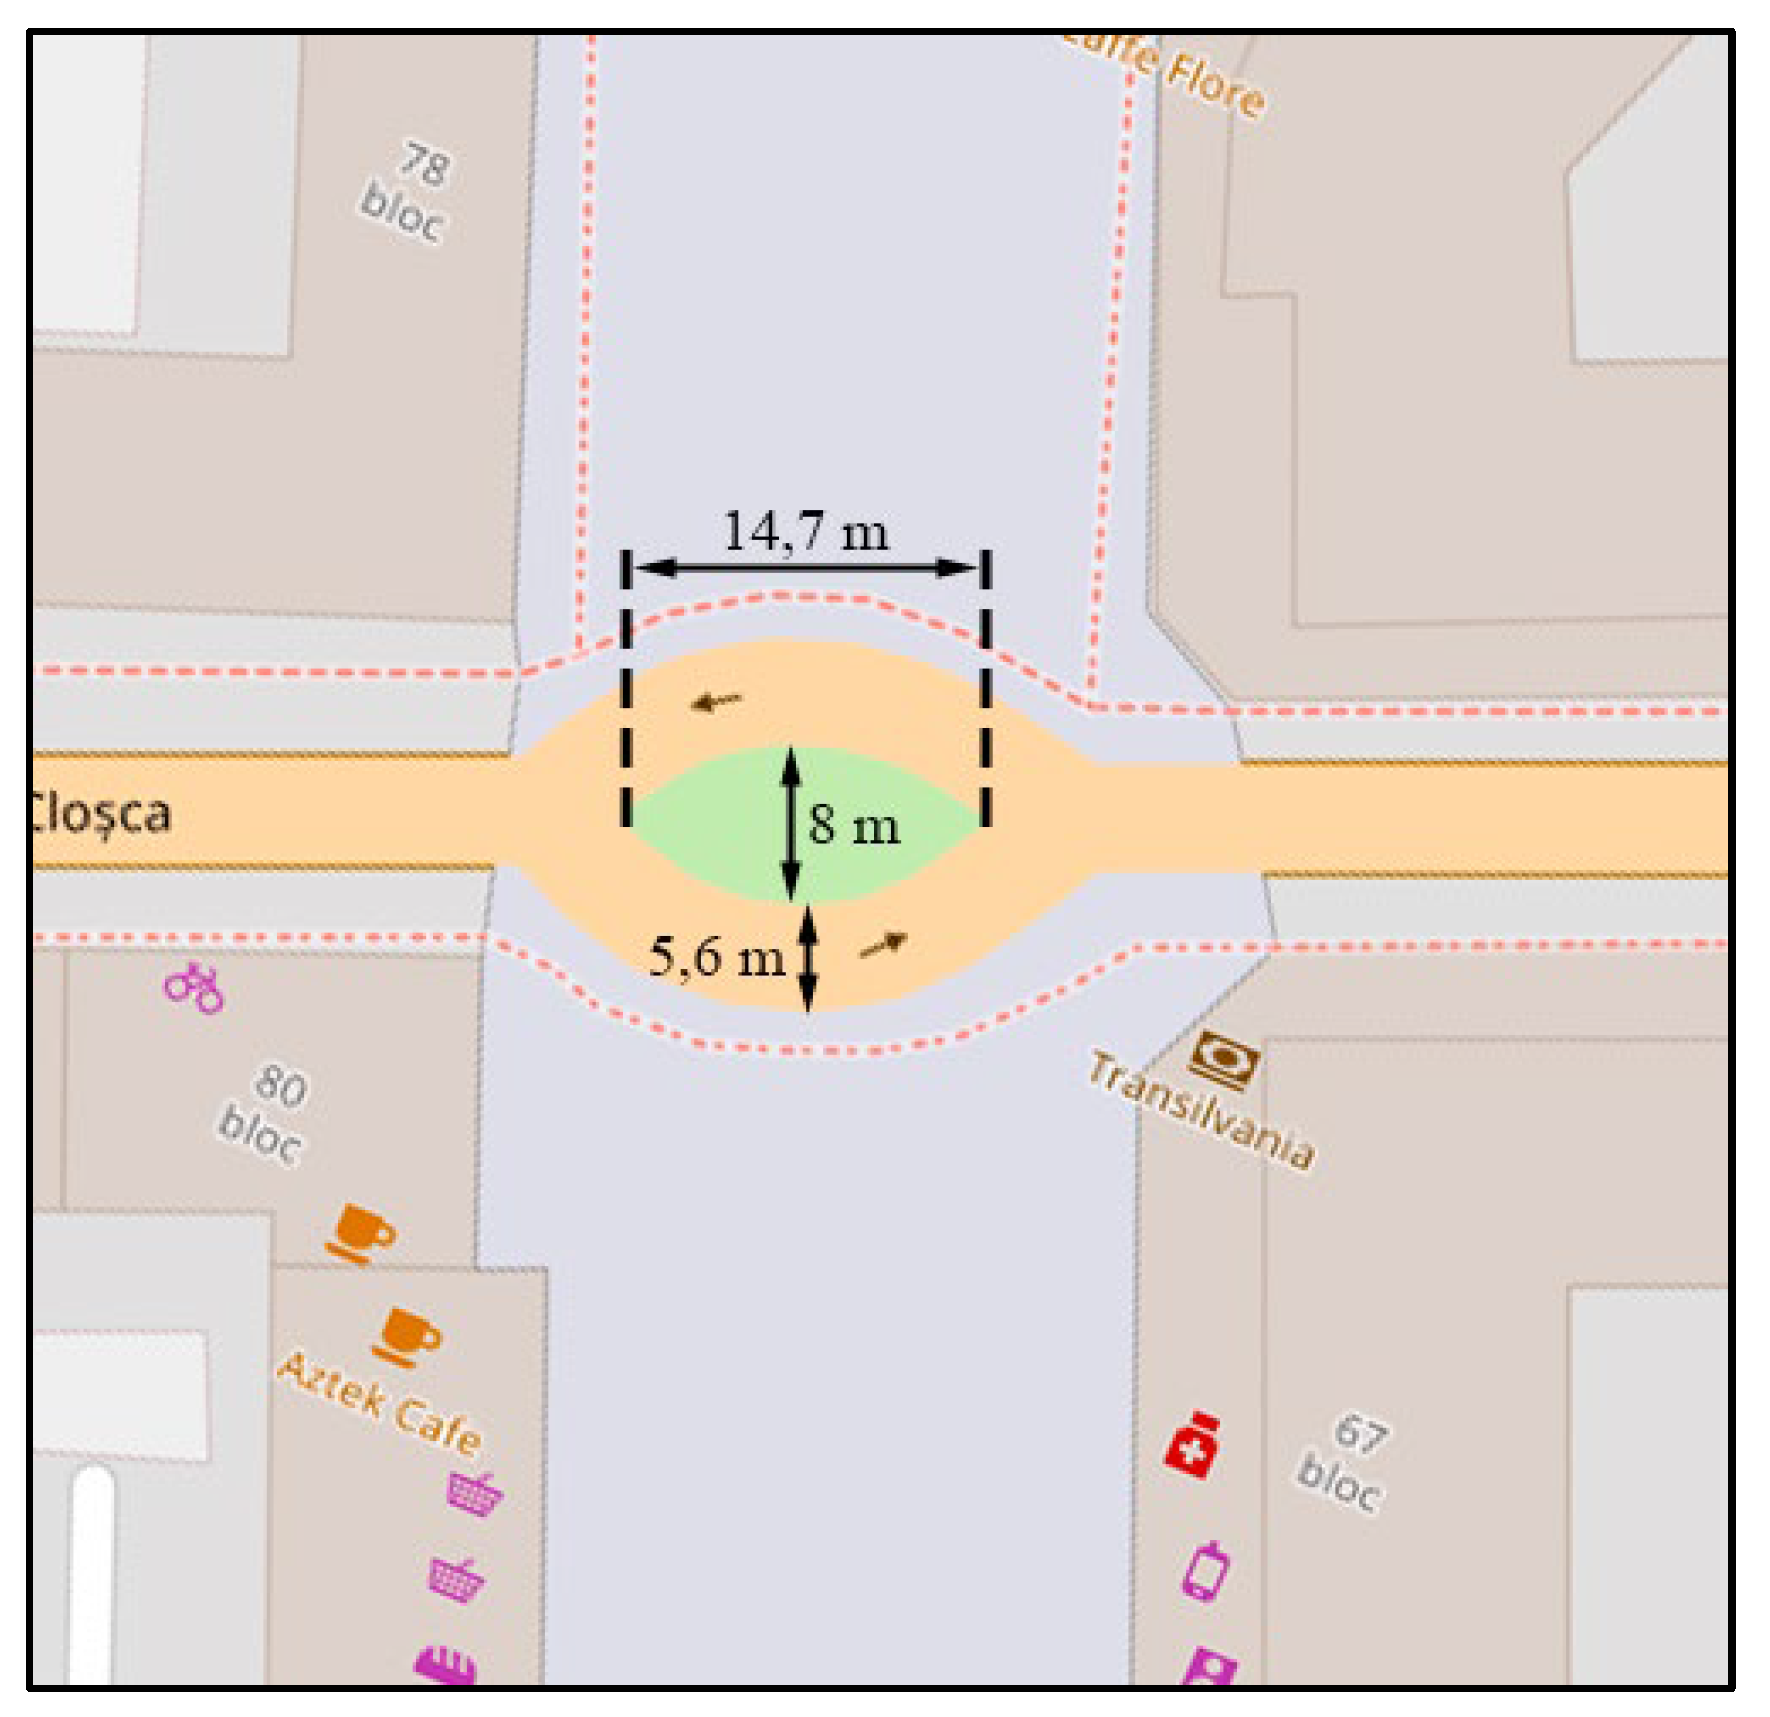
The intersection between Closca Street and 1 Decembrie 1918 Boulevard represents a “hot spot” in the infrastructure of Petrosani. In order to meet current traffic needs and improve accessibility, significant intervention on its components is necessary. We present further the current plan of the intersection and two variants of changes.
Figure 12.
Banca Transilvania Square.
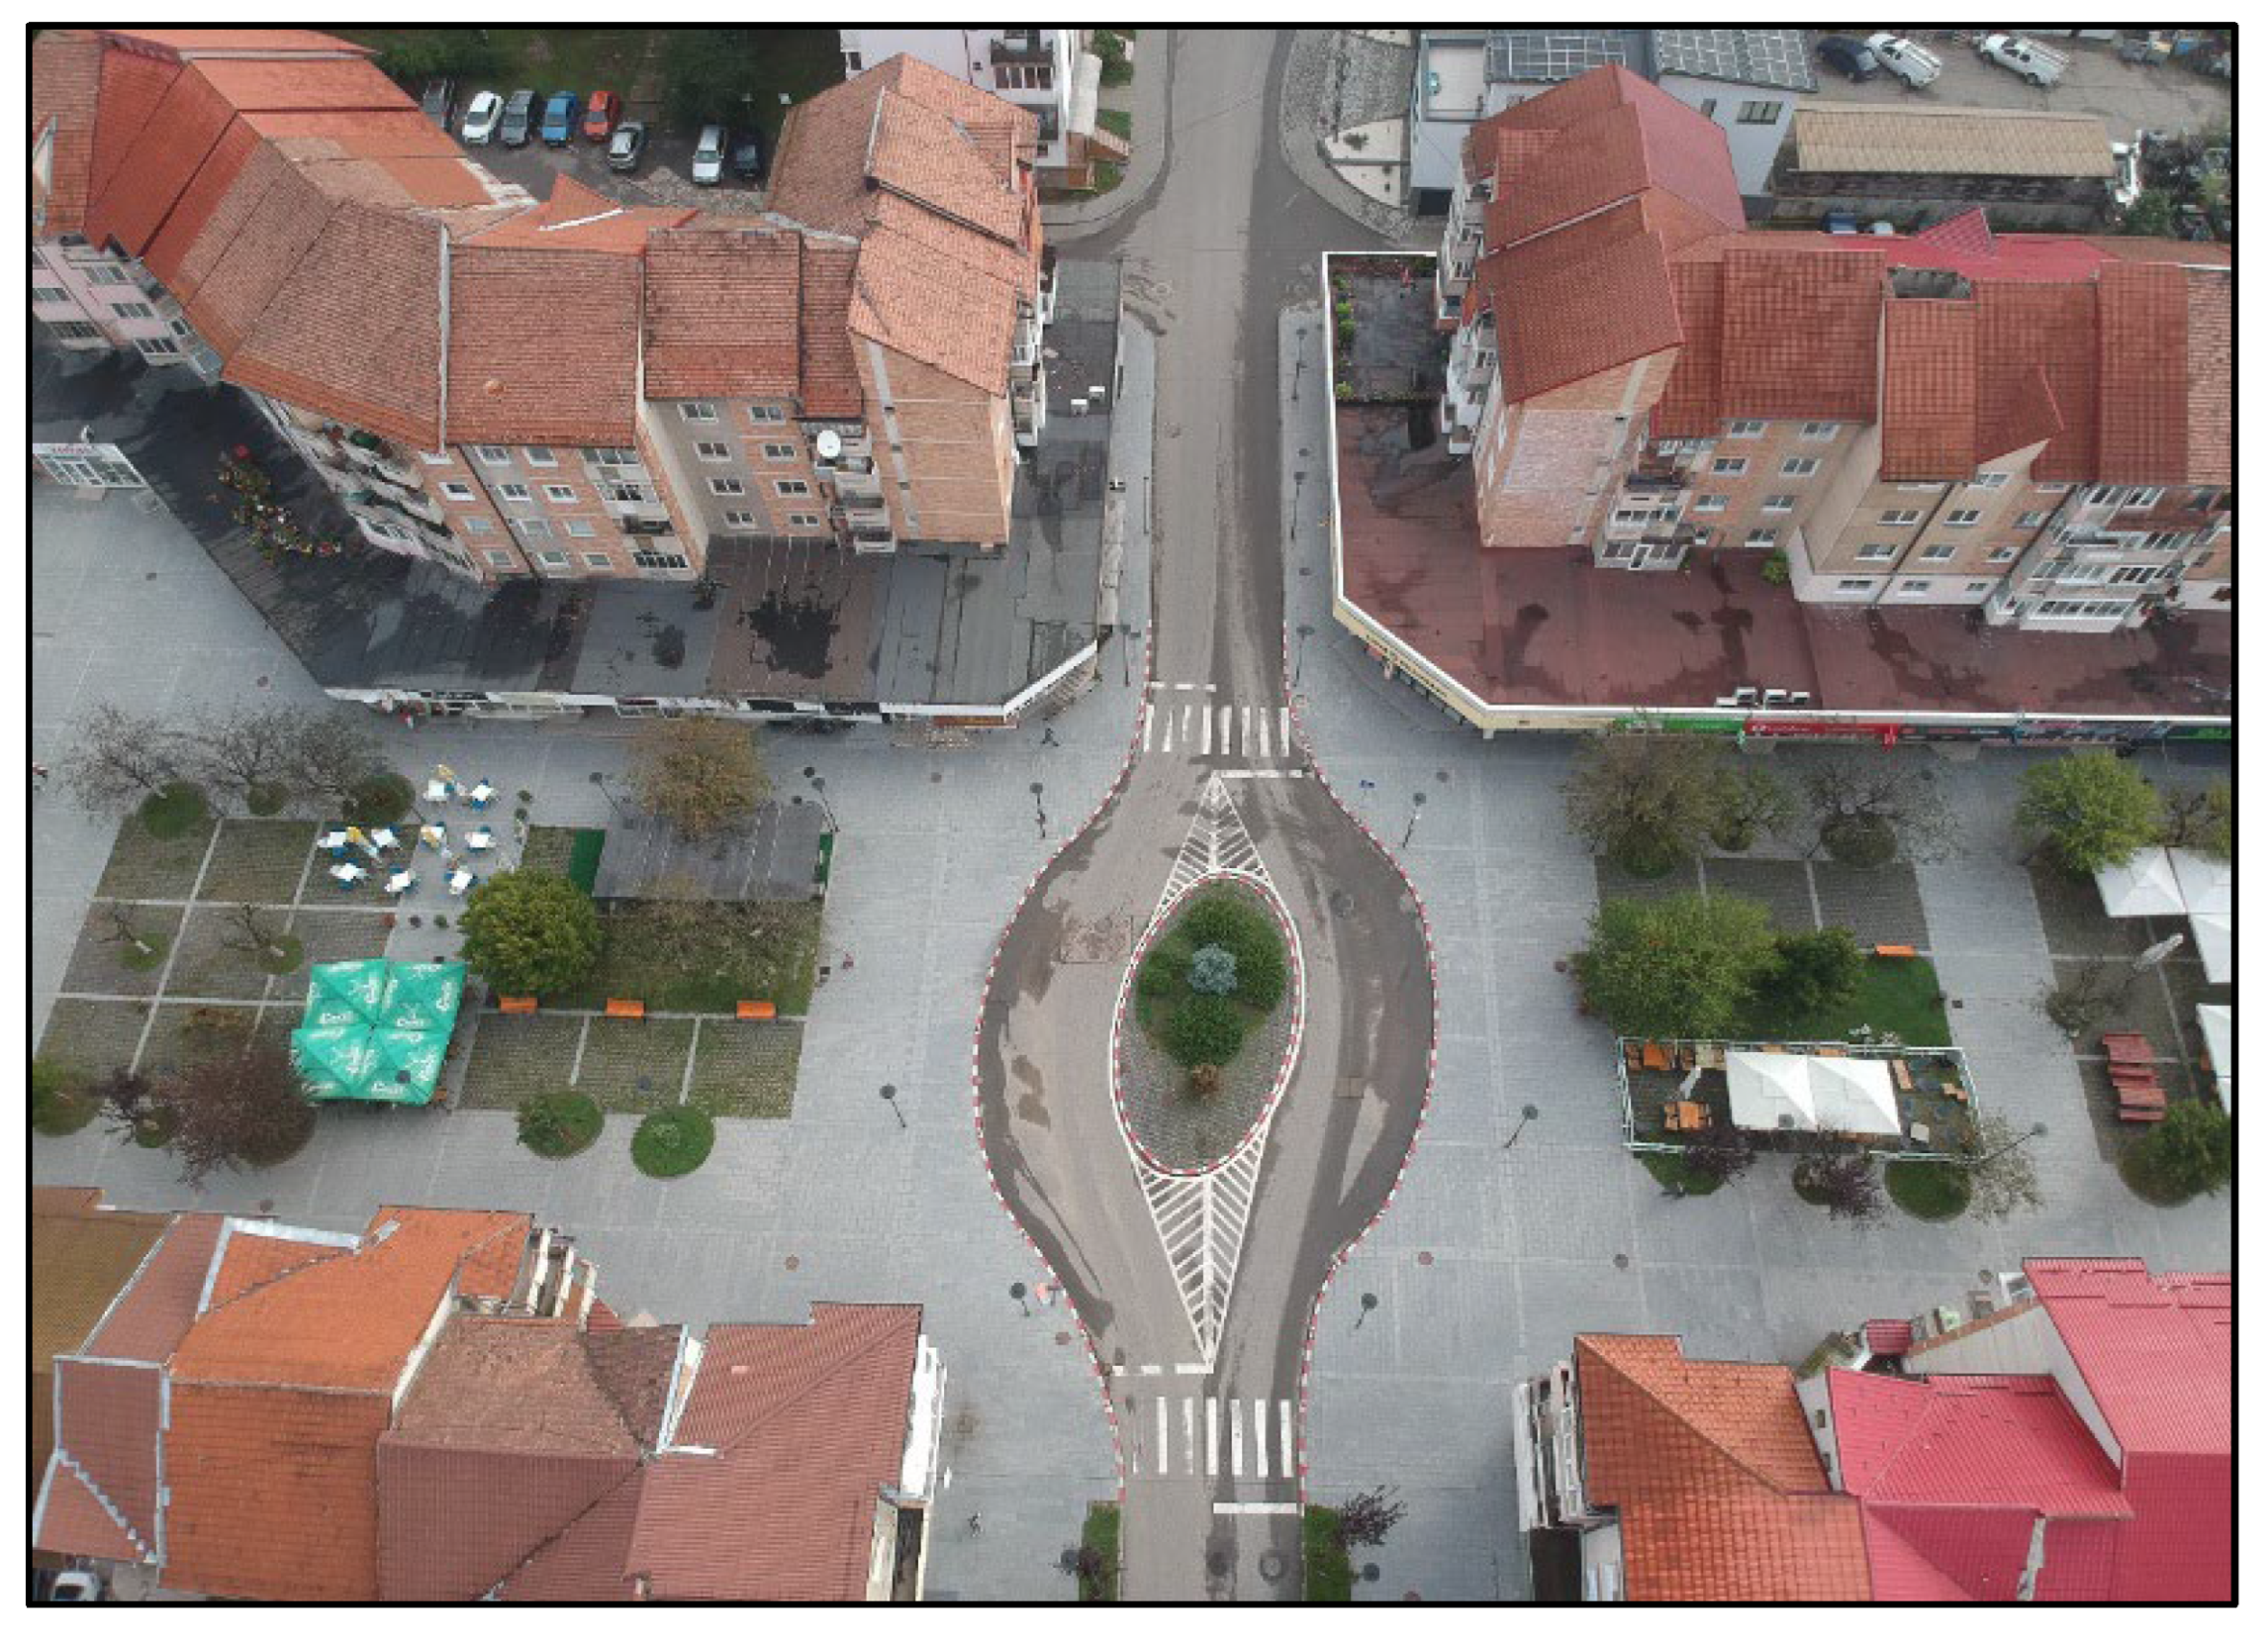
Figure 13.
Current plan of the square.
- Variant 1
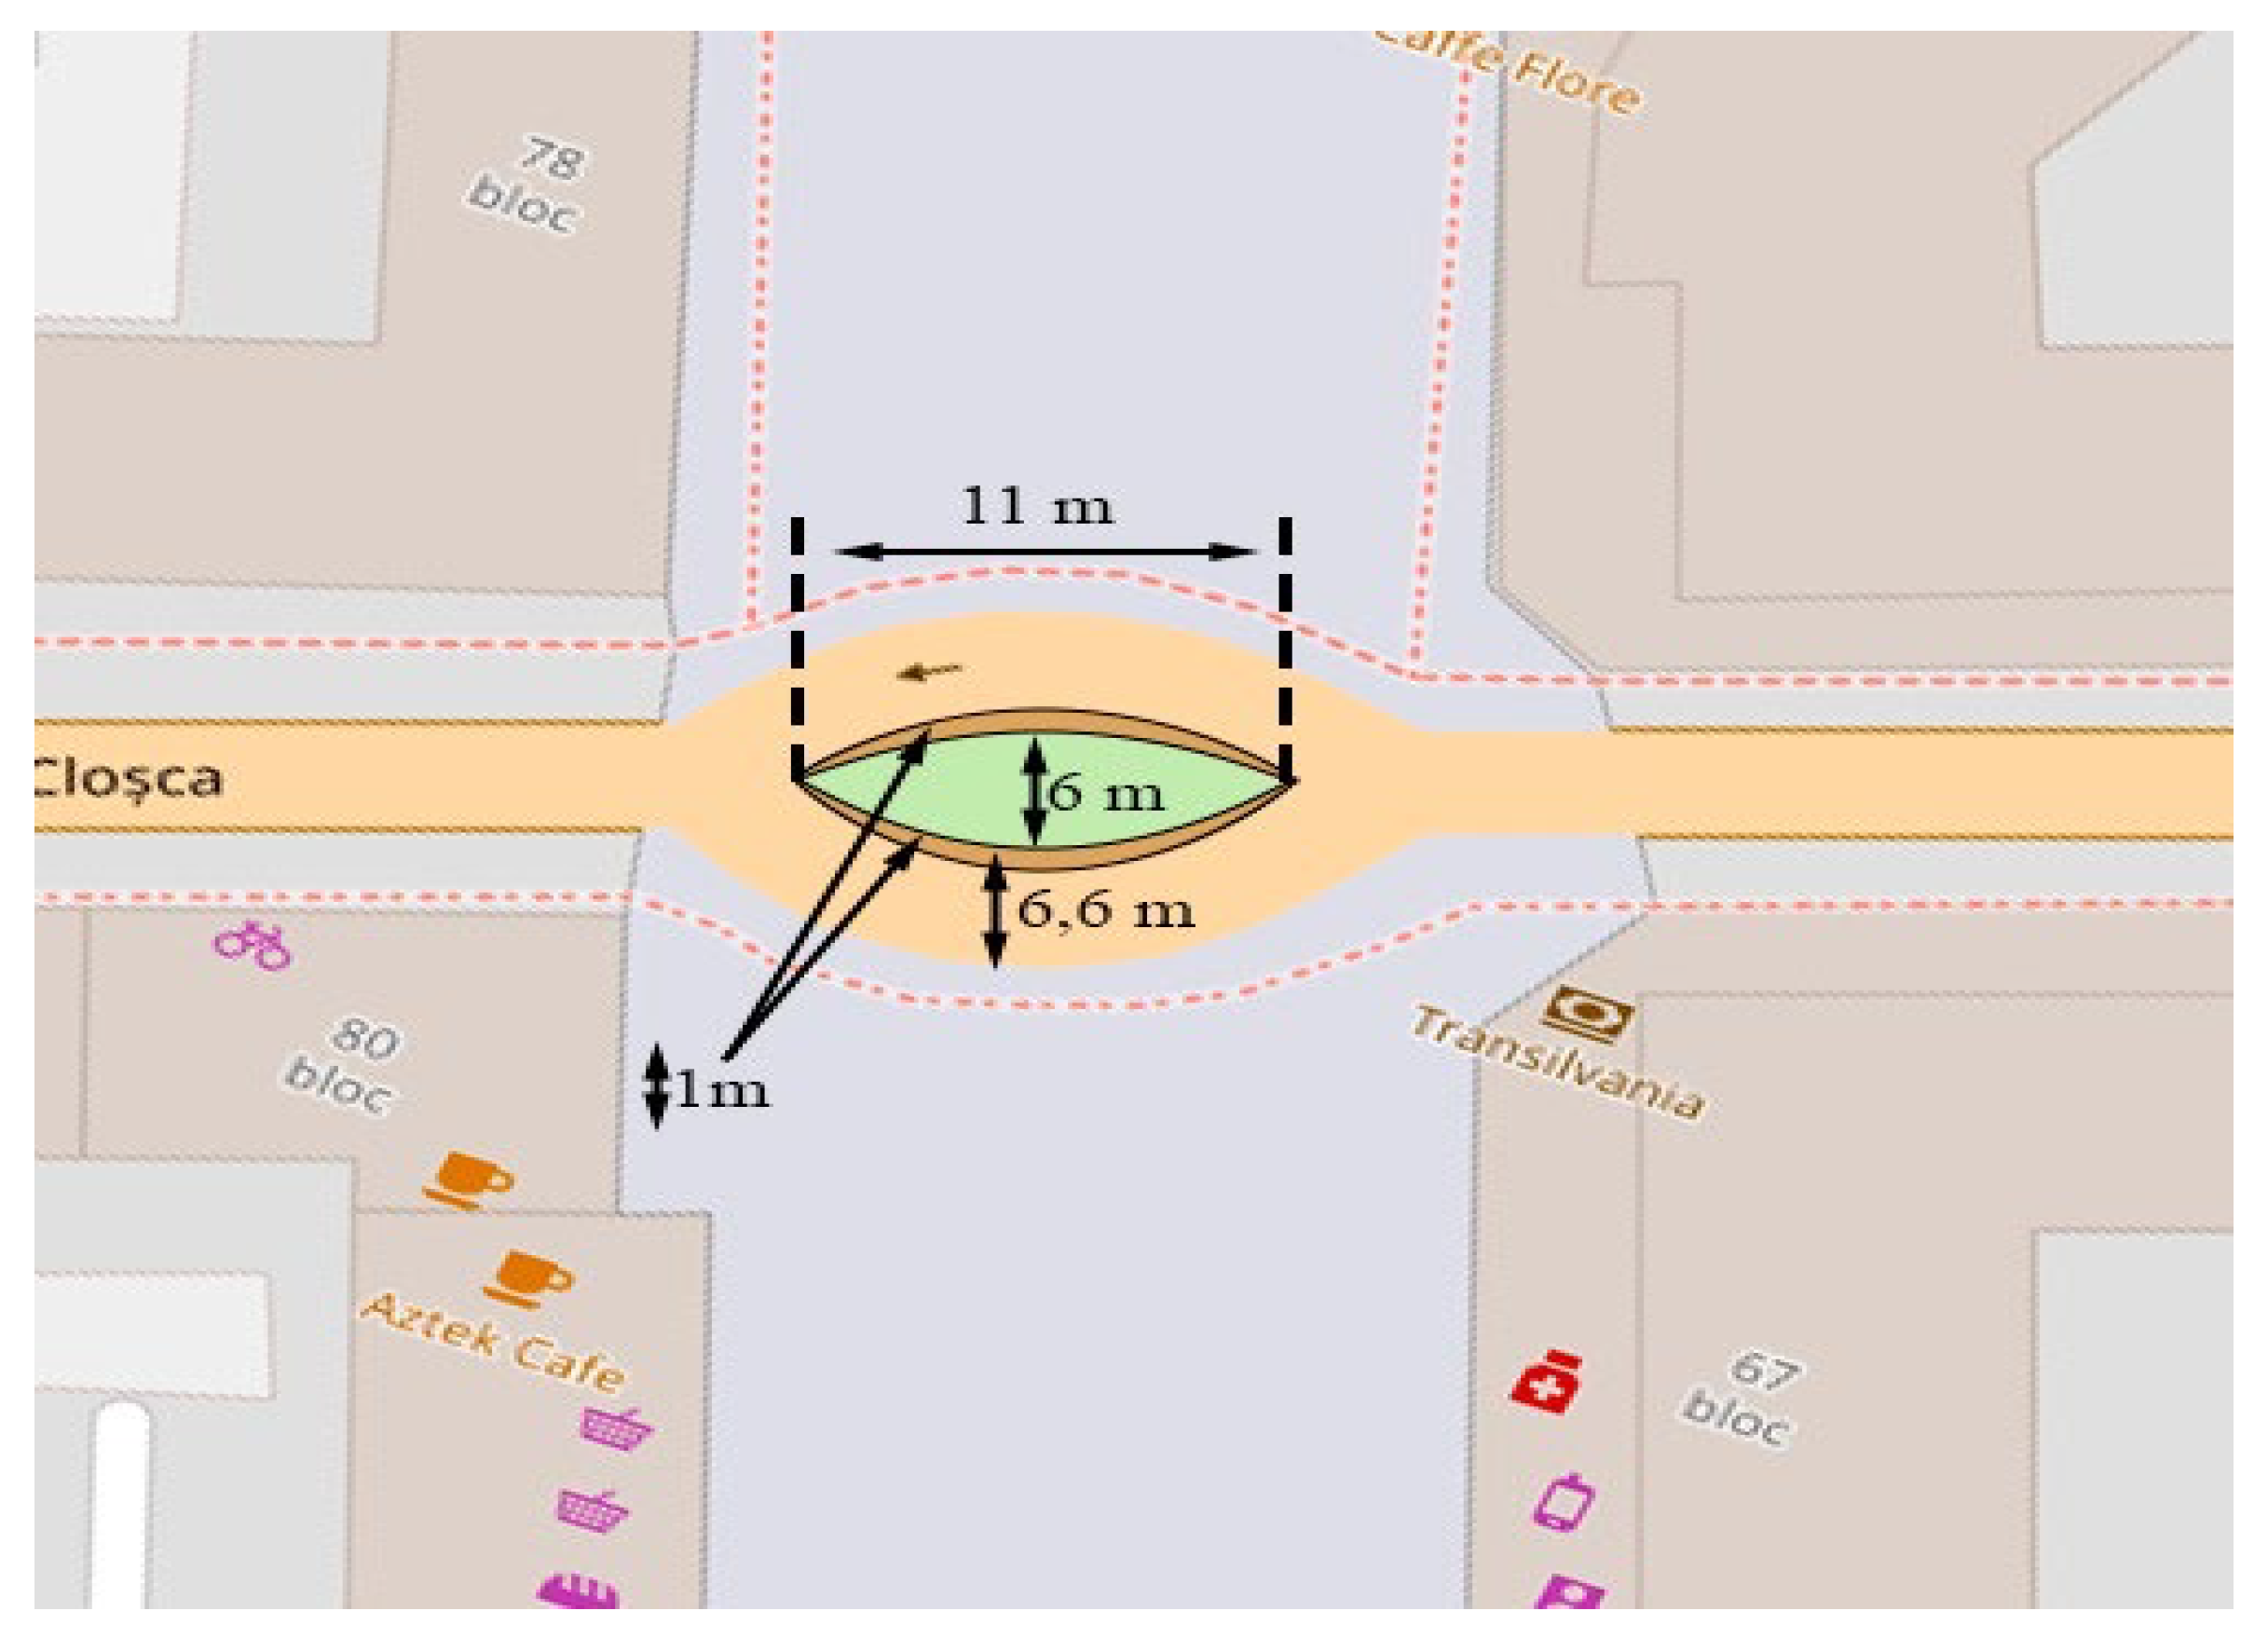
In order to cope with heavy traffic and create two lanes per direction, we have developed the following technical proposals, which include reducing the width of the island by 1 meter per direction for the creation of the second lane and allowing parking, including to allow the supply of shops in close proximity, without disturbing traffic. At the same time, in order to achieve traffic fluidization, it is also necessary to shorten the square in the longitudinal direction by 1.85 meters, in each part of it, so that its total length becomes 11.0 meters.
Figure 14.
Plan with proposed changes.
- Variant 2
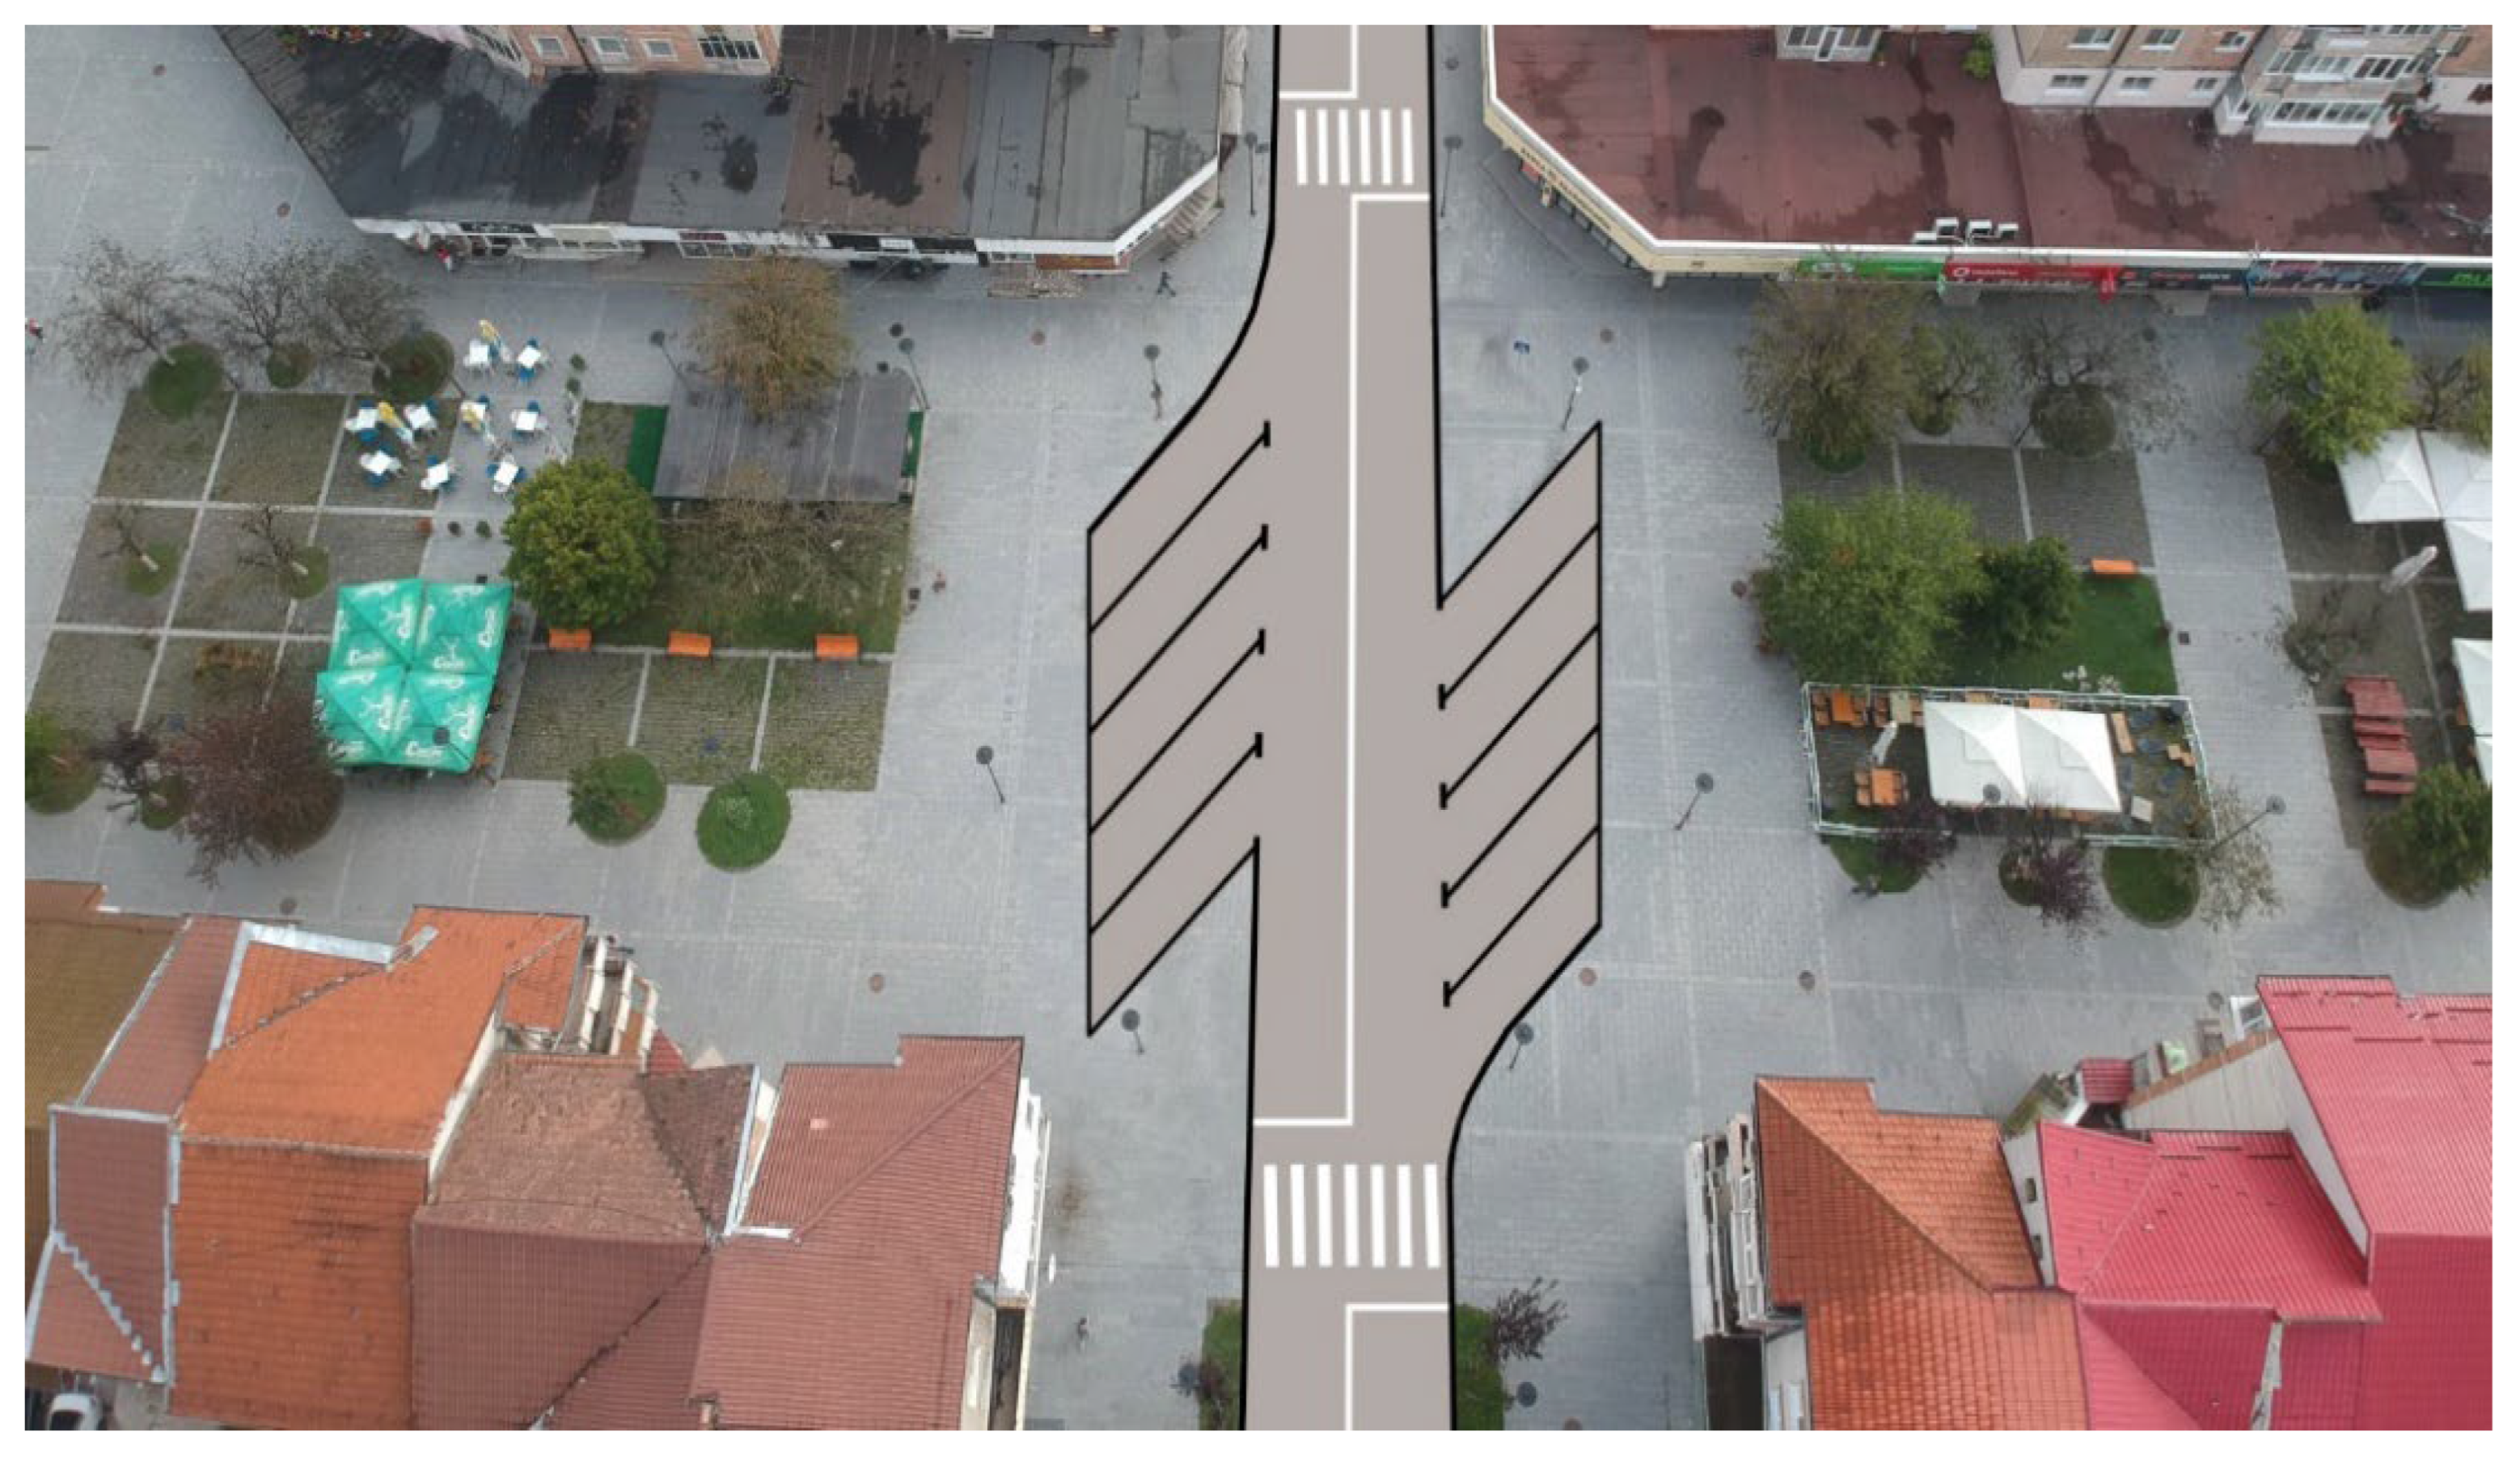
This variant involves the complete abolition of the square and the creation of two symmetrical parking lots, one in each direction of traffic, thus achieving an increase in traffic fluidization, decongesting the area due to the increase in the number of parking spaces and, last but not least, creating the possibility of easier supply of the commercial points located in the immediate vicinity.
Figure 15.
Plan with proposed parking lots.
The modification of the infrastructure of the square in the Banca Transilvania North area is important to meet current traffic demands and improve accessibility. These modifications contribute to creating a safer, more efficient and more functional urban environment, bringing benefits to all users of this important artery.
7.6. Installation of Smart Traffic Lights in Several Areas of Petrosani
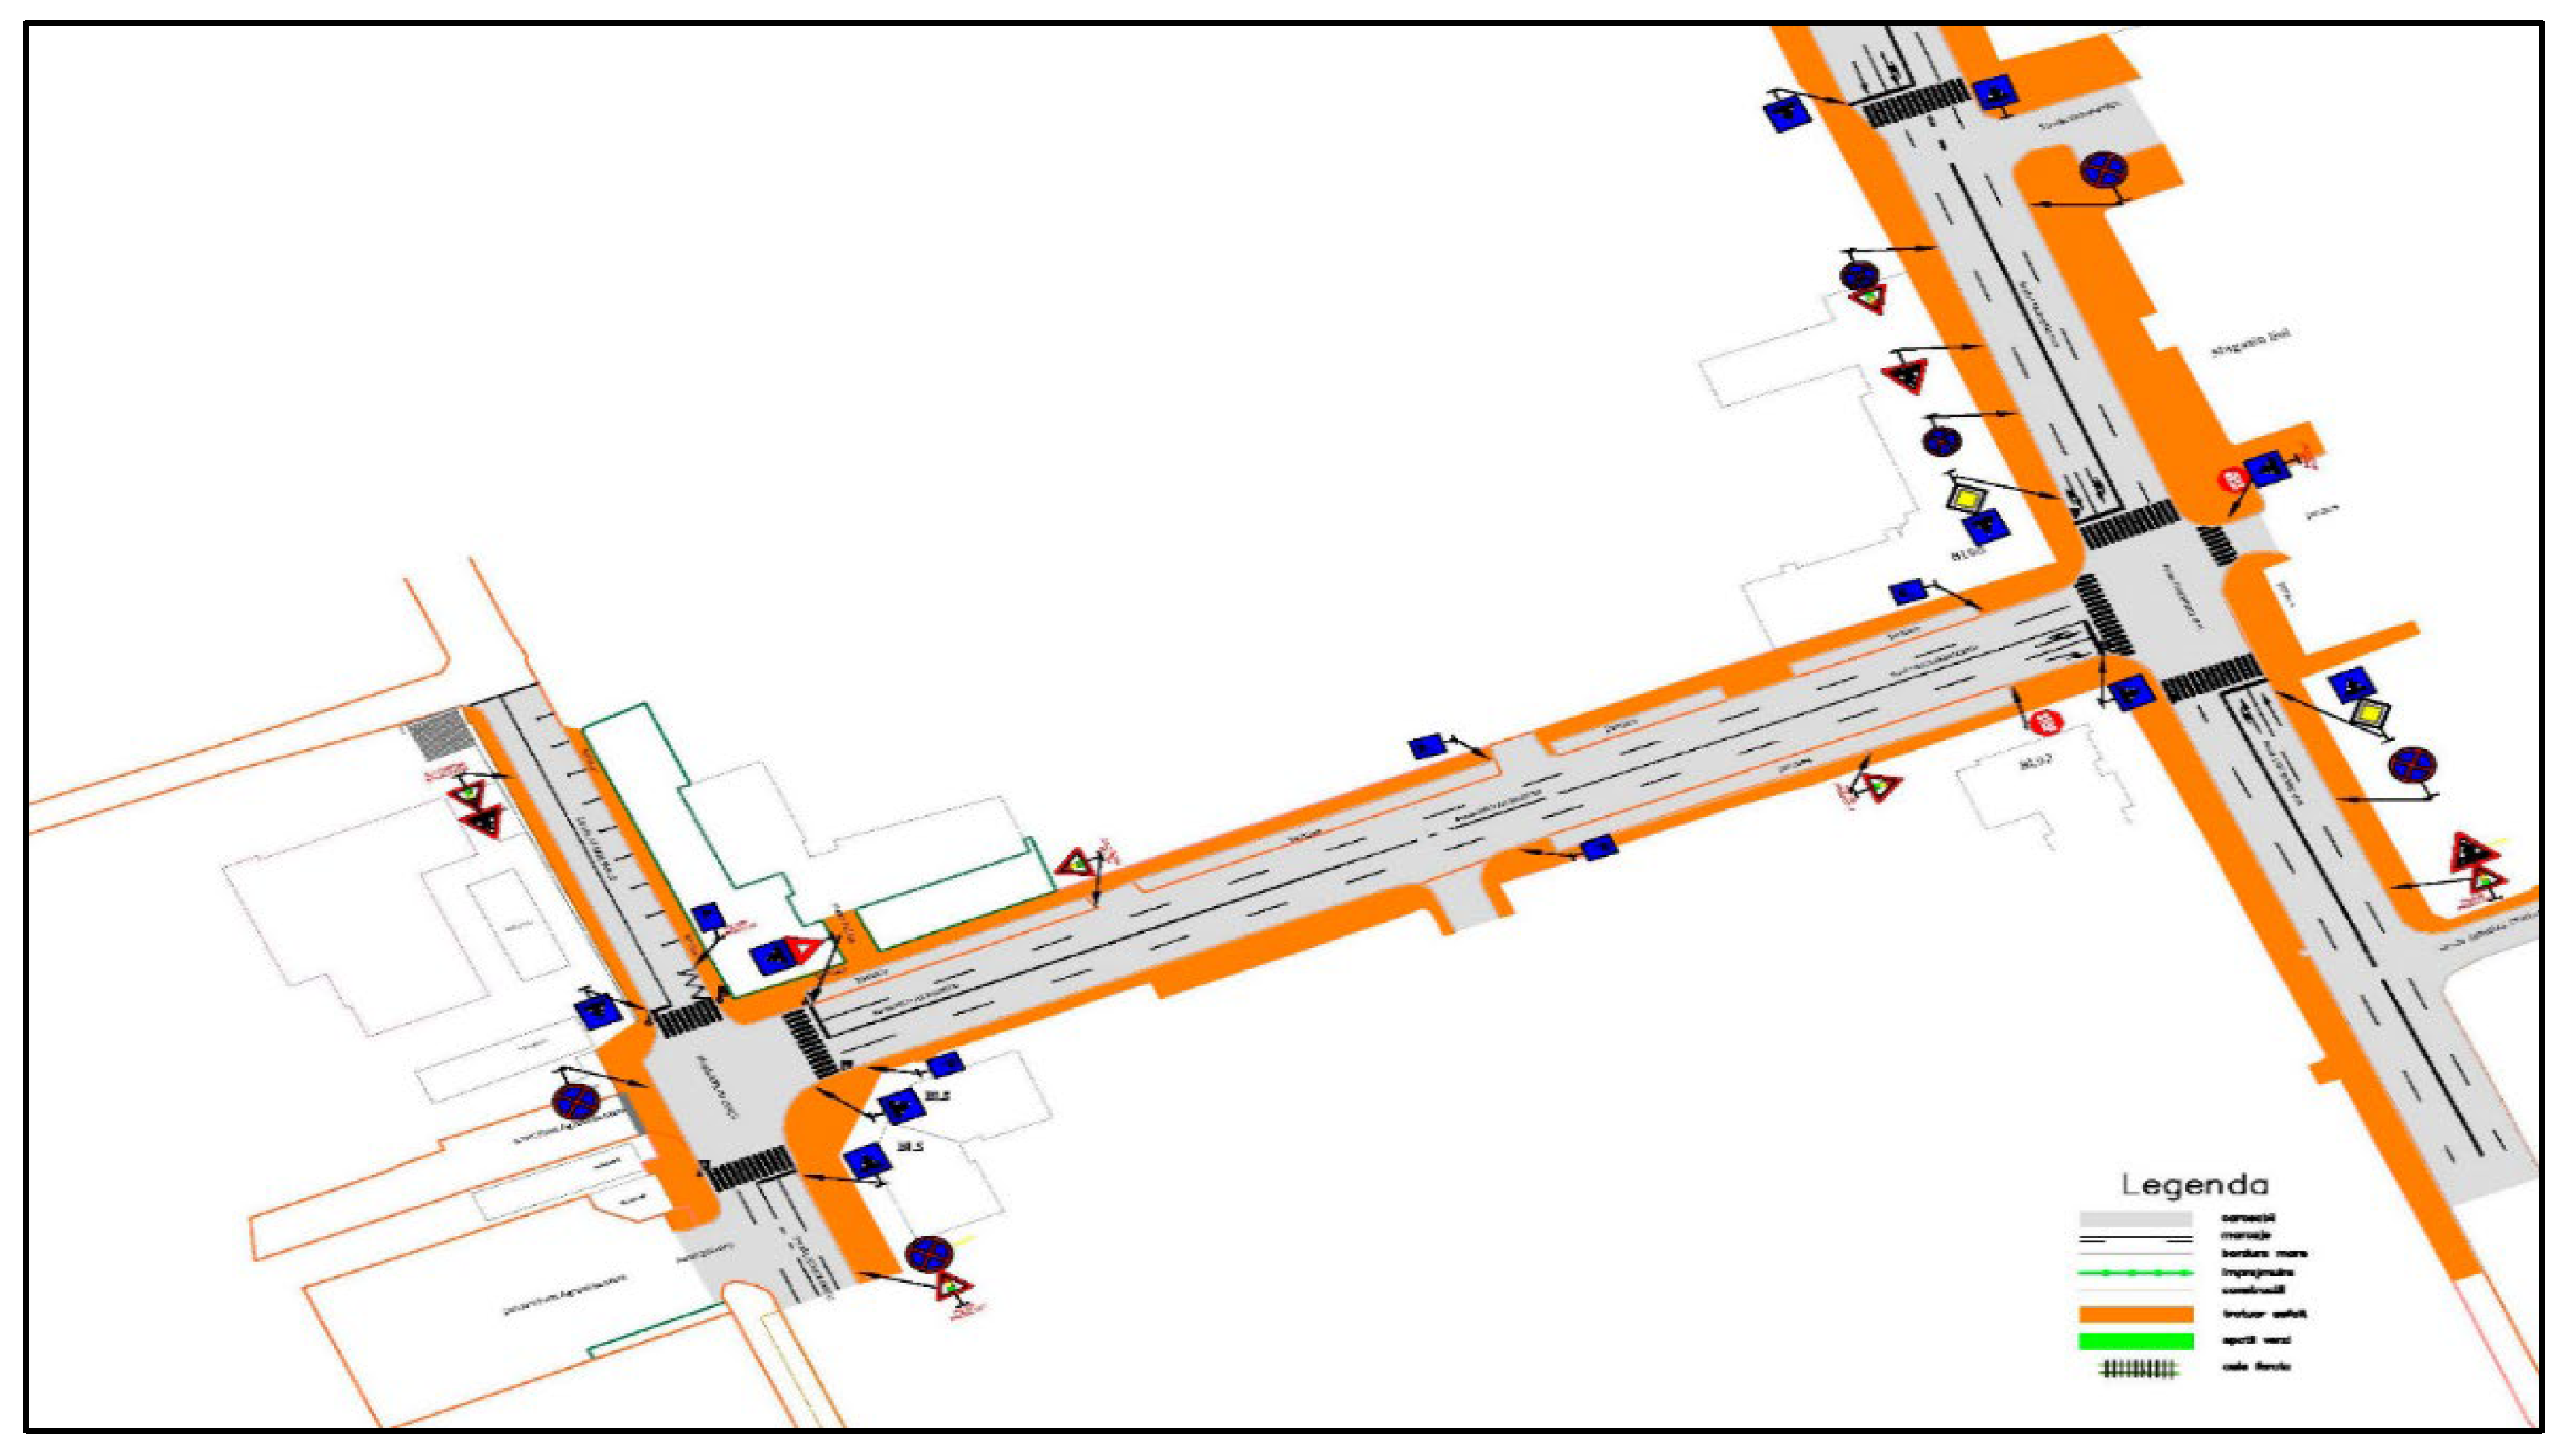
The investment called “Interconnected traffic light systems in Petrosani Municipality, Hunedoara County” consists of the modernization of five intersections in Petrosani, divided into two sections:
- Section I
- 1. The intersection between 1 Decembrie 1918 Street and Nicolae Balcescu Street:
- 3-colour LED traffic lights (red/yellow/green) for drivers: 8 pcs;
- Pedestrian traffic light bodies with built-in counter: 8 pcs;
- Pedestrian crossing sound device: 4 pcs;
- An automatic traffic guidance system that performs the necessary timings for traffic fluidization;
- Cantilever posts (with crossbar) for placing traffic lights: 4 pcs;
- Pillars designed to support warning road signs – traffic light: 4 pcs;
- Road warning signs – traffic light: 4 pcs.
- 2. The intersection between Nicolae Balcescu Street and Avram Iancu Street:
- 3-colour LED traffic lights (red/yellow/green) for drivers: 6 pcs;
- Pedestrian traffic light bodies with built-in counter: 6 pcs;
- Pedestrian crossing sound device: 3 pcs;
- An automatic traffic guidance system that performs the necessary timings for traffic fluidization;
- Cantilever posts (with crossbar) for placing traffic lights: 3 pcs;
- Pillars designed to support warning road signs – traffic light: 3 pcs;
- Road warning signs – traffic light: 3 pcs.
Figure 16.
Section 1.
Figure 16.
Section 1.
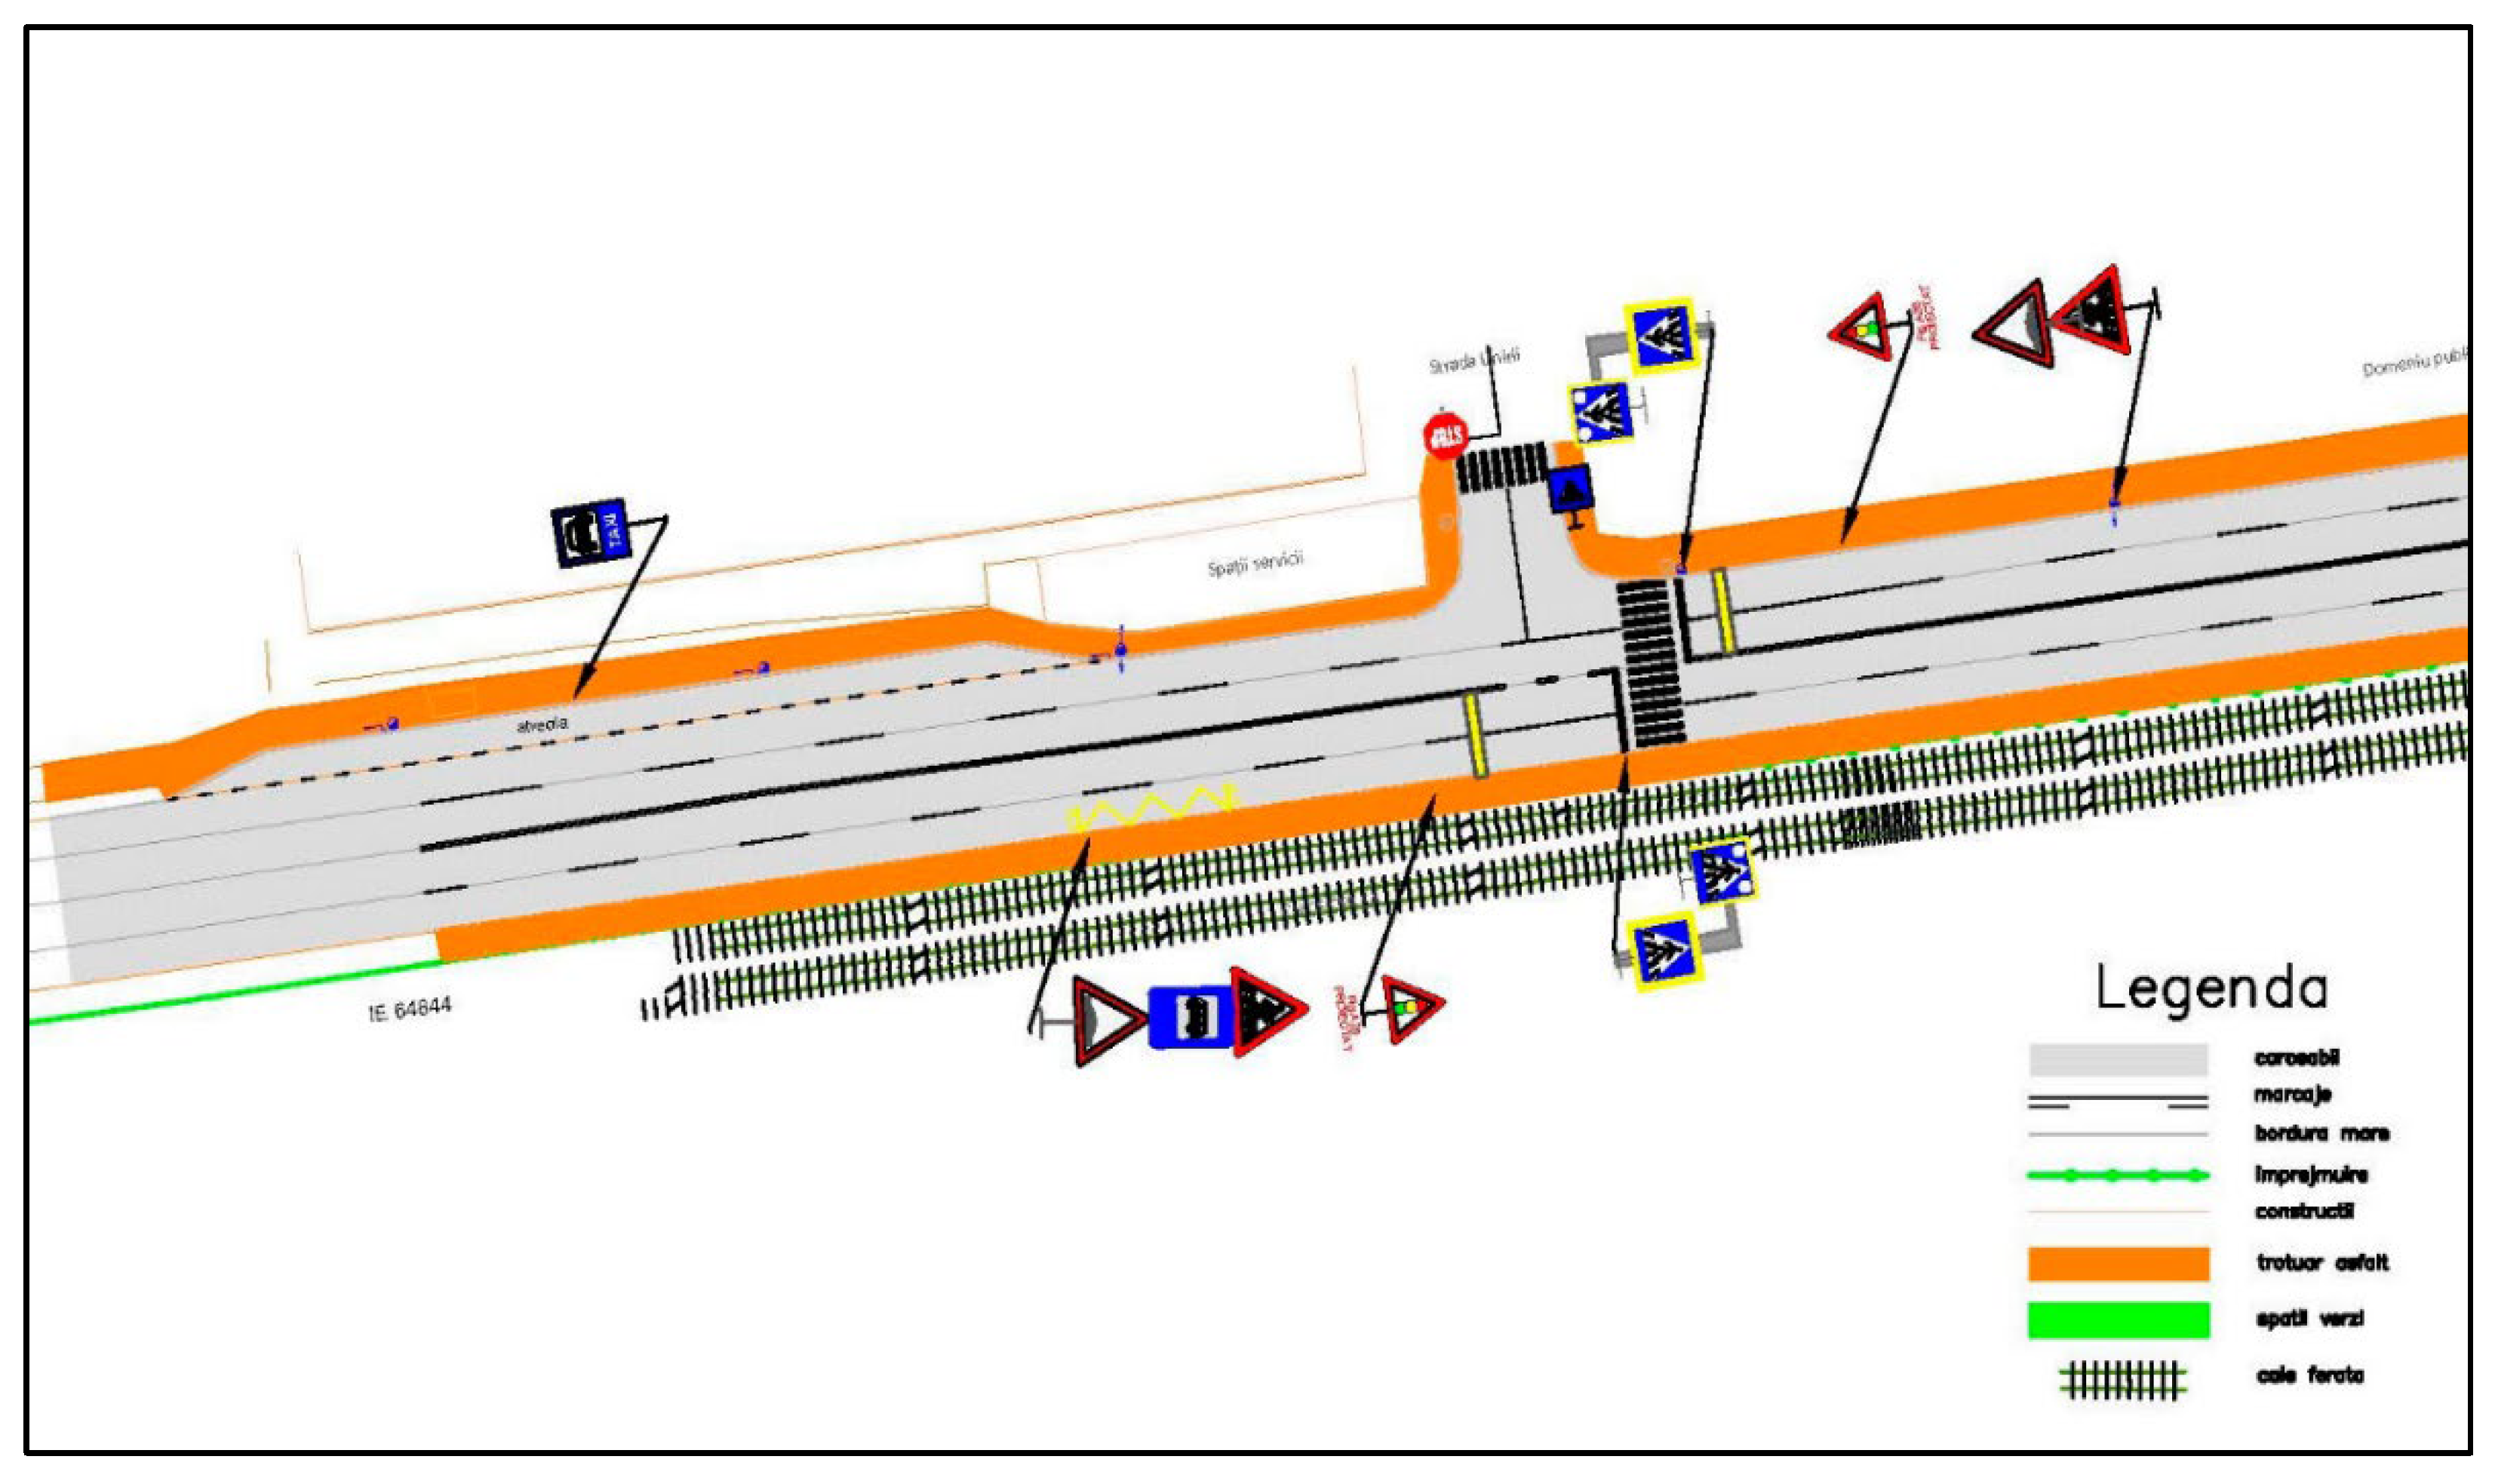
- Section II
- 1. NR 66 (4 lanes) Parangul area
Figure 17.
Parangul area.
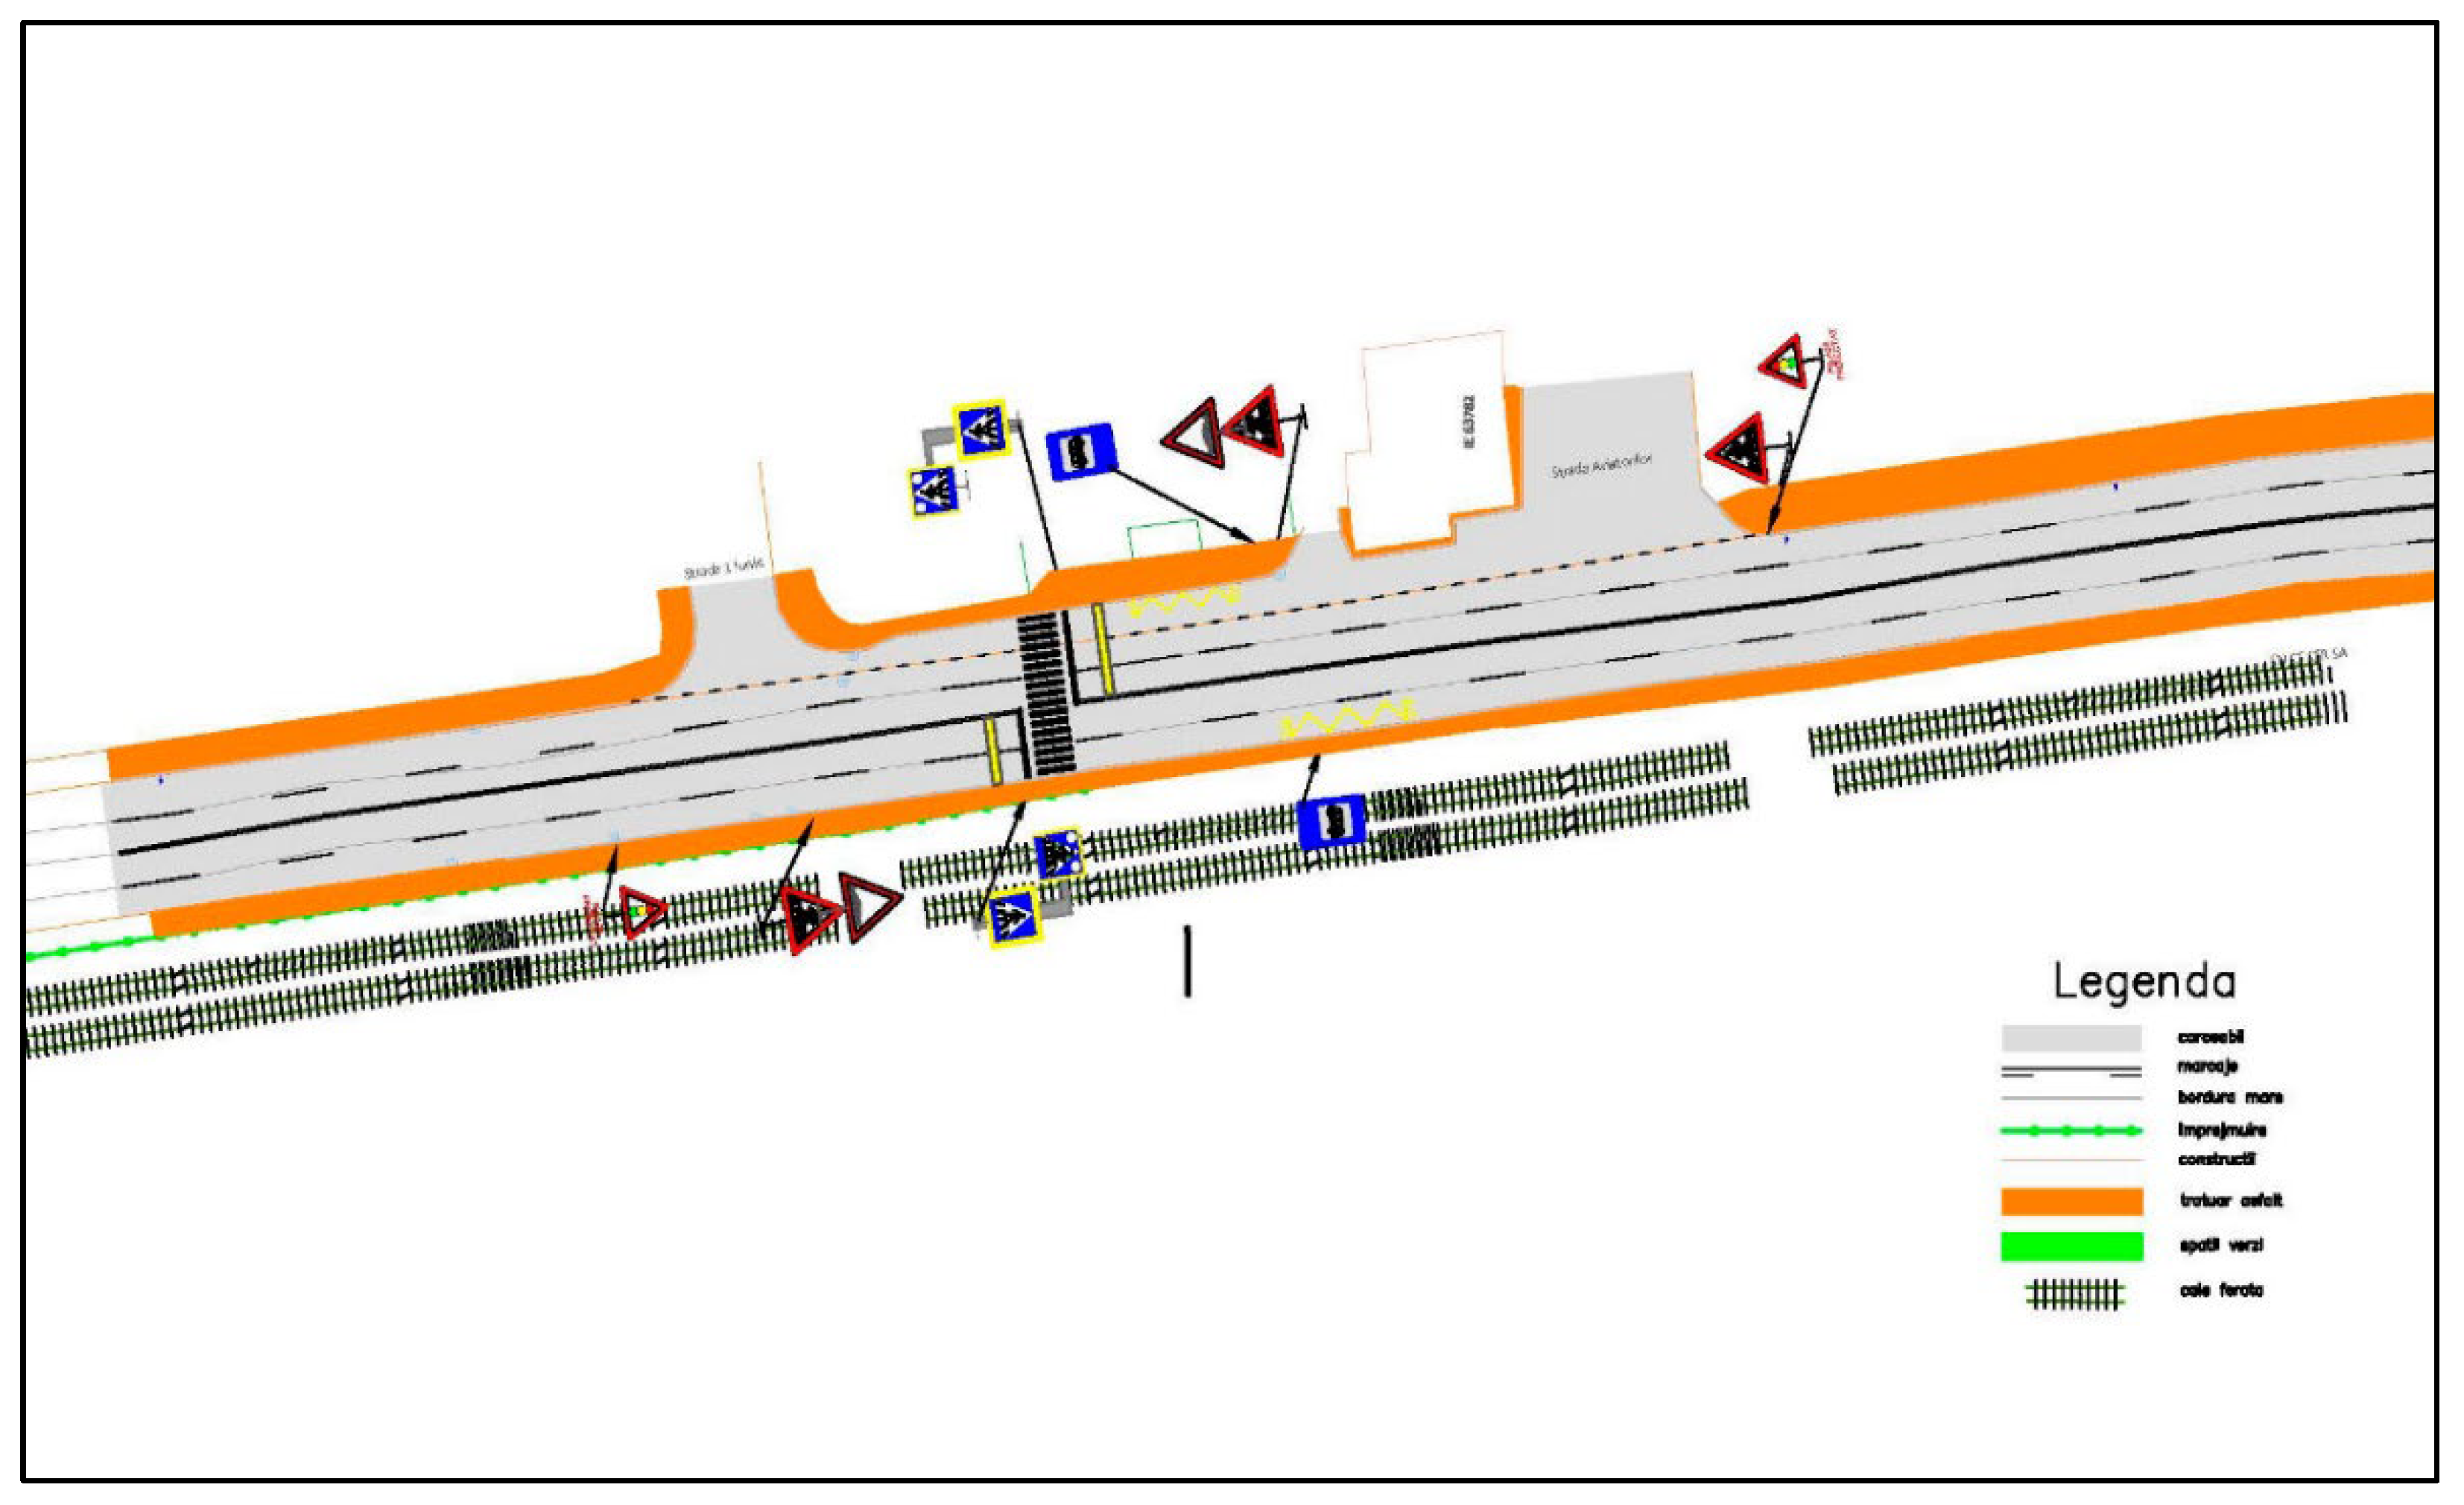
- 2. NR 66 (4 lanes) Dacia Square area
Figure 18.
Dacia Square area.
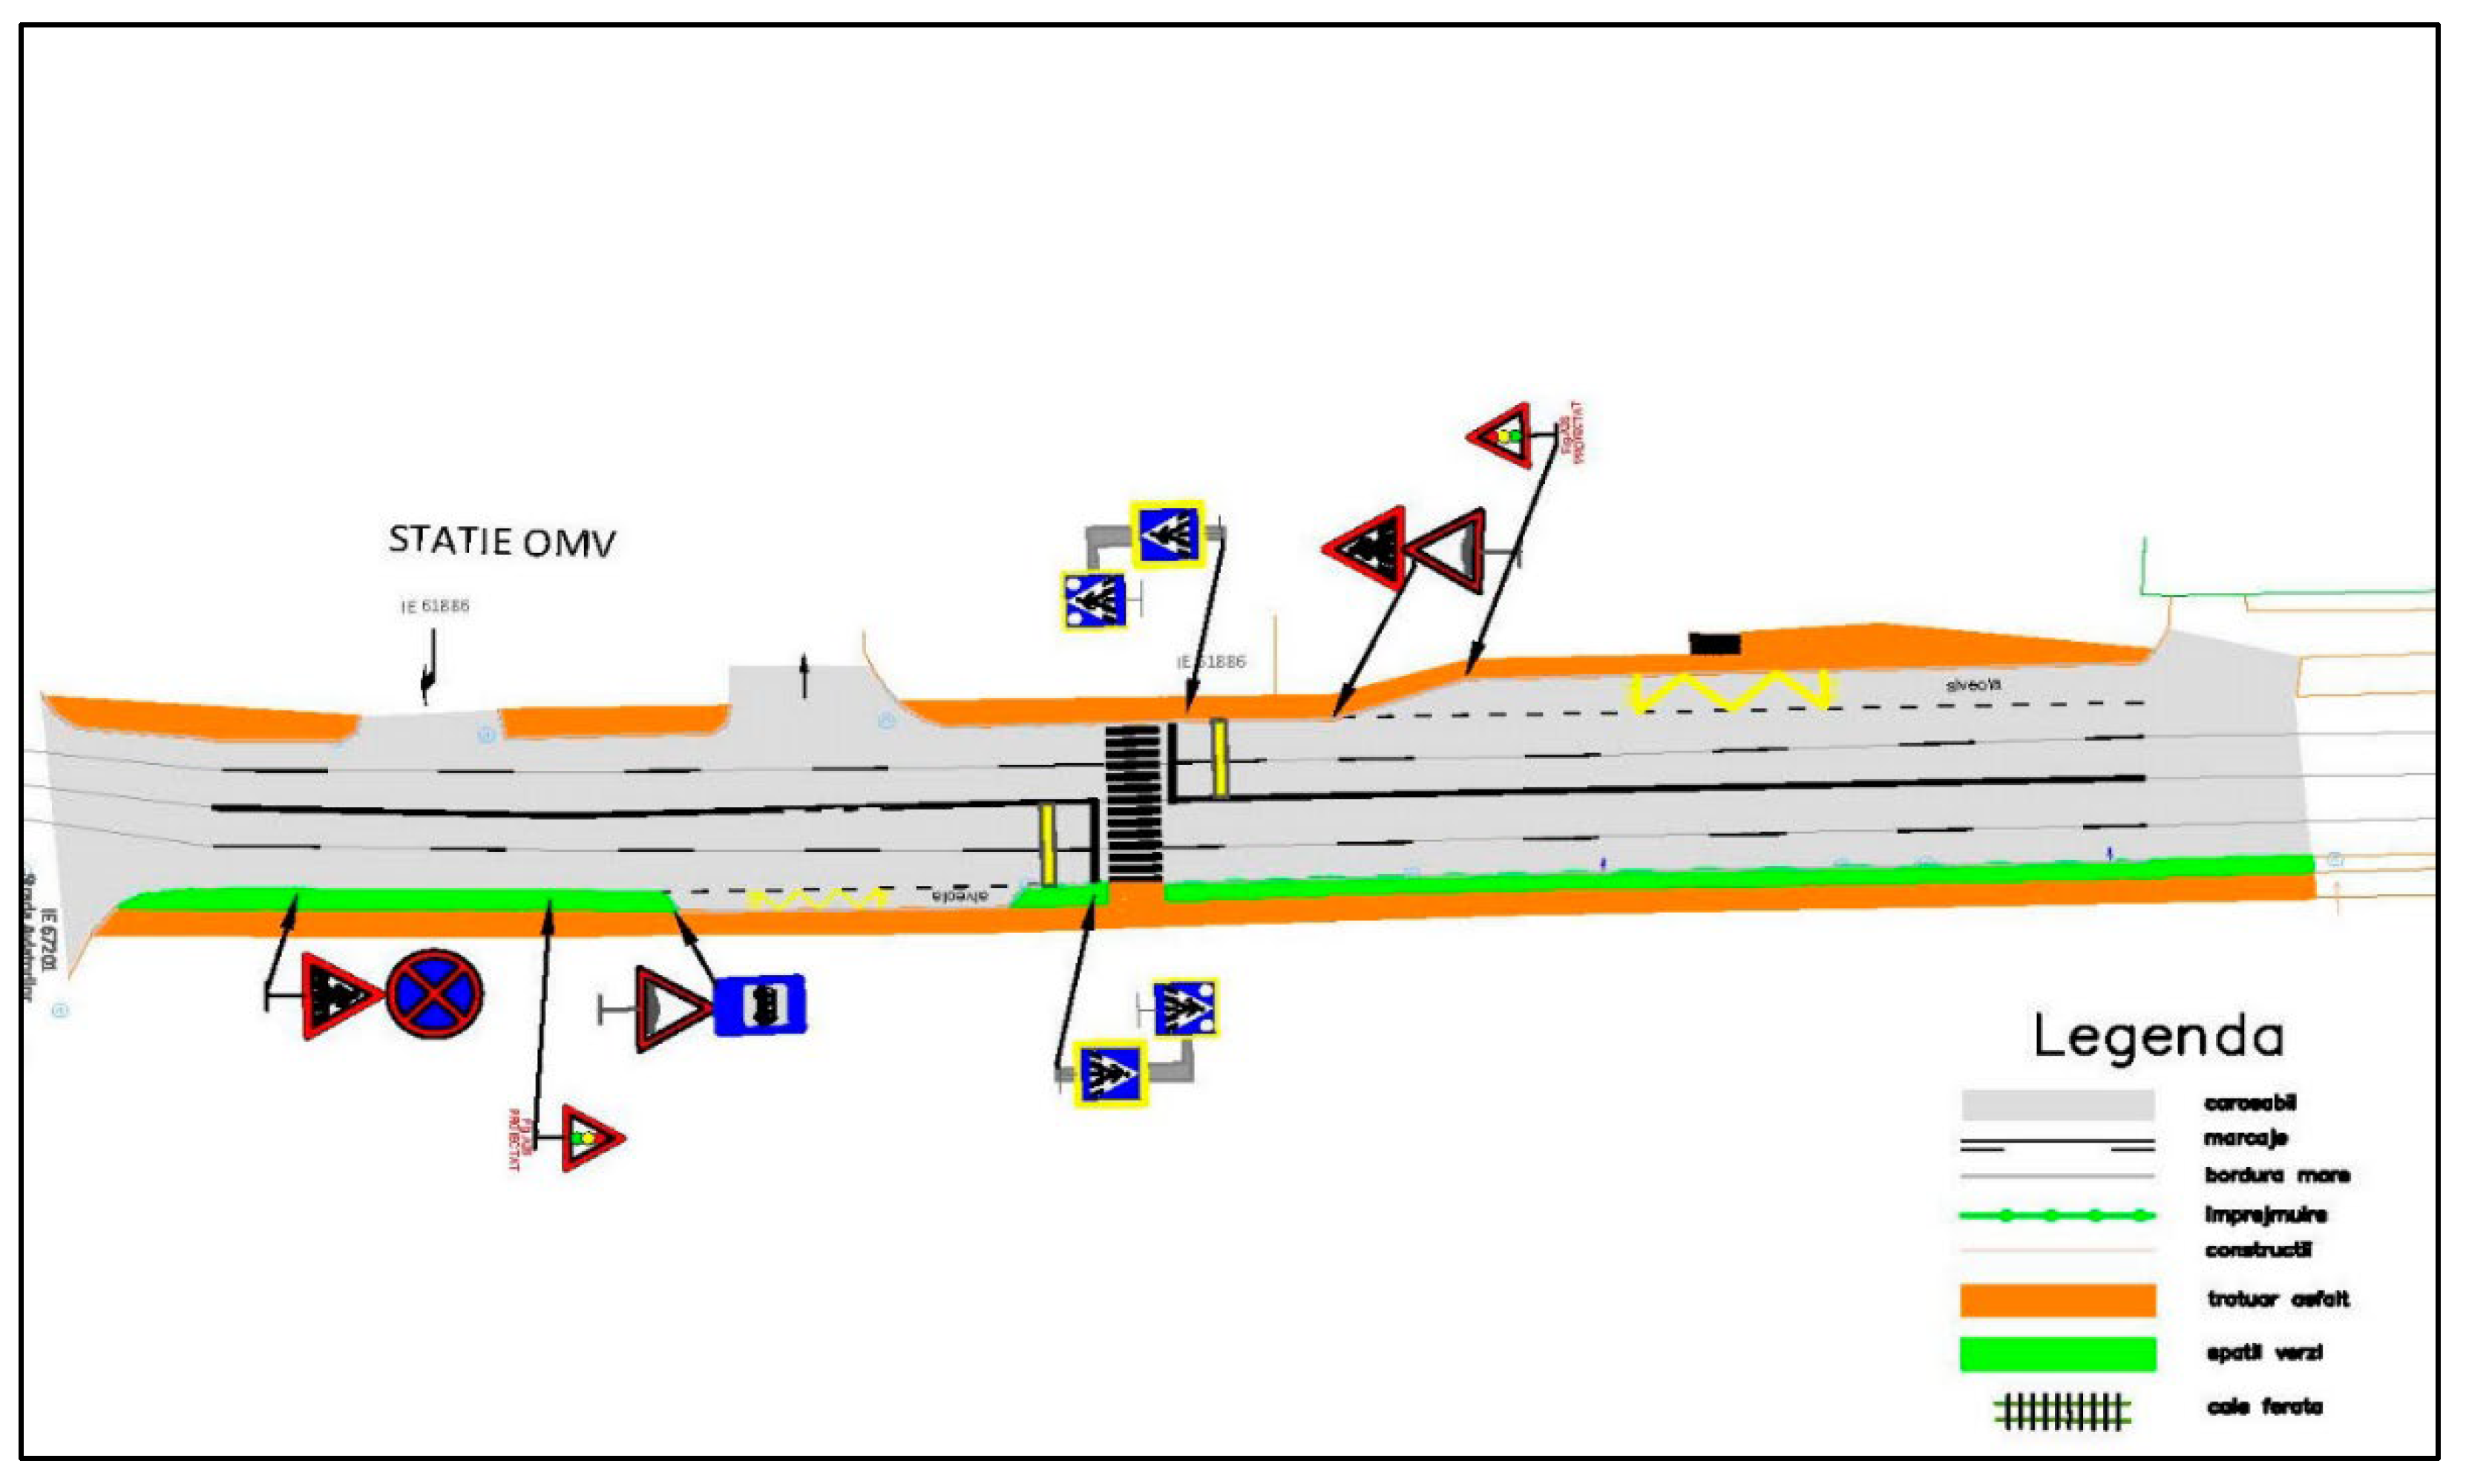
- 3. NR 66 (4 lanes) OMV area
Figure 19.
OMV area.
- 3-colour LED traffic lights (red/yellow/green) for drivers, on both sides of the road: 12 pcs;
- Pedestrian traffic light bodies with built-in counter: 12 pcs;
- Pedestrian crossing sound device: 3 pcs;
- An automatic traffic guidance system that performs the necessary timings for traffic fluidization;
- Pedestrian control buttons, mounted one on each side of the traffic artery: 6 pcs;
- Cantilever posts (with crossbar) for placing traffic lights: 6 pcs;
- Pillars designed to support warning road signs – traffic light: 6 pcs;
- Road warning signs – traffic light: 6 pcs.
7.7. Proposals Regarding the Completion, Correction, Rehabilitation of Road Markings and Signs and the Improvement of Road Infrastructure
- Greening the entrance to Petrosani from Hateg;
- Arranging a parking lot on the right side of the road at the entrance to Petrosani from Hateg;
- Reconditioning the parapet located on the right side of the road, at the entrance to Petrosani from Hateg, before Lascar Service Company SRL;
- Supplementation of “Extremely dangerous curve” signs to the right, at the entrance to Petrosani from Hateg, before Lascar Service Company SRL;
- Application of longitudinal road markings in the Lascar Service Company SRL area;
- Installation of lane selection indicators and application of longitudinal road markings in the Daranesti Roundabout area;
- Application of longitudinal road markings in the Gerom area;
- Application of longitudinal road markings and road signs in the area of the footbridge over the railway;
- Installation of direction signs for the directions of Tg.Jiu, Craiova, Voineasa, Transalpina, Straja at least 50 m before the Victory Square and Sancta Barbara roundabouts;
- Installation of a “Give way” sign for traffic lane 1 (towards Tg.Jiu) in the Sancta Barbara Roundabout; installation of “Center” signs on the left and right at least 70 meters before entering the roundabout;
- At the Jiul Shopping Center intersection: applying “Pedestrian crossing” markings, installing a pedestrian traffic light, trimming ornamental shrubs that obstruct visibility - on the eastern arm of the intersection;
- Restoring road markings in the Petrosani City Hall area;
- Installation of the “No Stopping” sign on Parangul Street, after the construction of parking spaces in the area of blocks 105 and 107;
- Installation of the “No Stopping” sign on 22 Decembrie Street, at the descent from Dimitrie Leonida Technological College;
- Installation of a “Extremely dangerous curve” sign to the right, at the intersection of 1 Dec. 1918 Bd. with Slatinioara Street (Mignon area), in the direction from the City Hall;
- Installation of “No left turn” signs towards Carrefour Market and the Keops Complex, in the direction from the City Hall;
- Replacing the “STOP” sign with the “Give way” sign when descending from the viaduct towards the Lidl Store;
- Application of longitudinal road markings when descending from the viaduct towards the Dedeman area;
- Construction of a roundabout in the Dedeman area;
- Construction of a roundabout in the Lidl area;
- Applying pedestrian crossing markings and installing two speed limiters on Lunca Street, in the stadium area;
- Installation of priority regulation signs at the intersection of Cuza Voda and Timisoara streets;
- Installation of the “No stopping” sign in the area of the barrier at the railway level crossing located at the intersection of Timisoara and Cuza Voda streets;
- Greening the area behind the Petrosani Railway Station, including to take over part of the road traffic in the area;
- Installation of the “Priority Road” sign and application of road markings at the intersection of Timisoara and Carol Schreter streets;
- Installation of removable blocking posts to restrict vehicle access to the Central Square platforms;
- Construction of two parking spaces, on Avram Iancu Street, near the Central Square platform, immediately after the traffic light, dedicated to vehicles supplying stores in the area;
- Replacing the “STOP” sign with the “Give way” sign at the intersection of Ion Creanga Street with the Petrosani bypass road (towards the MOL gas station);
- Installation of additional road signs related to the priority of crossing at the intersection of Avram Iancu and Ion Creanga streets (behind Carol Schreter Park);
- Installation of “Keep right/left” and “No Entry” signs in the area of the square at the end of Avram Iancu Street;
- Installation of “STOP” or “Give way” signs at the ends of streets intersecting Carpati Street (with priority) and priority signs on both sides of Carpati Street;
- Installation of the “Turn right ahead” sign at the exit from the Armicar Bread Factory in the one-way direction on Aleea Florilor Street;
- Installation of the “No Stopping” sign on Petru Maior Street, near the Emergency Hospital Roundabout;
- Installation of traffic dividers on Oituz Street, behind the Parangul Complex;
- Installation of the “Priority Road” sign on Aviatorilor Street, behind Dacia Square;
- Installation of “No stopping” signs every 50 meters, from the Parangul Complex to the Airplane Roundabout;
- Application of binding markings and arrow marks on all entrances to the Airplane Roundabout;
- Installation of the “No Stopping” sign every 50 meters, on the NR66 ring road of Petrosani, from the Airplane Roundabout to the first car wash.
General Proposals:
- Development of new parking spaces;
- Restoration of longitudinal markings;
- Maintenance/Replacement of damaged road signs and corroded support poles;
- All one-way streets should have the “Two-way traffic” sign at their end;
- Installation of modern, smart traffic lights;
- Installation of the “No horn blowing” sign in certain areas of Petrosani (hospital, central area, etc.);
- Development of a parking lot for vehicles in transit (for TIRs);
- Management of abandoned vehicles.
Proposal for the Construction of Parking Spaces in the Following Areas:
- On 1 Decembrie 1918 Boulevard, in front of blocks 97 and 99 (Opposite Carol Schreter Park and Petrosani Hotel;
- In the area of Petrosani City Hall, in front of the House of Culture;
- On Aleea Poporului Street, near Total Instal;
- In the area between BCR, Prosecutor`s Office and Carrefour Market;
- On 1 Decembrie 1918 Boulevard, from the “Serban Ionescu” Cinema to the “1001 Articole” Store, by canceling one of the two sidewalks;
- On 1 Decembrie 1918 Boulevard, in the Mignon area, in the direction to the Emergency Hospital, in front of blocks 120, 122 and 124, by canceling one of the two sidewalks;
- Additional parking spaces on all four interior sides of the blocks of flats located between 9 Mai Street and Aleea Florilor Street, as well as between blocks 2 and 4 on Carpati Street;
- On Parangul Street, near blocks 105 and 107 (behind Braseria Testre);
- On Slatinioara Street, near block 109;
- On Aviatorilor Street, in the area of blocks 16, 18, 20 and 22A;
- On Aviatorilor Street, in the area of block 66;
- On both sides of the square located at the intersection of Closca Street and 1 Decembrie 1918 Boulevard.
- Note: The proposals highlighted in Bold have already been implemented in the meantime, in the period since the start of the traffic study until now.
8. Final Conclusions
The traffic study aims to analyze the current traffic situation, assess the road network and estimate the effects generated following the implementation of new transport infrastructure, transport policy measures and any interventions that modify the structure and traffic capacity of the road network, by using a transport model.
For this purpose, a detailed analysis of the road infrastructure was carried out, including traffic analyses, surveys were taken on the streets and roads in the analyzed area, as well as the geometric configuration of the intersections and traffic arteries. The obtained data were introduced into a transport model, which allows the analysis of the existing situation, as well as its evolution in the medium term (year 2030).
As a result of the analysis of the parameters generated by the transport model and the other analyses carried out during the traffic study, the main road traffic malfunctions in Petrosani were identified:
- A small part of the road infrastructure on the city's street network requires rehabilitation and modernization works (approx. 15%);
- The existence of undercrossings/overcrossings that require safety systems;
- Lack of measures that would efficiently eliminate traffic jams and decongest them, in order to optimize road traffic;
- The existence of road sectors that overlap with national and county road routes, which leads to high traffic values;
- The lack of a complete bypass option to take over transit traffic;
- The existence of some sectors of the network on which urban, interurban and intra-county public transport lines overlap;
- Lack of an efficient traffic management system;
- Lack of an e-ticketing system;
- Reduced capacity of the transport infrastructure in relation to the increase in the number of passengers;
- Lack of properly arranged spaces for overnight parking of means of transport transiting the municipality;
- Reduced modal quota of public transport;
- The low level of specific infrastructure for cyclists;
- High traffic volumes during peak hours, due to the low level of use of public transport and the lack of attractiveness of this mode of transport;
To remedy these malfunctions and reduce or eliminate the effect on general traffic in Petrosani, as well as to achieve the proposed objectives regarding the sustainable urban mobility, solutions were proposed and tested within the case studies carried out.
The study contains a package of measures that will contribute to promoting and improving road traffic in general, public passenger transport and/or non-motorized modes of transport, implicitly encouraging and facilitating the transfer to these from individual car transport.
The forecasted increase in car traffic in the medium term will lead to exceeding the traffic capacity during peak hours, by almost 20% in some cases, which will lead to traffic congestion, traffic delays, reduced travel speeds and increased fuel consumption and GHG emissions, in the absence of the implementation of the measures proposed in this study.
An important objective may also be to ensure efficient passenger transport and/or to improve the conditions for the use of non-motorized modes of transport, in order to reduce the number of trips by private transport (cars) and reduce CO2 equivalent emissions from transport.
The study contains a package of proposals that will contribute to promoting and improving road traffic in general, public passenger transport and/or non-motorized modes of transport, implicitly encouraging and facilitating the transfer to these from individual car transport.
Among the objectives of these proposals, we list the following:
- Systematization of the road traffic and traffic fluidization in areas where many traffic jams occur;
- Decongesting traffic by introducing measures that will lead to a consistent decrease in the number of jams, including by applying regulations that will allow traffic to flow in one direction on certain sections of the road network, in order to optimize road traffic;
- Maintaining easy access for vehicle owners to parking spaces located in the immediate vicinity of their homes;
- Improving the quality of travel by public transport and non-motorized modes, by increasing quality and safety standards in the use of these modes of transport;
- Shortening travel time, without worsening traffic conditions in the study area and beyond it, by increasing the frequency of public transport;
- Increasing the quality of transport services by auditing existing public transport operators and limiting their operation when defects in existing means of transport or their improper condition are found;
- Implementation of the project “Green Line of Electric Buses in Petrosani, connected to the GreenLine Jiu Valley Project”;
- Reducing delays in public transport travel, due to traffic congestion that also affects general traffic;
- Establishing easy connections between different modes of transport;
- Transmission of real-time information regarding the traffic schedules of public transport vehicles;
- Development of specific infrastructure for cyclists;
- Increasing the number of parking spaces, insufficient parking spaces leading to irregular parking, with a negative effect on road traffic, pedestrian and cyclist safety;
- Implementation of measures to reduce the number of irregularly parked vehicles, which cause a reduction of the capacity to use road arteries;
- Implementation of measures leading to the promotion of intermodality and alternative means of transport;
- Introduction of an efficient traffic management system and an e-ticketing system.
This traffic study will represent a supporting tool for decision makers to establish, prioritize, justify and substantiate the financing of future investments in infrastructure and intelligent systems associated with it.
AIMS, OBJECTIVES, AND RELEVANCE OF THE STUDY
A. Objectives
General Objectives:
- Investigate urban traffic and mobility patterns in the city of Petroșani, within the context of smart city development;
- Evaluate the efficiency of existing infrastructure and identify critical points in traffic management;
- Formulate recommendations for optimizing urban mobility through digital tools and intelligent technologies.
Specific Objectives:
- Traffic Data Collection and Analysis – identify circulation patterns, main traffic flows, and peak congestion periods;
- Traffic Modeling – use mathematical models and specialized software to simulate traffic scenarios and forecast the impact of various optimization measures;
- Urban Mobility Assessment – analyze accessibility for public transport, pedestrians, and bicycles, as well as their interaction with vehicular traffic;
- Identification of Intelligent Solutions – propose smart city measures (e.g., intelligent traffic lights, real-time traffic monitoring systems, citizen information applications);
- Development of a Recommendation Framework for Decision-Makers – create a set of sustainable transport strategies tailored to the specific characteristics of the city of Petroșani.
B. Aims
The primary aims of the study is to contribute to the transition of the city of Petroșani toward a “smart city” model by understanding and optimizing urban mobility, reducing congestion, and improving residents’ quality of life. The study aims to integrate real-world data with predictive models and smart technologies to support efficient urban planning.
C. Relevance
- Scientific: The study contributes to the fields of urban transportation, traffic modeling, and smart city planning by applying analysis and simulation methods to a medium-sized community in Romania;
- Practical: The results can be used by local authorities to implement solutions that reduce traffic and pollution, enhance road safety, and encourage public transportation use;
- Social: Optimizing urban mobility contributes to improving quality of life, reducing stress and time lost in traffic, and promoting a city more friendly to pedestrians and cyclists;
- Political and Strategic: The study supports evidence-based decision-making in urban planning and smart mobility policies, in line with European strategies for sustainable cities and smart cities.
Author Contributions
Conceptualization, Aurelian Horia Nicola; Methodology, Mihai Sorin Radu; Software, Csaba Lorint; Validation, Mila Ilieva-Obretenova; Formal analysis, Nicolae Daniel Fita.
Funding
This research received no external funding.
Institutional Review Board Statement
Not applicable.
Informed Consent Statement
Not applicable.
Data Availability Statement
The original contributions presented in this study are included in the article. Further inquiries can be directed to the corresponding author.
Conflicts of Interest
The authors declare no conflict of interest.
References
- Integrated Urban Development Strategy of the Municipality of Petroșani 2021–2027 - Official city development strategy (includes SWOT sections).
- Dura, C., & Drigă, I. The SWOT Analysis of the University of Petroşani in the Context of COVID 19 Pandemic. Annals of the University of Petroşani: Economics (2021) — an example of applied SWOT in a local context.
- Gurel, E.; Tat, M. A Theoretical. In Diagnostic Review of SWOT, PESTEL, and Porter’s Five Forces; 2025. [Google Scholar]
- Li-bGuides: SWOT and PESTEL Analyses – City University research guide – explains how PESTEL and SWOT relate in strategic evaluation.
- Yuan, T.; da Rocha Neto, W.; Rothenberg, C.E.; Obraczka, K.; Barakat, C.; Turletti, T. Machine learning for next--generation intelligent transportation systems: A survey. Trans. Emerg. Telecommun. Technol. 2022, 334, e4427. [Google Scholar] [CrossRef]
- Lv, Z.H.; Shang, W.L. Impacts of intelligent transportation systems on energy conservation and emission reduction of transport systems: A comprehensive review. Green Technol. Sustain. 2022, 1, 100002. [Google Scholar] [CrossRef]
- Soriano-Gonzalez, R.; Perez-Bernabeu, E.; Ahsini, Y.; Carracedo, P.; Camacho, A.; Juan, A.A. Analyzing Key Performance Indicators for Mobility Logistics in Smart and Sustainable Cities: A Case Study Centered on Barcelona. Logistics 2023, 7, 75. [Google Scholar] [CrossRef]
- Zhao, C.; Wang, K.; Dong, X.; Dong, K. Is smart transportation associated with reduced carbon emissions? The case of China. Energy Econ. 2022, 105, 105715. [Google Scholar] [CrossRef]
- Figueiredo, L.; Jesus, I.; Machado, J.; Ferreira, J.; de Carvalho, J.M. Towards the development of intelligent transportation systems. In Proceedings of the ITSC 2001. 2001 IEEE Intelligent Transportation Systems. Proceedings [Cat. No. 01TH8585], Oakland, CA, USA, 25–29 August 2001; pp. 1206–1211. [Google Scholar]
- Mačiulis, A.; Vasiliauskas, A.V.; Jakubauskas, G. The impact of transport on the competitiveness of national economy. Transport 2009, 24, 93–99. [Google Scholar] [CrossRef]
- Letnik, T.; Marksel, M.; Luppino, G.; Bardi, A.; Božičnik, S. Review of policies and measures for sustainable and energy efficient urban transport. Energy 2018, 163, 245–257. [Google Scholar] [CrossRef]
- Frey, H.C. Trends in Transportation Greenhouse Gas Emissions. In Advances in Carbon Management Technologies; CRC Press: Boca Raton, FL, USA, 2020; pp. 359–375. [Google Scholar]
- Yigitcanlar, T.; Desouza, K.C.; Butler, L.; Roozkhosh, F. Contributions and risks of artificial intelligence [AI] in building smarter cities: Insights from a systematic review of the literature. Energies 2020, 13, 1473. [Google Scholar] [CrossRef]
- Wang, M.; Wang, B.; Abareshi, A. Blockchain technology and its role in enhancing supply chain integration capability and reducing carbon emission: A conceptual framework. Sustainability 2020, 12, 10550. [Google Scholar] [CrossRef]
- Wang, Y.; Han, J.H.; Beynon-Davies, P. Understanding Blockchain Technology for Future Supply Chains: A Systematic Literature Review and Research Agenda. Supply Chain Manag. 2019, 24, 62–84. [Google Scholar] [CrossRef]
- Singh, S.; Sharma, P.K.; Yoon, B.; Shojafar, M.; Cho, G.H.; Ra, I.-H. Convergence of blockchain and artificial intelligence in IoT network for the sustainable smart city. Sustain. Cities Soc. 2020, 63, 102364. [Google Scholar] [CrossRef]
- Appasani, B.; Mishra, S.K.; Jha, A.V.; Mishra, S.K.; Enescu, F.M.; Sorlei, I.S.; Bîrleanu, F.G.; Takorabet, N.; Thounthong, P.; Bizon, N. Blockchain-enabled smart grid applications: Architecture, challenges, and solutions. Sustainability 2022, 14, 8801. [Google Scholar] [CrossRef]
- Rissman, J.; Bataille, C.; Masanet, E.; Aden, N.; Morrow, W.R.; Zhou, N.; Elliott, N.; Dell, R.; Heeren, N.; Huckestein, B.; et al. Technologies and policies to decarbonize global industry: Review and assessment of mitigation drivers through 2070. Appl. Energy 2020, 266, 114848. [Google Scholar] [CrossRef]
- Aurelian Nicola, Bogdan Ioan Marc, Gheorghe Bogdan Urdea, Cosmin Daniel Vitan, Evelina Rezmerița, Vasile Darii, Study on Road Traffic Management in the Municipality of Petroșani (in romanian: Studiu Privind Managementul Traficului Rutier în Municipiul Petroșani), Beneficiary: Petroșani Municipality, Prepared by: University of Petroșani, Petroșani, 2023.
Figure 1.
Location of Petrosani city on the map of Romania.
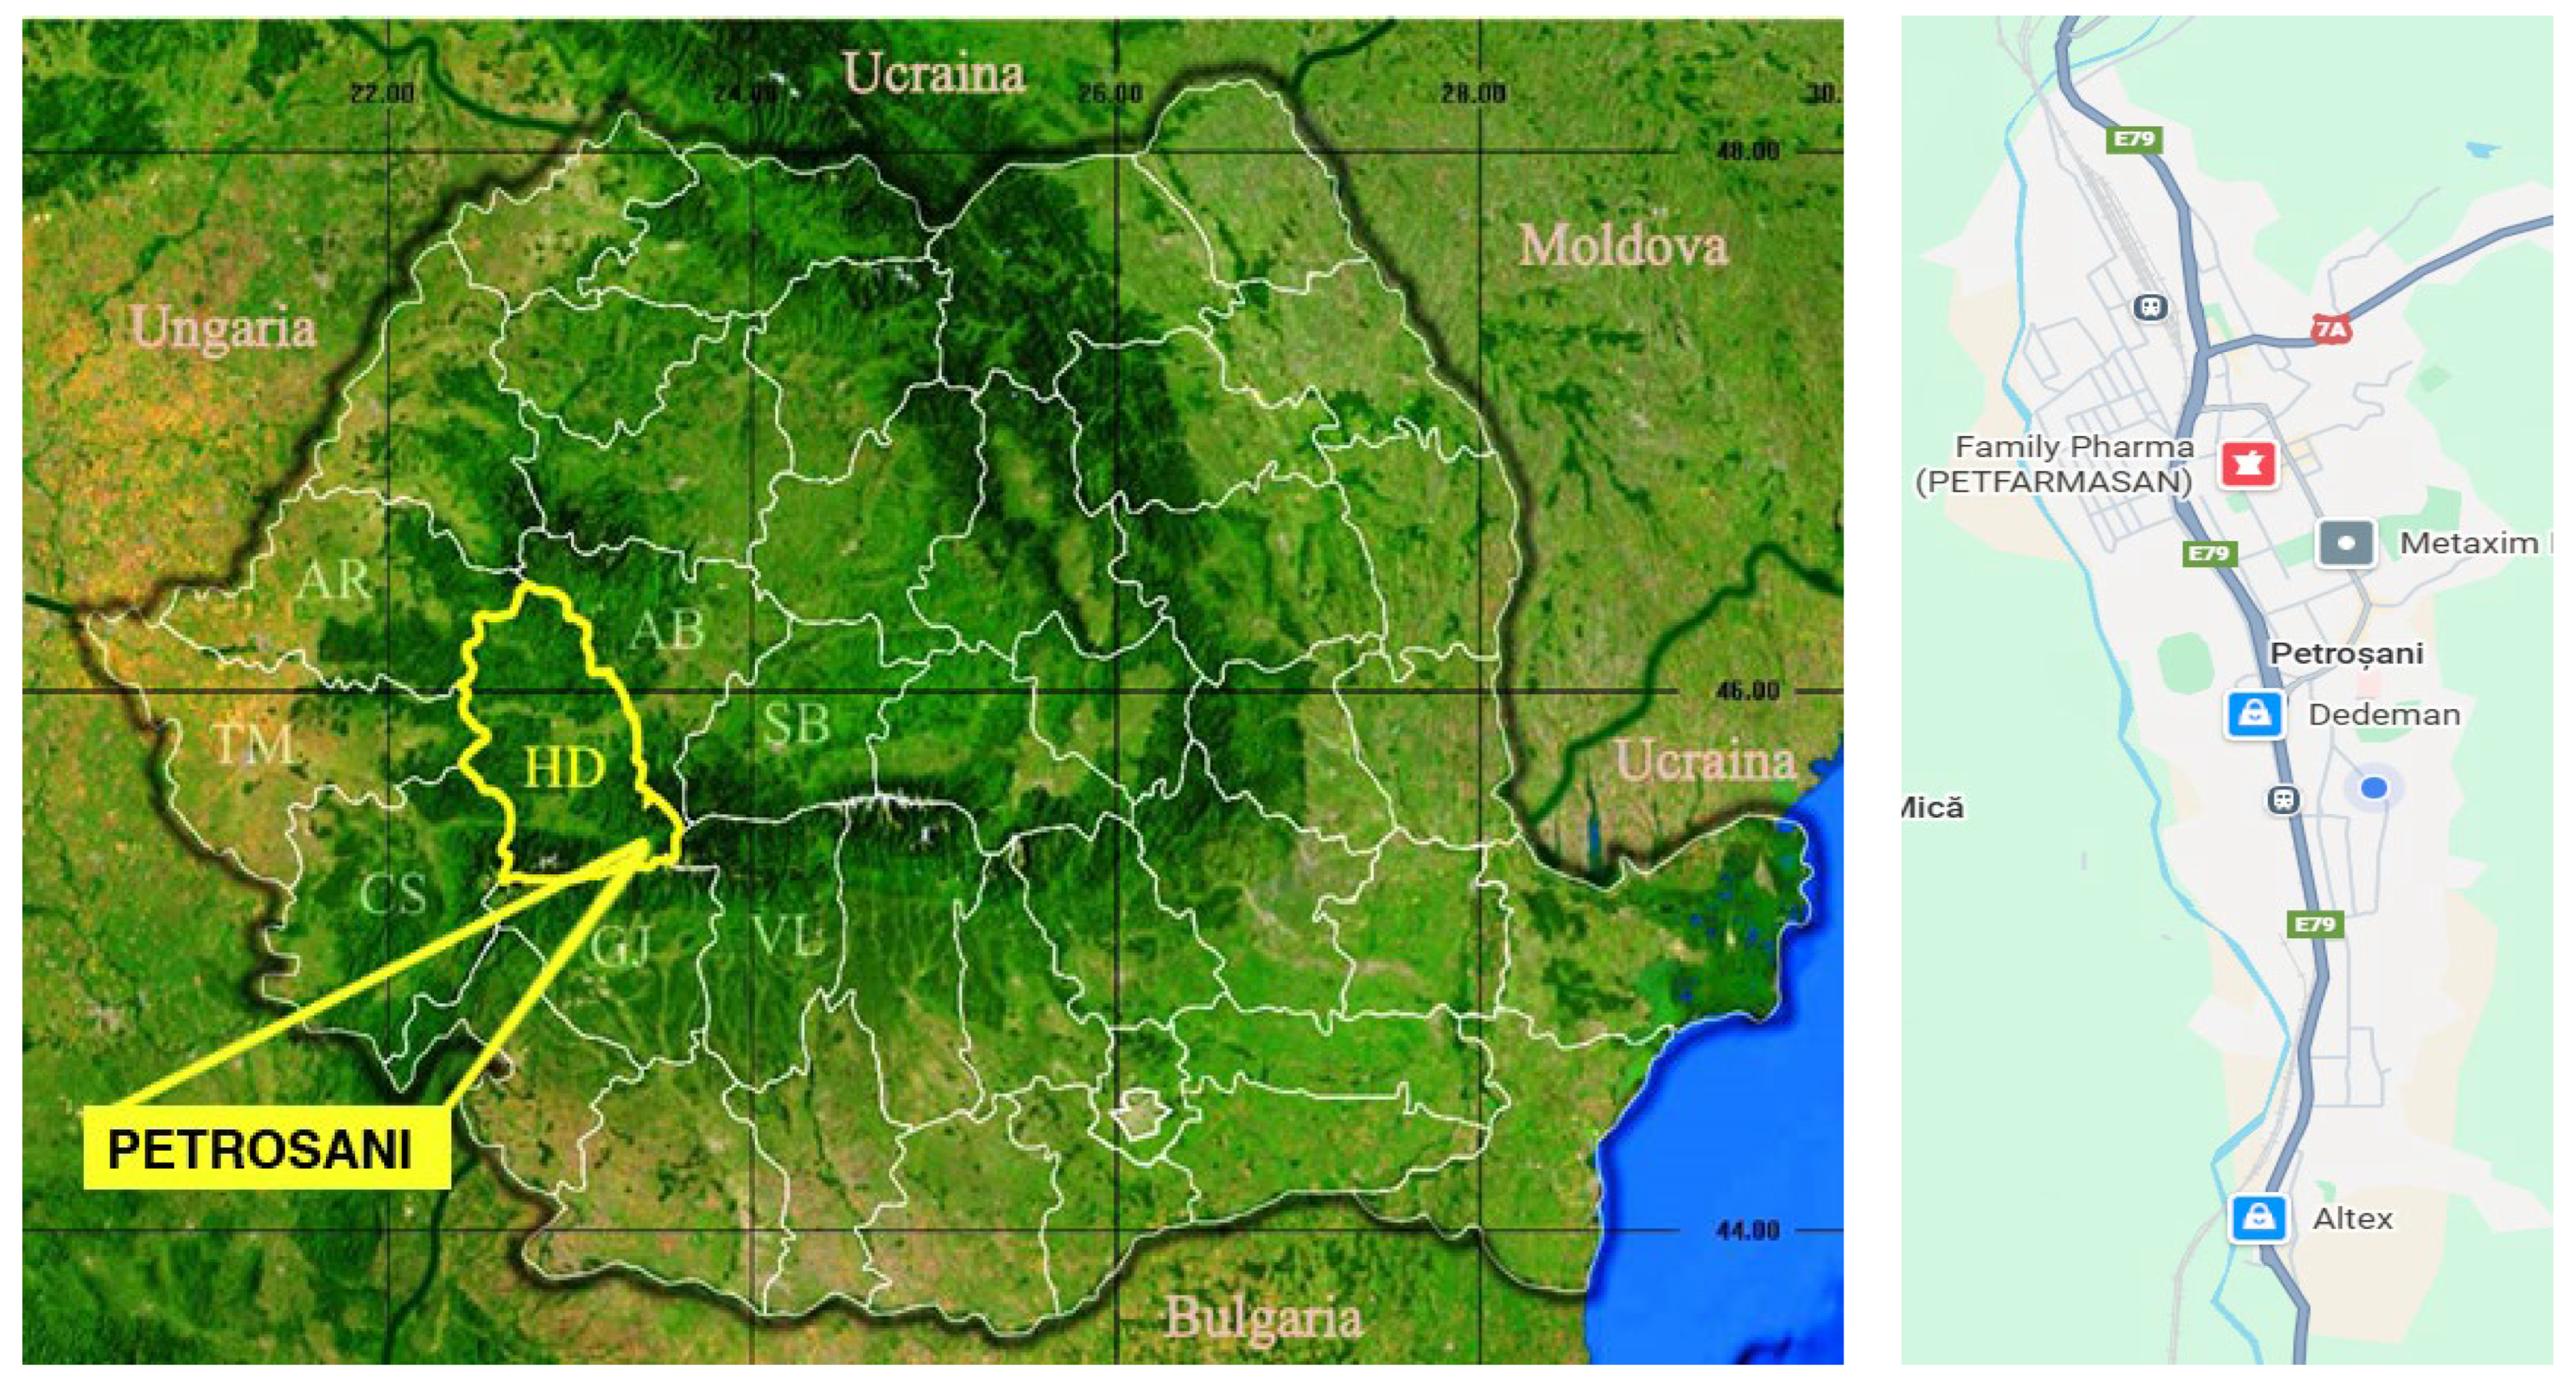
Figure 2.
Location of locations proposed to the North traffic study.
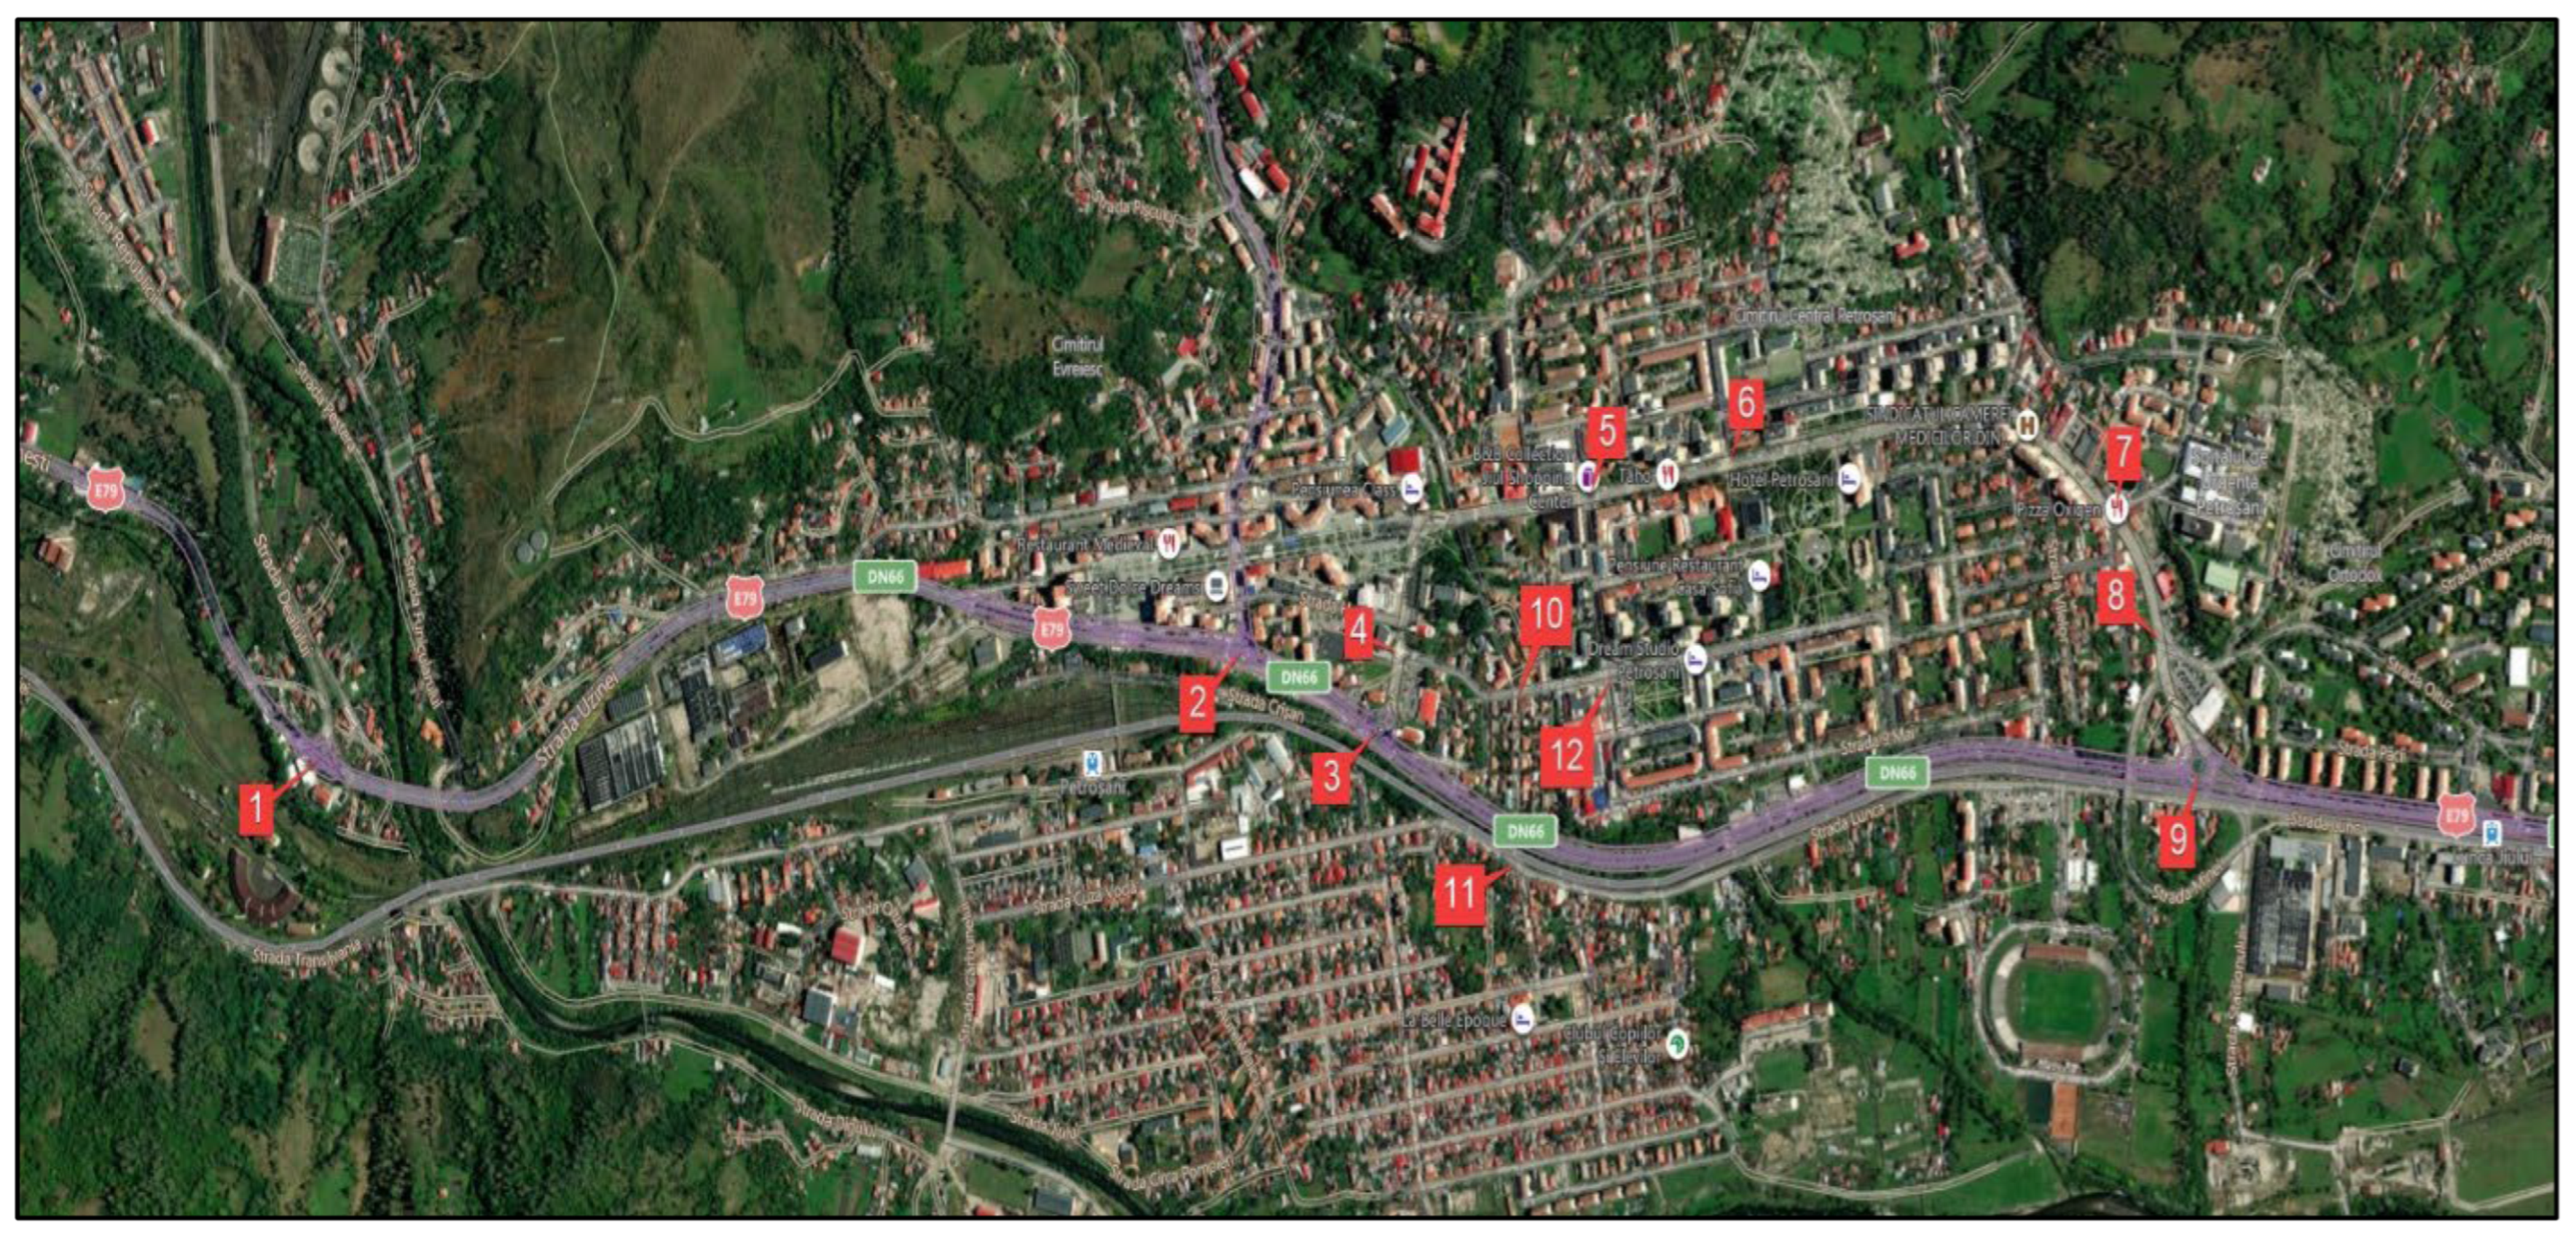
Figure 3.
Location of locations proposed to the South traffic study.
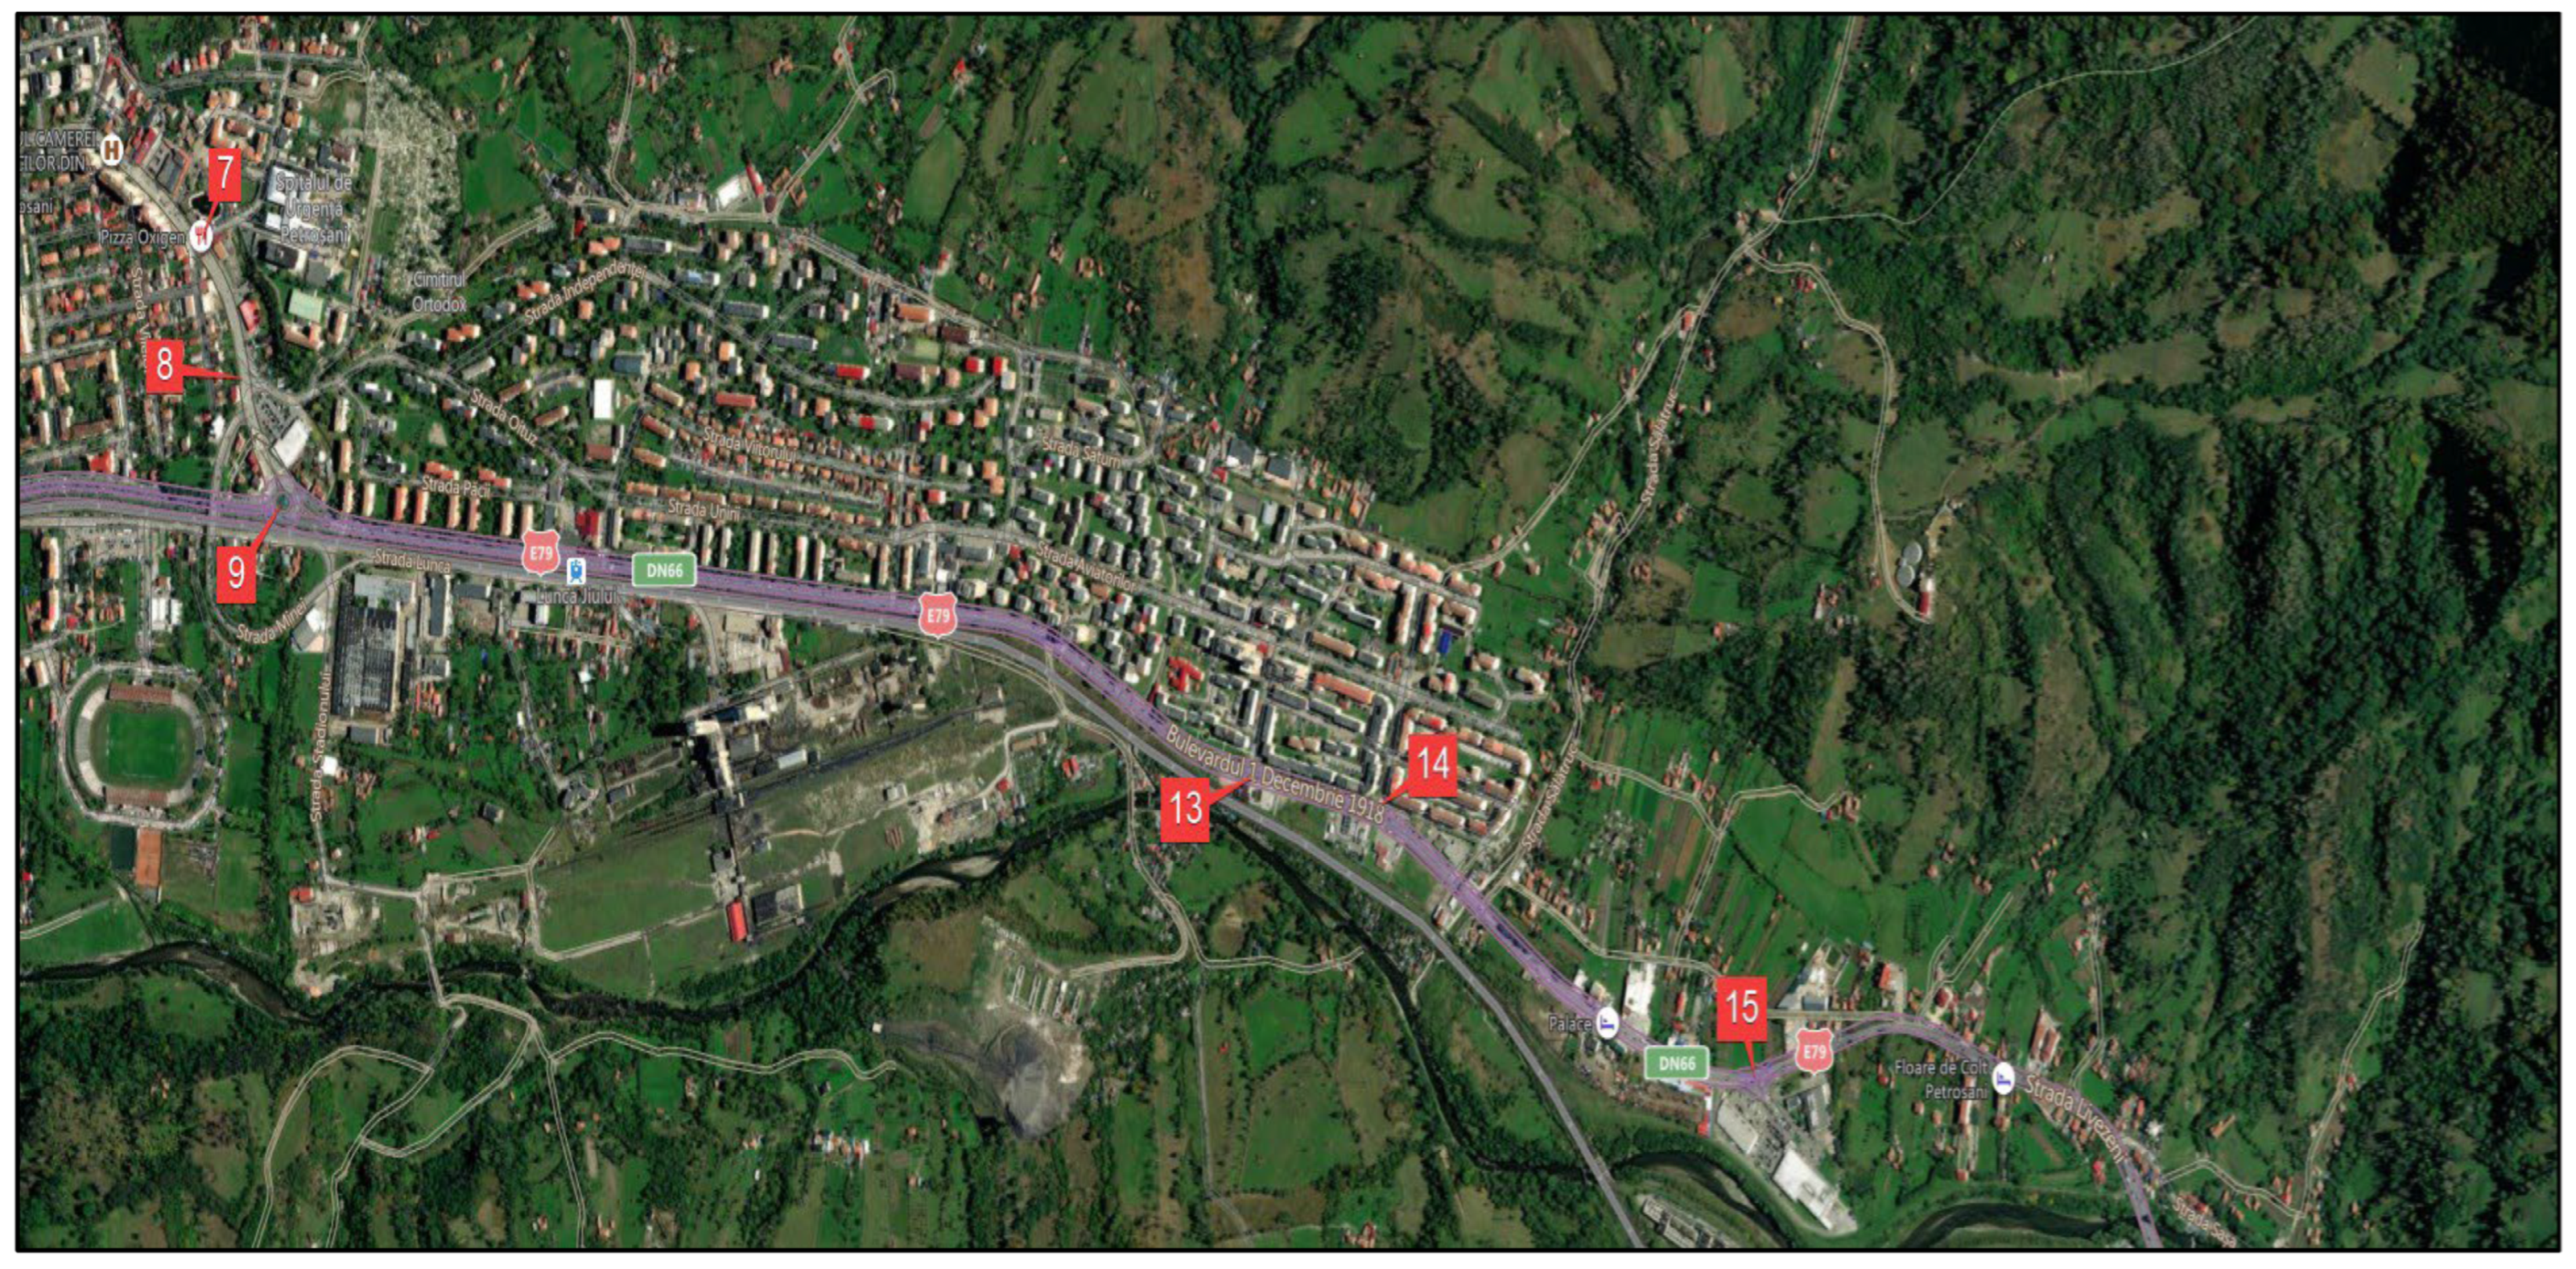
Figure 4.
Proposed routes for electric buses circulation in Petrosani.
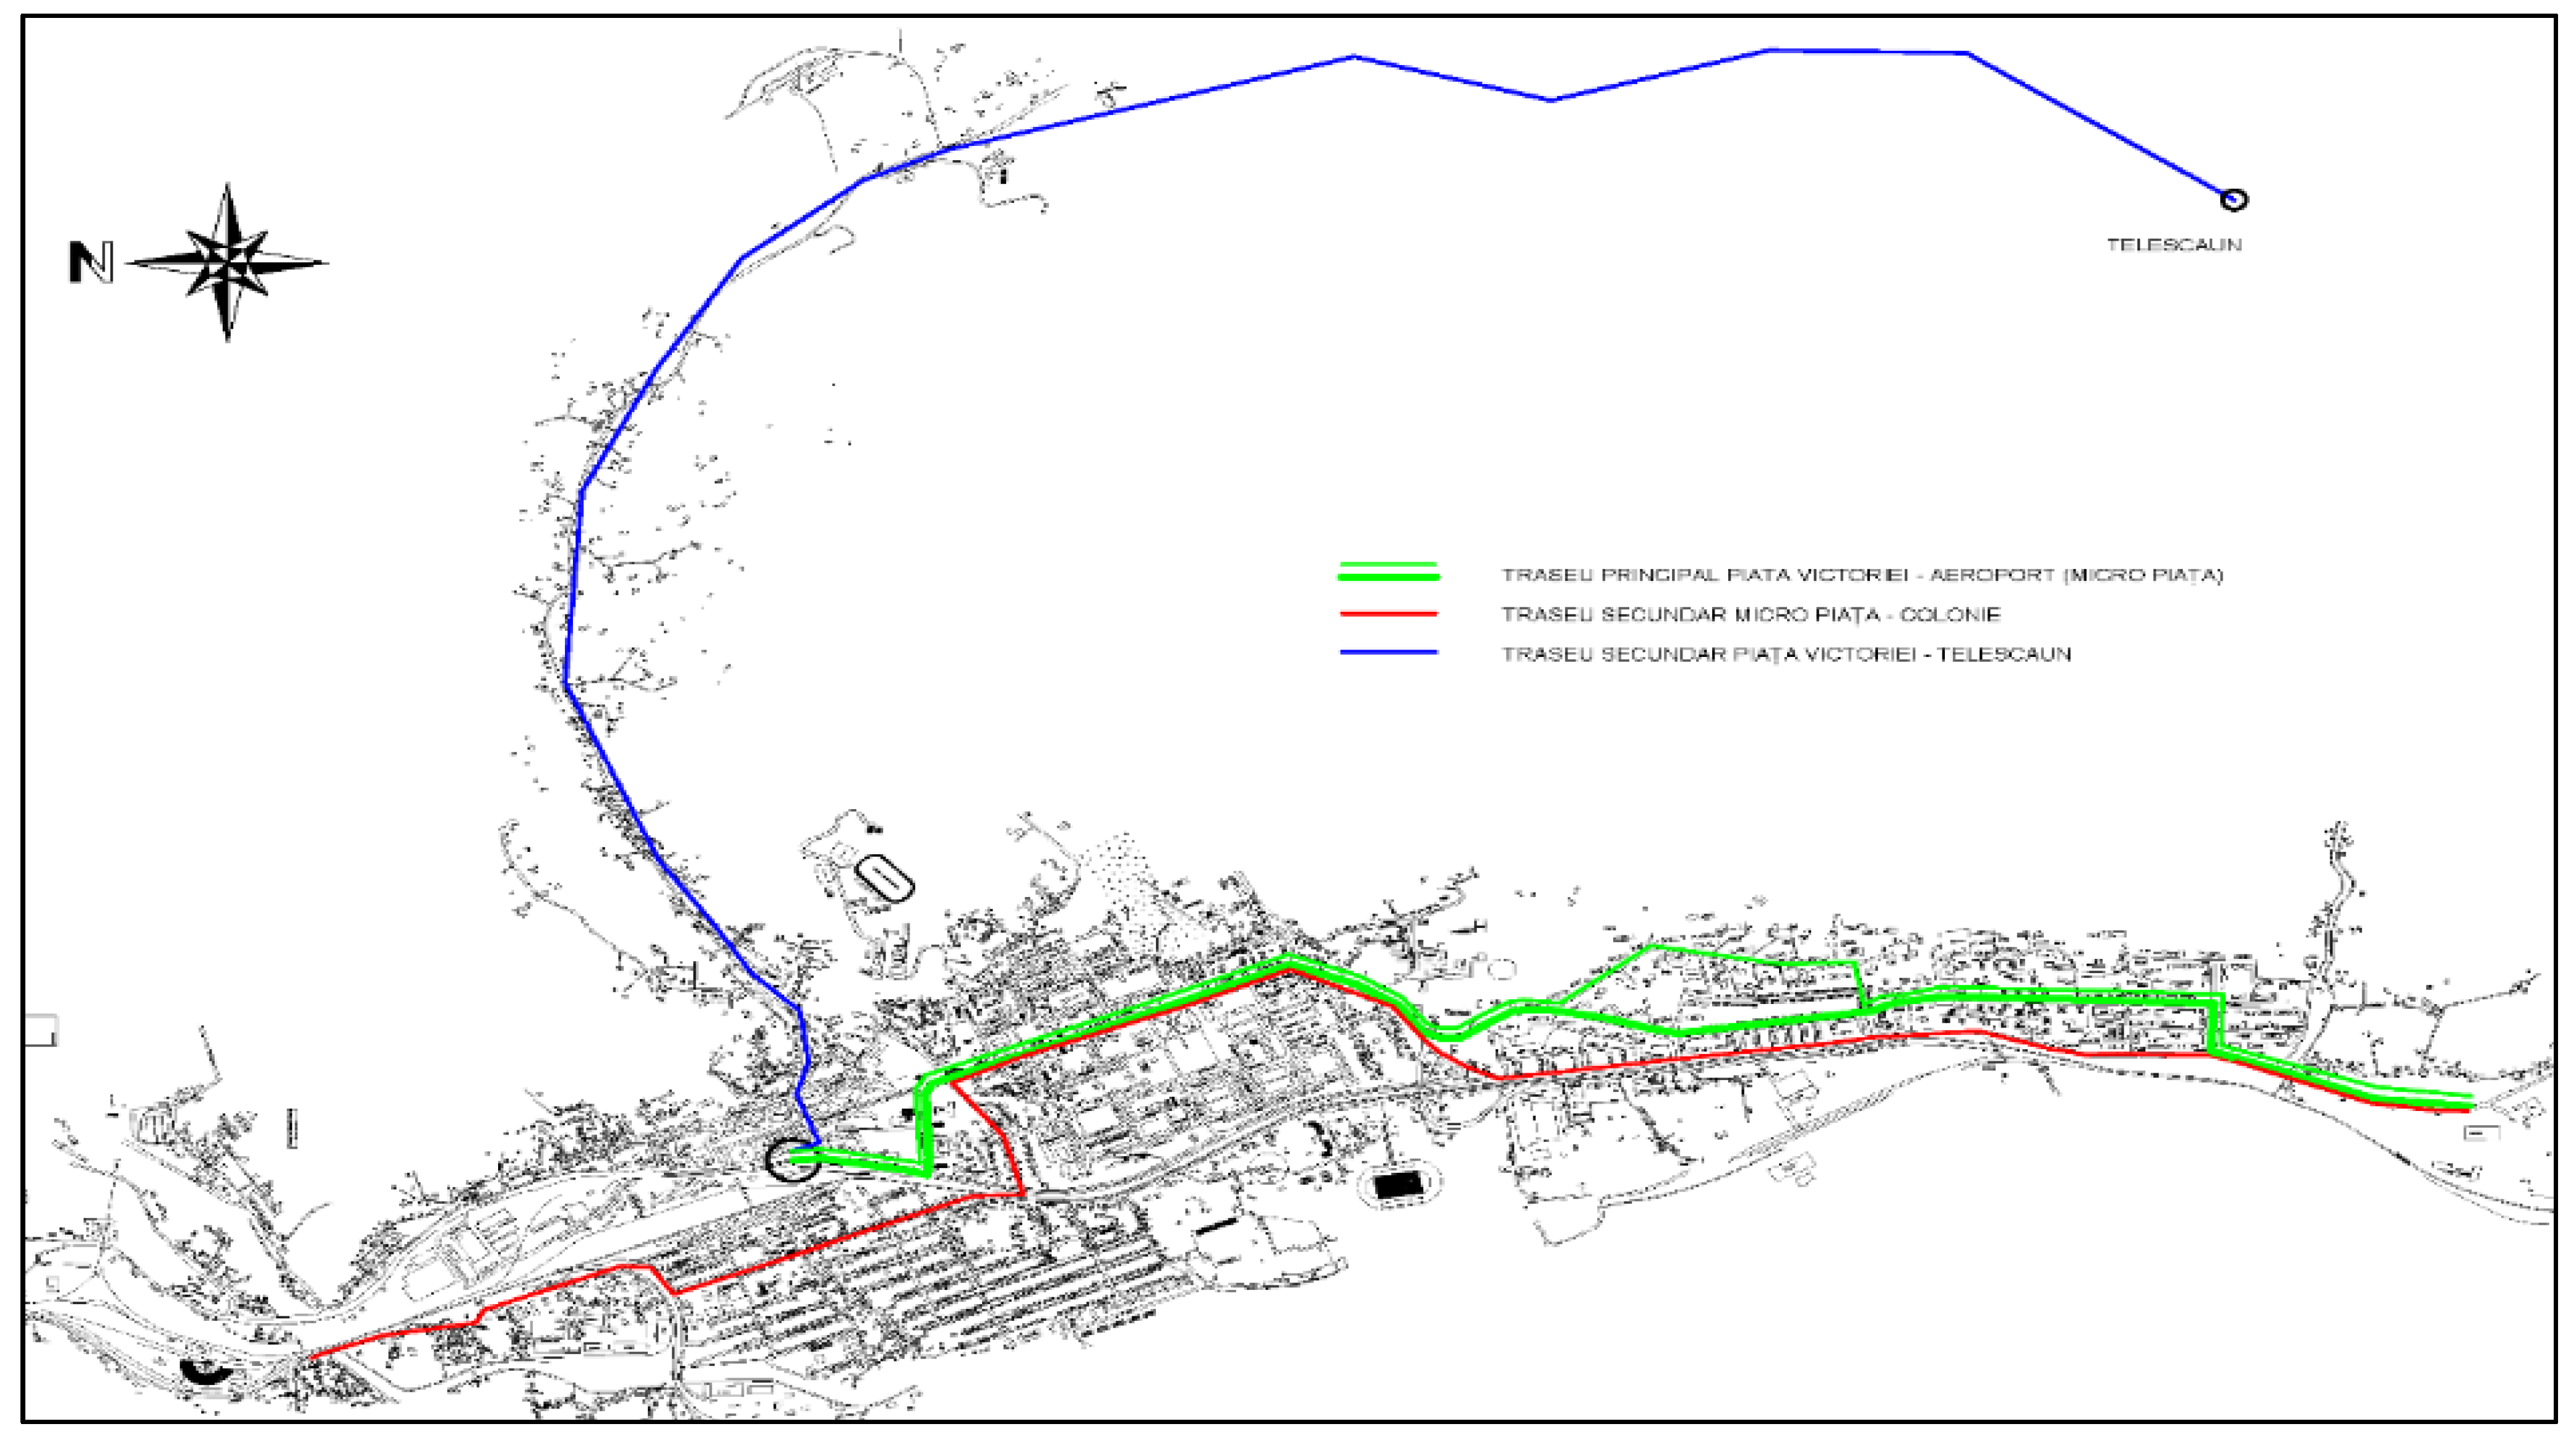
Figure 5.
Drone view of the studied area.
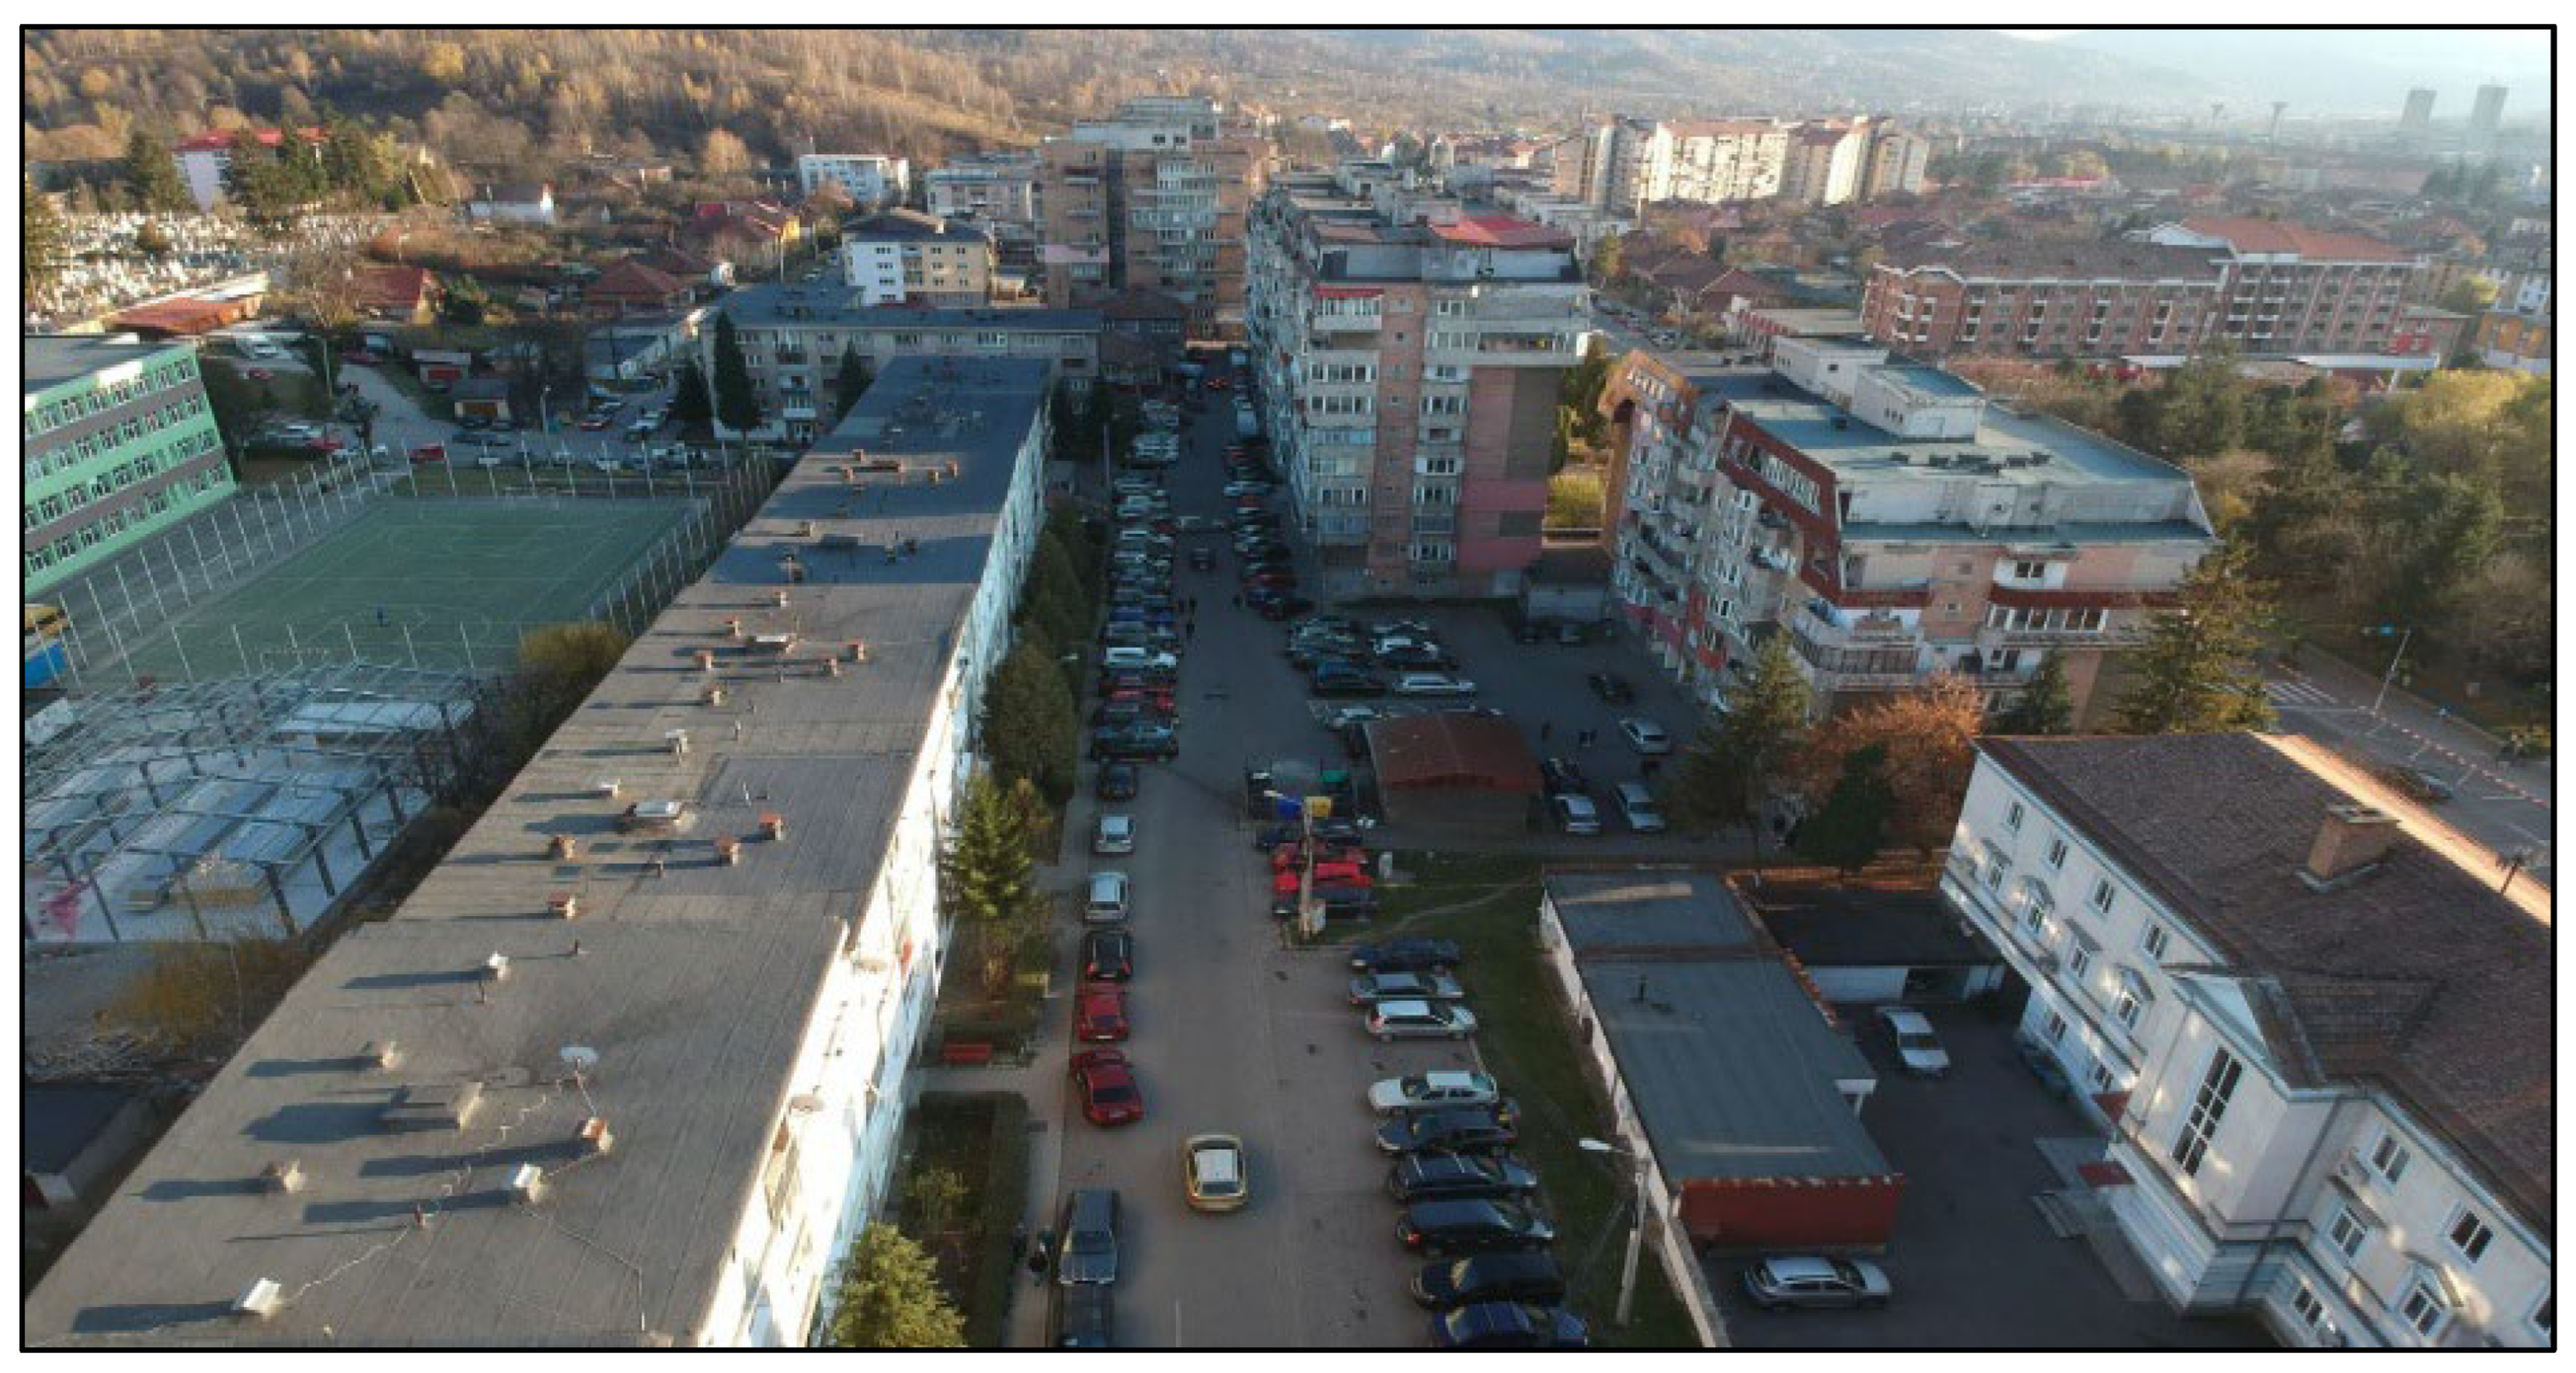
Figure 6.
View of the studied area.
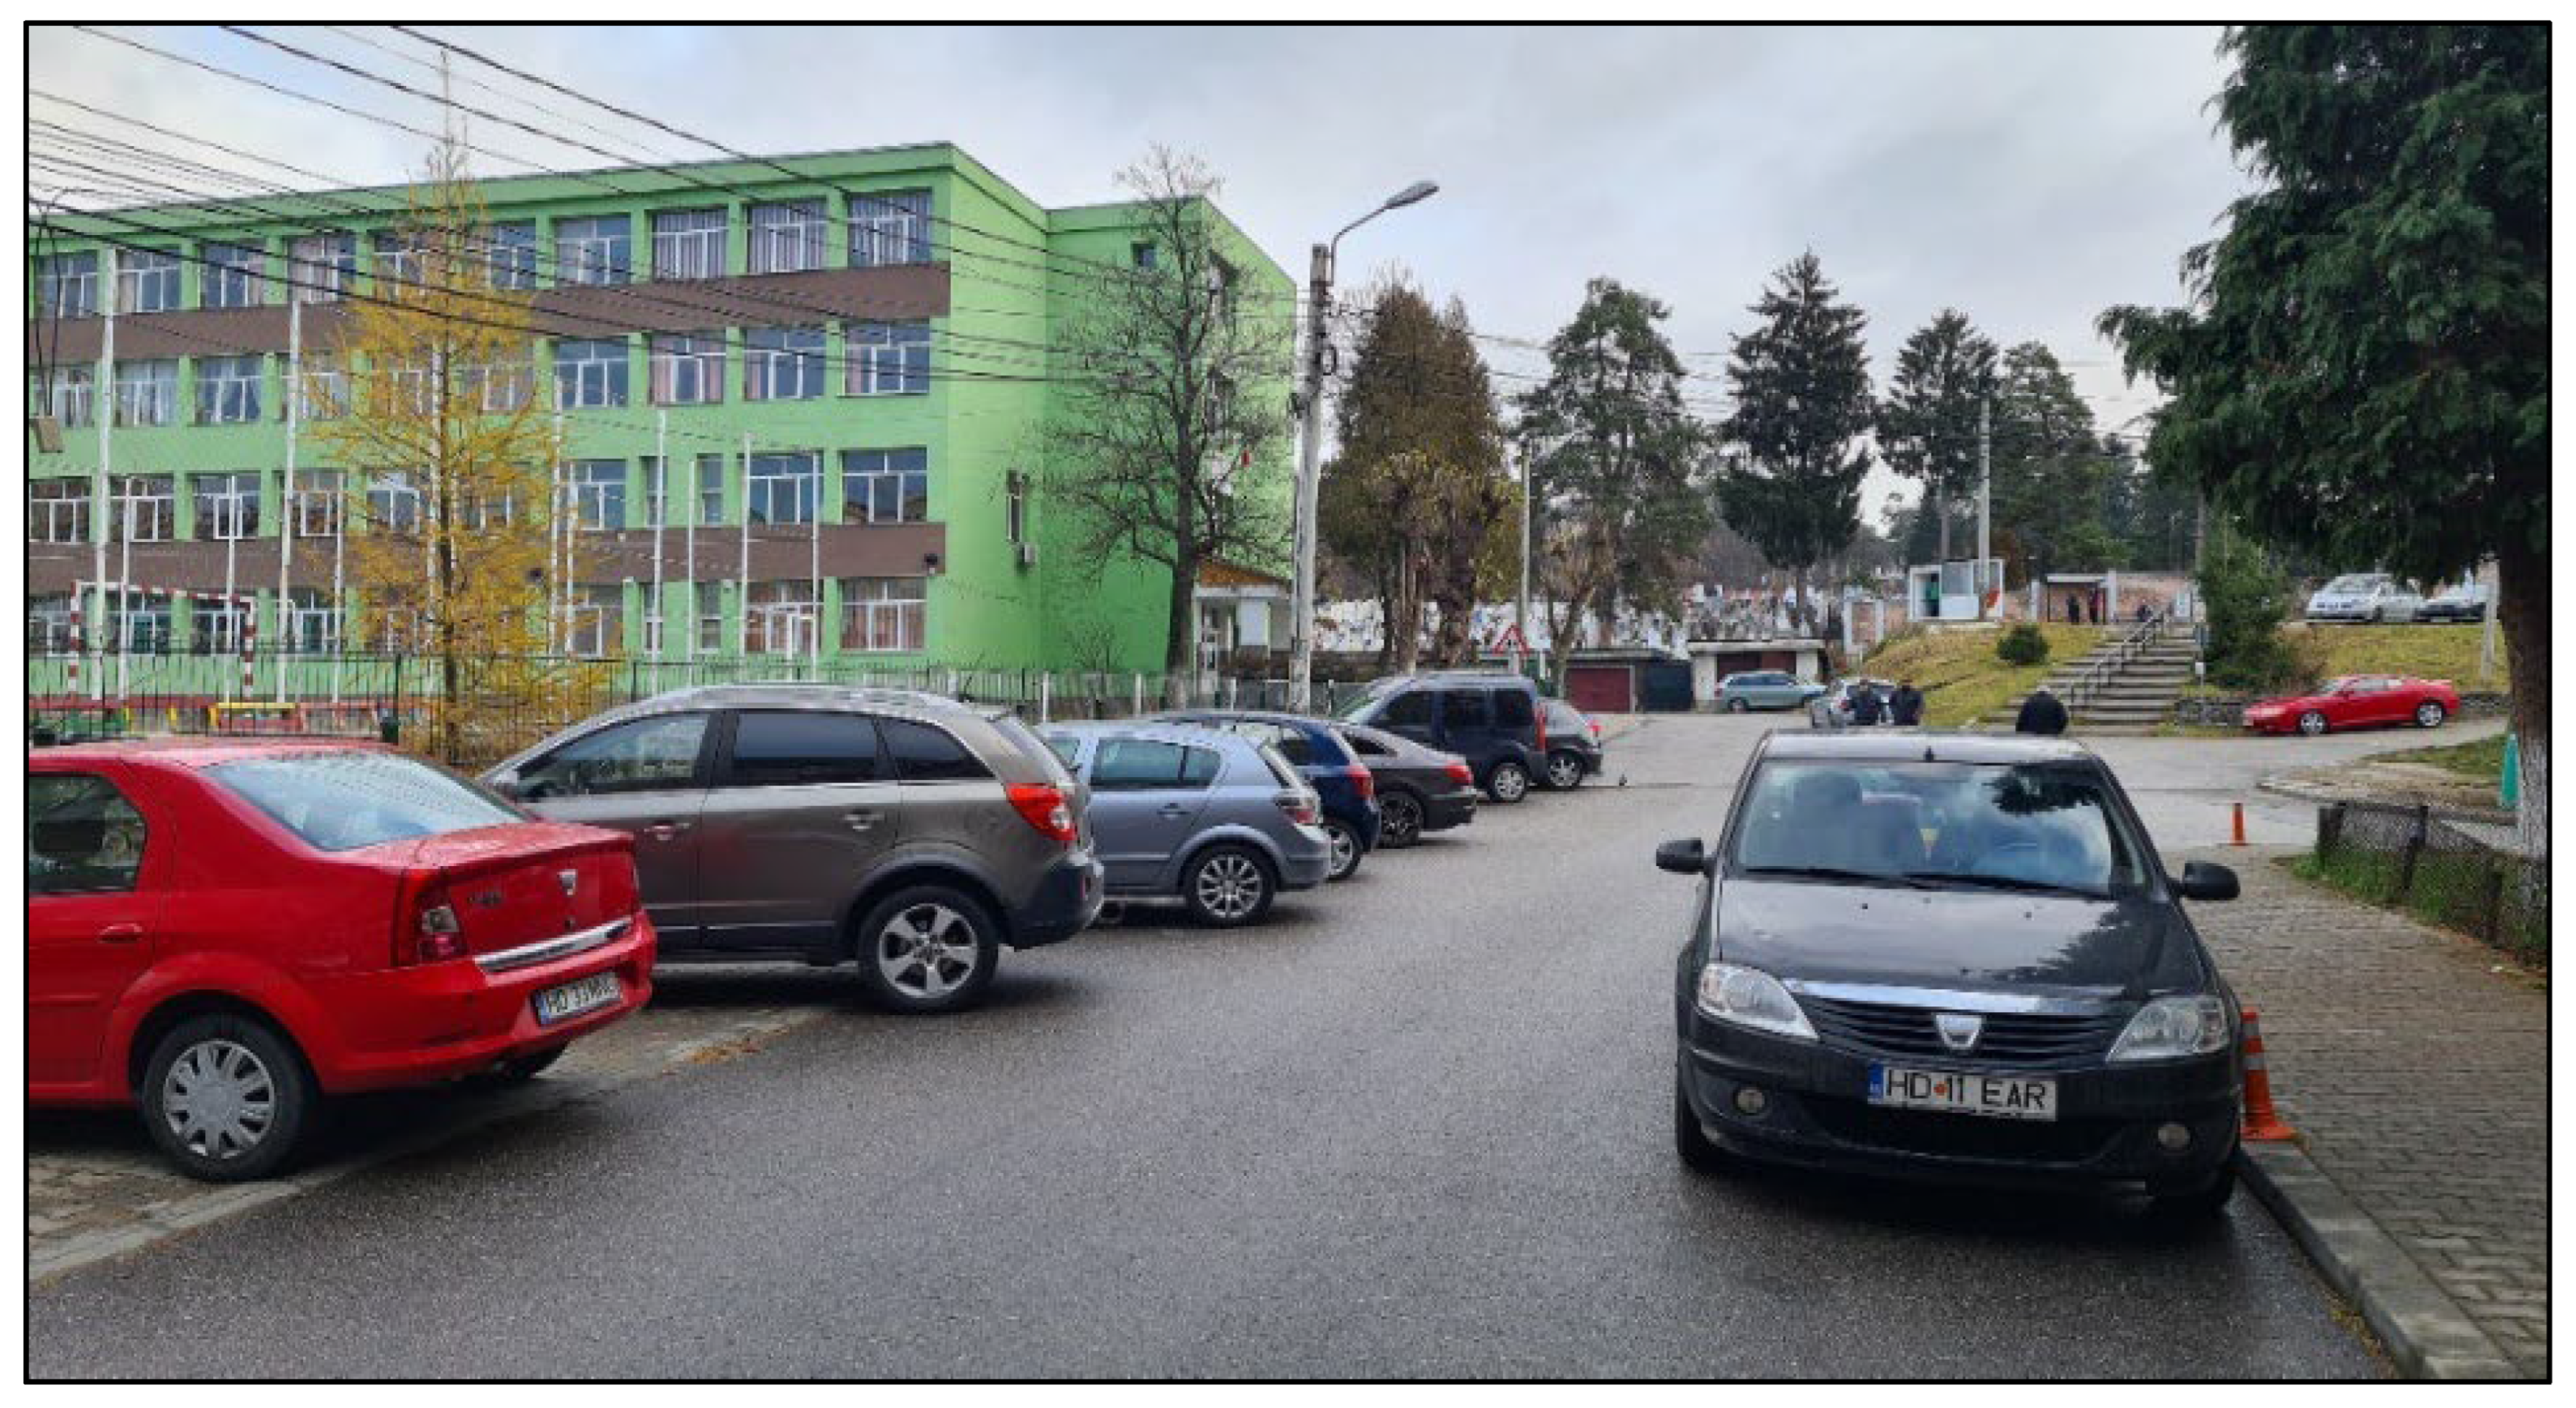
Figure 7.
Drone view of the studied area.
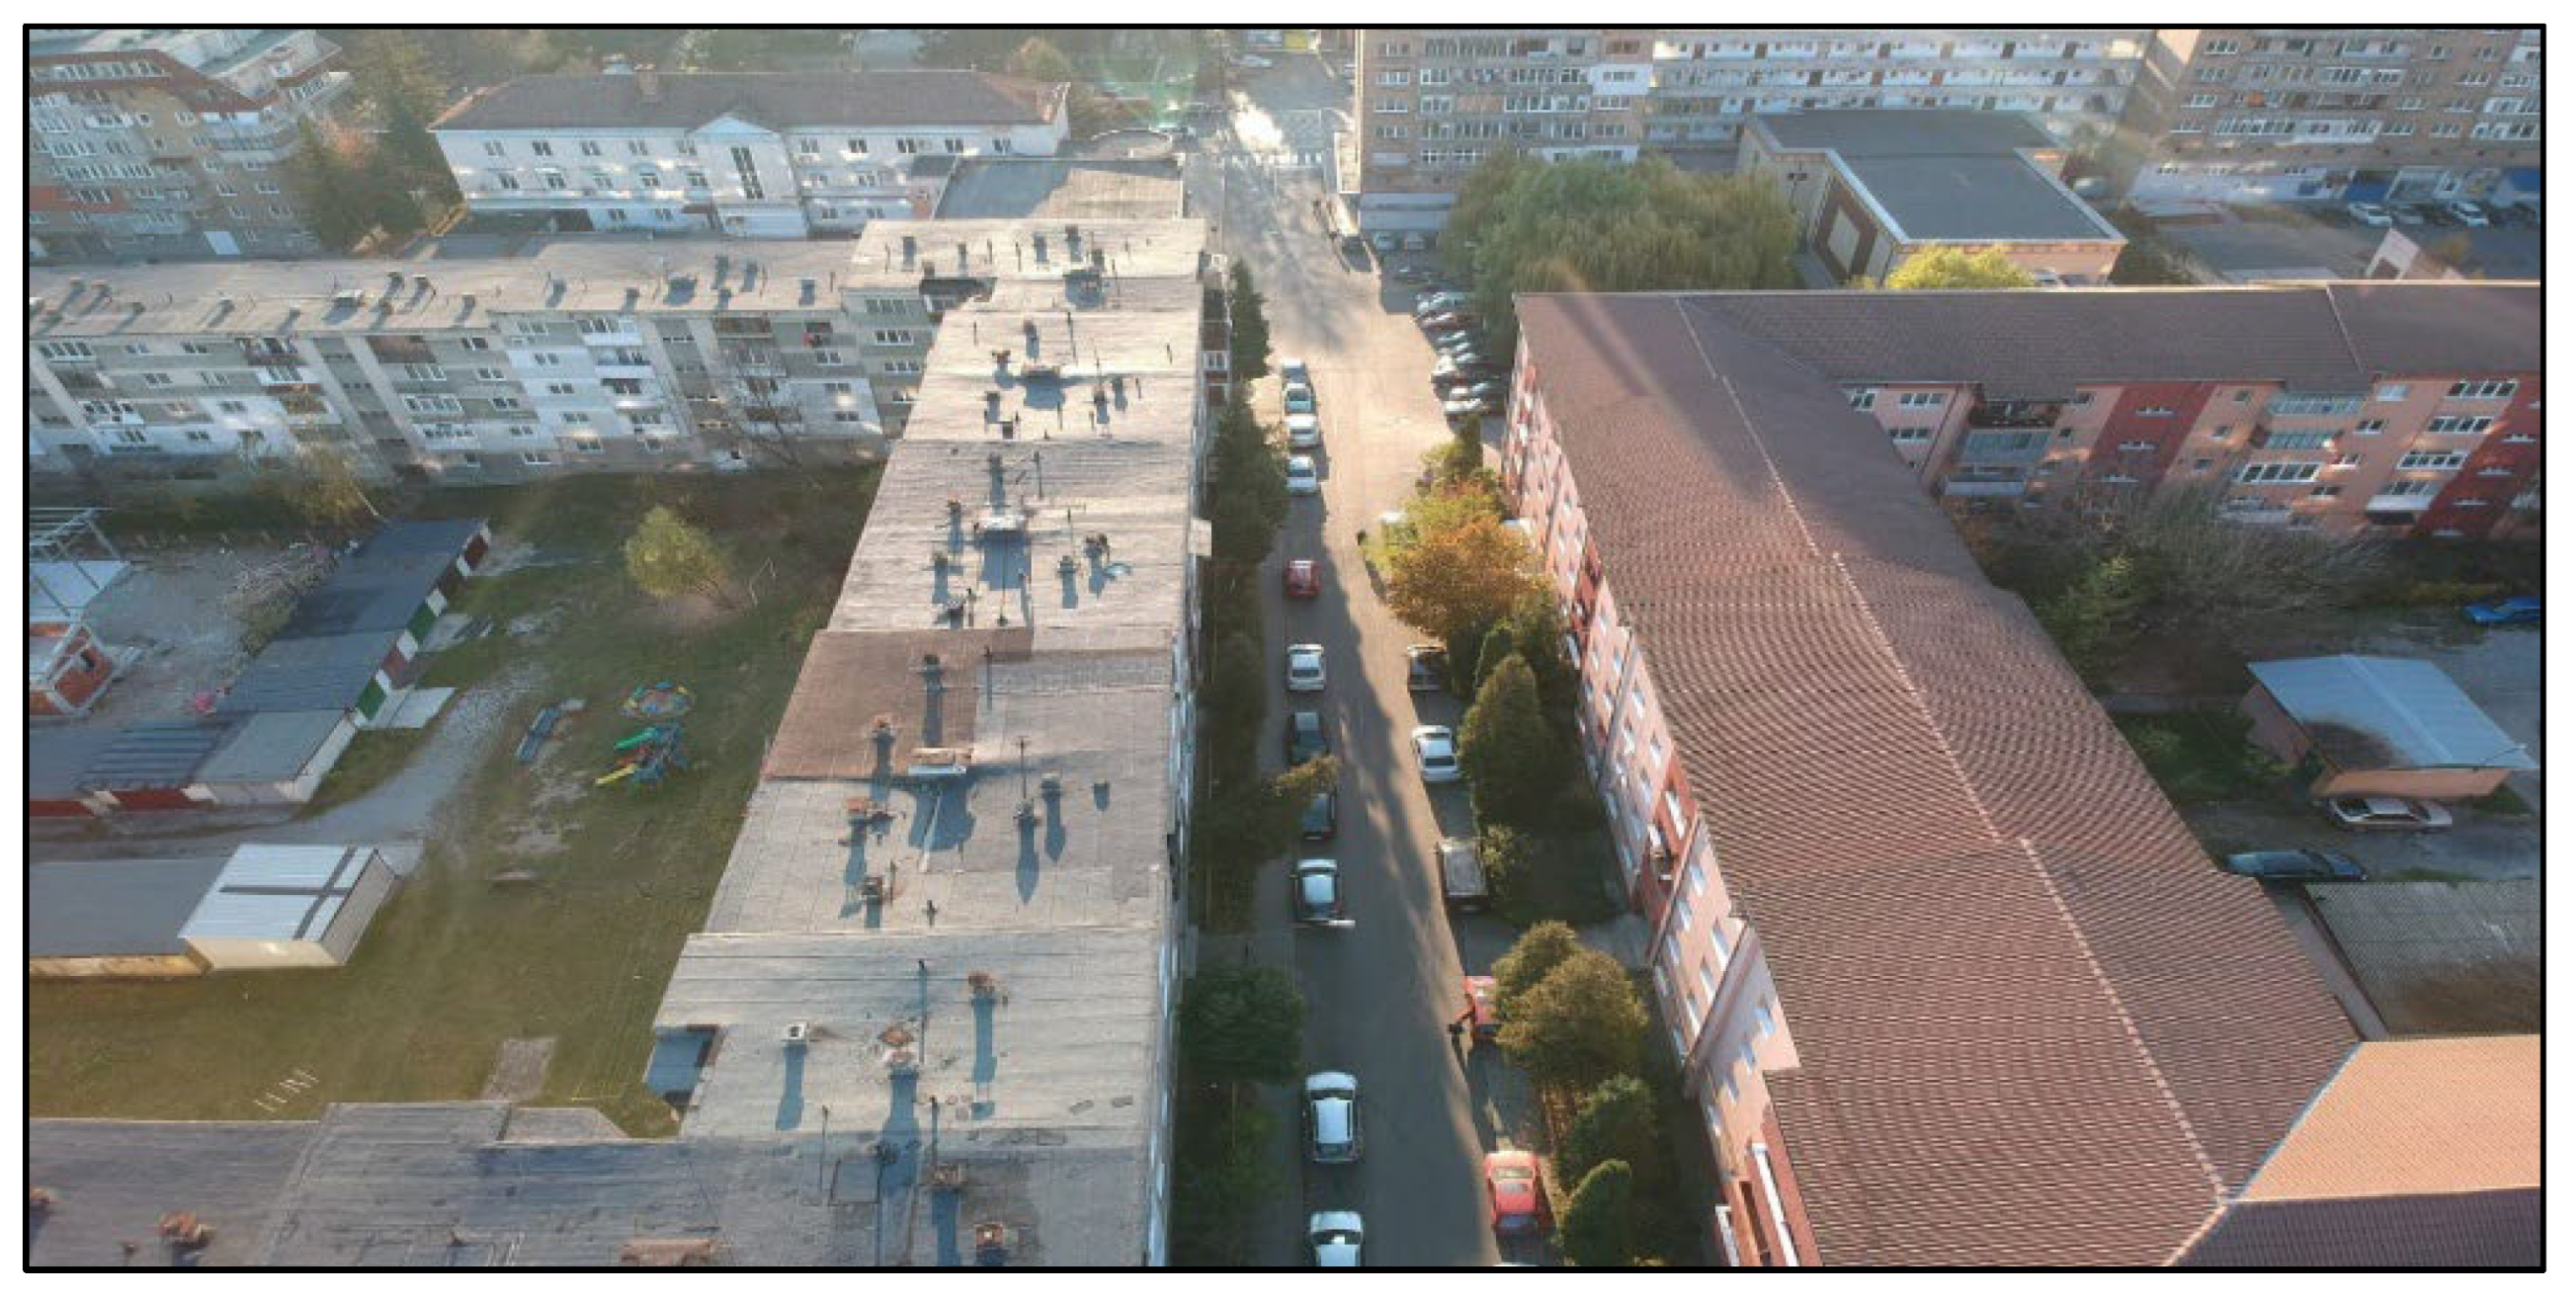
Figure 8.
Drone view of the studied area.
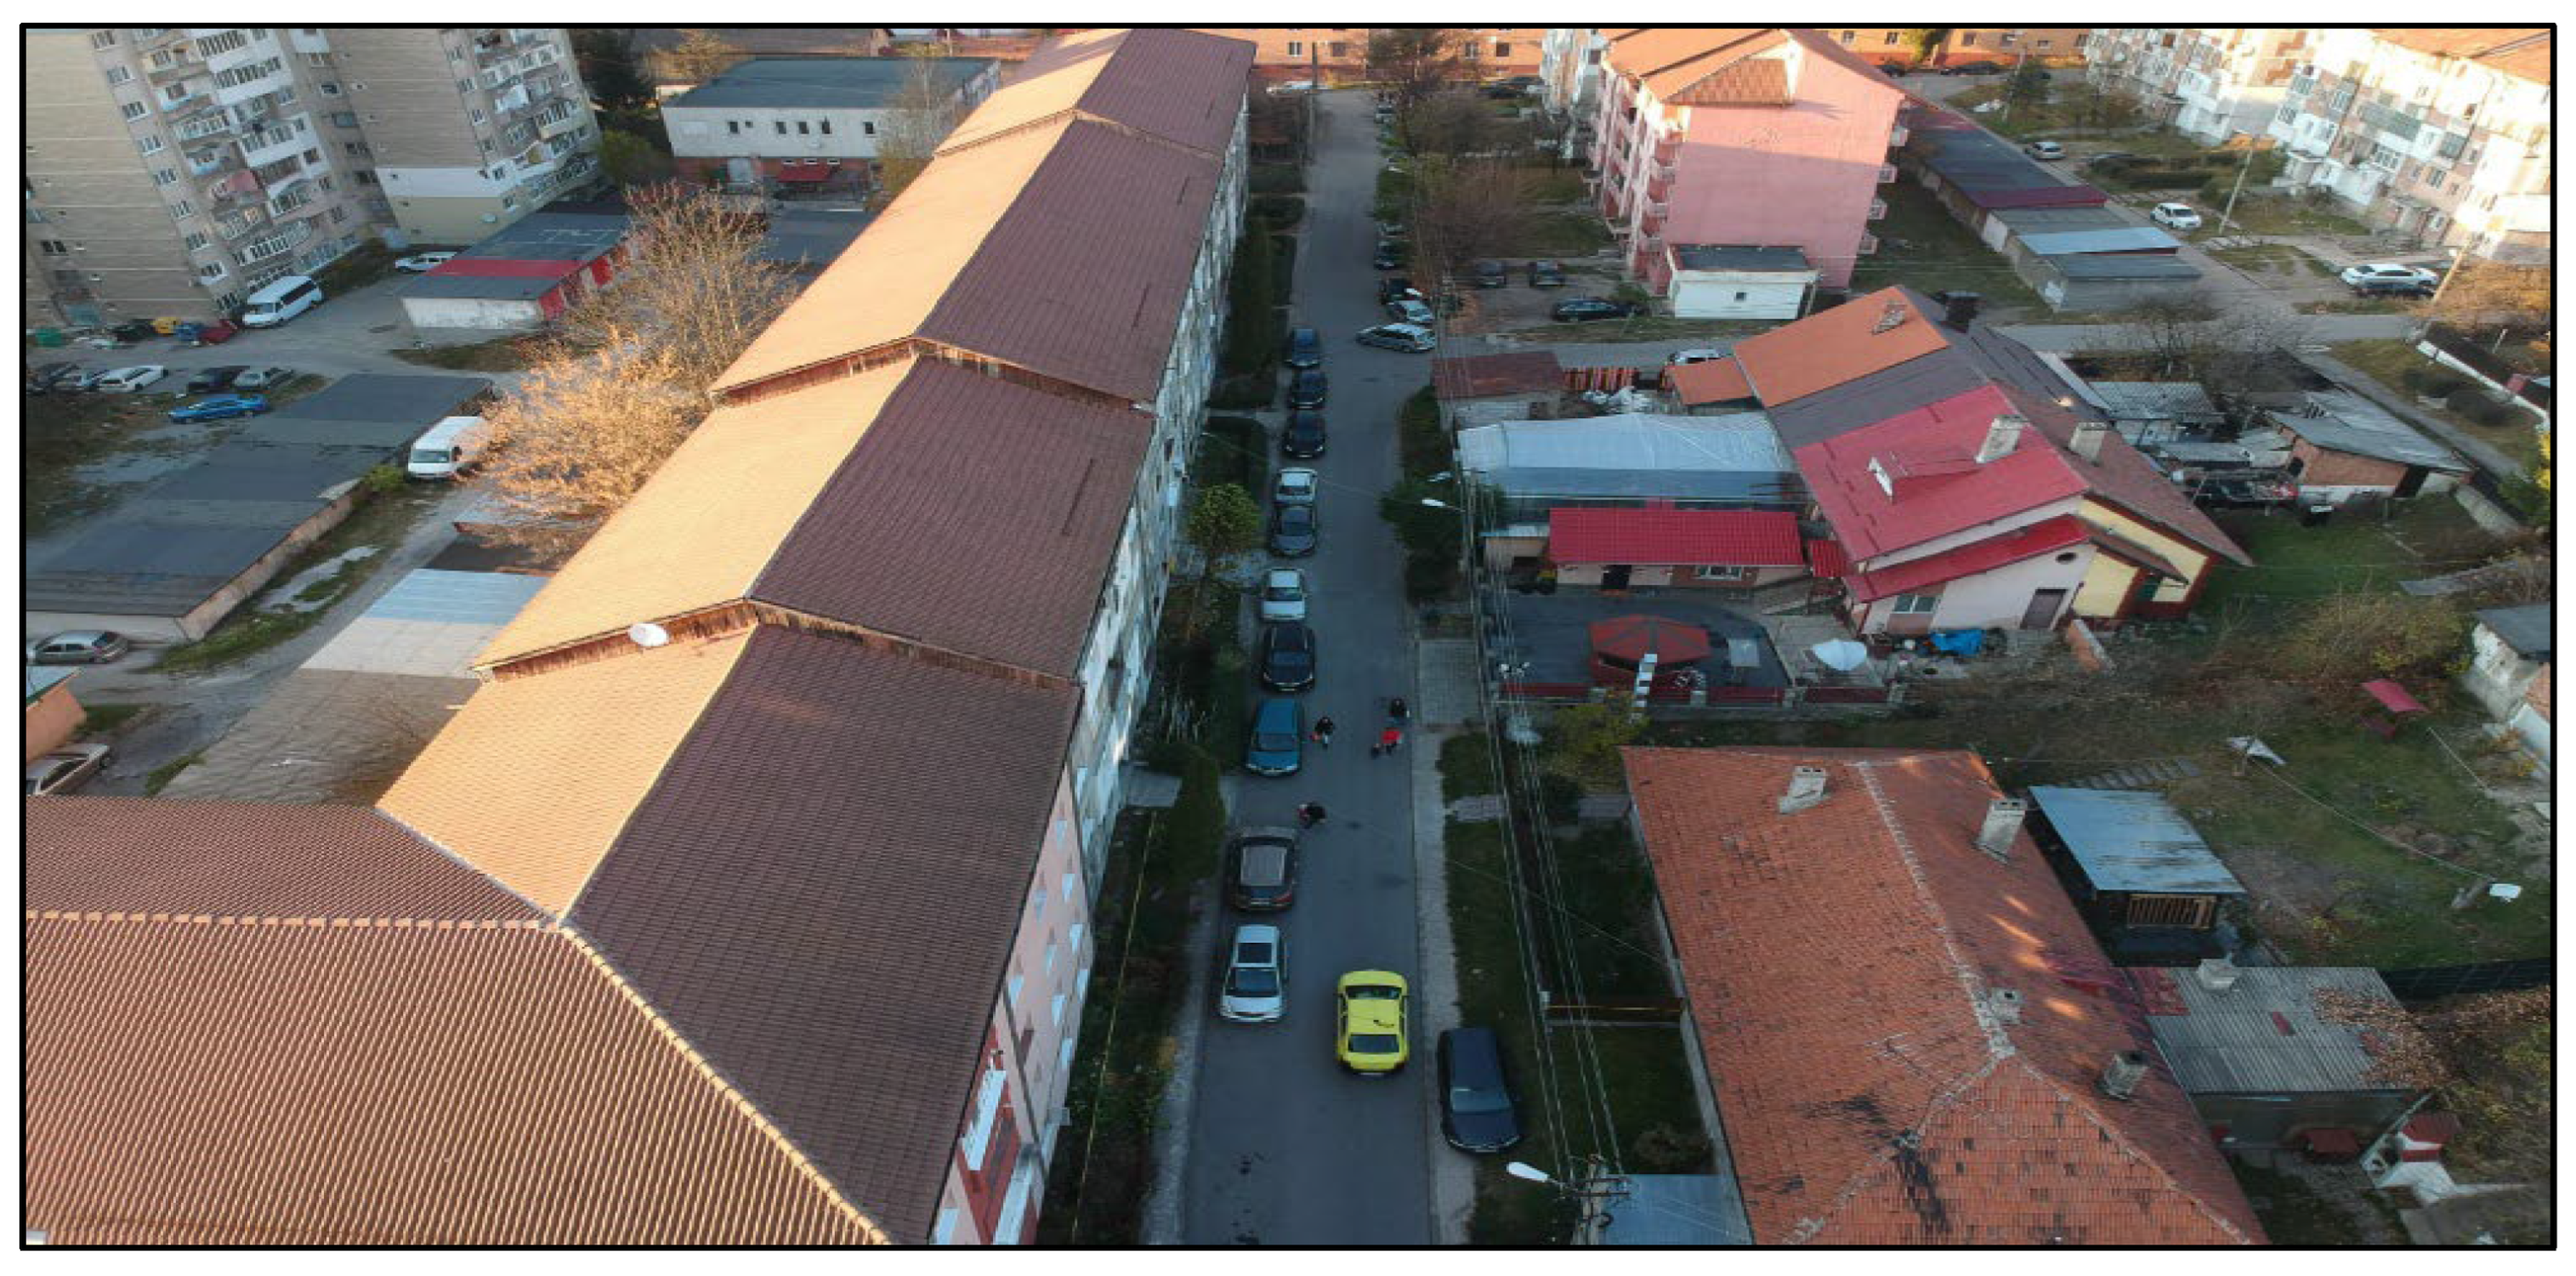
Figure 9.
View of the studied area.
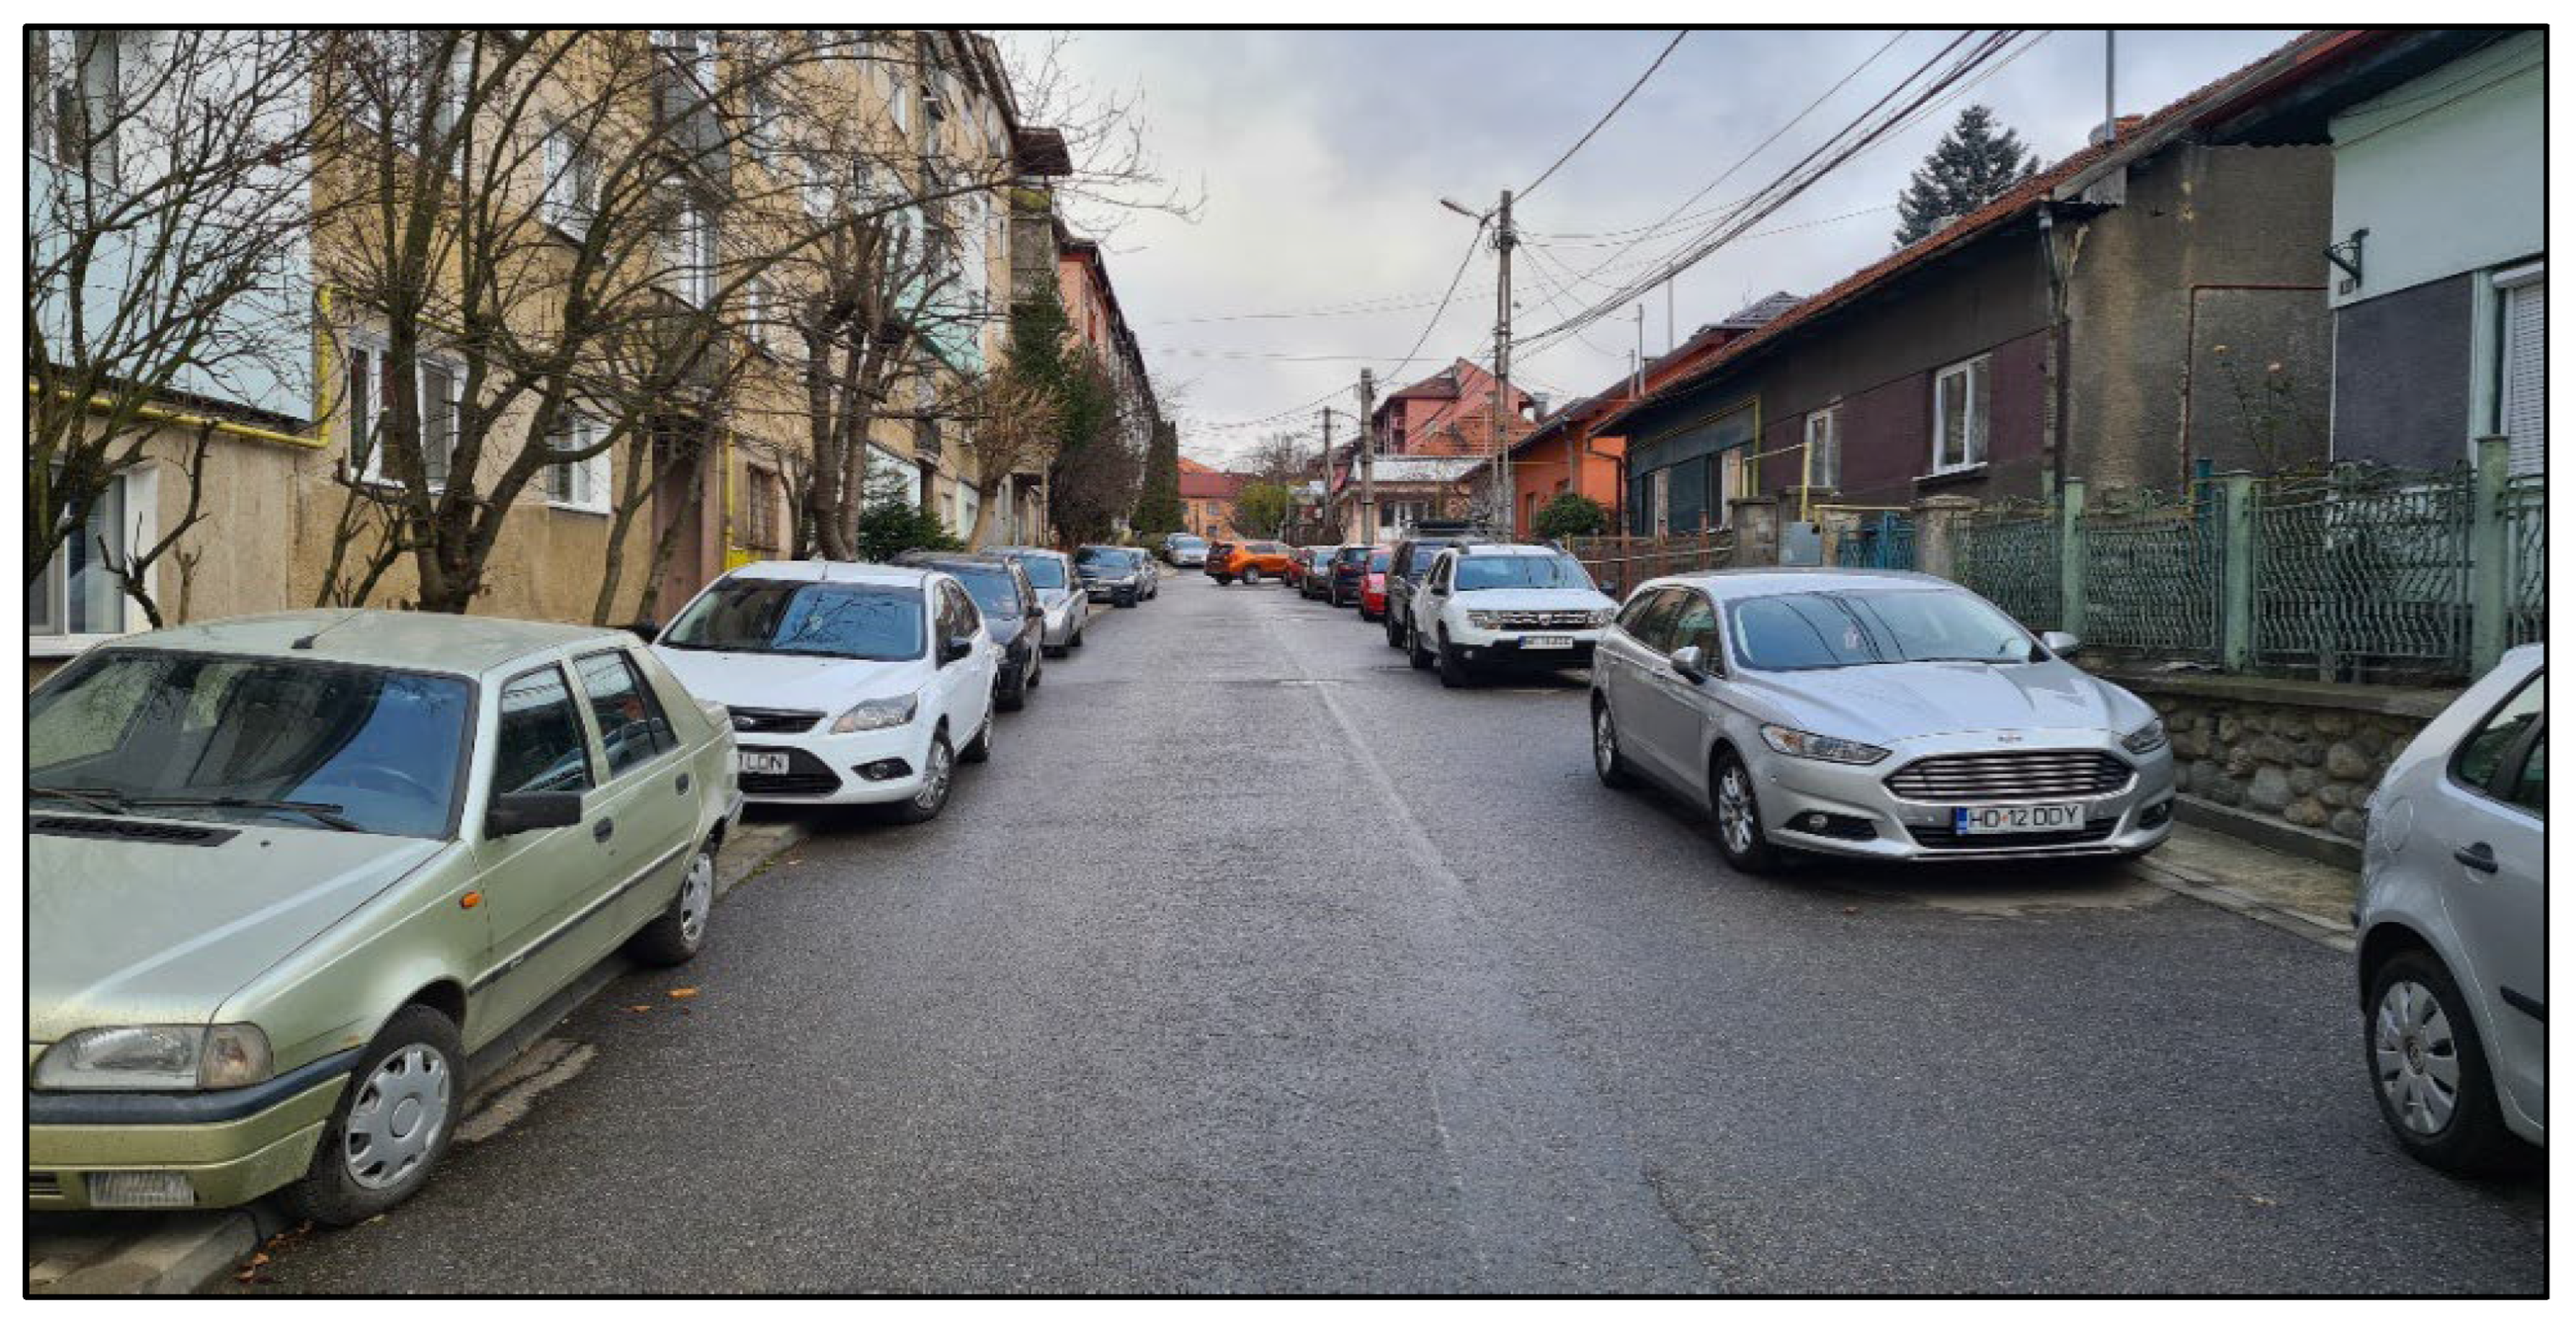
Figure 10.
Footbridge 1 - Lunca area (source: S.C. VENTOR Grup Consulting S.R.L.).
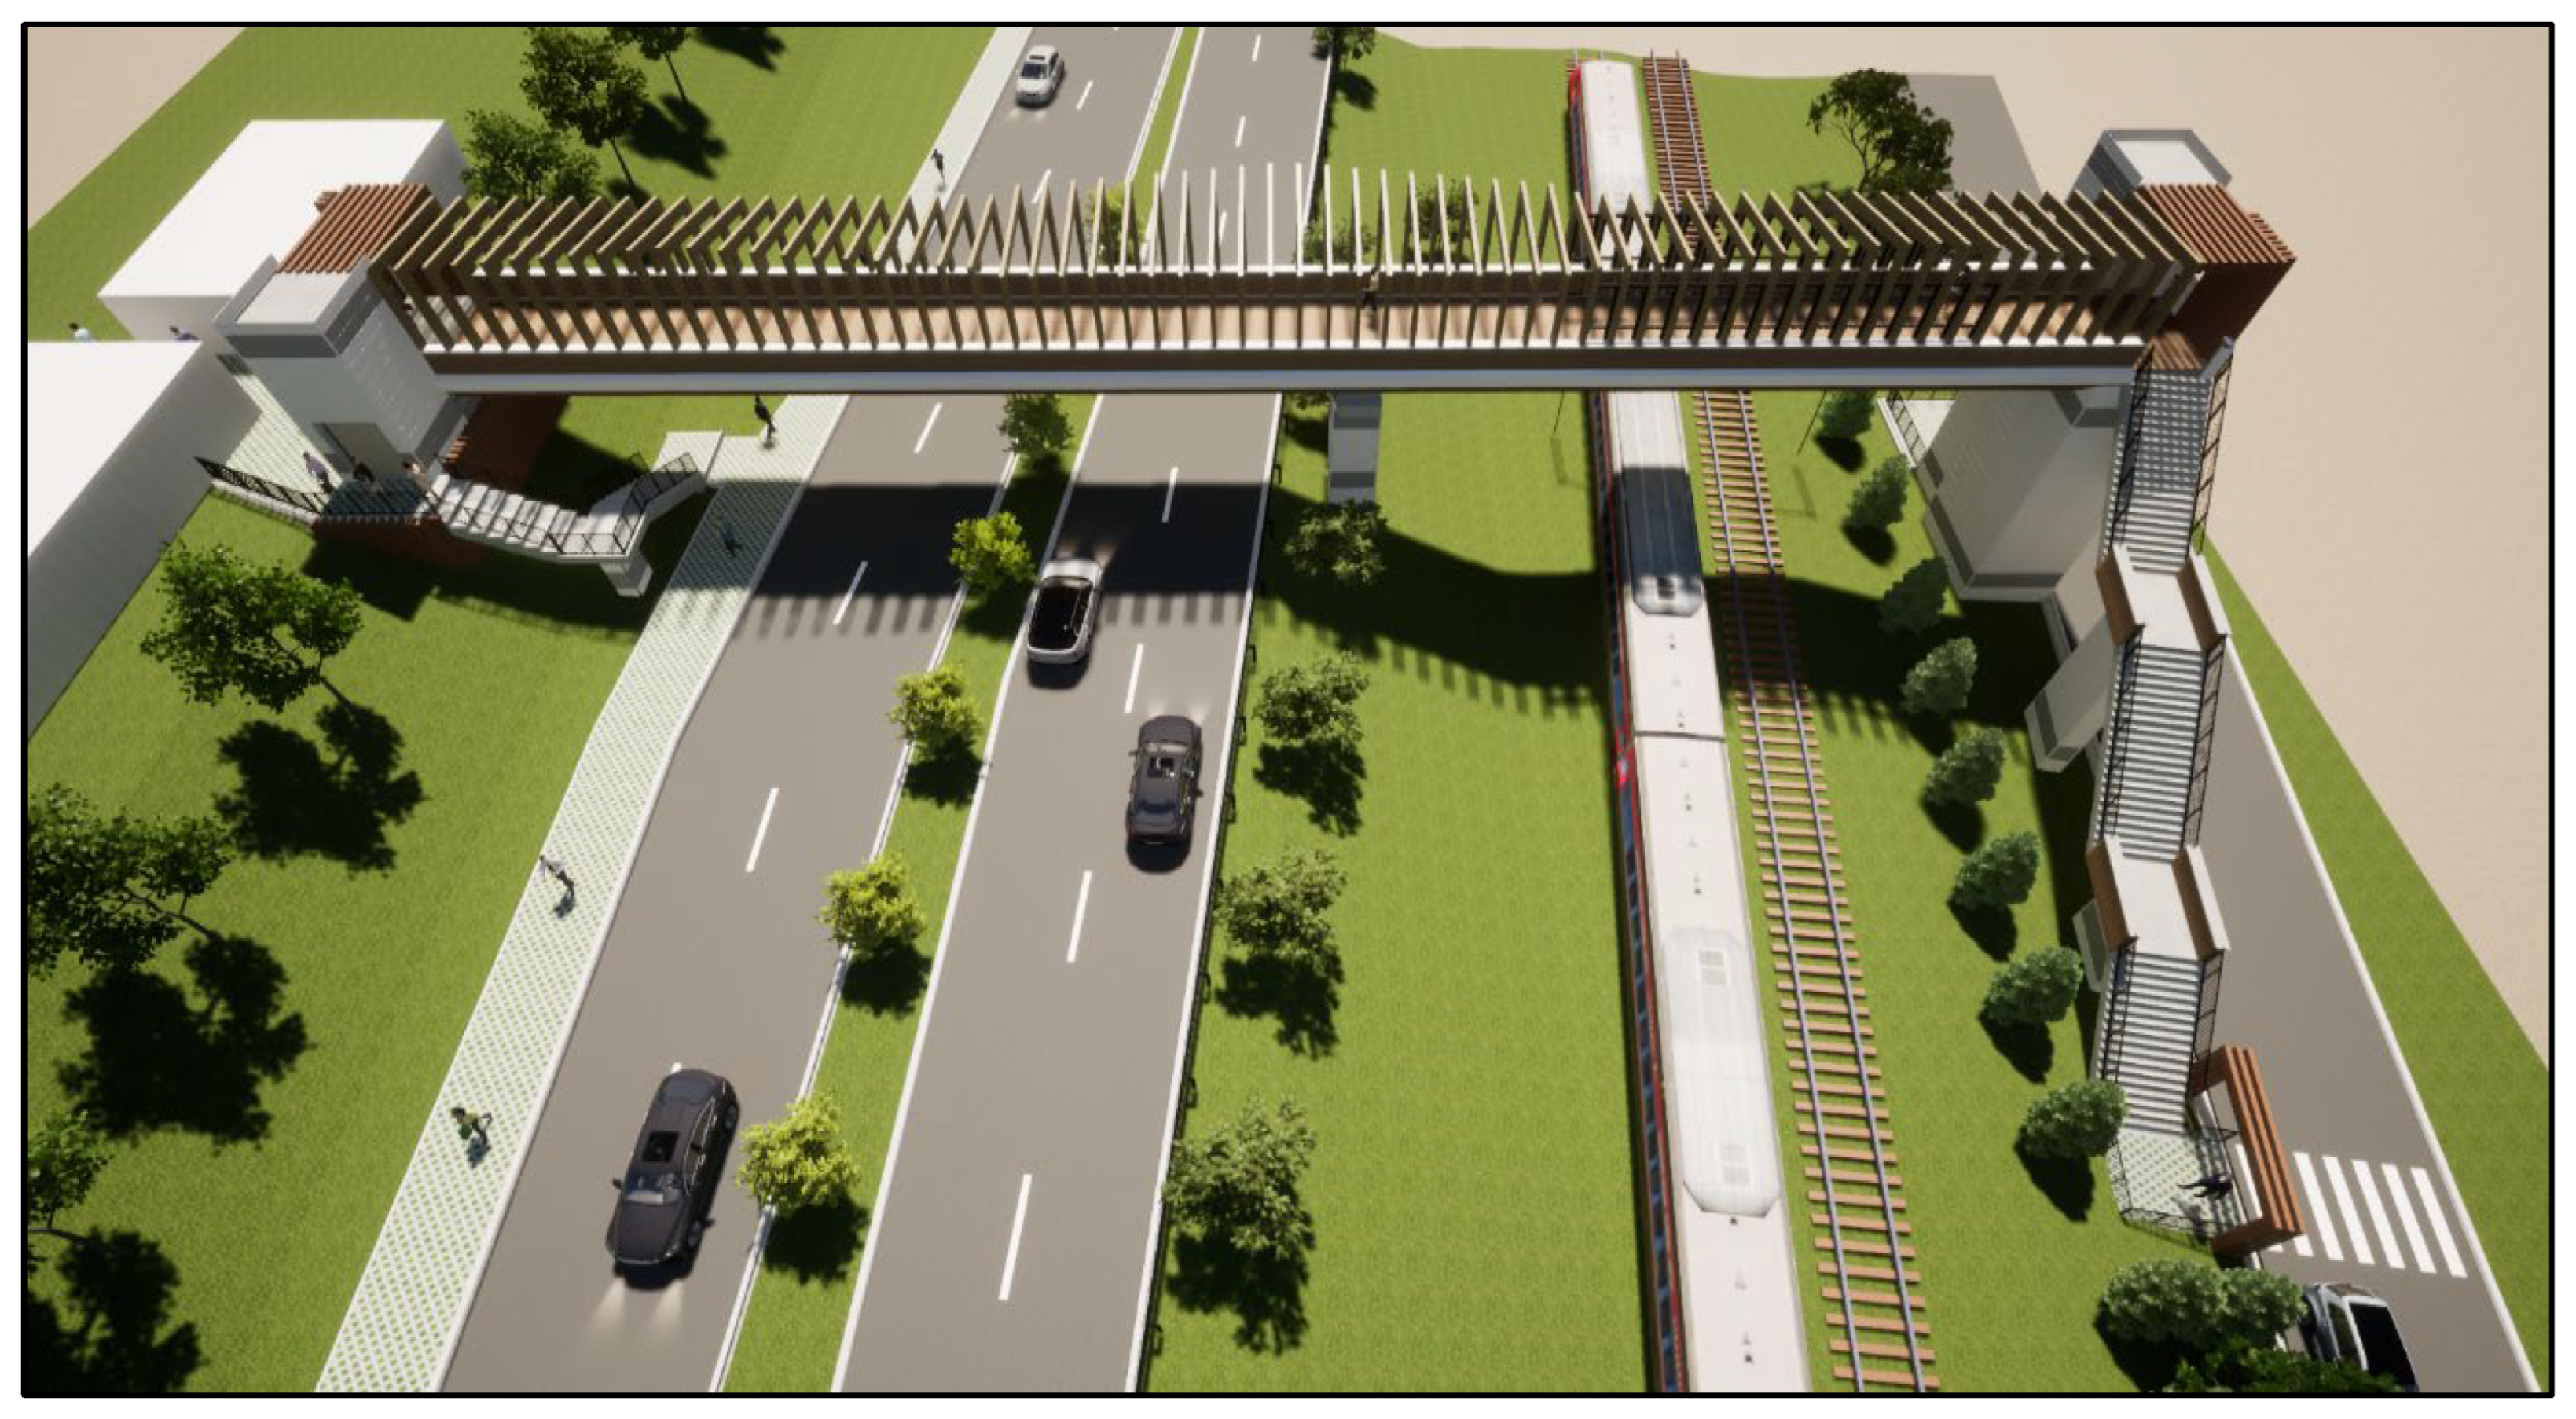
Figure 11.
Footbridge 2 – Parangul area (source: S.C. VENTOR Grup Consulting S.R.L.).
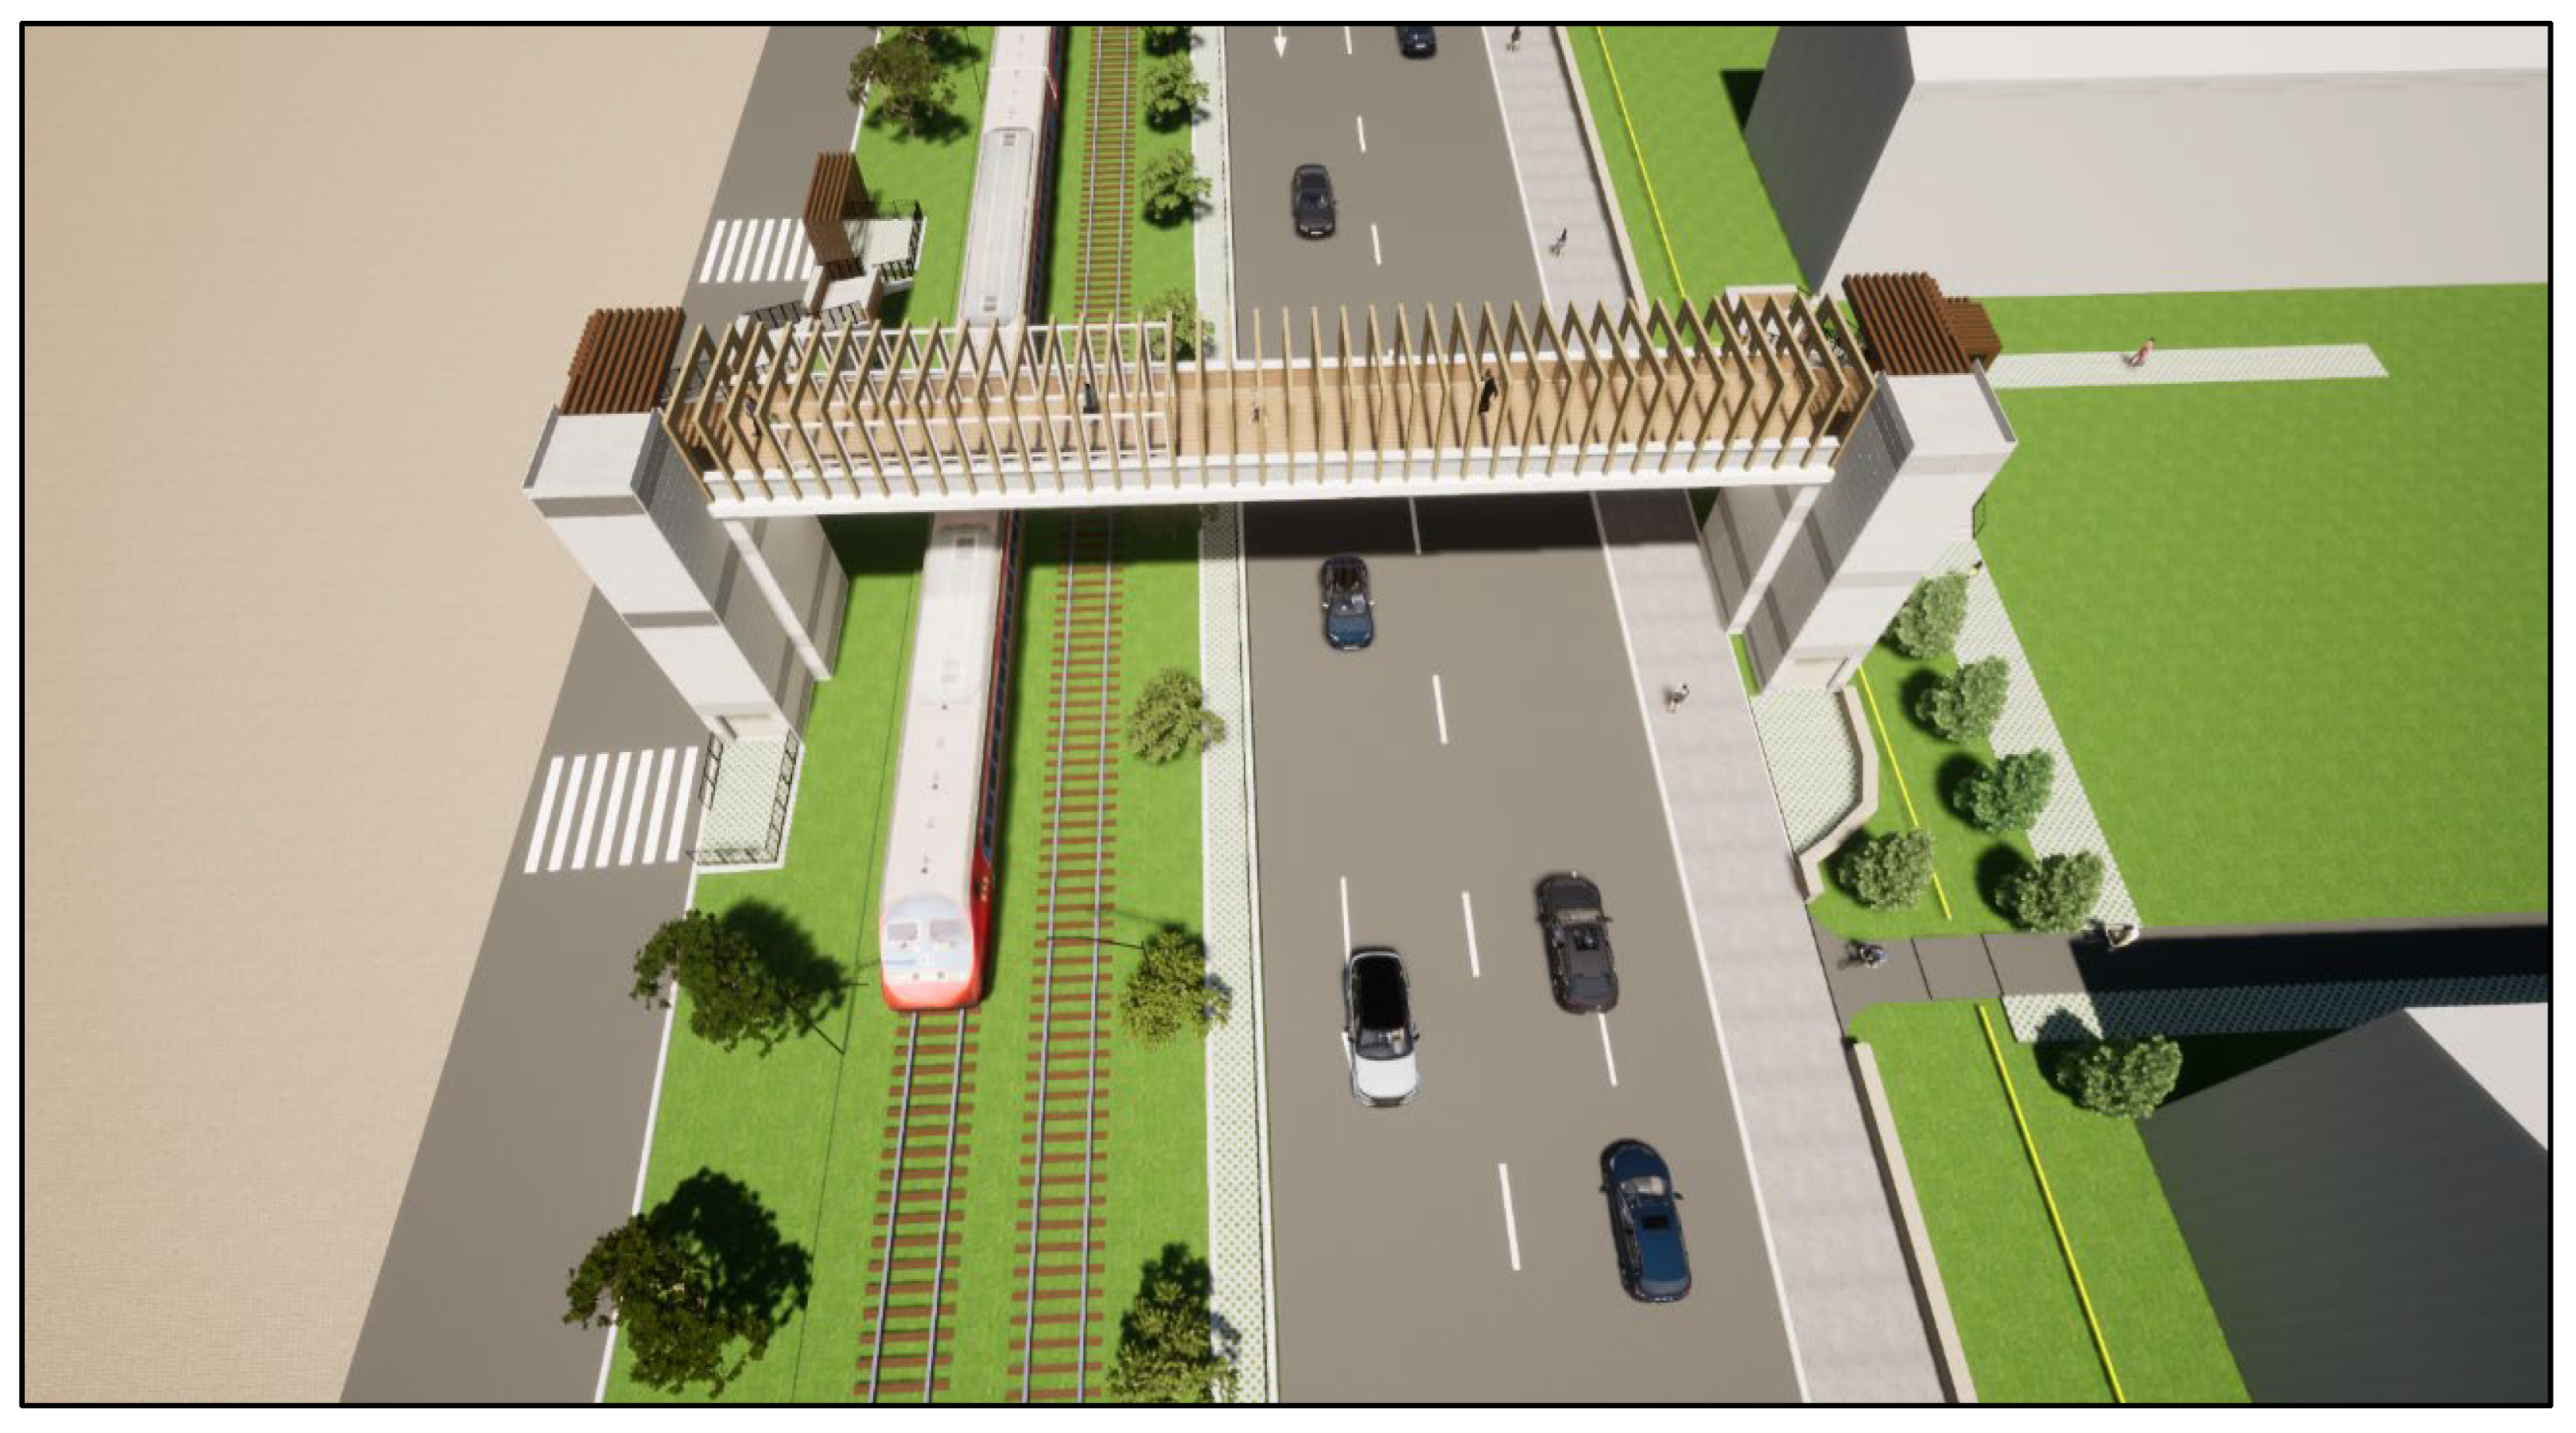
Table 1.
Coding of road arteries, intersections and traffic counters.
| Studied traffic location | Coding of traffic arteries | Graphic representation |
| 1. Daranesti roundabout | A / NR 66 North | 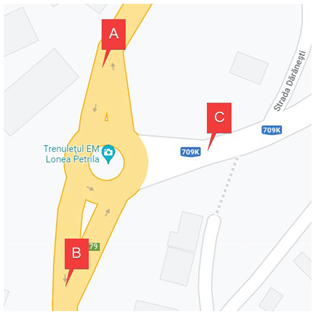 |
| B / NR 66 South | ||
| C / Dealului Street | ||
| 2. Victory Square roundabout | A / NR 66 North | 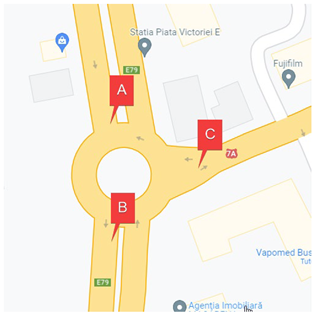 |
| B / NR 66 South | ||
| C / Maleia Street | ||
| 3. Sancta Barbara roundabout | A / NR 66 North | 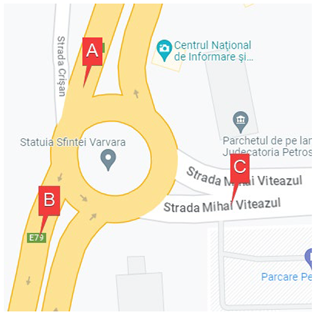 |
| B / NR 66 South | ||
| C / Mihai Viteazul Street | ||
| 4. BCR roundabout | A / Mihai Viteazul West Street | 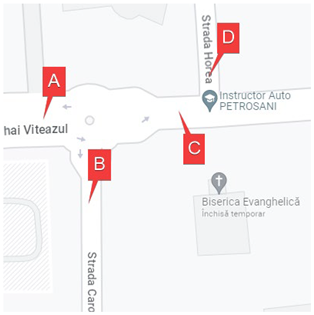 |
| B / Carol Schreter Street | ||
| C / Mihai Viteazul East Street | ||
| D / Horea Street | ||
| 5. Jiul intersection | A / 1 Decembrie North Street | 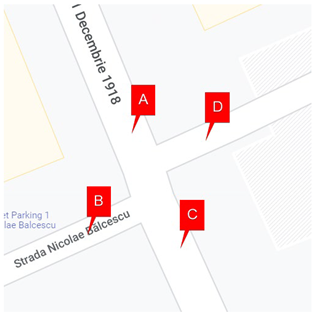 |
| B / Nicolae Balcescu West Street | ||
| C / 1 Decembrie South Street | ||
| D / Nicolae Balcescu East Street | ||
| 6. 1 Decembrie 1918 Street – St. O. Iosif Street intersection (City Hall) | A / 1 Decembrie 1918 North Street | 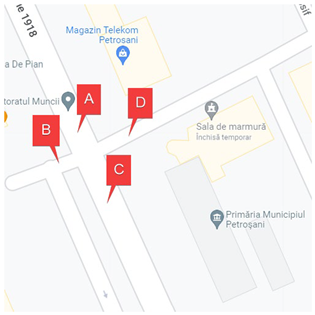 |
| B / Stefan Octavian Iosif West Street | ||
| C / 1 Decembrie 1918 South Street | ||
| D / Stefan Octavian Iosif East Street | ||
| 7. Emergency Hospital roundabout | A / 1 Decembrie 1918 North Street | 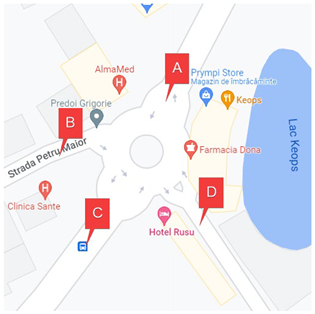 |
| B / Petru Maior Street | ||
| C / 1 Decembrie 1918 South Street | ||
| D / Nicolae Titulescu Street | ||
| 8. Lidl intersection | A / 1 Decembrie 1918 East Street | 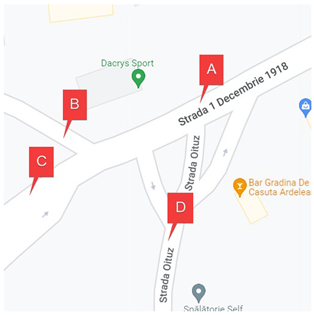 |
| B / Stadionului Street | ||
| C / 1 Decembrie 1918 West Street | ||
| D / Oituz Street | ||
| 9. Airplane roundabout | A / NR 66 North | 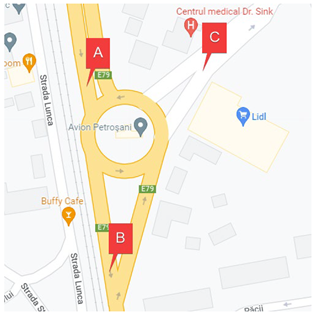 |
| B / NR 66 South | ||
| C / 1 Decembrie 1918 Street | ||
| 10. Timisoara Street – Carol Schreter Street intersection | A / Carol Schreter North Street | 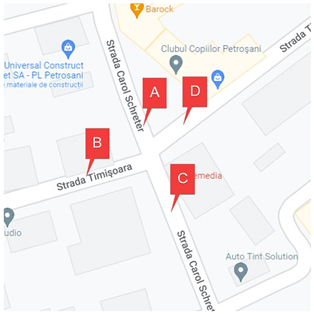 |
| B / Timisoara West Street | ||
| C / Carol Schreter South Street | ||
| D / Timisoara East Street | ||
| 11. Anton Pann Street – Timisoara Street intersection | A / Anton Pan North Street | 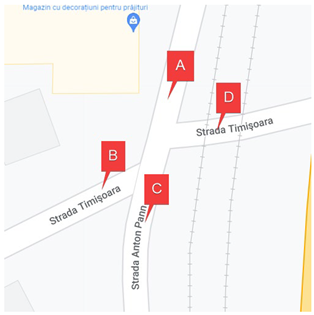 |
| B / Timisoara West Street | ||
| C / Anton Pan South Street | ||
| D / Timisoara East Street | ||
| 12. Central Square – Police intersection | A / Carol Schreter North Street | 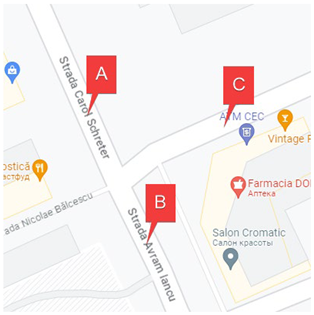 |
| B / Avram Iancu Street | ||
| C / Nicolae Balcescu Street | ||
| 13. Aviatorilor Street – NR 66 (the Rompetrol area) intersection | A / NR 66 North | 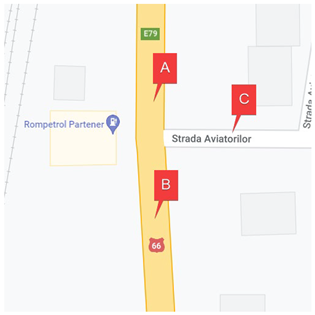 |
| B / Aviatorilor Street | ||
| C / NR 66 South | ||
| 14. Aviatorilor Street – NR 66 (the Lukoil area) intersection | A / NR 66 North |
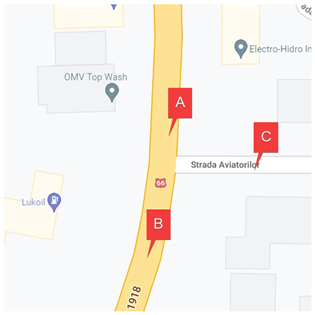 |
| B / NR 66 South | ||
| C / Aviatorilor Street (Micro-Square) | ||
| 15. Kaufland roundabout | A / NR 66 North |
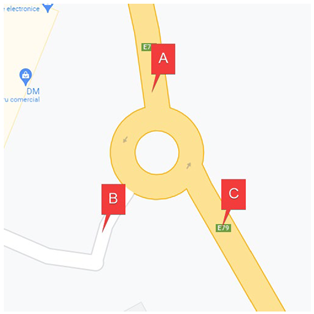 |
| B / Kaufland | ||
| C / NR 66 South |
Disclaimer/Publisher’s Note: The statements, opinions and data contained in all publications are solely those of the individual author(s) and contributor(s) and not of MDPI and/or the editor(s). MDPI and/or the editor(s) disclaim responsibility for any injury to people or property resulting from any ideas, methods, instructions or products referred to in the content. |
© 2026 by the authors. Licensee MDPI, Basel, Switzerland. This article is an open access article distributed under the terms and conditions of the Creative Commons Attribution (CC BY) license (http://creativecommons.org/licenses/by/4.0/).
Copyright: This open access article is published under a Creative Commons CC BY 4.0 license, which permit the free download, distribution, and reuse, provided that the author and preprint are cited in any reuse.


