
Submitted:
24 January 2026
Posted:
28 January 2026
You are already at the latest version
Abstract
This study investigates the role of social media engagement in influencing environmental protection (EP) knowledge and behaviour among university students. Rooted in a hypothesised model, we posited that engagement with EP-related content on social media platforms would positively affect students' environmental knowledge, which in turn would mediate behavioural change. A cross-sectional survey was conducted with 400 undergraduate students, and data were analysed using Exploratory and Confirmatory Factor Analysis (EFA & CFA), as well as Structural Equation Modelling (SEM). Descriptive results revealed that the majority of respondents were aged 20–29 (53.75%), with a higher representation of males (59.25%) and students in their 300 level (34%). Correlation analysis showed strong interrelationships among engagement metrics: likes, comments, shares, and participation, indicating the interconnected nature of social interaction on social media platforms. The cause-based and solution-driven content was positively associated with advocacy outcomes, indicating that meaningful content encourages intent to act.Factor analysis using both Varimax and Oblimin rotations identified four latent constructs: Engagement, Knowledge, Behaviour, and Advocacy, which collectively explained over 60% of the total variance. CFA confirmed strong model fit (CFI = 0.941, TLI = 0.927, RMSEA = 0.085, SRMR = 0.036), and SEM results supported the hypothesised mediation model. Engagement significantly predicted Knowledge (β = 0.973, p < 0.001), and Knowledge in turn significantly predicted Behaviour (β = 0.685, p = 0.001), while the direct path from Engagement to Behaviour was not significant (β = 0.329, p = 0.112). These findings confirm the mediating role of knowledge in transforming engagement into behavioural change.The study underscores the importance of educational and impactful social media content in fostering environmental awareness and advocacy among youth. It offers practical implications for environmental communicators, educators, and policymakers aiming to design content that not only engages but also educates and inspires pro-environmental behaviour.
Keywords:
social media
; environmental pollution
; advocacy
; environmental sustainability
; social media engagement
1. Introduction
In recent years, environmental pollution has gained momentum as one of the critical issues of climate change. Despite global efforts at mitigation, statistics continue to show its effect on humanity and now appear to emanate from both household and all economic sectors. Studies have shown energy sector produces over three-quarters of global greenhouse gas emissions (Harris, 2020). Electricity and heat generation alone account for about 34%, industry for 24%, transport for 15%, and buildings for 6% of 2019 emissions (U.S. Environmental Protection Agency, 2025). In a recent policy framework, United Nations Environment Programme (UNEP) argues that offline solutions alone are insufficient. They proposed enhancing digital literacy and capacity-building around environmental public goods through digital technology (UNEP, 2024). The approach will not only enable sensitisation of industry leaders but also educationally diverse households where cooking solid fuels caused approximately 3.2 million deaths, including over 237,000 children under five in 2020 (World Health Organisation (WHO), 2024).
Of recent, there has been an increased interest in effectively communicating environmental issues through social media (Xie et al., 2024). The field has become known as “care discipline,” which not only aims to prevent harm but also honours the people, places, and nonhuman species on the planet (Pezzullo, 2024). Social media is the most immediate, democratised and furthest-reaching form of mass communication (Ojo, 2021). Social media platforms are avenue to raise awareness, build skills, and foster collaborative action across diverse audiences (Fazil et al., 2024). There are several examples where government agencies and environmentalists used social media to create environmental awareness in the southern hemisphere. For example, in Nigeria, Environmental Rights Action (ERA) used Facebook to advocate environmental justice and campaigns against pollution and environmental degradation; Green Alliance Nigeria used Facebook to promotes environmental education, advocacy, and community engagement; and Lekan Bakare Foundation used X to builds knowledge and capacity for the protection, improvement and growth of #OceanMarineLife in rural and urban coastal areas of Nigeria. #BlueEconomy #Sdg14 (Oyelakin et al., 2025). However, little is known about how these initiatives contribute to sustainability.
As the most current social media savvy generation, this study takes analysis to university students in Nigeria. Nigeria’s young population and digital reach are growing rapidly. By 2023, Nigeria had about 122.5 million internet users and 31.6 million social media users (about 25% of adults) (Kemp, 2023). This means students can readily access environmental information online. However, it remains unclear how engaging with environmental content on social media translates into what students know, feel, and do about pollution. This study examines whether student engagement with environmental pollution (EP) content on social media is associated with greater EP knowledge and pro-environmental attitudes/behaviours, using a survey and structural equation model.
2. Literature Review
2.1. Environmental Pollution in Nigeria
The prevalent environmental issues in Nigeria cut across air pollution, water contamination, extensive oil spillage, widespread deforestation, desertification, erosion, pervasive flooding resulting from inadequate drainage systems, and critical solid waste management deficiencies (Abiolu, 2019; Alumona & Onwuanabile, 2019; Ononogbo et al., 2024; Oyelakin et al., 2025). The human toll of these environmental risk factors has contributed to an estimated 800,000 deaths and 26 million Disability-Adjusted Life Years (DALYs) across Nigeria (Schrage & Adeyanju, 2024). In Lagos alone, air pollution was responsible for over 11,200 premature deaths in 2018, with a disproportionate impact on children under five, who accounted for approximately 60% of these fatalities (Croitoru et al., 2020). On economic, the health cost attributed to air pollution in Lagos was estimated at $2.1 billion in 2018, representing 2.1% of the state’s Gross Domestic Product (GDP) (Croitoru et al., 2020).
Plastic pollution constitutes a particularly pressing crisis, with packaging identified as the single largest source of plastic waste in the country. Research indicates that the majority of this plastic waste is either burned, openly dumped, or discarded into water bodies, further escalating environmental degradation and public health risks (Kehinde et al., 2020). In response, Nigeria implemented extended producer responsibility regulations to hold companies accountable for managing the plastic waste they generate (UNEP, 2023), although its effectiveness remains questionable. Deforestation is another rampant issue. Nigeria has lost 1.14 million hectares of tree coverage between 2001 and 2021, resulting in over 90% deforestation by 2020 (Nri & Owoeye, 2022). The extensive loss of forest cover contributes to climate change impacts, which are increasingly evident across Nigeria, manifesting as excess flooding, declining rainfall, and rising temperatures, leading to natural disasters and heightened health risks. The UNICEF Climate Landscape Analysis for Children in Nigeria (2023) shows the gravity of the situation, ranking Nigeria as the second-worst globally on the Children’s Climate Risk Index, underscoring the extreme vulnerability of children to climate and environmental hazards.
The substantial number of deaths and significant economic costs directly linked to environmental pollution in Nigeria, particularly in urban centres like Lagos, Kano, Ibadan, and Porthacort highlights that these are not merely ecological concerns but represent a profound public health emergency and a considerable impediment to economic development. The situation is more than an environmental challenge, rather a core development issue. For a study investigating student knowledge and behaviour, this implies that the urgency of the problem extends beyond ecological preservation to deeply human and socio-economic well-being. Therefore, understanding how social media can influence action becomes critically important for national development and public health, thus elevating the study’s significance beyond academic inquiry to practical policy relevance. Furthermore, the data indicating that children, including students, constitute a highly vulnerable population directly experiencing the severe impacts of environmental pollution, makes their environmental knowledge, attitudes, and behaviours not just a matter of individual choice but a critical factor in national resilience and future sustainability. Engaging this demographic effectively through platforms they frequently use, such as social media, is thus an imperative for mitigating future crises and fostering a more sustainable future for the country.
2.2. Theoretical Background and Hypothesis Development
Communication and behaviour-change theories suggest media exposure shapes knowledge, attitudes, and behaviour. The Knowledge-Attitude-Behaviour (K-A-B) model posits that providing information (knowledge) leads to awareness/concern, which in turn prompts action (Yang et al., 2020). In other words, knowledge is a precursor to behaviour. Likewise, the Theory of Planned Behaviour (TPB) holds that people form attitudes based on beliefs rooted in information consumed, and these attitudes influence intentions and behaviour (Yang et al., 2020). Media exposure can thus influence attitudes by increasing knowledge. Taking insight from Yang et al. (2020), extending TPB with media attention improves prediction of pro-environmental intentions, as attention to environmental messages potentially significantly predicted intention.
According to the Social Cognitive Theory propounded by Bandura (2009), peers or influencers on social media can foster learning and self-efficacy for environmental actions. Exposure to user-generated content about recycling or pollution on platforms could help students learn new behaviours. From perspective of Agenda-Setting Theory, media emphasis makes certain issues more salient. If Nigerian social media frequently highlights pollution, students may see it as more urgent. In the view of Uses and Gratifications Theory, students actively seek useful content, and environmentally conscious students may follow green blogs or hashtags to gain knowledge and social approval. However, social media and news platforms can also have negative outcomes, such as spreading misinformation and causing harm to forestry (Almeida et al., 2024). Further, while social media are highly accessible and allow for interaction, which stimulates participatory engagement, there is a need for balancing entertainment value and scientific accuracy (Pavelle & Wilkinson, 2020).
Despite Nigeria’s serious pollution problems and the rapid growth of social media among youth, existing research has shown mixed results of how these factors interact. For example, Abiolu (2019) found that 68% of Nigerian youths had general environmental knowledge (mostly from electronic media), but their actual participation in eco-programs was low. Likewise, Ogunjinmi and Oniya (2016) found that university students’ attitudes strongly influenced their behaviours, yet it is unclear how much social media contributes to shaping those attitudes or knowledge in the first place. As Odunlami and Aro (2024) note, many studies emphasise the potential of social media but rarely evaluate its real-world impact on environmental behaviour. Outside Nigeria, research has found positive relationship between social media news use and trust in science (Huber et al., 2019), especially in young adults (Leighton & Serieys, 2025). Further, social media influencers can foster pro-environmental intention (Awang et al., 2021) and a more scientifically literate audience (Simis-Wilkinson et al., 2018).
In Nigeria, important questions remain: Are students learning about pollution from social platforms, and if so, does that translate into more positive attitudes or better waste-management practices? Based on the articles reviewed, we identified the gap, thus, that available literature majorly focused on the theoretical and conceptual importance of social media in environmental awareness and behaviour. However, no study examines pattern and influence of content engagement, and none has looked into how social media engagement mediates impact of environmental knowledge on pro-behaviour. On the other hand, no study, to our best knowledge, has adopted advanced analysis such as Structural Equation Modelling (SEM). Based on these gaps and aforementioned models, we developed hypotheses about the relationships among the constructs (see Figure 1). Specifically, the objectives of the study are (1) Engagement – representing how students engage with EP content on social media through actions such as liking, commenting, sharing, following, and participating; (2) Knowledge – reflecting how social media exposure influences students’ understanding of EP, including types, causes, effects, and potential solutions; and (3) Behaviour – capturing how social media exposure translates into behaviour changes, including adopting environmentally friendly habits, supporting policies, and engaging in advocacy.
2.3. Hypothesis
We hypothesised that student engagement with EP content on social media would positively influence their knowledge of EP, which in turn would drive behaviour changes. We tested both direct and indirect effects. Specifically, we assessed whether engagement had a direct effect on behaviour or whether the effect was mediated through knowledge. Structural Equation Modelling (SEM), Structural relationships
3. Methodology
3.1. Research Design
To quantitatively investigate the influence of social media on knowledge, attitude, and behaviour toward environmental pollution (EP), we adopted a quantitative research design. According to Ghanad (2023), a quantitative research design is used to understand the explanations and motives for actions with a focus on “how long,” “how many,” and “the degree to which. This design lets us establish a systematic and objective examination of the relationships among the selected key variables.
3.2. Data Collection
We conducted survey among students of the University of Abuja (UniAbuja) and Bayero University, Kano (BUK) in north-central and western Nigeria, respectively. Information from the schools’ websites revealed total of 45,810 and 33,552 enrolled students at BUK and UniAbuja, respectively, as of August 2024. Therefore, the study population is 79,362 students from both institutions. Using the Yamane Taro formula, a sample size of 398 was determined. We, however, rounded the sample to 400 to make up for potential non- or invalid responses (Doss et al., 2021). Therefore, we distributed 231 (57.8%) copies of the questionnaire in BUK and 169 (42.3%) copies in UniAbuja. We used a Google Form to distribute Likert scale questionnaire to study participants to gather primary data. The 27-item survey with closed-ended answers was distributed and collected between October and November 2024.
3.4. Data Analysis
We conducted a factor analysis, confirmatory factor analysis and structural equation modelling (SEM) to investigate the latent factors influencing student engagement, knowledge, and behaviour toward environmental pollution (EP). At first, a Pearson correlation and chi-square were done to examine the correlations and associations between key variables related to student engagement with EP content on social media, their knowledge of EP, and resulting behaviour changes. This helped establish initial patterns and relationships, forming the foundation for other analyses. To identify the latent factors, a factor analysis (FA) was conducted using both oblimin and varimax rotation methods. The Oblimin rotation assumes that the latent factors are correlated, whereas the varimax rotation assumes that the factors are not. Through this, we expected to uncover three primary latent factors: (1) Engagement; (2) Knowledge; and (3) Behaviour. To verify the expected latent factors, we performed a confirmatory factor analysis (CFA). To achieve this, we defined a measurement model where engagement, knowledge, and behaviour were measured by several indicators (Table 1). The CFA helped confirm the consistency and reliability of the factor structure, ensuring that the defined latent constructs accurately reflected the underlying patterns. In addition, the SEM model (based on the confirmed factor structure) was used to examine the causal relationships among engagement, knowledge, and behaviour. This helps test the research hypothesis by the direct and indirect effects within the model. The strength and significance of the effects were evaluated using path coefficients. The model fit was evaluated using Comparative Fit Index (CFI), Tucker-Lewis Index (TLI), Root Mean Square Error of Approximation (RMSEA), and Standardised Root Mean Square Residual (SRMR). All the analyses were done in R version 2024.12.0+467.
4. Results
4.1. Social Demography
Table 1 below reveals the information about the demographic distribution of respondents. A majority of participants were between the ages of 20 and 29(215, 53.75%), followed by those aged 15 to 20(124, 31%) and 30 to 49(56, 14%), while only 5(1.25%) respondents were aged 50 and above. In terms of gender, male respondents were the majority, representing 237 individuals (59.25%), compared to 163 females (40.75%). Regarding academic level, the largest group of participants were in their 300 Level, totalling 136 students (34%), followed by 400 Level students at 101 (25.25%), and 200 Level with 88 participants (22%). 500 Level students made up 46 respondents (11.5%), while 100 Level had the smallest representation with 29 students (7.25%). The religious affiliation data shows a fairly balanced distribution, with 238 participants (59.5%) identifying as Christians, and 162 (40.5%) as Muslims (other descriptive analysis results are contained in supplementary 1).

Table 1.
Demographic Characteristics of Respondents.
| Variable | Factors | Count(N) | Percentage (%) |
| Age | 20-29 | 215 | 53.75 |
| Age | 15-20 | 124 | 31 |
| Age | 30-49 | 56 | 14 |
| Age | 50 and above | 5 | 1.25 |
| Gender | Male | 237 | 59.25 |
| Gender | Female | 163 | 40.75 |
| Level | 300 Level | 136 | 34 |
| Level | 400 Level | 101 | 25.25 |
| Level | 200 Level | 88 | 22 |
| Level | 500 Level | 46 | 11.5 |
| Level | 100 Level | 29 | 7.25 |
| Religion | Christianity | 238 | 59.5 |
| Religion | Islam | 162 | 40.5 |
4.2. Interconnected Dynamics of Engagement, Content, and Advocacy
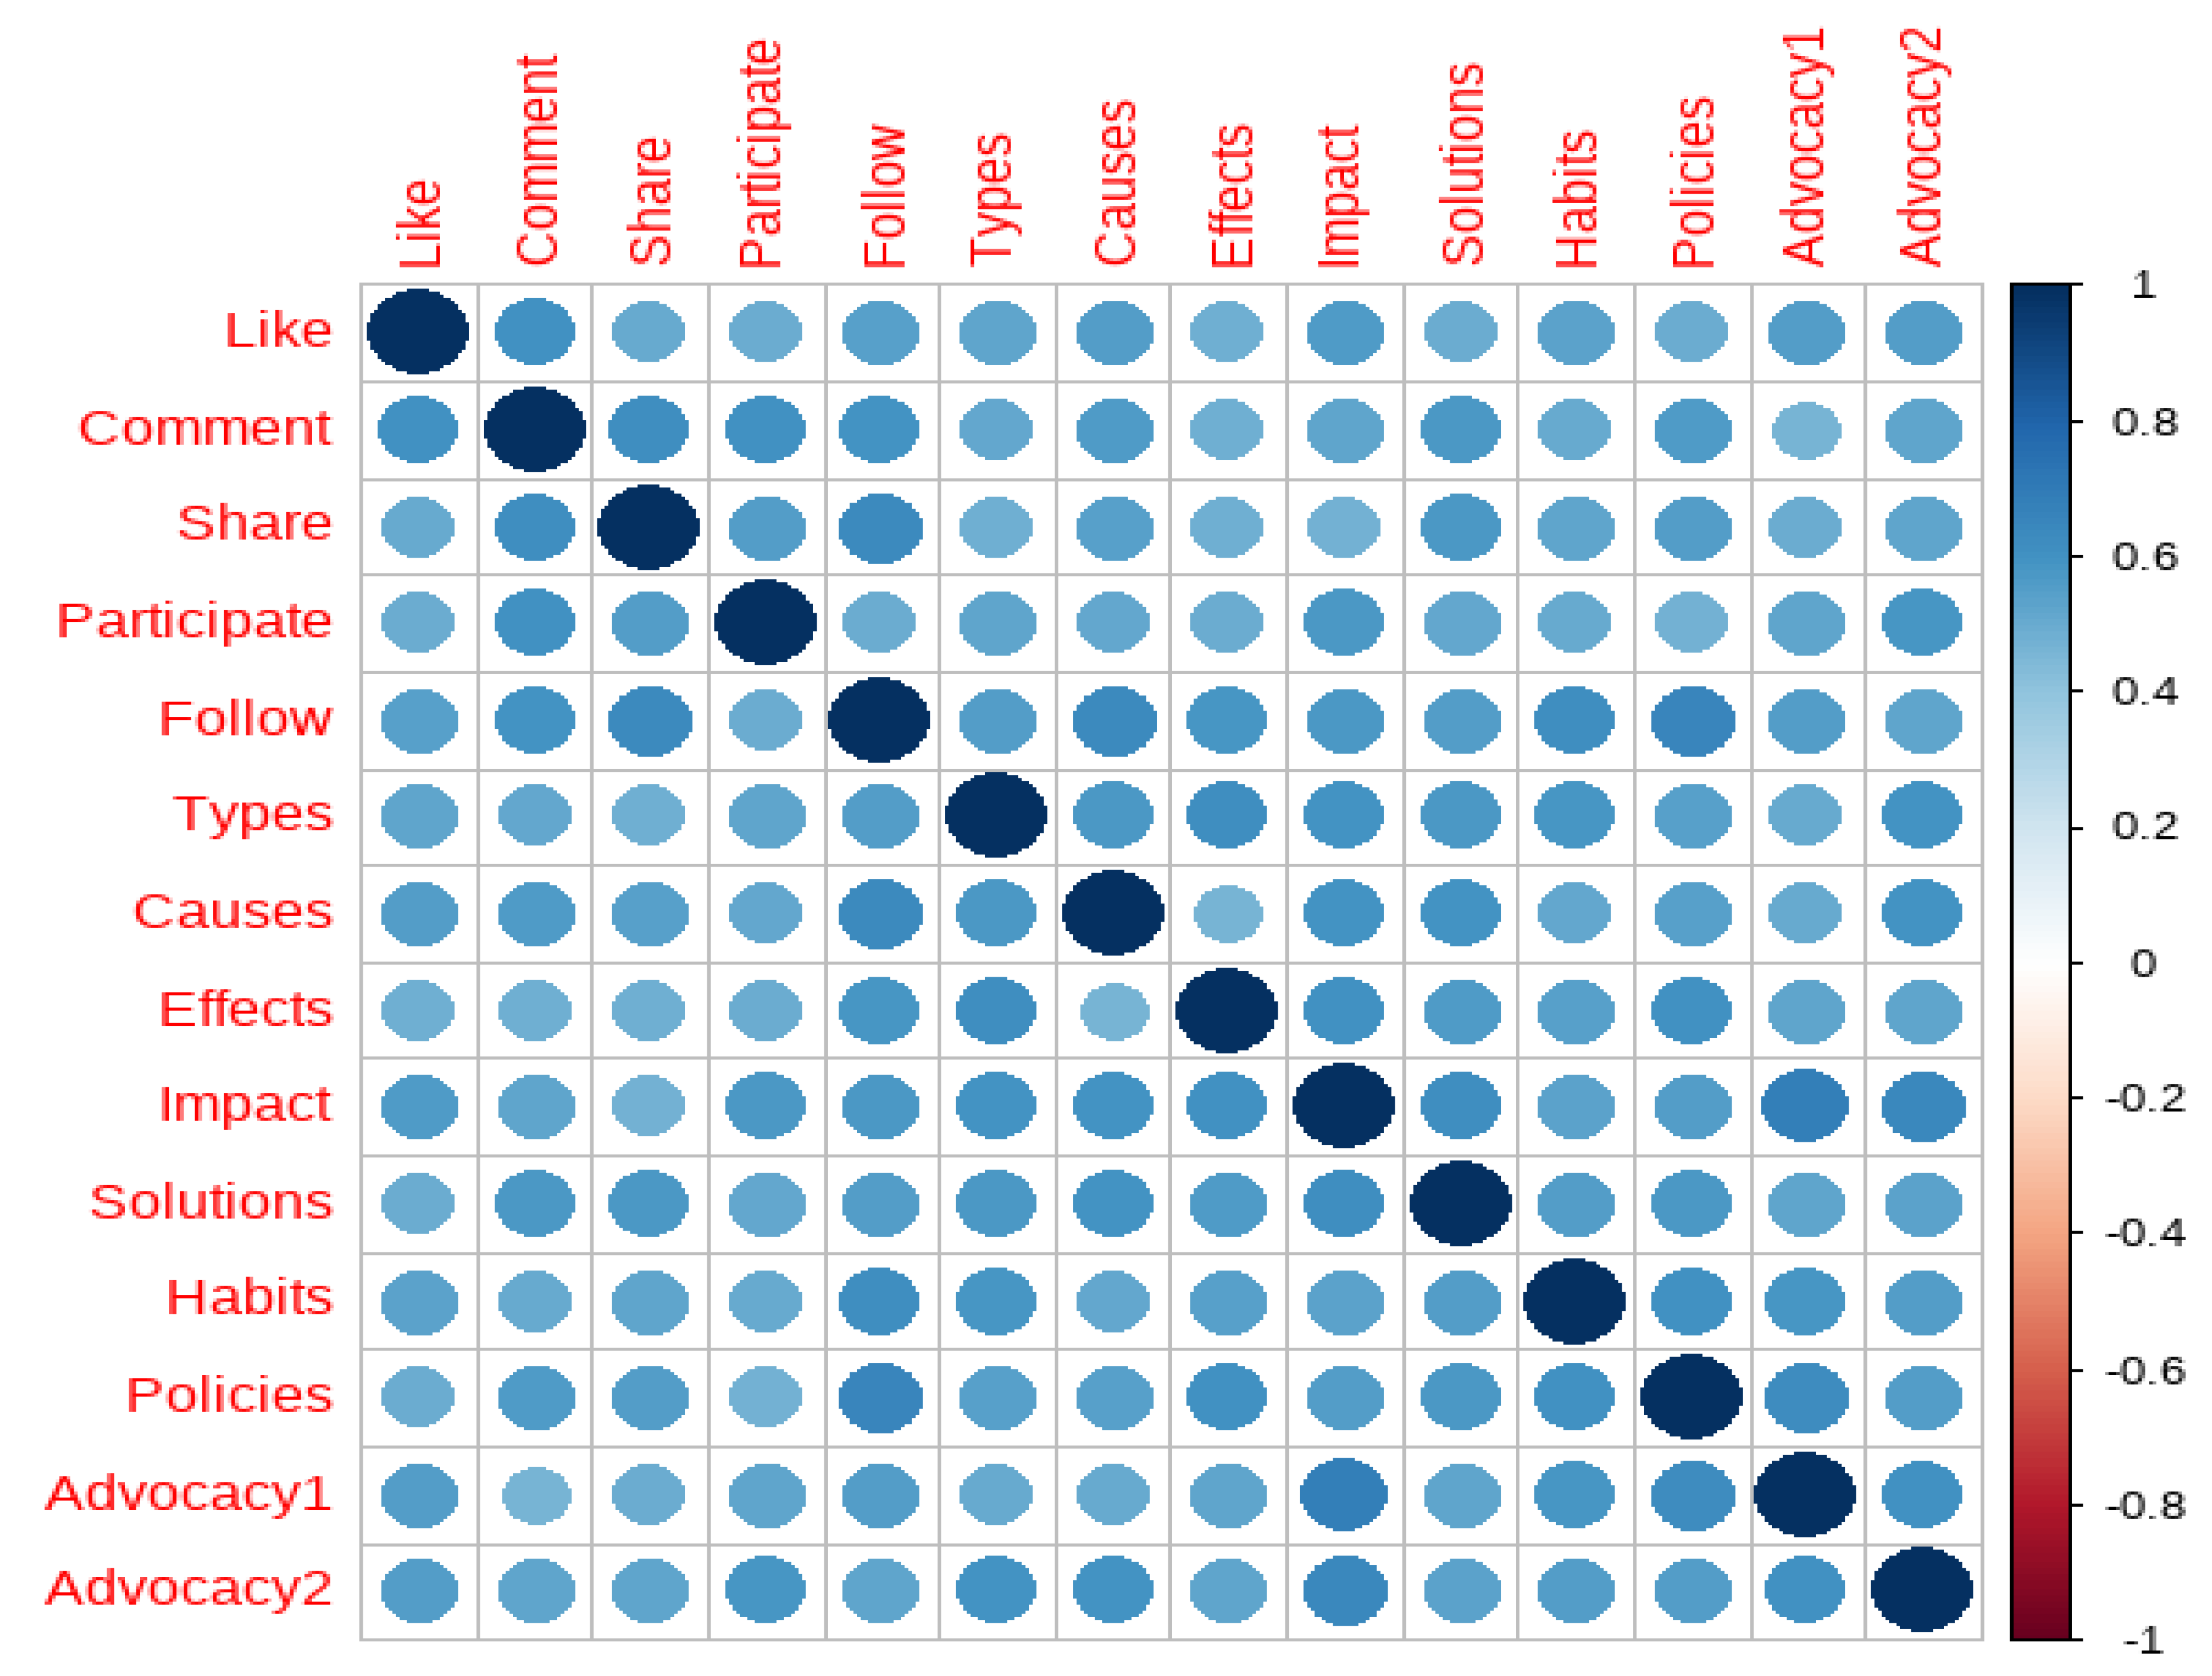
The correlation matrix reveals significant relationships between engagement metrics, content types, and advocacy measures, providing insights into the underlying patterns of audience interaction and content effectiveness. Engagement Metrics: Likes are positively correlated with comments (r = 0.60), shares (r = 0.50), and participation (r = 0.50), indicating that content that receives more likes tends to generate greater engagement through comments and shares. Similarly, comments are strongly correlated with shares (r = 0.62) and participation (r = 0.61), suggesting that content that elicits discussion also encourages further sharing and participation. Shares are also moderately correlated with participation (r = 0.56) and following (r = 0.64), implying that content that is widely shared tends to increase audience participation and following.
Content Impact and Engagement: Following is positively correlated with content types (r = 0.55), causes (r = 0.64), and effects (r = 0.58), suggesting that specific content types and cause-related content drive audience growth. Impactful content correlates strongly with likes (r = 0.56), participation (r = 0.58), and comments (r = 0.52), indicating that engaging and meaningful content is more likely to drive audience interaction. Solutions are also positively correlated with shares (r = 0.58) and comments (r = 0.57), suggesting that content providing actionable solutions tends to be more engaging. Advocacy and Influence: Advocacy outcomes are strongly linked to content impact and policies. Impact is strongly correlated with Advocacy1 (r = 0.69) and Advocacy2 (r = 0.65), showing that impactful content is more likely to motivate advocacy efforts.
Policies are also significantly correlated with Advocacy1 (r = 0.63) and Advocacy2 (r = 0.55), highlighting the role of policy-focused content in driving advocacy. Habits, representing consistent engagement, also show a strong correlation with Advocacy1 (r = 0.59), indicating that regular audience interaction fosters greater advocacy. Content Types and Causes/Effects: Content types are positively correlated with causes (r = 0.58) and effects (r = 0.61), indicating that content addressing specific causes tends to generate more discussion around outcomes and potential solutions. The relationship between causes and solutions (r = 0.59) underscores that content discussing problems is often paired with proposed resolutions, which enhances audience engagement and advocacy. The correlation between effects and solutions (r = 0.56) suggests that content highlighting outcomes tends to motivate audiences to consider solutions, driving deeper engagement.
Figure 2.
Correlation Matrix of Engagement Metrics, Content Characteristics, and Advocacy Outcomes.
4.3. Factor Analysis
4.3.1. Preliminary Analysis Test for the Factor Analysis
The Kaiser-Meyer-Olkin (KMO) measure of sampling adequacy indicates the suitability of our data for factor analysis, showing how well the variables are correlated. The total (Overall) KMO (0.95) indicates an excellent level of sampling adequacy, suggesting that the dataset is well-suited for factor analysis. All individual variables to be tested also demonstrate high KMO values, ranging from 0.93 to 0.97, further reinforcing the appropriateness of the data for factor extraction.
Table 2.
Kaiser-Meyer-Olkin factor adequacy.
| Variables | MSA |
| Habits | 0.97 |
| Like | 0.97 |
| Comment | 0.94 |
| Share | 0.95 |
| Participate | 0.96 |
| Follow | 0.94 |
| Types | 0.96 |
| Causes | 0.95 |
| Effects | 0.95 |
| Impacts | 0.94 |
| Solutions | 0.96 |
| Policies | 0.95 |
| Advocacy 1 | 0.93 |
| Advocacy 2 | 0.97 |
| Overall | 0.95 |
The Chi-square test result (χ2 = 3624.235, df = 91, p-value = 0) indicates a highly significant statistical association between the variables under investigation (Table 3). With a large Chi-square value and degrees of freedom equal to 91, and a p-value effectively equal to zero (p < 0.001), we can confidently reject the null hypothesis, which posits that there is no relationship between the variables. This suggests that the observed frequencies differ markedly from what would be expected under the assumption of independence or uniformity. This means that there is a strong and non-random relationship among the variables being analysed. This relates to user engagement, content, or behavioural, the results confirm that the variables do not operate independently and that there are meaningful interactions or associations present within the dataset.
4.3.2. Factor Analysis with Varimax Rotation
The Varimax rotation extracted four independent factors, each representing a unique behaviour of the respondents (Figure 3). The first factor (MR1: Engagement) is characterised by strong loadings on commenting (0.7), sharing (0.6), participating (0.5), and discussing causes (0.5) and solutions (0.5), suggesting that this factor captures the level of active engagement in discussions of EP. The second factor (MR4: knowledge) includes variables related to understanding different types (0.6), effects (0.6), impacts (0.5), and solution (0.4), indicating that it represents knowledge and awareness regarding EP. The third factor (MR3: Behavioural Influence) is represented by following (0.6), policies (0.6), and habitual behaviours (0.5), suggesting a behavioural shift influenced by awareness and engagement. The final factor (MR2: Advocacy) is predominantly driven by Advocacy1, with the highest factor loading (0.88), making it the most distinct factor. Together, these four factors explain 64% (MR1: 31%, MR4: 27%, MR3: 24%, and MR2: 18%) of the total variance. The factors have a strong reliability (MR1[R2 = 0.66], MR4[R2 = 0.62], MR3[R2 = 0.59], MR2 [R2 = 0.97].
Table 4 below indicates the model fit indices. The Tucker-Lewis Index (TLI: 0.96) suggests a high degree of factor reliability, indicating that the extracted factors explain the observed variance effectively, supported by the Bayesian Information Criterion (BIC: -141.93). The Root Mean Square Error of Approximation (RMSEA: 0.062, CT: 0.047 to 0.077), suggesting that the model has a reasonable approximation of the true population structure. The root mean square of the residuals (RMSR: 0.02, ARMSR: 0.3) indicates that the residuals are minimal, which is a strong indicator of model adequacy. The Likelihood (X2: 103.72, p < 2.4e-07) and empirical chi-square (X2: 28.8, p = 0.92) suggest that the model is significantly different from a null model with no factors, indicating a well-defined factor structure.
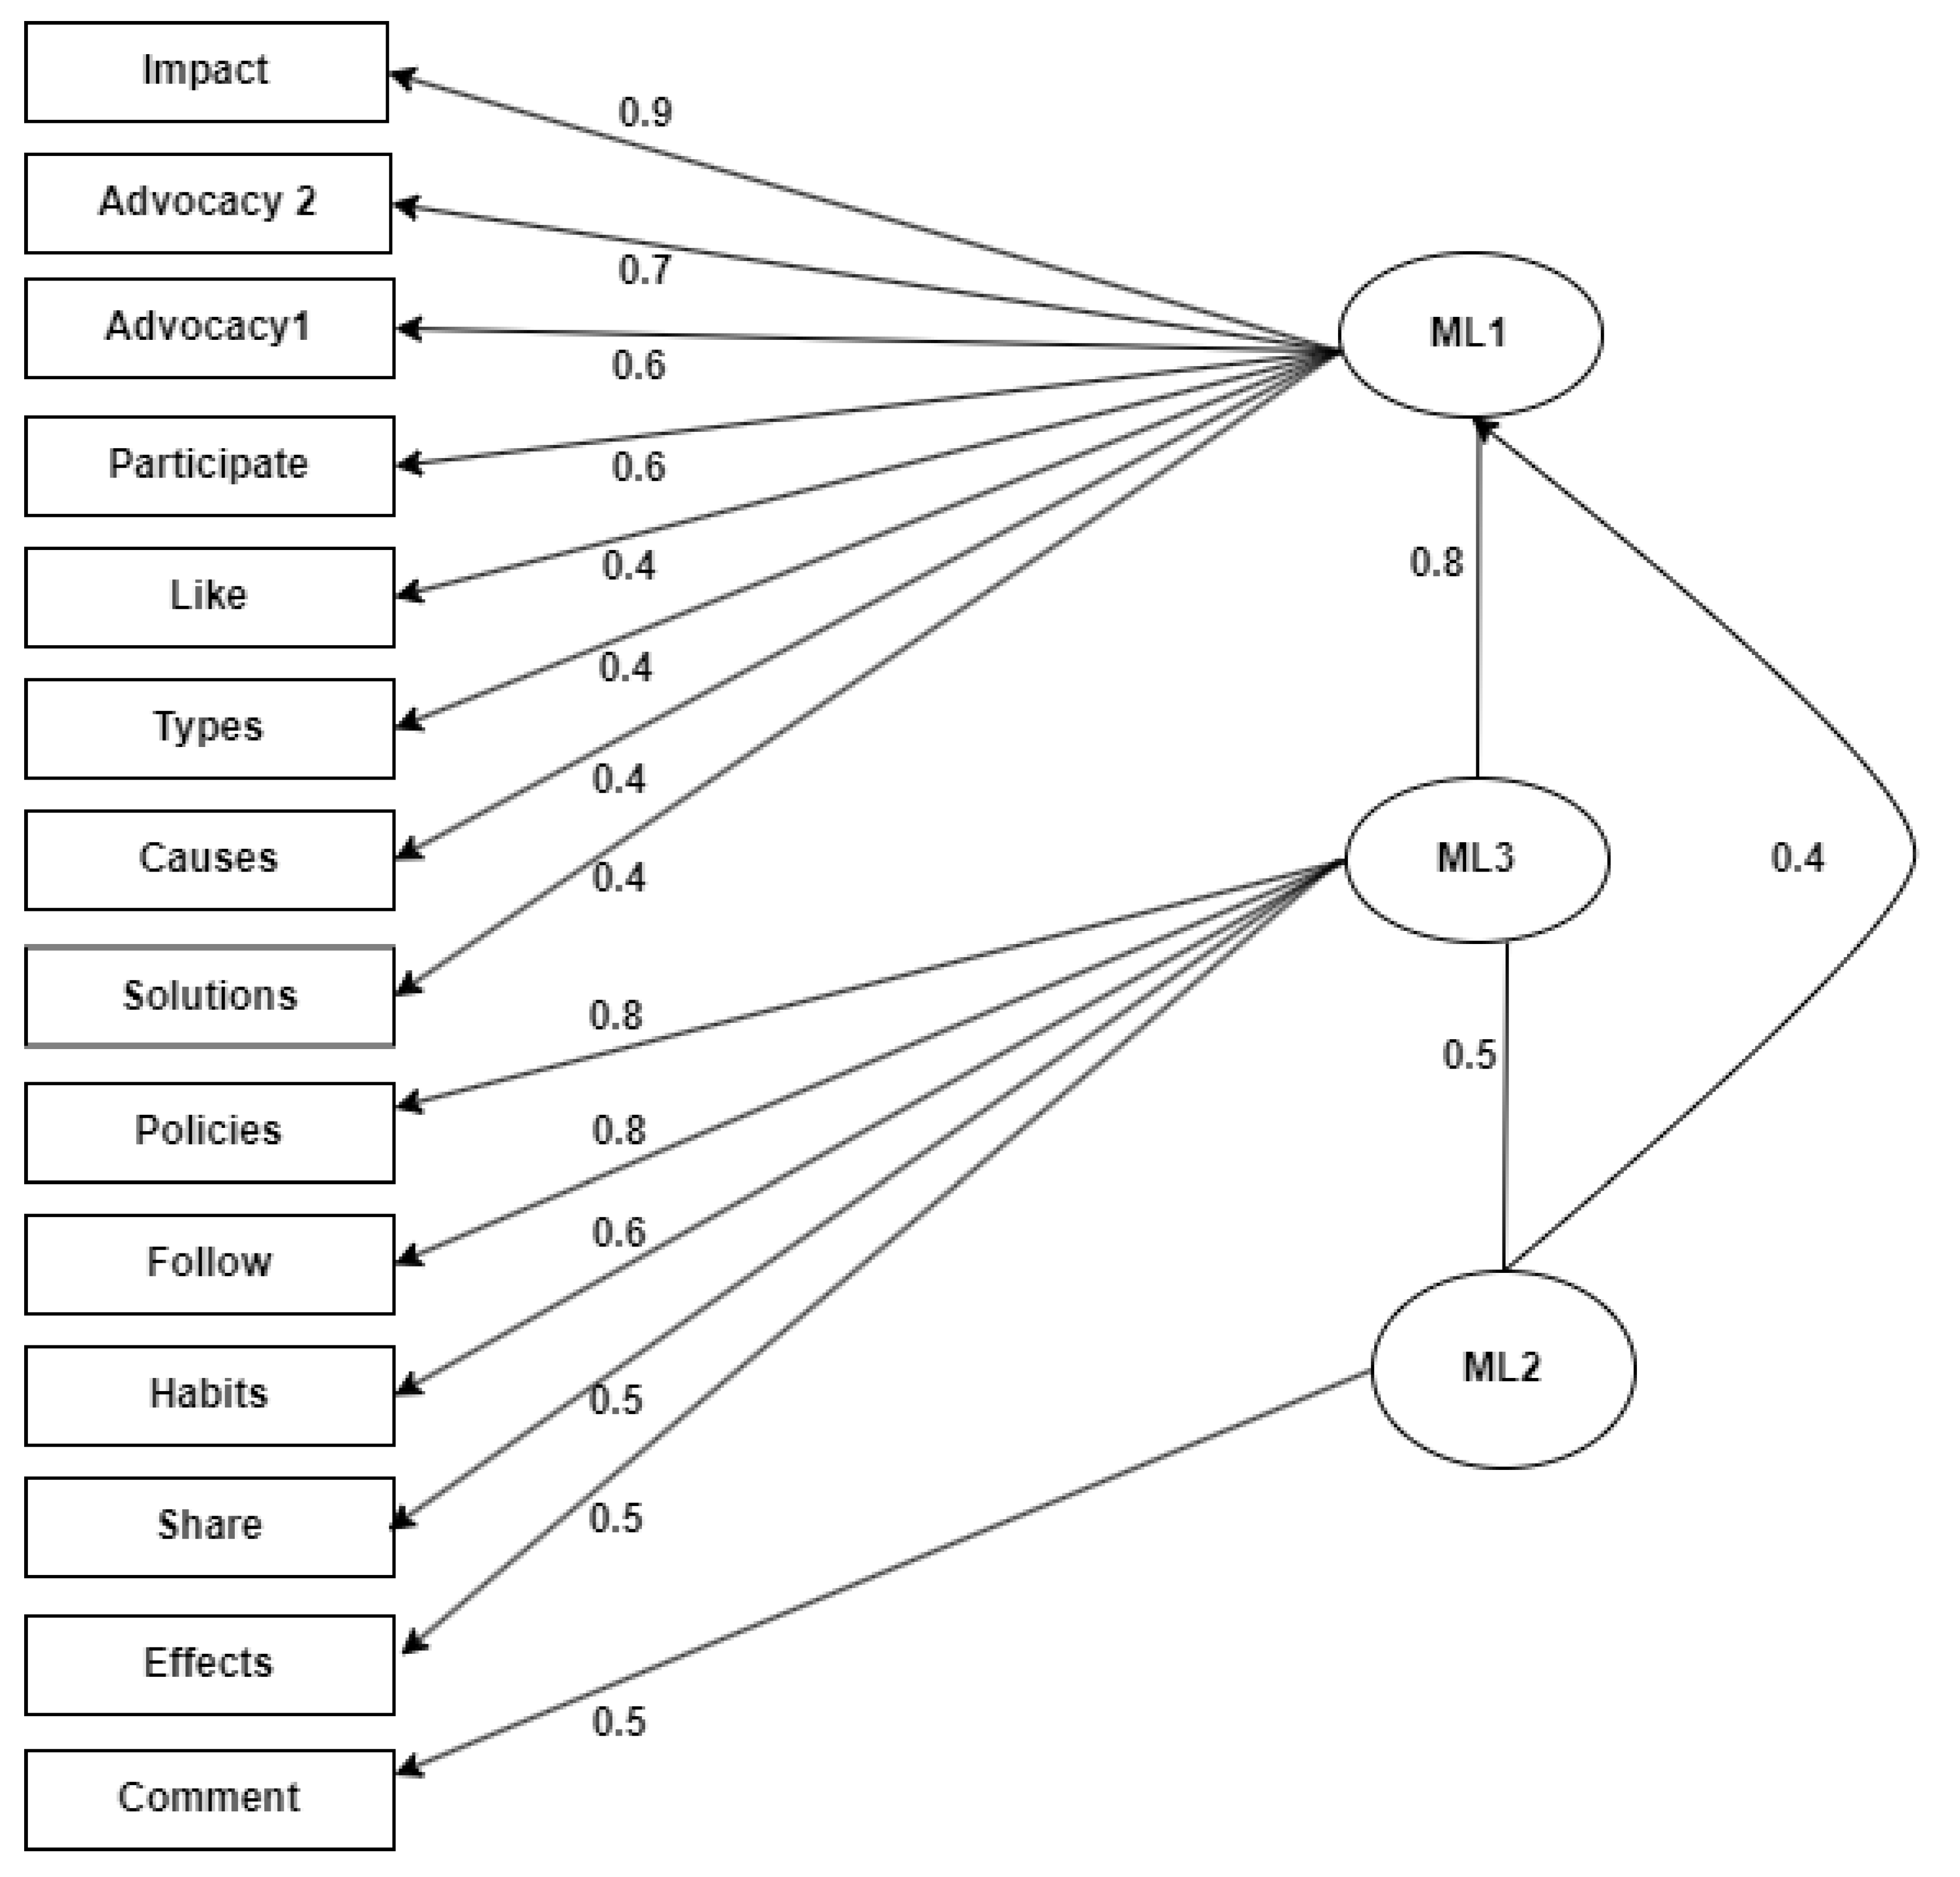
4.3.3. Factor Analysis with Oblimin Rotation
The factor analysis results using oblimin rotation, which assumes that the variables are correlated, reveal a well-structured factor solution with three main factors (MR1, MR3, and MR2). The first factor (MR1) has high loadings for Impacts (0.92), Advocacy2 (0.68), and Advocacy1 (0.57). The second factor (MR3) is strongly associated with Follow (0.78), Policies (0.83), and Habits (0.61). The third factor (MR2) has its highest loading on Comment (0.51) and moderate loadings on Participate (0.33) and Causes (0.23). The variance explained by the factors is also notable (MR1: 27%, MR3: 26%, and MR2: 8%, CEV: 61%) with the proportion explained values (MR1: 0.44, MR3: 0.43, and MR2: 0.13) suggesting that the three factors together explain a significant portion of the variance in social engagement behaviours and knowledge on EP. The correlation of regression scores with factors (MR1[r = 0.95, r2 = 0.91], MR3[r = 0.95, r2 = 0.90], MR2[r = 0.85, r2 = 0.67]) indicate a strong fit between the observed data and the latent factors, suggesting that MR1 and MR3 are closely related.
Figure 4.
Factor loadings from factor analysis with oblimin rotation.
The Tucker-Lewis Index (TLI: 0.949), Bayesian Information Criterion (BIC = -156.57), Root Mean Square Error of Approximation (RMSEA: 0.07, CI: 0.058 – 0.083), and Root Mean Square of the Residuals (RMSR = 0.03, ARMSR = 0.03) suggested that the oblimin factor model successfully captures most of the variance in the dataset, indicating a well-fitting model when compared to alternative factor solutions (Table 5). The Chi-Square test results provide further validation of the model’s performance. The Likelihood (X2: 154.99, p < 3.6e-12) suggests that the model does not perfectly reproduce the observed correlations. However, the empirical (X2: 47.45, p = 0.65) suggests that, in practical terms, the model provides an adequate representation of the data given sample size considerations.
4.4. Confirmatory Factor Analysis (CFA) Results
The Confirmatory Factor Analysis (CFA) results provide insights into the model fit and how well the proposed factor structure aligns with the observed data, validating the result of the FA (Table 6). The User Model test statistic (X2: 287.178, p < 0.001) and Baseline Model (X2: 3684.102, p < 0.001) indicate that the model fits significantly better than a model assuming no relationships among variables with a Comparative Fit Index (CFI = 0.941) and Tucker-Lewis Index (TLI = 0.927). The log-likelihood values for the user model (-8312.390) and unrestricted model (-8168.801) provide a basis for comparing different models. The Akaike Information Criterion (AIC = 16686.779), Bayesian Information Criterion (BIC = 16810.515), and Sample-size Adjusted BIC (SABIC = 16712.149) suggested that the user model is relatively efficient in explaining the data while balancing complexity. The RMSEA value (0.085, CI: 0.075 – 0.095), H0: RMSEA ≤ 0.05 (p = 0.000) further confirms that the model performance, H0: RMSEA ≥ 0.08 (p = 0.788) indicates that it is likely above the good fit threshold with a low SRMR value (0.036), suggesting an excellent model fit.
Table 7 below presents the latent variable analysis results providing strong evidence for the relationships among Engagement, Knowledge, and Behaviour constructs. For Engagement, the observed variables and their corresponding factor loadings are: Comment (1.165, Z = 15.075, p < 0.001), Share (1.070, Z = 14.663, p < 0.001), Participate (1.005, Z = 14.039, p < 0.001), and Follow (1.068, Z = 15.456, p < 0.001). These values suggest that all five behaviours effectively measure user engagement, with Comment having the highest factor. For Knowledge, the observed variables include causes (1.011, Z = 15.493, p < 0.001), Effects (0.966, Z = 15.191, p < 0.001), Impact (1.116, Z = 16.708, p < 0.001), and Solutions (1.034, Z = 15.899, p < 0.001). The highest factor loading in this category is for Impact (1.116), suggesting that perceived impact is a crucial component of knowledge acquisition. The observed variables influencing Behaviour toward EP Policies (1.023, Z = 16.027, p < 0.001), Advocacy1 (1.012, Z = 15.711, p < 0.001), and Advocacy2 (1.009, Z = 15.729, p < 0.001). The highest loading is for “Policies” (1.023), implying that policy-related actions are a key behavioural response. The covariances among the three latent variables are all statistically significant: Engagement and Knowledge (1.030, Std.Err = 0.103, Z = 10.002, p < 0.001), Engagement and Behaviour (1.058, Std.Err = 0.106, Z = 9.956, p < 0.001), and Knowledge and Behaviour (1.114, Std.Err = 0.108, Z = 10.326, p < 0.001). The strongest relationship is between Knowledge and Behaviour (1.114), indicating that individuals with greater knowledge are more likely to engage in behavioural changes.
4.5. Structural Equation Modelling (SEM) Results
The Structural Equation Modelling (SEM) results indicate a well-fitting model, as demonstrated by multiple fit indices and statistical measures (Table 8). The User Model Chi-Square (211.237, df = 62, p < 0.001) is statistically significant. The Comparative Fit Index (CFI = 0.953) and Tucker-Lewis Index (TLI = 0.941) both exceed the common threshold of 0.90, indicating a good fit, suggesting that the specified model explains a large proportion of the covariance structure relative to the baseline model. In terms of error metrics, the Root Mean Square Error of Approximation (RMSEA = 0.078, 90% CI: 0.066 – 0.089) falls below the acceptable threshold of 0.08, implying a reasonable fit, though not an ideal one. The p-value for RMSEA ≤ 0.05 is 0.000, suggesting that the model is unlikely to be a perfect fit, while the p-value for RMSEA ≥ 0.080 is 0.377, indicating that the model is on the borderline of acceptable fit. The Standardised Root Mean Square Residual (SRMR = 0.034) is well below the 0.05 threshold, further supporting a good model fit. Regarding information criteria, the Akaike Information Criterion (AIC = 15,582.172), Bayesian Information Criterion (BIC = 15,697.925), and Sample-size Adjusted BIC (SABIC = 15,605.906) provide measures for comparing models, with lower values indicating a better balance of fit and complexity.
Table 9 below presents the latent for Engagement, Knowledge, and behaviour. All the observed items (Like, Comment, Share, Participate, and Follow) have strong and significant loadings (P = 0.000), indicating that these variables reliably measure the engagement, Knowledge, and behaviour construct. However, Knowledge is significantly predicted by Engagement (Estimate = 0.973, SE = 0.070, Z = 13.985, p = 0.000). This indicates that higher engagement behaviours are strongly associated with increased knowledge. Similarly, behaviour is significantly predicted by Knowledge (Estimate = 0.685, SE = 0.206, Z = 3.318, p = 0.001), suggesting that individuals with more knowledge are more likely to exhibit behavioural changes. Behaviour is not significantly predicted by Engagement (Estimate = 0.329, SE = 0.207, Z = 1.587, p = 0.112). This implies that engagement alone does not directly lead to behavioural change, but rather, knowledge acts as a mediating factor.
The variance estimates in Structural Equation Modelling (SEM) and Confirmatory Factor Analysis (CFA) provide insights into the stability and reliability of the constructs and their observed indicators (Table 10). The variance of engagement, knowledge, and behaviour Indicators remains relatively stable between SEM and CFA. However, among the Latent Constructs, the variance estimates for the latent variables (Engagement, Knowledge, and Behaviour) differ significantly between SEM and CFA.
Figure 5 illustrates the structural relationships among three latent constructs: Engagement, Knowledge, and Behaviour. Engagement is measured by five observed variables—Like, Comment, Share, Follow, and Participate—all of which show strong factor loadings (ranging from 0.71 to 0.79). Engagement significantly predicts Knowledge (β = 0.95) and moderately influences Behaviour (β = 0.31), although the direct path to Behaviour is not statistically significant. Knowledge is strongly predicted by Engagement and, in turn, significantly predicts Behaviour (β = 0.66), indicating a mediating effect.
5. Discussion of Findings
The study hypothesised that student engagement with environmental protection (EP) content on social media would significantly influence their knowledge of EP, which in turn would drive behavioural changes. This was tested through structural equation modelling (SEM), factor analysis, and confirmatory factor analysis (CFA), using both direct and mediated pathways. The correlation matrix highlighted significant interconnections between engagement metrics and content features. Likes, comments, shares, and participation were found to be strongly correlated, indicating that social media interactions tend to reinforce one another. This discovery aligns with Ballara (2023) who states that posts with a higher number of likes tend to receive more exposure within social media platforms and with other similar studies (Li & Xie, 2020; O’Day & Heimberg, 2021; Rathje et al., 2021). In a post by Pfeffer (2023), it was stated that every like, comment, or share reinforces the user’s desire for validation, driving them to seek more interaction and engagement on the platform. For instance, content that garnered many likes also attracted more comments (r = 0.60), shares (r = 0.50), and participation (r = 0.50), reinforcing the concept of engagement as a multi-faceted construct. Notably, cause-based and solution-oriented content were highly correlated with measures of advocacy (e.g., Impact and Advocacy1: r = 0.69), suggesting that meaningful, actionable content drives not just engagement but also intent to act (Ballara, 2023).
More importantly, the findings extend beyond surface-level interaction to deeper behavioural intentions. Cause-based and solution-oriented content showed strong correlations with advocacy-related measures. For example, content perceived as impactful is highly correlated with advocacy behaviours (Impact and Advocacy1: r = 0.69), suggesting that the more a user perceives content as meaningful and solution-driven, the more likely they are to engage in advocacy. This implies that increasing the clarity and relevance of the content (e.g., by highlighting environmental causes or proposed solutions) can significantly boost not only user interaction but also users’ intention to take action (Ballara, 2023; Hatamleh et al., 2023). In essence, the results underscore that engagement is not random or isolated; rather, it is driven by the content’s relevance and perceived impact. According to Voorveld et al. (2018), engagement is highly context-specific. Berry (2019) and Tenenboim (2022) defined engagement as “the cognitive, emotional, or affective experiences that users have with media content or brands. Hence, creating content that is emotionally and intellectually stimulating, especially by addressing environmental causes and offering solutions, can amplify both engagement and advocacy outcomes. Thus, meaningful engagement can serve as a gateway to knowledge and behaviour change.
Factor analysis using Varimax and Oblimin rotations confirmed the dimensionality and structure of the engagement, knowledge, and behaviour constructs. The factors were conceptually meaningful and statistically robust, explaining over 60% of the variance. For example, the engagement factor included behaviours such as commenting and sharing, while the knowledge factor captured awareness of causes, effects, and solutions related to EP. The behaviour factor loaded strongly on consistent habits, policy engagement, and advocacy measures. This confirms that user interaction with EP content is multifaceted, rooted in information exchange, reflection, and action. The Confirmatory Factor Analysis (CFA) supported the hypothesised structure with satisfactory model fit indices (CFI = 0.941; TLI = 0.927; RMSEA = 0.085; SRMR = 0.036), suggesting the model is robust in explaining the latent structure of the constructs. Measurement model estimates showed that variables such as “Comment,” “Impact,” and “Policies” had the highest loadings in their respective domains, indicating they were the most representative of engagement, knowledge, and behaviour.
Crucially, the Structural Equation Model (SEM) validated the hypothesised. Engagement significantly predicted Knowledge (β = 0.973, p < 0.001), and Knowledge significantly predicted Behaviour (β = 0.685, p = 0.001), supporting the mediating role of Knowledge in the engagement-behaviour link. However, the direct relationship between Engagement and Behaviour was not statistically significant (β = 0.329, p = 0.112), suggesting that knowledge acquisition plays a pivotal intermediary role. In other words, merely engaging with EP content is insufficient for behaviour change unless it translates into knowledge gain, which then acts as the catalyst for informed action. This is a pivotal insight: while students may engage superficially (e.g., liking or sharing), it is their deeper understanding that catalyses actual behavioural transformation. Model fit indices such as CFI (0.953), TLI (0.941), and RMSEA (0.078) indicate that the SEM model fits the data well, confirming that the hypothesised relationships align closely with the empirical evidence. The low SRMR value (0.034) further validates that discrepancies between observed and predicted values are minimal.
These findings have important implications for social media campaigns and environmental advocacy. It is not enough to create engaging content, campaigns must also focus on educational clarity to transform interest into action. Visual storytelling, data-backed posts, and clear solution-oriented messages may serve as the conduits for knowledge, which then instigates behavioural change. In conclusion, this study demonstrates a clear chain of influence: engagement fosters knowledge, and knowledge drives behaviour. While engagement is necessary to draw attention, it is the cognitive processing of content that ultimately encourages environmentally protective behaviours. This supports the hypothesis and underscores the importance of educational depth in digital engagement strategies for environmental protection.
References
- Abiolu, O. A. (2019). Environmental knowledge and behaviour of Nigerian youth: An assessment. Applied Environmental Education & Communication, 18(1), 53–67.
- Almeida, E., Lagoa, D., & Vasudhevan, T. (2024). Hidden harms: The economic and financial consequences of deforestation and its underlying drivers.
- Alumona, I. M., & Onwuanabile, K. M. (2019). Environmental insecurity in Nigeria. In Internal Security Management in Nigeria: Perspectives, Challenges and Lessons (pp. 181–213). Springer. https://doi.org/10.1007/978-981-13-8215-4_10.
- Awang, S. F., Annuar, S. N., & Gisip, I. A. (2021). The effect of social media influencer attributes towards pro-environmental intention. Romanian Journal of Information Technology & Automatic Control/Revista Română de Informatică Și Automatică, 31(1).
- Ballara, N. B. (2023). The power of social validation: A literature review on how likes, comments, and shares shape user behaviour on social media. International Journal of Research Publication and Reviews, 4(7), 3355–3367. https://doi.org/10.55248/gengpi.4.723.51227.
- Bandura, A. (2009). Social cognitive theory of mass communication. In Media effects (pp. 110–140). Routledge.
- Berry, R. (2019). Podcasts and Vodcasts. The International Encyclopedia of Journalism Studies, 1–5.
- Croitoru, L., Chang, J. C., & Kelly, A. (2020). The Cost of Air Pollution in Lagos (No. Report No.\ 33038). World Bank Group. http://documents.worldbank.org/curated/en/980031575616020127.
- Doss, W., Rayfield, J., Burris, S., & Lawver, D. (2021). A Quantitative Content Analysis of Survey Research Methods over a 40-Year Time Period in the” Journal of Agricultural Education”. Journal of Agricultural Education, 62(3), 310–328. https://doi.org/10.5032/jae.2021.03310.
- Fazil, A. W., Hakimi, M., Akrami, K., Akrami, M., & Akrami, F. (2024). Exploring the role of social media in bridging gaps and facilitating global communication. Studies in Media, Journalism and Communications, 2(1), 13–21. https://www.researchgate.net/profile/Musawer-Hakimi/publication/378364057_Exploring_the_Role_of_Social_Media_in_Bridging_Gaps_and_Facilitating_Global_Communication/links/65d61551e7670d36abced4c8/Exploring-the-Role-of-Social-Media-in-Bridging-Gaps-and-Facilitating-Global-Communication.pdf.
- Ghanad, A. (2023). An overview of quantitative research methods. International Journal of Multidisciplinary Research and Analysis, 6(08), 3794–3803. https://doi.org/10.47191/ijmra/v6-i8-52.
- Harris, B. (2020, January 22). This chart shows how the energy mix is failing in the fight against climate change. World Economic Forum. https://www.weforum.org/stories/2020/01/this-chart-shows-how-the-energy-mix-is-failing-the-fight-against-climate-change/.
- Hatamleh, I. H. M., Safori, A. O., Habes, M., Tahat, O., Ahmad, A. K., Abdallah, R. A.-Q., & Aissani, R. (2023). Trust in Social Media: Enhancing Social Relationships. Social Sciences, 12(7), 416. https://doi.org/10.3390/socsci12070416.
- Huber, B., Barnidge, M., Gil de Zúñiga, H., & Liu, J. (2019). Fostering public trust in science: The role of social media. Public Understanding of Science, 28(7), 759–777.
- Kehinde, O., Ramonu, O., Babaremu, K., & Justin, L. (2020). Plastic wastes: Environmental hazard and instrument for wealth creation in Nigeria. Heliyon, 6(10). https://doi.org/10.1016/j.heliyon.2020.e05131.
- Kemp, S. (2023, February). Digital 2023: Global Overview Report—DataReportal – Global Digital Insights. In DataReportal – Global Digital Insights. https://datareportal.com/reports/digital-2023-global-overview-report.
- Leighton, G. R., & Serieys, L. E. (2025). Wild cats on the internet: The role of social media in popularising caracals in South Africa. Environmental Communication, 19(1), 87–101.
- Li, Y., & Xie, Y. (2020). Is a picture worth a thousand words? An empirical study of image content and social media engagement. Journal of Marketing Research, 57(1), 1–19.
- Nri, N. N., & Owoeye, F. (2022, June 8). In Nigeria’s disappearing forests, loggers outnumber trees. Reuters. https://www.reuters.com/world/africa/nigerias-disappearing-forests-loggers-outnumber-trees-2022-06-08/.
- O’Day, E. B., & Heimberg, R. G. (2021). Social media use, social anxiety, and loneliness: A systematic review. Computers in Human Behaviour Reports, 3, 100070.
- Odunlami, O. A., & Aro, A. K. (2024). Social Media Advocacy, Green Awareness and Sustainability Initiatives in Nigeria. Jalingo Journal of Social and Management Sciences, 6(1), 182–193.
- Ogunjinmi, A., & Oniya, B. (2016). Determinants of environmental attitudes and behaviours of Nigerian undergraduates: A case of Federal University of Technology, Akure, Nigeria. Applied Tropical Agriculture, 21(1), 175–182.
- Ojo, O. O. (2021). The role of social networking or social media in the development of Nigerian society. African Journal of Educational Management, 22(1), 137–154. http://journals.ui.edu.ng/index.php/ajem/article/download/695/620.
- Ononogbo, C., Ohwofadjeke, P., Chukwu, M., Nwawuike, N., Obinduka, F., Nwosu, O., Ugenyi, A., Nzeh, I., Nwosu, E., & Nwakuba, N. (2024). Agricultural and environmental sustainability in nigeria: A review of challenges and possible eco-friendly remedies. Environment, Development and Sustainability, 1–47. https://doi.org/10.1007/s10668-024-05435-2.
- Oyelakin, S., Adekunle, J., Abubakar, B., Oyeniran, M., Sule, H., Folorunso, O., Alagbe, A., Anifowoshe, T., Robbert, C. O., & Ebonyem, B. (2025). Online Advocacy and Social Media’s Role in Communicating Effects of Environmental Pollution. Nepal Journal of Multidisciplinary Research, 8(3), 33–55.
- Pavelle, S., & Wilkinson, C. (2020). Into the digital wild: Utilizing Twitter, Instagram, YouTube, and Facebook for effective science and environmental communication. Frontiers in Communication, 5, 575122.
- Pezzullo, P. C. (2024). On environmental communication as a care discipline. Environmental Communication, 18(1–2), 1–7.
- Pfeffer, A. (2023, August 7). The role of social media in fueling technology addiction. https://amypfeffer.com/the-role-of-social-media-in-fueling-technology-addiction/.
- Rathje, S., Bavel, J. J., & Linden, S. (2021). Out-group animosity drives engagement on social media. Proceedings of the National Academy of Sciences, 118(26), 2024292118.
- Schrage, P., & Adeyanju, G. C. (2024). Building Climate Resilient Health Systems: Panacea for Mitigating Climate Change Effects in Nigeria. Research Square (Pre Print). https://doi.org/10.21203/rs.3.rs-4387784/v1.
- Simis-Wilkinson, M., Madden, H., Lassen, D., Su, L. Y.-F., Brossard, D., Scheufele, D. A., & Xenos, M. A. (2018). Scientists joking on social media: An empirical analysis of# overlyhonestmethods. Science Communication, 40(3), 314–339.
- Tenenboim, O. (2022). Comments, shares, or likes: What makes news posts engaging in different ways. Social Media + Society, 8(4). https://doi.org/10.1177/20563051221130282.
- UNICEF Nigeria. (2023). Climate Landscape Analysis for Children in Nigeria 2023. United Nations Children’s Fund (UNICEF) Nigeria. https://www.unicef.org/nigeria/media/8311/file/Climate%20Landscape%20Analysis%20for%20Children%20in%20Nigeria%202023.pdf.
- United Nations Environment Programme. (2023, January 5). Nigeria acts to fight growing e-waste epidemic. https://www.unep.org/gef/news-and-stories/press-release/nigeria-acts-fight-growing-e-waste-epidemic.
- United Nations Environment Programme. (2024). Digital transformations as an enabler (UNEP/EA.6/13) (Report for the Sixth Session of the United Nations Environment Assembly, Nairobi, 26 February–1 March 2024 No. UNEP/EA.6/13). United Nations Environment Programme. https://docs.un.org/en/UNEP/EA.6/13.
- U.S. Environmental Protection Agency. (2025, March 31). Global Greenhouse Gas Overview. https://www.epa.gov/ghgemissions/global-greenhouse-gas-overview.
- Voorveld, H. A. M., Noort, G., Muntinga, D. G., & Bronner, F. (2018). Engagement with Social Media and Social Media Advertising: The Differentiating Role of Platform Type. Journal of Advertising, 47(1), 38–54. https://doi.org/10.1080/00913367.2017.1405754.
- World Health Organization (WHO). (2024, October 16). Household Air Pollution and Health. https://www.who.int/news-room/fact-sheets/detail/household-air-pollution-and-health.
- Xie, P., Zhang, Y., Chen, R., Lin, Z., & Lu, N. (2024). Social media’s impact on environmental awareness: A marginal treatment effect analysis of WeChat usage in China. BMC Public Health, 24(1), 3237.
- Yang, X., Chen, L., Wei, L., & Su, Q. (2020). Personal and media factors related to citizens’ pro-environmental behavioural intention against haze in China: A moderating analysis of TPB. International Journal of Environmental Research and Public Health, 17(7), 2314.
Figure 1.
Conceptual Framework.
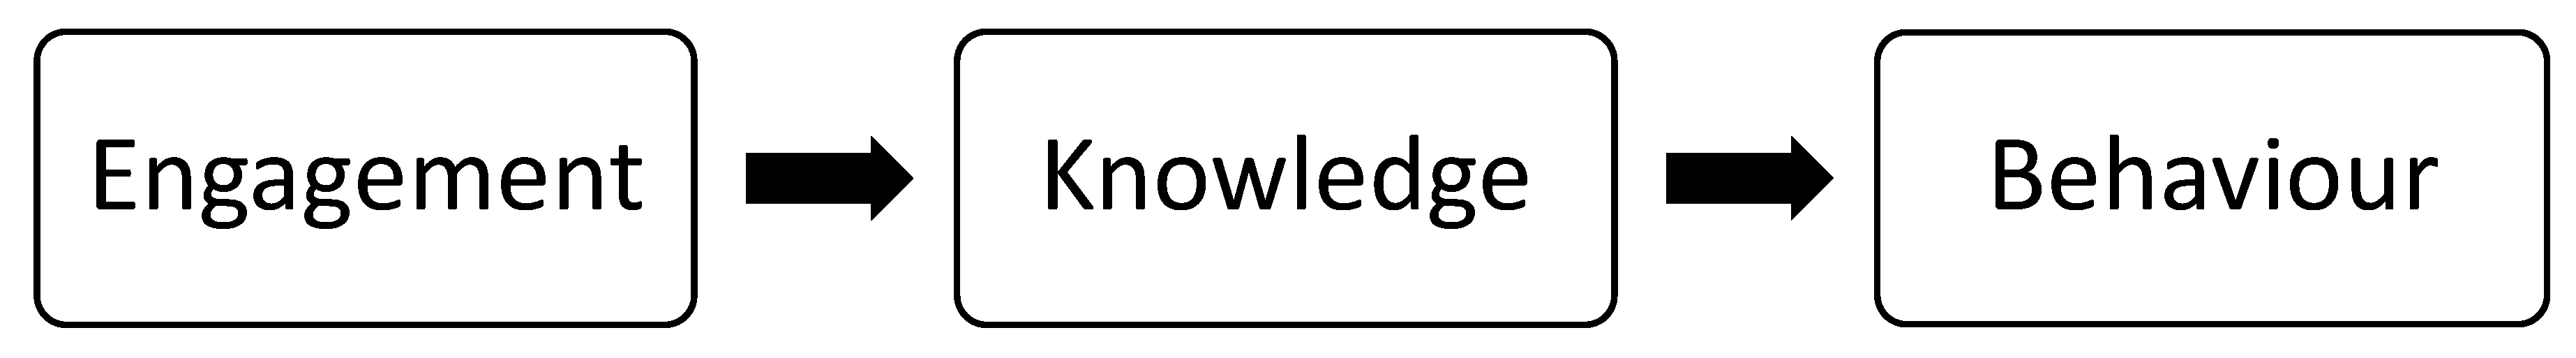
Figure 3.
Factor loadings from factor analysis with varimax rotation.
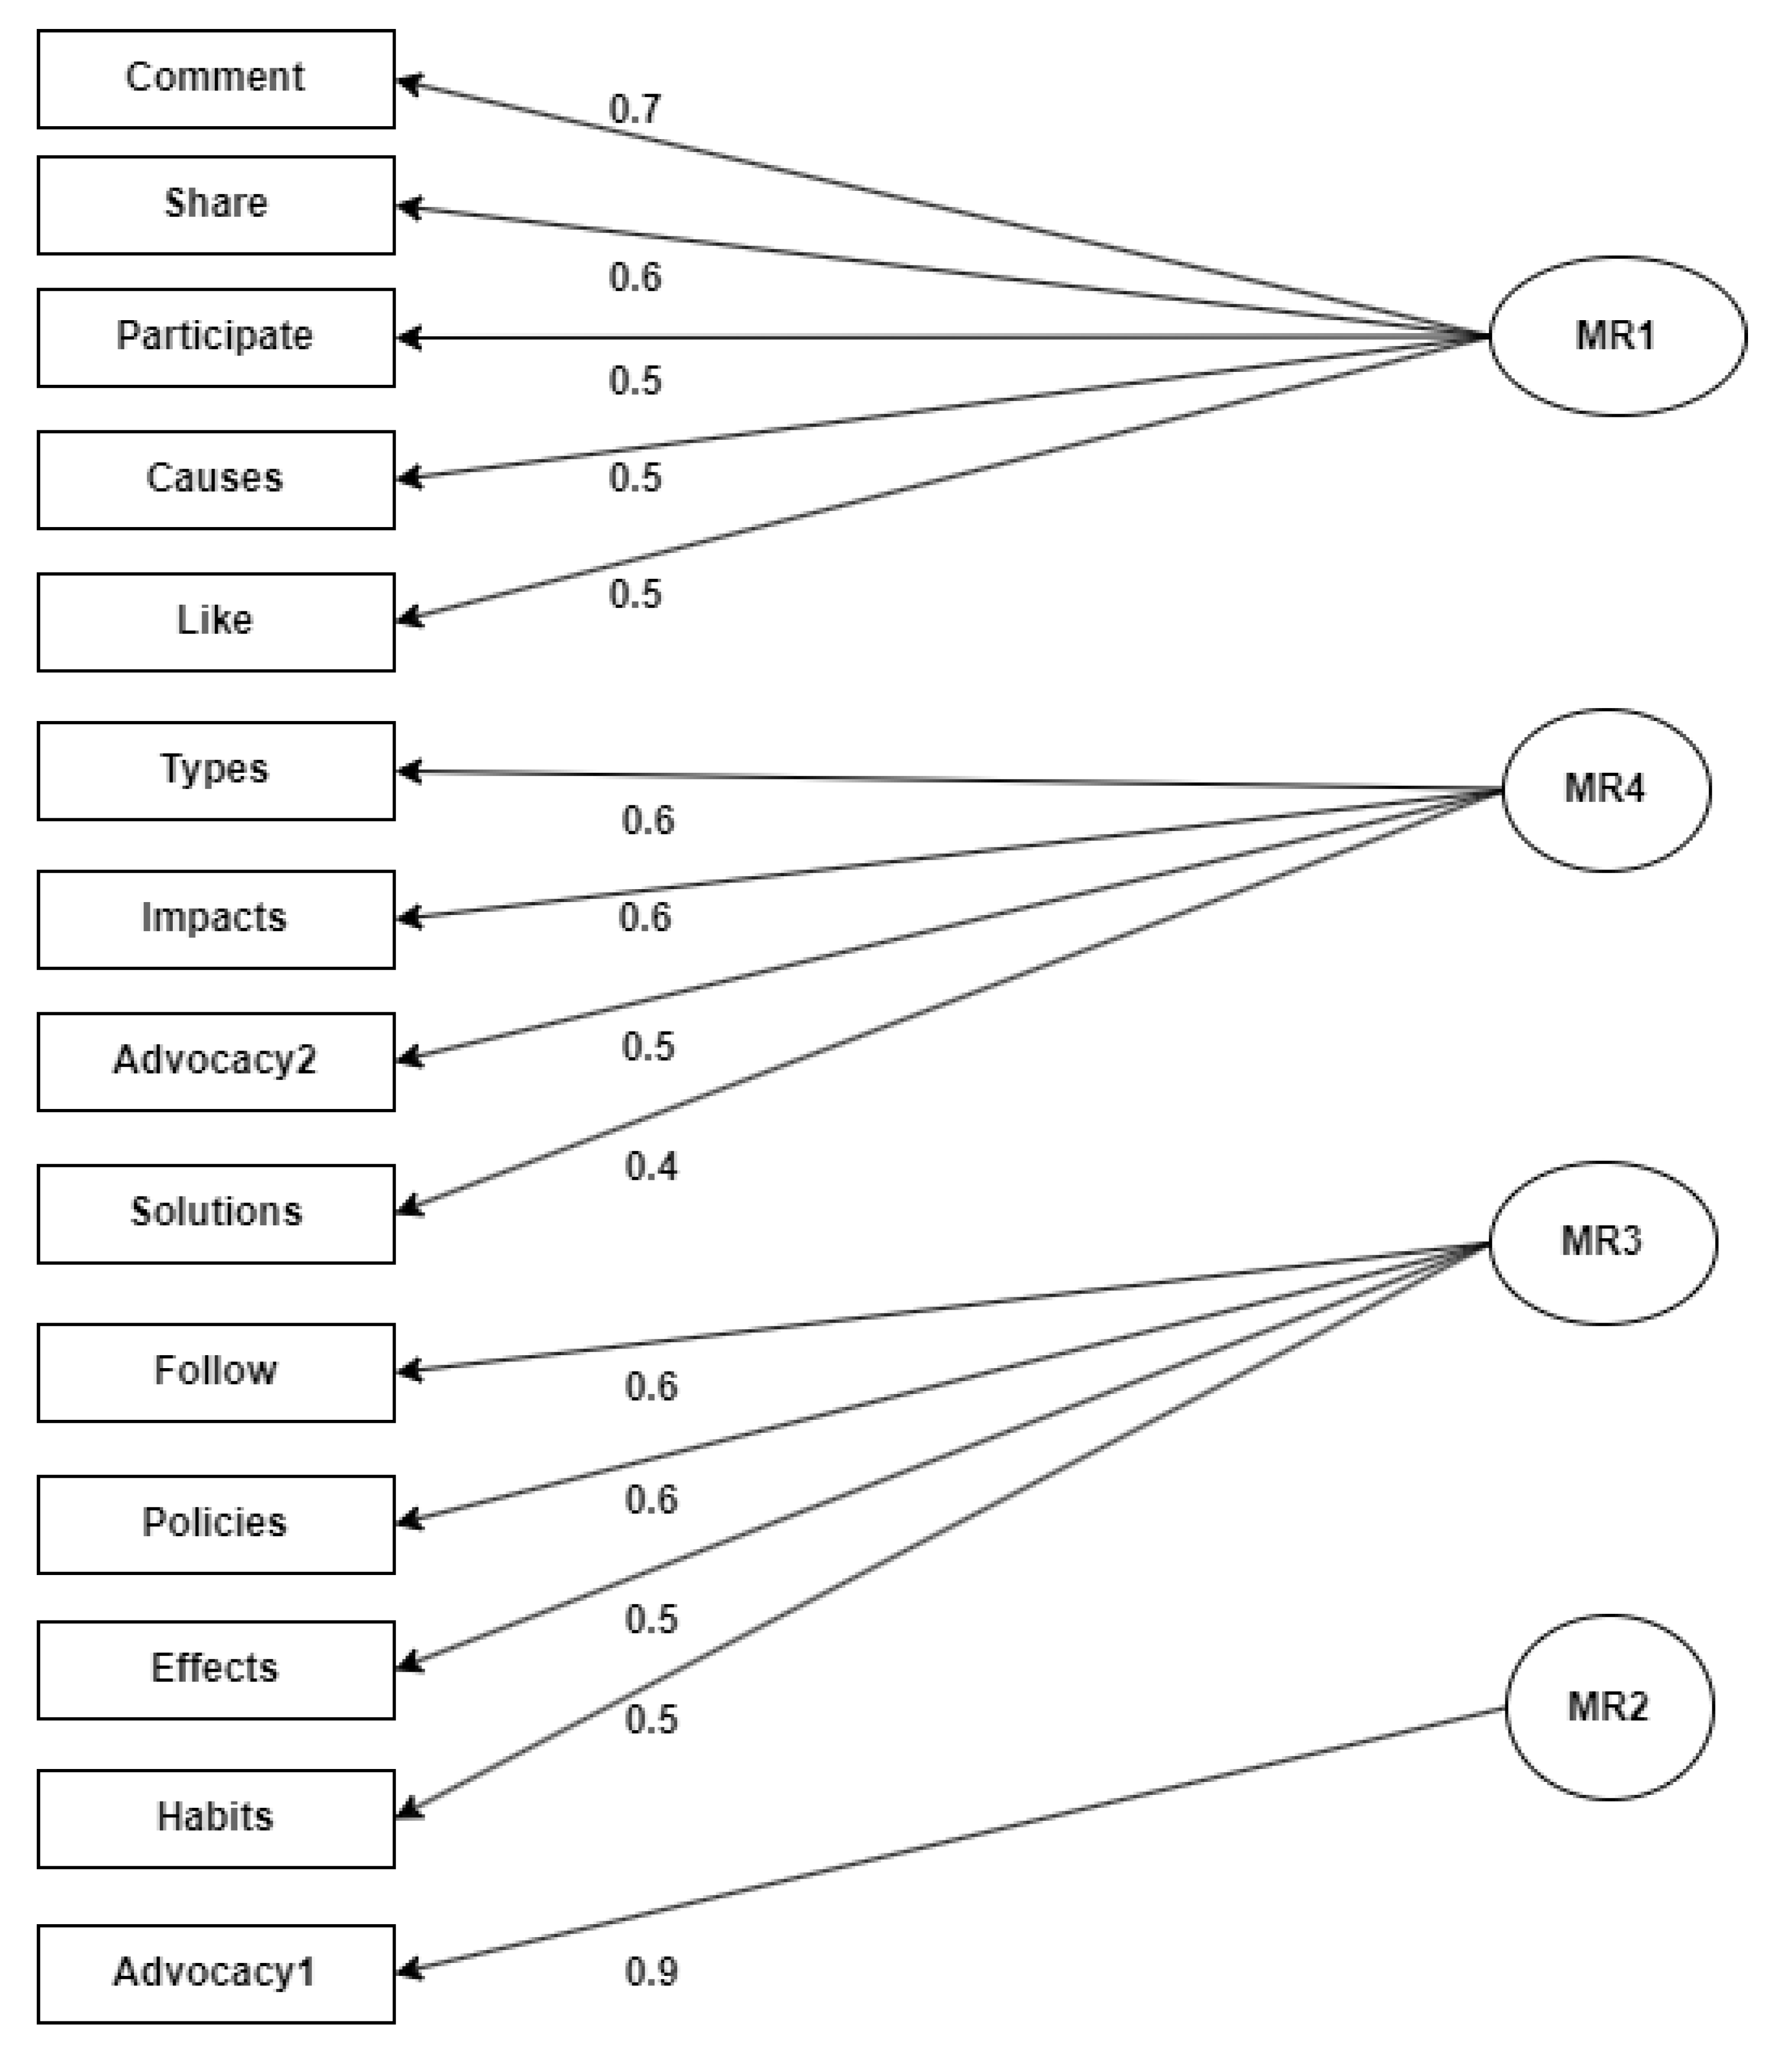
Figure 5.
Structural Equation Model Showing Relationships Among Engagement, Knowledge, and Behaviour Constructs.
Figure 5.
Structural Equation Model Showing Relationships Among Engagement, Knowledge, and Behaviour Constructs.
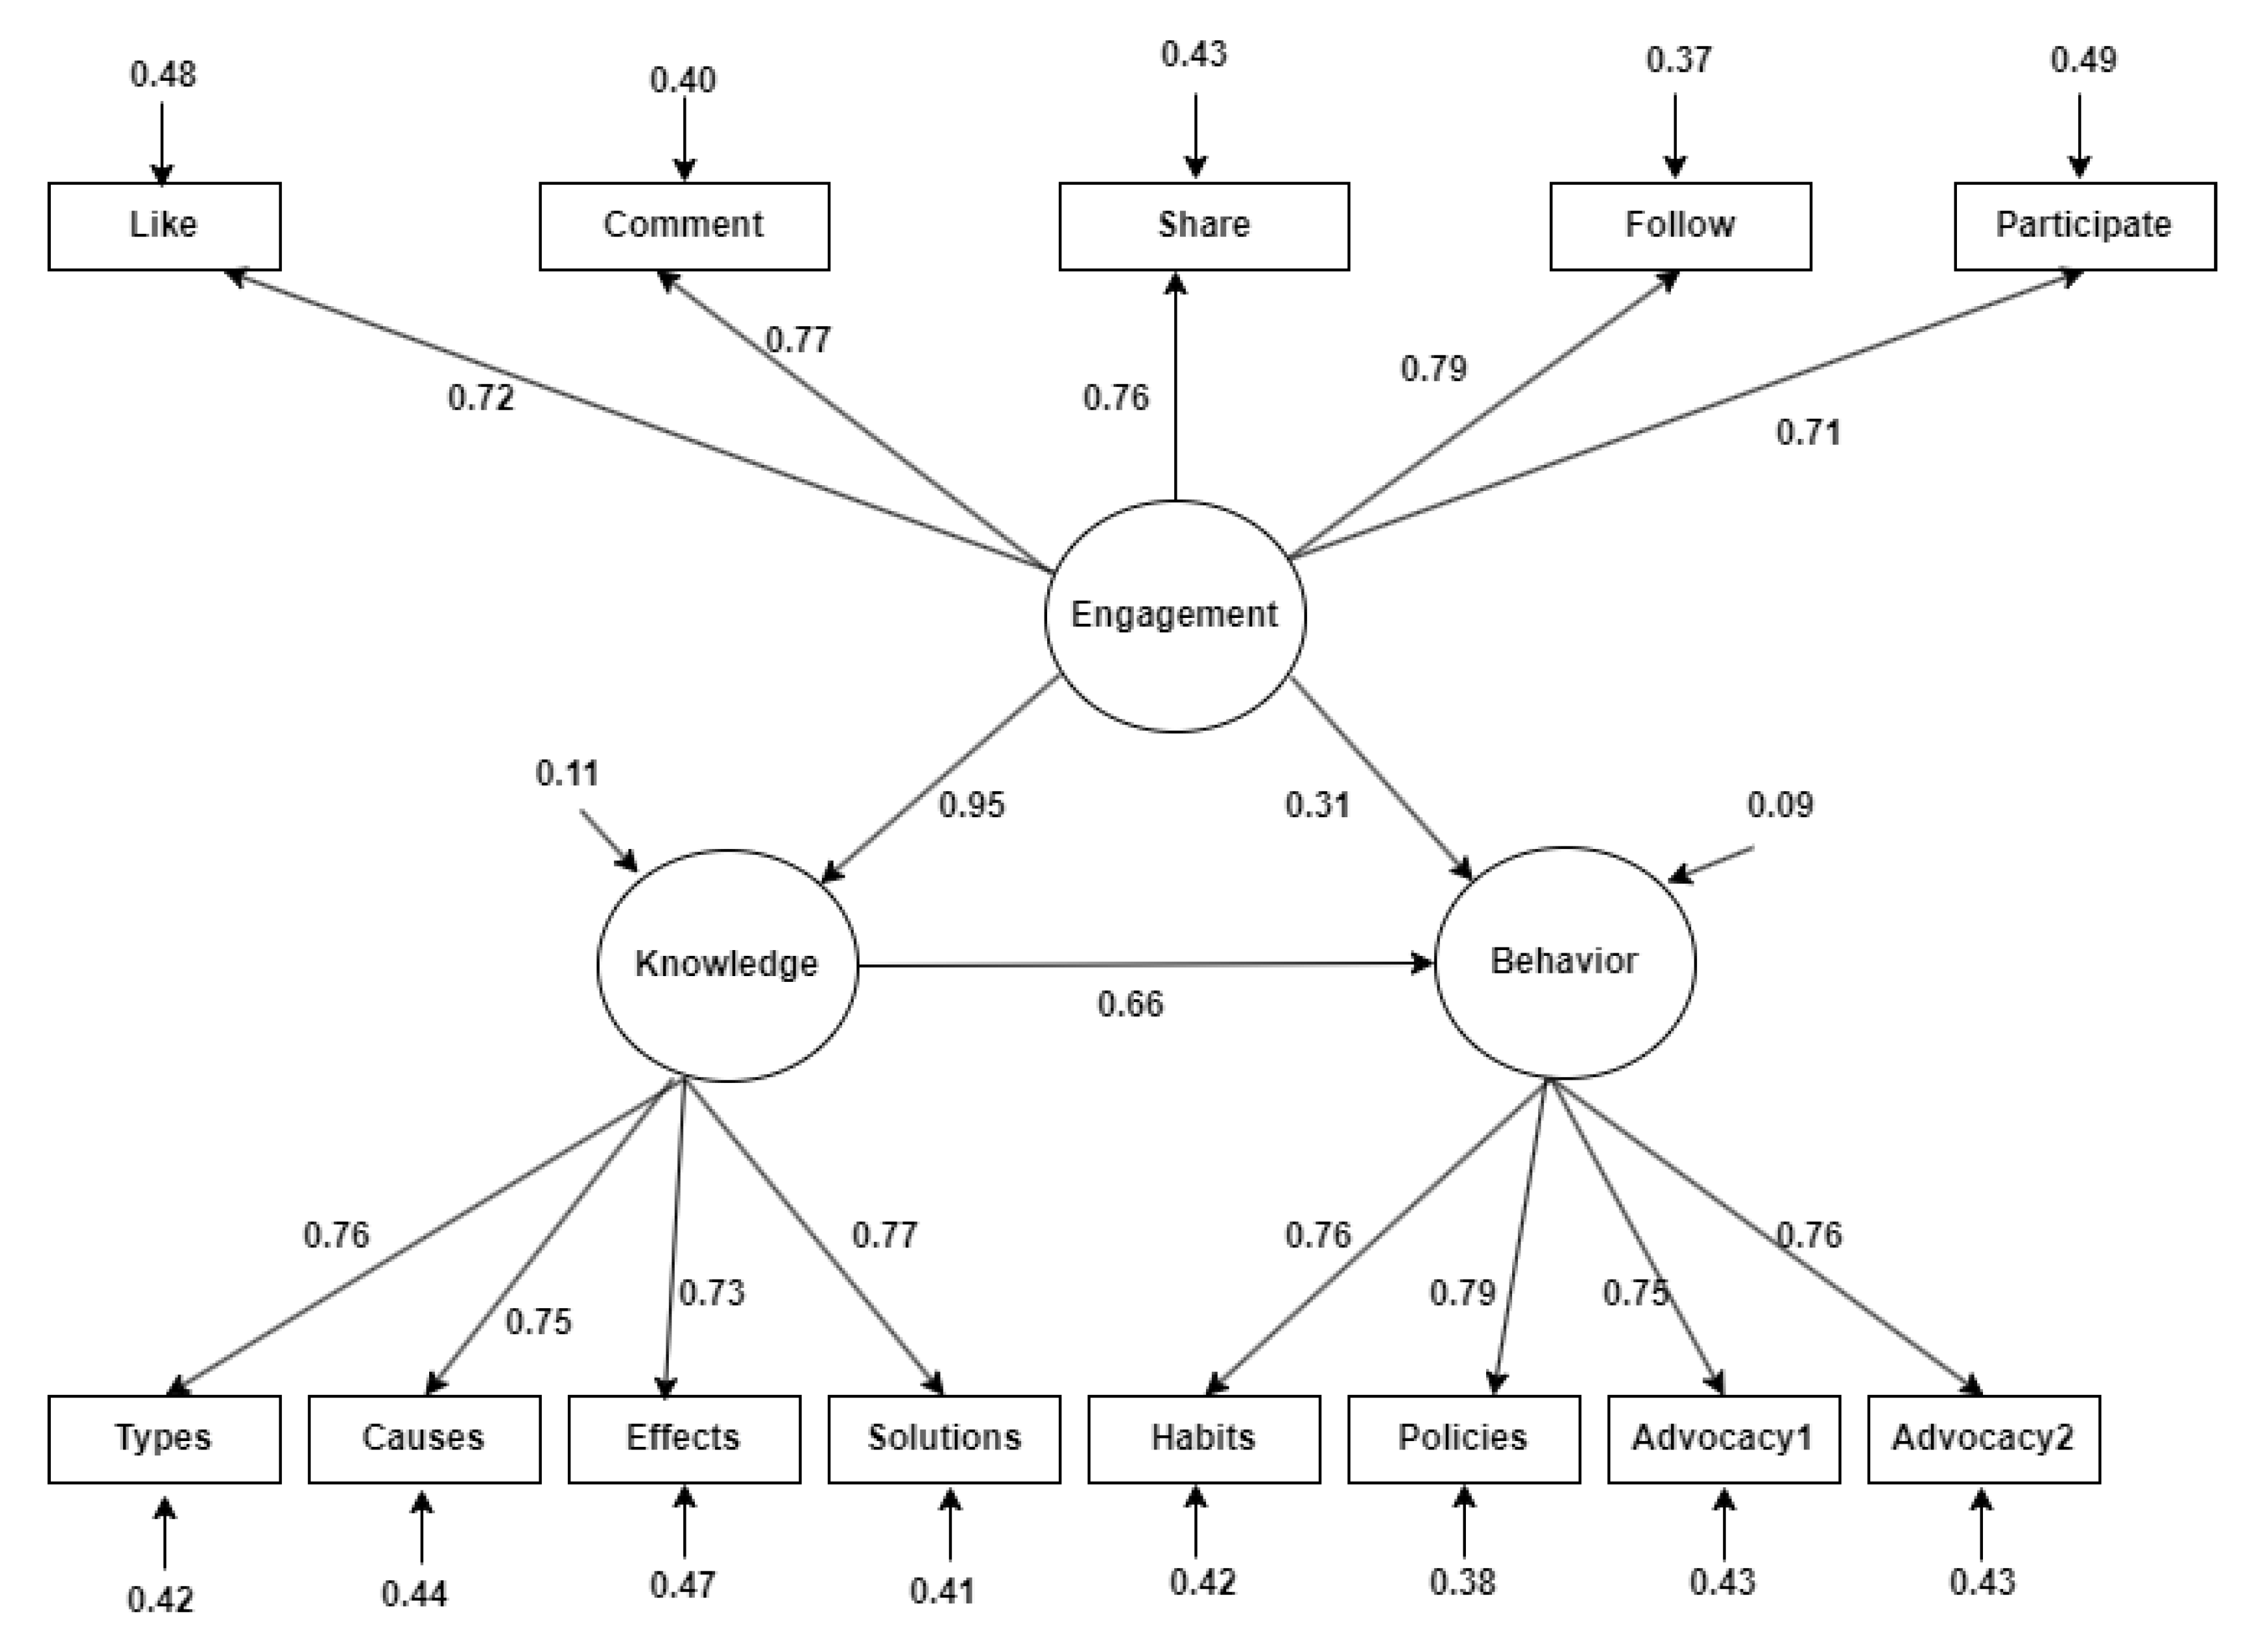
Table 1.
The Conceptual Framework and Variables Selected for Each Latent Construct (Factors).
| Latent Factor | Observed Variables | Question in Survey |
| Engagement | Like | When I come across content on the effect of EP, I like it |
| Comment | When I come across content on the effect of EP, I make comments. | |
| Share | When I come across content on the effect of EP, I share/repost | |
| Follow blogs/websites | I follow blogs or websites that discuss EP issues | |
| Participate in forums | I participate in online forums or communities about EP | |
| Knowledge | Types of EP | I am aware of the different types of EP (air, water, soil) |
| Causes of EP | EP occurs when humans introduce pollutants... | |
| Effects of EP | EP has harmful effects on plants, animals, and humans | |
| Solutions to EP | EP can be solved by adopting cleaner energy... | |
| Behaviour | Eco-conscious habits | I have adopted eco-conscious habits like using reusable products |
| Green policies | I now support green policies because of social media exposure | |
| Advocate against pollution | I desist from and advocate against industrial smoke | |
| Advocate | I desist from and advocate against any activities that lead to automobile exhaust and bush burning” |
Table 3.
Cortest Bartlett Test Chi-Square Test.
| X2 | df | p-Value |
| 3624.235 | 91 | 0 |
Table 4.
Model fit for the factor analysis with Varimax rotation.
| Metric | Value | 90% Upper | 90% Lower |
| Mean item complexity | 2.7 | ||
| Tucker Lewis Index of factoring reliability | 0.96 | ||
| BIC | -141.93 | ||
| RMSEA index | 0.062 | 0.077 | 0.047 |
| root mean square of the residuals (RMSR) | 0.02 | ||
| corrected root mean square of the residuals | 0.3 | ||
| The total n.obs was 400 with Likelihood Chi Square = 103.72 with prob < 2.4e-07 | |||
| The harmonic n.obs is 400 with the empirical chi square 28.8 with prob < 0.92 | |||
Table 5.
Model fit for the factor analysis with oblimin rotation.
| Metric | Value | 90% Upper | 90% Lower |
| Mean item complexity | 1.6 | ||
| Tucker Lewis Index of factoring reliability | 0.949 | ||
| BIC | -156.57 | ||
| RMSEA index | 0.07 | 0.083 | 0.058 |
| root mean square of the residuals (RMSR) | 0.03 | ||
| corrected root mean square of the residuals | 0.03 | ||
| The total n.obs was 400 with Likelihood Chi Square = 154.99 with prob < 3.6e-12 | |||
| The harmonic n.obs is 400 with the empirical chi square 47.45 with prob < 0.65 | |||
Table 6.
Confirmatory Analysis Results.
| Model Test | Test statistic | df | p-Value | |
| User model | 287.178 | 74 | 0.00 | |
| Baseline model | 3684.102 | 91 | 0.00 | |
| User Model versus Baseline Model | Comparative Fit Index (CFI) | 0.941 | ||
| Tucker-Lewis Index (TLI) | 0.927 | |||
| Loglikelihood and Information Criteria | Loglikelihood user model (H0) | -8312.390 | ||
| Loglikelihood unrestricted model (H1) | -8168.801 | |||
| Akaike (AIC) | 16686.779 | |||
| Bayesian (BIC) | 16810.515 | |||
| Sample-size adjusted Bayesian (SABIC) | 16712.149 | |||
| Root Mean Square Error of Approximation | RMSEA | 0.085 | ||
| 90 Per cent confidence interval - lower | 0.075 | |||
| 90 Per cent confidence interval - upper | 0.095 | |||
| P-value H_0: RMSEA <= 0.050 | 0.000 | |||
| P-value H_0: RMSEA >= 0.080 | 0.788 | |||
| Standardised Root Mean Square Residual | SRMR | 0.036 | ||
Table 7.
Measurement Model Estimates for Latent Variables.
| Latent Variable | Estimate | Std. Err | Z-value | P(>|z|) |
| Engagement | ||||
| Like | 1.000 | |||
| Comment | 1.165 | 0.077 | 15.075 | 0.000 |
| Share | 1.070 | 0.073 | 14.663 | 0.000 |
| Participate | 1.005 | 0.072 | 14.039 | 0.000 |
| Follow | 1.068 | 0.069 | 15.456 | 0.000 |
| Knowledge | ||||
| Types | 1.000 | |||
| Causes | 1.011 | 0.065 | 15.493 | 0.000 |
| Effects | 0.966 | 0.064 | 15.191 | 0.000 |
| Impact | 1.116 | 0.067 | 16.708 | 0.000 |
| Solutions | 1.034 | 0.065 | 15.899 | 0.000 |
| Behaviour | ||||
| Habits | 1.000 | |||
| Policies | 1.023 | 0.064 | 16.027 | 0.000 |
| Advocacy1 | 1.012 | 0.064 | 15.711 | 0.000 |
| Advocacy2 | 1.009 | 0.064 | 15.729 | 0.000 |
| Covariances: | ||||
| Engagement | ||||
| Knowledge | 1.030 | 0.103 | 10.002 | 0.000 |
| Behaviour | 1.058 | 0.106 | 9.956 | 0.000 |
| Knowledge | ||||
| Behaviour | 1.114 | 0.108 | 10.326 | 0.000 |
Table 8.
Model Fit Indices and Evaluation of the Structural Equation Model.
| Model Test | Test statistic | df | p Value | |
| User model | 211.237 | 62 | 0.00 | |
| Baseline model | 3257.881 | 78 | 0.00 | |
| User Model versus Baseline Model | Comparative Fit Index (CFI) | 0.953 | ||
| Tucker-Lewis Index (TLI) | 0.941 | |||
| Loglikelihood and Information Criteria | Loglikelihood user model (H0) | -7762.086 | ||
| Loglikelihood unrestricted model (H1) | -7656.468 | |||
| Akaike (AIC) | 15582.172 | |||
| Bayesian (BIC) | 15697.925 | |||
| Sample-size adjusted Bayesian (SABIC) | 15605.906 | |||
| Root Mean Square Error of Approximation | RMSEA | 0.078 | ||
| 90 Percent confidence interval - lower | 0.066 | |||
| 90 Percent confidence interval - upper | 0.089 | |||
| P-value H_0: RMSEA <= 0.050 | 0.000 | |||
| P-value H_0: RMSEA >= 0.080 | 0.377 | |||
| Standardised Root Mean Square Residual | SRMR | 0.034 | ||
Table 9.
Structural Equation Modelling Results for the Latent Constructs.
| Latent Variable | Estimate | Std.Err | Z-value | P(>|z|) |
| Engagement | ||||
| Like | 1.000 | |||
| Comment | 1.172 | 0.078 | 15.001 | 0.000 |
| Share | 1.084 | 0.074 | 14.695 | 0.000 |
| Participate | 1.079 | 0.070 | 15.436 | 0.000 |
| Follow | 1.002 | 0.072 | 13.851 | 0.000 |
| Knowledge | ||||
| Types | 1.000 | |||
| Causes | 1.013 | 0.063 | 15.445 | 0.000 |
| Effects | 0.957 | 0.064 | 14.952 | 0.000 |
| Solutions | 1.032 | 0.065 | 15.785 | 0.000 |
| Behaviour | ||||
| Habits | 1.000 | |||
| Policies | 1.024 | 0.063 | 16.365 | 0.000 |
| Advocacy1 | 0.985 | 0.063 | 15.537 | 0.000 |
| Advocacy2 | 0.987 | 0.063 | 15.645 | 0.000 |
| Regressions: | ||||
| Knowledge | ||||
| Engagement | 0.973 | 0.070 | 13.985 | 0.000 |
| Behaviour | ||||
| Knowledge | 0.685 | 0.206 | 3.318 | 0.001 |
| Engagement | 0.329 | 0.207 | 1.587 | 0.112 |
Table 10.
Variance Results in SEM and CFA Models.
| SEM | CFA | |||
| Estimate | P value | Estimate | P value | |
| Like | 0.985 | 0.000 | 0.974 | 0.000 |
| Comment | 0.991 | 0.000 | 0.992 | 0.000 |
| Share | 0.935 | 0.000 | 0.953 | 0.000 |
| Follow | 0.726 | 0.000 | 0.736 | 0.000 |
| Participate | 1.030 | 0.000 | 1.011 | 0.000 |
| Types | 0.827 | 0.000 | 0.830 | 0.000 |
| Causes | 0.898 | 0.000 | 0.905 | 0.000 |
| Effects | 0.908 | 0.000 | 0.891 | 0.000 |
| Solution | 0.853 | 0.000 | 0.852 | 0.000 |
| Habits | 0.872 | 0.000 | 0.900 | 0.000 |
| Policies | 0.782 | 0.000 | 0.812 | 0.000 |
| Advocacy1 | 0.903 | 0.000 | 0.866 | 0.000 |
| Advocacy2 | 0.881 | 0.000 | 0.856 | 0.000 |
| Engagement | 1.069 | 0.000 | 1.081 | 0.000 |
| Knowledge | 0.121 | 0.001 | 1.130 | 0.000 |
| Behaviour | 0.105 | 0.002 | 1.194 | 0.000 |
Disclaimer/Publisher’s Note: The statements, opinions and data contained in all publications are solely those of the individual author(s) and contributor(s) and not of MDPI and/or the editor(s). MDPI and/or the editor(s) disclaim responsibility for any injury to people or property resulting from any ideas, methods, instructions or products referred to in the content. |
© 2026 by the authors. Licensee MDPI, Basel, Switzerland. This article is an open access article distributed under the terms and conditions of the Creative Commons Attribution (CC BY) license (http://creativecommons.org/licenses/by/4.0/).
Copyright: This open access article is published under a Creative Commons CC BY 4.0 license, which permit the free download, distribution, and reuse, provided that the author and preprint are cited in any reuse.


