
Submitted:
24 January 2026
Posted:
26 January 2026
You are already at the latest version
Abstract
Background : Djulis is an aboriginal cereal crop native to Taiwan, and its effects on patients with inflammatory bowel disease (IBD) warrant exploration. The present study investigated whether consumption of djulis can alleviate chronic colitis induced by dextran sulfate sodium (DSS) in mice. Methods : Forty mice were randomly divided into five groups: blank group (B), control group (C), low-dose group (L), medium-dose group (M), and high-dose group (H). Body weight and disease activity index (DAI) were recorded throughout the study. Groups C, L, M, and H were administered with 2% DSS water on days 1–5 and 10–15 to induce chronic colitis. Groups L, M, and H were administered 5%, 10%, and 15% djulis, respectively. Serum and colon samples were collected for further analysis. Results : The DAI scores of groups L, M, and H were significantly lower than those of group C (P<.05), and the DAI scores of group H on day 18 were significantly lower than those of group L (P<.05). Colon length analysis revealed that DSS treatment significantly shortened colon length in group C (P<.05), whereas mice consuming djulis (groups L, M, and H) exhibited restoration of colon length, with the effect being most pronounced in group H. DSS significantly increased the secretion of pro-inflammatory cytokines in the serum and the expression of pro-inflammatory proteins in the colon (P<.05); however, djulis reversed these effects (especially in group H). In addition, mice in group H exhibited a beneficial gut microbiota. Conclusion : Djulis alleviated chronic colitis in mice by reducing inflammation and modulating the gut microbiota. Further research is required to validate the potential of djulis as a dietary treatment option for IBD patients.
Keywords:
Djulis
; inflammatory bowel disease (IBD)
; dextran sulfate sodium (DSS)
; chronic colitis
1. Introduction
Inflammatory bowel disease (IBD) is a chronic inflammatory immune disorder characterized by recurrent digestive tract inflammation. IBD is categorized into 2 types: Crohn’s disease (CD) and ulcerative colitis (UC) [1]. Patients with IBD often experience symptoms, such as abdominal pain and bloody stools, which adversely affect their quality of life. The etiology of IBD involves various factors including diet, genetics, environment, microbiome, and immune dysregulation [2]. Among these, dietary nutrition and its role in IBD have garnered considerable attention [3]. Studies have indicated that the peak age of onset is 20–39 years for CD and 40–59 years for UC [4]. In the United States, the prevalence of IBD in adults increased from 0.9% in 1999 to 1.3% in 2015 [5]. In Taiwan, the incidence of UC has increased from 1.16 cases per 100 000 people in 2016 to 1.53 cases per 100 000 people in 2020, while that of CD has increased from 0.65 cases per 100 000 people in 2016 to 0.81 cases per 100 000 people in 2020 [6]. The rising prevalence of IBD in both Eastern and Western countries may be associated with westernization of dietary habits [7]. Studies have indicated that the consumption of ultra-processed foods is associated with an increased risk of CD [8,9].
Various drugs are commonly used to treat IBD, including sulfasalazine, aminosalicylates, steroids, immunosuppressants, and biological agents [10,11]. Nutritional therapy is increasingly being recognized as a crucial aspect of IBD management. Adequate intake of dietary fiber and consumption of tea and coffee are considered protective factors [12]. A diet rich in fruits, vegetables, n-3 fatty acids, and low levels of n-6 fatty acids may reduce the risk of CD and UC [3]. Patients with IBD are highly likely to develop avoidant or restrictive food intake disorders and sarcopenia owing to protein deficiency [3,13]. Additionally, the use of corticosteroids in patients with active IBD can exacerbate protein loss. Thus, these patients are recommended to consume high-quality protein food, with a suggested protein supplement intake of 0.3 to 0.4 g/kg per meal [14,15]. Furthermore, diets high in inflammatory potential or those containing ultra-processed foods can increase the risk of IBD [8,16]. By contrast, dietary patterns or supplements that reduce inflammation may reduce the risk of IBD.
Djulis (Chenopodium formosanum), a plant native to Taiwan and a traditional cereal of Taiwan’s aboriginal people, is often consumed with rice or taro. Djulis seeds are rich in protein and dietary fiber, and contain diverse essential amino acids, such as lysine and histidine. Djulis contains twice the lysine content found in corn and wheat, making it a cereal with high nutritional value [17]. Moreover, djulis is rich in carbohydrates, unsaturated fatty acids, minerals, and other nutrients, as well as in active compounds, such as rutin, kaempferol, quercetin, and betacyanins [17,18]. These compounds can scavenge free radicals and reduce the expression of pro-inflammatory cytokines such as tumor necrosis factor-α (TNF-α) and interleukin (IL)-1β. Owing to the presence of these compounds, djulis exhibits antioxidant [19,20,21] and anti-inflammatory properties [22,23]. A previous study reported that djulis could improve liver fibrosis and treat liver damage [24]. Two experimental studies have demonstrated that djulis and its main compounds can ameliorate fatty liver induced by high-fat diets or liquid alcohol diets in obese mice [25,26], likely because of its role in inhibiting adipogenesis [27,28]. Quinoa grains, which are compositionally similar to djulis, contain various antioxidant and anti-inflammatory polyphenols [29,30]. Cereal polyphenols have beneficial effects on the gastrointestinal tract [31]. Some studies have reported that quinoa supports digestive health and alleviates colitis caused by dextran sulfate sodium (DSS) [32]. Given that djulis has a similar composition to quinoa but contains considerably higher levels of active ingredients[33] djulis may have greater potential in preventing and alleviating colitis. Moreover, djulis has been reported to prevent and treat colon cancer in animal models, and in cell models, djulis extract has been reported to inhibit the inflammatory response of colon cancer cells [34,35]. Lee’s articles also describe the phenolic composition of djulis [34] and its nutritional composition[35].
2. Materials and Methods
2.1. Ethical Statements
The study and animal use protocols were approved by the Institutional Animal Care and Use Committee of Taipei Medical University (approval no. LAC-2021-0081) on June 6, 2021.
2.2. Materials and Experimental Drugs
The djulis used in this study was purchased from Sinfong Agritech Co. (Taipei, Taiwan). Shelled djulis were ground into powder and stored at −20 °C until use [36,37]. Djulis powder was administered to mice as part of their diet. DSS is widely used to induce intestinal inflammation in mice and can effectively mimic the inflammatory response observed in IBD, particularly in UC [38,39,40]. The molecular weight of DSS ranges from 5 to 1400 kDa. DSS with a molecular weight of 36–50 kDa is typically used to induce inflammation [41]. DSS forms nanovesicles by combining with medium-chain fatty acids in the intestine, allowing these vesicles to enter the body through the colon epithelial cells and trigger an inflammatory response [42]. The tissue characteristics and clinical symptoms of DSS-induced colitis are similar to those of UC [43]. As C57BL/6 mice are more sensitive to DSS, they are often used as the strain of choice for colitis models [44,45]. Forty 8-week-old male C57BL/6 mice were obtained from the National Laboratory Animal Center (Taipei, Taiwan). The mice were housed in well-maintained cages at a constant temperature of 21 °C and subjected to a controlled light-dark cycle. The experiments were designed in accordance with the recommended DSS dosage.
2.3. Study Design
After a 1-week adaptation period, 40 8-week-old male C57BL/6 mice were randomly divided into five groups: blank group (B), control group (C), low-dose group (L), medium-dose group (M), and high-dose group (H; Table 1). Dietary intervention was initiated at the start of the experimental period (week 0). All groups were fed AIN-93G-based standard diet. The C, L, M, and H groups received 2% DSS in their drinking water to induce colitis on days 1–5 and 10–15, and normal drinking water was provided during the intervention periods. Body weight and food and water intake were monitored and recorded throughout the evaluation period. On the 31st day, the mice were sacrificed and blood, colon, cecal content, liver, kidney, and spleen samples were collected for analysis. Figure 1 shows the experimental flowchart.
2.4. Measurement of Disease Activity Index
DSS-induced colitis in mice is characterized by clinical symptoms, such as weight loss, diarrhea, and bloody stools [46]. Disease activity index (DAI) is commonly used to evaluate the severity of intestinal inflammation in animal models. The DAI scoring system includes assessments of changes in body weight, fecal consistency, and the presence of bloody stools, each of which is rated on a scale of 0 to 4 based on severity. The total score can reach 12 [47], with higher scores indicating more severe inflammation (Table 2).
2.5. Weighing of Organs
The liver, kidneys, and spleen of mice were removed and rinsed with saline. After removing the excess water from the paper towels, the organs were weighed. In addition, the cecum content was collected, weighed, and stored in antifreeze tubes for subsequent microbiota analysis.
2.6. Histopathological Examination of the Colon
DSS-induced colitis can result in reduced colon length, mucosal epithelial cell damage, inflammatory cell infiltration, and mucosal atrophy [48]. In the present study, the colon of each mouse was removed and its length (in centimeters) was measured. A 0.5-cm section from the anal end was excised for histopathological analysis. The tissue was stained with hematoxylin and eosin stain (H&E) for scoring (Table 3). Histopathological scoring was based on the structural integrity of the crypts (0–4 points), degree of inflammatory cell infiltration (0–3 points), and depth of tissue damage (0–3 points). The total score (maximum 10 points) indicates the severity of inflammation, with higher scores representing more severe inflammation [49]. After H&E staining, the colon sections were examined under a light microscope to evaluate the mucosal morphology and tissue changes. The remaining colon was stored in antifreeze tubes for further analysis.
2.7. Analysis of Inflammation-Related Cytokines and Proteins
To enable analysis of inflammation-related cytokines, blood samples were collected from mice. The serum concentrations of TNF-α and IL-1β were measured using enzyme-linked immunosorbent assays. Proteins were extracted from the colon tissue for analysis of inflammation-related proteins. Subsequently, Western blotting was performed to determine the expression levels of cyclooxygenase-2 (COX-2), nuclear factor kappa-light-chain-enhancer of activated B cells (NF-κB), and nuclear factor of kappa light polypeptide gene enhancer in B-cell inhibitor alpha (IkBα). These protein levels were used to analyze the degree of colon inflammation [50].
2.8. Analysis of Gut Microbiota
The mouse ceca were collected and homogenized. DNA was extracted from the samples using the QIAamp Fast DNA Stool Mini Kit (Qiagen, Hilden, Germany), in accordance with the manufacturer’s instructions. Next-generation sequencing was performed to analyze the bacterial flora. The intestinal tract contains a rich and diverse microbiome, including bacteria, viruses, fungi, and protozoa, which constitute microbial flora [51]. Gut microbiota offers numerous health benefits to the host, including pathogen protection, nutritional support, metabolic improvements, and immune system enhancement. Various symbiotic interactions between the host and the microbiota are crucial for maintaining health [52]. Gut microbiota primarily comprises four bacterial phyla: Firmicutes, Bacteroidetes, Proteobacteria, and Actinobacteria [53]. Although a definitive relationship between specific bacteria and intestinal inflammation has not yet been established, studies have indicated that enteritis reduces the abundance and diversity of intestinal bacteria in mice. Enteritis mainly reduces the abundance of two major bacterial phyla, Firmicutes and Bacteroidetes, and increases the abundance of Proteobacteria. A substantial increase in the abundance of Proteobacteria is indicative of intestinal microbial dysbiosis [32,54].
2.9. Statistical Analysis
Data are presented as mean ± standard deviation (SDs). Differences between experimental groups were evaluated using one-way analysis of variance, followed by Duncan’s multiple range test. All statistical analyses were performed using the SAS software (Statistical Analysis System Institute, Cary, NC, USA). Statistical significance was set at P <.05 was considered significant.
3. Results
3.1. Body Weight, Food Intake, Water Consumption, and Food Efficiency in Mice
No significant differences were observed between the initial body weights of the mice in the B, C, L, M, and H groups. However, by the end of the study, group B had the highest final body weight among the five groups. The body weights of groups C, L, and M were significantly lower than those of group B. No significant difference in body weight was noted between groups H and B. Average weight gain was calculated by dividing the total weight gain by the number of days in the experimental period. Weight gain in group B was significantly higher than that in the other four groups. Water consumption was significantly higher in group B than in the other four groups. In terms of food intake, no significant difference was observed between groups B and C. However, groups L, M, and H had significantly lower food intake than group B, and groups M and H had significantly lower food intake than group C. Feeding efficiency was calculated by dividing the weight gain by food intake. The results revealed that group C had a significantly lower feeding efficiency than group B. Furthermore, no significant difference in feeding efficiency was observed between groups L and B (Table 4).
3.2. DAI
The results indicated that the DAI scores for group B did not increase throughout the experimental period. However, the DAI scores for the other groups peaked on the 13th day, this corresponded to the second cycle of DSS administration. The DAI scores on days 4, 8, 13, 18, 22, and 27 for groups L, M, and H were all significantly lower than those for group C. Furthermore, on day 18, the DAI score for group H was significantly lower than that for group L. By day 30, no significant differences in the DAI scores were observed among the five groups (Figure 2).
3.3. Weights of Liver, Kidney, and Spleen
The results demonstrated that the relative liver weights in group C were significantly higher than those in group B. However, groups L, M, and H had significantly lower liver weights than those in group C. Furthermore, the liver weights in groups L, M, and H did not differ significantly from those in group B (Figure 3A). Group H had a significantly lower relative kidney weight than group B, and no significant difference in the relative kidney weight was observed among the other groups (Figure 3B). This result indicates that high doses of djulis may affect kidney function. Furthermore, group C had a significantly higher relative spleen weight than that of group B. In addition, groups L, M, and H had significantly lower relative spleen weights than group C did. The relative spleen weights in groups L, M, and H did not differ significantly from those in group B (Figure 3C).
3.4. Weights of Cecum, Cecal Wall, and Cecal Contents
The experimental results indicated no significant difference in the relative total cecal weights between groups B and C, whereas group H had a significantly higher relative total cecal weight than group B (Figure 4A). The relative cecal wall weight did not differ significantly between groups B and C. However, groups L, M, and H had significantly higher relative cecal wall weights than group B (Figure 4B). Furthermore, no significant differences in relative cecal content were observed among the five groups.
3.5. Colon Length and Weight
The experimental results indicated that the colon length of mice in group B was the longest among all the groups. Groups C and L had significantly shorter colon lengths than group B. However, no significant difference in colon length was observed between groups M and H and group B. Group H had significantly longer colon lengths than group C (Figure 5A, B). The relative colon weights of mice in groups C, L, M, and H were all significantly higher than those in group B (Figure 5C). We analyzed the ratio of colon weight to colon length and found that group B had the lowest ratio among the groups. In addition, groups M and H had significantly lower ratios than group C (Figure 5D).
3.6. Histopathological Evaluation of Colon
As presented in Figure 6A, after H&E staining of colon tissue sections, the colon structure in group B appeared intact, with crypts arranged in parallel columns and no immune cell infiltration. The histological score for this group was zero, indicating no pathology. In contrast, group C exhibited damaged crypt structures, reduced goblet cells, disorganized arrangement, and immune cell infiltration. Group C had the highest histological score among the five groups, indicating that it had the most severe tissue damage. Groups L, M, and H exhibited better recovery than group C did. These groups exhibited decreased immune cell infiltration, recovery of goblet cell development, and significantly lower histological scores than group C.
3.7. Analysis of Inflammatory Cytokines
The levels of blood cytokines in each group are presented in Figure 7. Group C exhibited an increasing trend in TNF-α levels compared with group B and groups L, M, and H. However, this difference was not significant (Figure 7A). In contrast, the level of IL-1β in group C was significantly higher than that in group B. Groups M and H exhibited significantly decreased IL-1β levels compared to group C (Figure 7B).
3.8. Expression of Inflammation-Related Proteins
The expression levels of NF-κB and p-NF-κB were significantly higher in groups C and L than in group B. On the contrary, group H had significantly lower expression levels of NF-κB and p-NF-κB than group C. Furthermore, the expression levels of NF-κB and p-NF-κB did not differ significantly between groups H and B (Figure 8A and B). The expression level of IκBα was significantly higher in groups C and M than in group B, whereas group H exhibited significantly lower levels of IκBα than group C. Furthermore, the level of IκBα did not differ significantly between groups H and B (Figure 9A). The expression level of p-IκBα was significantly higher in groups C and L than in group B. Group H exhibited a significantly lower expression level of p-IκBα than did group C. Furthermore, the level of p-IκBα did not significantly differ between group H and group B. Similarly, the expression level of p-IκBα in group M was not significantly different from that in group B (Figure 9B). The expression level of COX-2 tended to be higher in groups C and L than in group B, whereas groups M and H exhibited a decreasing trend in COX-2 expression compared to group C (Figure 10).
3.9. Gut Microbiota
As presented in Figure 11, the alpha diversity and richness of the bacterial communities were assessed using the observed species, Chao1, Shannon, and Simpson indices. The results indicated that group C had significantly lower observed species and Chao1 index values than group B, whereas group H exhibited no significant difference from group B, indicating a trend toward recovery. Group B had a higher Shannon index than groups C and H; however, no significant difference was noted between groups C and H. Simpson index did not differ significantly among the three groups.
Figure 12 presents the results of the beta diversity analysis conducted using the principal coordinate analysis. The results demonstrated distinct separations in the bacterial communities among the three groups, with group H clustering closer to group B. ANOSIM analysis further confirmed significant differences in the bacterial community distributions among the three groups (Table 5).
As depicted in Figure 13, the linear discriminant analysis (LDA) effect size score was used to identify the most representative bacteria in the intestinal flora. An LDA score greater than 2 indicated a significant difference in bacterial abundance among the groups. The analysis revealed that 58 species in group B were significantly different from those in the other two groups, whereas 28 species in group C and 15 species in group H showed significant differences.
Figure 14 lists the bacterial species that were significantly more abundant in group B, including Lachnospiraceae bacterium 609, Lachnospiraceae_g_s_, Roseburia_s_, Desulfovibrio_uncultured bacterium, and Muribaculaceae_g_s.
Figure 15 lists the bacterial species that were significantly more abundant in group C, namely Coriobacteriaceae UCG-002_uncultured bacterium, Erysipelatoclostridium_s_, Parasutterella_s_, Escherichia-Shigella_s_, and Parabacteroides_s_. Figure 16 lists the bacterial species that were significantly more abundant in group H, which were primarily Lachnospiraceae NK4A136 group, Bifidobacterium_s_, Faecalibaculum_uncultured bacterium, and Muribaculum_uncultured bacterium.
4. Discussion
This study investigated the potential of whole grains to improve IBD conditions. A previous study conducted in Taiwan indicated that adopting a dietary pattern rich in whole foods might help prevent IBD or reduce its activity [55]. It is rich in nutrients and exhibits anti-inflammatory properties. In this study, djulis was confirmed to have beneficial effects on colitis in mice. One study investigated the effects of djulis hull extract [25], which is rich in rutin. In contrast, in the present study, we used whole grain djulis as feed for mice to examine its overall effect. The anti-inflammatory effects of the various parts of djulis warrant further investigation to understand their specific contributions and potential benefits.
The effects of consuming cereals, such as djulis, on COX-2, TNF-α, IL-1β, NF-kB, and IκBα in animals are worthy of discussion. An early study showed that COX-2 is involved in inflammation and promotes tumor formation and growth. COX-2 is rapidly induced by various extracellular and intracellular stimuli [56]. These stimuli include lipopolysaccharide (LPS), interleukin-1 (IL-1), tumor necrosis factor (TNF), and arachidonic acid [56]. Another recent study found that, under the stimulation of LPS and TNF-α, the secretion of IL-8 and the expression of COX-2 in HT-29 cells (human colon cancer cell line) increased significantly, showing a typical inflammatory response. Inhibition of cytokine IL-8 production can reduce the inflammatory response [57]. Whether the mechanism of the effect of djulis in reducing COX-2 is related to these mechanisms requires further study.
NF-κB, as a central regulator of the innate immune response of intestinal epithelial cells (IECs) and an important transcription factor that integrates the pro-inflammatory response to enteroinvasive bacterial infection, can be activated by a variety of stimuli such as TNF-α, IL-1, and LPS [58]. The transcriptional system in IECs plays an important role in regulating inflammation in patients with intestinal diseases [59]. It can regulate the transcription of genes related to the acute injury response and chronic intestinal inflammation, including genes related to factors such as IL-1, TNF-α, IL-6, IL-8, COX-2, and intercellular adhesion molecule -1 (ICAM-1) [57,60]. Another study showed that quinoa-derived peptides reduced NF-κB, IL-6, and IL-8 expression in colorectal cancer (CRC) cells by inhibiting histone deacetylase 1 (HDAC1) and inflammation.[61] This is similar to the results of another study that showed that rutin in djulis inhibited NF-κB activation, thereby reducing TNF-α and IL-1β levels and alleviating inflammation [24]. Djulis can reduce the degradation of IκBα, which is bound to NF-κB, and decrease the expression of pro-inflammatory cytokines [62]. Our study confirmed that djulis could reduce NF-κB, thereby reducing the inflammatory response.
A systematic review of quinoa research showed that quinoa reduced the levels of TNF-α, IL-1β, and IL-6 in both animal studies and in vitro models [63]. Quinoa can reduce inflammation. Quinoa can relieve inflammatory diseases, but its therapeutic effects on systemic inflammation require further research. The results of this systematic review are similar to those of djulis’ related study.
In addition, a study reported that a diet low in n-6 fatty acids and high in n-3 fatty acids could help reduce the risk of IBD [3]. However, djulis is rich in polyunsaturated fatty acids (PUFAs; 39.24%), with an n-6/n-3 ratio of 18.137 and a PUFA/saturated fatty acid ratio of 0.74 [64]. Although djulis contains high levels of n-6 fatty acids, its ability to reduce enteritis is not due to these fatty acids. Instead, the benefits of djulis may be associated with its high PUFA content, particularly the presence of long-chain n-3 PUFA, which can reduce the risk of UC [65]. Djulis also contains 24 bioactive compounds with multiple functions[66], such as increasing collagen production and reducing advanced glycation end-products and fatty oil droplets. The antioxidant properties of djulis may alleviate intestinal inflammation in mice [28]. Compared to quinoa, djulis contains more antioxidants and anti-inflammatory polyphenols, which likely play a crucial role in the amelioration of DSS-induced colitis in mice [32,33].
DSS was selected as the inducer of colitis in the present study. Although lipopolysaccharide (LPS) and trinitrobenzene sulfonic acid (TNBS) are both commonly used to induce enteritis in mouse models, they are associated with different types of colitis. LPS-induced colitis resembles bacterial colitis [67], whereas TNBS-induced colitis is similar to CD [68,69]. As UC is more prevalent among patients with IBD and DSS-induced colitis closely mimics UC, we used DSS as the experimental agent [40,41,42].
Djulis may alleviate DSS-induced colitis in mice through its antioxidant, anti-inflammatory, and nutritive properties. Safety concerns regarding the excessive use of djulis exist, and the appropriate dosage for humans must be carefully studied. The maximum safe dosage of djulis should be determined before its use. Some studies have indicated that high doses of djulis can lead to an increase in glutamic pyruvic transaminase levels in rats. The estimated safe daily dose for adults is 126 g for shelled djulis or 70.5 g for shelled djulis [70].
IBD is associated with intestinal dysbiosis [71]. Whether nutritional supplements can improve intestinal flora imbalance, modify bacterial populations, and alleviate symptoms is currently an area of considerable research interest. The relationship between djulis and microbiota composition is also worth exploring. In the present study, among the mice with DSS-induced colitis, those fed high doses of djulis exhibited an increase in four bacterial species during recovery: s_Lachnospiraceae NK4A136, s_Bifidobacterium, s_Faecalibactulum_uncultured bacterium, and s_Muribaculum_uncultured bacterium. The Lachnospiraceae_NK4A136 group, which is considered to have anti-inflammatory properties, has been observed to increase in mice with reduced inflammation [72,73]. The genus Bifidobacterium has also been reported to ameliorate the symptoms of IBD [74,75], and Faecalibaculum has been reported to be associated with improvements in UC [76]. Although the abundance of Muribaculum was reported to typically decrease in mice with colitis, its abundance increased as inflammation improved [77]. The ability of djulis to enhance the presence of these four bacterial species in the intestine may indirectly improve intestinal dysbiosis.
5. Conclusions
The findings of this study indicate that djulis exerts a protective effect against colitis in a DSS-induced mouse model. Colitis caused by DSS is similar to that caused by IBD, especially UC. Our results revealed that consuming djulis may help reduce inflammation and alleviate intestinal dysbiosis in mice. However, further research is required to confirm these potential benefits in humans and fully elucidate the mechanisms involved.
Author Contributions
Hsing-Jung Yeh drafted the manuscript, analyzed the data, and approved the final version of the manuscript. Hung-Ming Chao, Wei-Yu Kao, Chun-Chao Chang, and Suh-Ching Yang contributed to data analysis and approved the final version of the manuscript. Chun-Kuang Shih was responsible for the conception and design of this study. Jane C.-J. Chao and Chun-Kuang Shih were responsible for complete data analysis, critical revision of the article for key intellectual content, and correspondence regarding the final approval of the submitted version of the manuscript. No artificial intelligence software was used during the writing process, but Google Translate was used to assist with grammar modification. Finally, the paper’s grammar was revised by Wallace Academic Editing at the Taipei Medical University.
Funding
This study was funded by Taipei Medical University Hospital, and we gratefully acknowledge their support. Research Project number: 110TMU- TMUH-03-3.
Acknowledgments
The authors thank the Research Center for Digestive Medicine at Taipei Medical University for their editing support. This manuscript was edited by Wallace Academic Editing.
Conflicts of Interest
The authors declare that they have no conflicts of interest.
Abbreviations
The following abbreviations are used in this manuscript:
| MDPI | Multidisciplinary Digital Publishing Institute |
| IBD | Inflammatory bowel disease |
| DSS | Dextran sulfate sodium |
| DAI | Disease activity index |
| CD | Crohn’s disease |
| UC | Ulcerative colitis |
| TNF-α | Tumor necrosis factor-α |
| IL | Interleukin |
| LPS | Lipopolysaccharide |
| H&E stain | Hematoxylin and eosin stain |
| COX-2 | Cyclooxygenase-2 |
| NF-κB | Nuclear factor kappa-light-chain-enhancer of activated B cells |
| IkBα | Nuclear factor of kappa light polypeptide gene enhancer in B-cell inhibitor alpha |
| SDs | Standard deviations score |
| SAS | Statistical Analysis System |
| IECs | Intestinal epithelial cells |
| ICAM-1 | Intercellular adhesion molecule -1 |
| CRC | Colorectal cancer |
| HDAC1 | Histone deacetylase 1 |
| PUFAs | Polyunsaturated fatty acids |
| LPS | Lipopolysaccharide |
| TNBS | Trinitrobenzene sulfonic acid |
References
- Geboes, K.; Colombel, J.-F.; Greenstein, A.; Jewell, D.P.; Sandborn, W.J.; Vatn, M.H.; Warren, B.; Riddell, R.H. Indeterminate colitis: A review of the concept — What’s in a name? Inflammatory Bowel Diseases 2008, 14(6), 850–857. [Google Scholar] [CrossRef]
- Gyires, K.; Tóth É, V.; Zádori, S.Z. Gut inflammation: current update on pathophysiology, molecular mechanism and pharmacological treatment modalities. Curr Pharm Des 2014, 20(7), 1063–1081. [Google Scholar] [CrossRef]
- Bischoff, S.C.; Escher, J.; Hébuterne, X.; Kłęk, S.; Krznaric, Z.; Schneider, S.; Shamir, R.; Stardelova, K.; Wierdsma, N.; Wiskin, A.E. ESPEN practical guideline: Clinical Nutrition in inflammatory bowel disease. Clin Nutr 2020, 39(3), 632–653. [Google Scholar] [CrossRef] [PubMed]
- Yen, H.H.; Weng, M.T.; Tung, C.C.; Wang, Y.T.; Chang, Y.T.; Chang, C.H.; Shieh, M.J.; Wong, J.M.; Wei, S.C. Epidemiological trend in inflammatory bowel disease in Taiwan from 2001 to 2015: a nationwide populationbased study. Intest Res 2019, 17(1), 54–62. [Google Scholar] [CrossRef] [PubMed]
- Dahlhamer, J.M.; Zammitti, E.P.; Ward, B.W.; Wheaton, A.G.; Croft, J.B. Prevalence of Inflammatory Bowel Disease Among Adults Aged ≥18 Years — United States, 2015. Morbidity and Mortality Weekly Report 2016, 65, 1166–1169. [Google Scholar] [CrossRef] [PubMed]
- Kuo, C.-J.; Lin, C.-Y.; Le, P.-H.; Kuo, Y.-W.; Hsu, C.-M.; Lai, M.-W.; Lin, W.-R.; Chang, M.-L.; Su, M.-Y.; Chiu, C.-T. Temporal Trends of Inflammatory Bowel Diseases in Taiwan from 2016 to 2020: A Population-Based Study. Digestive Diseases and Sciences 2024, 1–8. [Google Scholar]
- Chiba, M.; Nakane, K.; Komatsu, M. Westernized diet is the most ubiquitous environmental factor in inflammatory bowel disease. The Permanente Journal 2019, 23. [Google Scholar] [CrossRef]
- Lo, C.-H.; Khandpur, N.; Rossato, S.L.; Lochhead, P.; Lopes, E.W.; Burke, K.E.; Richter, J.M.; Song, M.; Ardisson Korat, A.V.; Sun, Q.; et al. Ultra-processed Foods and Risk of Crohn’s Disease and Ulcerative Colitis: A Prospective Cohort Study. Clinical Gastroenterology and Hepatology 2022, 20(6), e1323–e1337. [Google Scholar] [CrossRef]
- Chen, J.; Wellens, J.; Kalla, R.; Fu, T.; Deng, M.; Zhang, H.; Yuan, S.; Wang, X.; Theodoratou, E.; Li, X. Intake of ultra-processed foods is associated with an increased risk of Crohn’s disease: a cross-sectional and prospective analysis of 187 154 participants in the UK Biobank. Journal of Crohn’s and Colitis 2023, 17(4), 535–552. [Google Scholar] [CrossRef]
- Panaccione, R.; Rutgeerts, P.; Sandborn, W.J.; Feagan, B.; Schreiber, S.; Ghosh, S. Review article: treatment algorithms to maximize remission and minimize corticosteroid dependence in patients with inflammatory bowel disease. Aliment Pharmacol Ther 2008, 28, 674–688. [Google Scholar] [CrossRef]
- Torres, J.; Chaparro, M.; Julsgaard, M.; Katsanos, K.; Zelinkova, Z.; Agrawal, M.; Ardizzone, S.; Campmans-Kuijpers, M.; Dragoni, G.; Ferrante, M.; et al. European Crohn’s and Colitis Guidelines on Sexuality, Fertility, Pregnancy, and Lactation. Journal of Crohn’s and Colitis 2022, 17(1), 1–27. [Google Scholar] [CrossRef] [PubMed]
- Mak, W.Y.; Zhao, M.; Ng, S.C.; Burisch, J. The epidemiology of inflammatory bowel disease: East meets west. Journal of Gastroenterology and Hepatology 2020, 35(3), 380–389. [Google Scholar] [CrossRef]
- Yelencich, E.; Truong, E.; Widaman, A.M.; Pignotti, G.; Yang, L.; Jeon, Y.; Weber, A.T.; Shah, R.; Smith, J.; Sauk, J.S.; et al. Avoidant Restrictive Food Intake Disorder Prevalent Among Patients With Inflammatory Bowel Disease. Clinical Gastroenterology and Hepatology 2022, 20(6), 1282–1289.e1281. [Google Scholar] [CrossRef] [PubMed]
- Cannataro, R.; Carbone, L.; Petro, J.L.; Cione, E.; Vargas, S.; Angulo, H.; Forero, D.A.; Odriozola-Martínez, A.; Kreider, R.B.; Bonilla, D.A. Sarcopenia: Etiology, Nutritional Approaches, and miRNAs. International Journal of Molecular Sciences 2021, 22(18), 9724. [Google Scholar] [CrossRef] [PubMed]
- Paddon-Jones, D.; Rasmussen, B.B. Dietary protein recommendations and the prevention of sarcopenia. Curr Opin Clin Nutr Metab Care 2009, 12(1), 86–90. [Google Scholar] [CrossRef]
- Lo, C.H.; Lochhead, P.; Khalili, H.; Song, M.; Tabung, F.K.; Burke, K.E.; Richter, J.M.; Giovannucci, E.L.; Chan, A.T.; Ananthakrishnan, A.N. Dietary Inflammatory Potential and Risk of Crohn’s Disease and Ulcerative Colitis. Gastroenterology 2020, 159(3), 873–883.e871. [Google Scholar] [CrossRef]
- Tsai, P.J.; Chen, Y.S.; Sheu, C.H.; Chen, C.Y. Effect of nanogrinding on the pigment and bioactivity of Djulis ( Chenopodium formosanum Koidz.). J Agric Food Chem 2011, 59(5), 1814–1820. [Google Scholar] [CrossRef]
- Chyau, C.-C.; Chu, C.-C.; Chen, S.-Y.; Duh, P.-D. The Inhibitory Effects of Djulis (Chenopodium formosanum) and Its Bioactive Compounds on Adipogenesis in 3T3-L1 Adipocytes. Molecules 2018, 23(7), 1780. [Google Scholar] [CrossRef] [PubMed]
- Tsai, P.-J.; Sheu, C.-H.; Wu, P.-H.; Sun, Y.-F. Thermal and pH Stability of Betacyanin Pigment of Djulis (Chenopodium formosanum) in Taiwan and Their Relation to Antioxidant Activity. Journal of Agricultural and Food Chemistry 2010, 58(2), 1020–1025. [Google Scholar] [CrossRef]
- Tsai, T.-Y.; Lin, R.-J.; Liu, C.; Tseng, Y.-P.; Chan, L.-P.; Liang, C.-H. Djulis supplementation against oxidative stress and ultraviolet radiation-induced cell damage: The influence of antioxidant status and aging of skin in healthy subjects. Journal of Cosmetic Dermatology 2022, 21(7), 2945–2953. [Google Scholar] [CrossRef]
- Chuang, K.J.; Chen, Z.J.; Cheng, C.L.; Hong, G.B. Investigation of the Antioxidant Capacity, Insecticidal Ability and Oxidation Stability of Chenopodium formosanum Seed Extract. Int J Mol Sci 2018, 19(9). [Google Scholar] [CrossRef]
- Hong, Y.-H.; Huang, Y.-L.; Liu, Y.-C.; Tsai, P.-J. Djulis (Chenopodium formosanum Koidz.) Water Extract and Its Bioactive Components Ameliorate Dermal Damage in UVB-Irradiated Skin Models. BioMed Research International 2016, 2016, 7368797. [Google Scholar] [CrossRef]
- Martinez, R.M.; Longhi-Balbinot, D.T.; Zarpelon, A.C.; Staurengo-Ferrari, L.; Baracat, M.M.; Georgetti, S.R.; Sassonia, R.C.; Verri, W.A.; Casagrande, R. Anti-inflammatory activity of betalain-rich dye of Beta vulgaris: effect on edema, leukocyte recruitment, superoxide anion and cytokine production. Archives of Pharmacal Research 2015, 38(4), 494–504. [Google Scholar] [CrossRef] [PubMed]
- Lin, T.A.; Ke, B.J.; Cheng, C.S.; Wang, J.J.; Wei, B.L.; Lee, C.L. Red Quinoa Bran Extracts Protects against Carbon Tetrachloride-Induced Liver Injury and Fibrosis in Mice via Activation of Antioxidative Enzyme Systems and Blocking TGF-β1 Pathway. Nutrients 2019, 11(2). [Google Scholar] [CrossRef]
- Tung, Y.T.; Zeng, J.L.; Ho, S.T.; Xu, J.W.; Li, S.; Wu, J.H. Anti-NAFLD Effect of Djulis Hull and Its Major Compound, Rutin, in Mice with High-Fat Diet (HFD)-Induced Obesity. Antioxidants (Basel) 2021, 10(11). [Google Scholar] [CrossRef] [PubMed]
- Lin, T.A.; Ke, B.J.; Cheng, S.C.; Lee, C.L. Red Quinoa Bran Extract Prevented Alcoholic Fatty Liver Disease via Increasing Antioxidative System and Repressing Fatty Acid Synthesis Factors in Mice Fed Alcohol Liquid Diet. Molecules 2021, 26(22). [Google Scholar] [CrossRef]
- Chyau, C.C.; Chu, C.C.; Chen, S.Y.; Duh, P.D. The Inhibitory Effects of Djulis (Chenopodium formosanum) and Its Bioactive Compounds on Adipogenesis in 3T3-L1 Adipocytes. Molecules 2018, 23(7). [Google Scholar] [CrossRef]
- Lin, Y.Y.; Lin, Y.K.; Lin, Y.H.; Chiang, C.F. Novel compounds of Djulis (Chenopodium formosanum Koidz) increases collagen, antioxidants, inhibits adipogenesis. Nat Prod Res 2023, 1–10. [Google Scholar] [CrossRef]
- Laus, M.N.; Gagliardi, A.; Soccio, M.; Flagella, Z.; Pastore, D. Antioxidant activity of free and bound compounds in quinoa (Chenopodium quinoa Willd.) seeds in comparison with durum wheat and emmer. J Food Sci 2012, 77(11), C1150–1155. [Google Scholar] [CrossRef]
- Yao, Y.; Yang, X.; Shi, Z.; Ren, G. Anti-Inflammatory Activity of Saponins from Quinoa (Chenopodium quinoa Willd.) Seeds in Lipopolysaccharide-Stimulated RAW 264.7 Macrophages Cells. Journal of Food Science 2014, 79(5), H1018–H1023. [Google Scholar] [CrossRef]
- Ed Nignpense, B.; Francis, N.; Blanchard, C.; Santhakumar, A.B. Bioaccessibility and Bioactivity of Cereal Polyphenols: A Review. Foods 2021, 10, 1595. [Google Scholar] [CrossRef]
- Liu, W.; Zhang, Y.; Qiu, B.; Fan, S.; Ding, H.; Liu, Z. Quinoa whole grain diet compromises the changes of gut microbiota and colonic colitis induced by dextran Sulfate sodium in C57BL/6 mice. Scientific Reports 2018, 8(1), 14916. [Google Scholar] [CrossRef]
- Xie, G.-R. Analysis of Phytochemicals and Fingerprintin Chenopodium formosanum (Djulis). 2017. [Google Scholar]
- Lee, C.-W.; Chen, H.-J.; Xie, G.-R.; Shih, C.-K. Djulis (Chenopodium Formosanum) Prevents Colon Carcinogenesis via Regulating Antioxidative and Apoptotic Pathways in Rats. Nutrients 2019, 11(9), 2168. [Google Scholar] [CrossRef] [PubMed]
- Lee, C.W.; Chen, H.J.; Chien, Y.H.; Hsia, S.M.; Chen, J.H.; Shih, C.K. Synbiotic Combination of Djulis (Chenopodium formosanum) and Lactobacillus acidophilus Inhibits Colon Carcinogenesis in Rats. Nutrients 2019, 12(1). [Google Scholar] [CrossRef]
- Huang, H.W.; Cheng, M.C.; Chen, B.Y.; Wang, C.Y. Effects of high pressure extraction on the extraction yield, phenolic compounds, antioxidant and anti-tyrosinase activity of Djulis hull. J Food Sci Technol 2019, 56(9), 4016–4024. [Google Scholar] [CrossRef] [PubMed]
- Chung, C.-P.; Hsu, H.-Y.; Huang, D.-W.; Hsu, H.-H.; Lin, J.-T.; Shih, C.-K.; Chiang, W. Ethyl Acetate Fraction of Adlay Bran Ethanolic Extract Inhibits Oncogene Expression and Suppresses DMH-Induced Preneoplastic Lesions of the Colon in F344 Rats through an Anti-inflammatory Pathway. Journal of Agricultural and Food Chemistry 2010, 58(13), 7616–7623. [Google Scholar] [CrossRef]
- Cochran, K.E.; Lamson, N.G.; Whitehead, K.A. Expanding the utility of the dextran sulfate sodium (DSS) mouse model to induce a clinically relevant loss of intestinal barrier function. PeerJ 2020, 8, e8681. [Google Scholar] [CrossRef]
- Chassaing, B.; Aitken, J.D.; Malleshappa, M.; Vijay-Kumar, M. Dextran sulfate sodium (DSS)-induced colitis in mice. Curr Protoc Immunol 2014, 104, 15.25.11–15.25.14. [Google Scholar] [CrossRef]
- Eichele, D.D.; Kharbanda, K.K. Dextran sodium sulfate colitis murine model: An indispensable tool for advancing our understanding of inflammatory bowel diseases pathogenesis. World J Gastroenterol 2017, 23(33), 6016–6029. [Google Scholar] [CrossRef]
- Chassaing, B.; Aitken, J.D.; Malleshappa, M.; Vijay-Kumar, M. Dextran Sulfate Sodium (DSS)-Induced Colitis in Mice. Curr Protoc Immunol 2014, 104(1), 15.25.11–15.25.14. [Google Scholar] [CrossRef]
- Laroui, H.; Ingersoll, S.A.; Liu, H.C.; Baker, M.T.; Ayyadurai, S.; Charania, M.A.; Laroui, F.; Yan, Y.; Sitaraman, S.V.; Merlin, D. Dextran sodium sulfate (DSS) induces colitis in mice by forming nano-lipocomplexes with medium-chain-length fatty acids in the colon. PLoS One 2012, 7(3), e32084. [Google Scholar] [CrossRef]
- Okayasu, I.; Hatakeyama, S.; Yamada, M.; Ohkusa, T.; Inagaki, Y.; Nakaya, R. A novel method in the induction of reliable experimental acute and chronic ulcerative colitis in mice. Gastroenterology 1990, 98(3), 694–702. [Google Scholar] [CrossRef]
- Wirtz, S.; Popp, V.; Kindermann, M.; Gerlach, K.; Weigmann, B.; Fichtner-Feigl, S.; Neurath, M.F. Chemically induced mouse models of acute and chronic intestinal inflammation. Nature Protocols 2017, 12(7), 1295–1309. [Google Scholar] [CrossRef] [PubMed]
- Chen, Z.; Yu, K.; Zhu, F.; Gorczynski, R. Over-Expression of CD200 Protects Mice from Dextran Sodium Sulfate Induced Colitis. PLoS One 2016, 11(2), e0146681. [Google Scholar] [CrossRef] [PubMed]
- Cooper, H.S.; Murthy, S.N.; Shah, R.S.; Sedergran, D.J. Clinicopathologic study of dextran sulfate sodium experimental murine colitis. Lab Invest 1993, 69(2), 238–249. [Google Scholar] [PubMed]
- Xiao, H.-T.; Lin, C.-Y.; Ho, D.H.H.; Peng, J.; Chen, Y.; Tsang, S.-W.; Wong, M.; Zhang, X.-J.; Zhang, M.; Bian, Z.-X. Inhibitory Effect of the Gallotannin Corilagin on Dextran Sulfate Sodium-Induced Murine Ulcerative Colitis. Journal of Natural Products 2013, 76(11), 2120–2125. [Google Scholar] [CrossRef]
- Au - Kim, J.J.; Au - Shajib, M.S.; Au - Manocha, M.M.; Au - Khan, W.I. Investigating Intestinal Inflammation in DSS-induced Model of IBD. JoVE 2012, 60, e3678. [Google Scholar] [CrossRef]
- Bibi, S.; Du, M.; Zhu, M.-J. Dietary Red Raspberry Reduces Colorectal Inflammation and Carcinogenic Risk in Mice with Dextran Sulfate Sodium–Induced Colitis. The Journal of Nutrition 2018, 148(5), 667–674. [Google Scholar] [CrossRef]
- Surh, Y.-J.; Chun, K.-S.; Cha, H.-H.; Han, S.S.; Keum, Y.-S.; Park, K.-K.; Lee, S.S. Molecular mechanisms underlying chemopreventive activities of anti-inflammatory phytochemicals: down-regulation of COX-2 and iNOS through suppression of NF-κB activation. Mutation Research/Fundamental and Molecular Mechanisms of Mutagenesis 2001, 480-481, 243–268. [Google Scholar] [CrossRef]
- Honda, K.; Littman, D.R. The microbiome in infectious disease and inflammation. Annu Rev Immunol 2012, 30, 759–795. [Google Scholar] [CrossRef]
- Andoh, A.; Sakata, S.; Koizumi, Y.; Mitsuyama, K.; Fujiyama, Y.; Benno, Y. Terminal restriction fragment length polymorphism analysis of the diversity of fecal microbiota in patients with ulcerative colitis. Inflammatory Bowel Diseases 2007, 13(8), 955–962. [Google Scholar] [CrossRef]
- Eckburg, P.B.; Bik, E.M.; Bernstein, C.N.; Purdom, E.; Dethlefsen, L.; Sargent, M.; Gill, S.R.; Nelson, K.E.; Relman, D.A. Diversity of the human intestinal microbial flora. Science 2005, 308(5728), 1635–1638. [Google Scholar] [CrossRef]
- Chen, H.; Xia, Y.; Zhu, S.; Yang, J.; Yao, J.; Di, J.; Liang, Y.; Gao, R.; Wu, W.; Yang, Y.; et al. Lactobacillus plantarum LP-Onlly alters the gut flora and attenuates colitis by inducing microbiome alteration in interleukin-10 knockout mice. Mol Med Rep 2017, 16(5), 5979–5985. [Google Scholar] [CrossRef] [PubMed]
- Meng, M.J.; Huang, J.; Tsou, Y.K.; Pan, Y.B.; Chiu, C.T.; Lin, Y.T.; Le, P.H. Diet and the risk of inflammatory bowel disease: A retrospective cohort study in Taiwan. Journal of the Formosan Medical Association 2024. [Google Scholar] [CrossRef] [PubMed]
- Williams, C.S.; Mann, M.; DuBois, R.N. The role of cyclooxygenases in inflammation, cancer, and development. Oncogene 1999, 18(55), 7908–7916. [Google Scholar] [CrossRef] [PubMed]
- Li, S.-C.; Hsu, W.-F.; Chang, J.-S.; Shih, C.-K. Combination of Lactobacillus acidophilus and Bifidobacterium animalis subsp. lactis Shows a Stronger Anti-Inflammatory Effect than Individual Strains in HT-29 Cells. Nutrients 2019, 11(5), 969. [Google Scholar] [CrossRef]
- Elewaut, D.; DiDonato, J.A.; Mogg Kim, J.; Truong, F.; Eckmann, L.; Kagnoff, M.F. NF-κB is a central regulator of the intestinal epithelial cell innate immune response induced by infection with enteroinvasive bacteria. The Journal of Immunology 1999, 163(3), 1457–1466. [Google Scholar] [CrossRef]
- Kim, S.W.; Kim, H.M.; Yang, K.M.; Kim, S.-A.; Kim, S.-K.; An, M.J.; Park, J.J.; Lee, S.K.; Kim, T.I.; Kim, W.H.; et al. Bifidobacterium lactis inhibits NF-κB in intestinal epithelial cells and prevents acute colitis and colitis-associated colon cancer in mice. Inflammatory Bowel Diseases 2010, 16(9), 1514–1525. [Google Scholar] [CrossRef]
- Riedel, C.U.; Foata, F.; Philippe, D.; Adolfsson, O.; Eikmanns, B.J.; Blum, S. Anti-inflammatory effects of bifidobacteria by inhibition of LPS-induced NF-κB activation. World journal of gastroenterology: WJG 2006, 12(23), 3729. [Google Scholar] [CrossRef]
- Fan, X. Study on bioactivities of quinoa-derived peptides in alleviating intestinal diseases and their physicochemical properties; Universite de Liege (Belgium), 2023. [Google Scholar]
- Huang, Y.-C.; Tung, C.-L.; Ho, S.-T.; Li, W.-S.; Li, S.; Tung, Y.-T.; Wu, J.-H. Nutraceutical Potential of Djulis (Chenopodium formosanum) Hull: Phytochemicals, Antioxidant Activity, and Liver Protection. Antioxidants 2024, 13(6), 721. [Google Scholar] [CrossRef]
- Malek Mahdavi, A.; Javadivala, Z.; Khalili, Y.; Khalili, M. Effects of Quinoa (Chenopodium quinoa) on inflammatory mediators: a systematic review of preclinical studies. Inflammopharmacology 2023, 31(1), 241–251. [Google Scholar] [CrossRef]
- Ker, Y.B.; Wu, H.L.; Chen, K.C.; Peng, R.Y. Nutrient composition of Chenopodium formosanum Koidz. bran: Fractionation and bioactivity of its soluble active polysaccharides. PeerJ 2022, 10, e13459. [Google Scholar] [CrossRef]
- Ananthakrishnan, A.N.; Khalili, H.; Konijeti, G.G.; Higuchi, L.M.; Silva, P. d.; Fuchs, C.S.; Willett, W.C.; Richter, J.M.; Chan, A.T. Long-term intake of dietary fat and risk of ulcerative colitis and Crohn’s disease. Gut 2014, 63(5), 776–784. [Google Scholar] [CrossRef]
- Lin, Y.Y.; Lin, Y.K.; Lin, Y.H.; Chiang, C.F. Novel compounds of Djulis (Chenopodium formosanum Koidz) increases collagen, antioxidants, inhibits adipogenesis. Nat Prod Res 2024, 38(16), 2763–2772. [Google Scholar] [CrossRef] [PubMed]
- Candelli, M.; Franza, L.; Pignataro, G.; Ojetti, V.; Covino, M.; Piccioni, A.; Gasbarrini, A.; Franceschi, F. Interaction between Lipopolysaccharide and Gut Microbiota in Inflammatory Bowel Diseases. International Journal of Molecular Sciences 2021, 22(12), 6242. [Google Scholar] [CrossRef] [PubMed]
- Antoniou, E.; Margonis, G.A.; Angelou, A.; Pikouli, A.; Argiri, P.; Karavokyros, I.; Papalois, A.; Pikoulis, E. The TNBS-induced colitis animal model: An overview. Ann Med Surg (Lond) 2016, 11, 9–15. [Google Scholar] [CrossRef] [PubMed]
- Jiang, C.; Zhu, P.; Shi, Y.; Xiang, W.; Ge, S.; Zhang, Z.; Zuo, L. Protective effect of procyanidin B2 on intestinal barrier and against enteritis in a mouse model of trinitrobenzene sulphonic acid-induced colitis. Nan Fang Yi Ke Da Xue Xue Bao 2019, 39(7), 778–783. [Google Scholar] [CrossRef]
- TuzzYing, S.T.S.; RongRong, C.R.C.; JiunnWang, L.J.L.; ChenI, C.C.C.; ChienLin, C.C.C.; ChiuYuan, C.C.C. Safety assessment of whole and hulled Djulis (Chenopodium formosanum Koidz); publisher location: Taipei.
- publisher name: Agricultural Chemical Society of Taiwan and Taiwan Association for Food Science and Technology.
- Morgan, X.C.; Tickle, T.L.; Sokol, H.; Gevers, D.; Devaney, K.L.; Ward, D.V.; Reyes, J.A.; Shah, S.A.; LeLeiko, N.; Snapper, S.B. Dysfunction of the intestinal microbiome in inflammatory bowel disease and treatment. Genome biology 2012, 13, 1–18. [Google Scholar] [CrossRef]
- Dou, X.; Gao, N.; Yan, D.; Shan, A. Sodium Butyrate Alleviates Mouse Colitis by Regulating Gut Microbiota Dysbiosis. Animals 2020, 10(7), 1154. [Google Scholar] [CrossRef]
- Zhou, Q.; Ma, L.; Zhao, W.; Zhao, W.; Han, X.; Niu, J.; Li, R.; Zhao, C. Flaxseed oil alleviates dextran sulphate sodium-induced ulcerative colitis in rats. Journal of Functional Foods 2020, 64, 103602. [Google Scholar] [CrossRef]
- Yao, S.; Zhao, Z.; Wang, W.; Liu, X. Bifidobacterium longum: protection against inflammatory bowel disease. Journal of immunology research 2021, 2021(1), 8030297. [Google Scholar] [CrossRef]
- Ishikawa, H.; Matsumoto, S.; Ohashi, Y.; Imaoka, A.; Setoyama, H.; Umesaki, Y.; Tanaka, R.; Otani, T. Beneficial effects of probiotic bifidobacterium and galacto-oligosaccharide in patients with ulcerative colitis: a randomized controlled study. Digestion 1955, 84(2), 128–133. [Google Scholar] [CrossRef] [PubMed]
- Liu, L.; Chen, X.; Zhang, C.; Deng, J.; Xiao, H.; Rao, Y. Lactiplantibacillus biofilm and planktonic cells ameliorate ulcerative colitis in mice via immunoregulatory activity, gut metabolism and microbiota modulation. Food & Function 2023, 14(20), 9181–9193. [Google Scholar] [CrossRef] [PubMed]
- Xu, H.-M.; Huang, H.-L.; Xu, J.; He, J.; Zhao, C.; Peng, Y.; Zhao, H.-L.; Huang, W.-Q.; Cao, C.-Y.; Zhou, Y.-J. Cross-talk between butyric acid and gut microbiota in ulcerative colitis following fecal microbiota transplantation. Frontiers in microbiology 2021, 12, 658292. [Google Scholar] [CrossRef] [PubMed]
Figure 1.
Experimental flowchart.
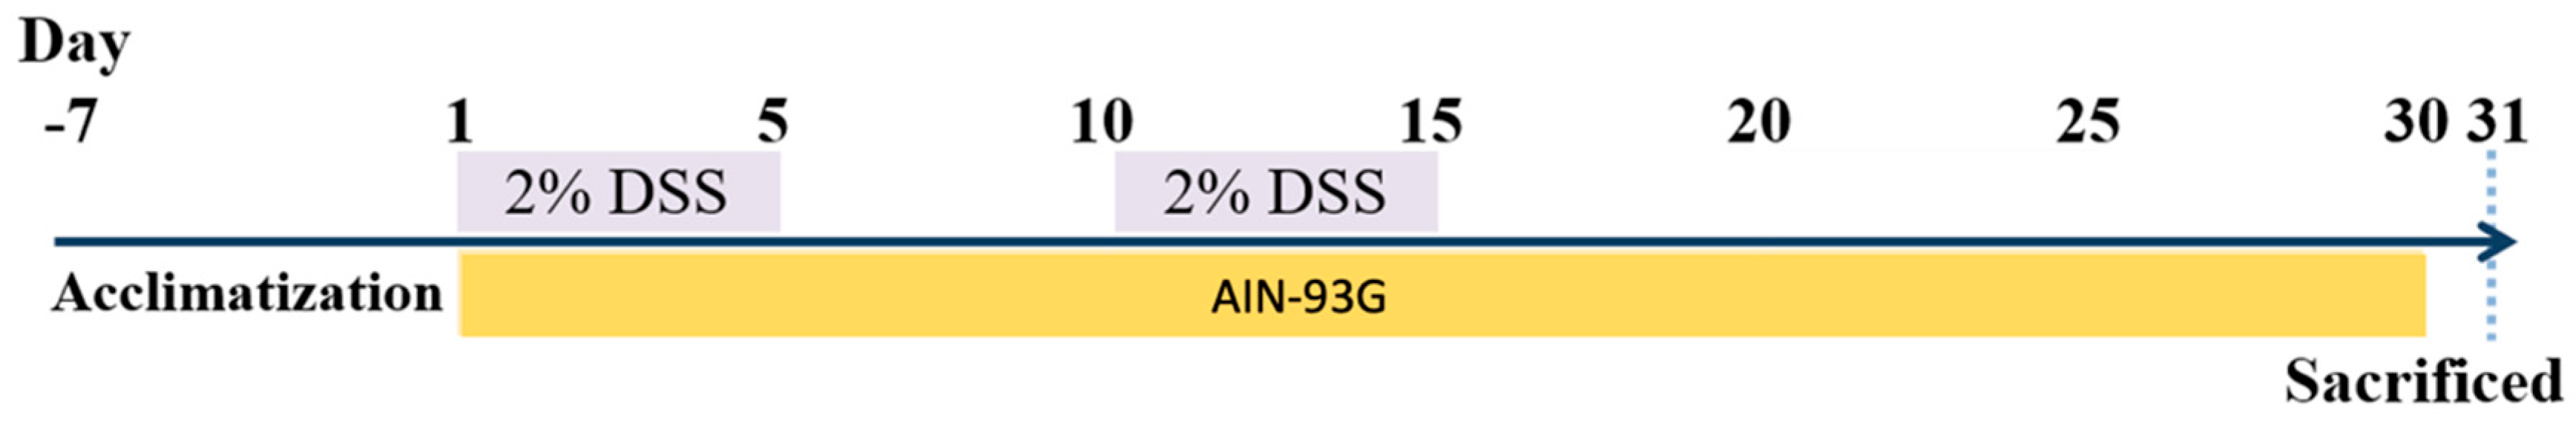
Figure 2.
Effects of djulis on disease activity index (DAI) in DSS-induced chronic colitic mice. Data are presented as means ± SDs (n = 8). All groups, with the exception of group B, were administered DSS. Groups B and C: AIN-93G diet; Group L: AIN-93G diet containing 5% djulis; Group M: AIN-93G diet containing 10% djulis; Group H: AIN-93G diet containing 15% djulis. An asterisk (*) indicates a significant difference when compared with group B. A hashtag (#) indicates a significant difference when compared with group C. An ampersand (&) indicates a significant difference when compared with group L.
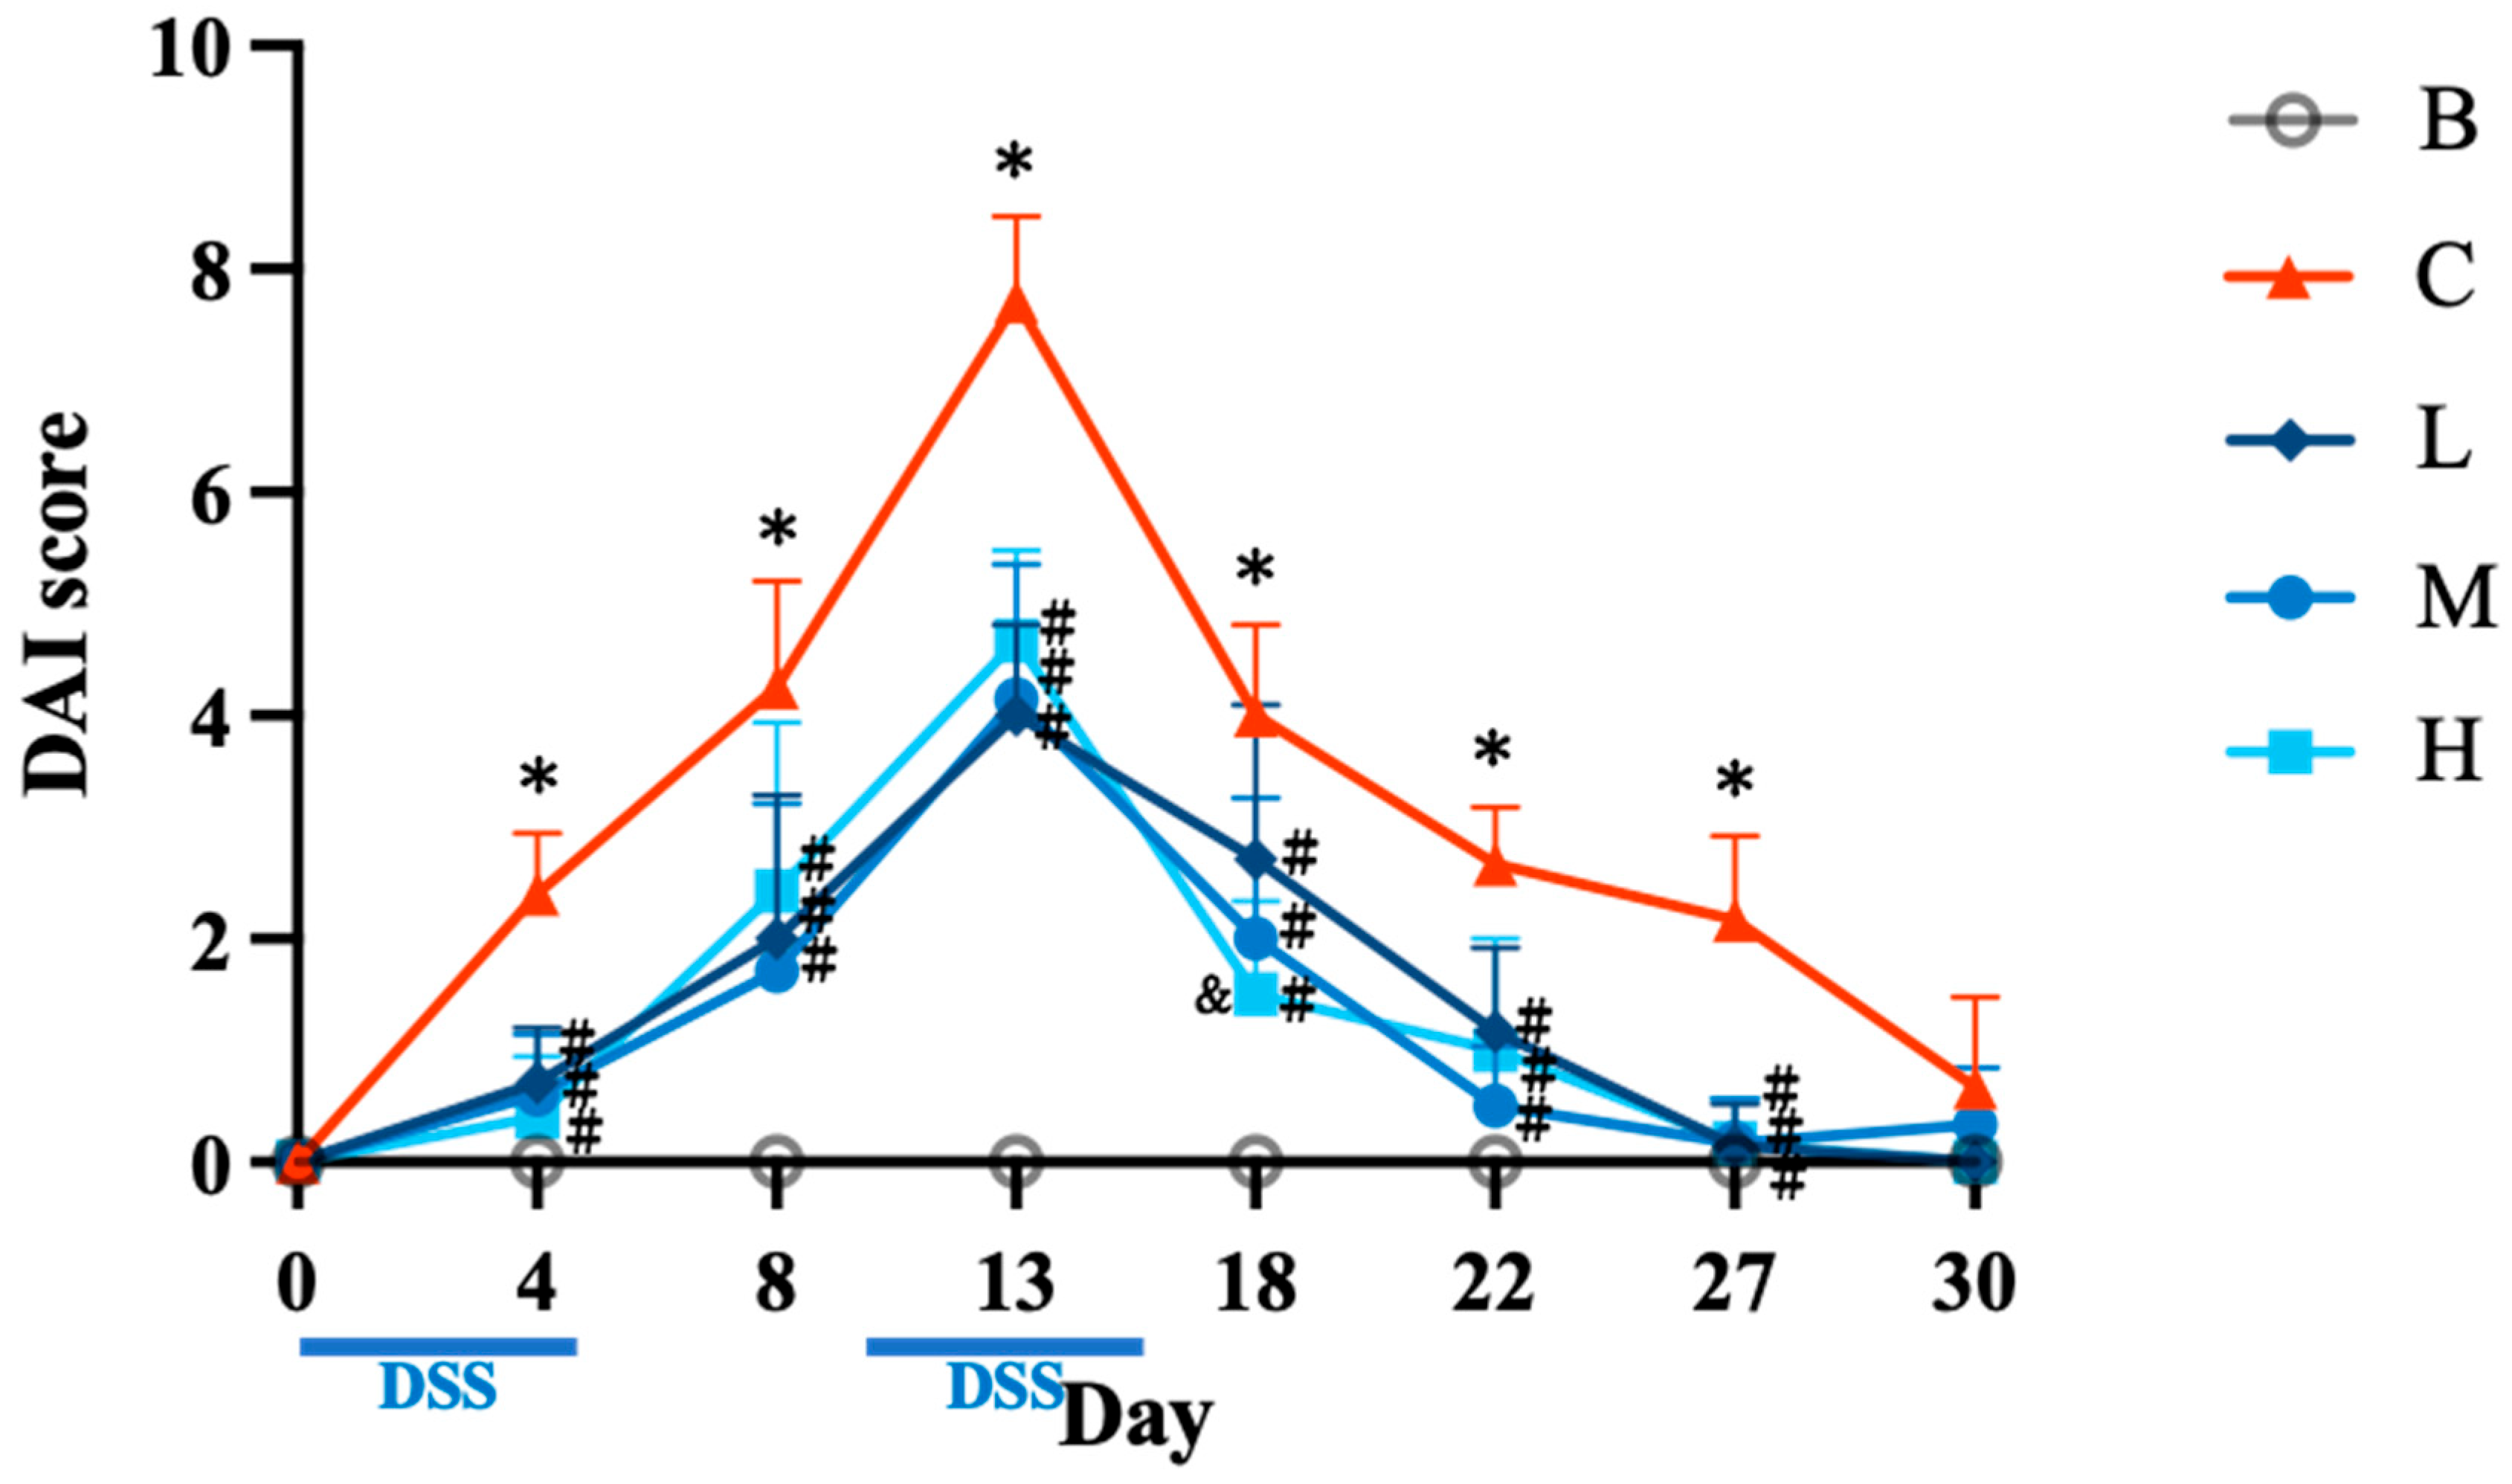
Figure 3.
Effects of djulis on relative liver weight (A), relative kidney weight (B), and relative spleen weight (C) in DSS-induced chronic colitic mice. Data are presented as means ± SDs (n = 8). All groups, with the exception of group B, were administered DSS. Groups B and C: AIN-93G diet; Group L: AIN-93G diet containing 5% djulis; Group M: AIN-93G diet containing 10% djulis; and Group H: AIN- 93G diet containing 15% djulis. Values with the same letter within a column are not significantly different from one another, as determined using ANOVA and Tukey’s range test, P < .05.
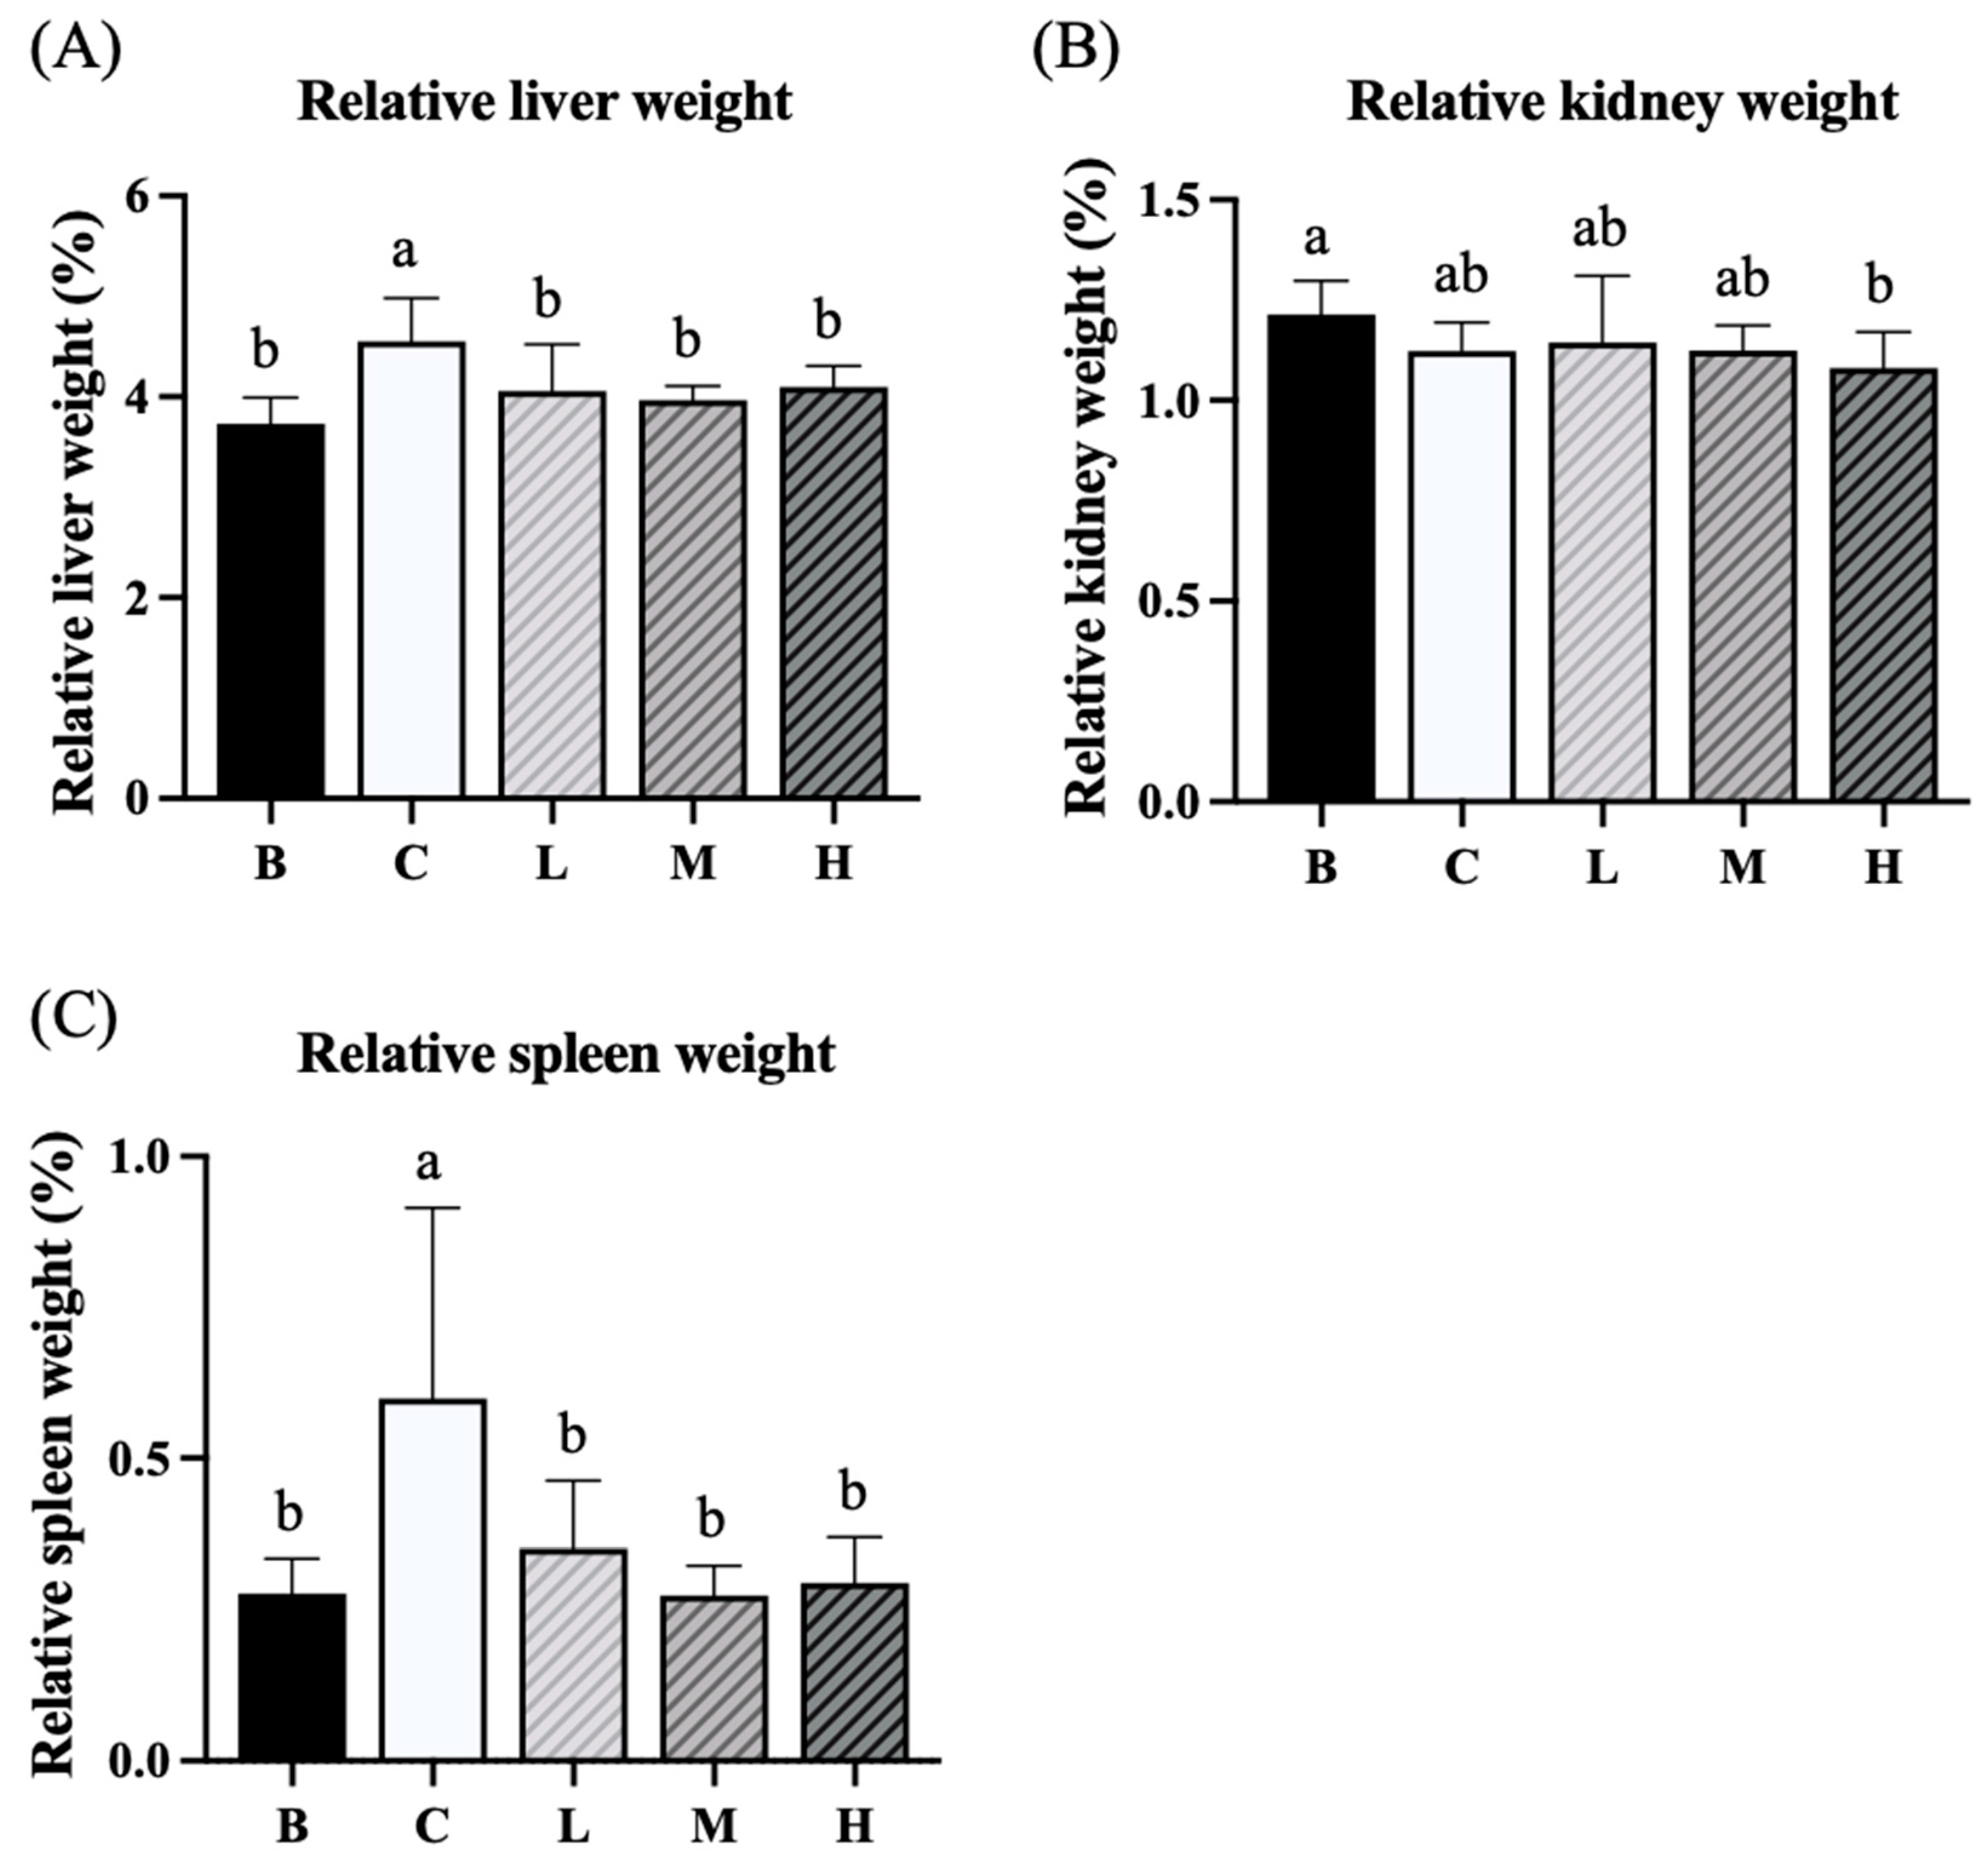
Figure 4.
Effects of djulis on relative total cecum weight (A), relative cecum wall weight (B), and relative cecum content weight (C) in DSS-induced chronic colitic mice. Data are presented as means ± SDs (n = 8). All groups, with the exception of group B, were administered DSS. Groups B and C: AIN-93G diet; Group L: AIN-93G diet containing 5% djulis; Group M: AIN-93G diet containing 10% djulis; and Group H: AIN- 93G diet containing 15% djulis. Values with the same letter within a column are not significantly different from one another, as determined using ANOVA and Tukey’s range test, P < .05.
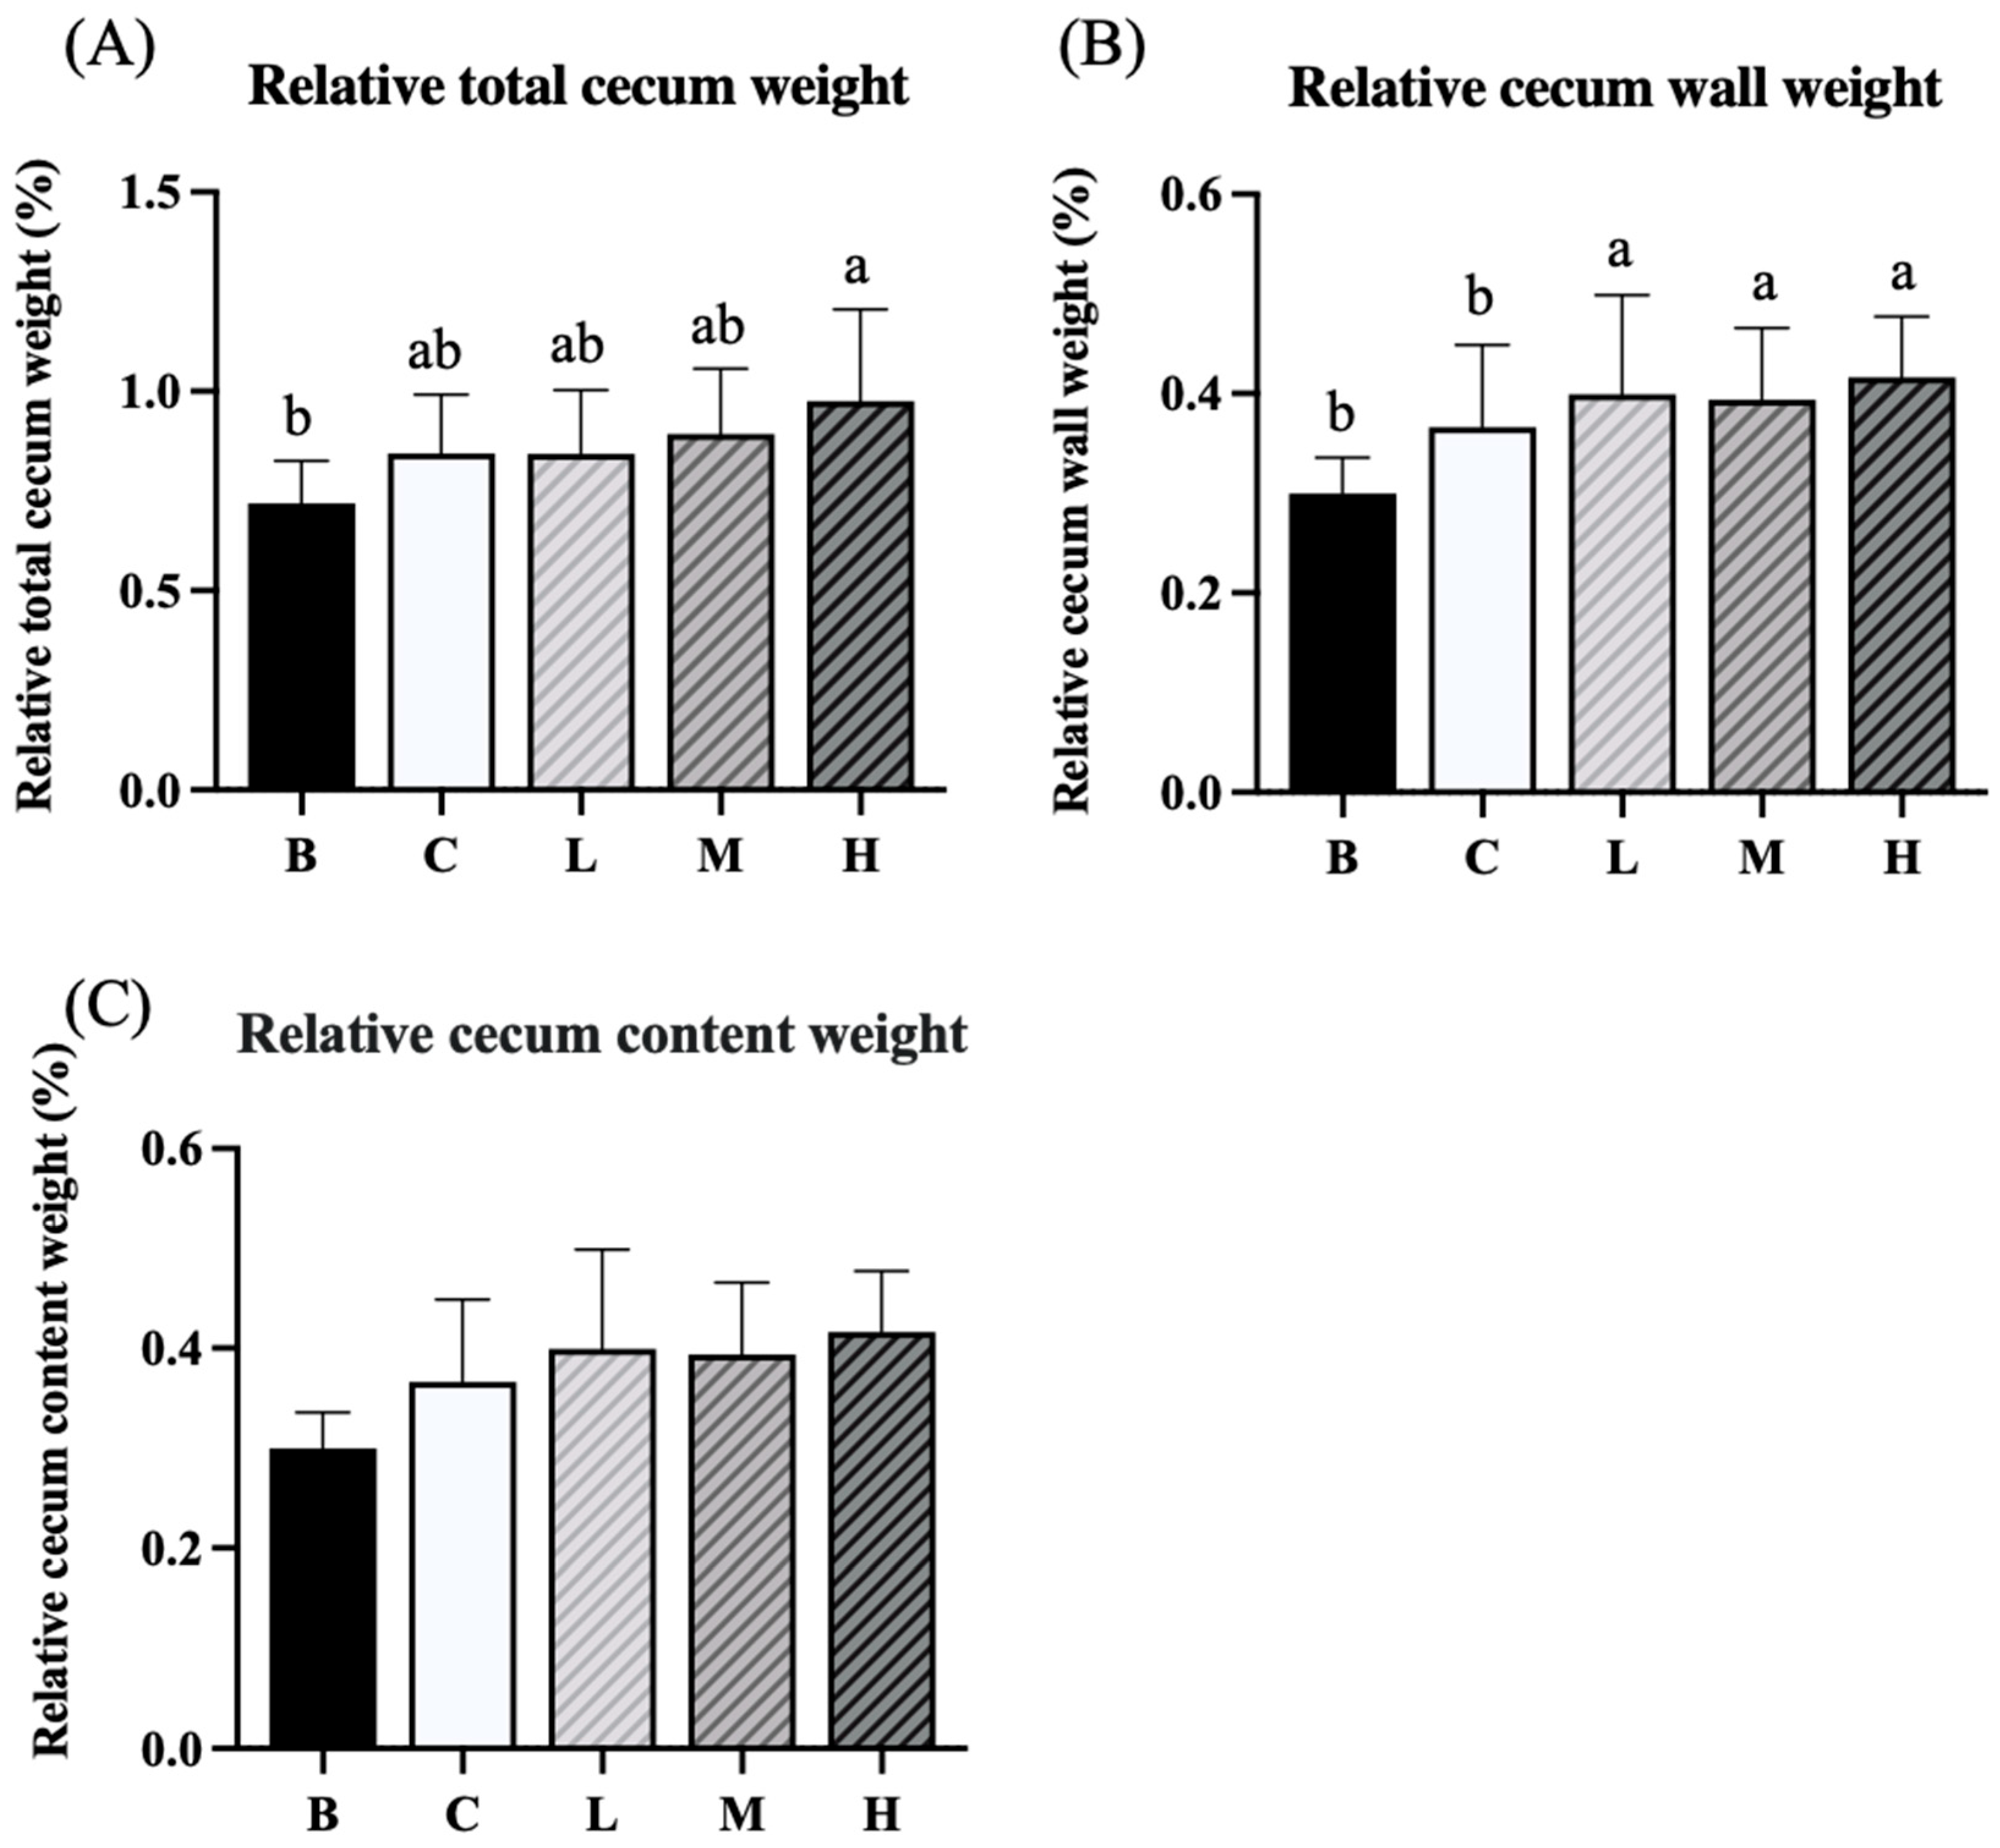
Figure 5.
Effects of djulis on representative photographs of colon (A), colon length (B), relative colon weight (C), and colon weight/length ratio (D) in DSS-induced chronic colitic mice. Data are presented as means ± SDs (n = 8). All groups, with the exception of group B, were administered DSS. Groups B and C: AIN-93G diet; Group L: AIN-93G diet containing 5% djulis; Group M: AIN-93G diet containing 10% djulis; and Group H: AIN- 93G diet containing 15% djulis. Values with the same letter within a column are not significantly different from one another, as determined using ANOVA and Tukey’s range test, P < .05.
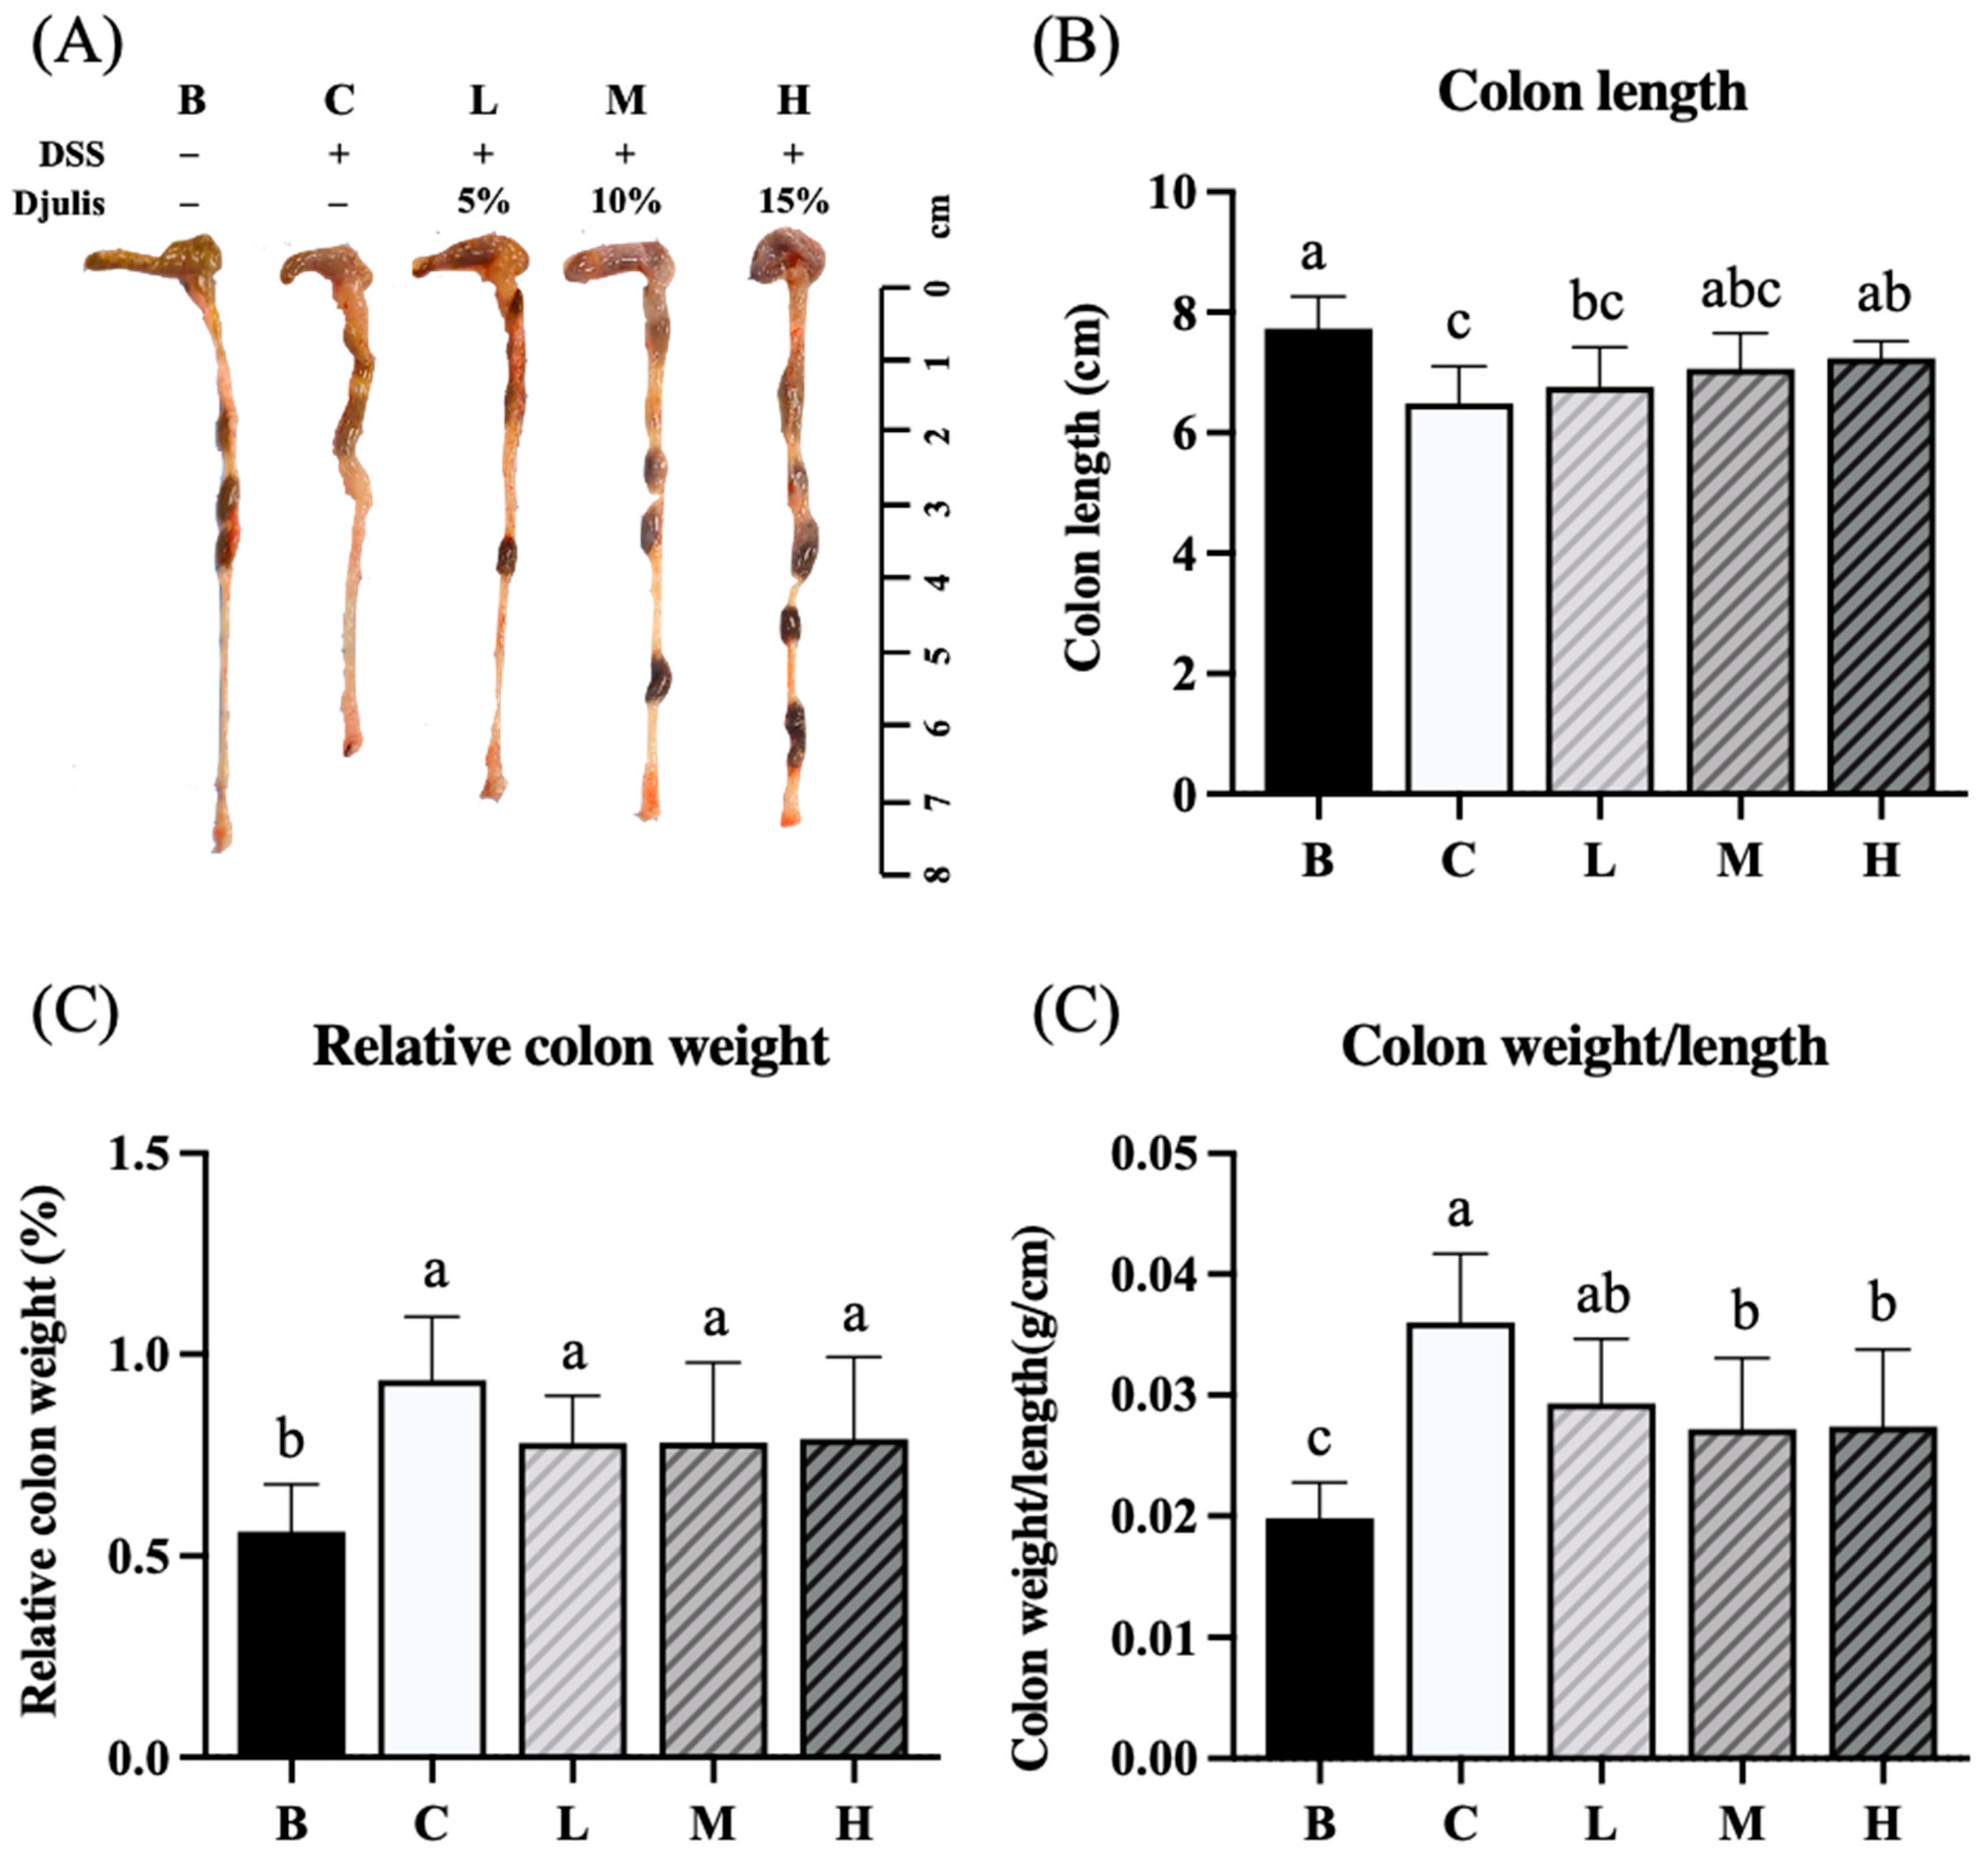
Figure 6.
Effects of djulis on histopathological changes in DSS-induced chronic colitic mice. (A) H&E-stained sections of the colon (100×). (B) Histological score. Data are presented as means ± SDs (n = 8). All groups, with the exception of group B, were administered DSS. Groups B and C: AIN-93G diet; Group L: AIN-93G diet containing 5% djulis; Group M: AIN-93G diet containing 10% djulis; and Group H: AIN- 93G diet containing 15% djulis. Values with the same letter within a column are not significantly different from one another, as determined using ANOVA and Tukey’s range test, P < .05.
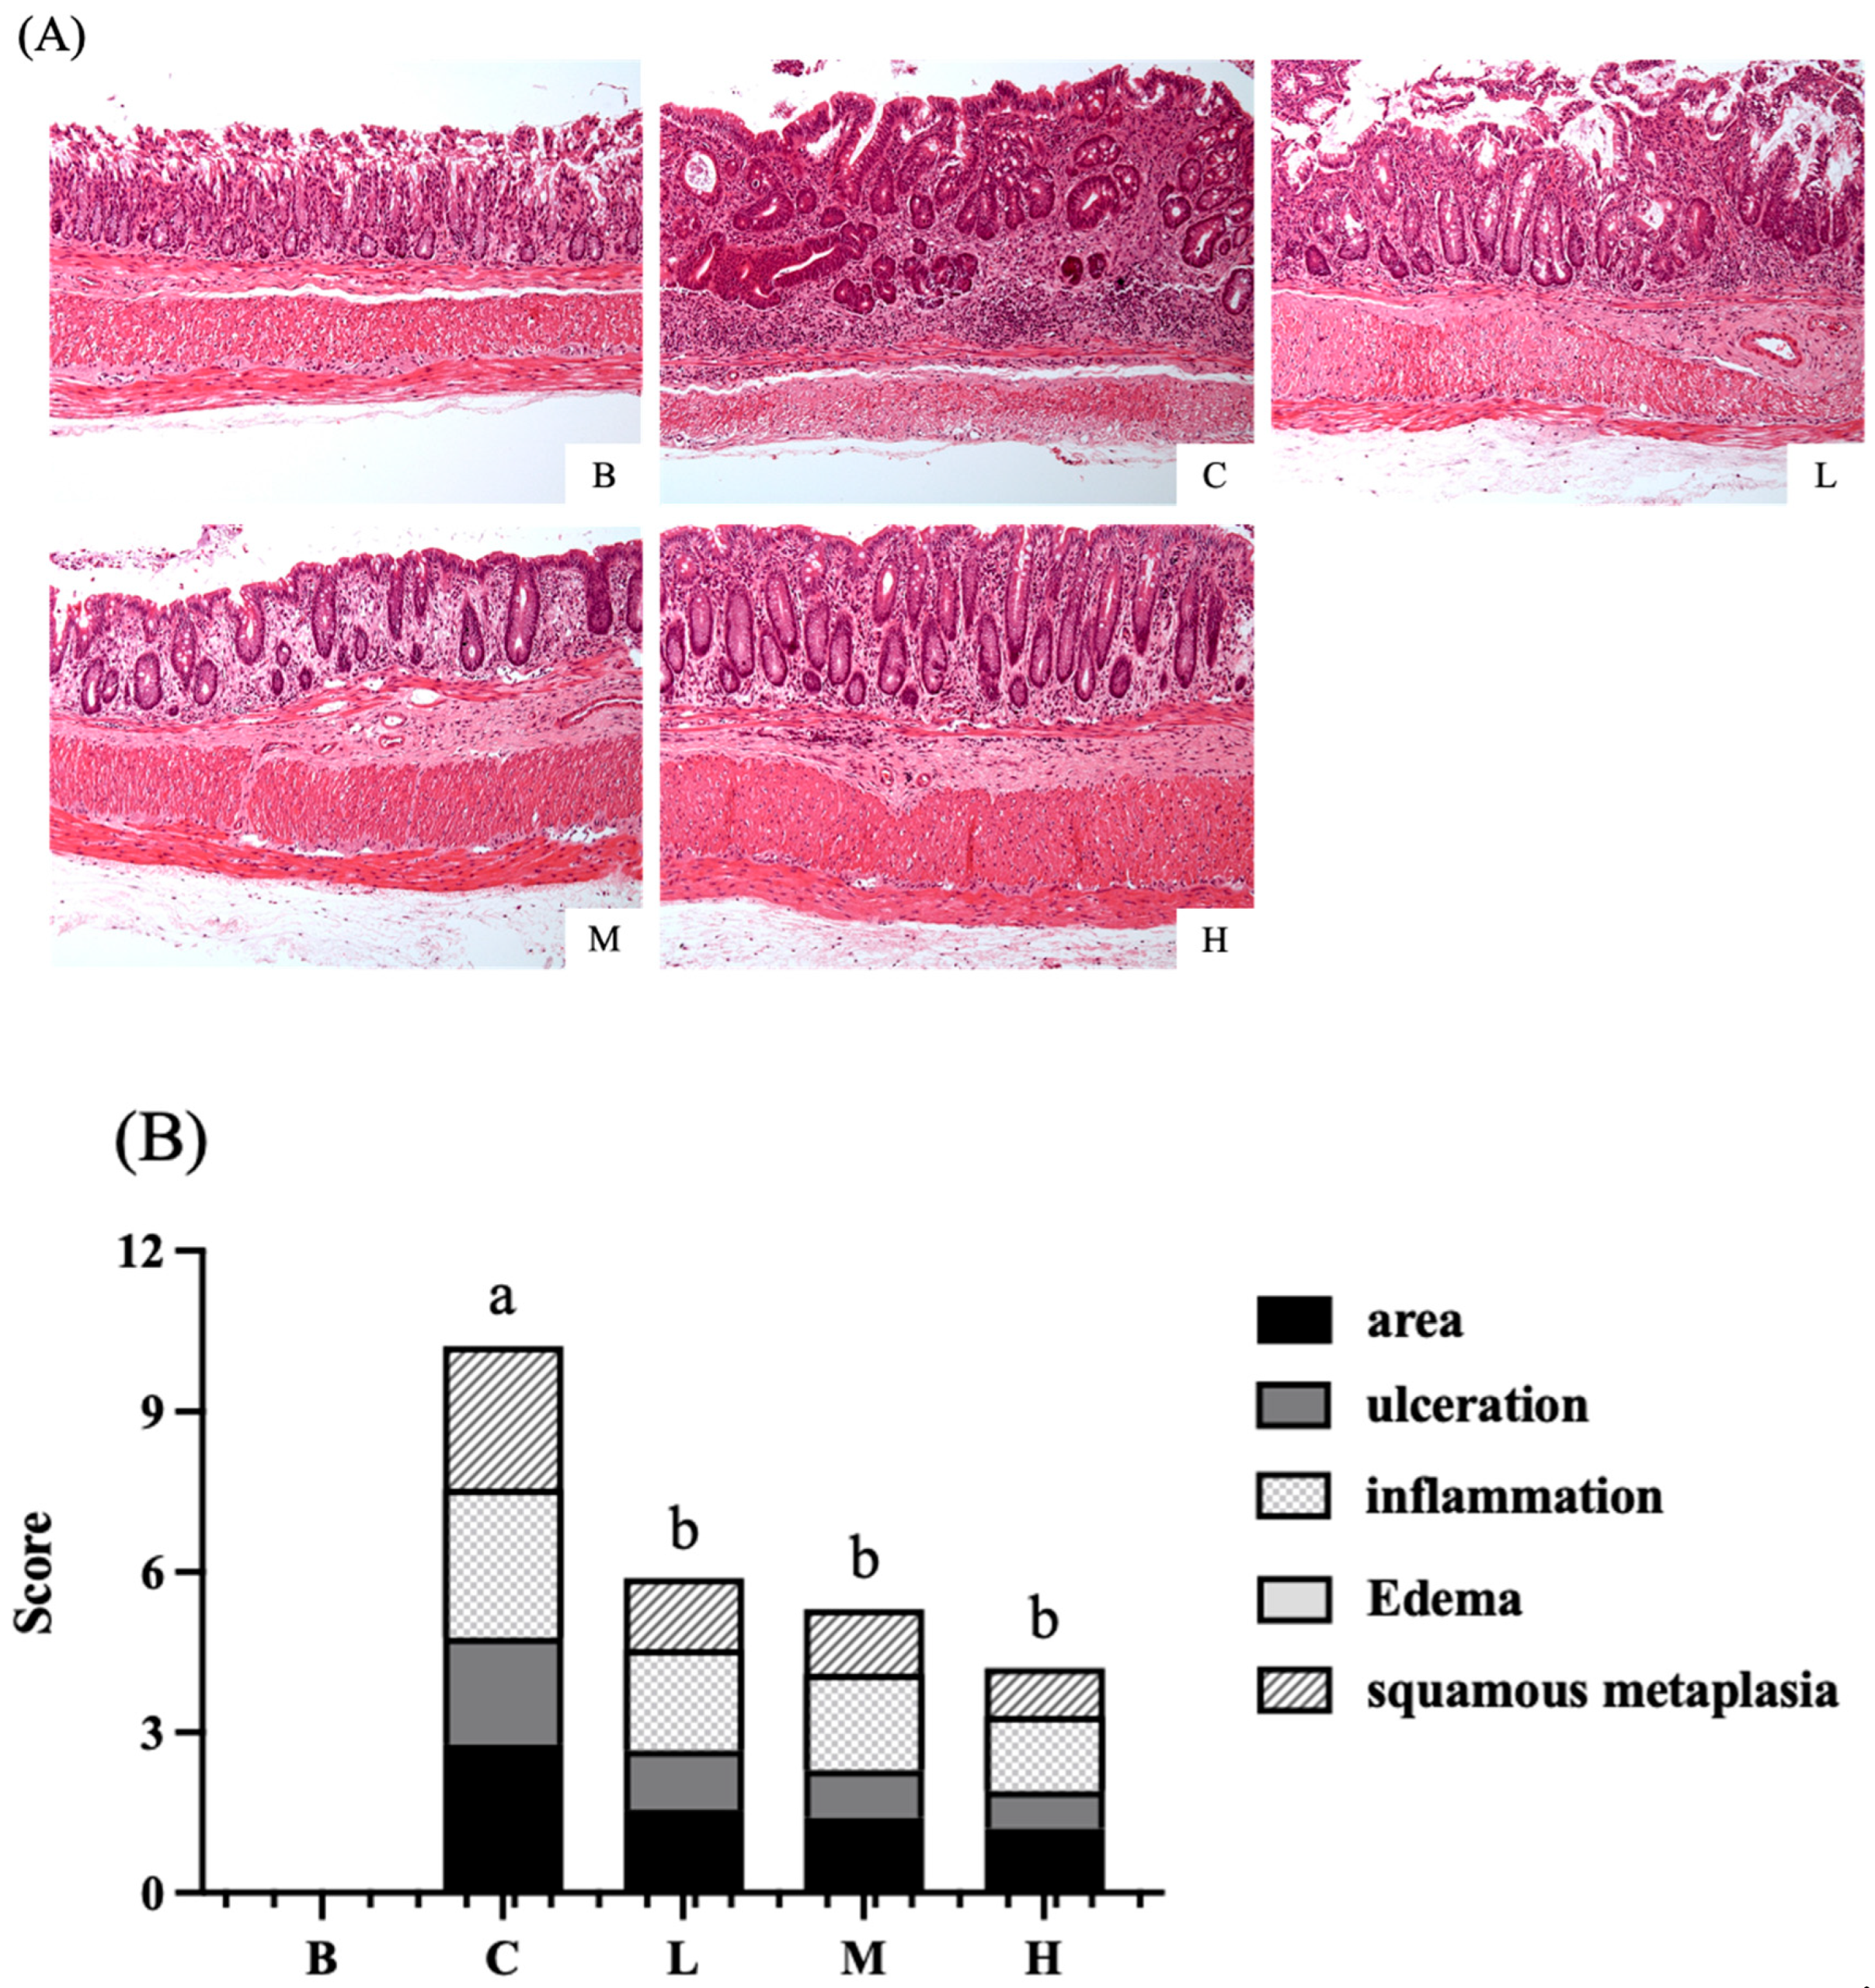
Figure 7.
Effects of djulis on cytokines in DSS-induced chronic colitic mice. (A) TNF-α. (B) IL-1β. Data are presented as means ± SDs (n = 8). All groups, with the exception of group B, were administered DSS. Groups B and C: AIN-93G diet; Group L: AIN-93G diet containing 5% djulis; Group M: AIN-93G diet containing 10% djulis; and Group H: AIN- 93G diet containing 15% djulis. Values with the same letter within a column are not significantly different from one another, as determined using ANOVA and Tukey’s range test, P < .05.
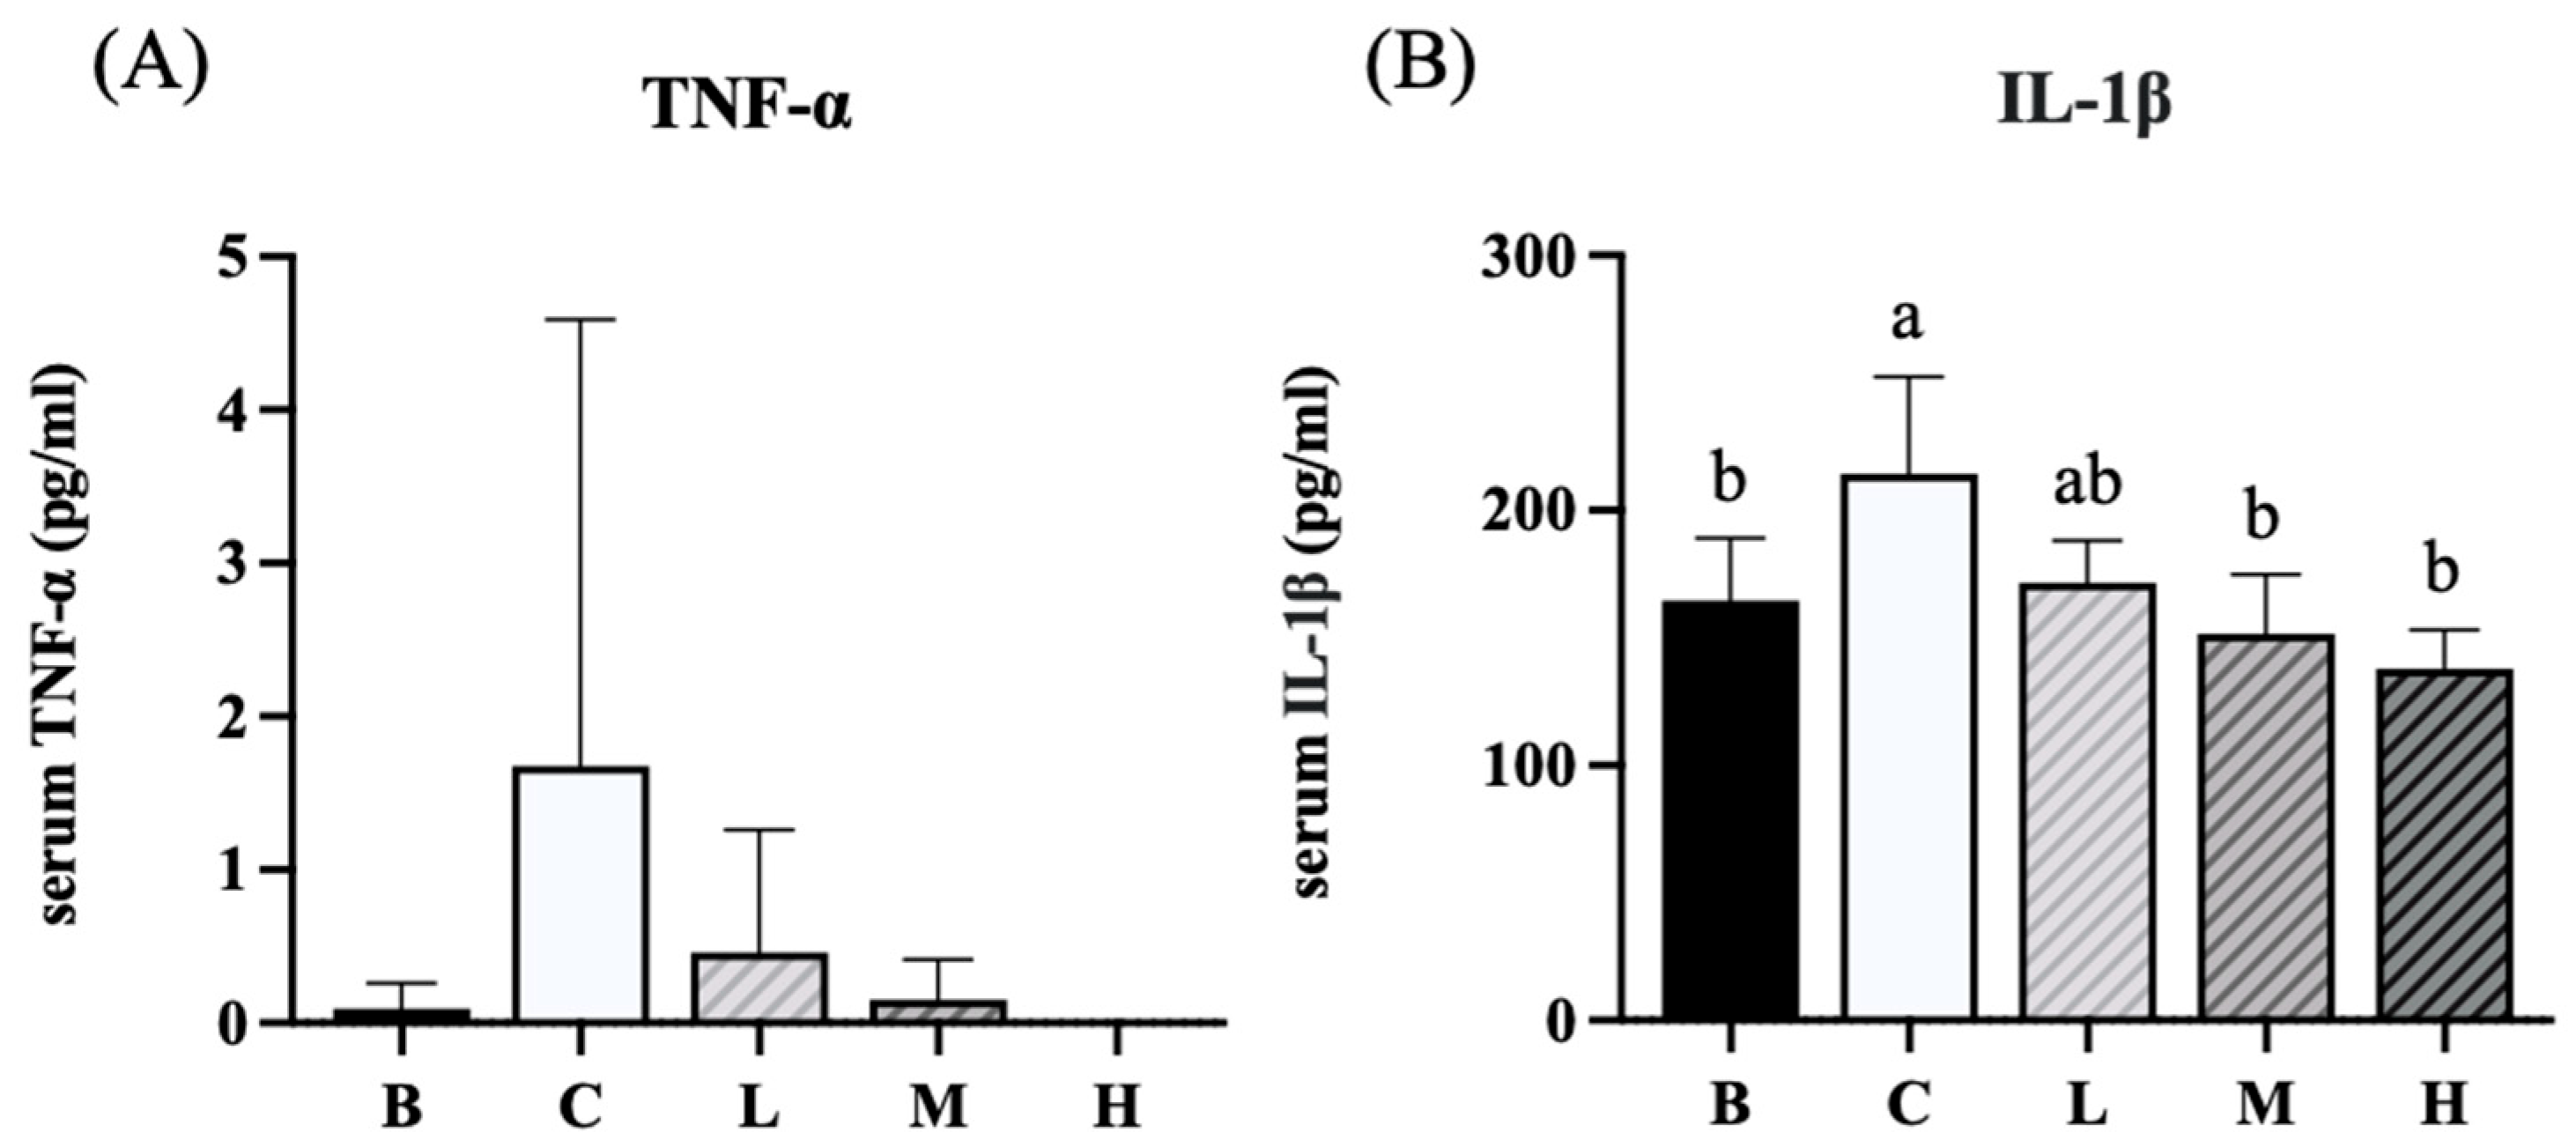
Figure 8.
Effects of djulis on colon NF-κB and p-NF-κB protein expression in DSS-induced chronic colitic mice. (A) NF-κB. (B) p-NF-κB. Data are presented as means ± SDs (n = 3 to 4). All groups, except group B, were administered DSS. Groups B and C: AIN-93G diet; Group L: AIN-93G diet containing 5% djulis; Group M: AIN-93G diet containing 10% djulis; and Group H: AIN- 93G diet containing 15% djulis. Values with the same letter within a column are not significantly different from one another, as determined using ANOVA and Tukey’s range test, P < .05.
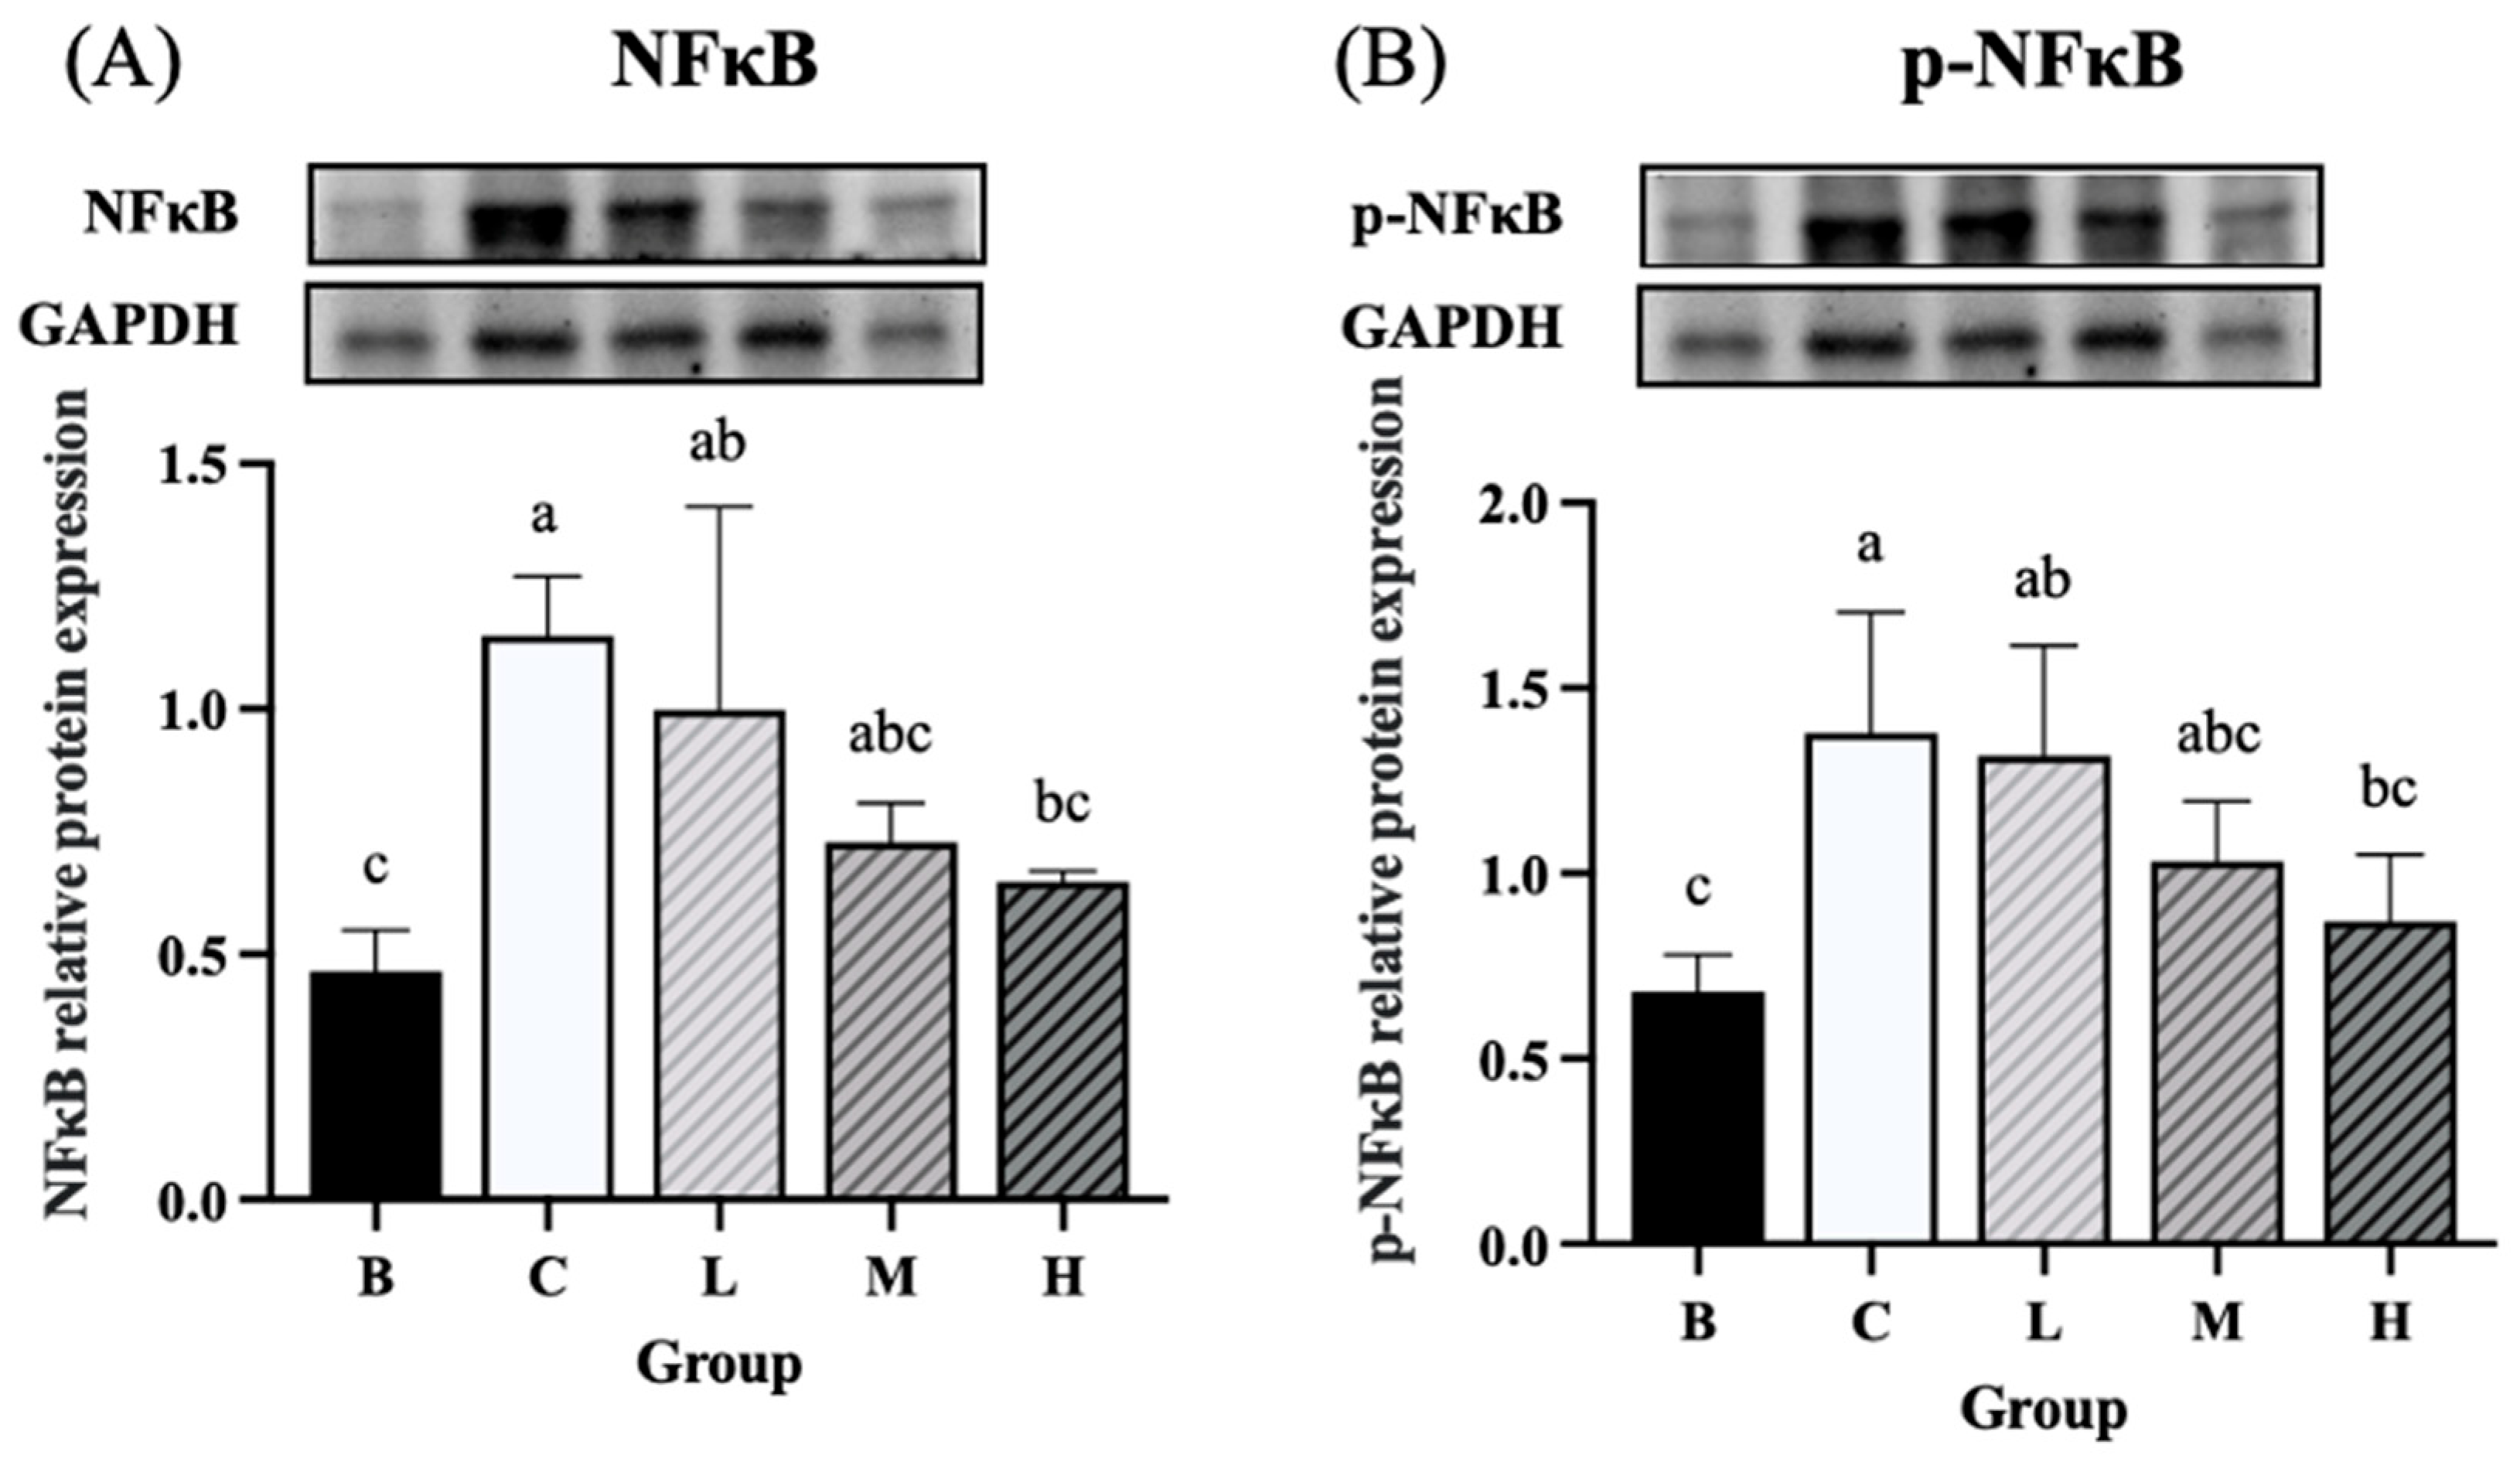
Figure 9.
Effects of djulis on colon IκBα and p-IκBα protein expression in DSS-induced chronic colitic mice. (A) IκBα. (B) p-IκBα. Data are presented as means ± SDs (n = 3 to 4). All groups, with the exception of group B, were administered DSS. Groups B and C: AIN-93G diet; Group L: AIN-93G diet containing 5% djulis; Group M: AIN-93G diet containing 10% djulis; and Group H: AIN-93G diet containing 15% djulis. Values with the same letter within a column are not significantly different from one another, as determined using ANOVA and Tukey’s range test, P < .05.
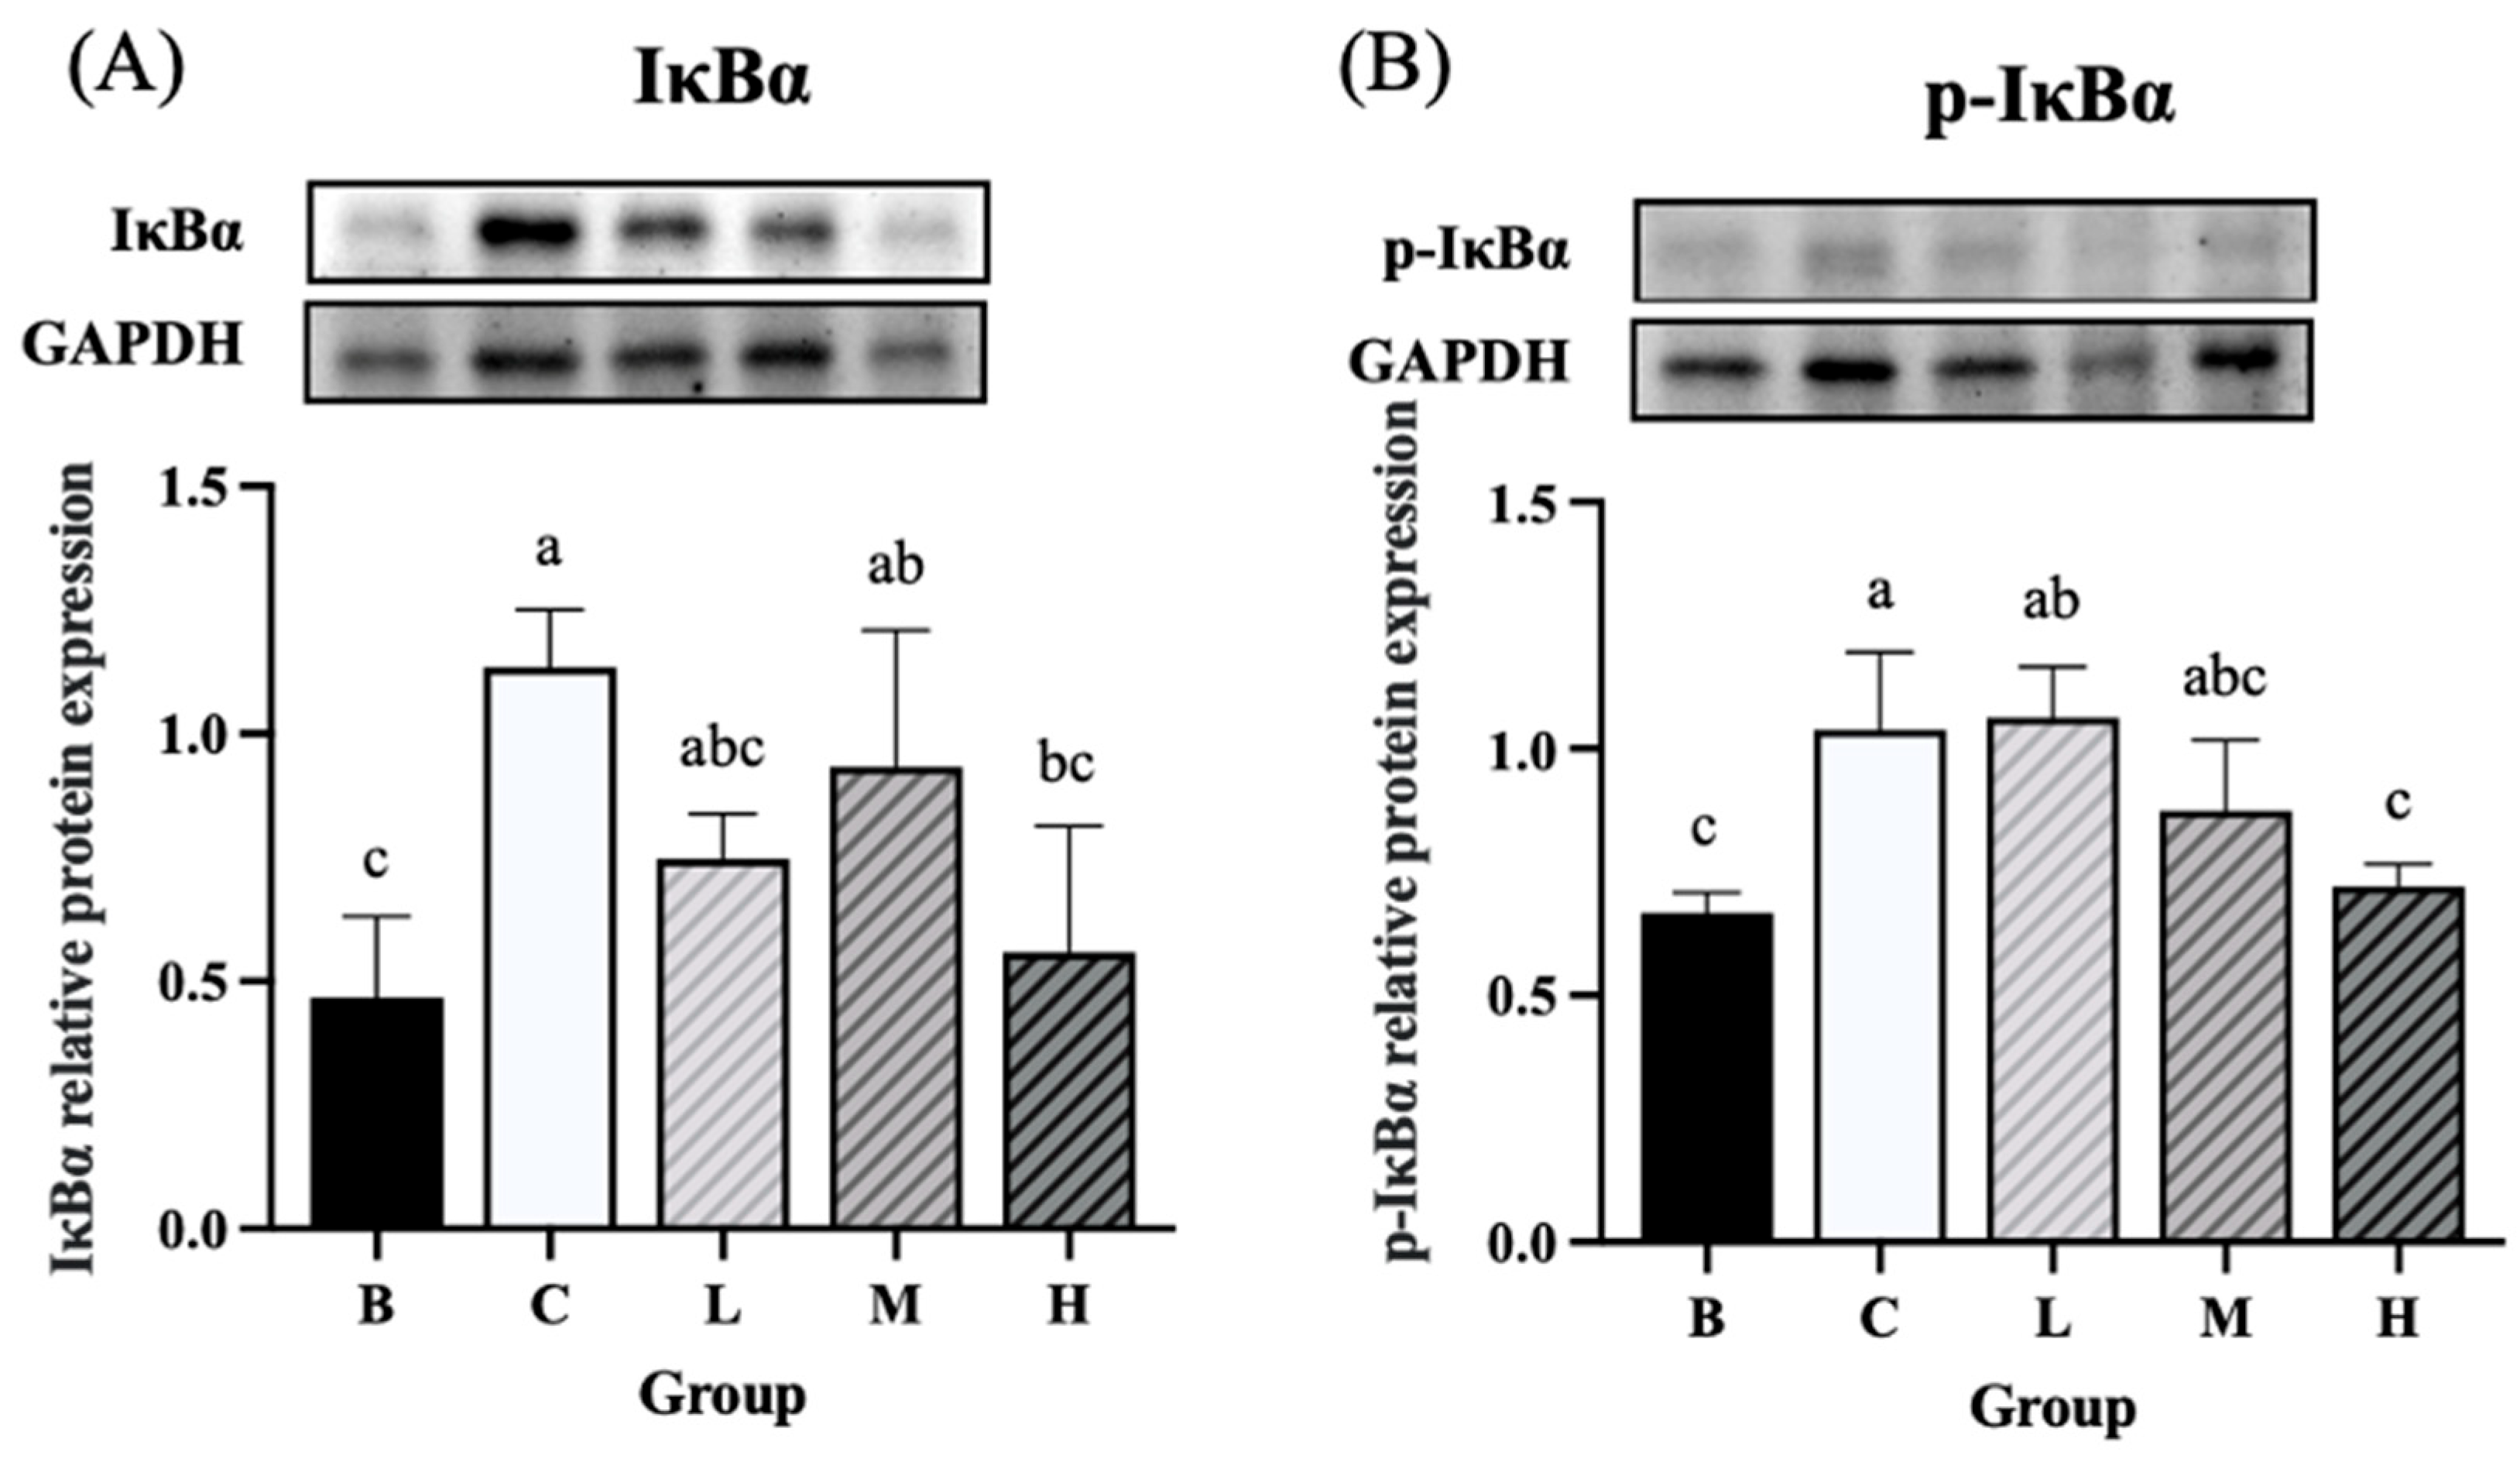
Figure 10.
Effects of djulis on colon COX-2 protein expression in DSS-induced chronic colitic mice. (A) IκBα. (B) p-IκBα. Data are presented as means ± SDs (n = 3 to 4). All groups, with the exception of group B, were administered DSS. Groups B and C: AIN-93G diet; Group L: AIN-93G diet containing 5% djulis; Group M: AIN-93G diet containing 10% djulis; and Group H: AIN-93G diet containing 15% djulis. Values with the same letter within a column are not significantly different from one another, as determined using ANOVA and Tukey’s range test, P < .05.
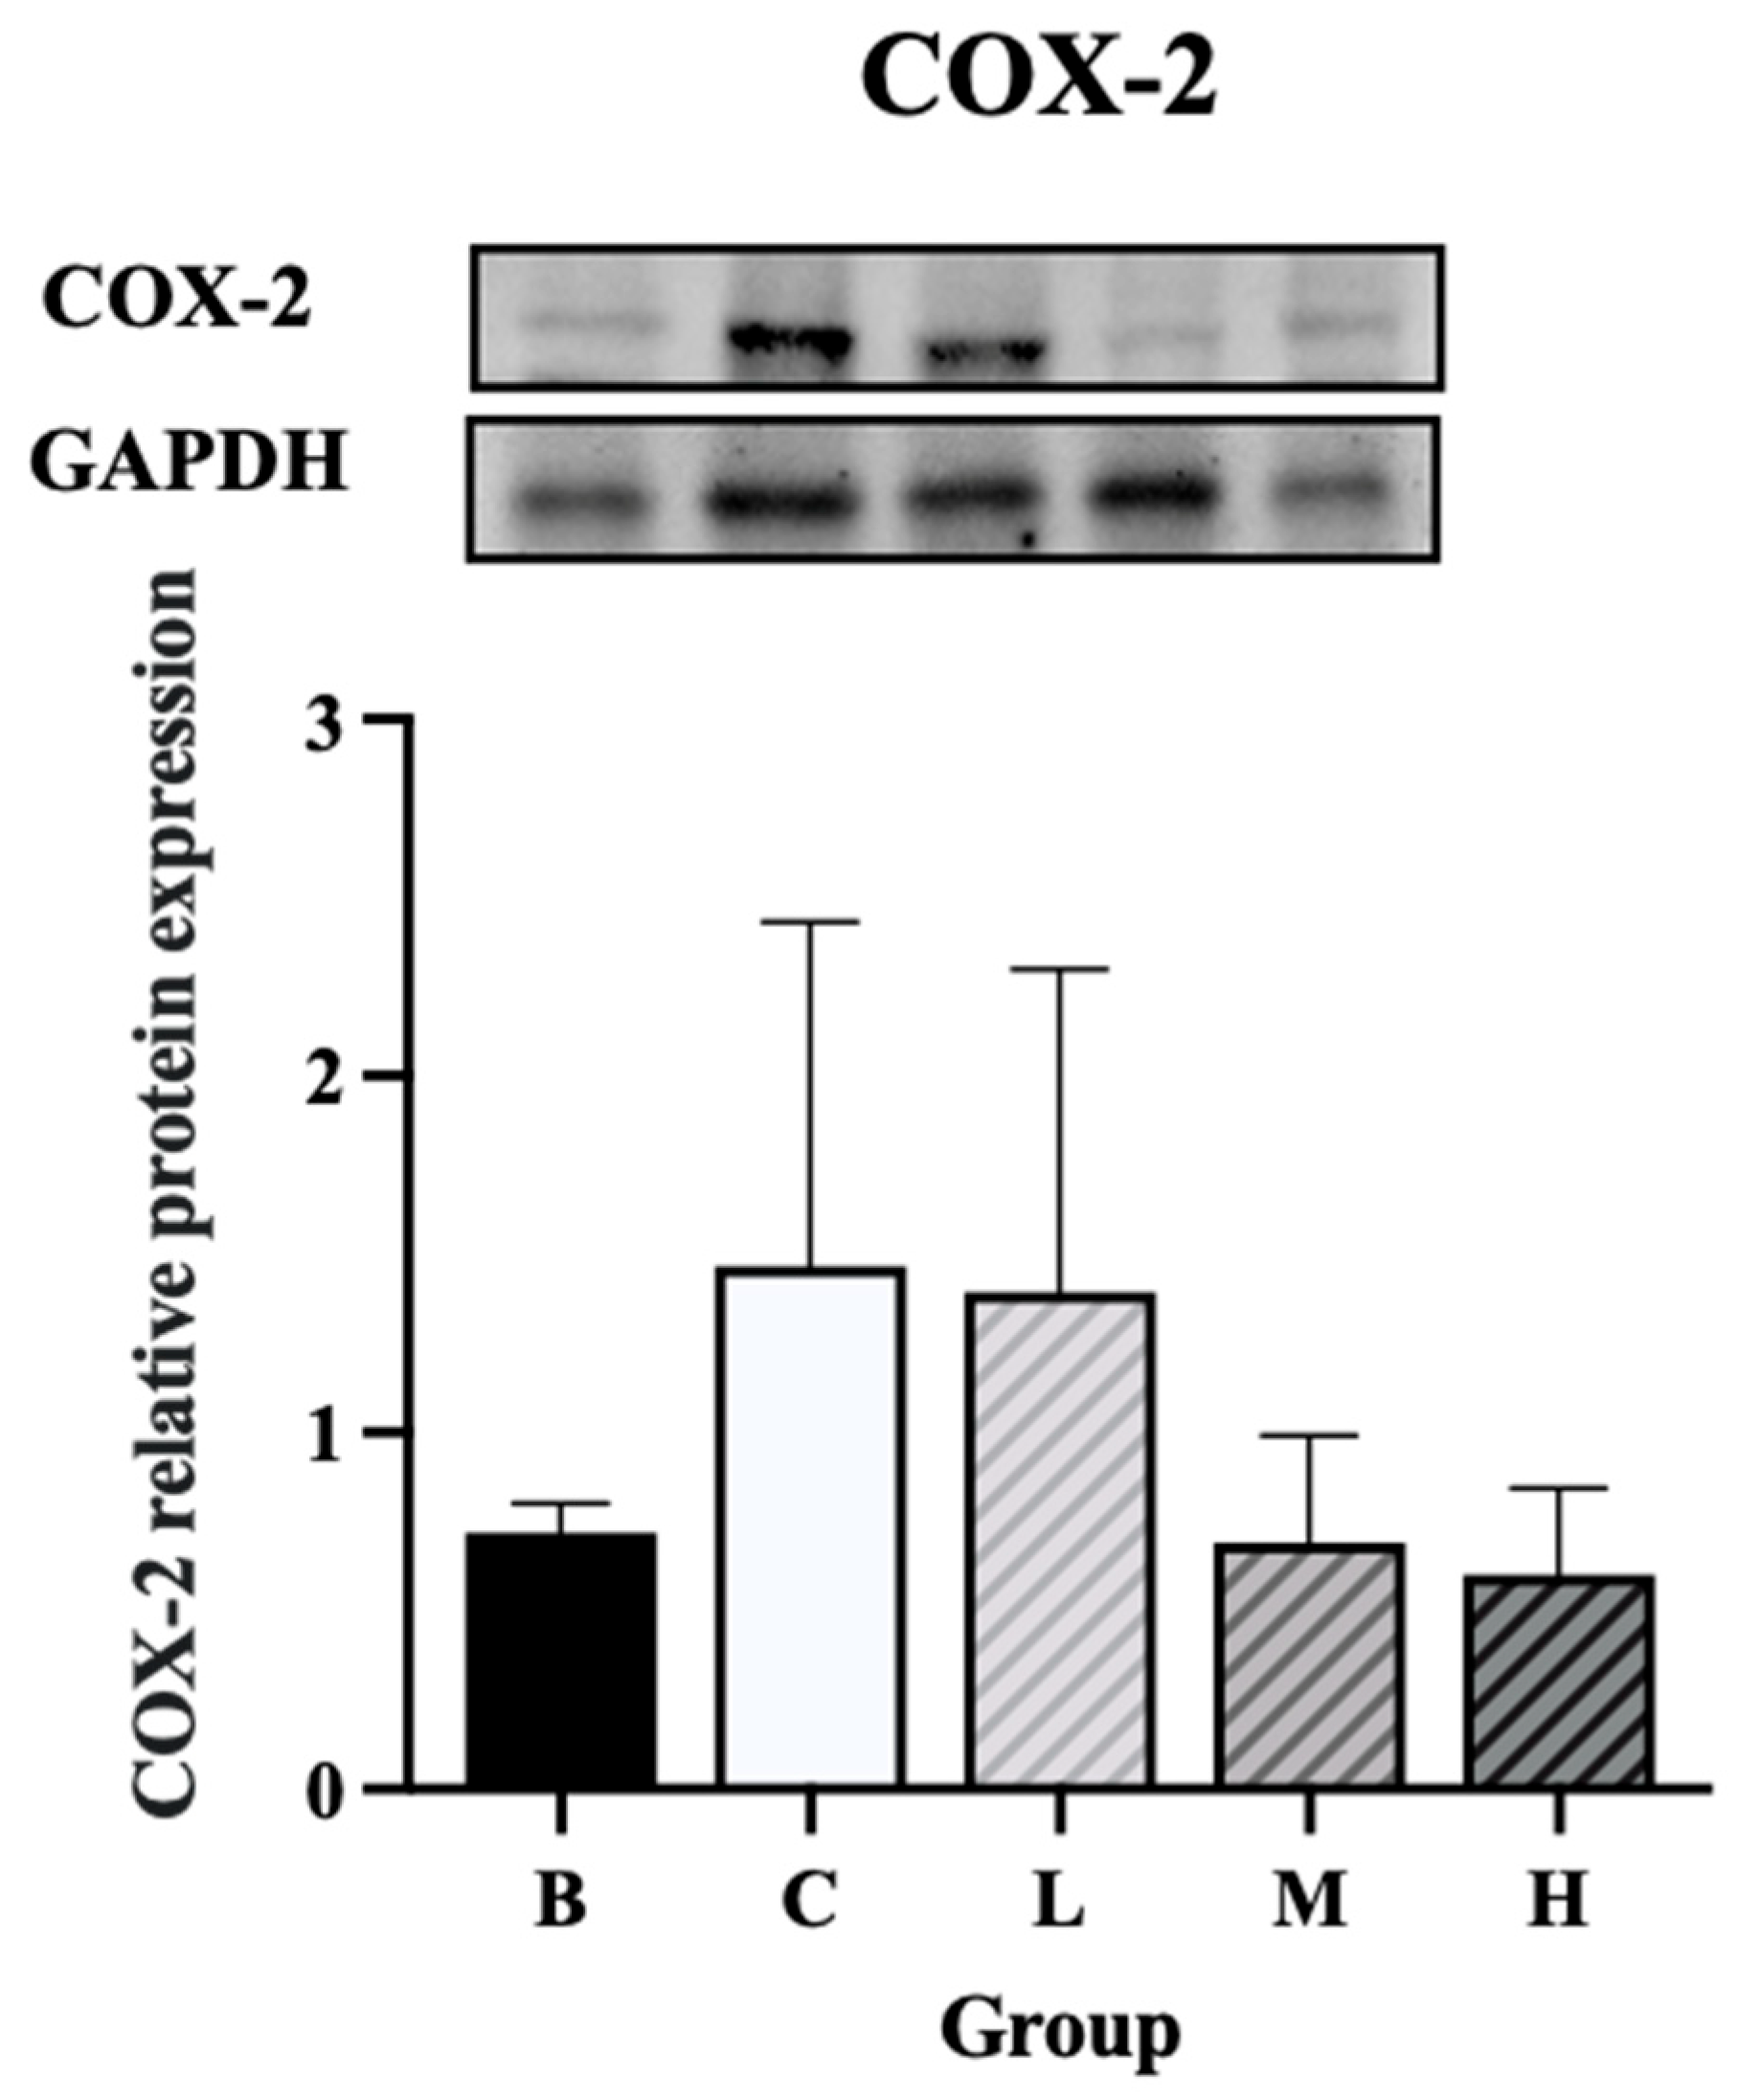
Figure 11.
Effects of djulis on alpha diversity of microbiota in DSS-induced chronic colitic mice. (A) Observed species, (B) Chao1 index, (C) Shannon index, and (D) Simpson index. All values are presented as means ± SDs (n = 5). All groups, with the exception of group B, were administered DSS. Groups B and C: AIN-93G diet; Group H: AIN-93G diet containing 15% djulis. An asterisk (*) indicates a significant difference compared with group B.
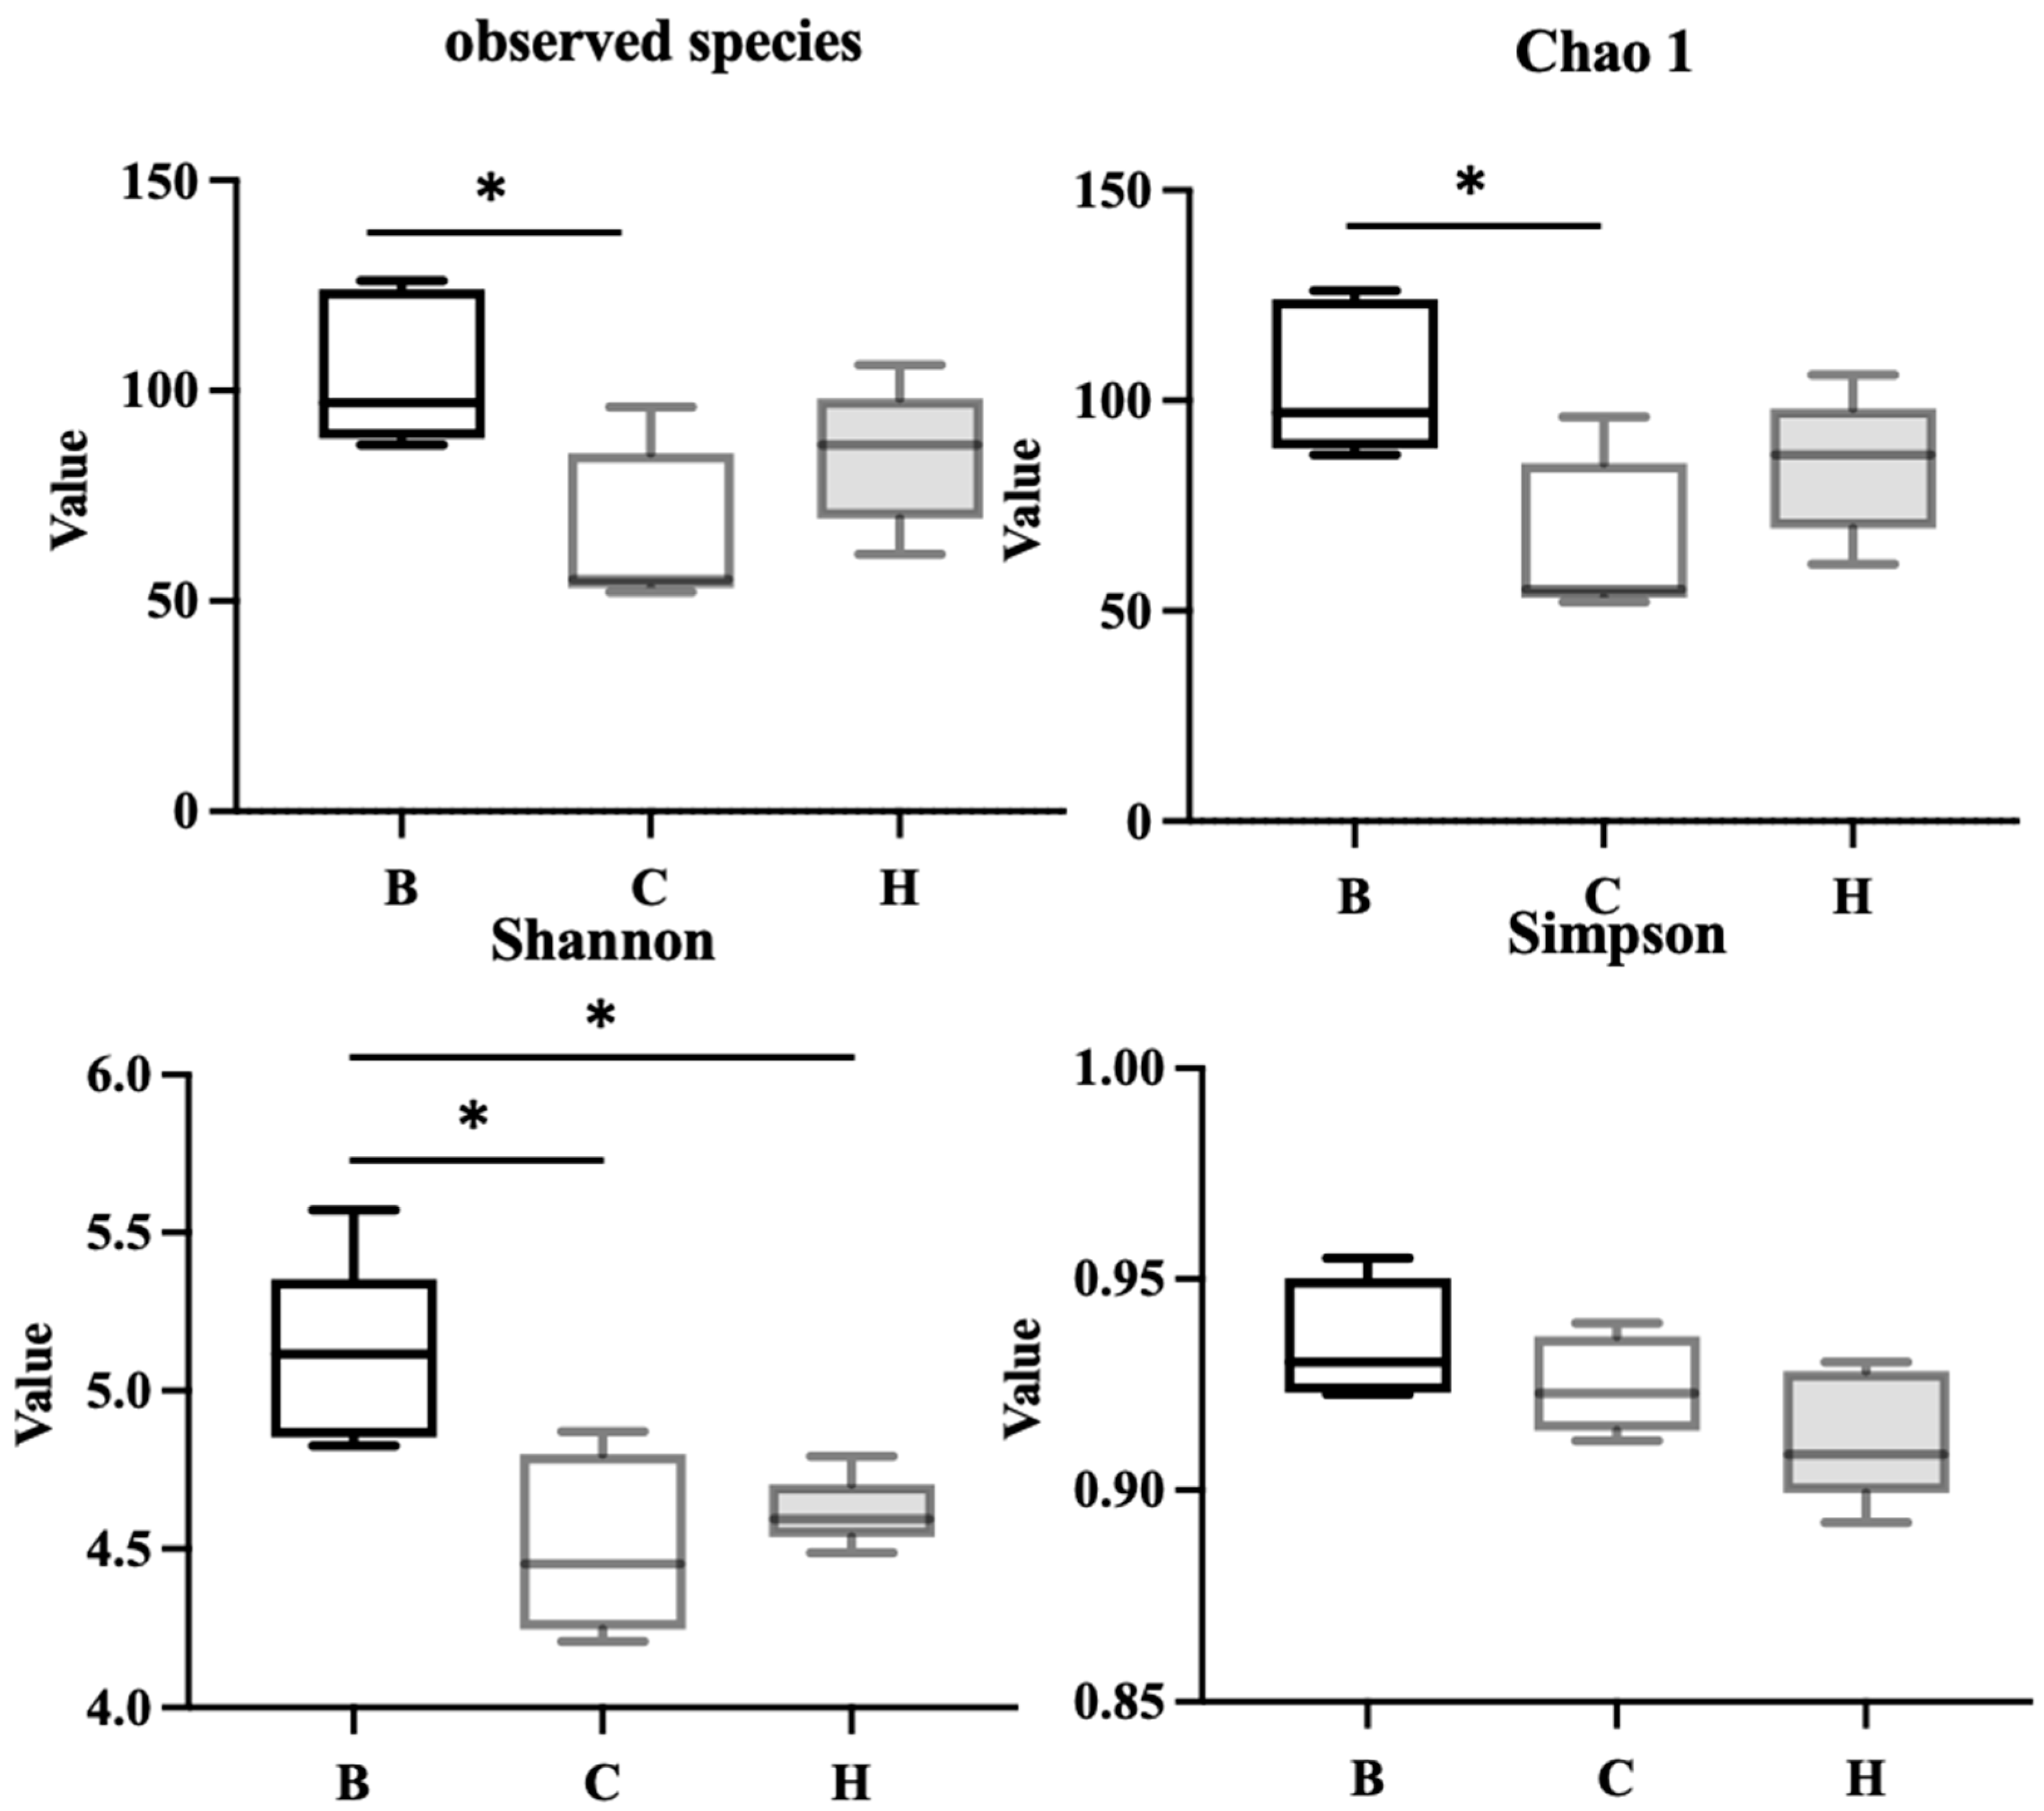
Figure 12.
Effects of djulis on beta diversity of microbiota in DSS-induced chronic colitic mice. All groups, with the exception of group B, were administered DSS. Groups B and C: AIN-93G diet; Group H: AIN-93G diet containing 15% djulis.
Figure 12.
Effects of djulis on beta diversity of microbiota in DSS-induced chronic colitic mice. All groups, with the exception of group B, were administered DSS. Groups B and C: AIN-93G diet; Group H: AIN-93G diet containing 15% djulis.
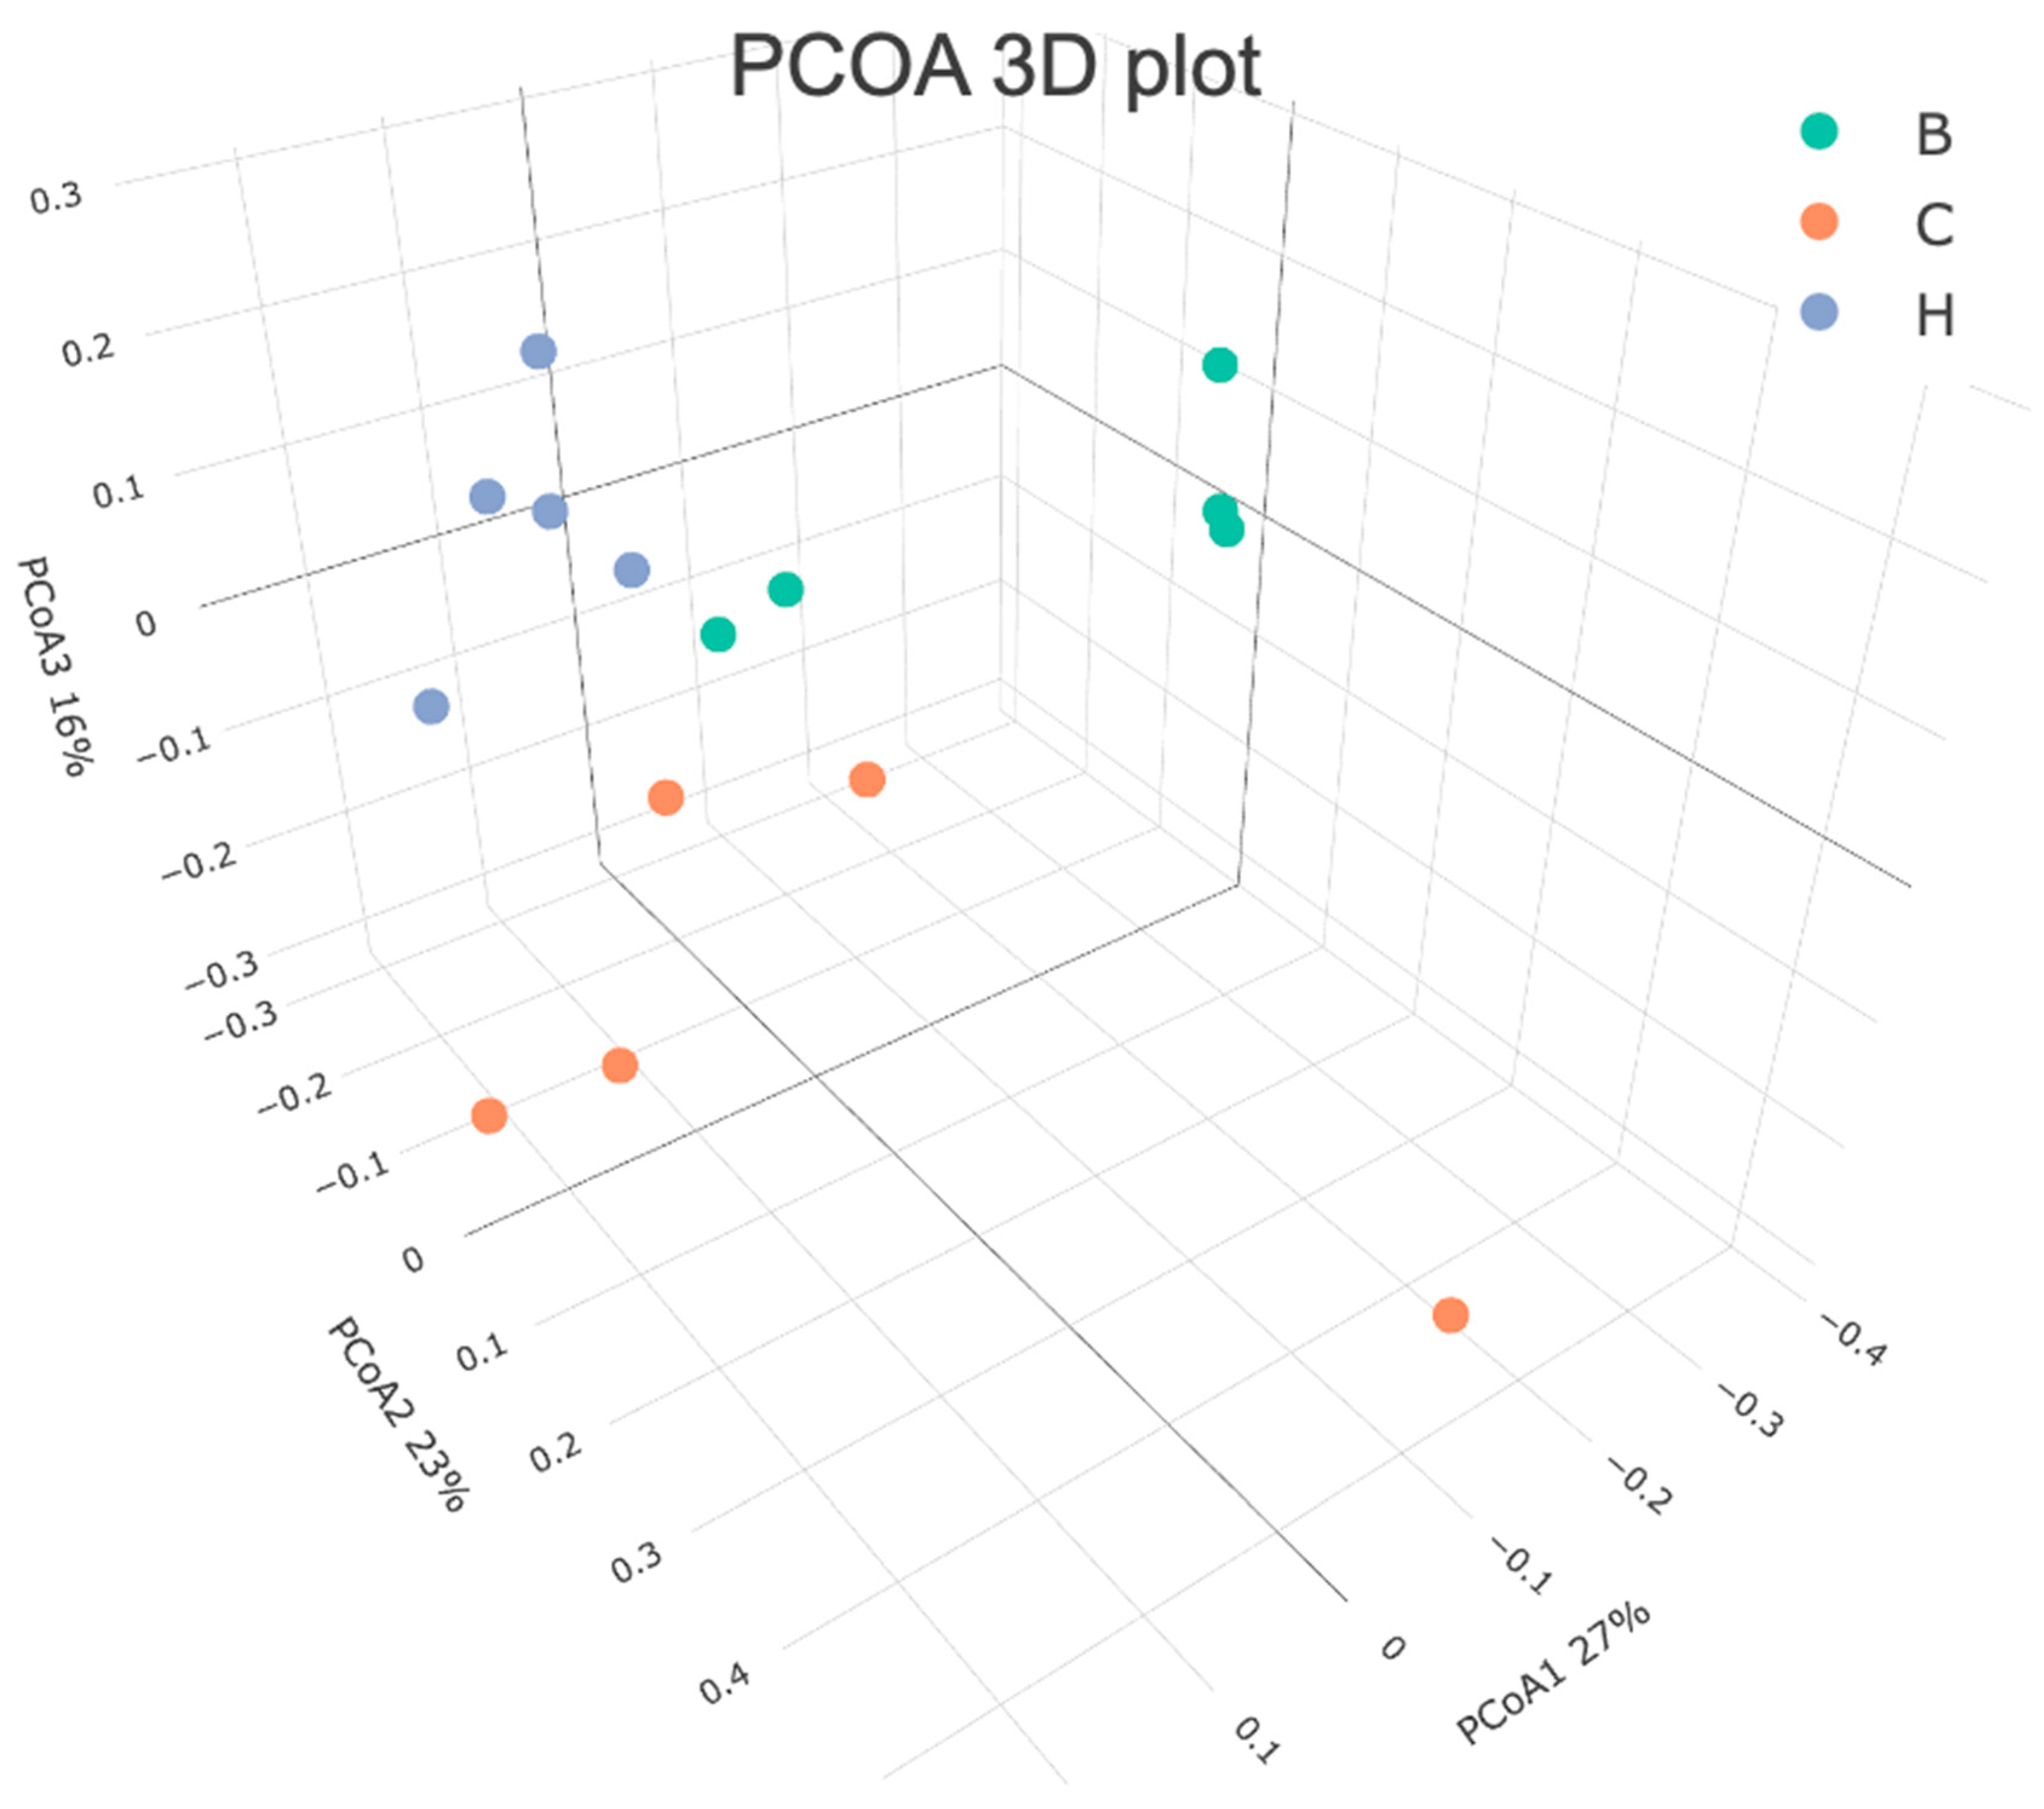
Figure 13.
Effect of djulis on colonic microbial composition in DSS-induced chronic colitic mice. The length of the bar represents the LDA score, and the colors indicate the group in which the taxa were more abundant compared with the other groups (n = 5). All groups, with the exception of group B, were administered DSS. Groups B and C: AIN-93G diet; Group H: AIN-93G diet containing 15% djulis. Differential abundant taxa are presented using the LEfSe method.
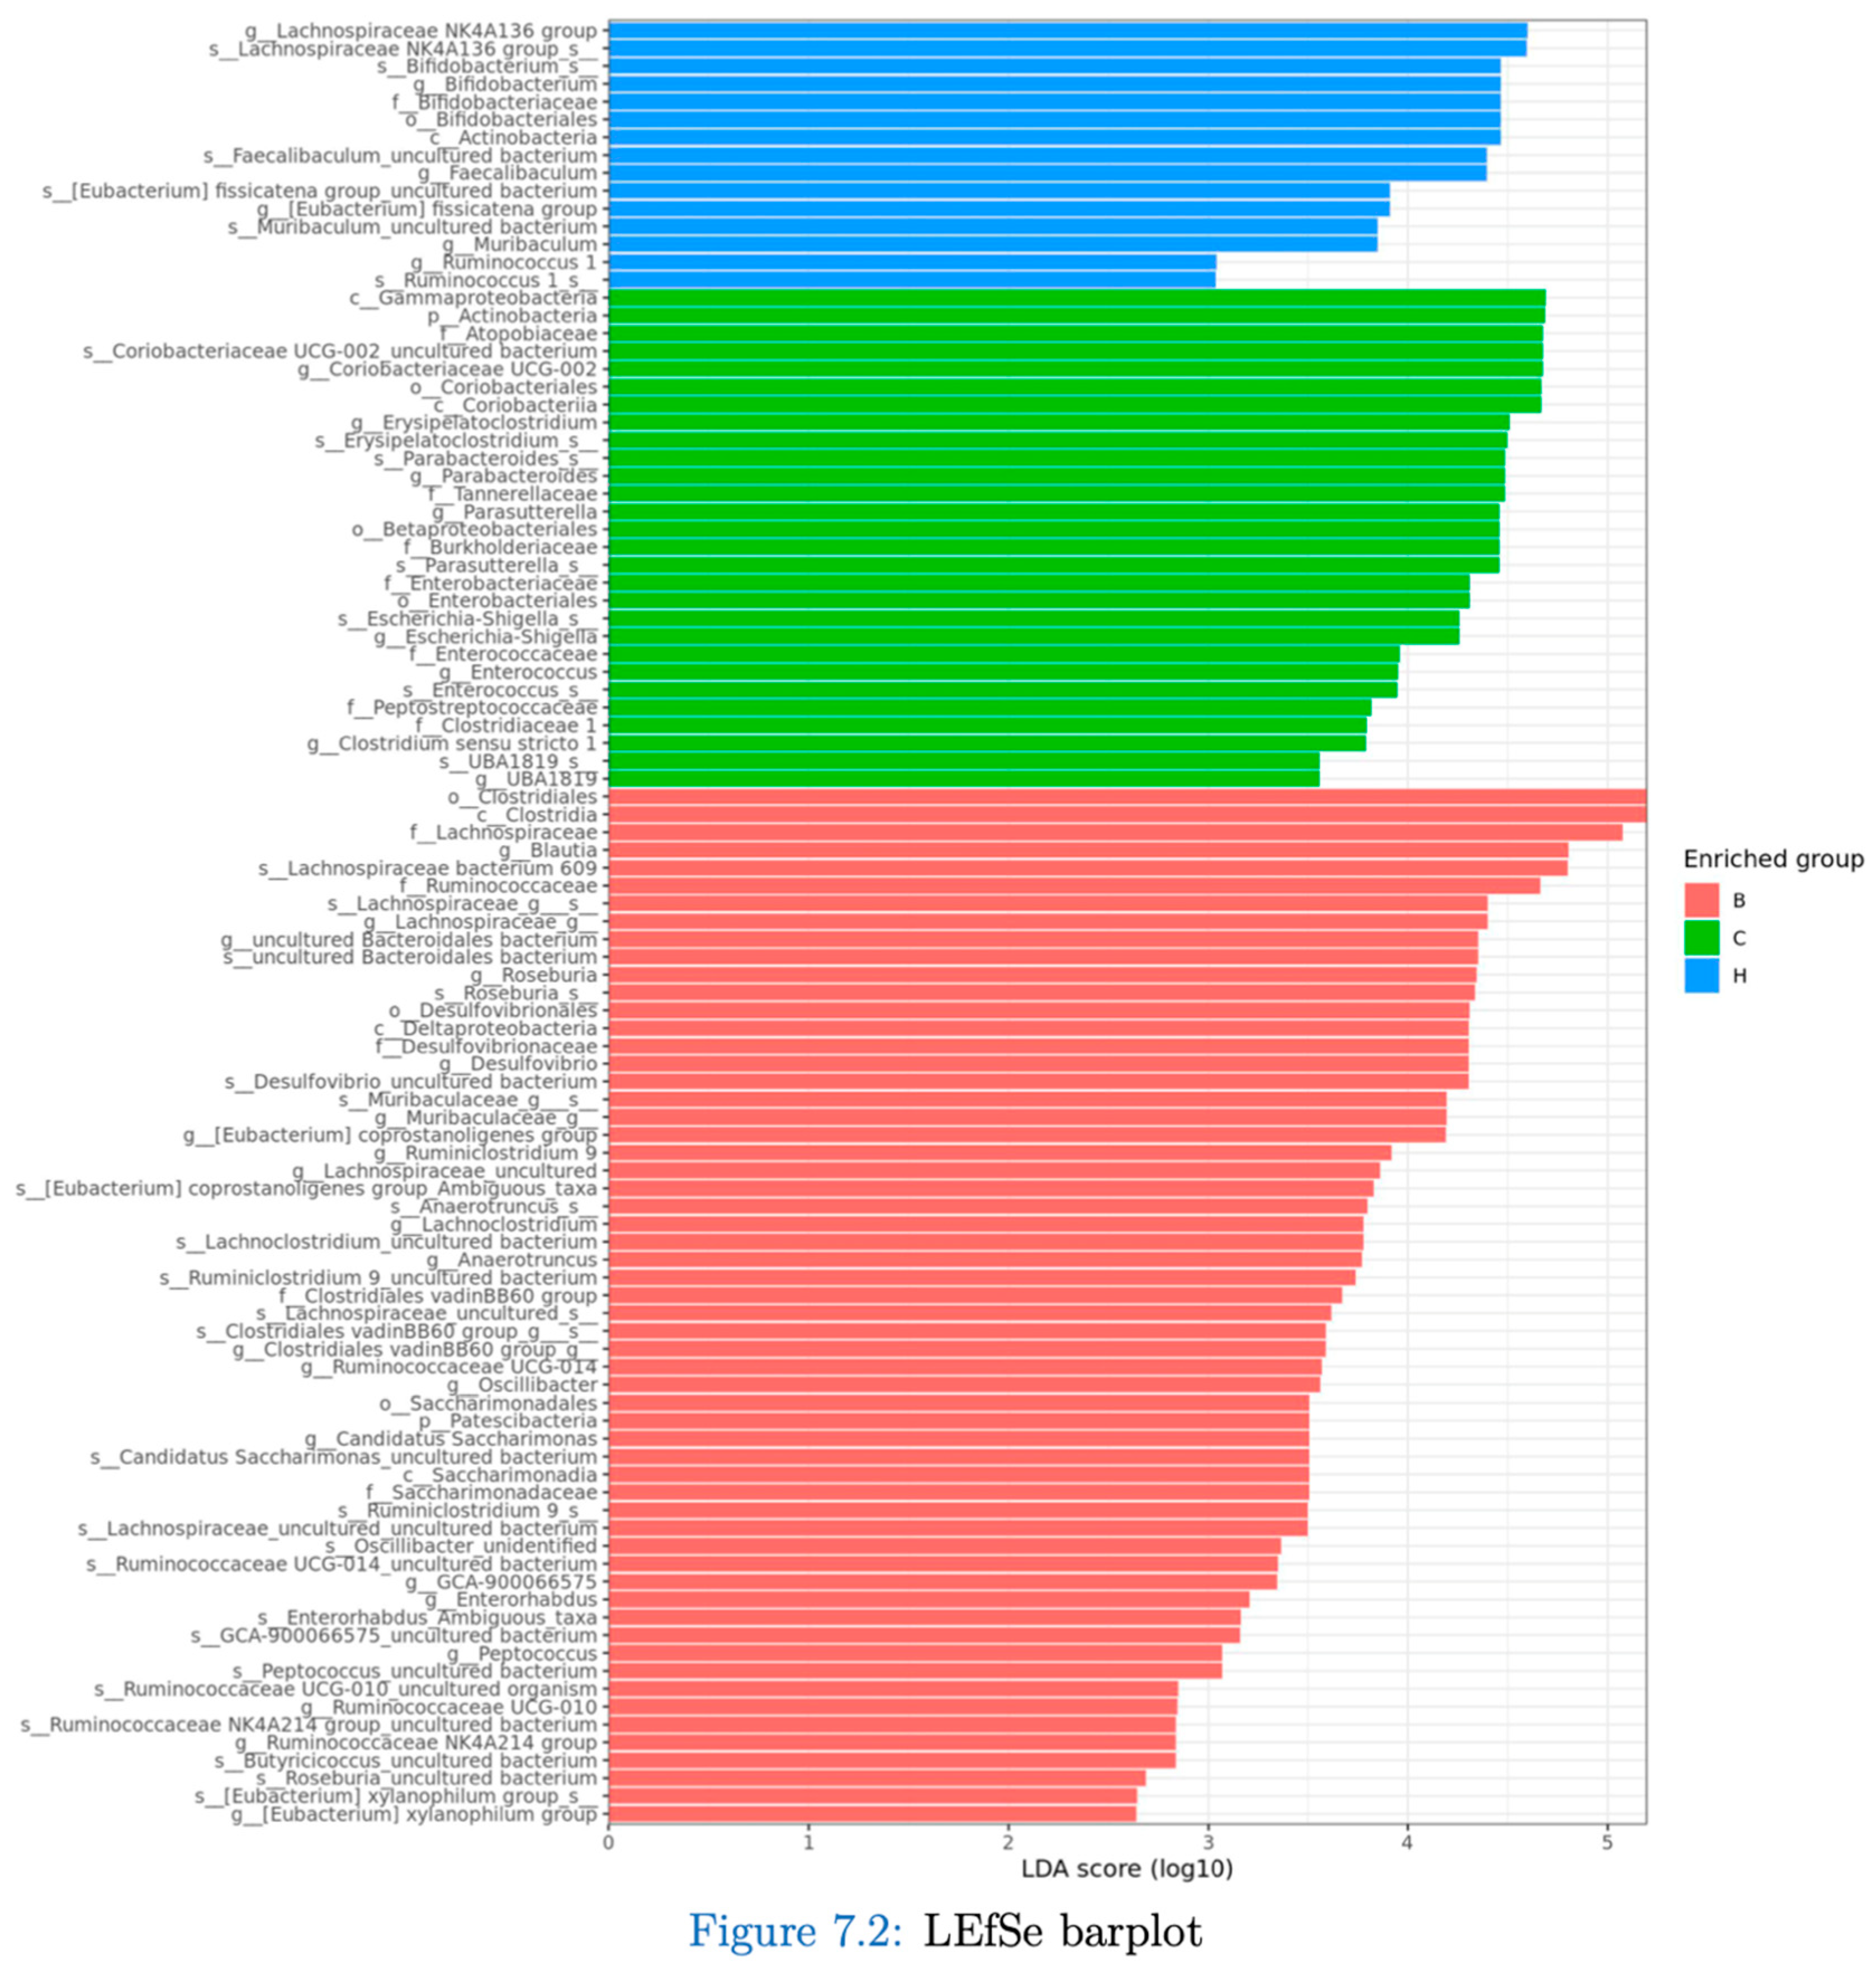
Figure 14.
Effects of djulis on indicator species of microbiota in DSS-induced chronic colitic mice. (A) s_Lachnospiraceae bacterium 609, (B) s_Lachnospiraceae_g_s_, (C) s_Rosebuia_s_, (D) s_Desulfovibrio_uncultured bacterium, and (E) s_Muribaculaceae_g_s_. All values are presented as means ± SDs (n = 5). All groups, with the exception of group B, were administered DSS. Groups B and C: AIN-93G diet; Group H: AIN-93G diet containing 15% djulis. An asterisk (*) indicates a significant difference compared with group B. A hashtag (#) indicates a significant difference compared with group C.
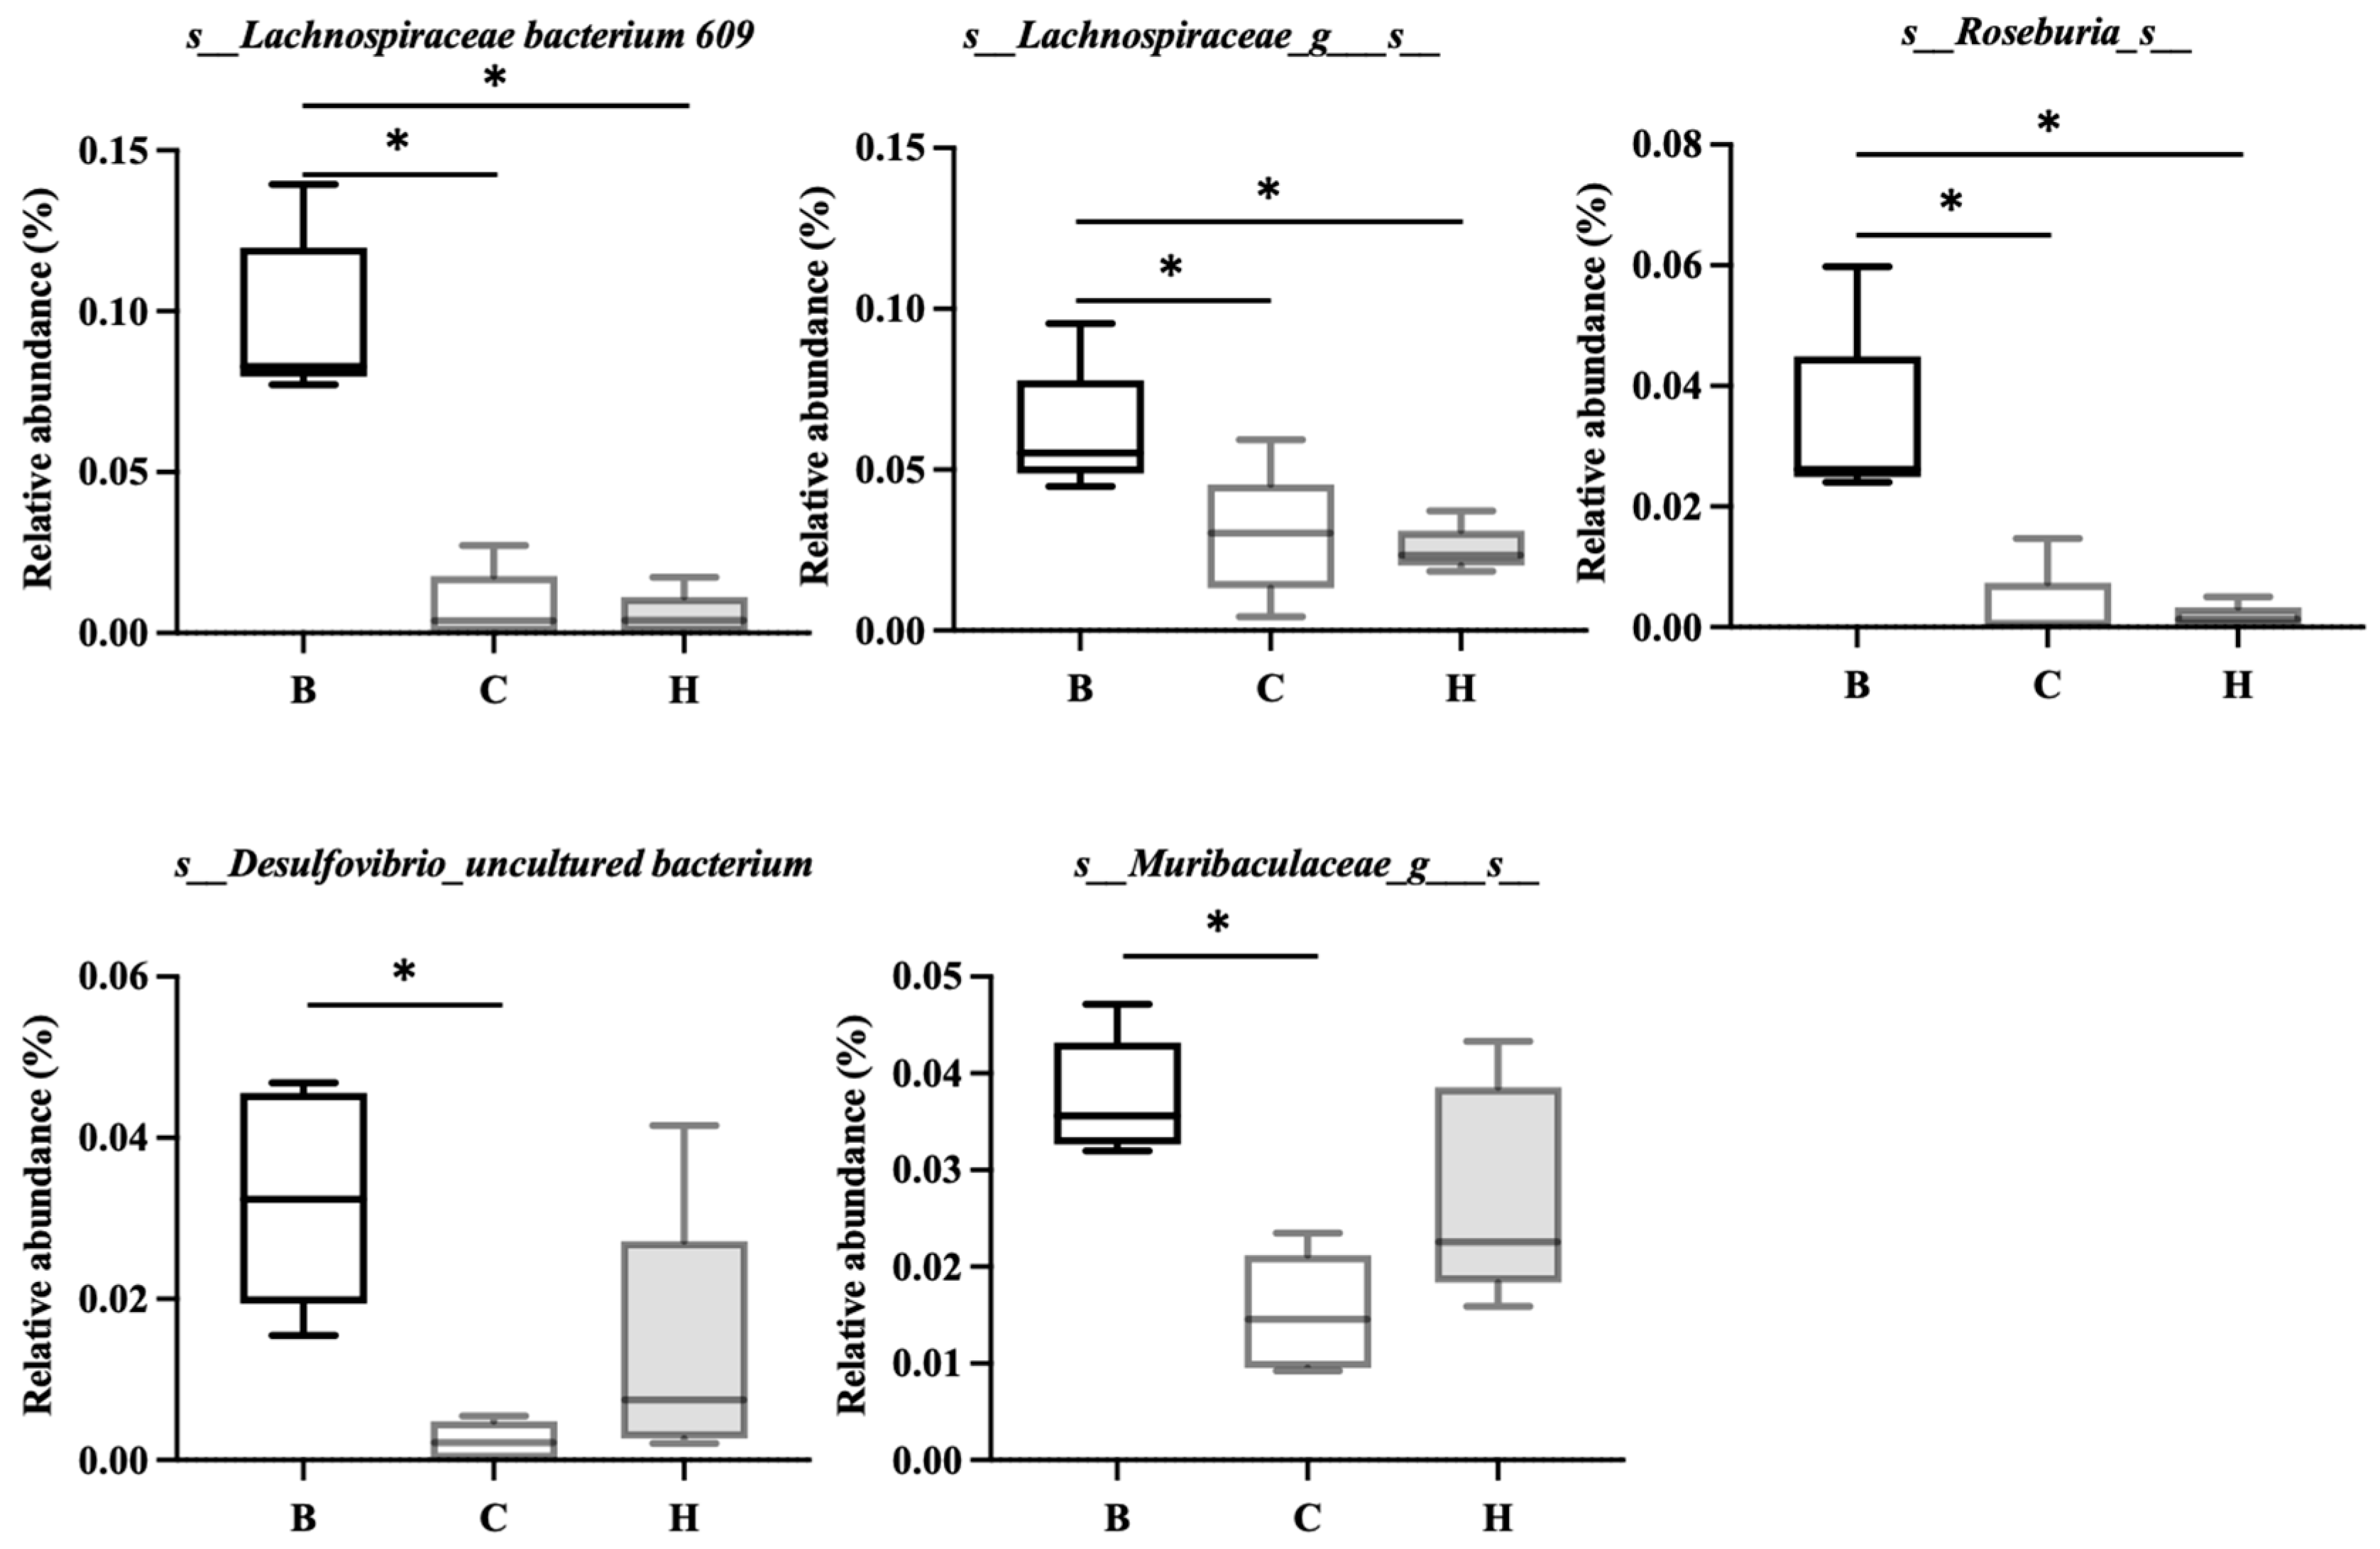
Figure 15.
Effects of djulis on indicator species of microbiota in DSS-induced chronic colitic mice. (A) Coriobacteriaceae UCG-002_uncultured bacterium, (B) s_Erysipelatoclostridium_s__, (C) s_Parasutterella_s__, (D) s_Escherichia-Shigella_s_, and (E) s_Parabacteroides_s_. All values are presented as means ± SDs (n = 5). All groups, with the exception of group B, were administered DSS. Groups B and C: AIN-93G diet; Group H: AIN-93G diet containing 15% djulis. An asterisk (*) indicates a significant difference compared with group B. A hashtag (#) indicates a significant difference compared with group C.
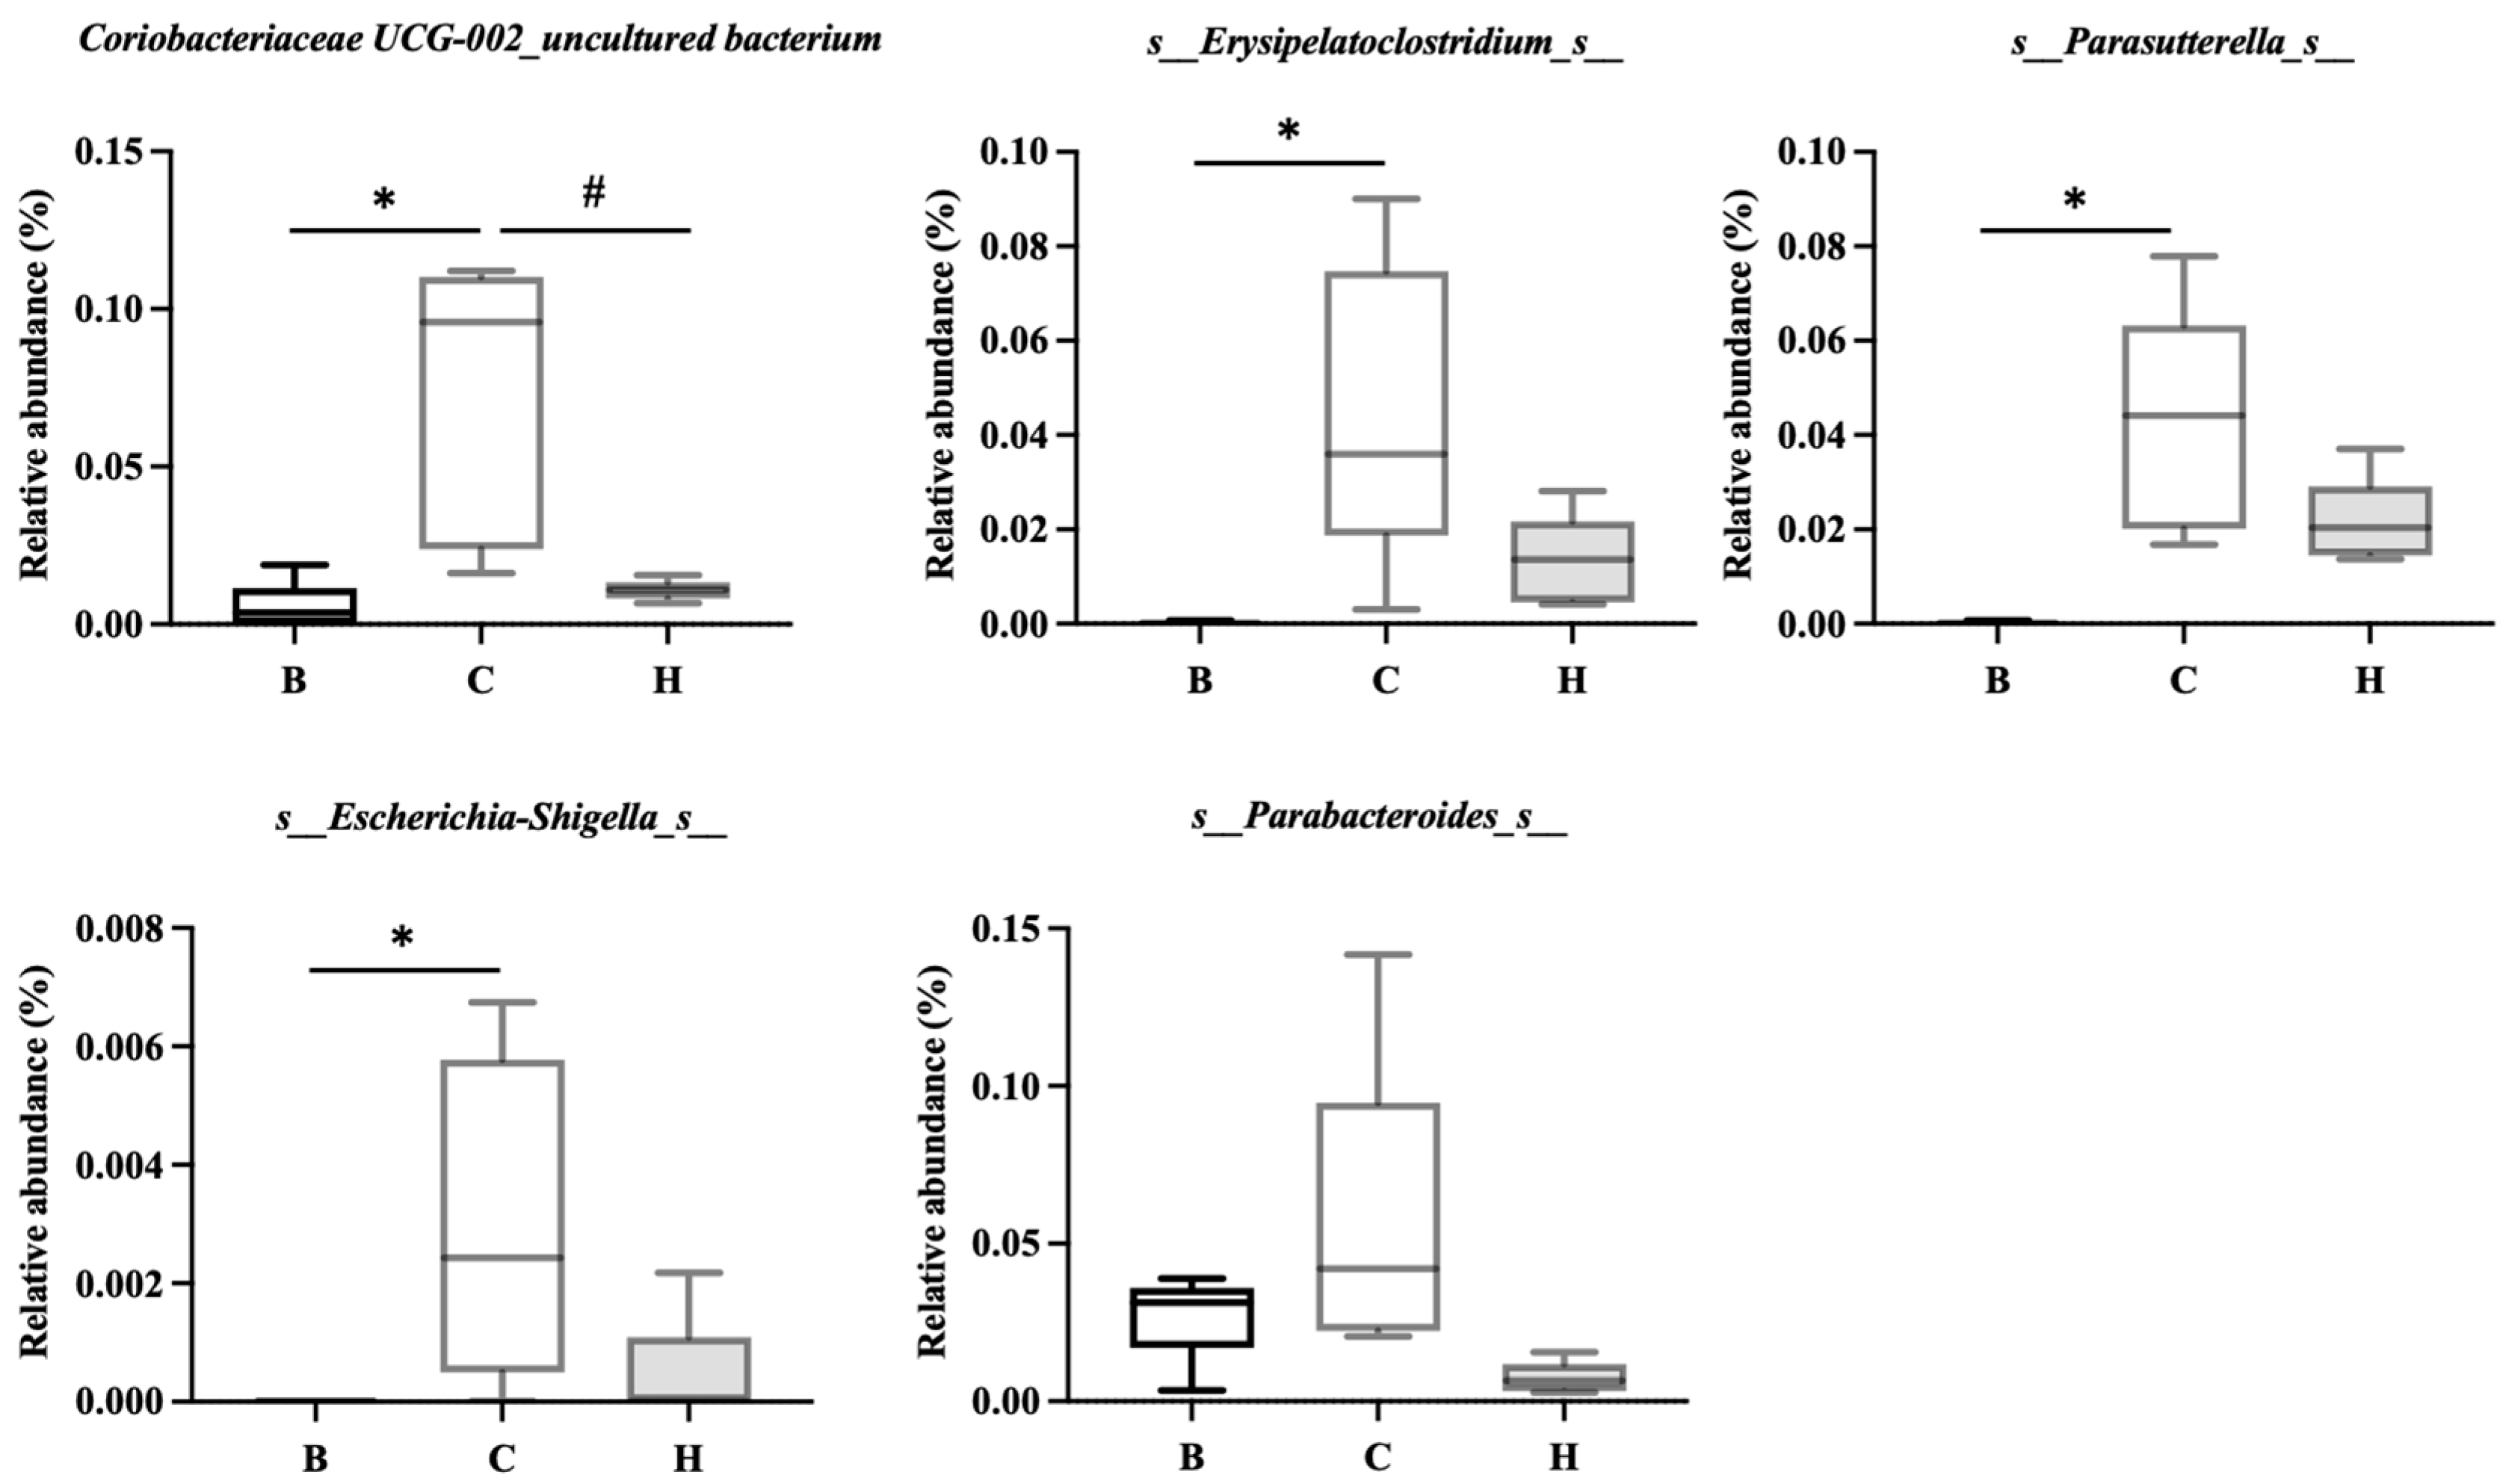
Figure 16.
Effects of djulis on indicator species of microbiota in DSS-induced chronic colitic mice. (A) s_Lachnospiraceae NK4A136 group, (B) s_Bifidobacterium, (C) s_faecalibaculum_uncultured bacterium, and (D) s_Muribaculum_uncultured bacterium. All values are presented as means ± SDs (n = 5). All groups, with the exception of group B, were administered DSS. Groups B and C: AIN-93G diet; Group H: AIN-93G diet containing 15% djulis. An asterisk (*) indicates a significant difference compared with group B. A hashtag (#) indicates a significant difference compared with group C.
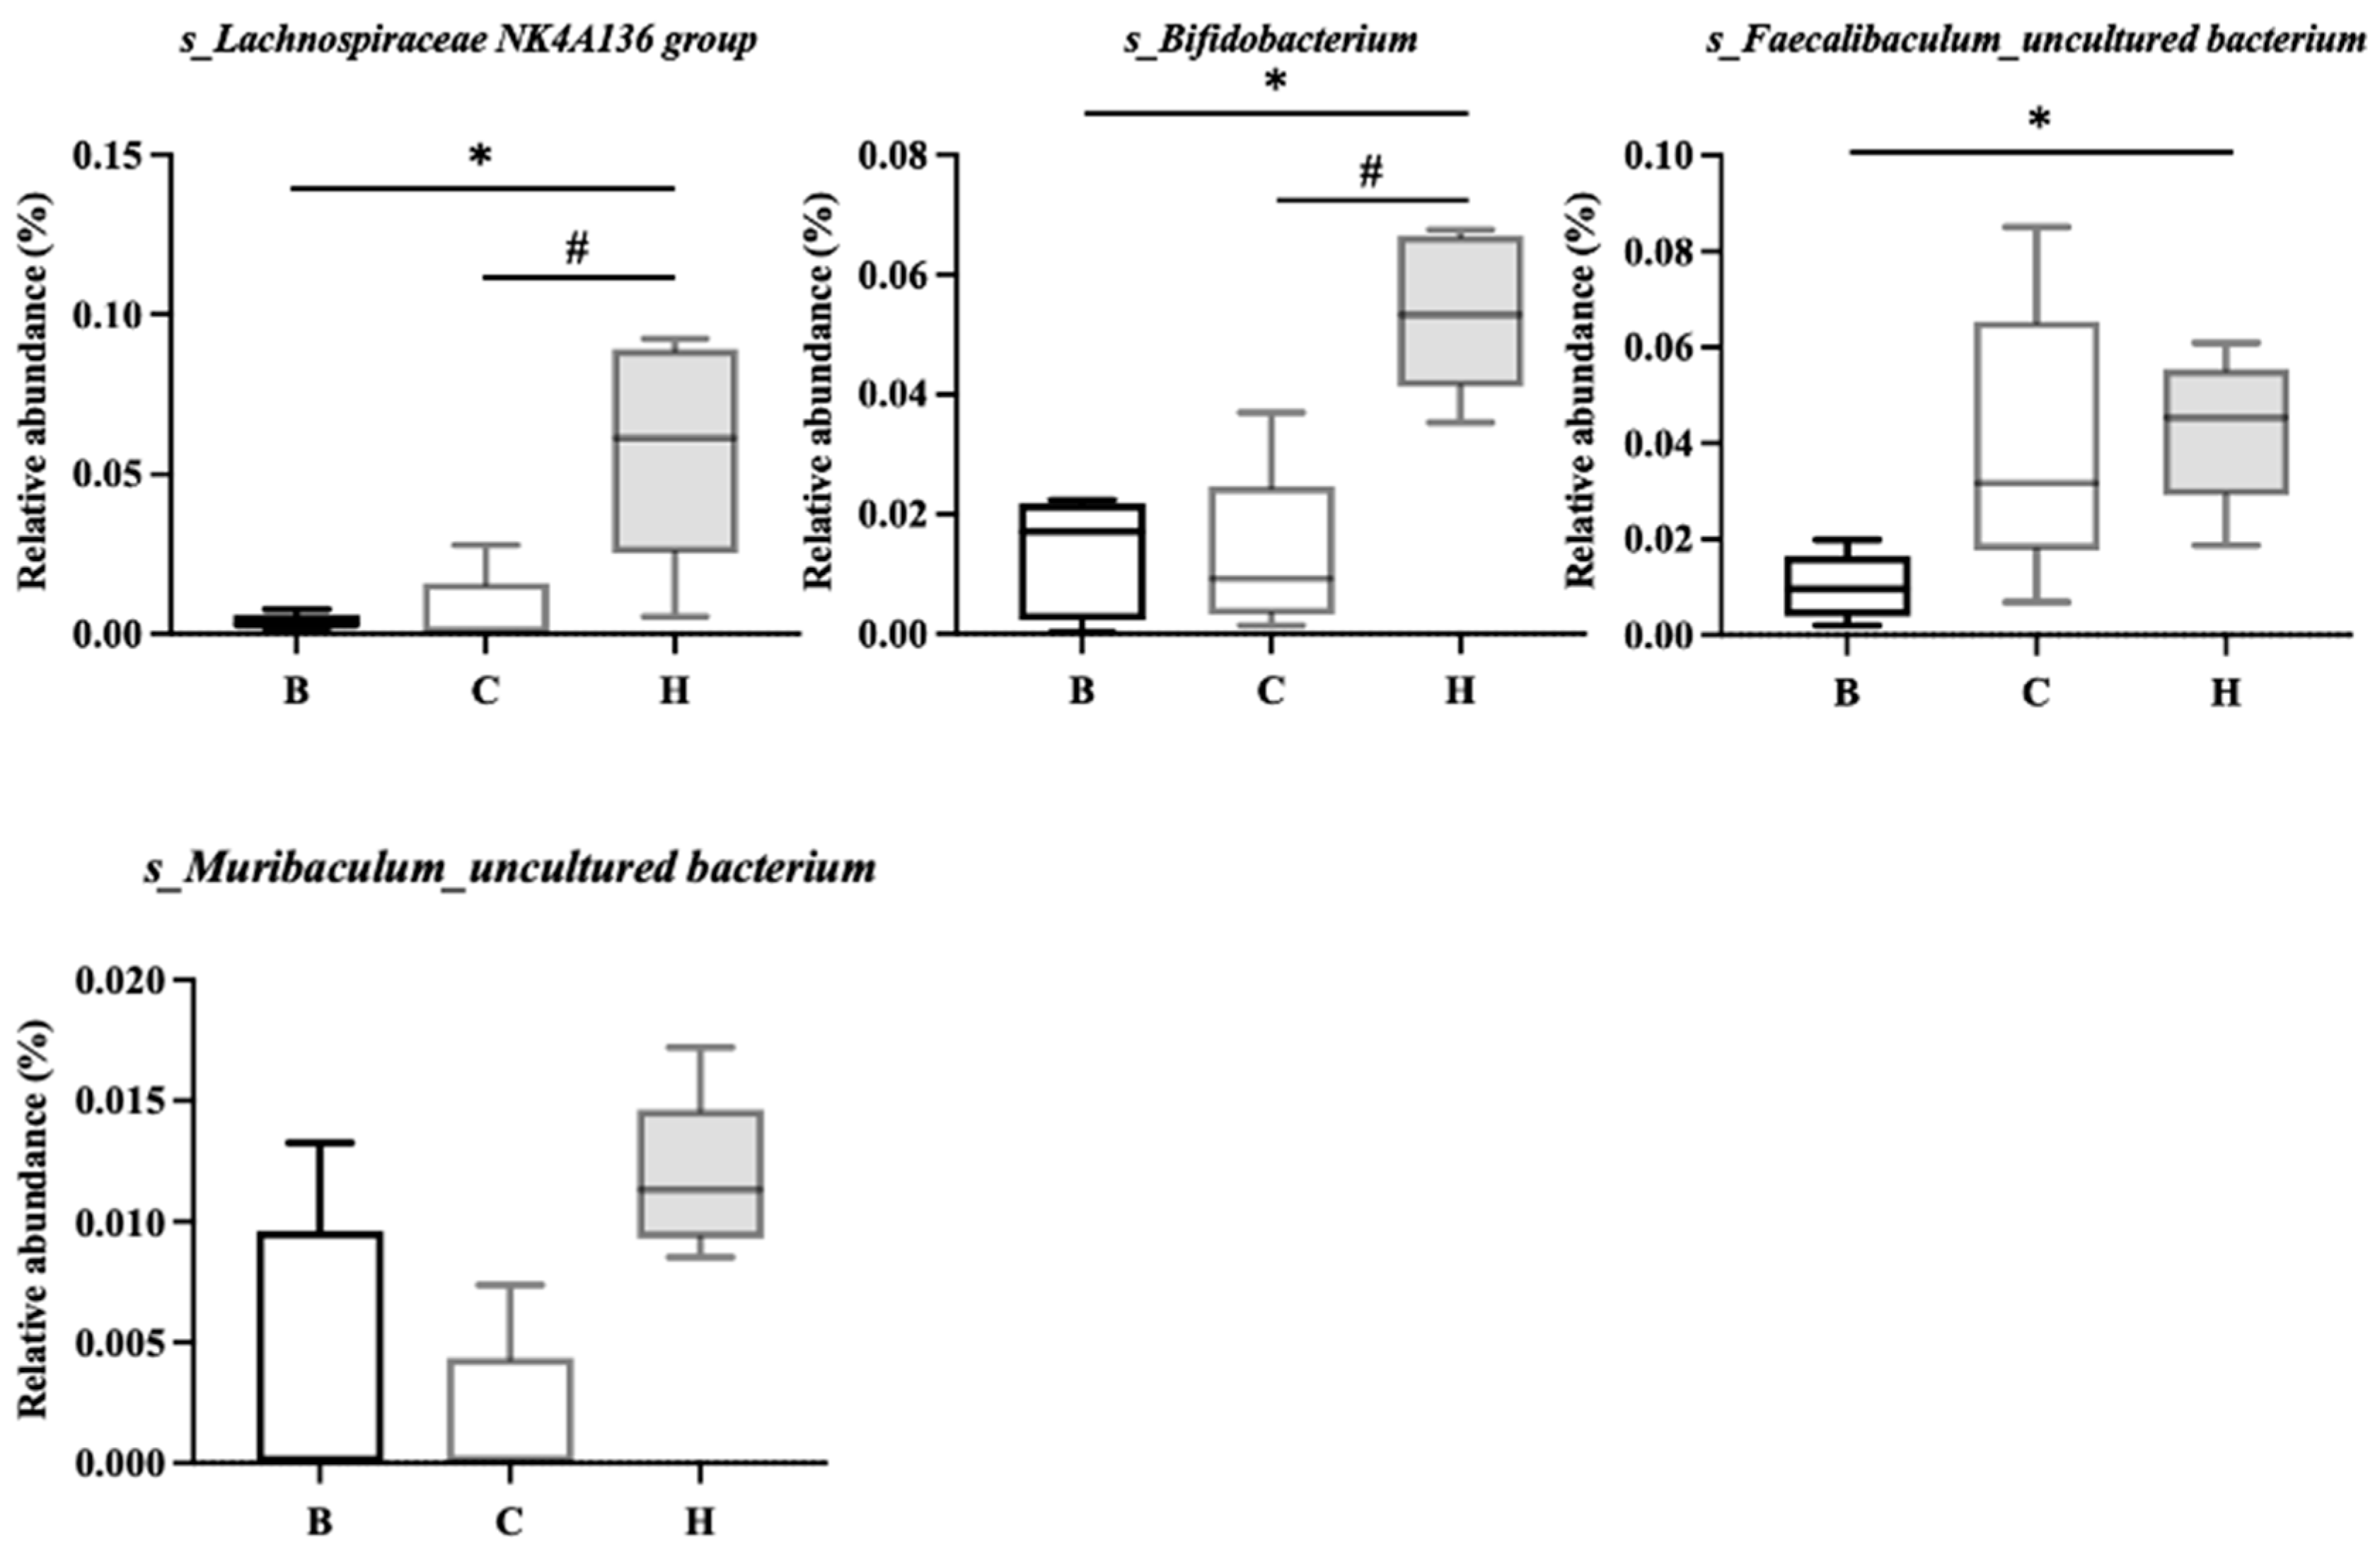

Table 1.
Grouping and intervention for study mice.
| Group | Oral gavage | Treatment |
|---|---|---|
| B | None | Normal drinking water |
| DSS | None | 2% DSS for 5 days and normal drinking water for 5 days (3 cycles) |
| LD | 5% whole seed powder of djulis | |
| MD | 10% whole seed powder of djulis | |
| HD | 15% whole seed powder of djulis |
Table 2.
DAI scores (Xiao et al., 2013).
| Score | Weight loss | Stool consistency | Fecal occult blood |
|---|---|---|---|
| 0 | None | Normal | Normal |
| 1 | <5% | ||
| 2 | 5%-10% | Loose stools | Slight bleeding |
| 3 | 10%-15% | ||
| 4 | >15% | Diarrhea | Gross bleeding |
Table 3.
Histopathological scoring (Bibi et al., 2018).
| Score | Crypt damage | Severity of inflammation | Depth of tissue damage |
|---|---|---|---|
| 0 | None | None | None |
| 1 | 1/3 Basal damage | Mucosal infiltration | Mucosal damage |
| 2 | 2/3 Basal damage | Mucosal and submucosal infiltration | Mucosal and submucosal damage |
| 3 | Only surface epithelium intact | Transmural infiltration | Transmural damage |
| 4 | Complete loss of crypt and epithelium | ||
Table 4.
Effects of djulis on body weight, food intake, food efficiency, and water consumption in DSS-induced chronic colitis mice[1,2].
| Group[3] | Initial body weight (g) | Final body weight (g) | Weight gain (g/d) | Water consumption(g/d) | Food intake (g/d) | Food efficiency[4] (%) |
| B | 23.6 ± 1.7 | 27.7 ± 1.6a | 0.14 ± 0.02a | 5.7 ± 1.0a | 5.1 ± 0.7a | 2.7 ± 0.5a |
| C | 23.7 ± 1.4 | 25.0 ± 2.0b | 0.04 ± 0.07b | 4.7 ± 0.6b | 4.7 ± 0.5ab | 0.9 ± 1.4b |
| L | 23.1 ± 1.4 | 25.2 ± 2.2b | 0.07 ± 0.05b | 4.0 ± 0.4b | 4.3 ± 0.5bc | 1.6 ± 1.2ab |
| M | 23.4 ± 1.8 | 24.9 ± 2.1b | 0.05 ± 0.02b | 4.4 ± 0.8b | 4.0 ± 0.6c | 1.3 ± 0.5b |
| H | 23.9±1.1 | 25.3 ± 1.9ab | 0.05 ± 0.04b | 4.6 ± 0.5b | 3.9 ± 0.3c | 1.2 ± 1.1b |
1All values are presented as means ± SDs (n = 8). 2Values with the same letter within a column are not significantly different from one another, as determined using ANOVA and Tukey’s range test (P < .05. 3All groups, except for group B, were administered DSS. Groups B and C: AIN-93G diet; Group L: AIN-93G diet containing 5% djulis; Group M: AIN-93G diet containing 10% djulis; Group H: AIN-93G diet containing 15% djulis. 4Weight gain/food intake × 100%.
| Comparison | R.Statistic.Value | P value3 | N.Perm |
| B vs C | 0.636 | .009 | 10 000 |
| B vs H | 0.784 | .008 | 10 000 |
| C vs H | 0.524 | .008 | 10 000 |
1ANOSIM: Analysis of similarities. 2All groups, except for group B, were administered DSS. Groups B and C: AIN-93G diet; Group H: AIN-93G diet containing 15% djulis.3P < .05 was considered significant.
Disclaimer/Publisher’s Note: The statements, opinions and data contained in all publications are solely those of the individual author(s) and contributor(s) and not of MDPI and/or the editor(s). MDPI and/or the editor(s) disclaim responsibility for any injury to people or property resulting from any ideas, methods, instructions or products referred to in the content. |
© 2026 by the authors. Licensee MDPI, Basel, Switzerland. This article is an open access article distributed under the terms and conditions of the Creative Commons Attribution (CC BY) license (http://creativecommons.org/licenses/by/4.0/).
Copyright: This open access article is published under a Creative Commons CC BY 4.0 license, which permit the free download, distribution, and reuse, provided that the author and preprint are cited in any reuse.


