Submitted:
23 January 2026
Posted:
26 January 2026
You are already at the latest version
Abstract
Cleft palate only (CPO) is a multifactorial craniofacial malformation with significant genetic and epigenetic contributions. Among these, microRNAs (miRNAs) have emerged as key regulators of palate development, although their precise role in CPO pathogenesis remains incompletely elucidated. In this study, we performed a comprehensive miRNA expression analysis on palatal tissues from an Italian cohort of non-syndromic CPO patients, compared with a human embryonic palate mesenchymal (HEPM) cell line. Using the NanoString® nCounter platform for miRNA profiling, we identified significant deregulation of several miRNAs, notably the upregulation of miR-205-5p and miR-200c-3p, and the downregulation of miR-125a-5p. Based on these expression changes, a functional analysis was carried out to identify potential target genes. Validation in primary cell cultures derived from patient tissues confirmed these expression patterns. Functional analyses and target predictions implicated PAX9, a key transcription factor essential for palatogenesis, as a probable target of miR-205-5p, while miR-125a-5p was associated with the regulation of PRTG and PRSS35, genes involved respectively in neural crest cell biology and extracellular matrix remodeling. Although modulation of certain predicted targets of miR-200c-3p was observed, in vitro inhibition experiments did not show significant changes in gene expression, highlighting the complexity of miRNA regulatory networks and the need for further studies to unravel these interactions. Altogether, these findings advance the understanding of miRNA-mediated molecular mechanisms in CPO and identify novel candidate pathways for further mechanistic and therapeutic investigation.
Keywords:
cleft palate only
; microRNAs
; palatogenesis
; gene expression
; craniofacial development
1. Introduction
Orofacial clefts are common craniofacial anomalies with an average prevalence of approximately 1 in 1000 live births. Hundreds of syndromes may include a cleft as a feature, but among isolated cases (~70%), clinical assessment recognizes at least three distinct phenotypic groups: cleft lip only (CLO), cleft lip with or without palate (CL/P), and cleft palate only (CPO) [1]. Although there is still much to be understood, it seems clear that these heterogeneous phenotypes, with different underlying etiological mechanisms, have complex, multifactorial causes. Indeed, genetic mutations, environmental factors, and epigenetic imbalances have been shown to play a role, often in concert, in the occurrence of these common defects of orofacial development [2].
In this paper we focus on CPO, the least frequent and least investigated form of orofacial clefting. While syndromic forms of cleft palate are often associated with specific genetic mutations and additional anomalies, most cases are non-syndromic and occur sporadically without other overt clinical features. Proper human palatal closure, occurring between weeks 6 and 12 of gestation, depends on coordinated proliferative, migratory, and fusional processes involving two distinct palatal shelves. This tightly regulated process requires the sequential activation of specific genes [3]. In recent years, genome wide association analyses have been performed to identify genes involved in the non-syndromic form of cleft palate (nsCPO); however, so far, only a single common variant associated with nsCPO has been identified using this approach: the rs41268753 at the grainyhead-like 3 gene (GRHL3 [MIM 608317]) [4]. The identification of GRHL3 supports the importance of genetic factors in the etiology of nsCPO; however, GRHL3 polymorphism does not account for the high heritability of CPO. This evidence highlights the need for further research into epigenetic mechanisms and regulatory elements, such as miRNAs. An increasing number of studies have focused in the last decade on the role of miRNAs in the deregulation of gene expression during normal and abnormal orofacial embryogenesis [5]. These small non-coding RNAs modulate critical morphogenetic processes necessary for palatal shelf fusion, such as cell proliferation, differentiation, migration, and epithelial-mesenchymal transition [5].
Despite significant advances in understanding, the role of miRNAs in the pathogenesis of CPO remains insufficiently characterized. This study aims to identify and characterize specific miRNAs involved in nsCPO pathogenesis, hypothesizing that deregulated miRNA expression contributes to abnormal palatal development. We identified at least one miRNA potentially implicated in the pathogenesis of human cleft palate. We validated the correlation between miRNA and target gene expression in primary cultures derived from the palatal mucosa of very young CPO patients (all under one year of age) undergoing their first palate reconstruction surgery. To our knowledge, this study is the first to report transfection of fibroblast cell lines from CPO patients with microRNA mimics (to up-regulate expression) or inhibitors (to downregulate expression).
2. Results
2.1. Identification of Deregulated miRNAs in CPO Patients
A preliminary screening experiment was performed to identify miRNAs deregulated in patients with cleft palate only (CPO) malformation. The miRNA expression profiles of fresh palatal tissues collected during the initial corrective surgery from 11 CPO patients were compared to those of HEPM cells, a human embryonic palatal mesenchymal cell line representing normal palate development. Using the NanoString® nCounter miRNA Expression platform, a panel comprising 827 miRNAs was analyzed. The comprehensive list of miRNAs along with the raw expression data are provided as Supplementary Material (Table S1). Expression analysis revealed that 19 miRNAs were significantly upregulated, while 16 miRNAs were downregulated in CPO samples compared to control (Figure 1).
2.2. Validation of miRNA Dysregulation and Target Gene Expression in Primary CPO Cell Cultures
Following the identification of deregulated miRNAs in the preliminary screening, primary cell cultures were established from seven patient specimens to further investigate the regulatory mechanisms involved in CPO development. Real-time PCR was performed to analyze the expression of the most dysregulated miRNAs and some of their predicted target genes. Specifically, the expression levels of the five most upregulated and three most downregulated miRNAs identified in Figure 1 were evaluated. miRNA expression in patient-derived cell cultures was compared to that of HEPM cells, with the results summarized in Table 1.
Consistent with the preliminary screening data from fresh tissue, expression levels of miR-205-5p and miR-200c-3p were significantly elevated in CPO cells, while miR-125a-5p expression was significantly reduced. Conversely, miR-100-5p and miR-29b-3p did not show significant differences compared to the control. It should be noted that some expression assays failed and were therefore excluded from the analysis.
Potential target genes of miR-205-5p, miR-200c-3p, and miR-125a-5p were selected based on prediction scores from miRDB (mirdb.org/) and TargetScan 7.2 databases [6], and their expression levels were analyzed in cultured cells. Since miRNAs generally act as negative regulators of gene expression, the predicted target genes of miR-205-5p and miR-200c-3p were expected to be downregulated, whereas the predicted target genes of miR-125a-5p were expected to be upregulated. Most of the genes investigated showed expression changes consistent with these expectations, although not all changes reached statistical significance or were fully concordant, as detailed in Table 2.
The inhibition of overexpressed miR-205-5p and miR-200c-3p in CPO patient-derived cells did not result in increased expression of their target genes (Table 3).
Indeed, the expression levels of all investigated genes remained largely unchanged following miRNA inhibition. In contrast, the positive control assay demonstrated that transfection with a let-7c-5p inhibitor effectively suppressed the expression of the reporter gene HMGA2.
Cell transfection with oligonucleotides mimicking the under-expressed miR-125a-5p, as expected, resulted in decreased expression of its potential target genes (Table 4), with PRSS35 and PRTG showing significant inhibition.
3. Discussion
A growing body of evidence implicates miRNA-mRNA regulatory networks in both normal craniofacial development and the pathogenesis of craniofacial anomalies, including cleft palate [7,8]. Epidemiological studies have reported considerable variability in the prevalence of CPO across different ethnic groups and geographical regions, reflecting the interplay between genetic heterogeneity and environmental factors [9]. This heterogeneity underscores the importance of geographically focused studies to identify population-specific molecular mechanisms involved in CPO development.
In this context, the present study aimed to identify deregulated miRNAs in palatal tissue from Italian CPO patients by comparison with a commercially available human embryonic palate mesenchymal (HEPM) cell line, which is widely used as an in vitro model of palatal mesenchyme. Using NanoString® Technologies, miRNA expression profiles were assessed from palatal tissue samples of 11 patients and compared with HEPM cells. We identified 19 significantly upregulated and 16 downregulated miRNAs. Expression profiling in patient-derived primary cell cultures confirmed the differential expression of key miRNAs, providing consistency between tissue and cellular models. Based on fold change and statistical significance, three miRNAs (two upregulated and one downregulated) were selected for functional analysis. Target genes of the upregulated miRNAs miR-205-5p and miR-200c-3p, as well as the downregulated miRNA miR-125a-5p, were selected based on their known involvement in CPO development [10] and their predicted regulatory relationships with these miRNAs, with the aim of pinpointing the underlying molecular mechanisms. Expression analyses of these target genes in primary cells revealed patterns generally consistent with expected miRNA regulatory effects, although not all changes were statistically significant or directionally concordant (Table 2). Finally, to evaluate miRNA-target gene interactions, miR-205-5p and miR-200c-3p downregulation and miR-125a-5p overexpression were induced in primary cell lines from CPO patients using miRNA inhibitors and mimic respectively.
Notably, miR-205-5p has not been previously implicated in palatogenesis or the etiology of cleft palate. However, a study by Wang et al. [11] reported miR-205-5p as the most deregulated miRNA in non-syndromic cleft lip with or without cleft palate (nsCL/P) tis-sues. It is important to highlight that their findings were based on a limited number of samples and mixed tissue types (two lip mucosa and two palatal mucosa), which warrants caution when extrapolating these results specifically to isolated cleft palate cases. This underscores the need for further investigation of miR-205-5p in the specific context of CPO.
In our cohort of 7 primary CPO cell lines, PAX9, a predicted high-confidence target of miR-205-5p, was significantly downregulated. It is a transcription factor member of the paired box family, which has been shown to play a critical role in human palate development [12], and has also been implicated in the etiology of cleft palate in mouse models [13,14,15]. Despite these observations, functional inhibition of miR-205-5p in our primary cell model did not significantly alter expression of its predicted target genes, suggesting complex regulatory mechanisms or compensatory pathways that warrant further investigation.
The upregulation of miR-200c-3p observed in cultures of cells derived from our CPO patients corroborates the findings of Won et al. [16], who demonstrated, using a mouse palate culture model, that miR-200c plays a crucial role in palate development by regulating E-cadherin expression, cell death, and palate shelf motility. Consistently, we observed significant downregulation of HIPK3, NR5A2, and VASH2, each with a top prediction score of 100 (miRDB; https://mirdb.org/), and TBK1, with a prediction score of 93, in our primary CPO cell lines as miR-200c-3p targets. The NR5A2 gene encodes the transcription factor nuclear receptor subfamily 5 group A member 2 (NR5A2). Its function is vital to several physiological processes, including normal physiology, homeostasis, embryonic development, lipid metabolism and anti-inflammatory activities [17]. VASH2 belongs to the VASH family together with VASH1; it activates actin-binding, metallocarboxypeptidase and microtubule-binding activities and has been shown to promote angiogenesis in the process of injury repair [18]. TBK1, a kinase implicated in innate immunity and development, has also been associated with increased CPO risk in maternal smoking cases in a multiple single-nucleotide polymorphisms association study [19]. HIPK3, encoding a homeodomain-interacting protein kinase involved in diverse cellular functions, has a less clear role in craniofacial development and merits further study. However, the inhibition of miR-200c-3p in our cell model did not lead to a significant upregulation of these targets, suggesting additional layers of regulation or context-dependent activities.
Among downregulated miRNAs, miR-125a-5p showed the most prominent under-expression. Several predicted targets, including PRTG, MAP6, and DVL3, were upregulated. Transfection of primary CPO cell lines with a miR-125a-5p mimic confirmed that PRTG is a target gene of this miRNA. Interestingly, protogenin (PRTG), as well as DVL3, is present in the neural crest differentiation pathway (PathCards.genecards.org), as it enhances the migration and survival of cephalic neural crest cells, which are responsible for facial and oral development [20]. Previous studies have linked low-frequency coding variants in PRTG to nsCL/P [21]. More recently, Siewert et al. investigated the expression pattern of PRTG in specific cell populations from the pharyngeal arches, which are responsible for mesenchyme development and cell migration, to explore its potential role in nsCL/P etiology [22]. Based on these insights, we hypothesize that PRTG upregulation may impair the survival and function of cranial neural crest cells, which are essential for palatogenesis. Such dysregulation could lead to failure of palatal shelf fusion during embryogenesis, resulting in cleft palate. Importantly, our study is the first to implicate PRTG in a well-defined, homogeneous cohort of CPO patients, thereby extending the gene’s suspected involvement from nsCL/P to isolated cleft palate. These findings provide valuable insights into the gene’s possible mechanistic role in cleft palate pathogenesis. Similarly, we validated PRSS35 as a direct target of miR-125a-5p, marking this study as the inaugural report linking PRSS35 to CPO etiology. PRSS35 encodes a serine protease that belongs to a group of proteins with critical roles in fundamental biological processes. In a case-control study, single-nucleotide polymorphisms mapping to the PRSS35 gene were originally found to be associated with CL/P in several subgroups of the main cohort [23]. More recently, the association has been confirmed by de Araujo’s group, although still limited to a study group of CL/P patients [24]. This finding aligns with previous evidence demonstrating Prss35 expression in craniofacial and palatal tissues during critical windows of murine embryogenesis, particularly at embryonic days 12 and 13, corresponding to the stages of palatal shelf growth and fusion [23]. Given the role of proteases in extracellular matrix remodeling and cell migration, dysregulation of PRSS35 may impair palatogenesis by disrupting these processes. Therefore, we hypothesize that disturbed expression of PRSS35 may contribute to CPO pathogenesis by interfering with the molecular mechanisms governing palatal shelf elevation and fusion. This hypothesis underscores the need for mechanistic studies to clarify the functional consequences of PRSS35 perturbation during human palate development and its contribution to CPO. MAP6, a microtubule-associated protein involved in stabilizing cytoskeletal architecture, emerged as another miR-125a-5p target of interest, though its precise role in CPO remains to be elucidated.
Overall, the strong concordance observed between miRNA expression profiles in fresh tissues and corresponding primary fibroblast cultures supports the involvement of miR-205-5p, miR-200c-3p, and miR-125a-5p in CPO pathogenesis, suggesting that primary fibroblasts serve as a relevant model for studying miRNA-mediated mechanisms in CPO development.
However, study limitations include the use of a single, commercially available control cell line (HEPM) rather than patient-matched healthy tissue, primarily due to ethical and practical constraints. Moreover, primary cultures derived from palatal tissues predominantly comprised fibroblasts; while these cells are key mesenchymal components in palatogenesis, the absence of other cell types may influence miRNA expression profiles and regulatory interactions. Despite these constraints, our study offers novel insights by combining unbiased miRNA discovery in a homogeneous cohort of very young Italian CPO patients (mean age 8 months ± 4) with functional validation in patient-derived cells, thereby bridging in vivo observations with mechanistic interrogation.
4. Materials and Methods
4.1. Specimen Collection
For the present study, mucosal tissue samples were collected from surgical excisions that were not used for palate reconstruction in patients affected by CPO. In the operating theatre, a portion of each tissue fragment was immersed in PBS for rapid culturing to isolate fibroblasts, while another portion was preserved in RNAlater (Sigma-Aldrich, Inc., St. Louis, MO, USA) for subsequent RNA extraction. Informed consent was obtained from the parents of patients who were included in the study, and the protocol was approved by the relevant ethics committees for the Meyer Hospital in Florence and the San Bortolo Hospital in Vicenza, both in Italy. A thorough medical history was conducted on all patients, ruling out the presence of features attributable to specific syndromes, neurological disorders, or metabolic diseases. Additionally, the presence of recurrent diseases within the family and the potential impact of known teratogenic substances was excluded. The clinical data of the patients are summarized in Table 5.
4.2. Isolation and Primary Culture of Human Palatal Fibroblasts
Primary human fibroblast cells were isolated from ex vivo palatal tissue fragments obtained from surgical resections. The tissue was cut into small pieces and placed in a 24-well plate. Each fragment was covered with a drop of DMEM/F12 medium (Sigma-Aldrich) supplemented with 50% fetal bovine serum (FBS), 2% penicillin/streptomycin, and 1% L-glutamine (all from Sigma-Aldrich). The plates were incubated at 37 °C in a humidified atmosphere of 5% CO₂ to facilitate cell adhesion. Subsequently, additional medium was added, and fibroblast outgrowth was typically observed after approximately 10 days. The medium was then replaced with DMEM/F12 supplemented with 10% FBS and antibiotics, and cells were cultured until they reached confluence. Once confluent, fibroblasts were transferred to T25 flasks and expanded to obtain a sufficient quantity for experimental analyses. Seven of the 11 primary cultures were selected for downstream experiments due to superior tissue quality, efficient cell adhesion, robust outgrowth, and consistent cellular morphology. Notably, the seven selected cell lines were derived from patients who had undergone surgery at an age no greater than 10 months.
4.3. RNA Isolation
Ex-vivo surgical tissue fragments were homogenized utilizing Potter-Elvehjem tissue grinders (Bellco Glass Inc., Vineland, NJ, USA). Cultured cells were harvested using trypsin/EDTA and subsequently pelleted by centrifugation at 500 × g for 1 minute. In both cases, total RNA was extracted and purified employing the Quick-RNA Microprep Kit (Zymo Research, Irvine, CA, USA). Briefly, samples were lysed with RNA Lysis Buffer and purified using a silica filter column, following the manufacturer’s instructions. The quantity of RNA and absence of contaminants were assessed using a Nanodrop 2000 spectrophotometer (Thermo Scientific, Waltham, MA, USA).
4.4. miRNA Expression Profiling
RNAs isolated from the palatal tissue of 11 patients and from a commercial cell line derived from embryonic palatal shelves (HEPM; LGC Standards, Milan, Italy; Lot/Batch No: 58798172) were processed for miRNA expression profiling using NanoString® Technology nCounter Human v3 miRNA Expression Assay (NanoString, Seattle, WA, USA) at the manufacturer’s facility (Diatech Lab Line, Jesi, Italy). The NanoString nCounter raw data were analyzed with the nSolver software 4.0. Geometric mean of negative control probe counts was used to perform background subtraction. Raw expression data was normalized in a two steps process; the first normalization factor was calculated using geometric mean of the positive controls that are spiked in to every sample, while geometric mean of all genes was used for CodeSet content normalization. Expression levels of miRNA in CPO biopsies were compared to HEPM cell line through fold change ratio calculation and the differential expression call, a test developed for nCounter exploratory studies data. Differential expression call is an error model to assist in determining confidence of ratios when no replicates exist that evaluate whether observed count differences between individual samples were significantly beyond platform technical noise.
4.5. Reverse Transcription
All miRNAs were reverse transcribed from 1,000 ng of total RNA in a final reaction volume of 10 µL. This reaction contained 1 µL of 10X poly(A) polymerase buffer, 1 mM ATP (both from New England Biolabs, Ipswich, MA, USA), 0.1 mM of each deoxynucleotide (dATP, dCTP, dGTP, and dTTP) (Sigma-Aldrich), 100 units of MuLV reverse transcriptase (New England Biolabs), and 1 µM reverse transcription (RT) primer (biomers.net GmbH, Ulm, Germany). The sequence of the RT primer was 5’-CAGGTCCAGTTTTTTTTTTTTTTTVN-3’, where V represents A, C, or G and N represents A, C, G, or T [25]. The reaction was incubated at 42 °C for 1 hour, followed by a 5-minute inactivation at 95 °C. For target gene expression analysis, cDNA synthesis was performed using 500 ng of total RNA and the PrimeScript RT Master Mix kit (Takara Bio, Kusatsu, Japan), following the manufacturer’s protocol. The thermal profile for this reaction included incubation at 37 °C for 15 minutes, followed by inactivation at 85 °C for 5 seconds.
4.6. Real-Time PCR Amplifications
Quantitative PCR assays were designed to investigate both miRNAs and their potential target genes. Primer sequences for miRNA expression analysis were designed using the miRprimer software [26], while primer sequences for gene expression analysis were designed with the aid of primerBlast tool at NCBI web site [27]. All miRNAs and target genes primer sequences can be provided upon request to the corresponding author. Quantitative real-time PCR (qPCR) was performed in a final volume of 20 μL, consisting of 10 μL Power SYBR Green Master Mix (Life Technologies, Foster City, CA, USA), 100 nM each of forward and reverse primers, and 300 nM cDNA. Reactions were conducted on a QuantStudio™ 5 Real-Time PCR System (Thermo Fisher Scientific). The cycling conditions comprised an initial denaturation at 95 °C for 2 minutes, followed by 40 cycles of 15 seconds at 95 °C and 60 seconds at 60 °C. A melt curve analysis was performed at the end of each assay to verify amplification specificity. All reactions were carried out in analytical duplicates. Negative controls were included in each experiment to rule out biological contamination. For normalization, expression levels of target genes were referenced to RPL13, while miRNA quantification utilized RNU44 as the endogenous control.
The relative gene expression was quantified with the delta-delta Ct calculation method [28], using RNU44 as reference gene for miRNAs, and RPL13 as reference gene for target genes. An independent t-test without the assumption of equal variances was applied to compare the delta Ct values between CPO cells and HEPM. A paired sample t-test was used to compare the delta Ct values between transfected CPO cells and their vehicle-treated controls. Expression level differences were calculated as fold changes using the formula 2 −ΔΔCt.
4.7. Transfection with miRNA Inhibitors and Mimic
Primary human fibroblasts were seeded into 6-well plates to achieve approximately 60% confluence at the time of transfection. Oligonucleotide for mirVana™ miRNA mimic (hsa-miR-125a-5p) and miRNA inhibitors (hsa-miR-205-5p and hsa-miR-200c-3p) (Thermo Fisher Scientific) were reconstituted in sterile, nuclease-free water to obtain stock solutions at 100 μM. Working solutions at 10 μM were freshly prepared by diluting the stock solutions in sterile nuclease-free water immediately prior to use. Lipofectamine™ RNAiMAX (Thermo Fisher Scientific) was diluted in Opti-MEM™ reduced-serum medium (Thermo Fisher Scientific) in accordance with the manufacturer’s protocol. For each well, 30 pmol of miRNA mimic or inhibitor was diluted in 125 μL of Opti-MEM™. The diluted miRNA solution was mixed 1:1 with the diluted Lipofectamine™ RNAiMAX and incubated at room temperature for 5 minutes to allow complex formation. The culture medium was gently removed to eliminate non-adherent and dead cells and replaced with fresh DMEM/F12 serum-free medium. The miRNA-Lipofectamine™ complex was then added to each well, and cells were incubated at 37 °C for 48 hours. To assess transfection efficiency and specificity, both positive and negative controls were included. The mirVana™ miRNA inhibitor let-7c positive control (Thermo Fisher Scientific) was used as an inhibitory control, with successful inhibition validated by upregulation of its target gene HMGA2, as measured by RT-qPCR. For mimic transfection, the mirVana™ miRNA mimic miR-1 positive control (Thermo Fisher Scientific) was employed, assessing downregulation of its target gene PTK9. A negative transfection control, mirVana™ miRNA mimic/inhibitor Negative Control #1 (Thermo Fisher Scientific), was included to establish baseline expression levels of the tested target genes. This negative control was transfected using the same methodology as the experimental mirVana™ miRNA mimic or inhibitors, as well as the positive controls.
5. Conclusions
Our results reveal a miRNA-mRNA interaction network that may play a critical role in the etiology of CPO. Interestingly, our findings on miR-205-5p deregulation in CPO are particularly striking given its previously unreported role in palatogenesis, highlighting a potential new avenue for understanding CPO etiology. Specifically, PAX9 emerged as a key regulatory target of miR-205-5p, while miR-125a-5p appears to modulate genes such as PRTG and PRSS35, which are involved in neural crest cell function and extracellular matrix remodeling. These findings deepen our understanding of the genetic and epigenetic mechanisms underlying cleft palate and provide a solid foundation for future investigations aimed at unraveling the complex molecular pathways governing craniofacial development.
Supplementary Materials
The following supporting information can be downloaded at: Preprints.org, Table S1: Raw data from NanoString® nCounter miRNA Expression platform.
Author Contributions
All authors contributed to the study conception and design. Patient enrollment and data interpretation, F.A., V.Z., G.S., R.S.; methodology and data collection, A.Palmieri, A.Pellati; bioinformatic analyses, L.S.; writing of original draft, M.M., L.S., A.Palmieri; supervision, M.M., F.C.; funding acquisition, M.M., A.Palmieri; all authors read and approved the final manuscript.
Funding
This research was funded by the Association Interethnos-Interplast Italy (M.M.) and by Banca d’Italia (M.M.); A.Palmieri has received research support from BENEFICENTIA Stiftung.
Institutional Review Board Statement
This study was performed in line with the principles of the Declaration of Helsinki. Approval was granted by the Ethics Committee of reference for Meyer Hospital in Florence (08/03/2022) and for AULSS 8 Berica - Ospedale di Vicenza in Vicenza (26/05/2023), both in Italy.
Informed Consent Statement
Informed consent was obtained from parents of all subjects involved in the study.
Data Availability Statement
All miRNAs and target genes primer sequences can be provided upon request to the corresponding author. The raw data are viewable in the table uploaded as supplementary material (Table S1).
Acknowledgments
We are indebted to the families participating in the study for their invaluable contribution. We would also like to express our gratitude to Dr Ugo Baciliero and Dr Barbara Morello for their assistance in liaising with patients’ families during the recruitment process.
Conflicts of Interest
The authors declare no conflicts of interest. The funders had no role in the design of the study; in the collection, analyses, or interpretation of data; in the writing of the manuscript; or in the decision to publish the results.
Abbreviations
The following abbreviations are used in this manuscript:
| CL/P | Cleft Lip with or without cleft Palate |
| CLO | Cleft Lip Only |
| CPO | Cleft Palate Only |
| DE | Differential Expression |
| EMT | Epithelial to Mesenchymal Transition |
| FBS | Fetal Bovine Serum |
| HEPM | Human Embryonic Palate Mesenchymal |
| miRNA | microRNA |
| nsCL/P | non-syndromic Cleft Lip with or without cleft Palate |
| nsCPO | non-syndromic form of Cleft Palate Only |
| RT-qPCR | Reverse Transcription-quantitative Polymerase Chain Reaction |
| SNP | Single Nucleotide Polymorphisms |
References
- Tolarova, M.M.; Cervenka, J. Classification and birth prevalence of orofacial clefts. Am J Med Genet 1998, 75, 126–137. [Google Scholar] [CrossRef]
- Robinson, K.; Curtis, S.W.; Leslie, E.J. The heterogeneous genetic architectures of orofacial clefts. Trends Genet 2024, 40, 410–421. [Google Scholar] [CrossRef]
- Martinelli, M.; Palmieri, A.; Carinci, F.; Scapoli, L. Non-syndromic Cleft Palate: An Overview on Human Genetic and Environmental Risk Factors. Front Cell Dev Biol 2020, 8, 592271. [Google Scholar] [CrossRef] [PubMed]
- Leslie, E.J.; Liu, H.; Carlson, J.C.; Shaffer, J.R.; Feingold, E.; Wehby, G.; Laurie, C.A.; Jain, D.; Laurie, C.C.; Doheny, K.F.; et al. A Genome-wide Association Study of Nonsyndromic Cleft Palate Identifies an Etiologic Missense Variant in GRHL3. American journal of human genetics 2016, 98, 744–754. [Google Scholar] [CrossRef]
- Seelan, R.S.; Pisano, M.M.; Greene, R.M. MicroRNAs as epigenetic regulators of orofacial development. Differentiation 2022, 124, 1–16. [Google Scholar] [CrossRef] [PubMed]
- Agarwal, V.; Bell, G.W.; Nam, J.W.; Bartel, D.P. Predicting effective microRNA target sites in mammalian mRNAs. Elife 2015, 4. [Google Scholar] [CrossRef]
- Shi, C.; Jiao, P.; Chen, Z.; Ma, L.; Yao, S. Exploring the roles of noncoding RNAs in craniofacial abnormalities: A systematic review. Dev Biol 2024, 505, 75–84. [Google Scholar] [CrossRef]
- Im, H.; Song, Y.; Kim, J.K.; Park, D.K.; Kim, D.S.; Kim, H.; Shin, J.O. Molecular Regulation of Palatogenesis and Clefting: An Integrative Analysis of Genetic, Epigenetic Networks, and Environmental Interactions. International journal of molecular sciences 2025, 26. [Google Scholar] [CrossRef] [PubMed]
- Burg, M.L.; Chai, Y.; Yao, C.A.; Magee, W., 3rd; Figueiredo, J.C. Epidemiology, Etiology, and Treatment of Isolated Cleft Palate. Front Physiol 2016, 7, 67. [Google Scholar] [CrossRef]
- Suzuki, A.; Li, A.; Gajera, M.; Abdallah, N.; Zhang, M.; Zhao, Z.; Iwata, J. MicroRNA-374a, -4680, and -133b suppress cell proliferation through the regulation of genes associated with human cleft palate in cultured human palate cells. BMC Med Genomics 2019, 12, 93. [Google Scholar] [CrossRef]
- Wang, S.; Sun, C.; Meng, Y.; Zhang, B.; Wang, X.; Su, Y.; Shi, L.; Zhao, E. A pilot study: Screening target miRNAs in tissue of nonsyndromic cleft lip with or without cleft palate. Exp Ther Med 2017, 13, 2570–2576. [Google Scholar] [CrossRef] [PubMed]
- Lan, Y.; Xu, J.; Jiang, R. Cellular and Molecular Mechanisms of Palatogenesis. Current topics in developmental biology 2015, 115, 59–84. [Google Scholar] [CrossRef] [PubMed]
- Jia, S.; Zhou, J.; Fanelli, C.; Wee, Y.; Bonds, J.; Schneider, P.; Mues, G.; D’Souza, R.N. Small-molecule Wnt agonists correct cleft palates in Pax9 mutant mice in utero. Development 2017, 144, 3819–3828. [Google Scholar] [CrossRef]
- Li, C.; Lan, Y.; Krumlauf, R.; Jiang, R. Modulating Wnt Signaling Rescues Palate Morphogenesis in Pax9 Mutant Mice. Journal of dental research 2017, 96, 1273–1281. [Google Scholar] [CrossRef]
- Almaidhan, A.; Cesario, J.; Landin Malt, A.; Zhao, Y.; Sharma, N.; Choi, V.; Jeong, J. Neural crest-specific deletion of Ldb1 leads to cleft secondary palate with impaired palatal shelf elevation. BMC Dev Biol 2014, 14, 3. [Google Scholar] [CrossRef]
- Won, H.J.; Won, H.S.; Shin, J.O. Increased miR-200c levels disrupt palatal fusion by affecting apoptosis, cell proliferation, and cell migration. Biochem Biophys Res Commun 2023, 664, 43–49. [Google Scholar] [CrossRef]
- Sandhu, N.; Rana, S.; Meena, K. Nuclear receptor subfamily 5 group A member 2 (NR5A2): role in health and diseases. Mol Biol Rep 2021, 48, 8155–8170. [Google Scholar] [CrossRef]
- Kimura, H.; Miyashita, H.; Suzuki, Y.; Kobayashi, M.; Watanabe, K.; Sonoda, H.; Ohta, H.; Fujiwara, T.; Shimosegawa, T.; Sato, Y. Distinctive localization and opposed roles of vasohibin-1 and vasohibin-2 in the regulation of angiogenesis. Blood 2009, 113, 4810–4818. [Google Scholar] [CrossRef]
- Beaty, T.H.; Ruczinski, I.; Murray, J.C.; Marazita, M.L.; Munger, R.G.; Hetmanski, J.B.; Murray, T.; Redett, R.J.; Fallin, M.D.; Liang, K.Y.; et al. Evidence for gene-environment interaction in a genome wide study of nonsyndromic cleft palate. Genet Epidemiol 2011, 35, 469–478. [Google Scholar] [CrossRef]
- Wang, Y.C.; Juan, H.C.; Wong, Y.H.; Kuo, W.C.; Lu, Y.L.; Lin, S.F.; Lu, C.J.; Fann, M.J. Protogenin prevents premature apoptosis of rostral cephalic neural crest cells by activating the alpha5beta1-integrin. Cell Death Dis 2013, 4, e651. [Google Scholar] [CrossRef] [PubMed]
- Leslie, E.J.; Carlson, J.C.; Shaffer, J.R.; Buxo, C.J.; Castilla, E.E.; Christensen, K.; Deleyiannis, F.W.B.; Field, L.L.; Hecht, J.T.; Moreno, L.; et al. Association studies of low-frequency coding variants in nonsyndromic cleft lip with or without cleft palate. Am J Med Genet A 2017, 173, 1531–1538. [Google Scholar] [CrossRef] [PubMed]
- Siewert, A.; Hoeland, S.; Mangold, E.; Ludwig, K.U. Combining genetic and single-cell expression data reveals cell types and novel candidate genes for orofacial clefting. Sci Rep 2024, 14, 26492. [Google Scholar] [CrossRef]
- Letra, A.; Menezes, R.; Fonseca, R.F.; Govil, M.; McHenry, T.; Murphy, M.J.; Hennebold, J.D.; Granjeiro, J.M.; Castilla, E.E.; Orioli, I.M.; et al. Novel cleft susceptibility genes in chromosome 6q. Journal of dental research 2010, 89, 927–932. [Google Scholar] [CrossRef] [PubMed]
- de Araujo, T.K.; Secolin, R.; Felix, T.M.; de Souza, L.T.; Fontes, M.I.; Monlleo, I.L.; de Souza, J.; Fett-Conte, A.C.; Ribeiro, E.M.; Xavier, A.C.; et al. A multicentric association study between 39 genes and nonsyndromic cleft lip and palate in a Brazilian population. J Craniomaxillofac Surg 2016, 44, 16–20. [Google Scholar] [CrossRef] [PubMed]
- Balcells, I.; Cirera, S.; Busk, P.K. Specific and sensitive quantitative RT-PCR of miRNAs with DNA primers. BMC Biotechnol 2011, 11, 70. [Google Scholar] [CrossRef]
- Busk, P.K. A tool for design of primers for microRNA-specific quantitative RT-qPCR. BMC Bioinformatics 2014, 15, 29. [Google Scholar] [CrossRef]
- Ye, J.; Coulouris, G.; Zaretskaya, I.; Cutcutache, I.; Rozen, S.; Madden, T.L. Primer-BLAST: a tool to design target-specific primers for polymerase chain reaction. BMC Bioinformatics 2012, 13, 134. [Google Scholar] [CrossRef]
- Livak, K.J.; Schmittgen, T.D. Analysis of relative gene expression data using real-time quantitative PCR and the 2(-Delta Delta C(T)) Method. Methods 2001, 25, 402–408. [Google Scholar] [CrossRef]
Figure 1.
miRNAs significantly deregulated in palatal mucosa of 11 CPO patients identified by NanoString® assay, employing HEPM cells as control.
Figure 1.
miRNAs significantly deregulated in palatal mucosa of 11 CPO patients identified by NanoString® assay, employing HEPM cells as control.
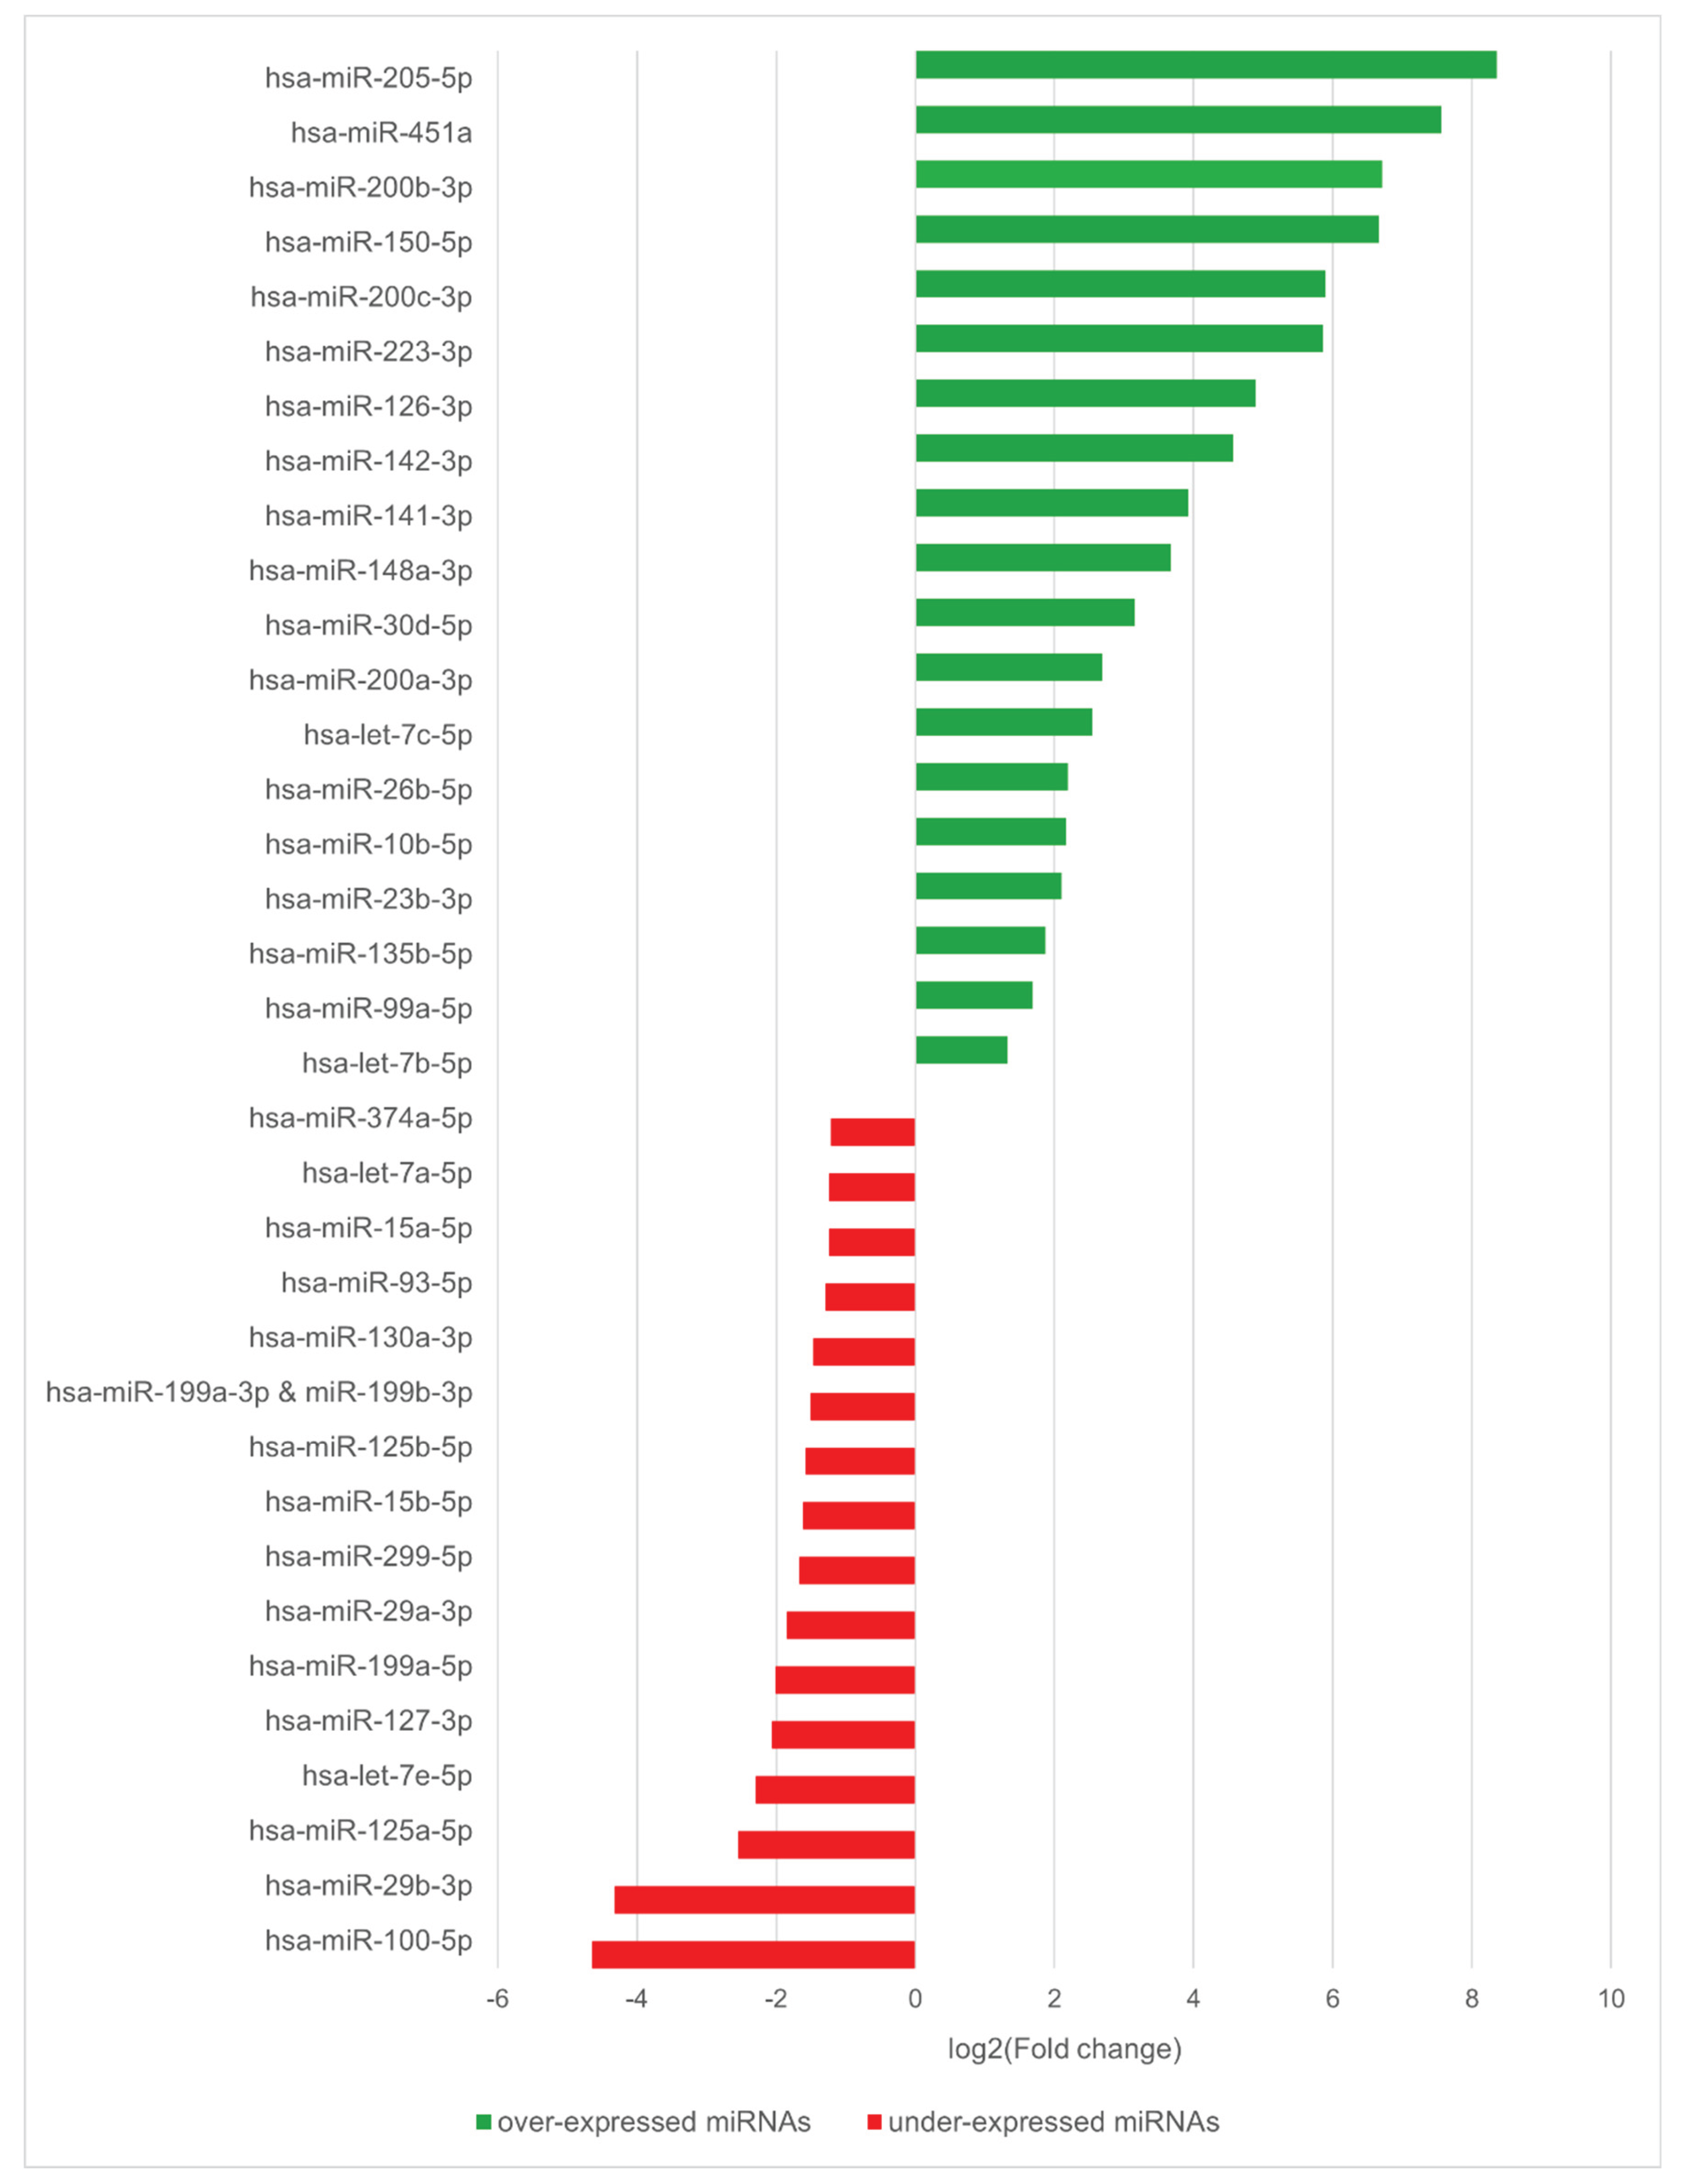

Table 1.
Expression levels in cultured cells from 7 CPO patients of the microRNAs identified as most deregulated by the Nanostring® assay.
Table 1.
Expression levels in cultured cells from 7 CPO patients of the microRNAs identified as most deregulated by the Nanostring® assay.
| miRNA | ΔΔCt | Student’s t | df | p value | Fold change | 95% CI | |
|---|---|---|---|---|---|---|---|
| mir205-5p | -5.5 | -6.04 | 9.35 | 0.0001* | 45.39 | 10.96 | 187.96 |
| mir200c-3p | -2.46 | -3.44 | 12 | 0.005* | 5.51 | 1.87 | 16.22 |
| mir125a-5p | 7.47 | 2.95 | 6.02 | 0.025* | 0.01 | 7.70E-05 | 0.41 |
| mir29b-3p | -0.76 | -1.1 | 10.93 | 0.293 | 1.69 | 0.59 | 4.84 |
| mir100-5p | -0.47 | -0.91 | 8.13 | 0.386 | 1.38 | 0.61 | 3.13 |
* p < 0.05; df: degrees of freedom.
Table 2.
Expression analysis of putative target genes of selected miRNAs. Gene expression levels in cultured cells from CPO patients were compared to those in the commercial HEPM cell line.
Table 2.
Expression analysis of putative target genes of selected miRNAs. Gene expression levels in cultured cells from CPO patients were compared to those in the commercial HEPM cell line.
| Gene | Potential regulator | Score (miRDB) | ΔΔCt | Student's t | df | P value | Fold change | 95% CI | |
|---|---|---|---|---|---|---|---|---|---|
| AXIN2 | miR-205-5p | 89 | 0.96 | 1.64 | 11.8 | 0.126 | 0.51 | 0.21 | 1.24 |
| CCNJ | miR-205-5p | 97 | -0.07 | -0.11 | 8.43 | 0.911 | 1.05 | 0.41 | 2.66 |
| CDK19 | miR-205-5p | 99 | 1.19 | 2.05 | 6.11 | 0.085 | 0.44 | 0.17 | 1.17 |
| JADE1 | miR-205-5p | 89 | 0.23 | 0.49 | 8.51 | 0.633 | 0.86 | 0.42 | 1.76 |
| PAX9 | miR-205-5p | 91 | 3.65 | 3.03 | 11.65 | 0.011* | 0.08 | 0.01 | 0.5 |
| HIPK3 | miR-200c-3p | 100 | 0.36 | 2.28 | 11.53 | 0.042* | 0.78 | 0.62 | 0.99 |
| NR5A2 | miR-200c-3p | 100 | 2.58 | 3.26 | 6.35 | 0.016* | 0.17 | 0.04 | 0.63 |
| RECK | miR-200c-3p | 99 | 0.81 | 1.79 | 7.62 | 0.112 | 0.57 | 0.27 | 1.18 |
| TBK1 | miR-200c-3p | 93 | 2.68 | 4.28 | 7.72 | 0.003* | 0.16 | 0.06 | 0.43 |
| VASH2 | miR-200c-3p | 100 | 1.29 | 2.45 | 10.81 | 0.033* | 0.41 | 0.18 | 0.91 |
| ZEB1 | miR-200c-3p | 100 | 0.12 | 0.61 | 9.46 | 0.554 | 0.92 | 0.67 | 1.26 |
| DVL3 | miR-125a-5p | 64 | -2.97 | -7.82 | 9.15 | <0.001* | 7.82 | 4.32 | 14.16 |
| MAP6 | miR-125a-5p | 87 | -1.36 | -3.27 | 8.86 | 0.010* | 2.56 | 1.33 | 4.91 |
| PRSS35 | miR-125a-5p | 86 | 0.33 | 0.41 | 8.16 | 0.69 | 0.79 | 0.22 | 2.87 |
| PRTG | miR-125a-5p | 95 | -1.51 | -3.29 | 10.3 | 0.008* | 2.85 | 1.41 | 5.79 |
| TNFSF4 | miR-125a-5p | 90 | -1.11 | -1.14 | 8.27 | 0.288 | 2.16 | 0.46 | 10.19 |
* p < 0.05; df: degrees of freedom.
Table 3.
Gene expression analysis of potential target genes after inhibition of specific miRNAs.
| Inhibited miRNA | Gene | ΔΔCt | Student’s t | df | p value | Fold change | 95% CI | |
|---|---|---|---|---|---|---|---|---|
| miR-205-5p | AXIN2 | -0.20 | -1.11 | 1 | 0.467 | 1.15 | 0.23 | 5.88 |
| CCNJ | 0.19 | 0.36 | 1 | 0.779 | 0.87 | 0.01 | 96.44 | |
| CDK19 | -0.001 | -0.004 | 1 | 0.997 | 1.00 | 0.29 | 3.42 | |
| JADE1 | -0.42 | -0.75 | 1 | 0.592 | 1.34 | 0.01 | 182.88 | |
| PAX9 | 0.40 | 1.91 | 1 | 0.307 | 0.76 | 0.12 | 4.77 | |
| miR-200c-3p | HIPK3 | 0.44 | 1.76 | 6 | 0.129 | 0.74 | 0.48 | 1.13 |
| NR5A2 | 0.50 | 1.36 | 6 | 0.222 | 0.71 | 0.38 | 1.32 | |
| TBK1 | 0.76 | 2.84 | 6 | 0.030* | 0.59 | 0.38 | 0.93 | |
| VASH2 | -0.21 | -1.13 | 6 | 0.301 | 1.16 | 0.85 | 1.58 | |
* p < 0.05; df: degrees of freedom.
Table 4.
Gene expression analysis of potential target genes after miR-125a-5p mimic transfection.
| Gene | ΔΔCt | Student’s t | df | p value | Fold change | 95% CI | |
|---|---|---|---|---|---|---|---|
| DLV3 | 0.34 | 1.04 | 4 | 0.356 | 0.79 | 0.42 | 1.48 |
| MAP6 | -0.09 | -0.42 | 6 | 0.689 | 1.06 | 0.74 | 1.53 |
| PRSS35 | 0.56 | 2.61 | 6 | 0.040* | 0.68 | 0.47 | 0.98 |
| PRTG | 0.59 | 4.88 | 6 | 0.003* | 0.67 | 0.54 | 0.82 |
| TNFSF4 | 0.69 | 2.12 | 6 | 0.078 | 0.62 | 0.35 | 1.08 |
* p < 0.05; df: degrees of freedom.
Table 5.
Clinical and demographic characteristics of patients included in the study.
| Patient | Gender | Age (months) | Case classification | Nanostring® | Validation |
|---|---|---|---|---|---|
| 1 | Female | 12 | Sporadic | X | |
| 2 | Male | 12 | Sporadic | X | |
| 3 | Male | 11 | Sporadic | X | |
| 4 | Female | 11 | Sporadic | X | |
| 5 | Female | 7 | Sporadic | X | X |
| 6 | Male | 10 | Sporadic | X | X |
| 7 | Male | 5 | Family history of CPO | X | X |
| 8 | Male | 4 | Sporadic | X | X |
| 9 | Male | 6 | Sporadic | X | X |
| 10 | Male | 4 | Sporadic | X | X |
| 11 | Male | 6 | Sporadic | X | X |
Disclaimer/Publisher’s Note: The statements, opinions and data contained in all publications are solely those of the individual author(s) and contributor(s) and not of MDPI and/or the editor(s). MDPI and/or the editor(s) disclaim responsibility for any injury to people or property resulting from any ideas, methods, instructions or products referred to in the content. |
© 2026 by the authors. Licensee MDPI, Basel, Switzerland. This article is an open access article distributed under the terms and conditions of the Creative Commons Attribution (CC BY) license (http://creativecommons.org/licenses/by/4.0/).
Copyright: This open access article is published under a Creative Commons CC BY 4.0 license, which permit the free download, distribution, and reuse, provided that the author and preprint are cited in any reuse.


