
Submitted:
25 January 2026
Posted:
26 January 2026
You are already at the latest version
Abstract
The global refrigerant transition requires the redesign of heating, ventilation and air-conditioning (HVAC) systems. Higher efficiency systems also reduce peak loads and allow better integration of secure, affordable, reliable base-load generation technologies. However, many small and medium-sized air conditioner (AC) manufacturers, particularly in developing and emerging economies, lack the technical capacity to design affordable, energy-efficient systems using next generation refrigerants. This study presents a simulation-driven design approach for developing cost-effective, high-efficiency mini-split AC prototypes using R32, R454B, and R290. Physics-based system models were developed in VapCyc® and CoilDesigner® to conduct component-level simulations and system optimization. Cost analysis was performed to minimize material costs, and optimal designs were validated under ISO 5151 conditions in a psychrometric chamber. All prototypes achieved 33% higher EER and nearly doubled cooling seasonal efficiency compared to reference units, with only a 2–16% increase in material cost. These results indicate an approximately twofold reduction in peak load and emissions at comparable cost. The proposed simulation-driven methodology shortens the product development cycle and enables reliable, high-performance, next generation AC designs, offering a practical pathway for manufacturers in emerging markets to accelerate the transition to sustainable cooling technologies, meeting grid reliability constraints, environmental regulations and market demands for affordability.
Keywords:
next generation refrigerants
; air conditioning
; simulation-driven design
; energy efficiency
; VapCyc
; CoilDesigner
1. Introduction
The global demand for space cooling is experiencing rapid growth, driven by electrification, increasing incomes, and higher temperatures in China, India & ASEAN countries (IEA, 2018). As global temperatures rise, air conditioning is transitioning from a luxury to a necessity for health, comfort, and productivity (International Labour Organization, 2019; Smallcombe et al., 2022; Obringer et al., 2022). However, this surge in cooling demand presents a challenge for grid reliability and energy security. Further, the environmental impact of conventional air conditioning is twofold, comprising both direct and indirect emissions. Direct emissions occur through the leakage and improper disposal of synthetic refrigerants, which are potent greenhouse gases with Global Warming Potentials (GWPs) thousands of times greater than that of carbon dioxide (CO2) (O'Neill et al., 2020; Homma et al., 2025). Indirect emissions, which constitute the larger portion of the environmental footprint, result from the substantial electricity consumption of cooling equipment, a significant fraction of which is generated by burning fossil fuels.
The International Energy Agency (IEA) has highlighted that the number of air conditioning units in buildings worldwide is set to increase from ~1.6 billion today to ~5.6 billion by 2050, an expansion that would require new electricity capacity equivalent to the combined capacity of the United States, European Union, and Japan (IEA 2018; Falchetta et al., 2024). This trajectory poses a critical threat to grid and energy security objectives , underscoring the urgency for a paradigm shift toward sustainable cooling technologies. The development of next-generation room air conditioners (RACs) that are both highly efficient and utilize next generation working fluids is therefore not merely incremental but a critical imperative (Andersen et al., 2020; Purohit et al., 2020).
The international policy landscape, shaped by the landmark Montreal Protocol on Substances that Deplete the Ozone Layer, has been remarkably successful in orchestrating the global phaseout of ozone-depleting substances (ODS) like chlorofluorocarbons (CFCs) and hydrochlorofluorocarbons (HCFCs). They are scheduled to be completely phased out (with the exception of process agents and feedstocks) by 2030 in non-A5 Parties and A5 parties1 (with a small service tail of only 2.5% allowed for the 2030–2040 period) (UNEP, 2010). However, their primary replacements, hydrofluorocarbons (HFCs), while being benign to the ozone layer, were later identified as potent GHGs. HFCs such as R410A, is a zeotropic, albeit a near-azeotropic mixture of difluoromethane (CH2F2, known as R32) and pentafluoroethane (CHF2CF3, known as R125). It does not contain bromine or chlorine, which are known to contribute to ozone depletion. However, R410A has a high global warming potential (GWP) similar to that of R22. The GWP and ozone depletion potential (ODP) values of R22 and R410A are listed in Table 1. R410A has a 100-year GWP of 2100, meaning one kilogram released has the same climate impact as over two thousand times of CO₂. With atmospheric concentrations of HFCs growing at 10-15% per year, they became the fastest-growing category of GHGs (Velders et al., 2012; Velders et al., 2014). Air conditioners (ACs) dominate the HFC market with a 56% share of GWP-weighted tons of carbon dioxide (CO2) equivalent (UNEP Ozone Secretariat, 2015).
Recognizing this impending threat, the global community adopted the Kigali Amendment to the Montreal Protocol in 2016. This agreement established a legally binding global framework for the phasedown of HFC production and consumption by more than 80% over the next 30 years. The amendment sets differentiated timelines for developed (non-Article 5) and developing (Article 5) countries, a move projected to avoid up to 0.4°C of global warming by the end of the century. Research has shown that coupling the HFC phasedown with simultaneous improvements in the energy efficiency of AC units could more than double the climate benefits of the Kigali Amendment alone. Achieving the efficiency levels of the best-available technologies could prevent up to 100 billion tons of CO₂-equivalent emissions by 2050 and avoid significant peaker power plant and grid impacts.(Shah et al., 2017).
This understanding catalyzed extensive research into sustainable cooling technologies. Numerous studies have investigated the performance of next generation low-GWP refrigerant alternatives. Mildly flammable (A2L) refrigerants like R32 have been widely studied as a replacement for R410A, offering a lower GWP and favorable thermodynamic properties, though requiring careful system optimization (Alabdulkarem et al., 2015; Panato et al., 2022; Lee et al., 2024). Hydrocarbon (HC) refrigerants like R290 (propane) offer a near-zero GWP and excellent efficiency but face stricter safety standards due to their high flammability (A3), limiting charge sizes in residential systems (Park et al., 2019; Colbourne and Suen, 2021; Li et al., 2023; Wei et al., 2024; Zou et al., 2025). Newer hydrofluoro-olefin (HFO) blends, such as R454B, have also emerged, providing a balance of low GWP, non-flammability, and performance comparable to legacy refrigerants (Shen et al., 2022; Suerdem et al., 2023; Wu et al., 2024). The consensus is that there is no "one-size-fits-all" solution; optimal refrigerant choice depends on the application, safety constraints, and system design (Calm, 2008).
Parallel to refrigerant research, advancements in component design and system modeling have become central to achieving higher efficiency. Simulation-driven design has been shown to dramatically shorten the product development cycle and reduce costs compared to traditional build-and-test methodologies (Zhao et al., 2023; Hwang & Park, 2024). Physics-based simulation tools are essential for this process. For instance, detailed heat exchanger models, often employing a segment-by-segment approach, are critical for optimizing geometry, circuitry, and airflow to enhance heat transfer and minimize refrigerant charge (Jiang, 2003; Jiang et al., 2006). Similarly, accurate compressor models, frequently based on the 10-coefficient AHRI standard polynomials, are fundamental for predicting system performance across various operating conditions (AHRI, 2015; Aute et al., 2015). System-level simulation platforms, such as the equation-based language Modelica (Fritzson and Engelson, 1998; Tiller; 2001; Wetter et al., 2014), and component-based tools like VapCyc (Richardson et al., 2002; Winkler et al., 2006), allow for the virtual integration and optimization of these components. These tools are often coupled with optimization algorithms, such as genetic algorithms, to explore various design space and identify configurations that maximize performance metrics like the Energy Efficiency Ratio (EER) or Cooling Seasonal Performance Factor (CSPF) (Bau et al., 2015; Li et al., 2018).
Despite these significant technological advancements in both refrigerants and design tools, a critical barrier persists: many small and medium-sized manufacturers (SMEs), particularly in the rapidly growing markets of developing and emerging economies, lack the specialized technical capacity, R&D budgets, and testing facilities to effectively integrate these innovations into cost-effective products (UNEP, 2019). While high-efficiency ACs (UNEP, 2019) with next generation refrigerants, such as R32, R454B and R290, are commercially available at prices comparable to similar ACs using high-GWP refrigerants, high efficiency is often associated with premium products selling at substantially higher prices than less efficient low-end products (Park et al. 2017). Consequently, high-efficiency, low-GWP systems are often positioned as premium products, priced out of reach for the majority of consumers who then default to cheaper, less efficient models that lock in high energy consumption peak load and environmental impacts for years. This creates a significant gap between what is technically possible in a research lab and what is commercially accessible in the mass market, thereby slowing the global transition to sustainable cooling. Price-sensitive consumers, particularly those from emerging economies in the tropics and subtropics, wherein an approximately 70% of the projected growth in cooling demand is expected to occur, prefer to buy low first cost product which is often the least efficient and contains ozone depleting or obsolete refrigerant products. In general, SMEs worldwide lack the technical capabilities to design affordable, energy-efficient ACs in tandem with refrigerant transitions under the Montreal Protocol.
This study addresses this critical gap by developing, demonstrating, and validating a practical, simulation-driven design methodology tailored to the needs of these manufacturers. It moves beyond pure theory by presenting a holistic workflow that integrates performance simulation with detailed cost analysis to ensure commercial viability. Using the commercially available simulation tools VapCyc® and CoilDesigner®, we present a systematic approach to optimize component design and system configuration for three distinct next generation low-GWP refrigerants: R32, R454B, and R290. The optimized virtual designs are then translated into physical prototypes, and their performance is experimentally validated in a psychrometric chamber under the ISO 5151 test standard. The outcome is a tangible, repeatable pathway for SMEs to leapfrog traditional development cycles, mitigate R&D risk, and accelerate the adoption of next-generation, energy secure cooling technologies.
2. Methodology
2.1. Energy Performance Modeling Approach
To better understand the energy performance of AC equipment and identify optimal system designs, this research developed a physics-based, component-level modeling approach using a suite of validated, industry-standard simulation tools, VapCyc® and CoilDesigner® (Richardson et al., 2002; Winkler et al., 2006; Jiang et al., 2006). The core of the methodology involved developing calibrated energy performance models to characterize the vapor compression cycle, conduct extensive sensitivity analyses of key design parameters to identify opportunities for energy performance improvement, and determine optimal configurations prior to any physical prototype construction.
The system-level vapor compression cycle simulation and optimization were modeled using VapCyc®, a flexible, component-based simulation tool that uses a successive substitution solver to converge on the system's steady-state operating point by balancing mass and energy across components. It is among the most popular AC/heat pump (HP) modelling software in the industry. The tool can be populated with product data to characterize the system performance. Figure 1 shows a typical vapor compression cycle with four key components: compressor, evaporator, expansion device, and condenser. For the most critical components, detailed physics-based models were developed and integrated.
2.1.1. Compressor Model
Compressors are the most important components of refrigeration systems. They function as the heart of the system by compressing the refrigerant from the low-pressure part to the high-pressure part. The VapCyc provides several compressor models. In this study, compressor performance maps were collected in the form of 10-coefficient polynomial equations defined by AHRI Standards 540 (AHRI, 2015). Manufacturer-provided coefficient sets for both power consumption and refrigerant mass flow rate at different compressor frequencies, valid for each specific refrigerant and compressor model, were used as inputs. These polynomials correlate compressor performance as a function of suction and discharge dew point temperatures as follows in Equation 1.
where
= regression coefficients provided by the manufacturer
= suction dew point temperature [°C, °F],
= discharge dew point temperature, [°C, °F]
= individual published rating, such as capacity [W, Btu/h], input power [W], and refrigerant mass flow rate [kg/s, lbm/h].
2.1.2. Heat Exchanger Model
The evaporator and condenser were modeled using CoilDesigner®. This tool employs a segment-by-segment modeling approach. The refrigerant path is discretized into a series of small, interconnected control volumes. For each segment, the governing equations for mass, momentum, and energy conservation are solved. Appropriate and validated heat transfer and pressure drop correlations are applied for different flow regimes (e.g., single-phase liquid, two-phase boiling/condensation, single-phase vapor). This detailed approach allows for the accurate prediction of energy performance based on specific geometric parameters. Key geometries, including inner and outer tube diameters, tube lengths, fin density (FPI), fin type, and complex refrigerant circuitry paths, were measured from reference product and implemented in the software to ensure the highest possible fidelity for the simulations. After defining the basic heat exchanger configuration, the circuit design, tube connection, and airflow properties were set up using the main graphic user interface (GUI) window (Figure 2). The resulting validated heat exchanger models were then imported and used as component within the VapCyc® system model for system design and optimization.
Other Components
Fan performance was modeled based on manufacturer data and measurements, correlating airflow rate with power consumption. Pressure drops in connecting lines were also included to account for their impact on the system. The expansion device was modeled as an isenthalpic process.
2.2. Reference System and Model Calibration
To validate the accuracy and predictive power of the simulation approach, reference models were developed and calibrated against experimental data. The reference systems were commercially available ductless mini-split2 AC units. They use a fixed-speed compressor with a rated system energy efficiency ratio (EER) of 3.0 W/W, representing a typical energy efficiency level available in developing economies, based on UNEP (2019). Table 2 summarizes the high-level energy performance information of the selected reference units.
The physical unit was installed and tested under the standard T1 full-capacity cooling conditions as specified in the ISO 5151 standard in a psychrometric test chamber. Detailed performance data, including cooling capacity, power consumption, temperatures, and pressures, were recorded. The VapCyc® and CoilDesigner® simulation models were then developed at the identical boundary conditions. Table 3 presents the test and simulation results for the R410A model, which was the only unit tested, as the R22 unit is no longer commonly available in the market and obtaining reliable cost details for it is extremely challenging. The simulation results of Model B were consistent with the test data. The differences between the test and simulation results were within ±5%. This successful single-point calibration confirmed the model's fidelity and established a reliable and trustworthy foundation for conducting the subsequent design optimization studies.
2.3. Multi-Objective Design Optimization
Following model calibration, a multi-objective design optimization was performed for three low-GWP refrigerant alternatives: R32 (GWP 675) and R454B (GWP 470) as near-term replacements for R410A, and R290 (GWP 3) as an ultra-low GWP replacement for R22. The primary objective was to maximize the system's EER under full-load conditions while simultaneously minimizing the increase in total material cost and the extent of modifications required from the reference design.
A genetic algorithm (GA) was employed to systematically and efficiently search the large, multi-variable design space. GAs are well-suited for such engineering problems as they are robust in navigating complex, non-linear solution spaces to find near-globally optimal solutions. The GA was configured to explore a wide range of design parameters, treated as "genes" for the optimization. The key design variables included:
- Refrigerant Choice: R32, R454B, R290.
- Compressors: Higher efficiency variable-speed drive (VSD) compressors were selected for each refrigerant, replacing the reference fixed-speed drive (FSD) unit.
- Fans: High-efficiency, electronically commutated direct current (DC) fan motors were substituted for the reference alternating current (AC) motors to reduce auxiliary power consumption.
- Heat exchanger circuitry: The refrigerant flow path was reconfigured to ensure optimal fluid distribution and facilitate efficient phase change within the tubes.
- Tube diameter: The tube diameter was reduced from the traditional 7 mm to a smaller 5 mm to explore benefits from enhanced the rate of heat transfer.
- Overall heat exchanger geometry: Parameters including the number of tubes, tube length, and fin density (Fin Per Inch), were varied within manufacturing limits and optimized based on simulation results to maximize energy performance.
The optimization was run independently for each of the three refrigerants. The GA generated and evaluated over 1,100 unique design combinations for each refrigerant. The selection process for the final optimal design was a two-step process. First, the GA identified a set of Pareto-optimal solutions that represented the best possible trade-offs between EER and cost. From this set, a final design was selected that offered the most substantial EER improvement for the lowest associated material cost increase, subject to practical manufacturing and component constraints as outlined in Table 4. The cost model used for this analysis was a bottom-up estimation based on manufacturer quotes for major components (compressor, motors, controls) and material-based pricing for heat exchangers (based on copper and aluminum weight).
2.4. Prototype Development and Experimental Validation
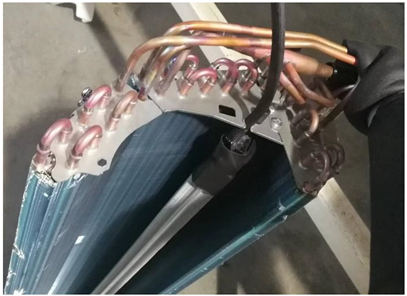
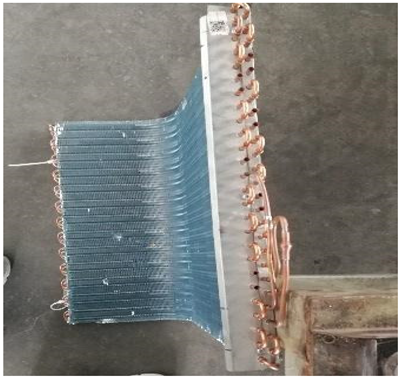
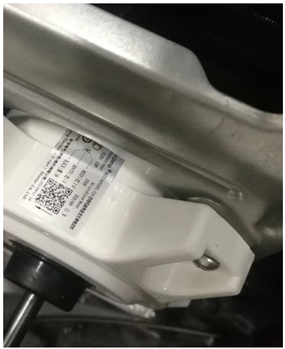
Based on the final optimized designs identified through the simulation process, physical prototypes were fabricated in collaboration with component suppliers and AC equipment manufacturers. This step translated the virtual models into tangible hardware. The control logic for each prototype, including the VSD compressor frequency, indoor and outdoor fan speeds, and electronic expansion valve (EEV) opening settings, was programmed and fine-tuned based on the optimal operating points identified in the simulations and subsequently verified during preliminary lab tests. Figure 3 shows the photos of one prototype AC system as an example. The detailed heat exchanger circuitry designs are included in Appendix Figure A1 and Figure A2. The photographs of the key components are shown in Appendix Table A1.
The final, fully assembled prototype units were then sent to Lawrence Berkeley National Laboratory (LBNL) for comprehensive and independent energy performance test validation. All experimental tests were conducted in LBNL’s HVAC&R testing facilities, specifically in the advanced psychrometric test chamber (Figure 4). This facility is used to evaluate the performance of central ACs and HPs with cooling capacities in the range of 1.76–26.37 kW (0.5–7.5 refrigeration tons), and with heating capacities in the range of 1.76–17.58 kW (0.5–5 refrigeration tons). It is comprised of side-by-side indoor and outdoor chambers with independently controlled temperature, humidity, and airflow. The indoor and outdoor room conditions, including the temperature and humidity, were controlled independently using proportional–integral–derivative (PID) controllers built into the data acquisition software. Each test room was equipped with an air enthalpy tunnel or a “code tester.” Code testers provided accurate control and measurements of the airflow volume and external static pressure of the test unit. In addition, the psychrometric test chamber included the necessary safety equipment for testing air conditioners utilizing A2L (R32) and A3 (R290) flammable refrigerants. Safety equipment included refrigerant detection sensors and control equipment to shut down the operation of the test chamber in the event of a flammable refrigerant leak.
Four psychrometers were built and installed in the chamber according to ASHRAE 41.1 (ASHRAE, 2013) and 41.6 (ASHRAE, 2014). Psychrometers provide accurate measurements of air properties, which are essential for testing and rating HVAC equipment. Three units were installed to power the test units. Based on the specifications of the tested product, the input voltage to the test unit could be configured within 110–500 V, at 50 or 60 Hz. The configurable test unit power supply system facilitated testing of international equipment. A data acquisition system was built with measurements of the temperature, pressure, refrigerant flow, and fan speed.
System performance was rigorously evaluated in strict accordance with the international test standard ISO 5151:2017/Amd 1:2020: “Non-ducted air conditioners and heat pumps -Testing and rating for performance” (ISO 5151, 2020). It also specifies the test methods for determining the capacity and efficiency ratings. The cooling capacity was determined using the primary indoor air enthalpy method, which measures the change in enthalpy of the air passing through the indoor unit. The outdoor air enthalpy method was used for the secondary-capacity heat balance. The power usage, including the current and voltage to the compressor, outdoor fan, and indoor fan, could be measured individually with Yokogawa power meters, which provided highly accurate and reliable capacity measurement results.
3. Results
3.1. Optimal Designs
Table 5 lists certain key design parameters of the optimal designs and compares the corresponding values with those of the reference Model B.
Figure 5 illustrates the system energy performance of the optimized AC units. Compared with the reference Model B unit (R410A), the optimized R32 and R454B AC designs exhibited a 4.2% and 2.3% reduction in cooling capacity, respectively, accompanied by a substantial decrease in power consumption of 27.0% and 25.1%, respectively. This resulted in remarkable enhancements in the system’s EER of 33.3% and 32.4%, respectively. Furthermore, compared to the reference Model A unit (R22), the optimized R290 AC design resulted in a 7.7% decrease in cooling capacity and a 27.4% reduction in power consumption. This translates into a significant 27.2% improvement in the system’s EER. These findings demonstrate that the optimized R32, R454B, and R290 AC designs achieved a favorable balance between cooling capacity and power consumption, surpassing the energy efficiency of conventional units that use R410A and R22refrigerants.
Table 6 illustrates the cost differentials among the optimal VSD models using R32, R454B, and R290 compared to the reference Model B (FSD design R410A refrigerant). The production of optimal prototype units required only marginal increases in cost. This observation underscores the cost-effectiveness of manufacturing these optimized units. Noted that FSD compressors generally entail lower costs compared to VSD compressors. The primary reason behind the higher compressor cost for the R410A reference model stems from the scarcity of R410A FSD units in the China domestic market during our research phase because ~95% of new RACs transitioned to VSD units in 2021 (ChinaIOL, 2022). Limited production volumes led to elevated component prices. Conversely, higher production volumes of other VSD components resulted in cost reductions due to economies of scale.
3.2. Experimental Validation of Optimized Prototypes
The three optimized low-GWP prototypes (R32, R454B, and R290) were fabricated and experimentally tested under the ISO 5151 T1 standard cooling conditions. The test condition comprised indoor and outdoor temperatures of 27°C (dry-bulb) / 19°C (wet-bulb), and 35°C (dry-bulb) / 24°C (wet-bulb), respectively. The full and half cooling capacities of the systems were tested. A primary goal of this phase was to validate the predictive accuracy of the entire simulation-driven design workflow. The refrigerant charge was optimized first and maintained constant while the openness of the expansion valve was adjusted to align with the simulations for subcooling and superheating. The experimental results demonstrated an excellent agreement with the performance predictions from the final simulation models.
As detailed in the comparative summary in Table 7 for full-capacity standard cooling conditions as an example, the measured cooling capacity and Energy Efficiency Ratio (EER) for all three prototypes were well within a 5% discrepancy of the simulated values. This close correlation between the simulated design performance and the measured physical performance provides strong validation for the predictive accuracy and reliability of the modeling approach used in this study.
3.3. System Performance and Efficiency Improvements
This study analyzes the seasonal cooling energy performance of the prototype units according to the ISO cooling seasonal performance factor (CSPF) calculation. The ISO CSPF calculation refers to ISO 16358-1:2019 Clause 6.4 for fixed-speed units and Clause 6.7 for variable-speed units. The CSPF calculation for variable-speed units is based on two sets of test data—measurement of performance (capacity and power input) at full- and half-capacity operation at an outdoor dry bulb temperature of 35°C—and then performance at 29°C is calculated by ISO 16358-determined equations. The CSPF calculation for fixed-speed units is based on one set of test data—measurement of performance (capacity and power input) at full-capacity operation at an outdoor dry bulb temperature of 35°C—and then performance at 29°C is calculated by the predetermined equations.4
The corresponding system results are listed in Table 8. The optimized low-GWP prototypes demonstrated substantial and compelling improvements in both nominal and seasonal energy efficiency when compared to the reference R410A fixed-speed unit. At the T1 full-capacity cooling condition, the optimized designs yielded major reductions in power consumption while maintaining similar cooling capacities. Notably, through system optimization, the prototype units achieved a 33% improvement in the EER compared with the reference FSD model.
The improvements in seasonal performance, which better reflect real-world annual energy consumption, were even more pronounced. The adoption of higher efficiency VSD compressors and optimized components resulted in a dramatic increase in the CSPF, calculated according to the ISO 16358 standard. The R32, R454B, and R290 prototypes achieved remarkable CSPF values that were 90%, 78%, and 83% higher than the reference fixed-speed unit, respectively. This is a direct result of the superior part-load performance of the VSD systems.
As shown in Figure 6, the seasonal energy performance of the R32 prototype complies with the leading international requirements (i.e., with China's MEPS and achieves the highest 5-Star rating in India). The R454B and R290 prototypes also performed strongly, closely approaching these stringent requirements. Crucially, this high level of efficiency was achieved with only a marginal 2%–16% increase in first cost. These results confirm both the commercial viability and technical feasibility of replacing conventional refrigerants with low-GWP alternatives in 1-ton mini-split units for competitive global markets.
3.4. Economic Analysis of Optimized Designs
A central objective of the study was to ensure that the designed efficiency gains were achieved without rendering the final product unaffordable in cost-sensitive markets. The economic analysis, based on a bottom-up material and component cost model, confirms that high performance was accomplished with only a modest increase in total manufacturing cost.
As detailed in the cost breakdowns in Table 6 and summarized in Table 8, the final estimated material costs for the optimized, high-efficiency VSD prototypes were only marginally higher than the reference FSD unit. The total material costs for the R32, R454B, and R290 prototypes were 2%, 2%, and 16% higher, respectively, than the estimated cost of the reference unit. The analysis noted that while the VSD compressor and control board are more expensive than their FSD counterparts, these costs were partially offset by savings in the optimized heat exchangers (due to smaller tube diameters and reduced material weight) and the economies of scale for VSD components in major manufacturing markets. This result is highly significant, as it demonstrates that a near doubling of seasonal energy efficiency can be achieved for a very small increment in first cost, breaking the paradigm that high efficiency must come at a high price premium.
4. Discussion
4.1. Interpretation and Significance of Findings
The results of this study demonstrate that a systematic, simulation-driven design approach can effectively bridge the technical and economic gaps for manufacturers transitioning to sustainable cooling technologies. The key takeaway is that the dual climate goals of phasing down obsolete refrigerants and improving energy efficiency are not mutually exclusive; rather, they can be pursued in synergy to achieve compounded benefits. Furthermore, this can be accomplished without incurring prohibitive costs that would otherwise hinder market adoption. The methodology presented and validated here provides a practical and reliable pathway for developing cost-effective, high-efficiency, next generation low-GWP room air conditioners using commercially available components. This is particularly significant for small and medium-sized manufacturers (SMEs) in developing and emerging economies. It provides them with a streamlined, de-risked product development cycle, enabling them to leapfrog legacy technologies and compete in markets with increasingly stringent energy performance standards and environmental regulations.
While extensive academic research has explored the thermodynamic potential of low-GWP refrigerants and the theoretical optimization of individual components, this work distinguishes itself by presenting a holistic and commercially-focused methodology. Many simulation studies in the literature remain purely theoretical or focus on maximizing performance without strict, realistic cost constraints. A primary contribution of this research is the empirical demonstration that a nearly twofold increase in seasonal efficiency can be achieved for a marginal cost increase of only 2–16%. By using commercially available simulation tools and off-the-shelf components to build, test, and validate physical prototypes, this study bridges the critical gap between academic modeling and real-world industrial product development. It provides a tangible, cost-effective blueprint that is directly applicable for the target audience of SMEs, an aspect often absent from purely theoretical research. The findings provide strong evidence to policymakers that ambitious MEPS are technically and economically feasible, and offer a clear business case for manufacturers to invest in cleaner, more efficient technologies.
4.2. Limitations and Future Work
This study was intentionally focused on a 3.5 kW (1 ton) capacity mini-split air conditioner, a common residential size in many global emerging markets. While the simulation-driven methodology is much more broadly applicable, further work would be needed to adapt and validate the specific design findings for other system types (e.g., window units, ducted systems) and cooling capacities.
Furthermore, to ensure the immediate relevance and accessibility of the designs for the target manufacturing audience, this work was deliberately constrained to using only currently commercially available, mass-produced components. This practical choice means that further performance gains could be realized with even higher efficiency or next-generation technology.
This points to several exciting avenues for future research. The next step is to apply this integrated design methodology to reversible heat pump (HP) systems to optimize for heating performance. Additionally, future work could focus on integrating and evaluating next-generation, innovative components, such as microchannel heat exchangers, advanced compressor designs (e.g., vapor injection), or novel materials to push system performance well beyond what is achievable with current off-the-shelf parts. Finally, this study focused on component and system hardware optimization; a significant opportunity remains for improving real-world performance through advanced, dynamic control strategies. Optimizing the operation of the VSD compressor, EEV, and fans in response to changing environmental loads could unlock further significant gains in seasonal efficiency.
5. Conclusions
The global transition to sustainable cooling requires the simultaneous adoption of next generation refrigerants and high-efficiency equipment. This presents a technical and economic challenge, particularly for small and medium-sized manufacturers in emerging economies. This study successfully developed, implemented, and validated a simulation-driven design methodology that directly addresses this challenge. By systematically integrating component-level modeling in VapCyc® and CoilDesigner® with a cost analysis, optimized AC prototypes were designed and built that achieved a 33% improvement in EER and a nearly twofold increase in seasonal efficiency (CSPF) compared to the reference units.
Crucially, these substantial performance gains were realized with only a 2–16% increase in total material cost, proving that high-performance, low-climate-impact air conditioners can be commercially viable and accessible in cost-sensitive markets. The close agreement between simulation predictions and experimental validation in a psychrometric chamber confirms the reliability and predictive power of the approach. This work provides a validated, practical pathway and a tangible business case for manufacturers to accelerate the development and deployment of next-generation cooling technologies. It offers a clear blueprint to meet the dual challenge of performance and affordability, thereby contributing meaningfully to achieving the global grid, peak load and energy security goals.
Acknowledgements
This study was supported by the National Philanthropic Trust, United States through the US Department of Enegy Prime Contract Number DE-AC02-05CH11231.The authors declare that they have no known competing financial interests or personal relationship that could cause a conflict of interest regarding this article. The authors gratefully acknowledge the valuable feedback and technical review provided by Omar Abdelaziz (American University in Cairo), Brian Holuj (United Nations Environment Programme), Ian McGavisk (Rocky Mountain Institute), Ankit Kalanki (Rocky Mountain Institute), Alexander Lekov (Lawrence Berkeley National Laboratory), and Greg Rosenquist (Lawrence Berkeley National Laboratory). Affiliations are provided for identification purposes only and do not imply endorsement of this work.
Acronyms and Abbreviations
| AC | air conditioner |
| AHRI | Air-Conditioning, Heating, and Refrigeration Institute |
| ASHRAE | American Society of Heating, Refrigerating and Air-Conditioning Engineers |
| CO2 | carbon dioxide |
| CSPF | cooling seasonal performance factor |
| DC | direct current |
| EER | energy efficiency ratio |
| FPI | fin per inch |
| FSD | fixed speed drive |
| GCEP | Global Cooling Efficiency Program |
| GWP | global warming potential |
| GHGs | greenhouse gases |
| HC | hydrocarbon |
| HCFC | hydrochlorofluorocarbon |
| HFC | hydrofluorocarbon |
| HFO | hydrofluro-olefins |
| HP | heat pump |
| HVAC&R | heating, ventilation, air conditioning, and refrigeration |
| IPCC | Intergovernmental Panel on Climate Change |
| IPCC5 | Intergovernmental Panel on Climate Change Fifth Assessment Report |
| ISO | International Organization for Standardization |
| ODP | ozone depletion potential |
| RTOC | Refrigeration, Air Conditioning and Heat Pumps Technical Options Committee |
| UNEP | United Nations Environment Programme |
| VSD | variable speed drive |
Appendix
Figure A1.
Circuitry design of the evaporator.
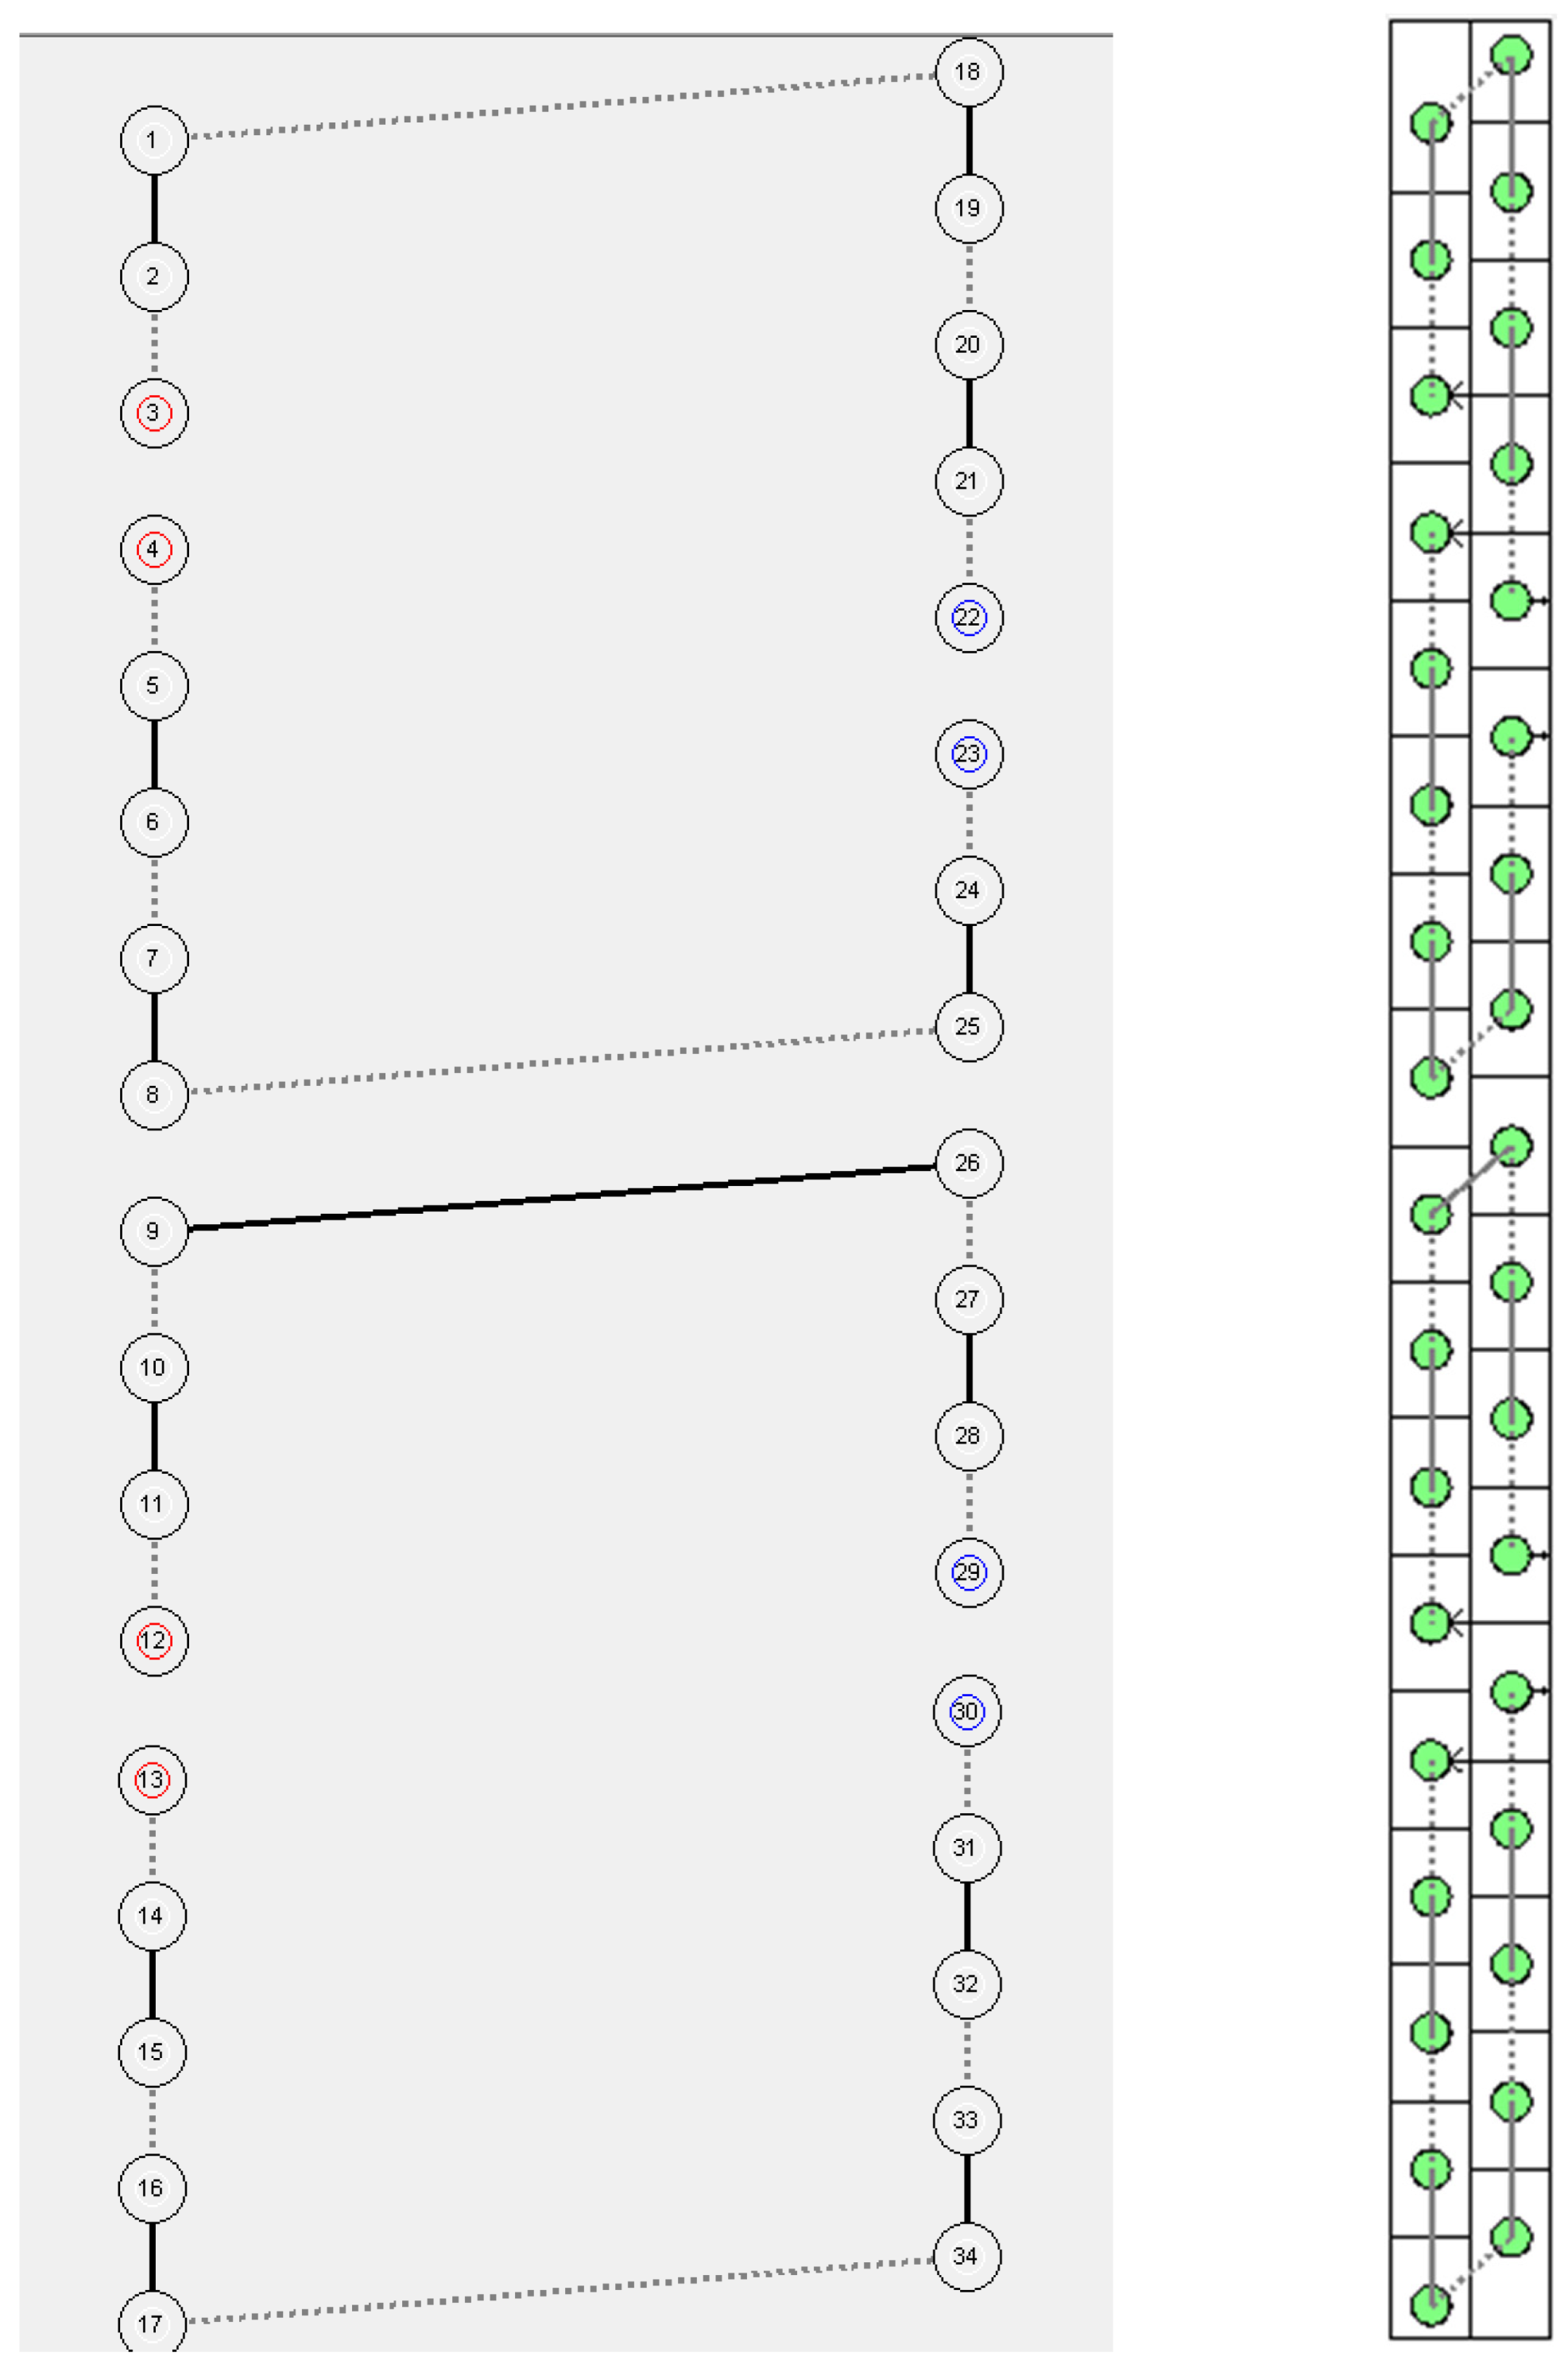
Figure A2.
Circuitry design of the condenser.
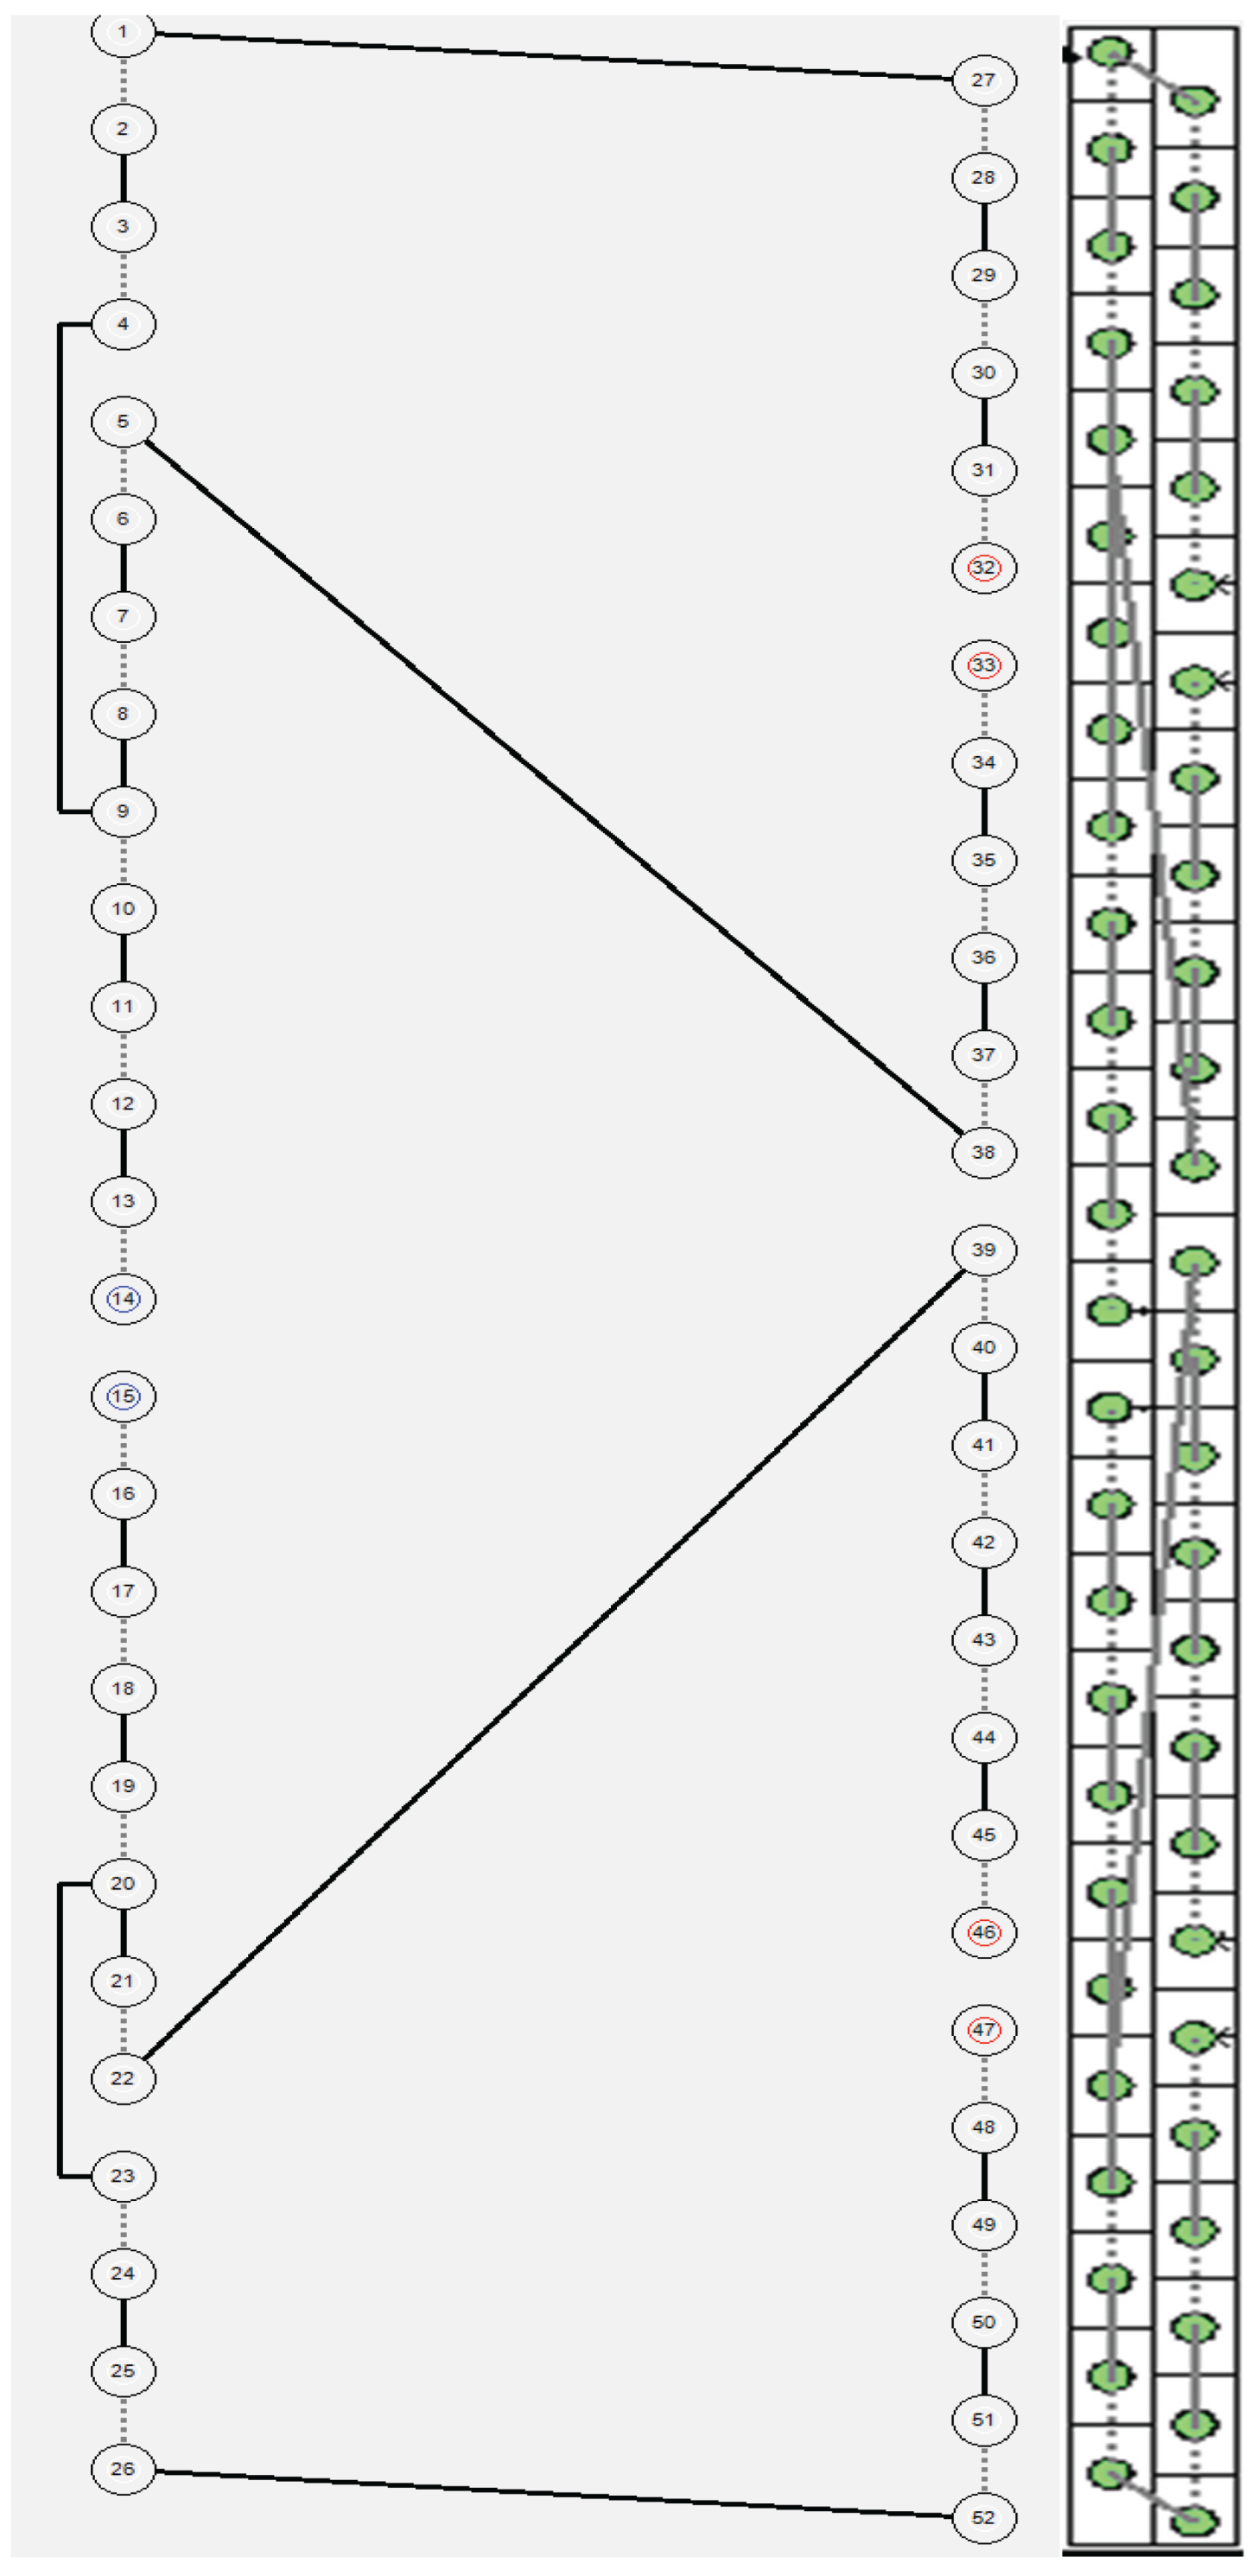

Table A1.
Table A1. Key Components of the prototype units.
| Components | Photos |
|---|---|
| Evaporator 5 mm hairpin tubes |
 |
| Indoor DC motor | 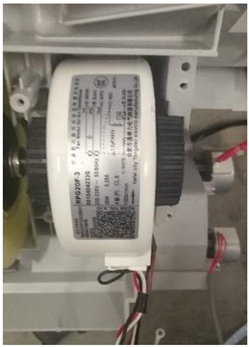 |
| Axial fan | 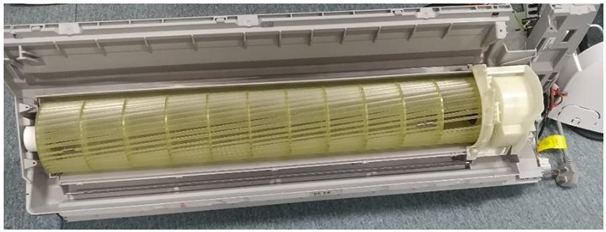 |
| Indoor control board | 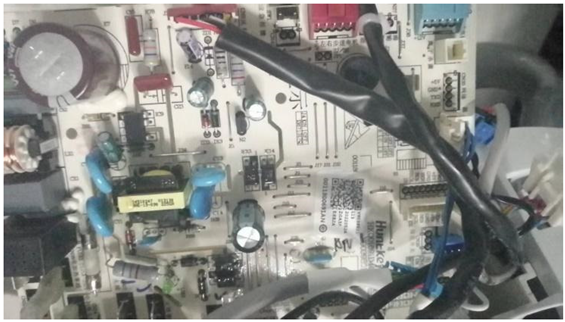 |
| Connecting line | 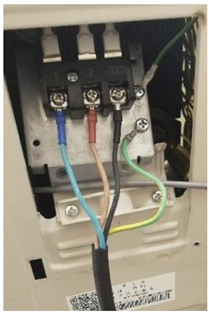 |
| Connecting Pipe | 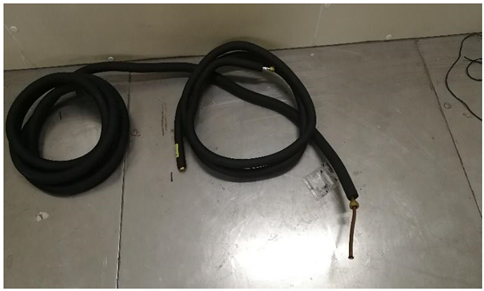 |
| Condenser 5 mm hairpin tubes |
 |
| Outdoor DC motor |
 |
| Fan blade | 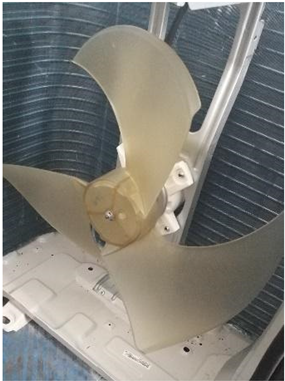 |
| Outdoor control board | 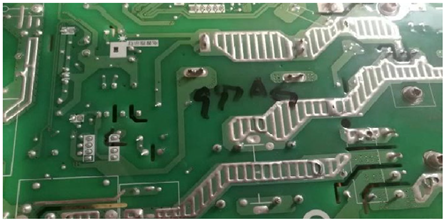 |
| Compressor |
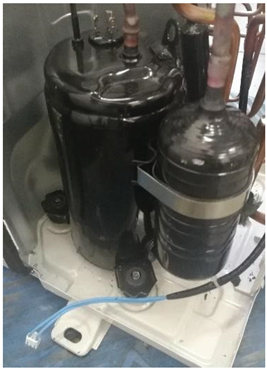 |
| 1 | A5 and non-A5 parties are defined here: https://ozone.unep.org/classification-parties
|
| 2 | This study focuses on ductless split ACs, because the global room AC market is dominated by this type of unit, known in the United States as mini-split ACs. In the United States, Canada, and Mexico, room ACs are typically understood to be window-type units. |
| 3 | Standard full capacity cooling test condition: indoor temperatures of 27°C (dry-bulb) / 19°C (wet-bulb), and outdoor temperatures of 35°C (dry-bulb) / 24°C (wet-bulb). |
| 4 | Given that predetermined equations are used to estimate the performance at 29°C, CSPF for fixed-speed units results in a linear relationship with EER, i.e., CSPF = 1.062 × EER with the ISO reference temperature bin hours (Park et al. 2019) |
References
- AHRI Standard 210/240. (2008). Performance Rating of Unitary Air-Conditioning & Air-Source Heat Pump Equipment.
- AHRI Standard 540. (2015). Performance rating of positive displacement refrigerant compressors and compressor units.
- Alabdulkarem, A., Eldeeb, R., Hwang, Y., Aute, V., & Radermacher, R. (2015). Testing, simulation and soft-optimization of R410A low-GWP alternatives in heat pump system. International Journal of Refrigeration, 60, 106-117.
- Andersen, S., Bandarra, E., Bhushan , C., Borgford-Parnell, N., Chen, Z., Christensen, J. M., Devotta, S., Dhasan, M. L., Dreyfus, G. B., Dulac, J., Elassaad , B., Fahey, D. W., Gallagher, G., Míguez González, M., Höglund-Isaksson, L., Hu, J., Jiang, Y., Lane, K., Mangotra, K., ... Xu, Y. (2020). Cooling emissions and policy Synthesis report: Benefits of cooling efficiency and the Kigali Amendment.
- ASHRAE 41.1. (2013). Standard method for temperature measurement.
- ASHRAE 41.6. (2014). Standard method for humidity measurement.
- ASHRAE 37. (2009). Methods of testing for rating electrically driven unitary air-conditioning and heat pump equipment.
- Aute, V., Martin, C., & Radermacher, R. (2015). Ahri project 8013: A study of methods to represent compressor performance data over an operating envelope based on a finite set of test data. Air-Conditioning, Heating, and Refrigeration Institute.
- Bau, U., Neitzke, D., Lanzerath, F., & Bardow, A. (2015, September). Multi-objective optimization of dynamic systems combining genetic algorithms and Modelica: Application to adsorption air-conditioning systems. In Proceedings of the 11th International Modelica Conference, Versailles, France (No. 118, pp. 777-784).
- Calm, J. M. (2008). The next generation of refrigerants – Historical review, considerations, and outlook. International Journal of Refrigeration, 31(7), 1123–1133. [CrossRef]
- ChinaIOL. (2022) Energy Efficiency Study of China's Exported Room Air Conditioner (in Chinese).
- Colbourne, D., & Suen, K. O. (2021). Hydrocarbon refrigerant charge limits for quiescent rooms. International Journal of Refrigeration, 125, 75-83.Falchetta, G., Cian, E. D., Pavanello, F., & Wing, I. S. (2024). Inequalities in global residential cooling energy use to 2050. Nature communications, 15(1), 7874.
- Fritzson, P., & Engelson, V. (1998, July). Modelica—A unified object-oriented language for system modeling and simulation. In European Conference on Object-Oriented Programming (pp. 67-90). Berlin, Heidelberg: Springer Berlin Heidelberg.
- GB 21455-2013. (2013). Minimum allowable values of the energy efficiency and energy efficiency grades for variable speed room air conditioner.
- GB/T 7725-2004. (2004). Room air conditioner.
- Homma, T., Kuijpers, L. J. M., Palandre, L., Zaelke, D., & Xu, Y. (2025). Combined effects of refrigerant substitutions and lifecycle refrigerant management in residential air conditioners from 2020 to 2070. Sustainability, 17(18), 8429. [CrossRef]
- Hwang, Y. J., & Park, N. (2024). Virtual design on the heat pump refrigeration cycle: Challenges and approaches. International Journal of Air-Conditioning and Refrigeration, 32 (8) (2018), The Future of Cooling, IEA, Paris https://www.iea.org/reports/the-future-of-cooling, Licence: CC BY 4.0. [CrossRef]
- International Labour Organization. (2019). Working on a Warmer Planet: The impact of heat stress on labour productivity and decent work. ILO.ISO 5151: 2017/Amd 1:2020. (2020). ISO 5151 Non-ducted air conditioners and heat pumps – Testing and rating for performance.
- ISO 16358-1:2013/Amd 2:2024. (2024). Air-cooler air conditioners and air-to-air heat pumps-Testing and calculating methods for seasonal performance factors.
- IPCC. (2014). Climate Change 2014: Mitigation of Climate Change (Fifth Assessment Report). Cambridge University Press.
- Jiang, H. (2003). Development of a simulation and optimization tool for heat exchanger design.
- Jiang, H., Aute, V., & Radermacher, R. (2006). CoilDesigner: a general-purpose simulation and design tool for air-to-refrigerant heat exchangers. International Journal of Refrigeration, 29(4), 601-610.
- Lee, M., Lee, S., Chung, J. Y., Kwon, S., & Kim, Y. (2024). Energy and environmental performances of heat pumps using R32 and R466A as alternatives to R410A. Applied Thermal Engineering, 256, 124140.
- Li, Z., Ling, J., & Aute, V. C. (2018). Tube-fin heat exchanger circuitry optimization for multiple airflow maldistribution profiles.
- Li, Y., Yang, J., Wu, X., Liu, Y., Zhuang, Y., Zhou, P., ... & Chen, G. (2023). Leakage, diffusion and distribution characteristics of refrigerant in a limited space: A comprehensive review. Thermal Science and Engineering Progress, 40, 101731.
- N, Shah, N. Khanna, N. Karali, W. Park, Y. Qu, and N. Zhou. (2017). Opportunities and risks for simultaneous efficiency improvement and refrigerant transition in air conditioning. Berkeley, CA: Lawrence Berkeley National Laboratory. https://eta.lbl.gov/publications/opportunities-simultaneous-efficiency.
- Obringer, R., Nateghi, R., Maia-Silva, D., Mukherjee, S., Cr, V., McRoberts, D. B., & Kumar, R. (2022). Implications of increasing household air conditioning use across the United States under a warming climate. Earth's Future, 10(1), e2021EF002434.O'Neill, N. F., Ma, J. M., Walther, D. C., Brockway, L. R., Ding, C., & Lin, J. (2020). A modified total equivalent warming impact analysis: Addressing direct and indirect emissions due to corrosion. Science of The Total Environment, 741, 140312.
- Panato, V. H., Pico, D. F. M., & Bandarra Filho, E. P. (2022). Experimental evaluation of R32, R452B and R454B as alternative refrigerants for R410A in a refrigeration system. International Journal of Refrigeration, 135, 221-230.
- Park, WY, N. Shah, and B. Gerke. (2017). Assessment of commercially available energy-efficient room air conditioners including models with low global warming potential (GWP) refrigerants. Berkeley, CA: Lawrence Berkeley National Laboratory. https://eta.lbl.gov/publications/assessment-commercially-available.
- Park, W., Shah, N., Ding, C., & Qu, Y. (2019). Challenges and Recommended Policies for Simultaneous Global Implementation of Low-GWP Refrigerants and High Efficiency in Room Air Conditioners. In Challenges and Recommended Policies for Simultaneous Global Implementation of Low-GWP Refrigerants and High Efficiency in Room Air Conditioners. Retrieved from https://escholarship.org/uc/item/07j5f74s.
- Richardson, D. H., Jiang, H., Lindsay, D., & Radermacher, R. (2002). Optimization of vapor compression systems via simulation.
- Shen, B., Li, Z., & Gluesenkamp, K. R. (2022). Experimental study of R452B and R454B as drop-in replacement for R410A in split heat pumps having tube-fin and microchannel heat exchangers. Applied Thermal Engineering, 204, 117930.
- Smallcombe, J. W., Foster, J., Hodder, S. G., Jay, O., Flouris, A. D., & Havenith, G. (2022). Quantifying the impact of heat on human physical work capacity; part IV: interactions between work duration and heat stress severity. International journal of biometeorology, 66(12), 2463–2476. [CrossRef]
- Suerdem, K., Taner, T., Acikgoz, O., Dalkilic, A. S., & Panchal, H. (2023). Performance of refrigerants employed in rooftop air-conditioners. Journal of Building Engineering, 70, 106301.
- Tiller, M. (2001). Introduction to physical modeling with Modelica. Springer Science & Business Media.
- United Nations Environment Programme (UNEP). (2010). Alternatives to HCFCs in the refrigeration and air conditioning sector. Practical guidelines and case studies for equipment retrofit and replacement. Swedish Environmental Protection Agency.
- UNEP Ozone Secretariat. (2015). Fact sheet 2. Overview of HFC market sectors. Background material on HFC management.
- UNEP. (2019). Model Regulation Guidelines for Energy-Efficient and Climate-Friendly Air Conditioners – Supporting Information. https://eta-publications.lbl.gov/sites/default/files/u4e_ac_model-reg-supporting-info_20190923.pdf.
- Velders, G.J., Ravishankara, A.R., Miller, M.K., Molina, M.J., Alcamo, J., Daniel, J.S., Fahey, D.W., Montzka, S.A. and Reimann, S. (2012). Preserving Montreal Protocol climate benefits by limiting HFCs. Science, 335(6071), 922-923.
- Velders, G. J. M., Solomon, S., and Daniel, J. S. (2014). Growth of climate change commitments from HFC banks and emissions, Atmos. Chem. Phys., 14, 4563–4572,. [CrossRef]
- Wei, M., Ding, C., Rosenquist, G., Coughlin, K., Cubero, E., Burke, T., & Abdelaziz, O. (2024). Benefits and challenges in deployment of low global warming potential R290 refrigerant for room air conditioning equipment in California. Sustainable Energy Technologies and Assessments, 70, 103937.
- Wetter, M., Zuo, W., Nouidui, T. S., & Pang, X. (2014). Modelica buildings library. Journal of Building Performance Simulation, 7(4), 253-270.
- Winkler, J., Aute, V., & Radermacher, R. (2006). Component-based vapor compression simulation tool with integrated multi-objective optimization routines.
- Wu, Z., Yuan, C., Li, H., Li, H., Peng, J., & Huang, L. (2024). Flow boiling heat transfer of R454B in a 24-port microchannel tube. Applied Thermal Engineering, 248, 123150.
- Zhao, D., Watari, D., Ozawa, Y., Taniguchi, I., Suzuki, T., Shimoda, Y., & Onoye, T. (2023). Data-driven online energy management framework for HVAC systems: An experimental study. Applied Energy, 352, 121921.
- Zou, L., Liu, Y., & Yu, J. (2025). Recent advances on performance enhancement of propane heat pump for heating applications. Energy, 314, 134251.
Figure 1.
Air conditioner system diagram in VapCyc.
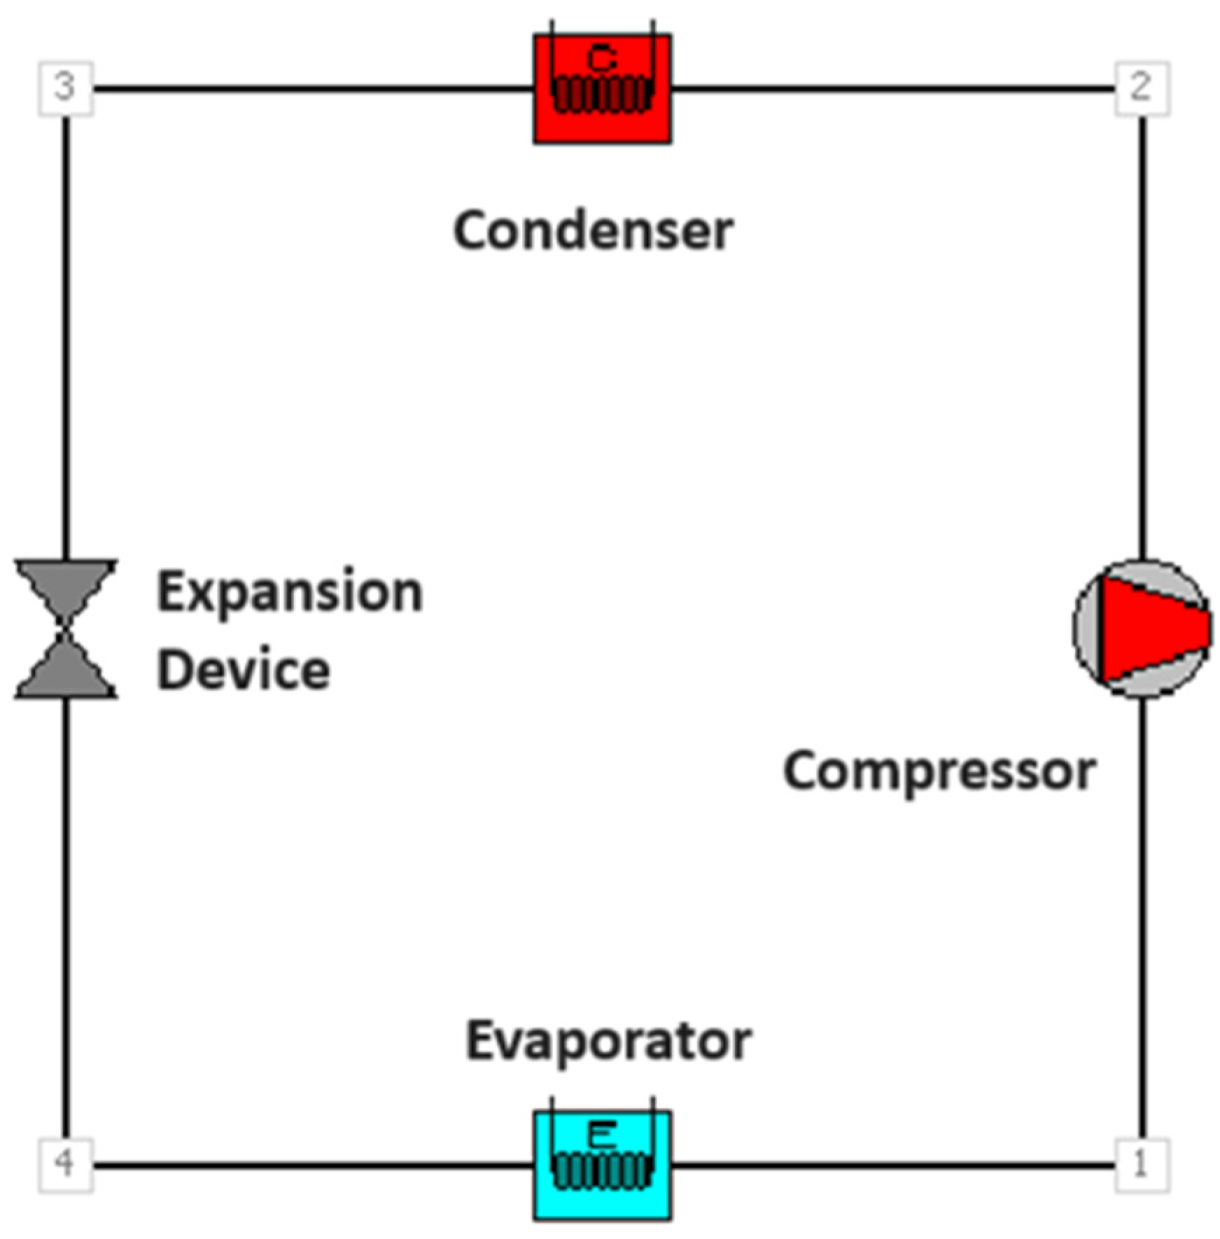
Figure 2.
A Screenshot of CoilDesigner’s Main GUI.
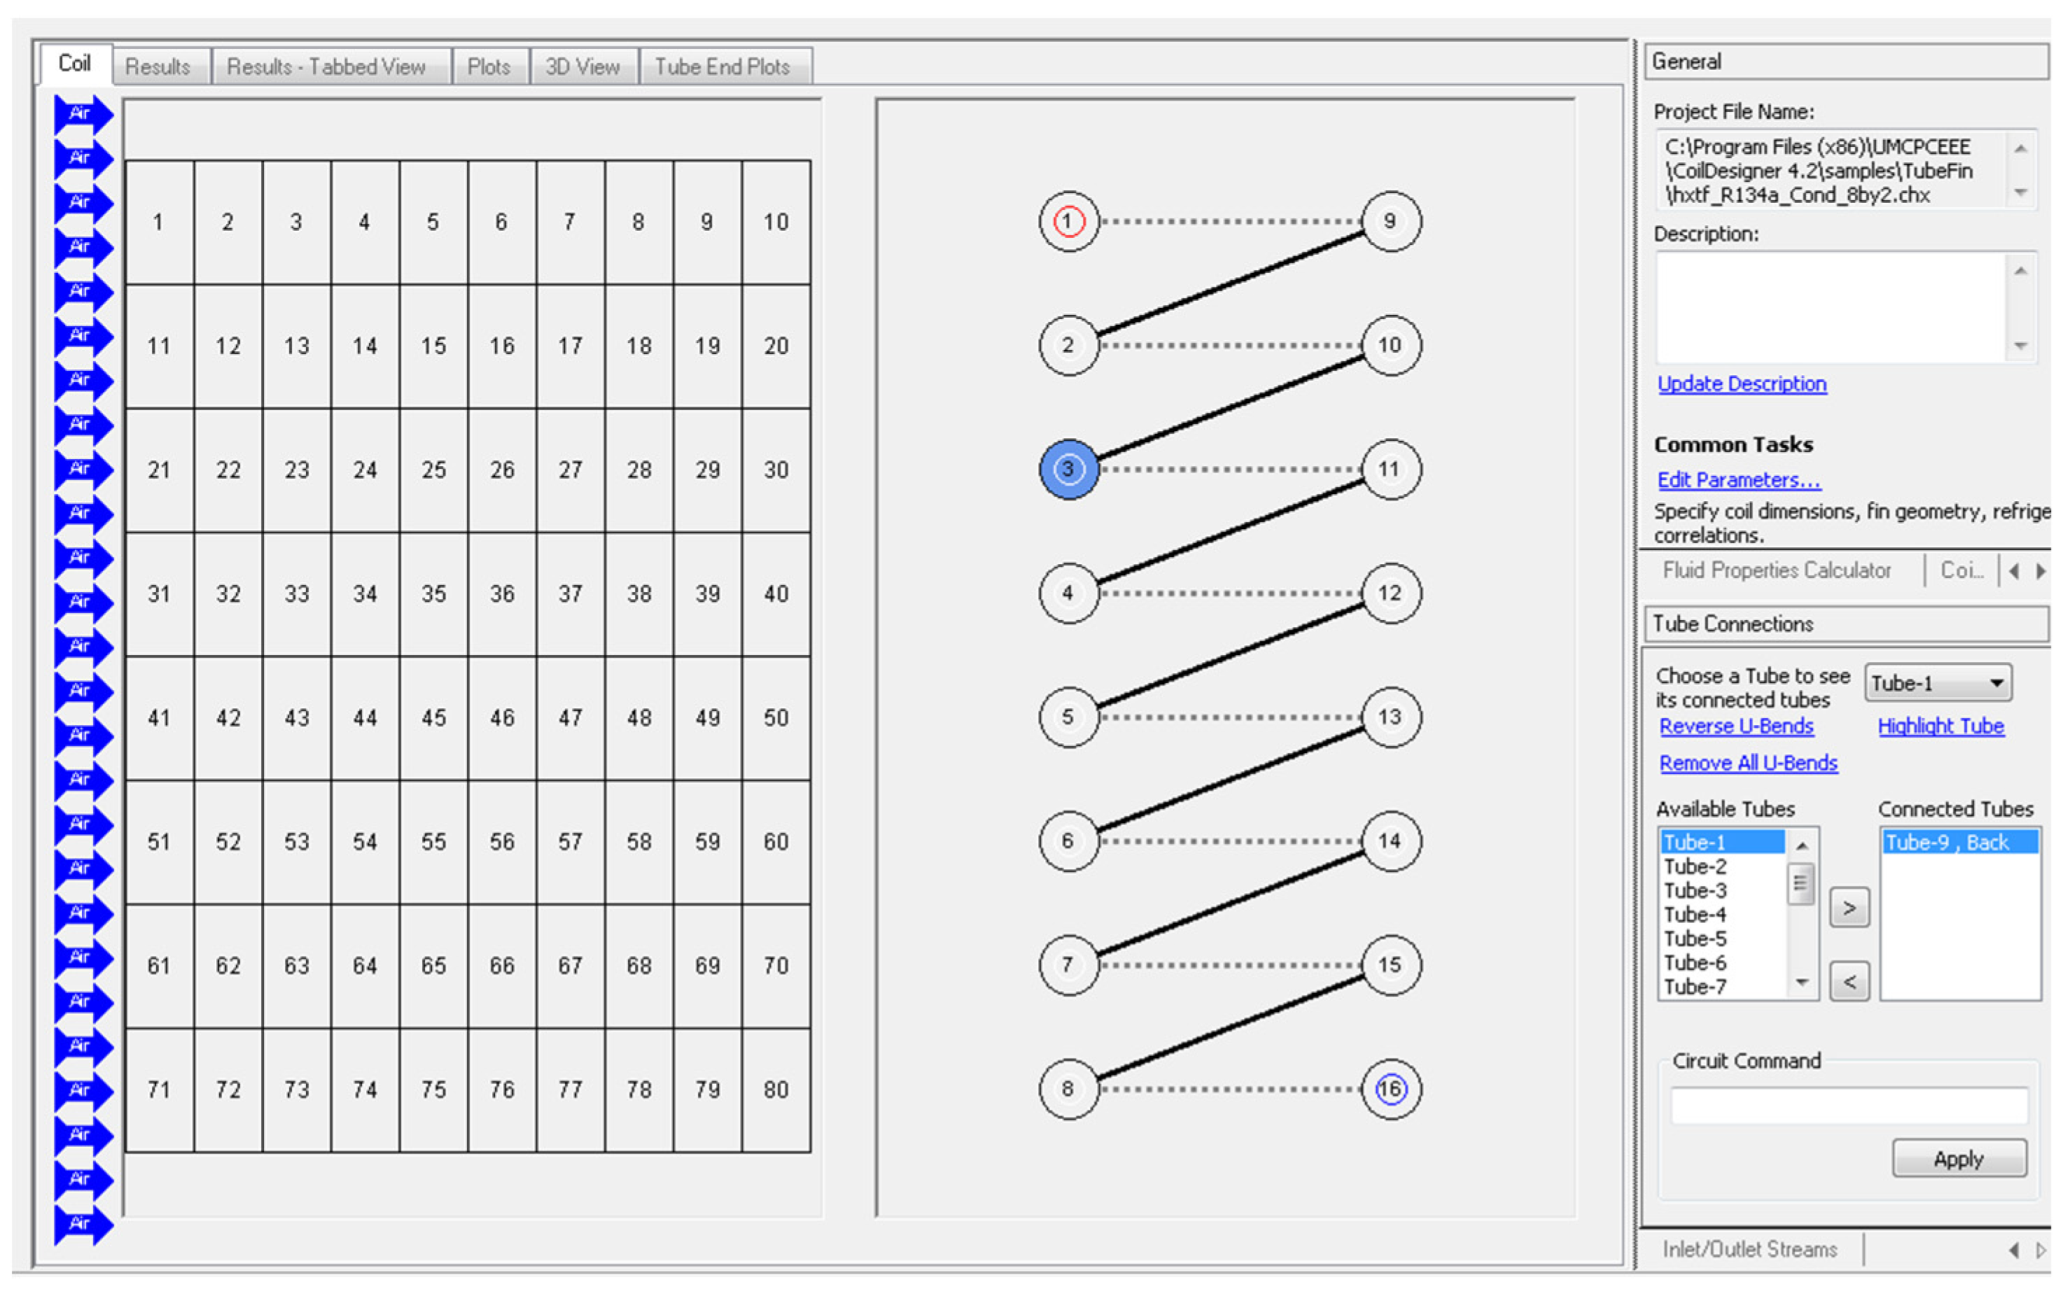
Figure 3.
Photographs of the R32 prototype AC unit.
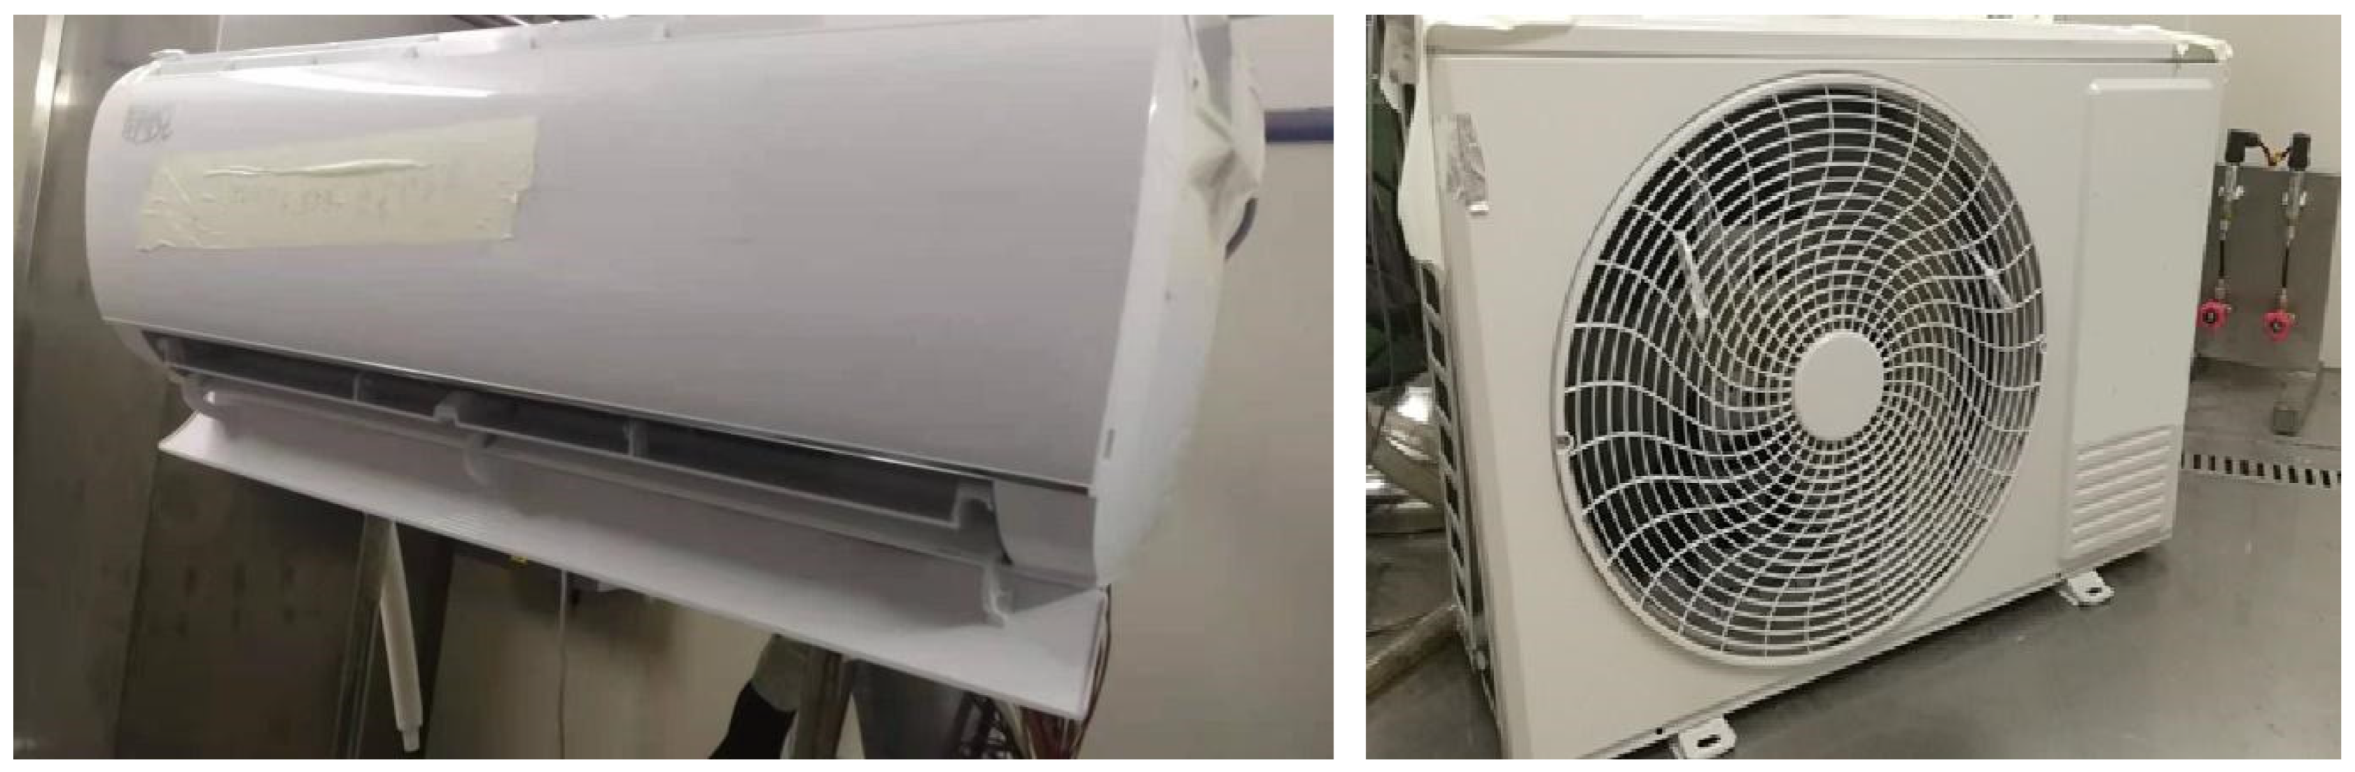
Figure 4.
A Photograph of LBNL’s psychrometric test chamber.
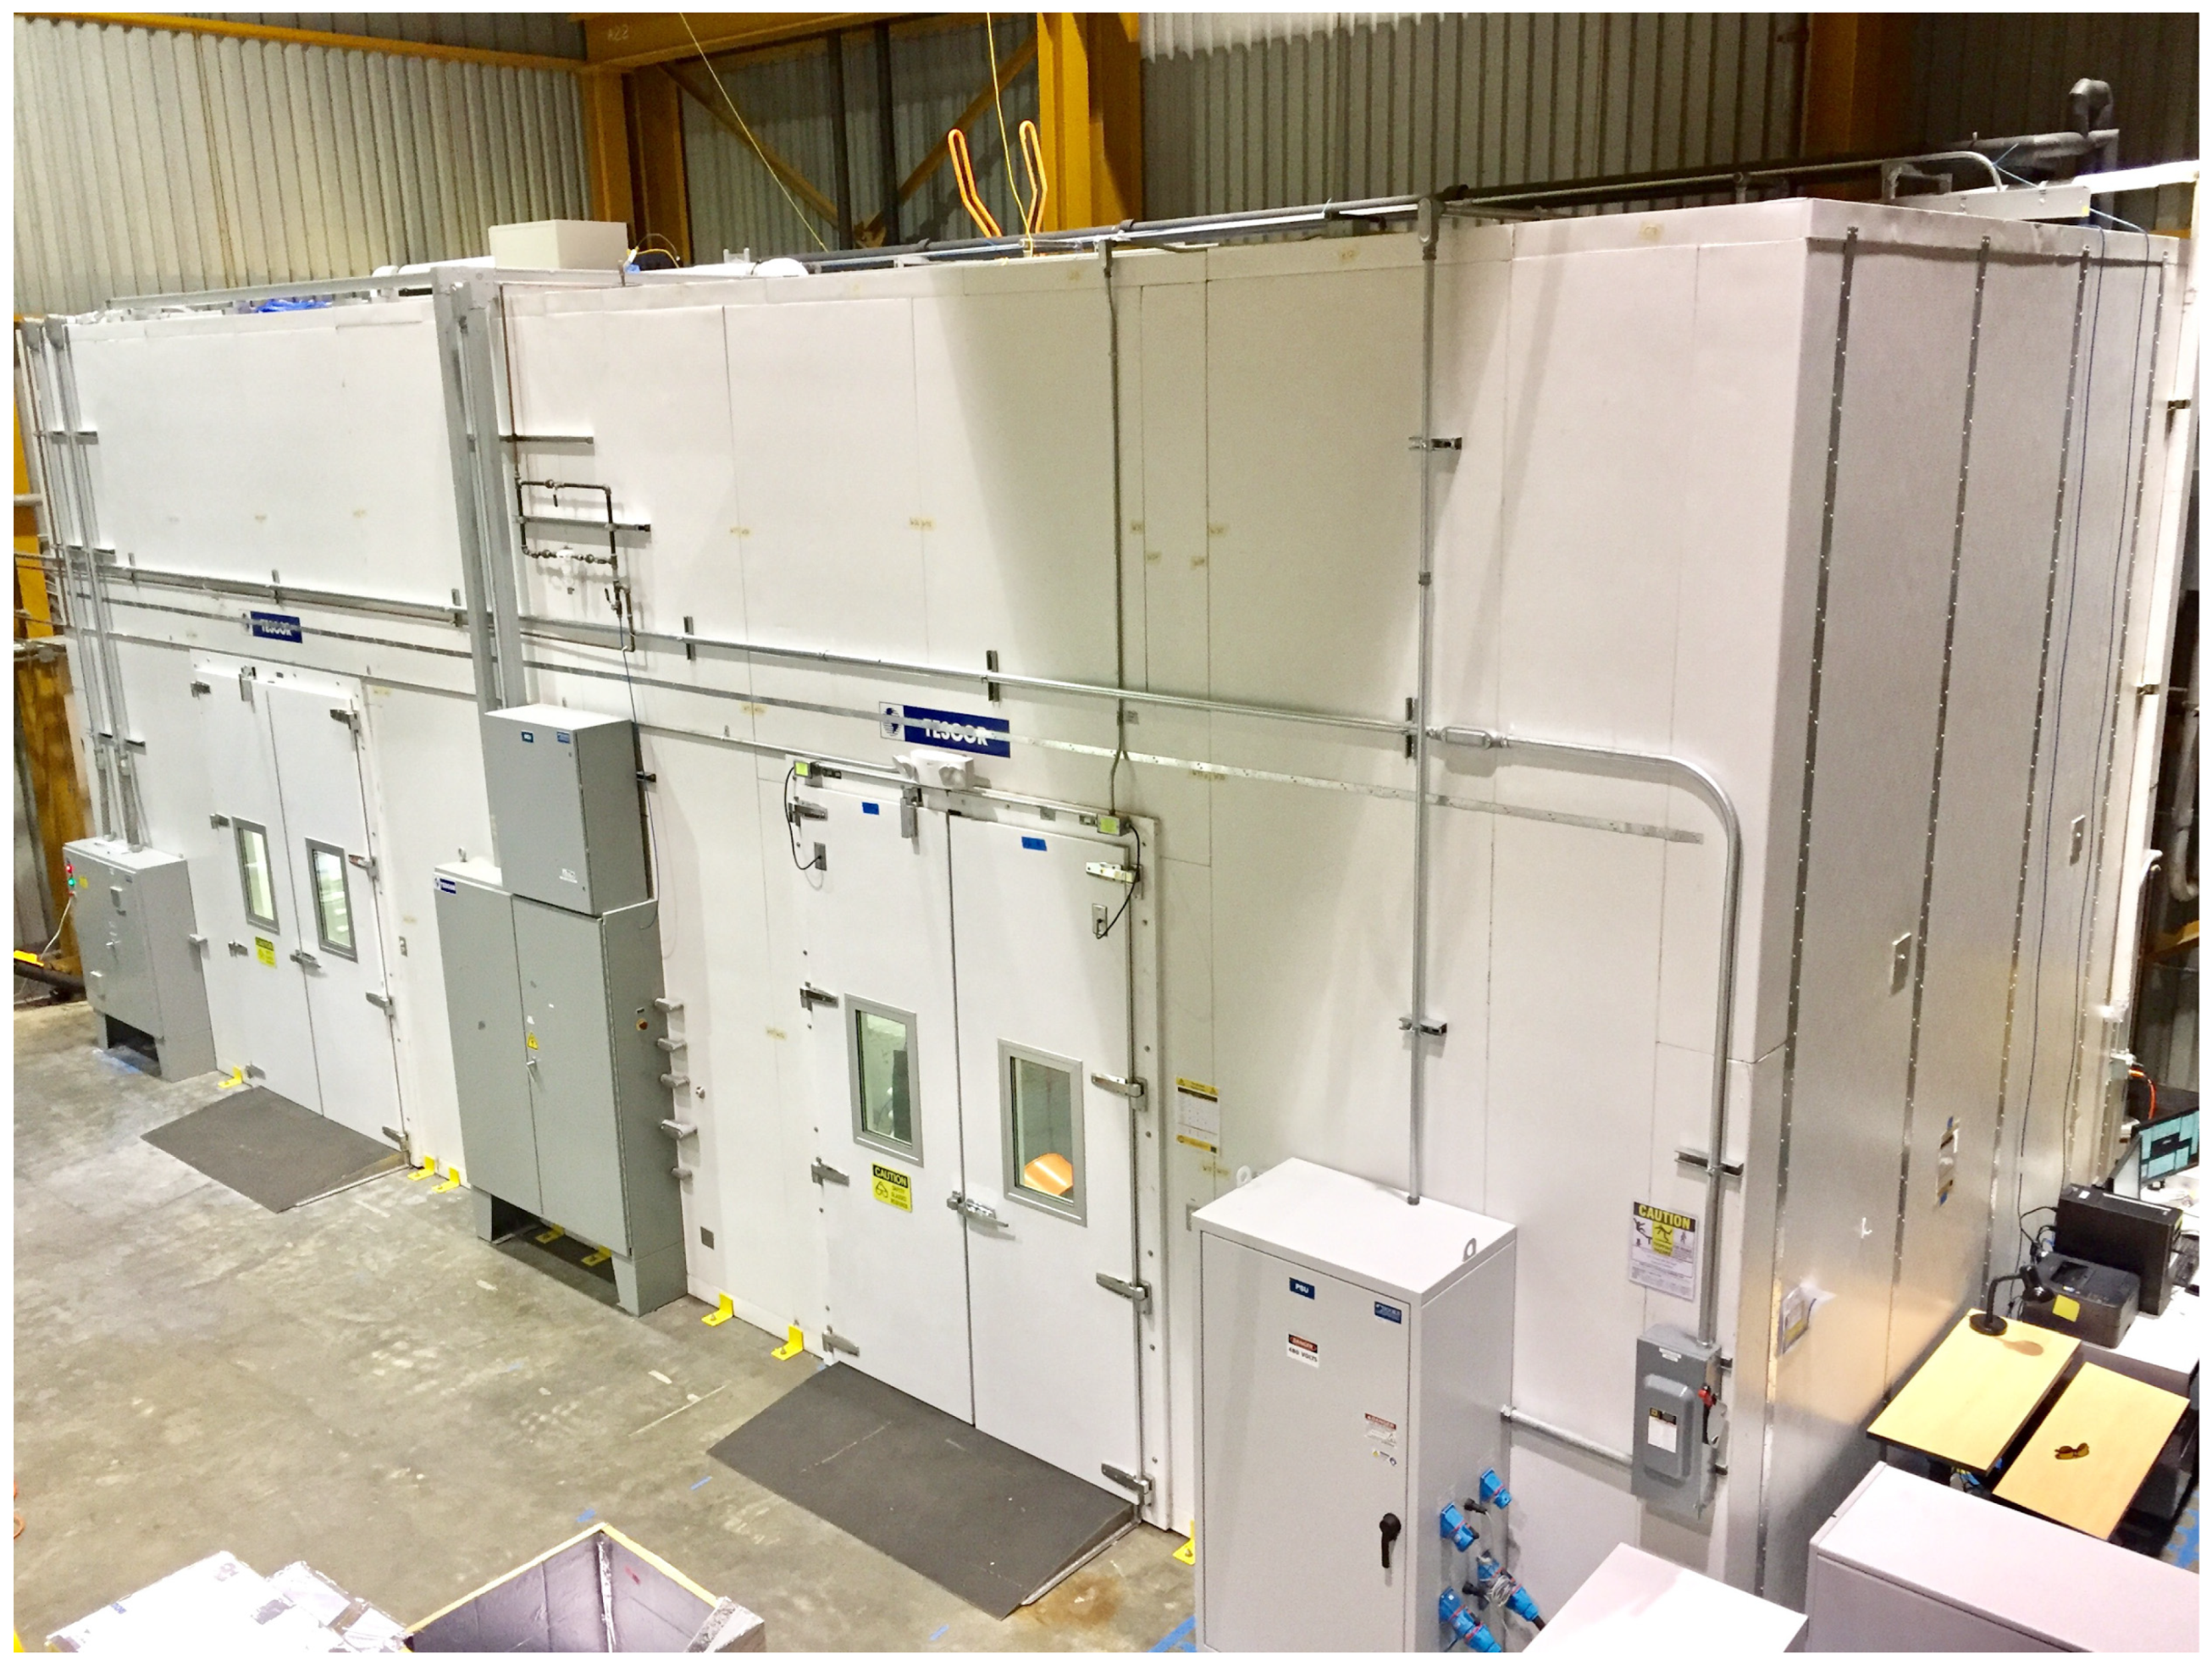
Figure 5.
Energy efficiency performance for the optimized R32, R454B, and R290 mini-split units (full capacity cooling).
Figure 5.
Energy efficiency performance for the optimized R32, R454B, and R290 mini-split units (full capacity cooling).
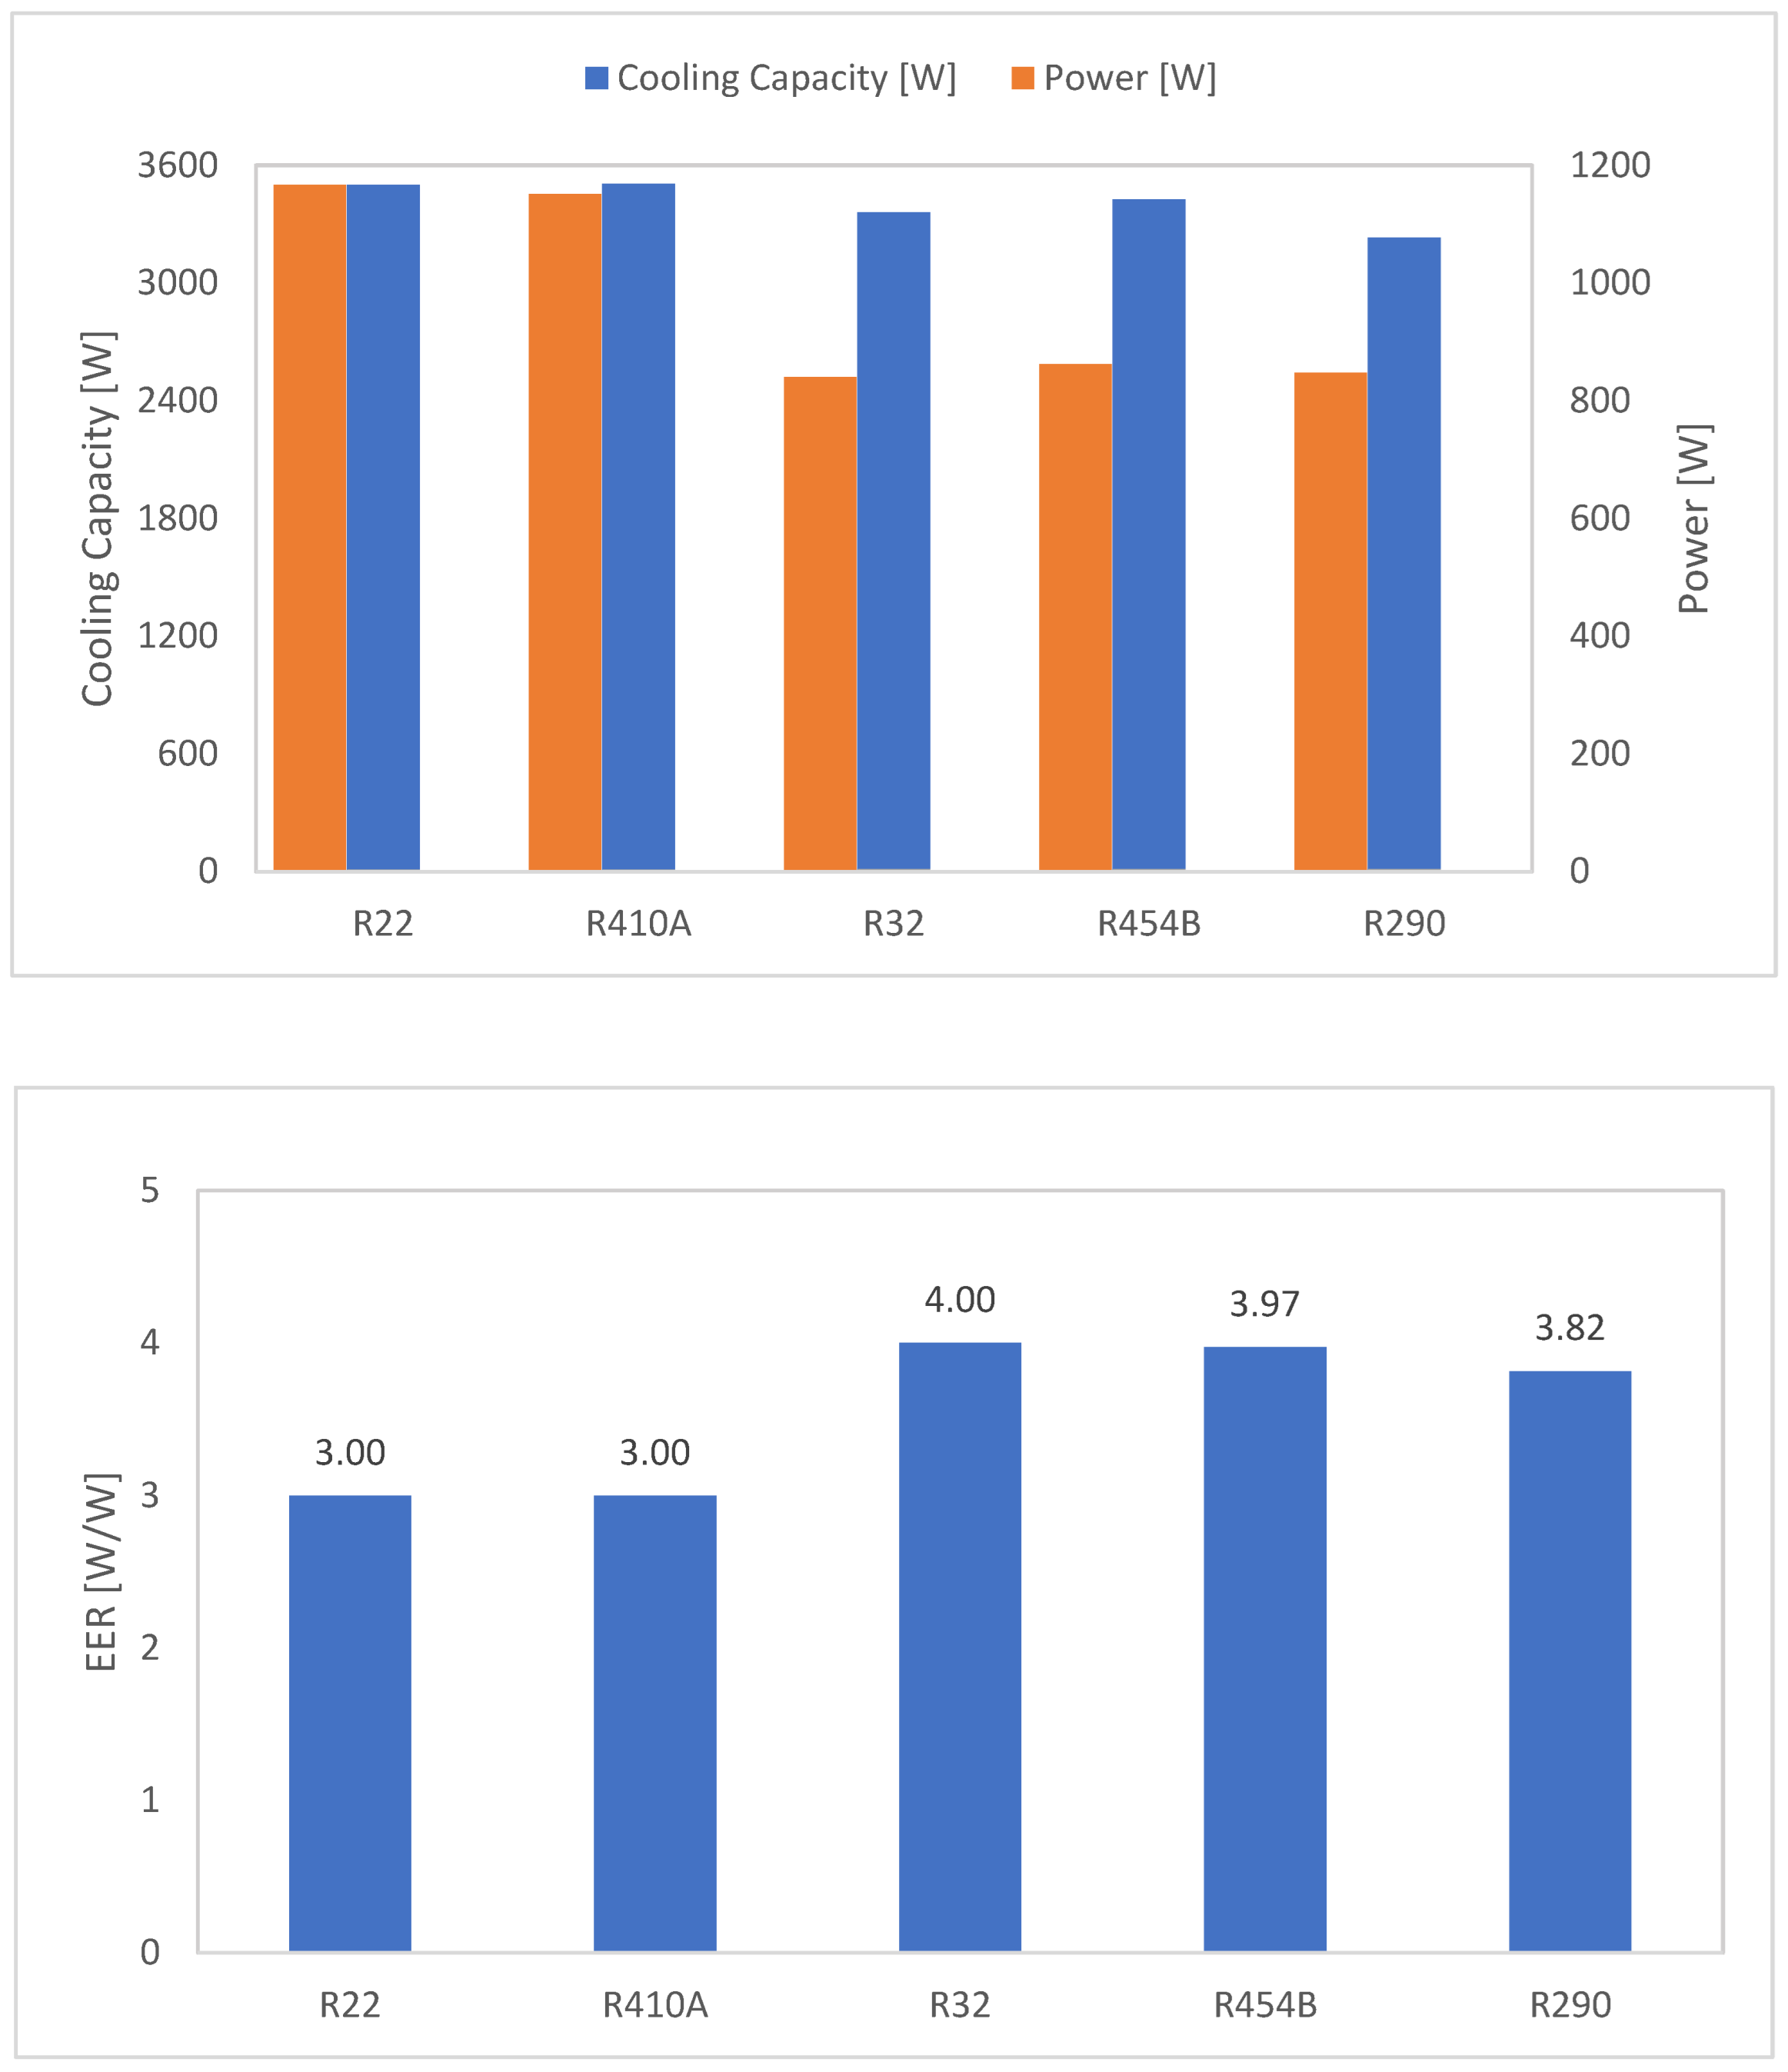
Figure 6.
Seasonal energy performances of three prototype AC units.
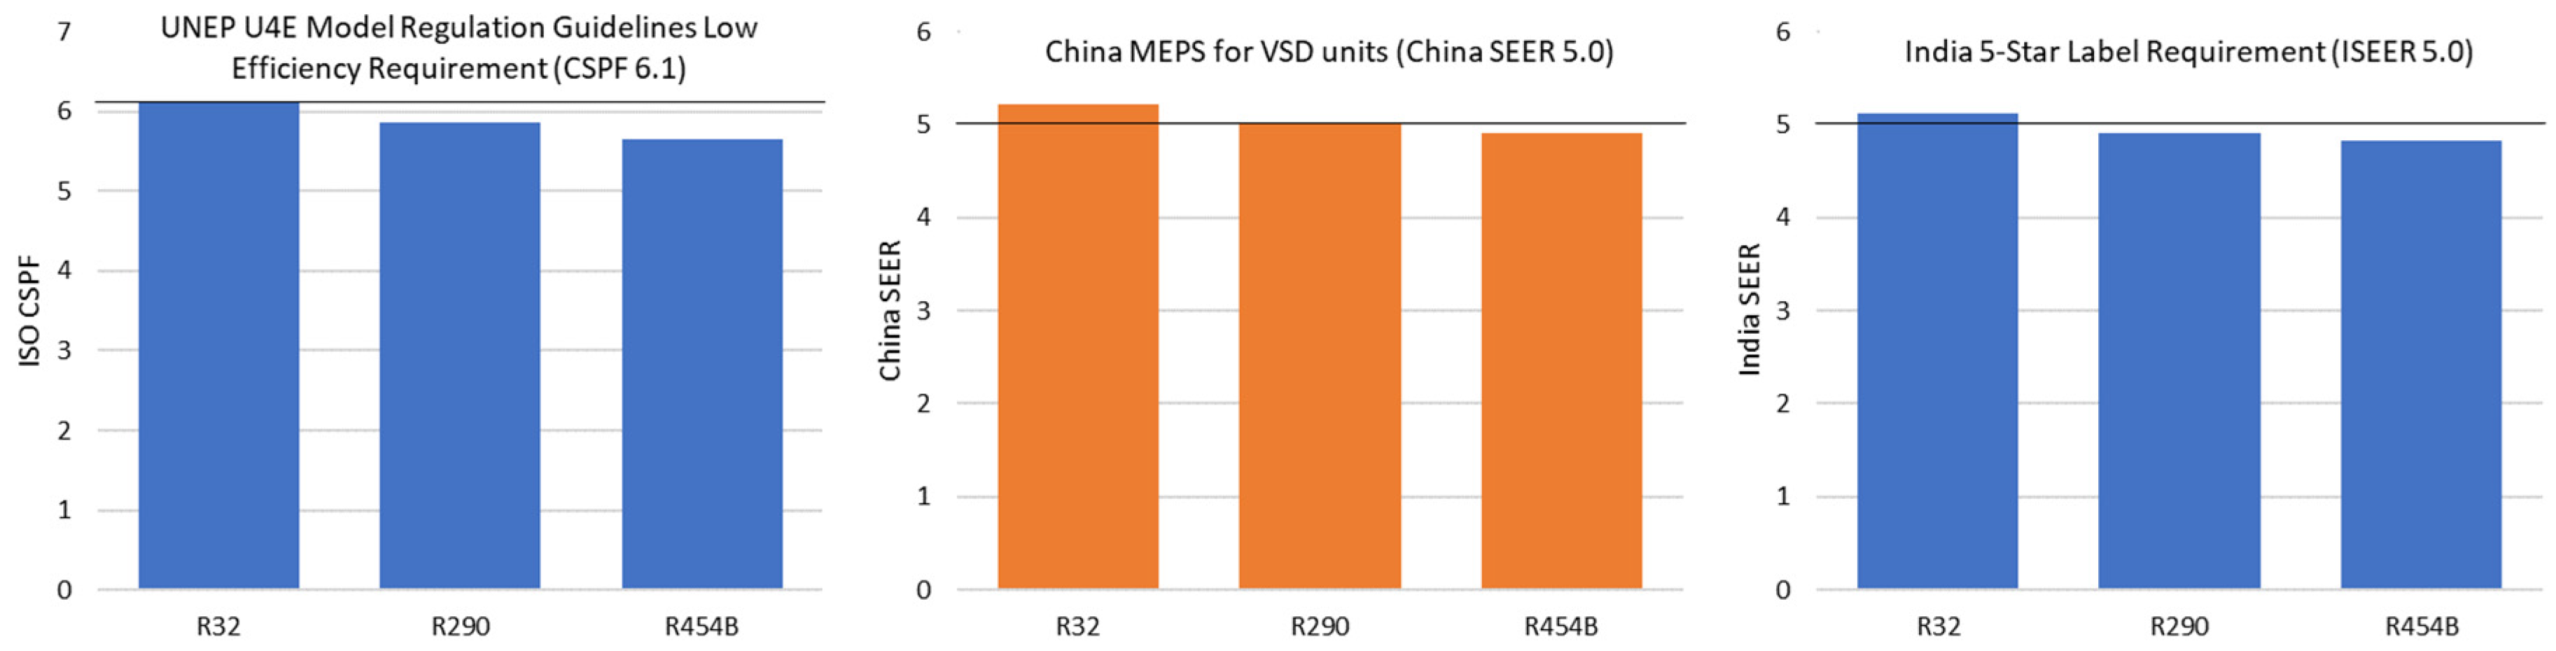
Table 1.
R22 and R410A GWP and ODP values.
| Type | Refrigerant | GWP 100 yearsa | ODP | |
|---|---|---|---|---|
| IPCC5b | RTOCc | |||
| HCFC | R22 | 1760 | 1780 | 0.034 |
| HFC | R410A | 1900 | 2100 | None |
Notes: a. GWP over a 100-year period. b. IPCC5: Intergovernmental Panel on Climate Change (IPCC) Fifth Assessment Report. c. RTOC: Refrigeration, Air Conditioning and Heat Pumps Technical Options Committee.
Table 2.
Reference mini-split AC models.
| Model | Market | Compressor Type | Rate EER (W/W) | Rate Cooling Capacity (kW) | Refrigerant |
|---|---|---|---|---|---|
| A | India | FSD | 3.0 | 3.5 | R22 |
| B | China | FSD | 3.0 | 3.5 | R410A |
Note: FSD: fixed speed drive; VSD: variable speed drive.
Table 3.
Model B (R410A) calibration results under standard full capacity cooling condition3.
| Cooling Capacity [W] | Power [W] | EER [W/W] | |
|---|---|---|---|
| Test | 3543 | 1208 | 2.93 |
| Simulation | 3506 | 1151 | 3.05 |
| % difference | -1.0% | -4.7% | 3.9% |
Table 4.
Key component constraints for the system optimization formulation.
| Component | Property | Model B | Lower Bound | Upper Bound |
|---|---|---|---|---|
| Indoor unit | Fan Air Flow Rate [m3/h] | 910 | 720 | 950 |
| Outdoor unit | Tube length[m] | 0.812 | 0.65 | 0.812 |
| Outdoor unit | Fan Air Flow Rate [m3/h] | 1800 | 1440 | 2160 |
Table 5.
Summary of the key design parameters of the studied designs.
| Key Design Parameters | Model B | Optimal Designs | ||
|---|---|---|---|---|
| Refrigerant | R410A | R32 | R454B | R290 |
| Compressor rated COPa | 4.55 | 4.5 | 4.74 | |
| Indoor Unit | ||||
| Tube diameter [mm] | 7 | 5 | 5 | 5 |
| Tube length[mm] | 656 | 656 | 656 | 656 |
| Number of tubes | 142 | 172 | 172 | 172 |
| Fan Power [W] | 25 | 30 | 50 | 60 |
| Fan Air Flow Rate [m3/h] | 910 | 864 | 792 | 864 |
| Outdoor Unit | ||||
| Tube diameter [mm] | 7 | 5 | 5 | 5 |
| Tube length[mm] | 812 | 650 | 786 | 786 |
| Number of tubes | 242 | 262 | 262 | 262 |
| Fan Power [W] | 40 | 42 | 61 | 59 |
| Fan Air Flow Rate [m3/h] | 1800 | 2016 | 1872 | 1836 |
| Cooling Capacity [W] | 3506 | 3360 | 3425 | 3232 |
| System Power [W] | 1151 | 840 | 862 | 847 |
| System EER [W/W] | 3.0 | 4.0 | 3.97 | 3.82 |
a. The rated compressor capacity and input are measured by the compressor manufacturer with inverter circuit based on the secondary refrigerant calorimeter methods defined by the standard JIS B8606. The compressors are used as is, without any modifications to the original designs.
Table 6.
Cost comparisons between optimal R32, R454B, and R290 prototypes and R410 reference model based on manufacturer survey.
Table 6.
Cost comparisons between optimal R32, R454B, and R290 prototypes and R410 reference model based on manufacturer survey.
| Cost [$US] | R410A Reference | R32 Prototype | R454B Prototype | R290 Prototype |
|---|---|---|---|---|
| Refrigerant | 5.36 | 3.00 | 3.00a | 2.73 |
| Heat Exchanger | 25.79 | 21.96 | 23.28 | 23.28 |
| Compressor | 47.65b | 36.08 | 36.08 | 59.16 |
| Capillary Tube/Expansion Valve | 0.50 | 4.36 | 4.36 | 4.36 |
| Fans + Motors | 16.47 | 20.42 | 20.42 | 20.42 |
| Control Board | 9.53 | 36.76 | 36.76 | 36.76 |
| Others | 50.00 | 50.00 | 50.00 | 50.00 |
| Total Material Cost | 155.31 | 172.58 | 173.90 | 196.71 |
a. Owing to low production volumes, the price of R454B is currently more than 9x higher than that of R32. It was assumed that the price would be similar to that of R32 when produced on an economic scale. b. Due to the low production volumes of R410A fix-speed units in the research market, the prices of fixed speed compressor components were higher.
Table 7.
Comparisons of the optimal simulation results and full capacity cooling test results.
| Test | Simulation | Δ% | Test | Simulation | Δ% | Test | Simulation | Δ% | |
|---|---|---|---|---|---|---|---|---|---|
| Refrigerant | R32 | R454B | R290 | ||||||
| Rated Cooling Capacity (W) | 3383 | 3360 | -0.68 | 3417 | 3425 | 0.23 | 3236 | 3232 | -0.12 |
| Power Consumption (W) | 829 | 840 | 1.33 | 849 | 862 | 1.53 | 818 | 847 | 3.55 |
| EER | 4.10 | 4.00 | -2.44 | 4.02 | 3.97 | -1.28 | 3.96 | 3.82 | -3.54 |
Note: R32 and R290 test results were validated at LBNL’s test chamber within 5% tolerance.
Table 8.
Comparisons of energy efficiency improvements and cost increases.
| Model B R410 (FSD) | Initial Plan (VSD) | Actual Performance (VSD) | Improvement from Reference | |
|---|---|---|---|---|
| Refrigerant | R22 | R32 (GWP 675) | ||
| Full cooling capacity [W] | 3500 | 3500 | 3456 | -1.3% |
| EER1 [W/W] | 3.0 | ≥ 3.0 | 4.1 | 33% |
| ISO CSPF2 [Wh/Wh] | 3.2 | ≥ 4.2 | 6.1 | 90% |
| UEC3 [kWh/y] | 805 | - | 413 | 49% |
| Estimated material cost [USD] | 170 (±10) | < 190(±10) | < 173(±10) | 2% |
| Refrigerant | R22 | R454B (GWP 470) | ||
| Full cooling capacity [W] | 3500 | 3500 | 3417 | -2.4% |
| EER [W/W] | 3.0 | ≥ 3.0 | 4.0 | 33% |
| ISO CSPF [Wh/Wh] | 3.2 | ≥ 4.2 | 5.7 | 78% |
| UEC [kWh/y] | 805 | - | 443 | 45% |
| Estimated material cost [USD] | 170 (±10) | < 190(±10) | 174(±10)4 | 2% |
| Refrigerant | R22 | R290 (GWP 3) | ||
| Full cooling capacity [W] | 3500 | 3500 | 3236 | -7.6% |
| EER [W/W] | 3.0 | ≥ 3.0 | 4.0 | 33% |
| ISO CSPF [Wh/Wh] | 3.2 | ≥ 4.2 | 5.9 | 83% |
| UEC [kWh/y] | 805 | - | 405 | 50% |
| Estimated material cost [USD] | 170 (±10) | As low as possible | 197(±10) | 16% |
Notes: FSD: fixed speed drive; VSD: variable speed drive. 1. Energy efficiency ratio per ISO 5151: 2010. 2. Cooling seasonal performance factor per ISO 16358-1: 2019. 3. Cooling seasonal energy consumption per ISO 16358-1: 2019. 4. Due to low production volumes, the price of R454B is currently more than 9x higher than that of R32. It was assumed that the price would be similar to that of R32 when produced on an economic scale.
Disclaimer/Publisher’s Note: The statements, opinions and data contained in all publications are solely those of the individual author(s) and contributor(s) and not of MDPI and/or the editor(s). MDPI and/or the editor(s) disclaim responsibility for any injury to people or property resulting from any ideas, methods, instructions or products referred to in the content. |
© 2026 by the authors. Licensee MDPI, Basel, Switzerland. This article is an open access article distributed under the terms and conditions of the Creative Commons Attribution (CC BY) license (http://creativecommons.org/licenses/by/4.0/).
Copyright: This open access article is published under a Creative Commons CC BY 4.0 license, which permit the free download, distribution, and reuse, provided that the author and preprint are cited in any reuse.


