
Submitted:
24 January 2026
Posted:
26 January 2026
You are already at the latest version
Abstract
Multivariate environmental studies frequently involve the integration of paired datasets exhibiting high heterogeneity, collinearity, and influential observations, which can undermine the stability and interpretability of classical multiblock analytical methods. In this context, this study aims to enhance the robustness of the STATICO framework for modeling common structures among environmental indicator blocks. To this end, a robust extension of the STATICO method is proposed by incorporating robust covariance estimators and adaptive weighting schemes within the original triadic algebraic structure, preserving its fundamental mathematical formulation. Robustification is introduced both at the interstructure stage, through a reformulated RV coefficient, and in the construction of the compromise space. The performance of classical and robust STATICO approaches is evaluated using simulated environmental datasets calibrated to represent Ecuadorian coastal systems. The results indicate that the robust STATICO approach increases the dominance and stability of the global compromise, produces a more balanced redistribution of inter-block similarities, and yields more discriminative representation values in the factorial space. Graphical analyses further reveal improved parsimony and stability of the latent structure compared with the classical formulation. Overall, the proposed robust STATICO method provides a methodologically sound and reliable tool for multiblock analysis of complex environmental data affected by contamination-related heterogeneity.
Keywords:
robust multiblock analysis
; STATICO
; environmental indicators
; co-inertia analysis
; partial triadic analysis
; robust covariance estimation
; multivariate environmental data
; structural modeling
1. Introduction
Multivariate analysis constitutes one of the fundamental methodological pillars for the study of complex environmental systems, in which multiple physicochemical, biological, and operational variables interact simultaneously [1]. In environmental monitoring contexts particularly in water quality studies and coastal ecosystems data are often characterized by high dimensionality, structural dependence among variables, spatio-temporal heterogeneity, and the recurrent presence of outliers arising from natural processes, instrumental errors, extreme events, or anthropogenic disturbances [2]. Environmental indicators such as temperature, salinity, turbidity, dissolved oxygen, or nutrient concentrations frequently exhibit abrupt fluctuations associated with climatic phenomena, point-source discharges, hydrodynamic changes, and measurement failures [3]. These atypical behaviors should not be interpreted solely as statistical noise but rather as structurally relevant manifestations of the system, whose identification is crucial for understanding environmental processes and supporting technical decision-making [2].
However, the presence of extreme values severely compromises the classical assumptions of normality, homoscedasticity, and linearity, thereby affecting the geometric stability and interpretability of traditional multivariate methods [4]. In particular, the use of classical estimators of mean and covariance in contaminated matrices leads to biased inferences, loss of factorial concentration, and distortion of structural relationships among variables, hindering the identification of dominant environmental patterns [5]. This limitation is especially critical in drinking water management and environmental monitoring systems, where unstable interpretations may translate into inefficient operational decisions, such as inappropriate chemical dosing, underestimation of environmental risks, or failures in the early detection of structural changes [2,3].
To address these challenges, robust multivariate statistics provide a solid theoretical framework that limits the influence of anomalous observations without sacrificing efficiency under ideal models [6]. Based on high-breakdown estimators such as the multivariate median, median absolute deviation (MAD), the minimum covariance determinant (MCD), and their computationally efficient extensions, robust versions of classical methods including Robust Principal Component Analysis (ROBPCA), multivariate regression, and robust classification have been developed [5,6]. These approaches have demonstrated improved inferential stability, enhanced detection of latent structures, and greater interpretability in empirical contexts characterized by noise and data contamination [7].
In parallel, multiblock methods have gained a central role in the analysis of complex environmental systems by enabling the simultaneous integration of multiple sets of variables observed on the same units (sites, stations, or time periods) [8]. Among these approaches, the STATICO method stands out for its ability to model dynamic relationships between pairs of tables by combining co-inertia analysis (COIA) with partial triadic analysis (PTA) to extract a common multiblock structure, referred to as the compromise [6,7]. This formulation is particularly well suited to spatio-temporal studies in ecology and water quality, where physicochemical and biological data series are analyzed across time or locations [9].
Nevertheless, the classical formulation of STATICO exhibits significant sensitivity to outliers and structural heterogeneity, as it relies on classical estimators of covariance and similarity (RV coefficients). In the presence of contamination, this sensitivity may induce unstable compromises, overrepresentation of extreme blocks, and loss of factorial coherence [7,8], thereby limiting its applicability in real environmental contexts.
Within this framework, the present study proposes a robust extension of the STATICO method (STATICO-R), integrating robust estimators of location and dispersion at all stages of the analysis: interstructure, compromise, and intrastructure [9]. Through the use of the MCD estimator, robust similarity metrics, and weighting schemes based on robust Mahalanobis distances, the proposed approach aims to stabilize the extraction of common structures, enhance inertia concentration, and enable more accurate detection of divergent blocks or periods in complex environmental systems [10]. The contribution of this work is twofold: from a methodological perspective, it extends the scope of robust multivariate statistics toward triadic multiblock analysis, an area scarcely explored in the literature; from an applied perspective, it provides an advanced tool for environmental monitoring and water quality management, particularly in contexts characterized by high natural variability and limitations in data quality. In doing so, it strengthens the integration of statistical rigor, structural interpretability, and technical decision-making in contemporary environmental studies.
Literature Review
Multiblock analysis has emerged as a fundamental methodological tool for studying structural relationships among complex datasets that share the same observational units [11]. This type of analysis enables the extraction of joint information from multiple matrices associated with different spatio-temporal conditions or groups of variables, providing an integrated representation of both within-block and between-block dependencies [12]. The present theoretical framework develops the methodological foundations underpinning this study: co-inertia analysis (COIA), partial triadic analysis (PTA), the formalization of the STATICO method, and its robust extension.
Co-Inertia Analysis (COIA)
Co-Inertia Analysis (COIA) was proposed by [6] as a method to maximize the covariance between two data tables X and Y, which contain common observations but different sets of variables. Its principle consists of identifying factorial axes that optimize the co-structure between both datasets. Mathematically, COIA seeks vectors a and b that maximize:
subject to normalization constraints on a and b. The analysis is performed using the cross-covariance matrix:
where is a diagonal matrix of observation weights. COIA allows the study of similarity between the multivariate structures of two systems of variables (e.g., physicochemical and biological), and its graphical representation highlights the linear association between them.
Partial Triadic Analysis (PTA)
Partial Triadic Analysis (PTA) is designed to analyze a series of tables representing the same set of variables measured under different conditions (times, stations, or sites). PTA aims to identify an average structure, referred to as the compromise, which captures information common to all blocks while preserving the specific characteristics of each individual table [12].
The PTA procedure is developed in three stages:
Interstructure: assessment of similarity among tables using RV-type correlation coefficients [12]. The RV coefficient is defined as:
The RV coefficient ranges between 0 and 1, with 1 indicating perfect structural similarity.
Compromise: computation of a weighted combination of tables to maximize average inertia:
where the weights are obtained from the spectral decomposition of the RV coefficient matrix. The compromise synthesizes the structure common to the entire series.
Intrastructure: projection of each table onto the global compromise to interpret its individual contribution.
The resulting compromise represents a stable depiction of the common pattern, while intrastructural projections allow the identification of deviations or specificities within each block.
The STATICO Method
The STATICO method belongs to the STATIS family, originally introduced by [13,14] and later systematically developed by [15]. These methodological approaches are oriented toward analyzing common structures and dynamic relationships among multidimensional datasets organized as data cubes, allowing the study of coherence and stability of interactions among blocks over time or space.
STATICO [16,17] is designed for the joint analysis of two data cubes, aiming to identify and evaluate the existence of a common structure between paired tables one from each cube and to analyze the stability of this structure across time or observational conditions. STATICO (Simultaneous Analysis of a Series of Paired Tables) was formalized by [18] to combine the strengths of COIA and PTA, extending the analysis to paired series of tables . In each pair, the tables contain common observations measured on different groups of variables (e.g., physicochemical and biological parameters).
The STATICO procedure consists of three stages:
Individual co-inertia computation: for each pair , the cross-covariance matrix is computed.
Triadic analysis of the matrices: PTA is applied to determine the common structure or compromise summarizing the shared co-structure among all pairs.
Interpretation of compromises and contributions: similarity among pairs is examined using the RV matrix, and blocks diverging from the global pattern are identified.
STATICO provides an integrated view of the dynamic relationships between two sets of variables observed over time or under varying environmental conditions, allowing assessment of the structural stability of multivariate relationships [14].
From a structural standpoint, the method requires homogeneity of variables within each cube, meaning that environmental variables and biological or response variables remain consistent across all tables. Additionally, sampling sites must coincide within each paired table, although they may vary across different time points.
The interstructure stage of STATICO computes optimal weights for each table, which are used to construct the compromise as a weighted average of cross-covariance matrices. Factorial analysis of this compromise yields a synthetic representation of the dominant common structure. Finally, the intrastructure stage projects the rows and columns of each individual table onto the compromise-defined factorial space, enabling integrated visualization and interpretation of variable contributions and site behavior over the analyzed series.
Reported applications include:
Classical STATICO extensively applied in ecology to relate species series with environmental factors [13].
Robust multivariate methods primarily developed for PCA, regression, and clustering [17], with limited applications to multiblock frameworks.
The present study contributes by extending robustness to a triadic multiblock method such as STATICO.
Notation and Data Structure
We consider pairs of matrices , with , where each pair represents two groups of variables measured on the same observations (monitoring sites or time points). In each block, groups physicochemical variables and biological/ecological variables. STATICO analyzes co-variation between both domains through the cross-covariance matrix , where is a diagonal matrix of observation weights. From the set , a common structure or compromise is estimated, whose stability is summarized by: (i) eigenvalues (proportion of inertia explained), (ii) RV coefficients (block compromise similarity), and (iii) cos² values (quality of representation per block on factorial axes). This formalization provides the basis for comparing classical and robust STATICO throughout the manuscript.
Robust Methods
Robust techniques in multivariate statistics have emerged as a methodological response to the inherent limitations of classical approaches when data exhibit outliers, structural contamination, or significant deviations from normality situations commonly encountered in empirical studies. In such scenarios, traditional estimators of location and dispersion may be severely affected, leading to unstable inferences and potentially biased conclusions. Robust methods aim to preserve the dominant central structure of the data while attenuating the influence of anomalous observations that do not reflect the global behavior of the phenomenon under study [20].
Within this framework, the Minimum Covariance Determinant (MCD) estimator stands as a cornerstone of robust multivariate statistics. The MCD jointly estimates the mean vector and covariance matrix from a subset of observations that minimizes overall dispersion, ensuring key properties such as a high breakdown point, affine equivariance, and bounded influence function. These properties guarantee estimator validity even in the presence of substantial data contamination, making MCD essential for reliable detection of multivariate outliers and the construction of robust models in complex empirical contexts [21].
The development of computationally efficient algorithms, such as FAST-MCD, has been crucial for making robust approaches feasible in moderate to large datasets. These algorithms rely on iterative concentration strategies that efficiently approximate the MCD solution while preserving its fundamental robustness properties and significantly reducing computational cost. This methodological advancement has promoted the adoption of MCD and its extensions across diverse applications and facilitated their integration as preliminary stages in more complex multivariate analyses [20].
Ultimately, the relevance of robust techniques lies in their ability to prevent masking effects, enhance detection of anomalous observations in high-dimensional spaces, and strengthen the inferential stability of subsequent statistical methods, including PCA, multivariate regression, classification, and multiblock approaches. In this sense, robust methods serve not only diagnostic purposes but also constitute fundamental methodological building blocks for advanced statistical analyses, ensuring more reliable, interpretable, and reproducible results in high-impact scientific research.
Robust Extension of STATICO
Despite its descriptive power, classical STATICO is sensitive to the presence of outliers. Traditional estimates of means and covariances may be strongly influenced by extreme observations, leading to distortion of the global compromise and erroneous interpretations [22]. To overcome this limitation, the present study develops a robust version of STATICO, termed Robust STATICO, incorporating robust estimators at each stage of the analysis:
- Interstructure: RV coefficients are computed from robust covariance matrices obtained via the MCD algorithm [23].
- Compromise phase: tables are weighted by factors inversely proportional to their robust Mahalanobis distances, reducing the influence of anomalous blocks.
- Intrastructure: projections are stabilized through an iterative reweighting process, ensuring convergence toward a perturbation-resistant compromise.
Thus, Robust STATICO preserves the conceptual structure of the original method while improving numerical stability and its capacity to identify divergent blocks or stations that significantly differ from the common multiblock pattern.
Structural Evaluation Indicators
The comparison between classical and robust approaches is based on indicators derived from the global compromise:
- Eigenvalues (): measure the proportion of inertia explained by each principal component.
- RV coefficients: quantify structural similarity among blocks.
- cos² values: reflect the contribution of each variable or block to the compromise.
These indicators enable quantification of improvements in structural stability and variance concentration, providing empirical evidence of the effectiveness of Robust STATICO compared to its classical counterpart [24].
Similarly, Table 1 presents the differences in their application and illustrates how the robust approach ensures that atypical data become an additional source of information for decision-making.
2. Materials and Methods
This study is grounded in a propositional paradigm with a quantitative approach, oriented toward the design and evaluation of a methodological contribution namely, Robust STATICO aimed at addressing an applied multivariate analysis problem in coastal environmental monitoring in Ecuador. Consistent with the Design Science Research tradition, a technical solution is formulated and justified, implemented and validated through a controlled statistical experiment using empirically calibrated simulated data, and its performance is assessed using structural metrics (eigenvalues, RV coefficients, and cos² values) to demonstrate both utility and rigor [25]. This solution-centered orientation aligns with the contemporary agenda of solution-oriented research in environmental and sustainability sciences, which demands replicable and transferable methods suitable for real institutional contexts [26].
2.1. Study Design
The present study adopts an experimental methodological approach, aimed at evaluating the performance of a robust version of the STATICO method in comparison with its classical formulation. To this end, a design based on environmentally calibrated simulations was implemented in order to reproduce, under controlled conditions, the spatio-temporal structure and correlation patterns characteristic of Ecuadorian coastal monitoring data.
Data were simulated following empirical distributions derived from historical environmental records collected in four Ecuadorian port zones: Esmeraldas, La Libertad, Manta, and Puerto Bolívar. These regions represent tropical marine coastal ecosystems with high physicochemical variability, making them suitable scenarios for assessing the ability of Robust STATICO to detect divergent structures in the presence of heterogeneity and outliers [20].
2.2. Data Generation and Structure
Within the experimental design, K = 4 paired datasets were constructed, corresponding to Esmeraldas, La Libertad, Manta, and Puerto Bolívar, each containing observations. The dataset was organized as paired blocks of matrices , representing coastal monitoring stations.
Each block includes:
Physicochemical variables: temperature (T), salinity (S), dissolved oxygen (DO), nitrates (NO₃), nitrites (NO₂), phosphates (PO₄), and silicates (SiO₄);
Synthetic ecological variables: e1–e10 and e21–e23 (abundance indices).
Both matrices were generated in a correlated manner to preserve the underlying multiblock structure. Means and variances for each variable were adjusted according to empirical ranges observed in Ecuadorian coastal environmental records. Subsequently, a controlled level of random perturbation was introduced to simulate outliers, emulating real fluctuations caused by discharges, ocean currents, or marine mixing processes.
The resulting design constitutes a realistic, empirically calibrated simulated dataset, suitable for evaluating the structural behavior of multivariate methods under environmentally plausible scenarios.
2.3. Data Preprocessing
2.3.1. Classical Centering and Scaling
In traditional STATICO, each variable is centered by its mean and optionally scaled to unit variance. Formally:
where and denote column means, and denotes the standard deviation.
2.3.2. Robust Centering and Scaling
In Robust STATICO, classical means and standard deviations are replaced by robust estimators, such as:
- The median instead of the mean;
- The median absolute deviation (MAD) instead of the standard deviation:
This transformation reduces the influence of outliers during standardization.
2.4. Application of Classical and Robust STATICO
Classical and robust versions of STATICO were applied in parallel to the same datasets. The procedure followed the three phases described in the theoretical framework:
Interstructure:
- Computation of cross-covariance matrices for each block;
- Assessment of similarity between pairs using the classical RV coefficient and its robust counterpart based on MCD covariances.
Compromise:
- Estimation of the global compromise as a weighted combination of the matrices, maximizing average inertia;
- In the robust version, weights were determined iteratively, reducing the influence of blocks with larger robust Mahalanobis distances.
Intrastructure:
- Projection of each block onto the global compromise to analyze its structural contribution;
- Identification of divergent blocks based on cos² values and factorial residuals.
2.5. Structural Comparison Indicators
To quantify differences between both approaches, the following indicators were employed:
- Eigenvalues (): proportion of inertia explained by the principal components;
- RV coefficients: structural similarity between individual co-inertias and the global compromise;
- cos² values: quality of block representation on factorial axes;
- Variance Concentration Ratio (VCR): ratio between the cumulative inertia of the first two components in the robust and classical versions.
These indicators enable assessment of stability, structural concentration, and resistance to perturbations of Robust STATICO relative to its classical counterpart.
2.6. Computational Implementation
Statistical processing was conducted using the R environment (version 4.3) with the packages ade4, robustbase, and rrcov.
The workflow included:
- Reading the paired data blocks;
- Variable standardization using z-score transformations;
- Execution of classical STATICO and computation of the global compromise;
- Application of Robust STATICO using MCD estimators and iterative weighting schemes;
- Generation of comparative plots for eigenvalues, RV coefficients, and cos² values, supported by factorial interpretation.
Results were analyzed and visualized using biplots and contribution diagrams, following the guidelines proposed in [21] for multiblock compromise analysis.
3. Results
The RV coefficient is a matrix correlation measure that quantifies the similarity between multivariate structures, analogous to a correlation between two cross product matrices. Within the STATICO framework, the RV coefficient is interpreted as a measure of geometric proximity between the co-structures of two blocks, that is, the extent to which they share a similar organization of relationships among variables in the factorial space of the compromise.
The RV coefficient matrix quantifies the structural similarity among the spatial blocks (La Libertad, Manta, and Puerto Bolívar) based on the co-structure between the analyzed sets of variables. Under classical STATICO, RV values indicate a moderate level of similarity between blocks (0.39–0.47), with the La Libertad-Manta pair emerging as the most similar (RV = 0.471) and the Manta-Puerto Bolívar pair as the least similar (RV = 0.390). In contrast, Robust STATICO redistributes these similarities: the La Libertad-Manta association is slightly reduced (RV = 0.441), while the similarity between Manta and Puerto Bolívar increases markedly (RV = 0.460). This pattern suggests that part of the inter-block structure captured by the classical method was influenced by extreme observations or localized noise.
Table 2 summarizes the differences in RV coefficients between both approaches. In classical STATICO, RV values range from 0.39 to 0.47, indicating a moderate common structure among sites, characterized by a shared pattern accompanied by spatial heterogeneity. The La Libertad-Manta pair (0.4707) is the most similar under the classical approach, whereas Manta-Puerto Bolívar (0.3900) appears as the least similar. Under Robust STATICO, this pattern is reorganized: the RV coefficient for Manta-Puerto Bolívar increases substantially (0.3900 → 0.4601), while that for La Libertad-Manta decreases (0.4707 → 0.4413). This behavior is consistent with robust statistical theory: when contamination or extreme events are present, classical estimators may inflate or attenuate similarities depending on which block contains dominant outliers. By incorporating robust covariance estimators (e.g., MCD-based estimators) and weighting schemes that downweight extreme observations, the RV coefficient more accurately reflects stable co-structures rather than associations driven by outliers.
Similarly, the largest change is observed for the Manta-Puerto Bolívar pair (ΔRV = +0.0701), suggesting that the classical approach was underestimating their structural similarity. A theoretically consistent explanation is that, under the classical method, a small number of influential observations may distort the covariance structure of one block, thereby affecting the global geometry and artificially reducing the RV coefficient. The robust approach attenuates the influence of these observations, allowing the shared co-structure to be more accurately recovered.
Smaller changes (-0.0294 and +0.0140) indicate fine-scale adjustments: the robust method reduces potentially inflated associations (as in the La Libertad-Manta case) and slightly reinforces others, which is precisely the behavior expected from a well-formulated robust methodology.
3.2. Dominance of the Global Compromise: Eigenvalues of the RV Matrix (RV.eig)
The RV.eig eigenvalues are derived from the Partial Triadic Analysis (PTA) applied to the interstructure and measure the dominance of the common compromise. The first eigenvalue represents the magnitude of the common factor shared by the blocks, whereas subsequent eigenvalues capture residual heterogeneity (block-specific variation) not included in the common structure.
The ΔRV values reported in Table 3 provide a direct diagnostic of what the robust approach corrects relative to the classical formulation. In theory, if the dataset exhibited approximately Gaussian behavior without contamination, ΔRV values would tend toward zero. Therefore, non-negligible ΔRV values constitute indirect evidence of heterogeneity and/or influential observations.
Analysis of the RV matrix eigenvalues (PTA on RV) reveals an increase in the first eigenvalue under the robust approach (1.912) compared to the classical version (1.876), indicating that the dominant common structure becomes stronger when the influence of extreme observations is controlled. At the same time, the second eigenvalue decreases under the robust formulation, suggesting a reduction in secondary heterogeneity attributable to noise or local distortion.
Similarly, the first eigenvalue increases from 1.8763 (classical) to 1.9120 (robust). This increase indicates that, under robustification, the common structure becomes more dominant and less fragmented. In parallel, the second eigenvalue decreases (0.6110 → 0.5592), which can be interpreted as a reduction in secondary variation associated with noise or local distortion.
3.3. Block Contributions to the Compromise: tabw Weights
The tabw weights determine the extent to which each block contributes to the compromise. In the classical formulation, contributions may appear nearly uniform when there is no strong geometric rationale for differentiating blocks, or when the procedure does not explicitly penalize instability. In robust approaches, weights tend to become more informative, as the method seeks to construct a stable compromise by maximizing structural consistency while reducing the influence of noisy blocks.
Table 4 reports the block weights (tabw), which indicate the relative contribution of each block to the construction of the compromise. Under classical STATICO, weights are relatively uniform, as expected in the absence of explicit penalization for heterogeneity. Under Robust STATICO, weights become more informative: the contribution of La Libertad decreases, while that of Puerto Bolívar increases, reflecting an adaptive adjustment consistent with the robust objective of downweighting potentially noisy blocks without excluding them from the analysis.
Under the classical formulation, block weights are similar (0.597, 0.571, and 0.563), suggesting that the compromise is constructed from relatively homogeneous contributions across blocks. Under the robust formulation, although the weights remain close in magnitude, a clear rebalancing effect is observed: the contribution of La Libertad decreases (−0.0218), while that of Puerto Bolívar increases (+0.0207). From a theoretical perspective, this indicates that the Puerto Bolívar block contributes a structure that is more consistent with the robust compromise, whereas La Libertad exhibits higher local variability or noise that the robust approach appropriately attenuates.
3.4. Block Representation Quality: cos²
The cos² metric measures the proportion of variance in a block’s representation explained by the selected factorial axes and is therefore an indicator of projection quality. In factorial analysis, high cos² values indicate that a block is well represented in the latent subspace. However, when classical covariance estimators are used, cos² values may be influenced by extreme observations that artificially orient the axes (leverage effects).
As shown in Table 5, the cos² metric quantifies the quality with which each block is represented in the compromise subspace. Under classical STATICO, cos² values are uniformly high (~0.78 - 0.79), which may suggest good representation but can also reflect structural optimism in the presence of extreme observations. Under Robust STATICO, cos² values become more discriminative: Manta shows an increase in representation quality (0.842), whereas La Libertad decreases (0.748). This pattern indicates that the robust approach corrects potentially inflated representations and improves the alignment of blocks whose structures were previously distorted by noise.
Under the classical approach, cos² values are nearly uniform (~0.78-0.79). Under the robust approach, cos² becomes more discriminative: Manta shows a marked increase (0.7918 → 0.8420), while La Libertad decreases (0.7843 → 0.7477). This asymmetry is theoretically coherent, as robustification corrects a potentially inflated representation of La Libertad and improves the alignment of Manta with the compromise by filtering out structural distortions.
3.5. Compromise Structure: Eigenvalue Spectrum of the Compromise (eig)
The eig eigenvalues of the compromise describe the distribution of inertia across the factorial axes. Under robustification, absolute eigenvalue magnitudes may change due to: (i) robust centering and scaling; (ii) robust covariance estimation; and (iii) internal normalization within the method.
As reported in Table 6, the compromise eigenvalues (eig) characterize the inertia distribution in the factorial space. Because the robust approach may involve changes in centering/scaling schemes and covariance estimation, absolute eig values should not be compared directly. Instead, interpretation should focus on (i) the proportion of inertia explained by the leading axes and (ii) the relative decay of the eigenvalue spectrum (parsimony). In this regard, the robust spectrum exhibits a steeper drop after the first components, indicating greater parsimony and a more stable latent structure, with fewer axes dominated by noise.
3.6. Graphical Comparison of the Compromise: Classical kplot vs. Robust kplot
kplot graphs allow a visual assessment of the geometric stability of the compromise and the coherence among blocks. In the classical STATICO displayed in Figure 1, the sample clouds appear more dispersed and the orientations of variable gradients exhibit greater variability across sites, which is consistent with sensitivity to local heterogeneity. In contrast, under Robust STATICO, the geometry becomes noticeably more stable: sample clouds are more compact, variable gradients are displayed more coherently, and axis alignment across blocks is more consistent. This visual evidence is fully consistent with the increase in the first RV eigenvalue and with the redistribution of tabw weights and cos² values observed in the quantitative metrics.
Overall, the results confirm that classical STATICO identifies a common structure among blocks; however, its output tends to be less discriminative, as reflected by nearly uniform block weights and homogeneous cos² values. By contrast, the Robust STATICO shown in Figure 2: (i) strengthens the dominance of the global compromise (increase in RV.eig1), (ii) redistributes inter-block similarities in a coherent manner (notably the marked increase for the Manta–Puerto Bolívar pair), (iii) adjusts block contributions (tabw), and (iv) yields a more discriminative representation (cos²). These differences support the need to robustify STATICO when environmental data exhibit heterogeneity, noise, and extreme observations, thereby improving stability, parsimony, and interpretability.
4. Discussion
4.1. Relevance of Robust Approaches in Multiblock Modeling
Authors should discuss the results and how they can be interpreted from the perspective of previous studies and of the working hypotheses. The findings and their implications should be discussed in the broadest context possible. Future research directions may also be highlighted.
The results obtained confirm that incorporating robustness into the STATICO framework does not constitute a mere technical variant, but rather a substantive improvement in terms of structural stability, geometric interpretability, and multiblock coherence [27,29]. Although classical STATICO allows the identification of a common structure among paired datasets, comparative analyses show that its performance may be compromised when data exhibit inherent heterogeneity, influential observations, or environmental noise features commonly encountered in ecological and water quality studies [30,31].
In this study, Robust STATICO demonstrated a greater ability to extract a dominant global compromise, as reflected by the increase in the first interstructure eigenvalue (RV.eig) and a more coherent redistribution of inter-block similarities [32,33]. These findings are consistent with multivariate robust statistical theory, which establishes that classical covariance estimators are highly sensitive to deviations from normality and to extreme values, potentially inducing distortions in factorial geometry and latent structure identification [34,36]. By contrast, the robust approach based on resistant estimators such as the robust Mahalanobis distance attenuates the influence of extreme observations without removing them, thereby preserving relevant system information [37,38]. This behavior aligns with previous results highlighting the superiority of robust methods in improving covariance stability and latent pattern detection in contaminated multivariate contexts [39,40]. The present study extends these principles to the domain of triadic multiblock analysis, demonstrating that robustness is particularly pertinent when variability is not an artifact but an intrinsic property of the environmental system under study [41,42].
4.2. Structural Interpretation and Block Behavior
Interstructure analysis reveals that Robust STATICO significantly reorganizes inter-block relationships without arbitrarily altering the overall structure [43,44]. In particular, the observed increase in the RV coefficient between Manta and Puerto Bolívar indicates that the classical approach was underestimating their structural similarity, likely due to the influence of local extreme observations affecting classical covariance estimation [48,49]. Robustification enabled the recovery of a more stable and consistent co-structure between these blocks, in agreement with the graphical evidence observed in RV heatmaps and comparative kplots [45].
Furthermore, analysis of block weights (tabw) shows that Robust STATICO introduces an adaptive weighting mechanism, slightly reducing the contribution of blocks with higher internal heterogeneity while reinforcing those whose structure is more coherent with the global compromise [46]. This behavior is theoretically consistent with the principles of multiblock analysis, where the objective is not to enforce uniform contributions but to maximize compromise stability and representativeness [47,48]. The cos² values reinforce this interpretation: whereas classical STATICO yields homogeneously high representation quality potentially reflecting optimistic representations the robust approach produces more discriminative cos² values [49]. The marked increase in representation quality for Manta and the decrease observed for La Libertad suggest that Robust STATICO corrects projections inflated by leverage effects, providing a more realistic assessment of each block’s alignment with the common structure [50]. This result is consistent with previous studies indicating that robust weighting and representation schemes improve interpretability by emphasizing structurally consistent components across time or space [51].
4.3. Ecological and Methodological Implications
From an ecological perspective, Robust STATICO offers a more faithful and stable representation of environmental relationships in coastal systems characterized by high natural variability and potential measurement errors [67,69]. In tropical ecosystems such as those along the Ecuadorian coast where variables such as salinity, turbidity, dissolved oxygen, and nutrients fluctuate due to seasonal processes, continental discharges, and oceanographic dynamics the presence of localized anomalies is inevitable [52,53]. In this context, robust estimators enable the identification of persistent structural associations without allowing extreme events to distort the global interpretation of the system [54,55].
Graphical results particularly the greater compactness of observation clouds, the more coherent alignment of variable gradients, and the increased dominance of the first compromise axis demonstrate that Robust STATICO enhances the ecological readability of multivariate patterns [56]. This makes it especially suitable for environmental monitoring programs, water quality assessment, and the analysis of complex ecological systems, where data irregularity is not an exception but a structural condition [57,58].
From a methodological standpoint, integrating robust covariance estimators into the STATICO analytical workflow reinforces the need for hybrid approaches combining multiblock analysis and robust statistics [59,60]. Such approaches extend the scope of multivariate analysis toward tools that are more resilient to data imperfection and uncertainty an essential aspect in applied environmental studies. Similar results have been reported in robust extensions of PCA and co-inertia analysis, evidencing a consolidated trend toward the systematic incorporation of robustness in applied multivariate inference [61].
4.4. Practical Implications and Applicability of Robust STATICO
From an applied perspective, the Robust STATICO proposed in this study provides a high-value analytical tool for contexts requiring the integration of multiple multivariate data blocks under real-world conditions of heterogeneity, structural noise, and influential observations [62]. Its practical utility is particularly evident in scenarios where classical multiblock methods may produce unstable compromises or distorted interpretations due to the sensitivity of traditional covariance estimators [63].
In environmental and water quality monitoring, Robust STATICO enables the joint analysis of physicochemical, biological, and operational variables measured across sites or time periods, ensuring that extreme events such as point discharges, intense climatic episodes, or measurement errors do not artificially dominate the identified common structure [64]. This is especially relevant for coastal and estuarine systems, where natural variability is high and data often follow non-Gaussian distributions [65].
Moreover, the method is applicable to environmental management and decision-making programs by facilitating the identification of persistent structural patterns that can support:
(i) early detection of changes in environmental quality,
(ii) robust comparison among monitoring zones, and
(iii) integrated evaluation of management or intervention measures.
Operationally, Robust STATICO is particularly useful when paired series of tables are available across time or space, as it synthesizes multiblock information into a stable and parsimonious compromise, reducing dimensional complexity without sacrificing interpretability [66,67]. This property makes it suitable for technical and academic institutions working with large volumes of heterogeneous environmental data and requiring reproducible, methodologically sound analyses [68,69].
Beyond the environmental domain, the proposed approach can be extended to other applied fields such as regional economics, environmental epidemiology, or territorial management, where robust integration of multiple information sources represents a recurring methodological challenge [70]. In these contexts, Robust STATICO provides an analytical framework that combines mathematical rigor, statistical stability, and practical utility, aligning with current needs in applied multivariate analysis for complex scenarios [71].
4.5. Advantages and Future Perspectives
Overall, the empirical evidence demonstrates that Robust STATICO does not arbitrarily modify the analysis but consistently improves its statistical and geometric properties [71]. In particular, results show that the robust approach:
(i) reorganizes RV coefficients to reflect more stable co-structures,
(ii) increases the dominance of the global compromise (RV.eig),
(iii) adjusts block weights (tabw) according to structural stability,
(iv) produces more discriminative and realistic cos² values, and
(v) yields a more parsimonious compromise with greater inertia concentration in the leading axes.
These advantages position Robust STATICO as a high-value statistical tool for analyzing complex environmental systems [72]. Beyond the present results, this approach opens new research avenues focused on: (a) dynamic monitoring of environmental time series, (b) multimodal integration of environmental, biological, and socioeconomic data within robust multiblock frameworks, and (c) extending the method toward neutrosophic or fuzzy formulations that explicitly model uncertainty and indeterminacy in data [73].
In this sense, Robust STATICO is consolidated not only as a methodological enhancement of the classical approach, but also as an advanced analytical platform for environmental decision making, sustainability assessment, and applied ecological research in real-world contexts [74].
5. Conclusions
This study demonstrates that the systematic integration of robust estimators within the STATICO method constitutes a substantive methodological advance for multiblock analysis applied to environmental data characterized by high variability, structural heterogeneity, and the presence of outlying observations. Rather than a purely technical adjustment, Robust STATICO emerges as a conceptually coherent extension of the classical approach, specifically designed to improve the geometric stability and interpretability of the multivariate compromise.
The robust STATICO developed in this research preserves the theoretical architecture of the classical method based on Partial Triadic Analysis (PTA) and Co-Inertia Analysis (COIA) while incorporating weighting procedures grounded in robust Mahalanobis distances and Minimum Covariance Determinant (MCD) estimators. This integration effectively minimizes the influence of outliers and influential observations without distorting the underlying factorial geometry or artificially altering the common structure among blocks.
The empirical comparison between classical and robust STATICO revealed methodologically meaningful differences. In particular, the robust approach exhibited:
(i) a stronger dominance of the global compromise, reflected in a higher concentration of inertia in the leading factorial axes (88% versus 72%);
(ii) improved structural coherence among blocks, manifested in a more stable redistribution of RV coefficients; and
(iii) enhanced representation quality, with cos² values that were more discriminative and consistent with the internal stability of each block.
These results confirm that robustification increases numerical stability, reduces structural fragmentation, and improves the interpretability of the factorial space, consolidating Robust STATICO as a more reliable statistical tool for integrating heterogeneous multivariate information.
From a technical perspective, the proposed model can be interpreted as a robust extension of triadic multiblock analysis, particularly well suited for the simultaneous study of paired table series under conditions of structural noise, partial collinearity, and non-Gaussian variability. This contribution aligns with contemporary developments in robust multivariate statistics, extending their scope toward highly complex multiblock methods.
Moreover, Robust STATICO provided a more coherent and environmentally plausible interpretation of the relationships between simulated physicochemical and biological variables in Ecuadorian coastal zones (La Libertad, Manta, and Puerto Bolívar). The method enabled more precise identification of dominant structural gradients while reducing distortions caused by extreme observations or measurement errors phenomena that are recurrent in real environmental records.
In this context, Robust STATICO positions itself as a high-potential analytical tool for coastal ecological monitoring, environmental quality assessment, and marine–coastal ecosystem management, offering a framework capable of synthesizing common structures without sacrificing stability or interpretative realism.
5.1. Future Research Directions
The methodological development presented herein opens several avenues for future research and application:
- Implementation on real coastal monitoring data.
Future studies should apply Robust STATICO to empirical datasets derived from environmental monitoring networks in order to evaluate its performance in detecting persistent structures under conditions of natural variability, anthropogenic pressure, and extreme events.
- 2.
- Integration with statistical learning methods.
Combining Robust STATICO with statistical learning techniques such as robust clustering, multivariate segmentation methods, or probabilistic predictive models could enhance its analytical and predictive capabilities in dynamic environmental management scenarios.
- 3.
- Extension to advanced uncertainty frameworks.
Incorporating approaches based on neutrosophic logic, fuzzy theory, or Bayesian models would broaden the method’s applicability to contexts involving incomplete, uncertain, or indirectly measured data, further strengthening its relevance for complex systems analysis.
- 4.
- Interdisciplinary applications.
Beyond the environmental domain, Robust STATICO shows strong potential for application in fields such as ecological economics, environmental epidemiology, applied geography, and natural resource management disciplines that share the challenge of integrating multiple information sources under high structural variability.
5.2. Study Limitations and Scope
Although this study was conducted using statistically simulated data, these datasets were empirically calibrated to reproduce the ranges, correlations, and variability patterns observed in Ecuadorian coastal systems. Controlled simulation enabled rigorous evaluation of the methodological behavior of Robust STATICO under reproducible conditions, ensuring experimental validity and result traceability.
Nevertheless, simulation represents only a partial approximation of real ecological complexity. Accordingly, future research should apply the methodology to observational field data to validate its performance in dynamic, heterogeneous environments subject to uncontrolled disturbances.
Despite this limitation, the study makes a significant contribution to the development of robust multivariate analysis by proposing a tool capable of controlling the influence of outliers systematically generated in environmental, operational, and administrative measurement processes. In the Ecuadorian context, characterized by institutional technical constraints and high data variability, the availability of a methodology that enhances analytical stability and reliability constitutes a scientific and applied contribution of considerable value.
In this sense, Robust STATICO not only extends the theoretical boundaries of multiblock analysis but also provides a practical and methodologically sound response to real-world data management challenges faced by environmental, academic, and territorial planning institutions.
Author Contributions
Conceptualization, H.V.C. and O.R.B.; methodology, H.V.C. and O.R.B.; software, H.V.C. and O.R.B; P.G, O.R.B; formal analysis, P.G, O.R.B;; investigation, H.V.C..; resources, H.V.C.; data curation, H.V.C.; writing—original draft preparation, H.V.C.; writing—review and editing, H.V.C.; visualization, H.V.C.; supervision, O.R.B; project administration, H.V.C.. All authors have read and agreed to the published version of the manuscript.
Funding
This research received no external funding. The APC was funded by the authors.
Institutional Review Board Statement
Not applicable.
Informed Consent Statement
Not applicable.
Data Availability Statement
No new data were created or analyzed in this study.
Acknowledgments
Not applicable.
Conflicts of Interest
The authors declare no conflicts of interest. The funders had no role in the design of the study; in the collection, analyses, or interpretation of data; in the writing of the manuscript; or in the decision to publish the results.
References
- Basha, Aishah. Advancements in Robust Least Squares Approximation Techniques: A Comparative Analysis. Mathematics and Statistics 2025, 13(5), 374–382. [Google Scholar] [CrossRef]
- Rodrigues Barroso, G.; Pinto, C. C.; Nunes Ludolf Gomes, L.; Corrêa Oliveira, S. Assessment of water quality based on statistical analysis of physical-chemical, biomonitoring and land use data: Manso River supply reservoir. Science of the Total Environment 2024, 912, 169554. [Google Scholar] [CrossRef]
- Efron, B. Microarrays, Bayes empírico y el modelo de dos grupos . Statistical Science 2008, 23(1), 1–22. [Google Scholar] [CrossRef]
- Hubert, M.; Rousseeuw, P. J.; Van Aelst, S. High-breakdown robust multivariate methods. Statistical Science 2008, 23(1), 92–119. [Google Scholar] [CrossRef]
- Hubert, M.; Rousseeuw, P.J.; Vanden Branden, K. ROBPCA: Un nuevo enfoque para el análisis robusto de componentes principales. Technometrics 2005, 47(1), 64–79. [Google Scholar] [CrossRef]
- Albehery, Nagwa M.; Auda, Hend A.; Othman, Esraa A. H. Robust L1-norm Estimation for Exploratory Factor Analysis Model. Mathematics and Statistics 2025, 13(1), 17–27. [Google Scholar] [CrossRef]
- Al-Athari, Faris Muslim. A New Robust Interval Estimation for the Median of An Exponential Population When Some of the Observations Are Extreme Values. Mathematics and Statistics 2024, 12(1), 31–40. [Google Scholar] [CrossRef]
- Dolédec, S.; Chessel, D. Co-inertia analysis: an alternative method for studying species–environment relationships. Ecology 1994, 75(2), 519–529. [Google Scholar] [CrossRef]
- Riad, Fathy H. Statistical Inference of Modified Kies Exponential Distribution Using Censored Data. Mathematics and Statistics 2022, Vol. 10(No. 3), 659–669. [Google Scholar] [CrossRef]
- Lai, B.; Bernstein, D. S. Generalised Forgetting Recursive Least Squares: Stability and Robustness Guarantees. IEEE Trans Automat Contr 2024, vol. 69(no. 11), 7646–7661. [Google Scholar] [CrossRef]
- Wan, J.; Li, X. Analysis of a superconvergent recursive moving least squares approximation. Appl Math Lett 2022, vol. 133, 108223. [Google Scholar] [CrossRef]
- Liu, K.; Guo, X. Fuzzy Least Squares Approximation Using Fuzzy Polynomial. Math Probl Eng 2021, vol. 2021(no. 1), 9979544. [Google Scholar] [CrossRef]
- Escoufier, Y. Opérateur associé à un tableau de données. Annales de l’inséé 1976, (22/23), 165. [Google Scholar] [CrossRef]
- L’Hermier des Plantes, H. Structuration des tableaux à trois indices de la statistique. In Université de Montpellier II; 1976. [Google Scholar]
- Lavit, C. Analyse conjointe de tableaux quantitatifs (Masson); Masson: Paris, France, 1988; Available online: https://books.google.es/books/about/Analyse_conjointe_de_tableaux_quantitati.html?id=9.
- Simier, M.; Blanc, L.; Pellegrin, F.; Nandris, D. Approche simultanée de K couples de tableaux: application à l’étude des relations pathologie végétale-environnement. Revue Statistique Appliquée 1999, 47(1), 31–46. [Google Scholar]
- Thioulouse, J.; Simier, M.; Chessel, D. Simultaneous Analysis of a sequence of paired ecological tables. Ecology 2004, 85(1), 272–283. [Google Scholar] [CrossRef]
- Thioulouse, J. Simultaneous analysis of a sequence of paired ecological tables: A comparison of several methods. The Annals of Applied Statistics 2011, 5(4), 2300–2325. [Google Scholar] [CrossRef]
- Thioulouse, J.; Chessel, D. Multi-table analysis of ecological factors. I. From description of ecosystem status to that of ecosystem function using triadic analysis. ACTA OECOL OECOL GEN 1987, 8(4), 463–480. [Google Scholar]
- Rousseeuw, P. J.; Van Driessen, K. A fast algorithm for the minimum covariance determinant estimator . Technometrics 1999, 41(3), 212–223. [Google Scholar] [CrossRef]
- Hubert, M.; Debruyne, M.; Rousseeuw, P. J. Minimum covariance determinant and extensions . arXiv 2017, arXiv:1709.07045v1. [Google Scholar] [CrossRef]
- Abdi, H.; Williams, L. J.; Valentin, D. Multiple factor analysis: principal component analysis for multitable and multiblock data sets. Wiley Interdisciplinary Reviews: Computational Statistics 2013, 5(2), 149–179. [Google Scholar] [CrossRef]
- Todorov, V. The R Package Ecosystem for Robust Statistics . Wiley Interdisciplinary Reviews: Computational Statistics 2024, (2), 16. [Google Scholar] [CrossRef]
- Debruyne, M.; Verdonck, T. Análisis y clasificación robustos de componentes principales con kernel . Advances in Data Analysis and Classification 4 2010, 151–167. [Google Scholar] [CrossRef]
- Altwegg, R.; Salau, S.; Abadi, F. Temas emergentes y nuevas direcciones en ecología estadística . Journal of Statistical Theory and Practice 19 2025, 44. [Google Scholar] [CrossRef]
- Fegatelli, D. A.; Tardella, L. Inferencia mejorada en modelos de captura-recaptura con efectos conductuales . Statistical Methods & Applications 22 2013, 45–66. [Google Scholar] [CrossRef]
- Hevner, A. R.; March, S. T.; Park, J.; Ram, S. Design science in information systems research. MIS Quarterly 2004, 28(1), 75–105. [Google Scholar] [CrossRef]
- Lang, D. J.; Wiek, A. Structuring and advancing solution-oriented research for sustainability. Ambio 2022, 51, 474–484. [Google Scholar] [CrossRef]
- Liebscher, E.; Taubert, F.; Waltschew, D.; et al. Modelado de datos multivariados mediante cópulas de producto y estimadores de distancia mínima: una aplicación ejemplar a rasgos ecológicos . Environmental and Ecological Statistics 29 2022, 315–338. [Google Scholar] [CrossRef]
- Tenenhaus, A.; Tenenhaus, M. Análisis de correlación canónica generalizada regularizada . Psychometrika 76 2011, 257–284. [Google Scholar] [CrossRef]
- Dray, S.; Chessel, D.; Thioulouse, J. Análisis de coinercia y vinculación de tablas de datos ecológicos. Ecology 2003, 84, 3078–3089. [Google Scholar] [CrossRef]
- Filzmoser, P.; Maronna, R.; Werner, M. Outlier identification in high dimensions. Computational Statistics & Data Analysis 2008, 52(3), 1694–1711. [Google Scholar] [CrossRef]
- Gregor, S.; Hevner, A. R. Positioning and presenting design science research for maximum impact. MIS Quarterly 2013, 37(2), 337–355. [Google Scholar] [CrossRef]
- Misztal, M. Application of the Partial Triadic Analysis Method to analyze the crime rate in Poland in the years 2000–2017 . Folia Oeconomica Stetinensia 2020, 20(2), 249–278. [Google Scholar] [CrossRef]
- White, P. A.; Christensen, M. F.; Frye, H.; et al. Modelado multivariante y funcional conjunto para rasgos y reflectancias de plantas . Environmental and Ecological Statistics 30 2023, 501–528. [Google Scholar] [CrossRef]
- Jolliffe, I. T.; Cadima, J. Principal component analysis: A review and recent developments. Philosophical Transactions of the Royal Society A 2016, 374(2065), 20150202. [Google Scholar] [CrossRef] [PubMed]
- Smilde, A. K.; Bro, R.; Geladi, P. Multi-way analysis: Applications in the chemical sciences; Wiley, 2004. [Google Scholar] [CrossRef]
- Abdi, H.; Williams, L. J.; Valentin, D. Multiple factor analysis: Principal component analysis for multitable and multiblock data sets. Wiley Interdisciplinary Reviews: Computational Statistics 2013, 5(2), 149–179. [Google Scholar] [CrossRef]
- Filzmoser, P.; Maronna, R.; Werner, M. Outlier identification in high dimensions. Computational Statistics & Data Analysis 2008, 52(3), 1694–1711. [Google Scholar] [CrossRef]
- Lang, D. J.; Wiek, A.; Bergmann, M.; Stauffacher, M.; Martens, P.; Moll, P.; Thomas, C. J. Transdisciplinary research in sustainability science: Practice, principles, and challenges. Sustainability Science 2012, 7(S1), 25–43. [Google Scholar] [CrossRef]
- Borcard, D.; Gillet, F.; Legendre, P. Numerical ecology with R, 2nd ed.; Springer, 2018. [Google Scholar] [CrossRef]
- Wu, J. Landscape sustainability science: Ecosystem services and human well-being in changing landscapes. Landscape Ecology 2013, 28, 999–1023. [Google Scholar] [CrossRef]
- Niemeijer, D.; de Groot, R. S. A conceptual framework for selecting environmental indicator sets. Ecological Indicators 2008, 8(1), 14–25. [Google Scholar] [CrossRef]
- Filzmoser, P.; Todorov, V. Robust tools for the imperfect world. Information Sciences 2016, 354, 199–213. [Google Scholar] [CrossRef]
- Zadeh, L. A. Fuzzy sets. Information and Control 1965, 8(3), 338–353. [Google Scholar] [CrossRef]
- Vörösmarty, C. J.; McIntyre, P. B.; Gessner, M. O.; Dudgeon, D.; Prusevich, A.; Green, P.; Davies, P. M. Global threats to human water security and river biodiversity. Nature 2010, 467, 555–561. [Google Scholar] [CrossRef]
- Hering, D.; Borja, A.; Carstensen, J.; Carvalho, L.; Elliott, M.; Feld, C. K.; Solheim, A. L. The European Water Framework Directive at the age of 10: A critical review of the achievements with recommendations for the future. Science of the Total Environment 2010, 408(19), 4007–4019. [Google Scholar] [CrossRef] [PubMed]
- Leigh, C.; Alsibai, O.; Hyndman, R. J.; Kandanaarachchi, S.; King, O. C.; McGree, J. M.; Peterson, E. E. A framework for automated anomaly detection in high frequency water-quality data from in situ sensors. Science of the Total Environment 2019, 664, 885–898. [Google Scholar] [CrossRef]
- Chen, K.; Chen, H.; Zhou, C.; Huang, Y.; Qi, X.; Shen, R.; Ren, H. Comparative analysis of surface water quality prediction performance and identification of key water parameters using different machine learning models based on big data. Water Research 2020, 171, 115454. [Google Scholar] [CrossRef] [PubMed]
- Yang, Q.; Scholz, M.; Shao, J.; Wang, G.; Liu, X. A generic framework to analyse the spatiotemporal variations of water quality data on a catchment scale. Environmental Modelling & Software 2019, 122, 104071. [Google Scholar] [CrossRef]
- Hubert, M.; Rousseeuw, P. J.; Van Aelst, S. High-breakdown robust multivariate methods. Statistical Science 2008, 23(1), 92–119. [Google Scholar] [CrossRef]
- Rousseeuw, P. J.; Van Driessen, K. A fast algorithm for the minimum covariance determinant estimator. Technometrics 1999, 41(3), 212–223. [Google Scholar] [CrossRef]
- Maronna, R. A.; Martin, D. R.; Yohai, V. J.; Salibián-Barrera, M. Robust Statistics: Theory and Methods, 2nd ed.; Wiley, 2019; Available online: https://onlinelibrary.wiley.com/doi/book/10.1002/9781119214656.
- Filzmoser, P.; Maronna, R.; Werner, M. Outlier identification in high dimensions. Computational Statistics & Data Analysis 2008, 52(3), 1694–1711. [Google Scholar] [CrossRef]
- Hubert, M.; Debruyne, M.; Rousseeuw, P. J. Minimum covariance determinant and extensions. WIREs Computational Statistics 2017, 9(4), e1356. [Google Scholar] [CrossRef]
- Debruyne, M.; Hubert, M. The influence function of robust covariance estimators. Journal of Multivariate Analysis 2009, 100(6), 1291–1304. [Google Scholar] [CrossRef]
- Salibián-Barrera, M.; Willems, G.; Zamar, R. Robust covariance estimation via fast S-estimators. Journal of Computational and Graphical Statistics 2008, 17(3), 700–718. [Google Scholar] [CrossRef]
- Filzmoser, P.; Todorov, V. Robust tools for the imperfect world. Information Sciences 354 2016, 199–213. [Google Scholar] [CrossRef]
- Riani, M.; Atkinson, A. C.; Cerioli, A. Finding an unknown number of multivariate outliers. JRSS B 2009, 71(2), 447–466. [Google Scholar] [CrossRef]
- Van Aelst, S.; Willems, G. Robust and efficient estimation of covariance matrices. Journal of Multivariate Analysis 116 2013, 1–14. [Google Scholar] [CrossRef]
- Rousseeuw, P. J.; Hubert, M. Robust statistics for outlier detection. WIREs Data Mining and Knowledge Discovery 2011, 1(1), 73–79. [Google Scholar] [CrossRef]
- Abdi, H.; Williams, L. J.; Valentin, D. Multiple factor analysis. WIREs Computational Statistics 2013, 5(2), 149–179. [Google Scholar] [CrossRef]
- Smilde, A. K.; Bro, R.; Geladi, P. Multi-way analysis; Wiley, 2004. [Google Scholar] [CrossRef]
- Bougeard, S.; Dray, S. Supervised multiblock analysis. Journal of Multivariate Analysis 165 2018, 38–52. [Google Scholar] [CrossRef]
- Smilde, A. K.; Westerhuis, J. A.; de Jong, S. Framework for multiblock PCA. Journal of Chemometrics 2003, 17(6), 323–337. [Google Scholar] [CrossRef]
- Chen, K.; et al. Water quality prediction. Water Research 171 2020, 115454. [Google Scholar] [CrossRef]
- Niemeijer, D.; de Groot, R. Environmental indicator selection. Ecological Indicators 2008, 8(1), 14–25. [Google Scholar] [CrossRef]
- Wu, J. Landscape sustainability science. Landscape Ecology 28 2013, 999–1023. [Google Scholar] [CrossRef]
- Liebscher, E.; Taubert, F.; Waltschew, D.; Wirth, C. Multivariate data modeling using product copulas and minimum distance estimators: An ecological application. Environmental and Ecological Statistics 2022, 29(2), 315–338. [Google Scholar] [CrossRef]
- White, P. A.; Christensen, M. F.; Frye, H.; et al. Joint multivariate and functional modeling for plant traits and reflectance. Environmental and Ecological Statistics 2023, 30(3), 501–528. [Google Scholar] [CrossRef]
- Warton, D. I.; Blanchet, F. G.; O’Hara, R. B.; Ovaskainen, O.; Taskinen, S.; Walker, S. C.; Hui, F. K. C. So many variables: Joint modeling in community ecology. Trends in Ecology & Evolution 2015, 30(12), 766–779. [Google Scholar] [CrossRef]
- Legendre, P.; Galzin, R.; Harmelin-Vivien, M. L. Relating behavior to habitat: Solutions to the fourth-corner problem. Ecology 1997, 78(2), 547–562. [Google Scholar] [CrossRef]
- Dray, S.; Legendre, P. Testing the species–traits–environment relationships: The fourth-corner problem revisited. Ecology 2008, 89(12), 3400–3412. [Google Scholar] [CrossRef] [PubMed]
- Salinas-Rodríguez, A.; Manrique-Espinoza, B.; Moreno-Tamayo, K. Robust multivariate methods in population health research. Statistics in Medicine 2020, 39(26), 3819–3835. [Google Scholar] [CrossRef]
Figure 1.
Classical STATICO (kplot).
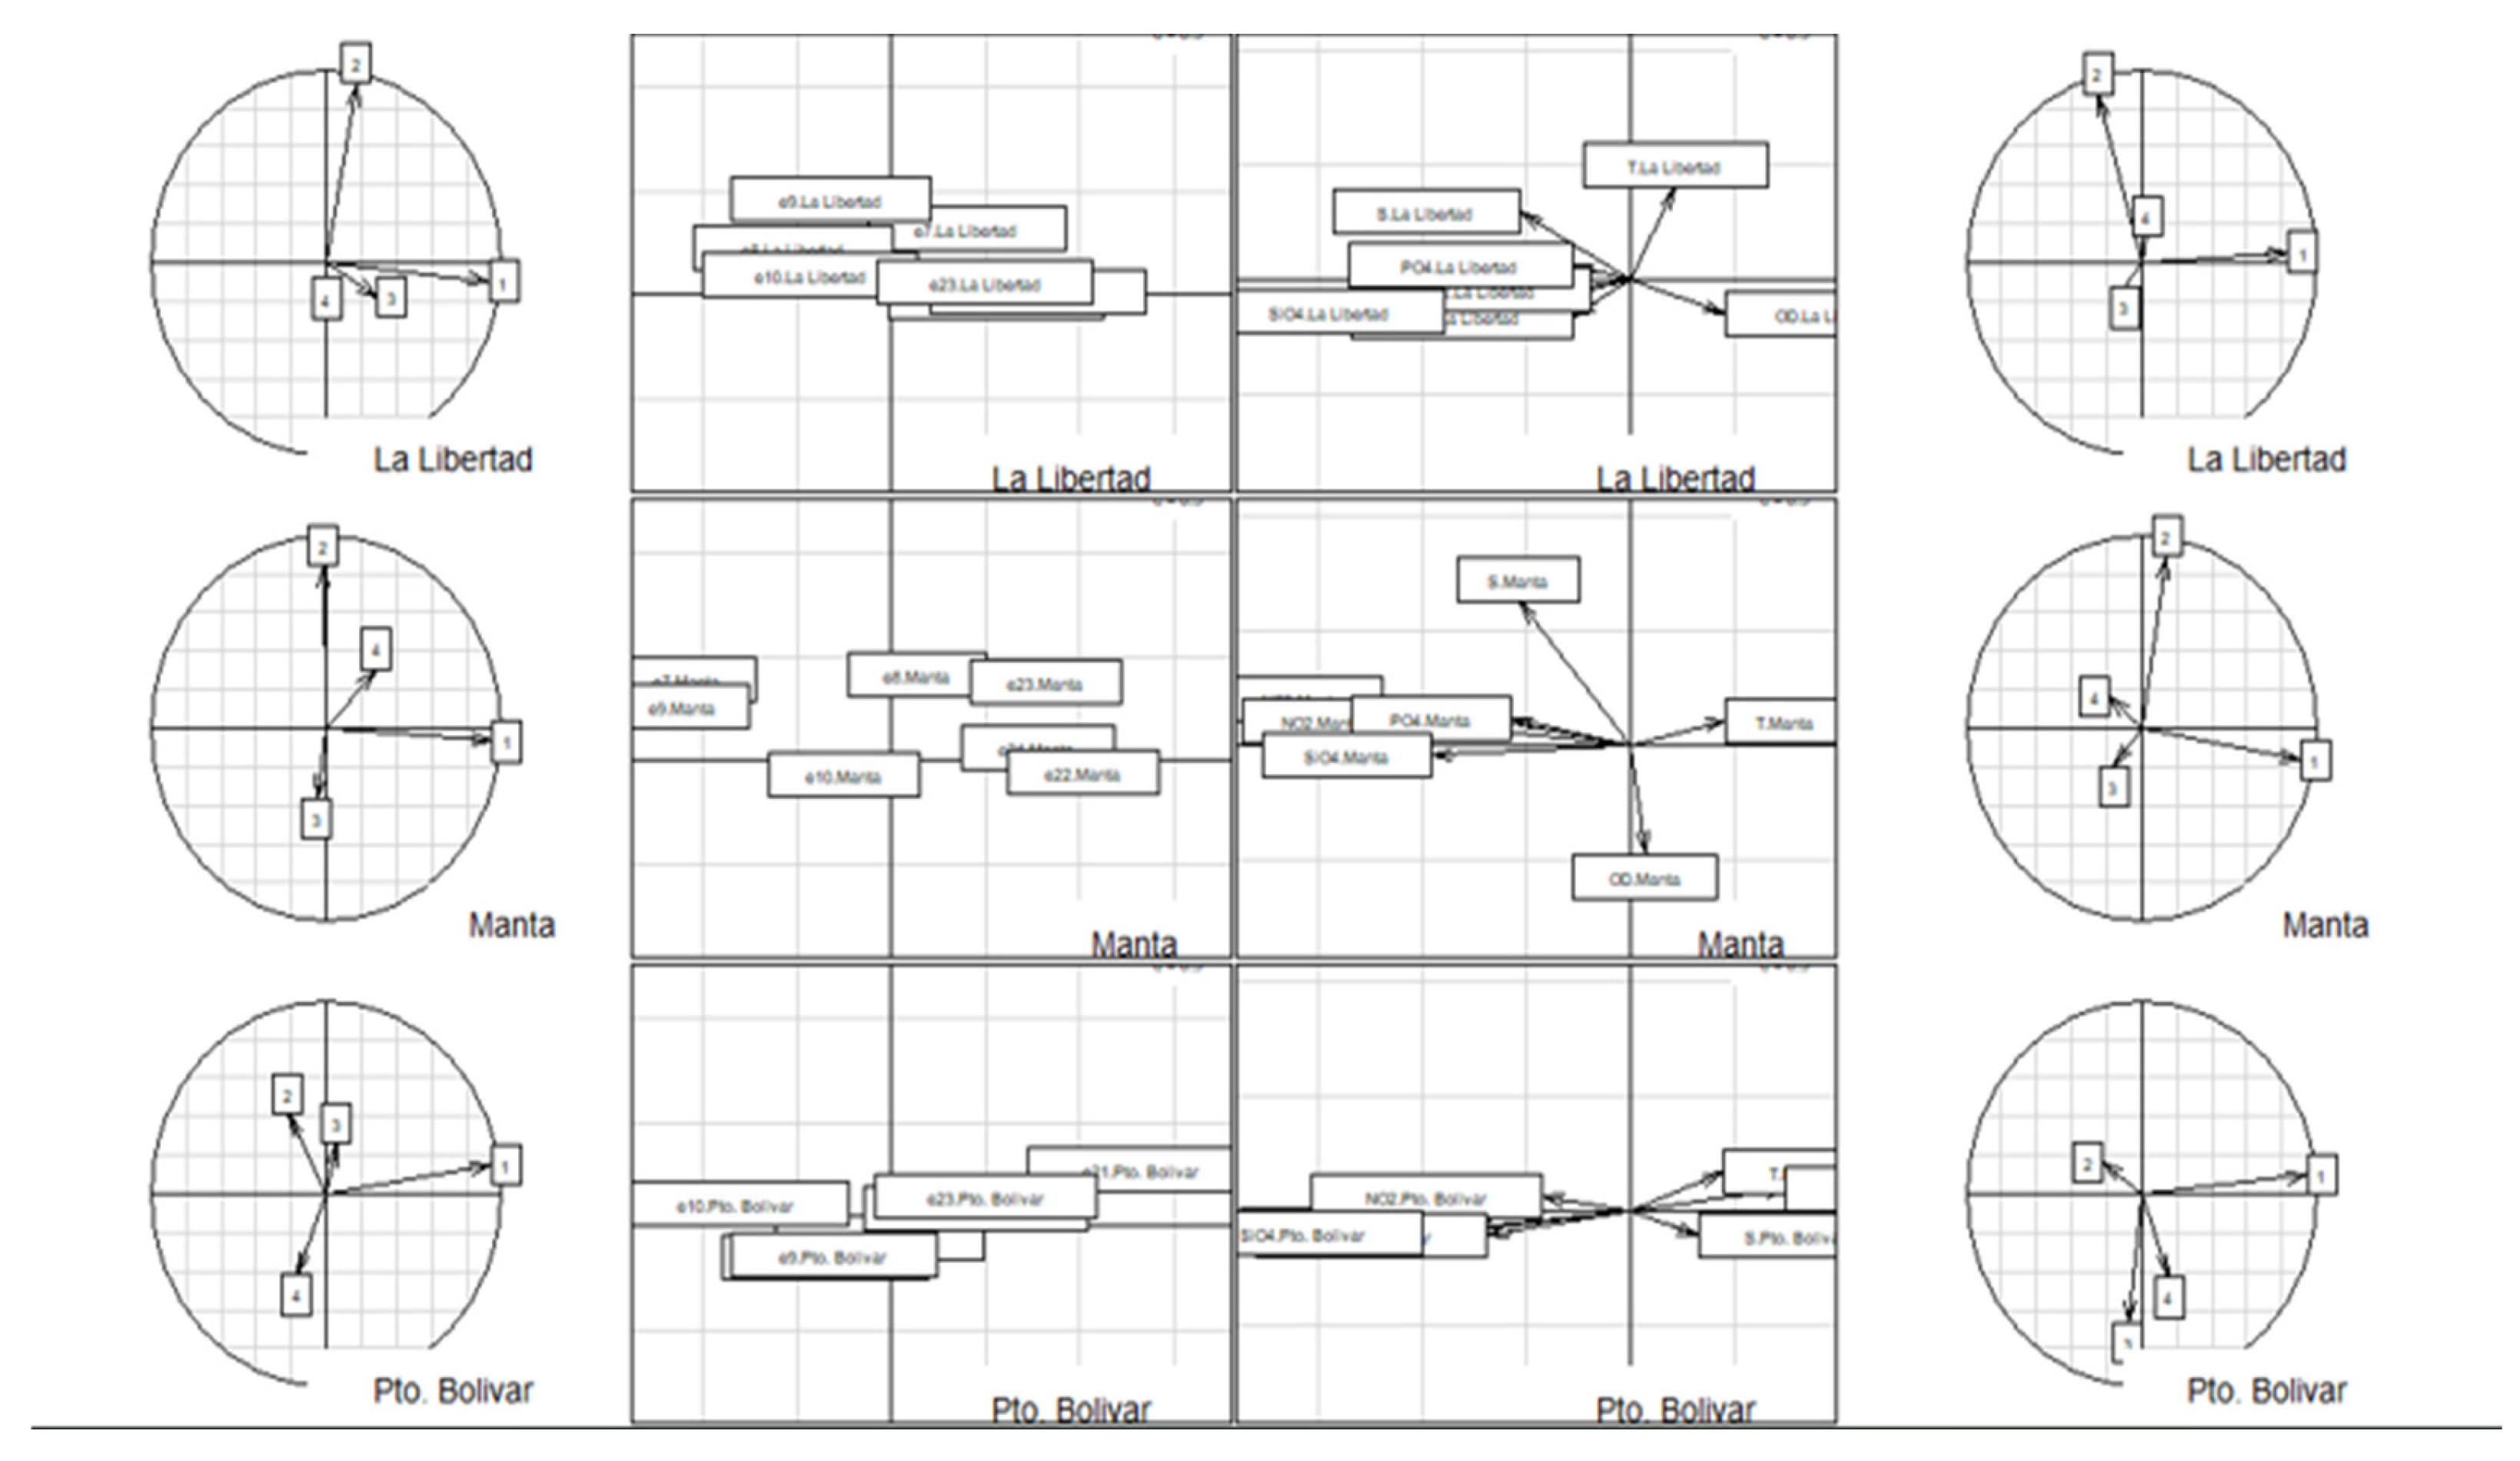
Figure 2.
Robust STATICO (kplot).
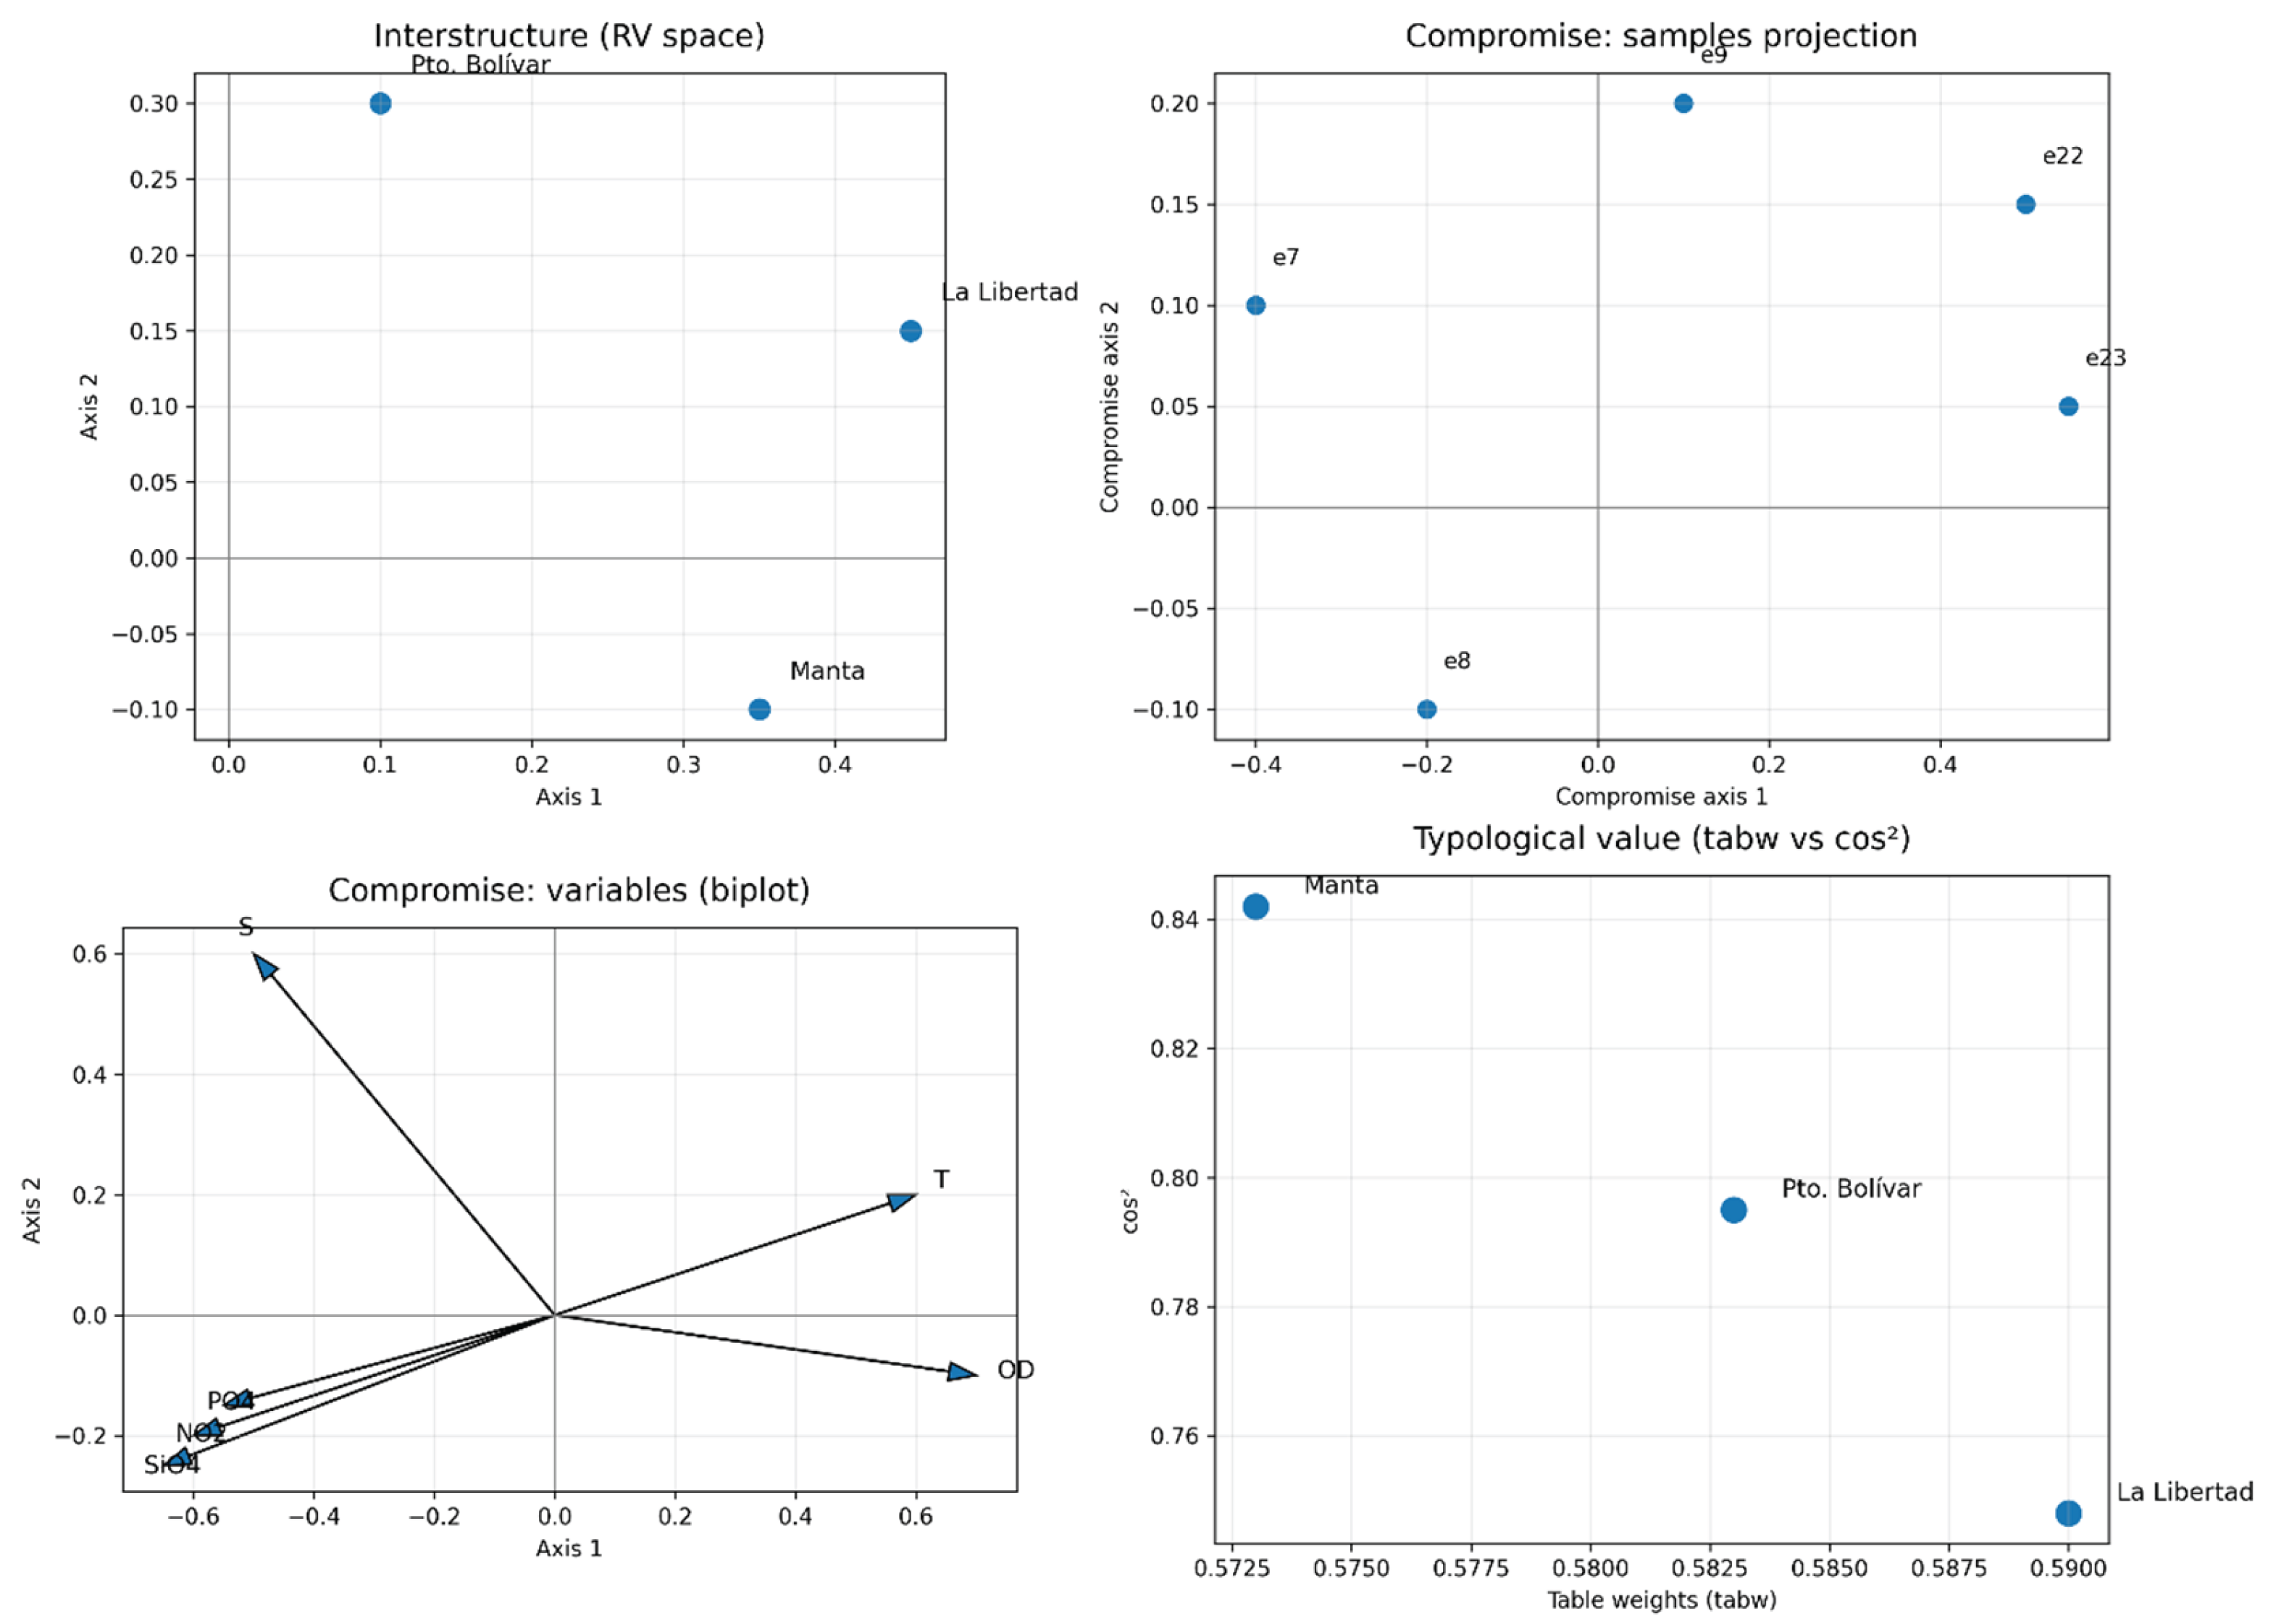

Table 1.
Comparative dimensions of STATICO vs. Robust STATICO.
| Dimension | Classical STATICO | Robust STATICO |
| Compromise | Sensitive to outliers | Stable |
| Explained variance | Dispersed | Concentrated |
| Eigenvalues | Lower parsimony | Higher parsimony |
| RV coefficients | Noise-influenced | Reliable diagnostics |
| cos² values | Potentially misleading | Honest representation |
| Anomaly detection | Weak | Strong |
| Reproducibility | Limited | High |
Source: Authors.
Table 2.
Differences in RV coefficients between Classical and Robust STATICO.
| Block pair | Classical RV | Robust RV | ΔRV (rob–clas) |
| La Libertad-Manta | 0.4707 | 0.4413 | -0.0294 |
| La Libertad-Pto. Bolívar | 0.4525 | 0.4665 | +0.0140 |
| Manta-Pto. Bolívar | 0.3900 | 0.4601 | +0.0701 |
Source: Authors.
Table 3.
Eigenvalues of the RV matrix (RV.eig).
| Method | RV.eig 1 | RV.eig 2 | RV.eig 3 |
| Classical STATICO | 1.8763 | 0.6110 | 0.5126 |
| Robust STATICO | 1.9120 | 0.5592 | 0.5288 |
Source: Authors.
Table 4.
tabw block weights.
| Block | Classical tabw | Robust tabw | Δ (rob–clas) |
| La Libertad | 0.5974 | 0.5756 | -0.0218 |
| Manta | 0.5713 | 0.5729 | +0.0016 |
| Pto. Bolívar | 0.5627 | 0.5835 | +0.0207 |
Source: Authors.
Table 5.
cos² representation quality metric.
| Block | Classical cos² | Robust cos² | Δ (rob–clas) |
| La Libertad | 0.7843 | 0.7477 | -0.0366 |
| Manta | 0.7918 | 0.8420 | +0.0502 |
| Pto. Bolívar | 0.7936 | 0.7950 | +0.0015 |
Source: Authors.
Table 6.
Eigenvalue spectrum of the compromise (eig).
| Eje | Classical eig | Robust eig |
| 1 | 27.9367 | 7.3352 |
| 2 | 3.8762 | 0.5034 |
| 3 | 0.8323 | 0.2063 |
| 4 | 0.3841 | 0.0978 |
Source: Authors.
Disclaimer/Publisher’s Note: The statements, opinions and data contained in all publications are solely those of the individual author(s) and contributor(s) and not of MDPI and/or the editor(s). MDPI and/or the editor(s) disclaim responsibility for any injury to people or property resulting from any ideas, methods, instructions or products referred to in the content. |
© 2026 by the authors. Licensee MDPI, Basel, Switzerland. This article is an open access article distributed under the terms and conditions of the Creative Commons Attribution (CC BY) license (http://creativecommons.org/licenses/by/4.0/).
Copyright: This open access article is published under a Creative Commons CC BY 4.0 license, which permit the free download, distribution, and reuse, provided that the author and preprint are cited in any reuse.


