Submitted:
23 January 2026
Posted:
26 January 2026
You are already at the latest version
Abstract
Climate change poses significant challenges to agricultural practices worldwide, affecting crop yields, food insecurity, and rural livelihoods. Maize crop farming is particularly vulnerable due to extreme weather conditions such as high rainfall, high temperature, soil acidity, humidity and unproper irrigation affecting crop yield and consider to be a source of hunger and food security concern. The aim of the study was to propose a reliable and accurate machine learning techniques to be used in the prediction of maize crop yield using historical climate and soil data for informed planning. This enables farmers, agronomists and decision makers to forecast maize crop yield based on historical data for adaptation. To come up with a comprehensive prediction model, historical dataset from Meteo Rwanda and Maize crop yield from Kayonza district-Rwanda were used in the training and testing. Weather data considered in this study were annual mean temperature, annual maximum temperature, annual minimum temperature, annual rainfall, soil temperature for the past thirteen years. The data collected were analyzed using Random Forest regressor, Extreme Boost regressor Gradient, support vector machine and least absolute shrinkage and least absolute shrinkage and selection ( LASSO) machine learning techniques. The results shows that random forest perform better compared to other models with an accuracy of R² 0.957, support vector machine 0.957, XGBoost regressor 0.953, LASSO 0.256 and can be recommended for prediction of maize crop yield. The random forest regressor will be adapted in design and development of prototype to improve farming decision making.
Keywords:
smart weather monitoring
; climate change
; machine learning techniques
; maize crop farming
; Internet of Things
1. Introduction
The world population is expected to reach 9.8 billion in 2050; the necessity to keep the ecosystem equilibrium is paramount for the wellbeing of communities, one fact that could affect that equilibrium state is climate degradation which directly affect human nature and be the cause of hunger, malnutrition, deforestation, water scarcity, soil deterioration. Studies revealed that the improper distribution of rainfall, variability of temperature, humidity, soil acidity, inaccurate information on weather forecast, unavailability of information on mitigation and adaptation strategies related to the climate change will decrease globally the productivity of maize crop at a rate of 3.8 % in 2090. The African continent will be also affected and a decrease of maize productivity is expected to be 5% and wheat by 17% [1]. In the context of Rwanda, agriculture sector has been affected by the adverse of climate change and affect people lives; through meteorological data observed, the variability of rainfall in Rwanda is predicted to increase from 5% to 10%, this variation will directly affect people lives and associated disasters can be observed such as floods, landslides which at the end affect Rwandan economy. Rwanda has pledged to combat the negative impacts of climate change through various initiatives such as the Paris Agreement [2], the Green Growth and Climate Resilience Strategy (GGCRS) [3], and the United Nations Framework Convention on Climate Change (UNFCCC). These commitments have been integrated into the Rwanda National Strategies for Transformation (NST2) for the five years government planning. According to the census conducted by the National Institute of Statistics of Rwanda in 2022, 63% of household do crop farming and Maize crop represent 56% of crop production after beans [2]. As per the crop intensification program [3] initiated by the Government of Rwanda in 2018, Maize crop is selected as suitable crop to cultivate in Kayonza district; however, in 2008 maize yield losses at a rate of 37% in Eastern province and 26% in southern province. In 2017, more than 3000 families in the Eastern province including Kayonza district faced hunger due to prolonged drought [4]. The study contributed in the resilience of climate variability in maize farming. This implied the monitoring of weather parameters mainly temperature variability and precipitation fluctuation considered as the major dominant factors influencing maize yields, other variables like solar radiation, humidity and soil temperature management also play a significant role. To analyze the trends in maize productivity vis- a vis to the climatic parameters’ variation; Meteo-Rwanda stations namely RWINKWAVU and KAWANGIRE based at Kayonza district were used. Data related to temperature, precipitation, humidity, soil temperature and solar radiation were collected and utilized in the proposed prediction models. Figure 5 and 6 provides trends of temperature and rainfall variability for the past forty years and Figure 9 provides maize crop productivity for the period of 2011 to 2024 from Kayonza district.
The aim of this study is to exploit machine learning techniques for the prediction of maize crop yield based on historical meteorological data. The proposed models will enable farmers, decision makers to take decision based on reliable and accurate. The area considered in this study is Kayonza district, Rwanda. Meteorological dataset for past thirteen years. Variables taken into account in this research are rainfall, temperature and soil temperature. Maize crop production, seasonal annual reports from National Institute of Statistics of Rwanda were also considered in this study. This paper is organized as follows: Section 2 provide information related to the methodology; It comprises data collection, data processing. Section 3 is the discussion and Section 4 the conclusion.
2. Related Study
In Rwanda, rainfall variability has been identified as a key determinant of crop yield changes, with some crops exhibiting a positive relationship with rainfall, while others show an inverse relationship [2]. The report [1] highlights the vulnerability of the Rwandan agricultural sector, including maize production, to weather-related risks such as prolonged droughts, erratic rains, floods, hailstorms, and mudslides. It also mentions that farmers, especially in drought-prone areas, lack the knowledge, skills, and adequate infrastructure to cope with such harsh conditions, leading to severe losses in agricultural production and household income.
The study [5] uses a descriptive statistic to analyze the temperature and rainfall data from 1901 to 2005 to evidence the climate change impacts on agriculture and food security in Nigeria. The findings revealed temperature increases by (1.1°C) and rainfall decrease by (81mm) within 105 years, imposing a pronounced decrease in agricultural productivity. The system leverages the Internet of Things (IoT), wireless sensor networks, remote sensing, and advanced data analytics to continuously monitor weather and environmental parameters, providing real-time information and alerts to stakeholders, including farmers. [8] proposes IoT Based Farmers' Smart Technology for Weather Monitoring and Notification in Agriculture, which was named "KUBERO Communication Model". Data collection applied qualitative and observation methods by conducting interviews with meteorologists, agronomists, and farmers and gathering first-hand information on the communication flow between meteorology agency, agronomists, volunteers, farmer facilitators, and farmers. The findings revealed a faster communication with stakeholders through an Android app for agronomists, a USSD app for farmers, and a web app for the meteorology agency. [6] reviews the use and impact of Artificial Intelligence on Climate Change Adaptation in Africa, and provided an overview of various AI projects, research, and applications related to climate change adaptation in Africa. This discusses the case studies, challenges, and potential future applications of AI in this domain, and concluded that AI can be a critical tool for climate change adaptation efforts, particularly in areas like weather prediction, agriculture, flood and drought monitoring, and human migration patterns. [9] uses Internet of Things (IoT) and Artificial Neural Networks for Real-time Environmental Monitoring system with Artificial Neural Network (ANN) for status prediction of perishable fruits and vegetables (FVs). This real-time intelligent monitoring and notification system achieved 99% accuracy in predicting commodity status. It outperformed the existing methods like Compress Sending, Adaptive Naive Bayes, XGBoost, and Data Mining in forecasting accuracy and facilitated the timely necessary action by personnel through remote monitoring and automatic notifications. The study [10] reviews remote sensing technologies in precision agriculture, examining satellite systems like Quickbird and UAVs, including fixed-wing and rotorcraft drones. They discussed sensor technologies such as multispectral and hyperspectral cameras, alongside advanced image analysis techniques like convolutional neural networks. However, the study highlighted a lack of extensive weather datasets necessary for developing machine learning models. [11] uses a survey to IoT technologies for precision agriculture, focusing on tools such as GPS, GIS, and variable rate technology. Their findings emphasized the potential of IoT in optimizing farming practices but identified a need for better integration of IoT with remote sensing and data analytics, particularly for smart weather monitoring and climate adaptation in maize farming. [12] presents an IoT-based system for real-time weather monitoring, utilizing sensors like DHT11 for temperature and humidity, anemometers for wind speed, and hygrometers for soil moisture. The system transmitted graphical data via web interfaces and provided alerts through a mobile app. While functional, it lacked machine learning models for improved forecasting accuracy. [13] developed a two-tier IoT-based weather monitoring system featuring sensors like DHT11 and BMP180 connected to a NodeMCU microcontroller. Data was transmitted to a web server for analysis, offering farmers actionable insights. However, the system did not include real-time notifications or advanced analytics, limiting its predictive capability. [14] proposed an IoT system for monitoring greenhouse environments using the TI CC2650 SensorTag device. Sensor data was logged on the IBM Watson Cloud platform, and notifications were automated through a Node-RED flow, alerting users to parameter deviations. While the system effectively safeguarded greenhouse conditions, it did not integrate data analytics or machine learning for crop health assessment. [15] developed an IoT-enabled hydroponic system designed to monitor and accelerate plant growth through automated environmental parameter control. Using a PID controller, the system adjusts factors like temperature, humidity, and pH based on plant-specific profiles. The collected data is stored in the cloud for analysis and is accessible via a mobile app. Their findings demonstrate that the IoT hydroponic system significantly increases yields compared to traditional agriculture. However, the study does not thoroughly evaluate the system's performance in terms of plant growth, yield, or resource efficiency. [16] introduced an IoT-based smart agriculture rover designed for small-scale rural farms. Powered by an ATmega2560 microcontroller, the rover monitors environmental parameters such as soil conditions and weather, while managing sprinklers to distribute water or pesticides. It utilizes GPS for navigation and transmits real-time data to farmers via SMS. Although effective, the system relies on pre-programmed crop locations, which may limit its adaptability to dynamic crop patterns. [17] proposed a smart irrigation system for precision agriculture using machine learning; the system combines Support Vector Regression (SVR) for soil moisture prediction, Kernel Canonical Correlation Analysis (KCCA) for feature extraction, and the Penman-Monteith equation for evapotranspiration calculation. The results shows accurate soil moisture predictions and optimized irrigation schedules with reduced model complexity. However, the study lacks integration of real-time weather data and does not address variable climate conditions. [18] developed a smart irrigation system employing Arduino-based sensors and logistic regression to predict optimal water requirements for crops. The system gathers data on soil moisture, weather, and crop types, automating irrigation based on analysis. While innovative, the paper does not detail the dataset used to train and validate the logistic regression model, limiting its generalizability. [19] designed a cost-effective weather forecasting system using IoT and machine learning. Utilizing Arduino UNO with sensors such as LM35 and DHT22, the system gathers temperature and humidity data, which is transmitted to the cloud via ThingSpeak. Artificial Neural Networks (ANN) and regression algorithms are employed for predictions. Although the system is compact and accessible for remote areas, its focus on temperature and humidity alone limits its scope for comprehensive weather forecasting. The study [20] focus on Weather monitoring and forecasting system using IoT". introduces an IoT-based system for weather monitoring and forecasting using sensors and the Dark Sky.net API with Raspberry Pi. Real-time data is accessible via a web interface, but the study lacks machine learning integration for weather forecasting efficiency. The study on "AgriPrediction: A proactive internet of things model to anticipate problems and improve production in agricultural crops"[21]. AgriPrediction combines a LoRa WSN system with an ARIMA prediction model for proactive monitoring in agriculture. It was tested on arugula, showing gains in leaf development and weight, though the study was limited to a small-scale experiment.
[22] applies an IOT BASED SMART WEATHER MONITORING SYSTEM. It describes an IoT-based weather monitoring system using the Particle Photon board and DHT-11 sensors. The system tracks local weather conditions in real time but is limited to temperature and humidity monitoring, lacking other environmental parameters. [23] deploys an energy efficient selection of cluster head and disease prediction in IoT based smart agriculture using a hybrid artificial neural network model". The methodology involves K-means clustering, AMR for cluster head selection, and a Hybrid ANN model for disease prediction. Data collected via IoT sensors are stored in the cloud, but the study does not address real-world deployment or integration with existing systems. [24] developed a Smart Weather Reporting System Based on Blynk Application for Agriculture and discussed a Blynk-based system for collecting weather data, including temperature, humidity, and rainfall. It was successfully implemented for agricultural monitoring, offering a user-friendly and flexible system, although it lacks a comprehensive understanding of all global weather factors. [25] examined the Artificial Intelligence Best Practices in Smart Agriculture. This reviews AI applications across smart agriculture, covering soil management, irrigation, weather forecasting, and livestock management. It discusses the deployment of artificial neural networks, convolutional neural networks, and support vector machines for weather forecasting, emphasizing the need for advanced AI techniques that require less data and computational resources. [26] uses an AI Based on the Real-Time Weather Condition Prediction with Optimized Agricultural Resources”. The study utilizes a Fuzzy Inference System (FIS) for real-time weather prediction, integrating atmospheric parameters and soil conditions to schedule irrigation and fertigation. Weather and farm field data are presented to farmers via a mobile app, though details on sensor types affecting data accuracy are lacking. [27] explores the potential applications of Artificial Intelligence in Agriculture Sector”. review article examines AI applications in agriculture, highlighting monitoring, data analytics, and efficient farming. It does not provide specific case studies or empirical evidence of successful AI implementations. [28] presents a Sustainable Agriculture in the Digital Age: Crop Management and Yield Forecasting with IoT, Cloud, and AI”. The paper discusses the integration of IoT, cloud computing, and AI for sustainable agricultural practices. It enables real-time monitoring and predictive analytics for crop management and yield forecasting but lacks details on the interoperability among IoT devices and platforms. [29] uses "LoRa based intelligent soil and weather condition monitoring with internet of things for precision agriculture in smart cities". The study proposes a LoRa-based system for monitoring soil and weather conditions, utilizing sensors to collect temperature, humidity, and wind speed data. These data are visualized on Thingspeak and processed using machine learning algorithms to improve irrigation efficiency. However, the study lacks implementation or evaluation of specific machine learning algorithms for predictive purposes. [30] uses IoT for Promoting Agriculture 4.0: a Review from the Perspective of Weather Monitoring, Yield Prediction, Security of WSN Protocols, and Hardware Cost Analysis". The paper reviews IoT-based agriculture systems, focusing on weather monitoring, yield prediction, and the application of machine learning algorithms like ANNs, SVMs, and clustering techniques. A challenge is the universal applicability of prediction algorithms across varied agricultural datasets. [31] deploys a Smart farming, IoT, data mining, crop production prediction and proposes an IoT-based system to predict crop production using linear regression and k-nearest neighbors (KNN) algorithms. The system integrates heterogeneous data for reliable prediction, focusing on corn grain in a specific region of Mexico, which limits the generalizability of the findings. [32] incorporates big data analytics from which the Hadoop framework and Logistic Regression for climate prediction is applied, accuracy evaluation mentioned to improve with more iterations and input parameters tuning; however, the specific details on the implementation or validation of the proposed system in a real-world scenario is not tackled. [33] deploys a weather monitoring system using IoT technology. The system collects environmental data from sensors connected to a Raspberry Pi 3. Python code was implemented to enable communication between the sensors and the ThingSpeak cloud platform. The sensor data was transmitted to the ThingSpeak cloud for analysis and monitoring of weather conditions suitable for crop growth., The sensor data collected over a period help farmers to analyze the optimal weather conditions for farming and remotely data accessibility. [34] review and analyze the confluence of Artificial Intelligence (AI) and climate change anticipation, examining the possibilities of AI approaches in forecasting and mitigating the effects of climate change. The research was delving into diverse AI implementations, including machine learning algorithms, neural networks, and data extraction, employed in climate simulation, weather projection, and ecological surveillance. Author revealed a positive result in integrating AI technologies in climate change research, with a significant leap toward proactive adaptation and sustainable decision-making, offering invaluable insights for policymakers and researchers striving to address the global climate crisis. [35] deploys Hybrid AI-NWP (Numerical Weather Prediction) models using Multilayer Perceptron (MLP) and Spatio-temporal Attention Network (STAN); for addressing climate change and achieving environmental justice. Bilal A et al. (2024) [36] Explores the application of AI technologies in climate finance with reviews of the various AI techniques such as neural networks and decision trees for real-time data analysis, enabling proactive decision-making and adaptation to environmental changes; focusing on the theoretical aspects, excluding the empirical data and case studies [37] discusses the potential use of AI and ML techniques for climate change estimation and modeling, particularly in data collection, dynamic optimization, and predictive regulation. The benefits of AI in climate mitigation and adaptation are highlighted, while the empirical evidence to substantiate its claims is not covered. [38] examines AI’s application in flood forecasting and disaster mitigation using machine learning models such as linear regression, decision trees, and neural networks. AI techniques improve flood prediction by leveraging data from various sources, but the study faces challenges due to the lack of accurate, up-to-date, and unbiased data. [39] presents an AI-based prediction model for climate change effects on crop production, utilizing optimized convolutional neural networks (CNNs). The model demonstrates high accuracy in predicting the impacts of climate change on crops such as wheat, maize, and rice. However, it relies solely on the CNN algorithm, which may limit its applicability across different conditions. [40] explores the use of AI methods for resolving climate change impacts, specifically focusing on weather conditions and vulnerability predictions, mentioning potential for the real-world implementation; the research gap does not tackle on the issues regarding time processing and computational efficiency. [41] explores the relationship between crop yield and weather using satellite agrometeorology. Models like DNN, MARS, RF, SVM, and ANN apply to analyze remote sensing data. The DNN model proven to perform better with lower prediction errors and inclusion of additional data sources like soil data would provide a more comprehensive analysis. [42] presents an interactive predictive system for weather forecasting using data mining and Numerical Weather Prediction models, Emphasize is on the importance of a historical weather dataset, but it does not provide the practical implementation details. [43] examines the integration of IoT, AI, and big data in smart agriculture for tracking crop growth based on soil moisture, temperature, and humidity and confirms the potential of these technologies, while it does not provide specific AI techniques or IoT infrastructure requirement details. [44] introduces a novel scheme for smart greenhouse control using ANN-based learning modules, focusing on a controlled environment; and the real-world outdoor farming conditions is not tackled. [45] examines the adoption of modern agricultural technologies in Rwanda, such as precision agriculture, irrigation, and ICTs. The benefits of technologies like drones and IoT for crop monitoring and management was highlighted, and revealed that the adoption is low to the smallholder farmers due to the limited accessibility and affordability matters. [46] employs the bibliometric analysis to explore stress factors affecting agricultural productivity, such as water and temperature stress. The major findings indicate water stress as the most considered factor, with detailed field data to validate the simulation models. [47] introduces a satellite IoT framework for smart agriculture applications, focusing on computer vision for aphid detection. The satellite edge computing workflow enables real-time analysis in rural areas but is limited in scope to specific agriculture applications including pest detection. [48] present a UAV-based smart agriculture IoT system for soil moisture sensing, meteorological monitoring, and insect detection. While the system performs well for specific data collection, it lacks detailed algorithms for broader data analysis or real-time notifications. [49] proposes a "Sensing-without-Sensors" system for soil moisture estimation using LoRa-modulated underground transmissions and machine learning. The Decision Tree and Neural Network models show good accuracy but focus solely on soil moisture, not addressing broader weather monitoring aspects. [50] discusses the role of remote sensing systems in precision agriculture, including irrigation, smart fertilizer application, and crop protection. The study emphasizes IoT and big data analytics for processing remote sensing data, but lacks specific methodologies for real-time climate monitoring in agriculture. [51] discusses various IoT-enabled sensor technologies for smart agriculture, covering communication protocols and artificial intelligence techniques. It categorizes different sensors used in smart agriculture, including soil, weather, irrigation, and crop sensors. However, the study lacks an exploration into advanced AI techniques for accurate forecasting and decision-making. [52] focuses on the remote sensing and decision support systems for precision agriculture. It covers a variety of techniques like NDVI, WSN, UAVs, and AI for crop monitoring, yield forecasting, and real-time monitoring of environmental conditions. But the climatic related challenges are not specifically addressed. [53] explores the applications of Industry 5.0 technologies in agriculture, including IoT, AI, machine learning, and remote sensing technologies like hyperspectral imaging and LiDAR. It discusses various agricultural applications such as crop monitoring, water management, and disease identification. However, challenges of network infrastructure or high bandwidth requirements are not deeply investigated. [54] examines the adoption of smart agriculture from a farmer's perspective, discussing the role of IoT, robotics, and AI. While it highlights various technologies' contributions, it does not focus specifically on weather monitoring and climate change for maize crop farming. [55] propose a smart agriculture management system for corn using remote sensing technology and a Support Vector Machine (SVM) algorithm for disease classification. While the model achieves high accuracy in disease detection, it lacks considerations for broader weather monitoring and climate change adaptation. [56] deploys a smart agriculture robotic system utilizing IoT, incorporating sensors for soil moisture, temperature, humidity, and air quality, as well as actuators for automated irrigation and crop/weed management. This integration enhances crop monitoring and management but lacks explicit coverage on advanced weather monitoring and real-time notification for climate change. [57] presents an IoT-based smart farming system, employing wireless sensor nodes and actuators for remote monitoring of farm conditions such as temperature, humidity, and CO2. However, it does not address weather monitoring or real-time notifications for climate change, and there is minimal discussion on data analysis algorithms or prediction models. [58] describes a wireless sensor network for sustainable agriculture and smart cities, using machine learning algorithms for disease detection and task allocation. While the system provides flexibility and mobility, it does not integrate smart weather monitoring or real-time climate change notifications. [59] applies machine learning techniques, including neural networks and CNNs, for various agricultural tasks such as soil detection, weather forecasting, and disease detection. However, the study does not specifically address the need for smart weather monitoring and real-time notifications related to climate change. [60] discusses the remote sensing technologies like multispectral and hyperspectral sensors for crop monitoring and soil analysis; and limited to the provision of a specific methodology or algorithm for smart weather monitoring or real-time climate change notifications. [61] explores the crop yield estimation using combined optical and SAR imagery with Gaussian kernel regression and probabilistic Gaussian process regression (PGPR) models. The integration of Sentinel-1 interferometric coherence and Sentinel-2 RDVI provided a high accuracy for rice grain yield estimation (r2 = 0.81, RMSE = 0.55 t/ha). However, the research does not investigate advanced machine learning methods for yield estimation beyond Gaussian kernel regression. [62] presents a novel IoT-based smart agriculture system utilizing a wireless mobile robot controlled by a Raspberry Pi and a Zigbee wireless protocol. While it details various agricultural operations such as moisture sensing, pesticide spraying, and animal scaring, it lacks information on the algorithms or software implementations used for sensor data processing, decision-making, and robot control. This limits the system’s adaptability and data-driven optimization. [63] focus on a neural network model for crop productivity prediction within an IoT-based smart agriculture monitoring system. Although it provides insights into predictive analytics, the paper does not explicitly address weather monitoring or real-time notification for climate change. The primary emphasis is on crop productivity prediction rather than comprehensive agricultural data management. [64] proposes a LoRa-based smart agriculture management system leveraging LPWAN technology. A microstrip patch antenna was developed and deployed wireless sensors for monitoring soil moisture levels, crop growth, and weather conditions. While the system optimizes irrigation and crop management, the paper does not provide detailed real-world deployment or performance evaluation in large-scale agricultural settings. It mainly focuses on the design and technological components without exploring operational challenges and solutions in practical agricultural environments.[65] introduce an IoT-based smart auto-irrigation system utilizing a decision tree machine learning algorithm. The system addresses precision irrigation challenges, incorporating weather forecast data into its decision-making process. However, the paper does not detail the source or methodology used to incorporate weather data, which limits its ability to adapt to real-time climate changes effectively. [66] propose a three-tier architecture for a smart agriculture system using a LoRa-based multi-sensor IoT network. The architecture includes a sensing layer, a fog layer, and a cloud layer, utilizing LoRa communication technology for low-power, long-range data transmission from sensors. The fog layer is structured as a microservice architecture to handle latency-sensitive tasks in a disconnected environment. While the system architecture and preliminary implementation are well-documented, the paper lacks detailed results or performance evaluation. The focus is more on the architectural framework rather than empirical data supporting its effectiveness in real-world applications.
[67] discuss the use of remote sensing technologies, such as satellite imagery, aerial photography, and geographic information systems (GIS), for precision agriculture practices. These technologies provide valuable information for crop identification, nutrient deficiency detection, crop condition assessment, yield modeling, and land use/land cover change analysis. However, the paper does not delve into specific methodologies or case studies related to smart weather monitoring and real-time notification for climate change. The discussion remains at a general level without addressing the integration of advanced technologies like AI, IoT, and machine learning for enhancing the efficiency of agriculture in response to climate changes.
3. Materials and Methods
3.1. Study Area
The research was carried in Kayonza district, one among seven districts composed the Eastern province of the Republic of Rwanda. The district covers a surface of 1935 km2 and it has 236.26 habitat per km2. The total population of the district as per the year 2022 is 457,156. The district is composed of twelve administrative sectors; seven were considered in the study considering that they are equipped with sub stations of meteorology facilities where data being collected for analysis. Agricultural land use predominates an important space in Kayonza district where it extends generally in Eastern part of the district. It is covered by the natural features including wetlands, lakes, and their buffers as well as Akagera national park with its buffer zone. Figure 1 indicates the map of the Republic of Rwanda indicating the area of study, Figure 2 shows natural features and Figure 3 indicate land use distribution.
The total land area reserved for agriculture is 93,685.41 Ha including livestock (57.71%). The agricultural land covers only 61,149.45 Ha providing 37.6% of the total district land use.
3.2. Methodology
Optimization of factors such as, climate and weather conditions, soil quality and nutrient management, seed variety and genetics, agronomic practices, pest and diseases management, irrigation and water management, harvesting practices, social economic and policy factors can lead to the substantial improvement for maize productivity.
This section highlights the methodology used in the process of collecting data, this includes meteorological and maize crop harvest. Meteorological data considered in this study are temperature and rainfall which are considered among factors affecting maize crop production. The period considered for meteorological parameters data is from 1980. In this study, the period considered for harvest of maize crop is from 2011. To ensure the integrity, accuracy and Genuity of data; sources were from the district agronomist, seasonal reports from the National Institute of Statistics of Rwanda and from Rwanda meteorology agency. To collect information on the rate of maize production; a survey questionnaire was addressed to the district agronomist for the collection of information related to the change of climate and its effect to maize productivity in the area. A survey questionnaire was also addressed to the Ministry of Agriculture and Animal Resources to collect information on strategies for the adaptation of climate variability vis a vis to agricultural practices. To collect meteorological data, a formal request was made to Meteo Rwanda and a dataset of daily temperature, mean temperature, annual temperature, daily rainfall, monthly rainfall and annual rainfall were provided for analysis. Figure 4 below indicates the process flow for the data analysis.
3.2.1. Data Collection and Analysis
Rainfall
Maize has a relatively high-water requirement, especially during the vegetative and reproductive stages. In general, the total water requirement for the entire growing season ranges from 500 to 800 mm, depending on the climate and growing season length. Moisture stress during the silking and grain-filling stages can severely reduce yield. Excessive rainfall or waterlogging can also be detrimental, as maize is susceptible to root diseases in saturated soil conditions [68,69]. Daily rainfall depicted in Figure 5 provides discrepancies in rainfall distribution for the area under study where the minimum daily rainfall ranged between 20mm and 150 mm, this directly affect the expected maize productivity.
Analysis of Meteo-Rwanda data related to the rainfall, and data for annual maize productivity in the period of 2011 to 2023 revealed a worrying variability in the annual mean rainfall, from which the mean annual rainfall reached 473 mm; the lowest being 564 mm and the highest 1037mm, with a pronounced effects on the maize agriculture and productivity for the region.
Temperature
Weather data were collected from stations situated in the Kayonza district from 1981. This provides the foundational information necessary to analyze the impact of weather patterns in agricultural practices and to develop effective strategies for adaptation to climate change in the context of Rwanda, with a specific focus on the agricultural landscape of Kayonza district. Data collected from Meteo-Rwanda indicated a drastic fluctuation in the annual mean temperature and annual mean rainfall, with associated negative impact on the crop productivity. Weather data collected were treated and gives details on daily rainfall at the seven sectors which are Kabarondo, Gahini, Mwiri, Mukarange, Rwinkwavu, Ndego and Murundi. Figure 6 show a trend of variation of daily rainfall for the seven sectors under study; the range of rainfall for the seven sectors under study ranged between 20 mm to 150 mm and NTEGO is the most affected. Data from meteo-Rwanda was analyzed and the findings revealed an increase in the annual mean temperature by 2.1 ⁰C from 2011 to 2023, the lowest being 19.94 ⁰C and highest 22.04 ⁰C putting a worrying pressure to the maize agriculture in the pilot area of the study.
Maize requires warm temperatures for germination, growth, and development. In general, the optimum temperature for maize growth ranges between 20°C and 30°C. Temperatures below 10°C or above 35°C can adversely affect growth and yield, but this can differ due to the overall soil quality and the nutrients content. Extreme high temperatures (above 40°C) during pollination and grain-filling stages can lead to significant yield losses [68,69]. Figure 6 highlight the trend of annual mean temperature for the district.
Soil Temperature
Soil temperature management help to maximize maize productivity by ensuring healthy germination, root development and nutrient uptake throughout the growing process. The optimum soil temperature ranging between 20-30°C is the best for maize seeds germination bellow which germination fails or slow down leading to poor stand establishment; and above which young seed can be damaged leading to the poor plant establishment. Maize roots development requires a moderate climate, as cold soil temperature slows the root growth and limits the plant’s ability to access water and nutrient [72]. Figure 7 mentions the trend of maize yields relative to the annual mean soil temperature recorded at 10cm. Meteo-Rwanda data related to the soil temperature, in the period of 2011 to 2023 mentioned a slight variability in the annual mean soil temperature by 2.18 °C; the lowest being 21.21 °C and the highest 23.39 °C. The figure mentions a correlation of soil temperature recorded at 10 cm of land deep vis – a- vis to the annual maize yields estimated in ton per ha. Other factors to consider are solar radiation shading and humidity as, maize typically grow in regions with abundant sunlight, and it is sensitive to variations in solar radiation. Insufficient solar radiation leads to the poor growth, delays maturity, and reduces yields [68,70].
Maize Crop Data
In this study, as per the crop intensification program established by the Government of Rwanda, maize is mostly cultivated in Eastern part of the country, especially in Kayonza district, However, the effect of climate variability continuously affects maize crop rate production and be the source of hunger. Figure 8 provides details on maize crop productivity for the period of 2011 to 2024.
3.2.2. Machine Learning Models
Empirical evidence from prior research underscores the pivotal role of machine learning as a decision-support mechanism for crop yield prediction and weather forecasting. In this study, four models are proposed; this includes Random Forest Regressor, XBoost regressor, Support vector machine and LASSO. The selection of these algorithms was informed by the numerical characteristics of the target variable, as opposed to categorical outputs, and the scale of the dataset under consideration.
Random Forest Regression Model
The Random Forest Regression algorithm was employed to compute metrics for annual temperature, mean temperature, and cumulative annual rainfall. As an ensemble learning method, Random Forest is particularly suited for the prediction of meteorological variables and crop yield due to its capacity to handle nonlinear relationships and high-dimensional datasets. The model operates by constructing a multitude of decision trees, each trained on a bootstrap sample of the dataset, while a random subset of predictor variables is considered at each split. This dual randomization—both in sampling and feature selection—ensures model diversity and reduces the risk of overfitting. Figure 9 gives an overview of the Random Forest regression model.
Extreme Gradient Boosting
Extreme gradient boosting method builds trees sequentially, where each new tree corrects the error of previous trees. The model is highly optimized and regularized for better performance. The input features enter the first decision tree, the residual errors from the first tree are computed; a new tree is trained to predict these residuals and repeat for multiple trees and summing predictions to get the final yield. Figure 10 shows detail of the model.
Support Vector Machine
The support vector machine regression fil a function within a tolerance that predicts the target variables. It uses Kernel functions to handle non-linear data. The input features are mapped into a high dimensional space via a kernel and identify a hyperplane that best predicts yield within a tolerance margin; the outputs predicted yield for the given input. Figure 11 shows the diagram process with clarity.
Least Absolute Shrinkage and Selection Operator
The model is a linear regression which shrinks less important feature coefficients to zero. The input features are weighted by coefficients learned from training; predictions are linear combination of input features and coefficients and the regularization reduces overfitting by penalizing large coefficients. Figure 12 provides details of the proposed model.
3.2.3. Evaluation Metric
The performance of the predictive models was evaluated using standard metrics, such as Mean Absolute Error (MAE), Root Mean Squared Error (RMSE) and Coefficient of Determination (R-squared).
The formula for the mean absolute error is
where: n is the number of data points; yi is the actual (observed) value for the i-th data point and is the predicted value for the i-th data point.
Root Mean Squared error (RMSE) provides the root mean square difference between the anticipated and real value.
Where: where: n is the number of data points; yi is the actual (observed) value for the i-th data point and is the predicted value for the i-th data point.
Coefficient of determination (R2): statistical measures that examine the variance in dependent variables in regression models
where yi are the observed values, are the predicted values and the mean of the observed values.
4. Results
4.1. Prediction Results
As provided in section 4; the proposed models were evaluated based on the three metrics; the Mean Absolute Error (MAE), Root Mean Squared Error (RMSE) and Coefficient of Determination (R-squared). The results presented in Table 1 expressed that Random Forest possess a coefficient of determination R² of 0.957, support vector machine R² is 0.955, Extreme Boost with R² 0.953 and LASSO with R² of 0.253. as per the results, Random Forest achieved the highest R² and consider the most accurate for maize crop prediction. Extreme Boost machine is slightly less accurate compare to the random forest but still competitive. The support vector machine performed well but lacks feature importance insights. LASSO shows poor performance due to the non-linear relationship in the data.
Parameters considered in this prediction processes were maize crop production for the year 2011 to 2024, annual mean temperature, annual maximum temperature, annual minimum temperature, annual rainfall and soil temperature for the mentioned years.
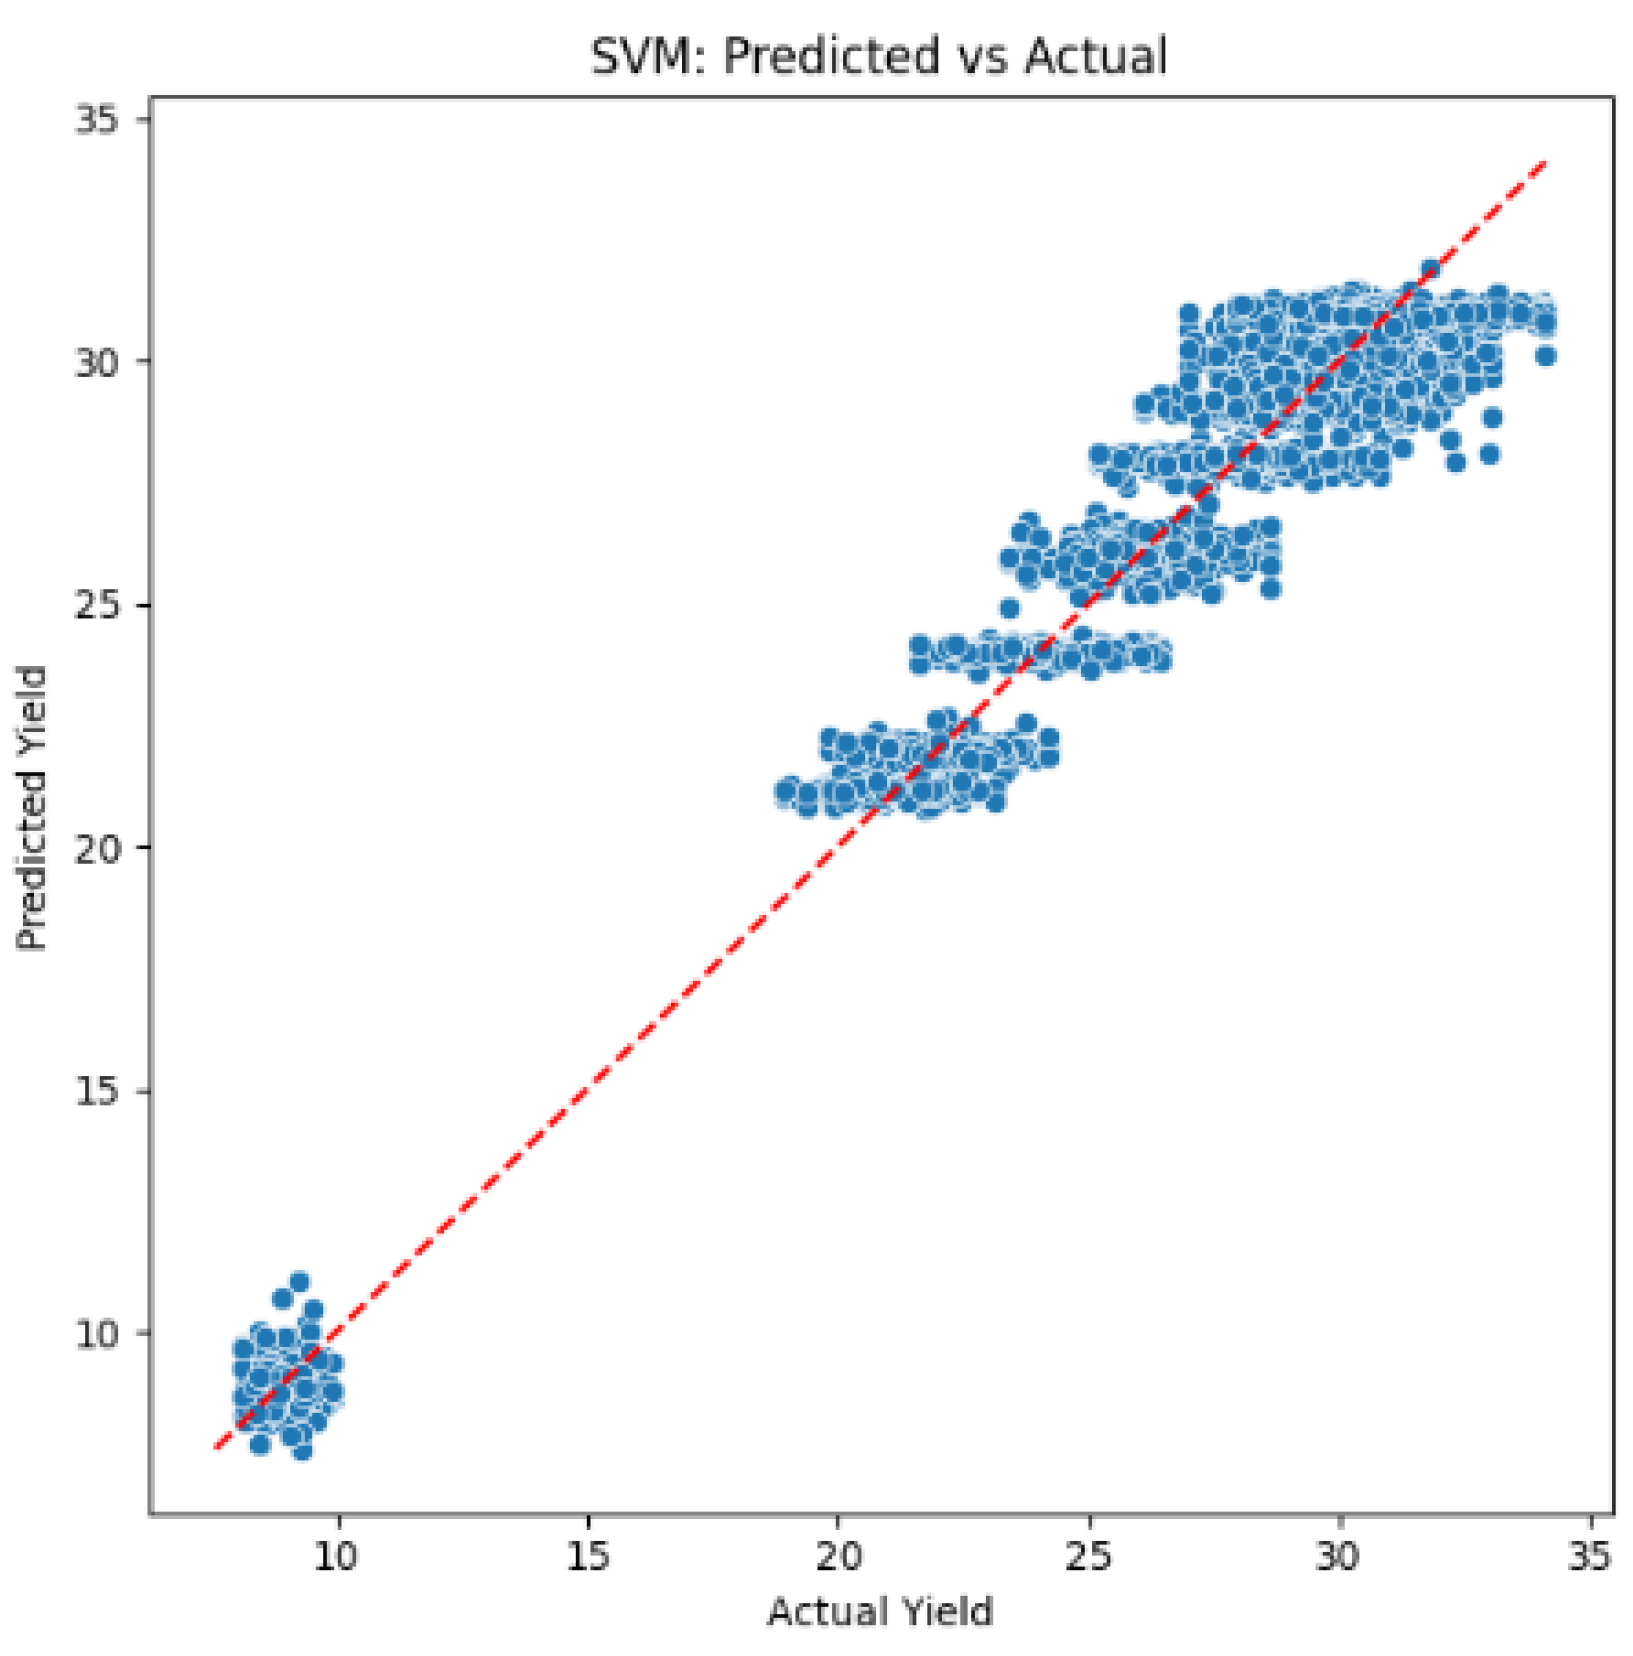
The maize yield prediction was determined based on climatic and soil features using multiple proposed machine learning models. Graphical visual representation describes the predicted crop yield vis a vis to the actual yield. figures below highlight the performance of Random Forest prediction model, Extreme Boost regressor, support vector machine and LASSO where a comparison graph depicts the predicted crop yield versa actual yield.
Graphical representation in figure 13, figure 14 and figure 16 presents similarities where points are clustered closely to the diagonal line, this re-affirm the high performance of random forest, support vector machine and Extreme boost machines learning models. Points indicated above the diagonal line simply indicate occasional overestimation and can be tolerate as minor bias. However figure 15 shows a large number of points above and under the diagonal line, this indicates that a large number of crop yield is both underestimated and overestimated, the performance is not viable and cannot be trusted, this imply that the model is not viable and not advised for linear regression model.
Figure 13.
Graphical visual prediction of Random Forest model.
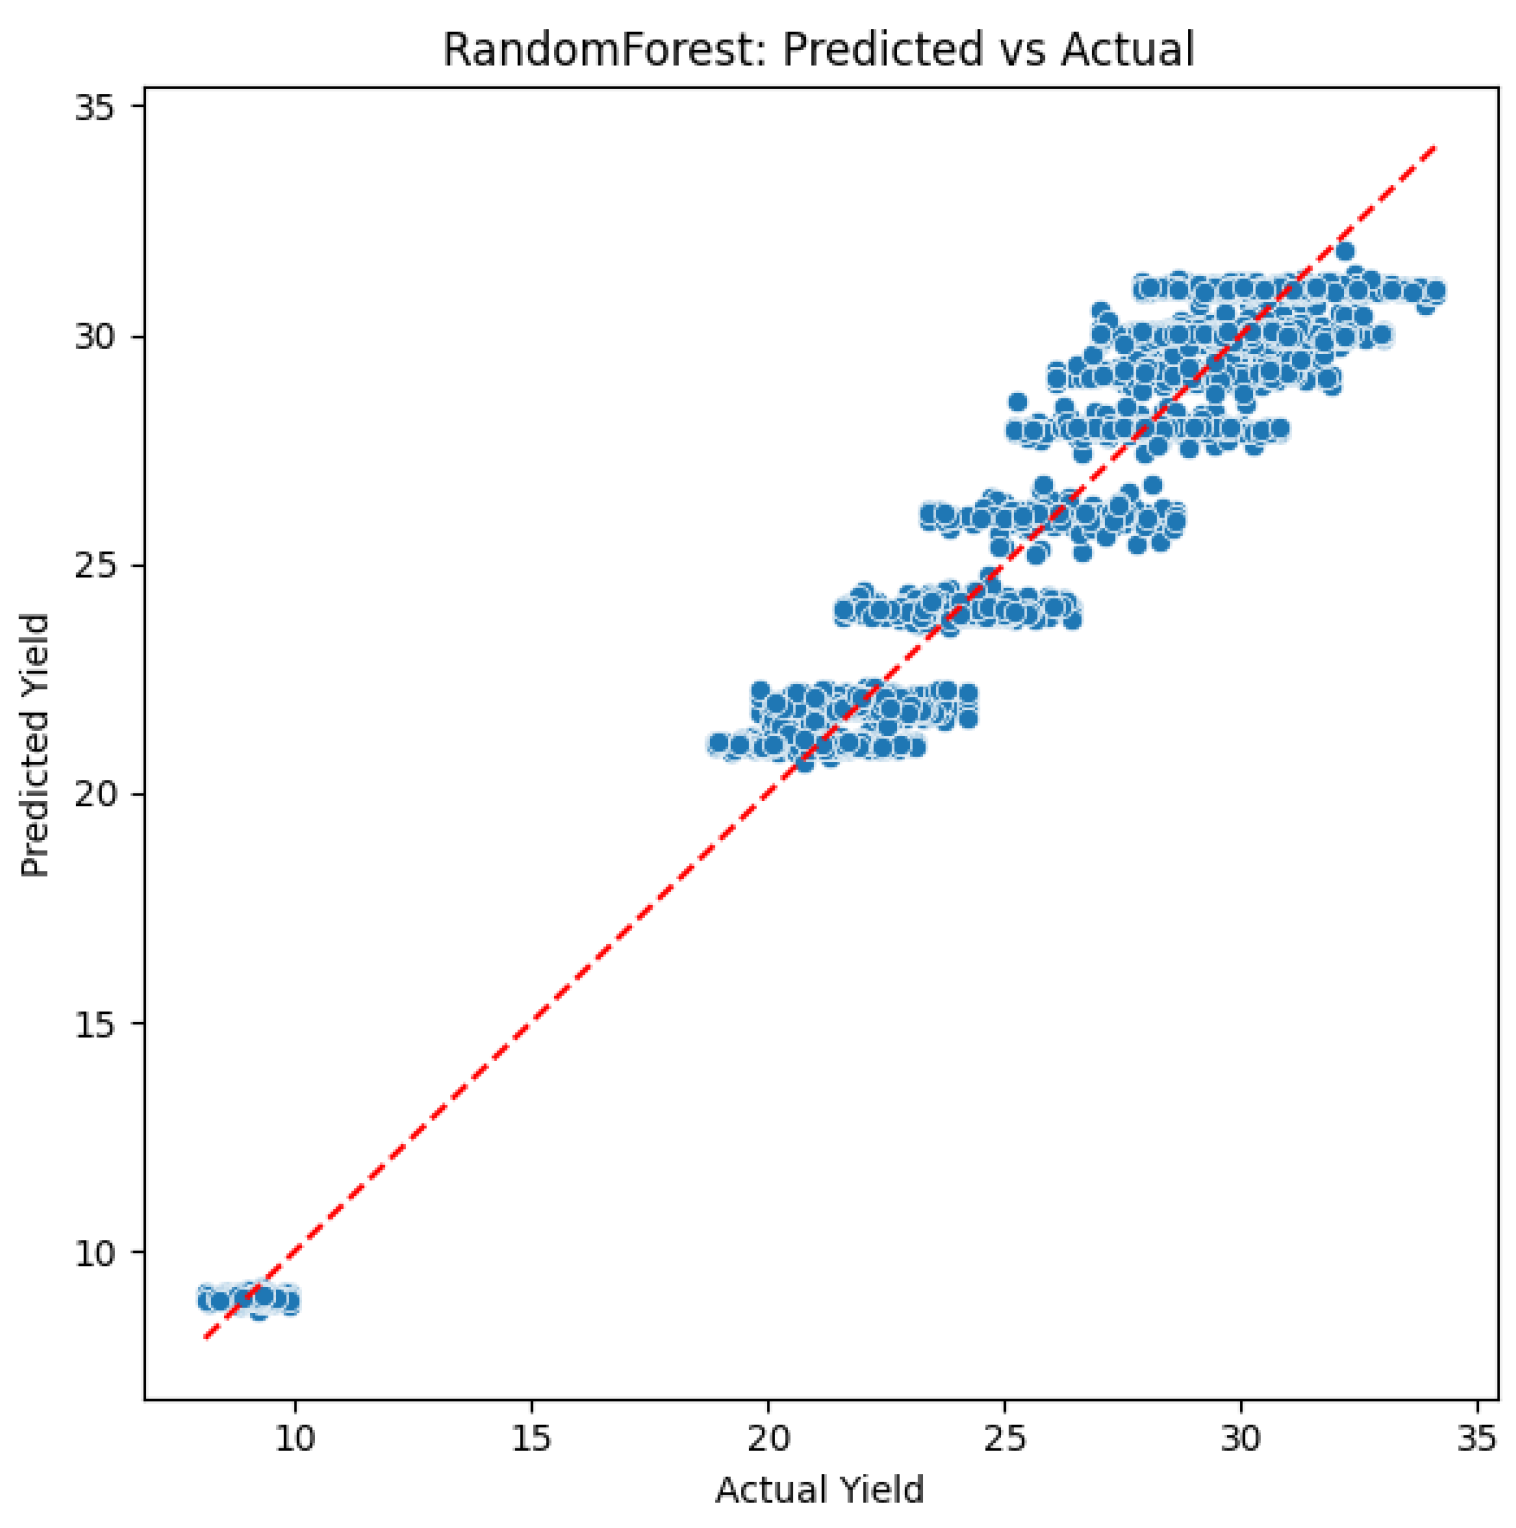
Figure 14.
Graphical visual prediction of XBoost prediction model.
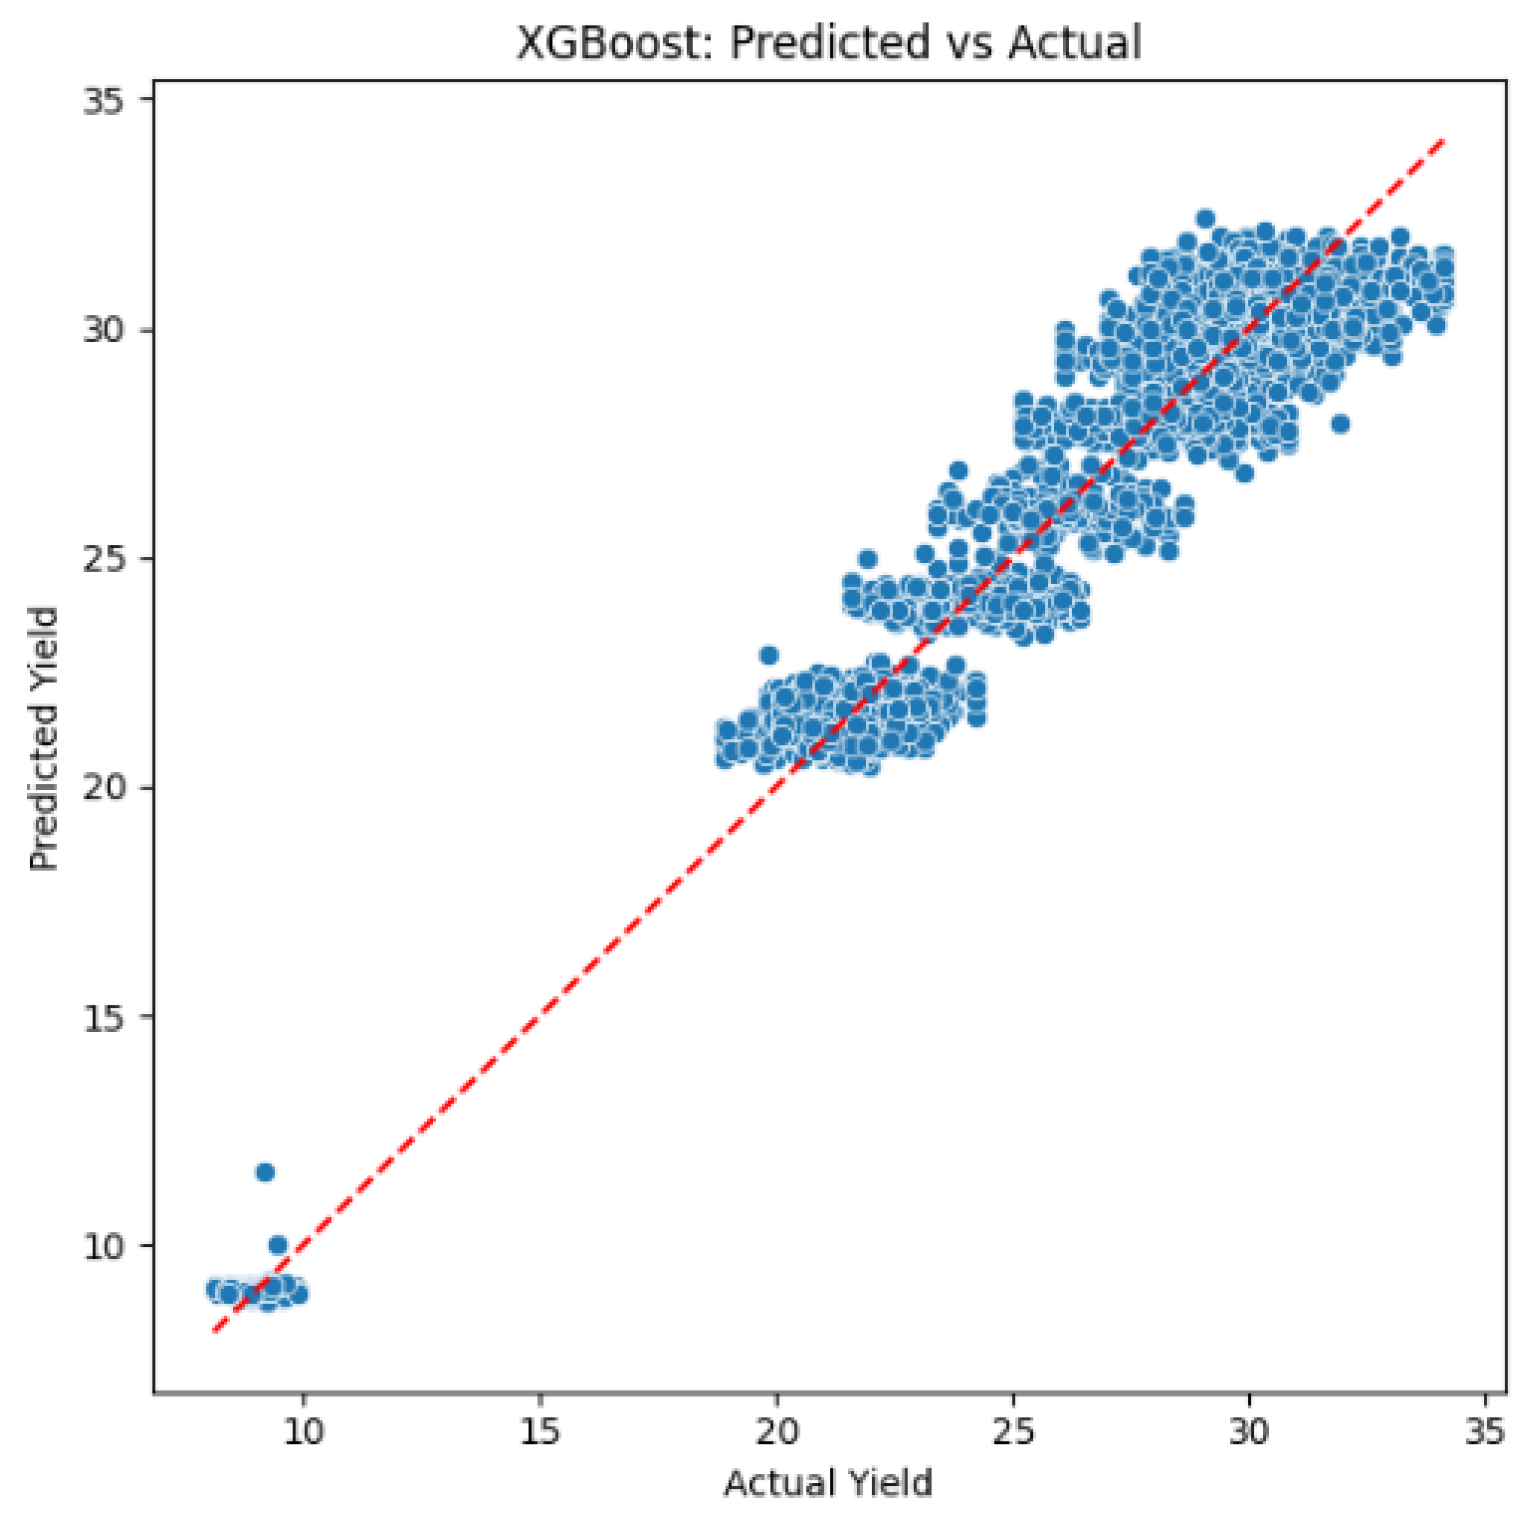
Figure 15.
Graphical visual of LASSO Prediction model.
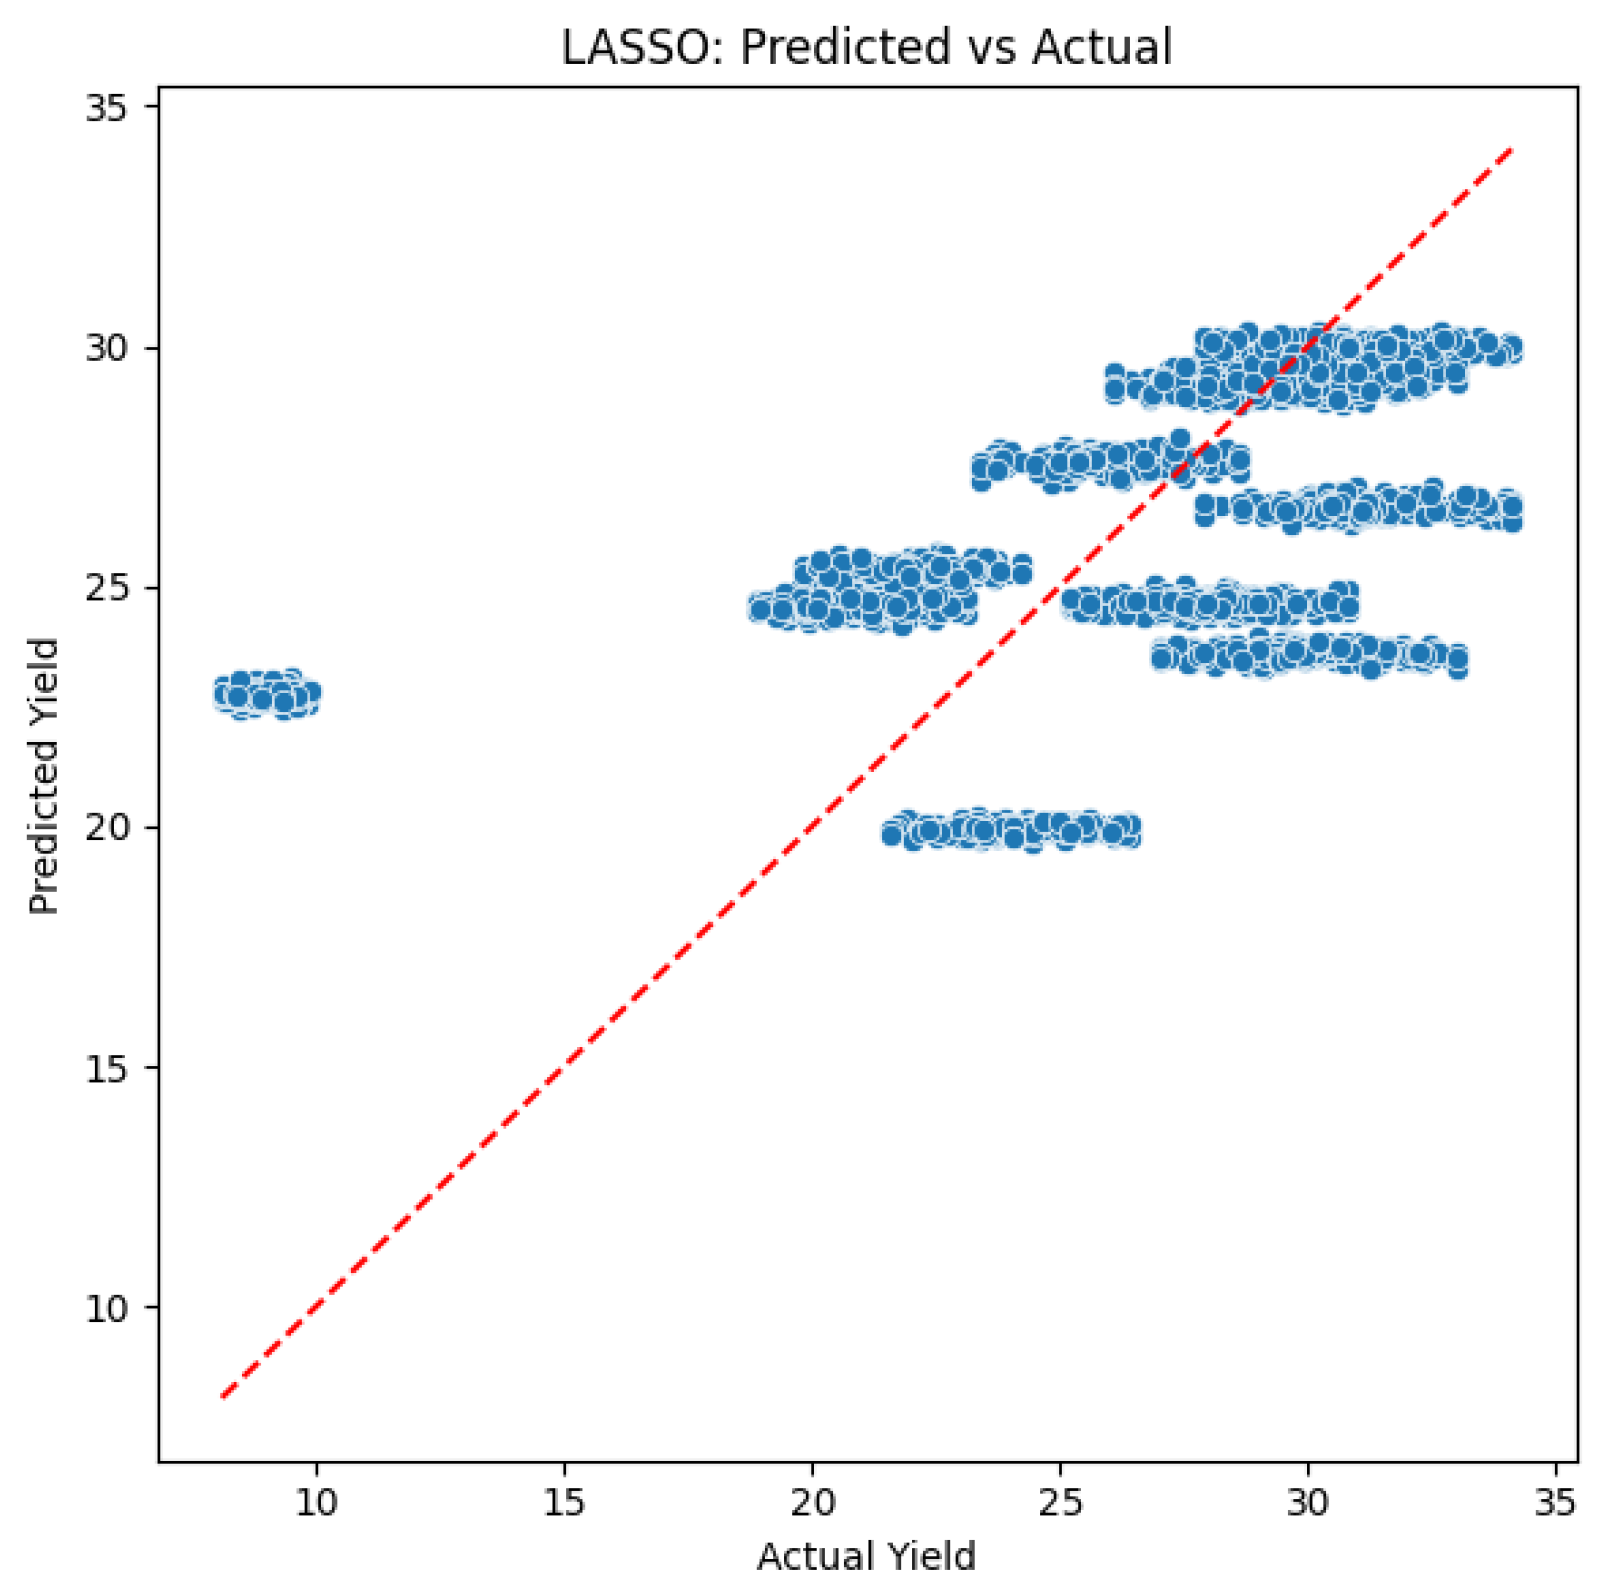
Figure 16.
Graphical visual prediction of SVM model.
4.2. Variable Importance
Based on the proposed models, among other contributors; climatic variables and maize crop yield play a key role in the determination of workable prediction models. From the proposed models only Random Forest and extreme gradient booster provide importance features.
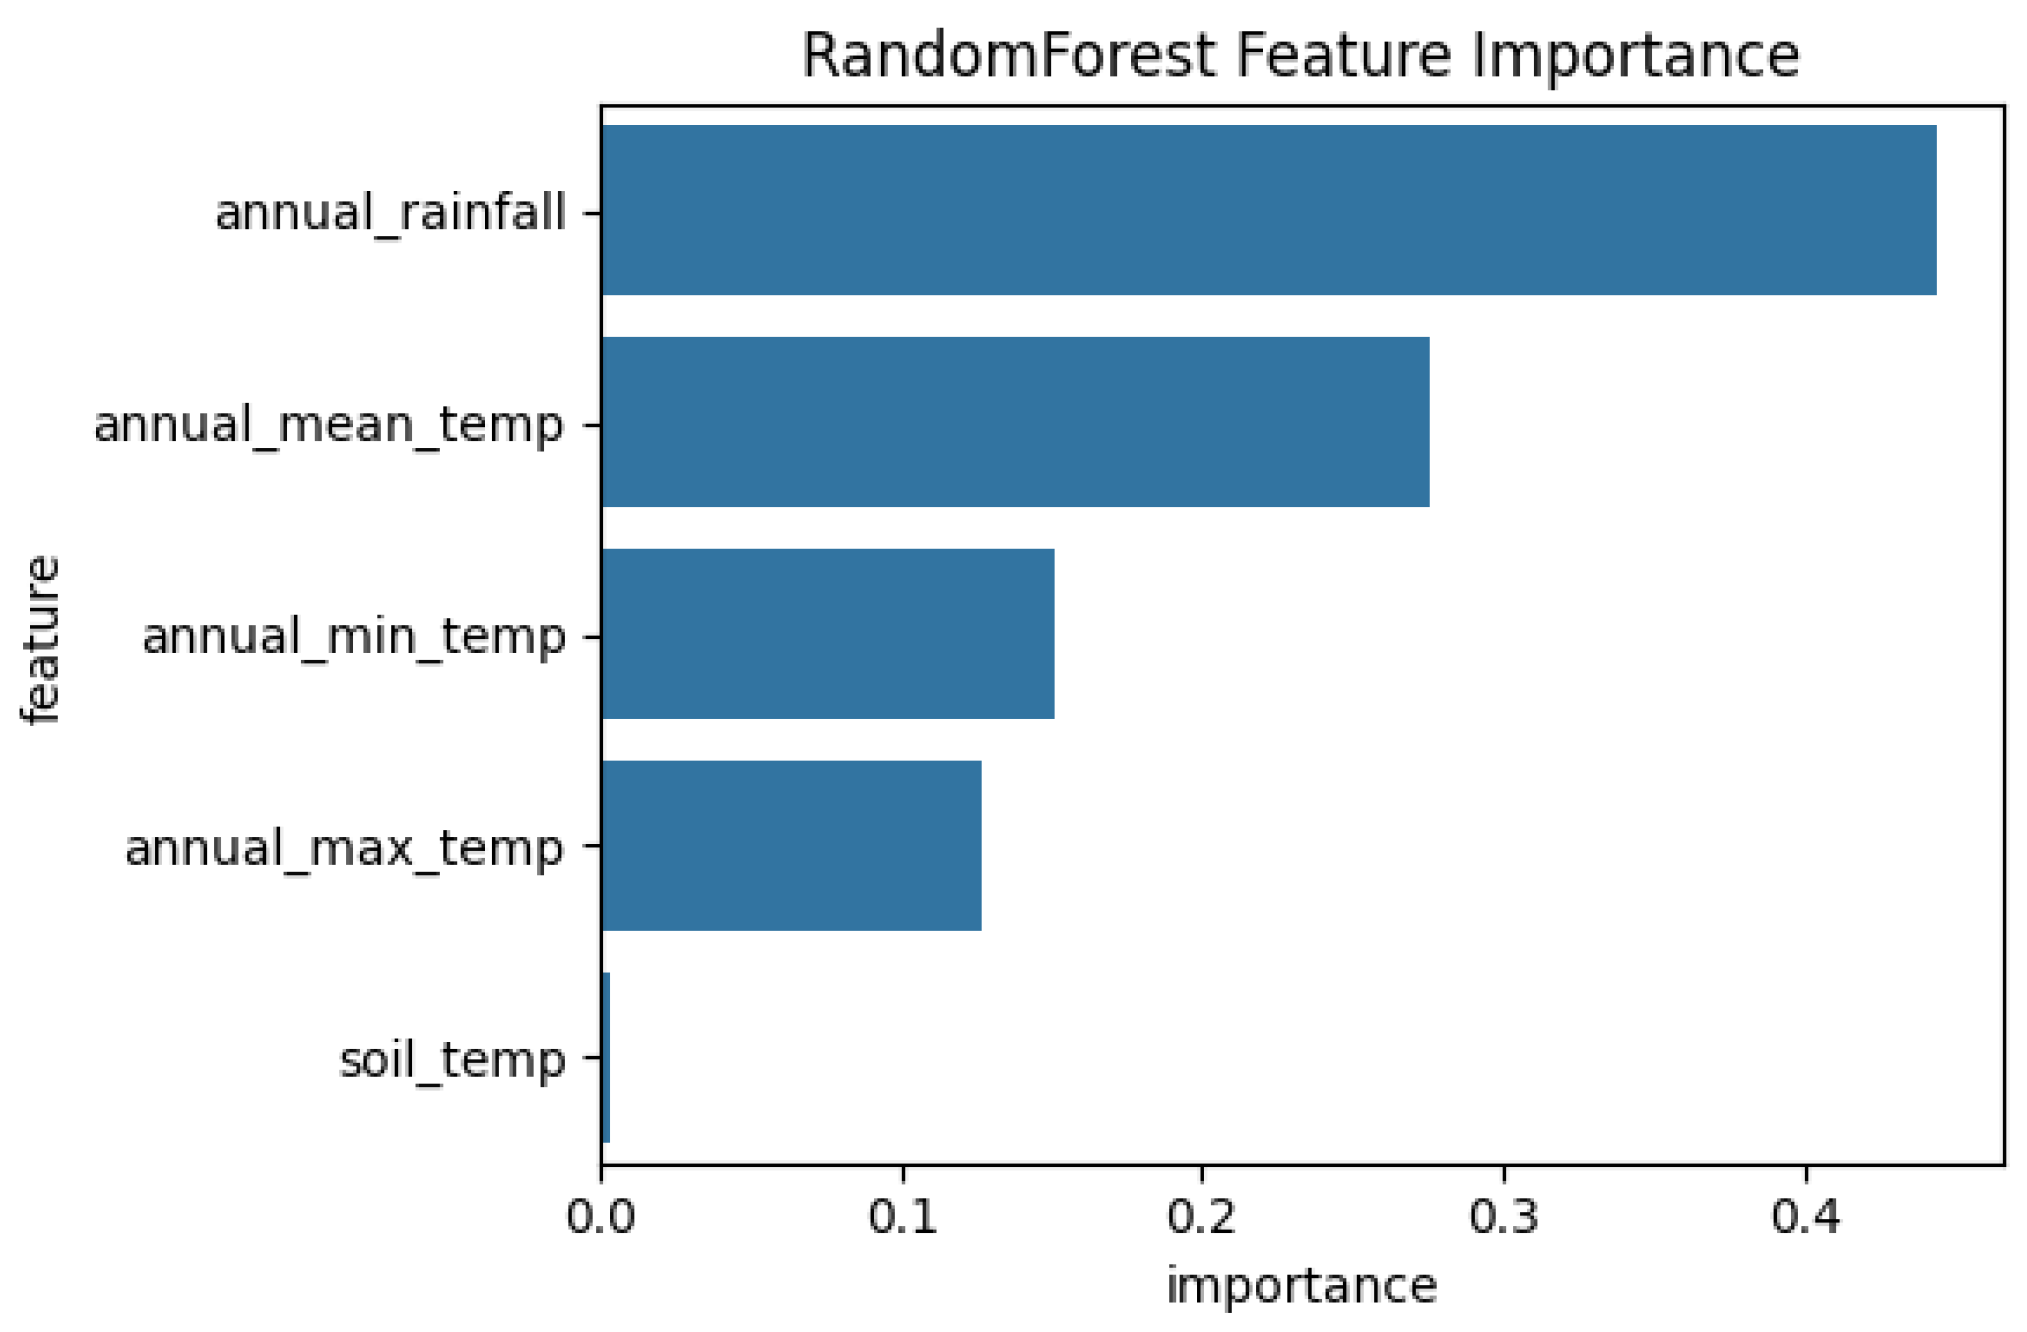
4.2.1. Random Forest Feature Importance
Features contributed in the performance of Random Forest machine learning model are annual mean temperature, annual maximum temperature, annual minimum temperature, annual rainfall and soil temperature. Table 2 and figure 17 shows proportion of important contributors of the model; annual rainfall contributes at 0.444 followed by the annual mean temperature with a contribution of 0.276, soil temperature has no significance contribution to the model.
Figure 17.
contribution of features importance of RF model.
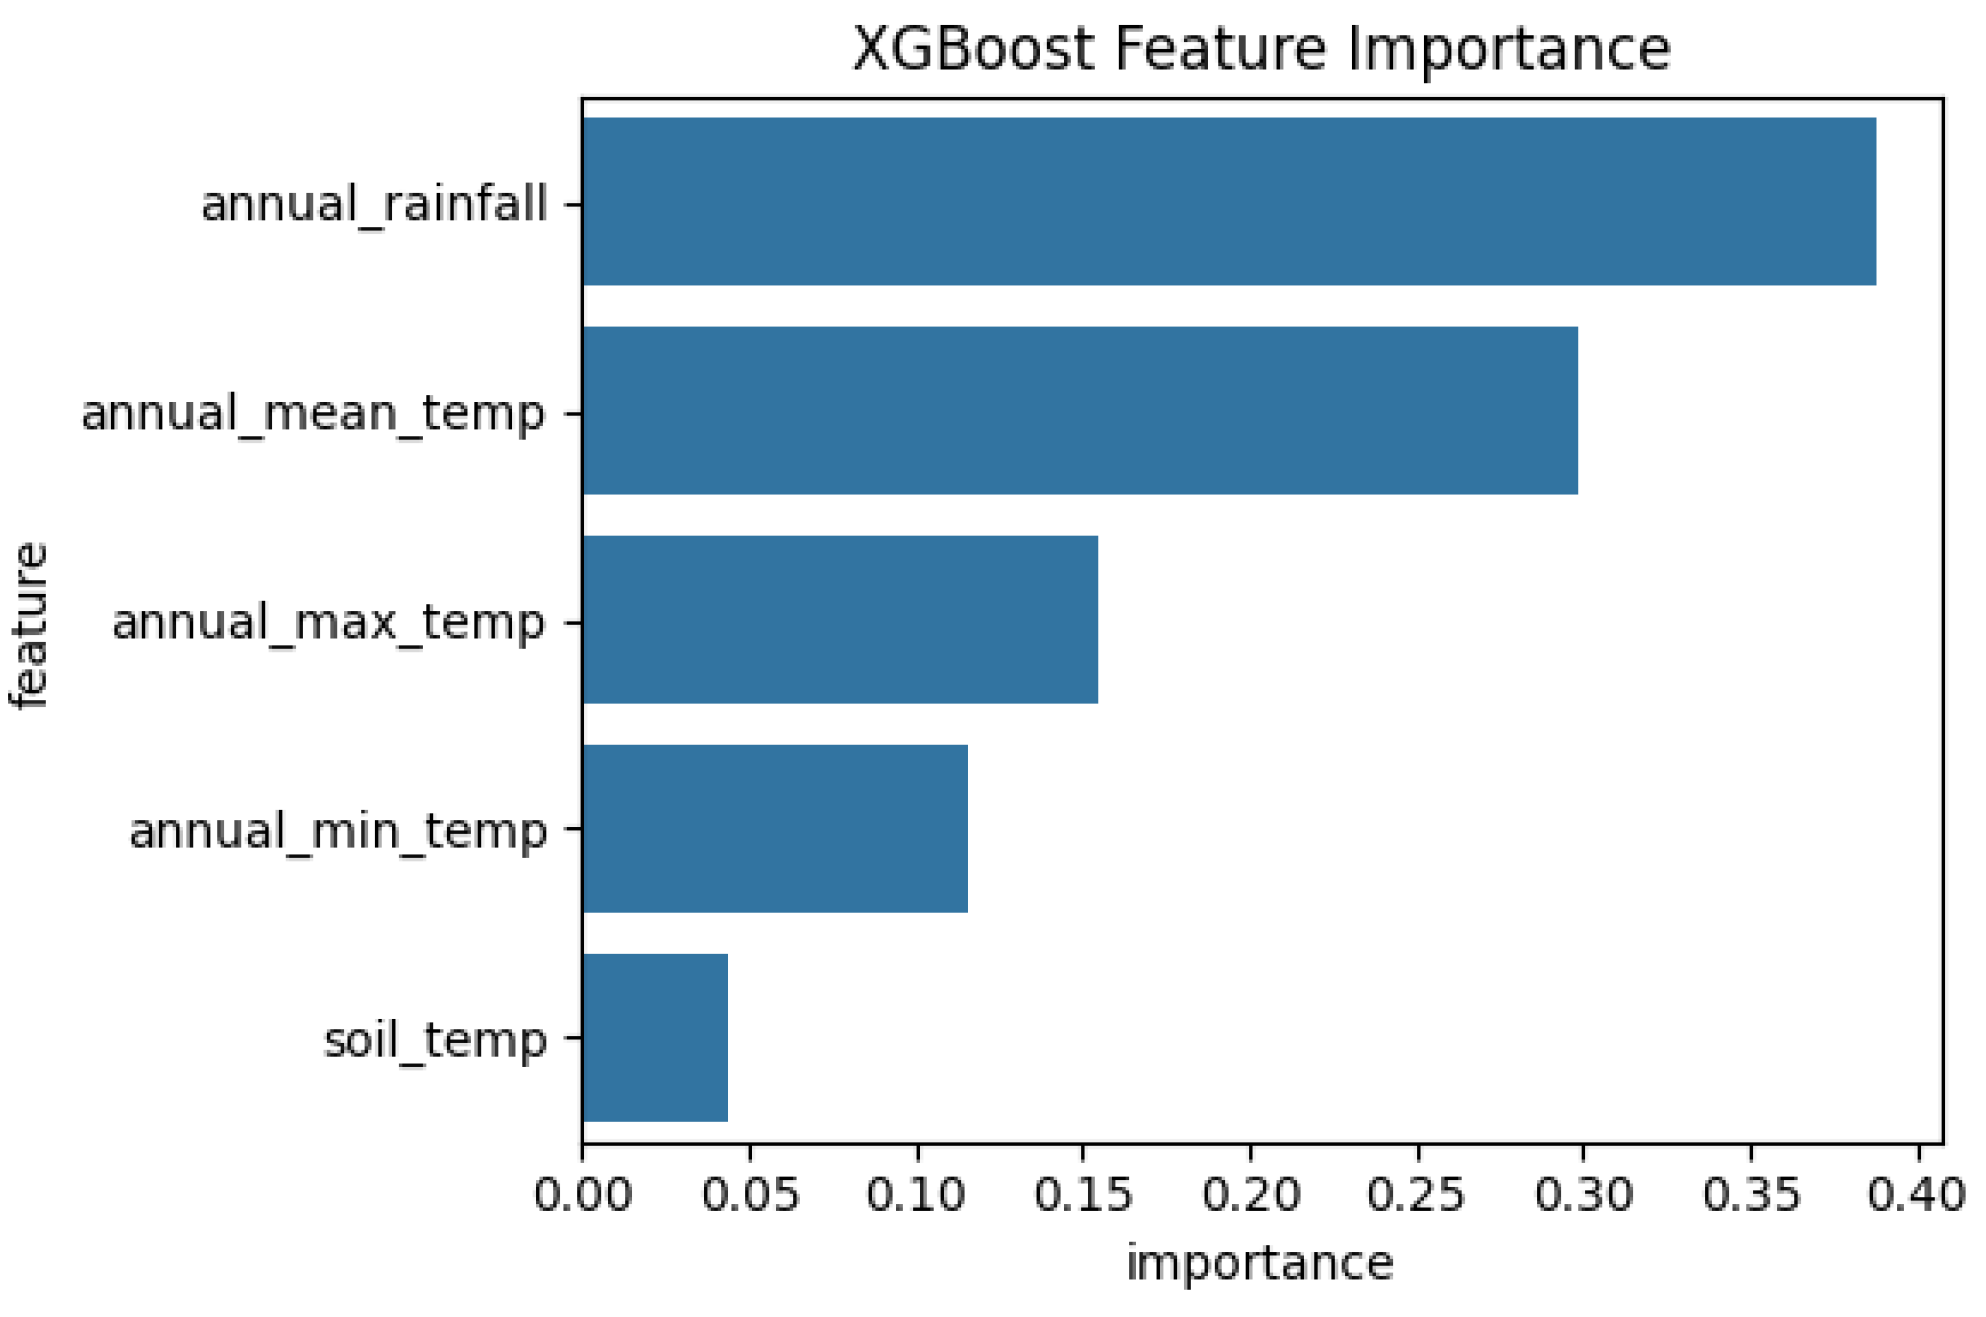
4.2.2. Extreme Gradient Boost Regressor
For this proposed model, among other parameters that had influences in the performance of prediction model; annual rainfall has the highest impact on maize yield, it has a value of 0.388 followed by the annual mean temperature. Soil temperature has minimum influence of 0.043 as presented in Table 3 and figure 18.
Figure 18.
Contribution of features importance of XGBoost Model.
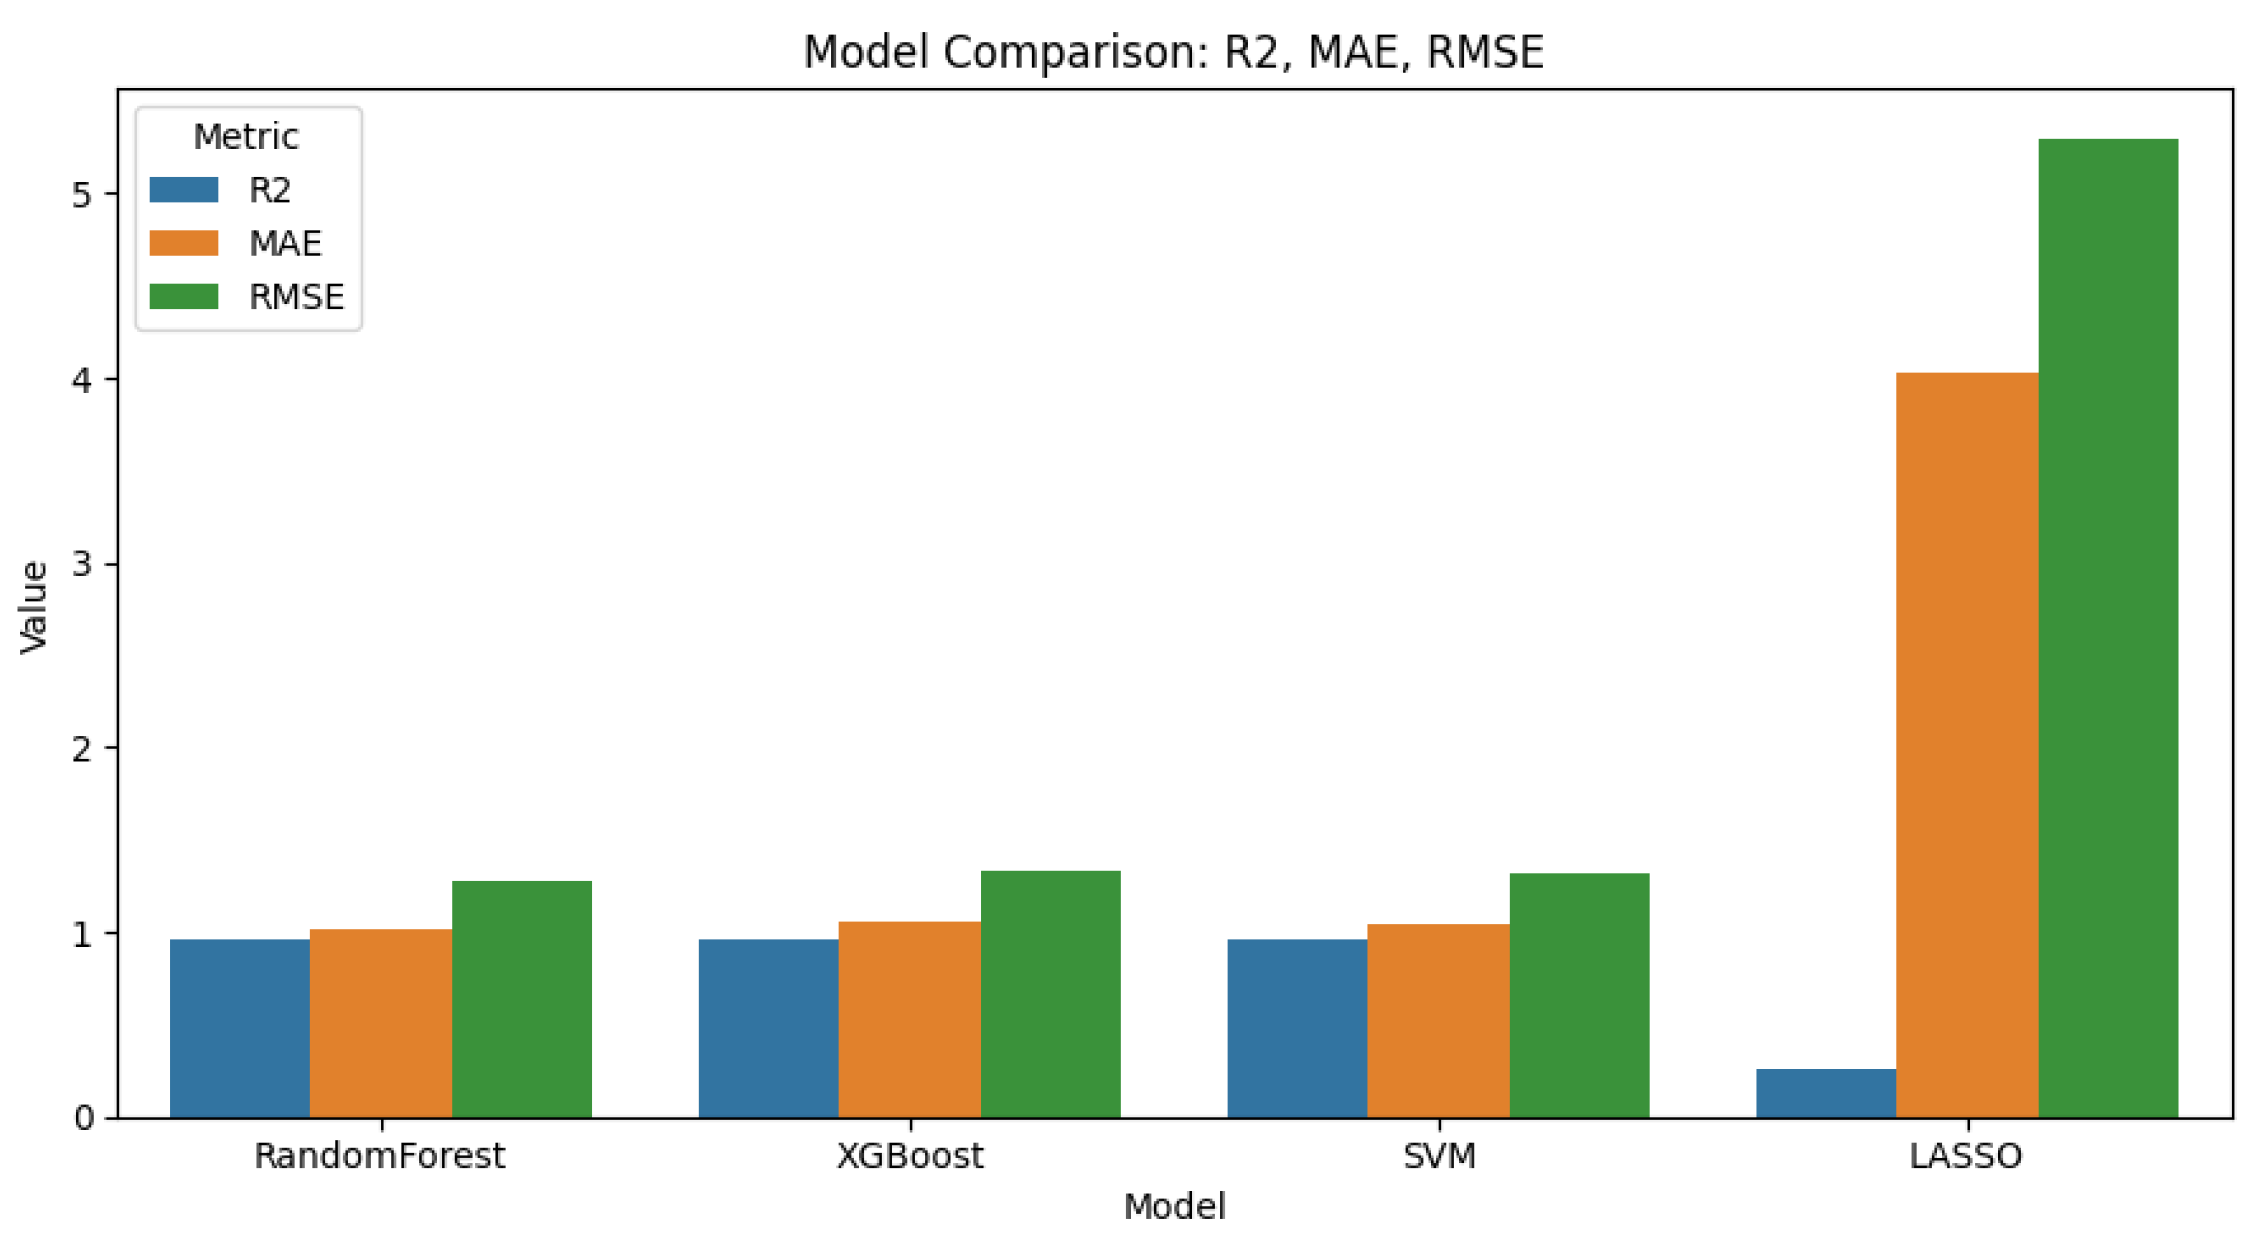
4.2.3. Comparative Analysis of the Proposed Machine Learning Models
Performance of the proposed machine learning for the prediction of maize crop has been evaluated using R². Based on the dataset and results indicated in figure 19, it shows that Random Forest is the best machine learning techniques to recommend in the prediction of maize crop yield; it provides R² value of 0.957 compared to support vector machine, XGBoost model, and LASSO which has respectively R² values of 0.955, 0.953 and 0.256.
Figure 19.
Performance evaluation of MLM.
5. Conclusions
This study highlighted the impact of climate change in maize crop yield production; the change in temperature, rainfall and soil temperature has a direct impact in the expected productivity especially in maize crop production. The study tested Random Forest, support vector machine, Extreme gradient Boost regressor and LASSO using historical meteorological dataset and maize crop yield from Kayonza district- Rwanda. The performance of the predictive models was evaluated using standard metrics, such as Mean Absolute Error (MAE), Root Mean Squared Error (RMSE) and Coefficient of Determination (R-squared). Through performance analysis; Random Forest performed better compared to other models with accuracy of R² value of 0.957; However, several challenges and research gaps exist, including the lack of large-scale dataset, limited consideration on meteorological variables where only temperature, rainfall and soil temperature were considered; only maize crop was considered in the stydy. For the future work, an IoT monitoring component is planned to be developed and deployed where Random Forest machine learning techniques will be tested to ensure timely and accurate information not limited to agriculture practitioner, policy makers and researchers.
Acknowledgments
We thank the African center of Excellence in Internet of Things (ACEIoT), University of Rwanda to provide conducive platform to perform this research. This work was not funded from any organization.
Abbreviations
| MAE | Mean Absolute Error |
| RMSE | Root Mean Squared Error |
| RF | Random Forest |
| SVM | Support vector machine |
| LASSO | Least absolute shrinkage and least absolute shrinkage and selection |
| XGBoost | Extreme Boost regressor |
| AI | Artificial Intelligence |
| ML | Machine learning |
References
- V. Shevchenko et al.: Climate Change Impact on Agricultural Land Suitability Digital , 2024; Object Identifier. [CrossRef]
- World Bank and CIAT, “Climate-Smart Agriculture in Rwanda. CSA Country Profiles for Africa, Asia, and Latin America and the Caribbean Series.,” pp. 1–16, 2015.
- Y. P. Perevedentsev and A. A. Vasil’ev, “Climate Change and Its Impact on Agriculture,” Russ. Meteorol. Hydrol., vol. 48, no. 9, pp. 739–744, 2023. [CrossRef]
- L. Pereira, Climate Change Impacts on Agriculture across Africa. 2017. [CrossRef]
- B. O. B. et al., “Evidence of Climate Change Impacts on Agriculture and Food Security in Nigeria,” Int. J. Agric. For., vol. 2, no. 2, pp. 49–55, 2012. [CrossRef]
- Rutenberg, A. Gwagwa, and M. Omino, “Use and Impact of Artificial Intelligence on Climate Change Adaptation in Africa,” in African Handbook of Climate Change Adaptation: With 610 Figures and 361 Tables, Springer International Publishing, 2021, pp. 1107–1126. [CrossRef]
- V. Karimi, E. Karami, and M. Keshavarz, “Climate change and agriculture: Impacts and adaptive responses in Iran,” J. Integr. Agric., vol. 17, no. 1, pp. 1–15, 2018. [CrossRef]
- K. Kumar, B. Murimi, and I. Romalice, “IoT Based Farmers’ Smart Technology, Case Study: Rwanda Meteorology Agency, Kayonza District,” Int. J. Comput. Trends Technol., vol. 67, no. 9, pp. 1–6, Sep. 2019. [CrossRef]
- H. Afreen and I. S. Bajwa, “An IoT-Based Real-Time Intelligent Monitoring and Notification System of Cold Storage,” IEEE Access, vol. 9, pp. 38236–38253, 2021. [CrossRef]
- M. Kuradusenge et al., “Crop Yield Prediction Using Machine Learning Models: Case of Irish Potato and Maize,” Agric., vol. 13, no. 1, Jan. 2023. [CrossRef]
- M. Pyingkodi, K. Thenmozhi, M. Karthikeyan, T. Kalpana, S. Palarimath, and G. B. A. Kumar, “IoT based Soil Nutrients Analysis and Monitoring System for Smart Agriculture,” in 3rd International Conference on Electronics and Sustainable Communication Systems, ICESC 2022 - Proceedings, Institute of Electrical and Electronics Engineers Inc., 2022, pp. 489–494. [CrossRef]
- Y. Rahut, R. Afreen, and D. Kamini, “Smart weather monitoring and real time alert system using IoT,” Int. Res. J. Eng. Technol., vol. 848, 2008, [Online]. Available: www.irjet.net.
- P. Sharma and S. Prakash, “Real Time Weather Monitoring System Using Iot,” ITM Web Conf., vol. 40, p. 01006, 2021. [CrossRef]
- R. K. Kodali, S. C. Rajanarayanan, and L. Boppana, “IoT based weather monitoring and notification system for greenhouses,” in Proceedings of the 11th International Conference on Advanced Computing, ICoAC 2019, Institute of Electrical and Electronics Engineers Inc., Dec. 2019, pp. 342–345. [CrossRef]
- Kumar and P. Savaridassan, “Monitoring and accelerating plant growth using IoT and Hydroponics,” in 2023 International Conference on Computer Communication and Informatics, ICCCI 2023, Institute of Electrical and Electronics Engineers Inc., 2023. [CrossRef]
- G. Menon and M. Prabhakar, “Smart Agriculture Monitoring Rover for Small-Scale Farms in Rural Areas using IoT,” in Proceedings of the 2021 IEEE International Conference on Innovative Computing, Intelligent Communication and Smart Electrical Systems, ICSES 2021, Institute of Electrical and Electronics Engineers Inc., 2021. [CrossRef]
- V. Sirisha and G. Sahitya, “Smart irrigation system for the reinforcement of Precision agriculture using prediction algorithm: SVR based smart irrigation,” in Proceedings of the 6th International Conference on Inventive Computation Technologies, ICICT 2021, Institute of Electrical and Electronics Engineers Inc., Jan. 2021, pp. 1059–1066. [CrossRef]
- P. Mishra and R. K. Somkunwar, “Smart Irrigation with Water Level Indicators Using Logistic Regression,” in 2023 4th International Conference for Emerging Technology, INCET 2023, Institute of Electrical and Electronics Engineers Inc., 2023. [CrossRef]
- Shivanshu, P. Nagwanshi, and A. Chauhan, “Smart Real Time Weather Forecasting System,” in Proceedings - 2021 3rd International Conference on Advances in Computing, Communication Control and Networking, ICAC3N 2021, Institute of Electrical and Electronics Engineers Inc., 2021, pp. 558–562. [CrossRef]
- Balakrishnan Sivakumar and Chikkamadaiah Nanjundaswamy, “Weather monitoring and forecasting system using IoT,” Glob. J. Eng. Technol. Adv., vol. 8, no. 2, pp. 008–016, Aug. 2021. [CrossRef]
- U. J. L. dos Santos, G. Pessin, C. A. da Costa, and R. da Rosa Righi, “AgriPrediction: A proactive internet of things model to anticipate problems and improve production in agricultural crops,” Comput. Electron. Agric., vol. 161, pp. 202–213, Jun. 2019. [CrossRef]
- “IOT BASED SMART WEATHER MONITORING SYSTEM,” Int. Res. J. Mod. Eng. Technol. Sci., Apr. 2023. [CrossRef]
- T. Ara, Bhagappa, J. Ambareen, S. Venkatesan, M. Geetha, and A. Bhuvanesh, “An energy efficient selection of cluster head and disease prediction in IoT based smart agriculture using a hybrid artificial neural network model,” Meas. Sensors, vol. 32, p. 101074, Apr. 2024. [CrossRef]
- B. M. H. Z. Siti NurFatin Muharan, “Development of Smart Weather Reporting System Based on Blynk Application for Agriculture,” 2022.
- F. K. Shaikh, M. A. Memon, N. A. Mahoto, S. Zeadally, and J. Nebhen, “Artificial Intelligence Best Practices in Smart Agriculture,” IEEE Micro, vol. 42, no. 1, pp. 17–24, 2022. [CrossRef]
- N. Jean Pierre et al., “AI Based Real-Time Weather Condition Prediction with Optimized Agricultural Resources.” [Online]. Available: www.ajpojournals.org.
- M. Javaid, A. Haleem, I. H. Khan, and R. Suman, “Understanding the potential applications of Artificial Intelligence in Agriculture Sector,” Adv. Agrochem, vol. 2, no. 1, pp. 15–30, Mar. 2023. [CrossRef]
- H. Ashraf and M. T. Akanbi, “Tensorgate Journal of Sustainable Technology and Infrastructure for Developing Countries 64 Sustainable Agriculture in the Digital Age: Crop Management and Yield Forecasting with IoT, Cloud, and AI.” [Online]. Available: https://orcid.org/0000-0002-2419-4626.
- D. K. Singh, R. Sobti, A. Jain, P. K. Malik, and D. N. Le, “LoRa based intelligent soil and weather condition monitoring with internet of things for precision agriculture in smart cities,” IET Commun., vol. 16, no. 5, pp. 604–618, Mar. 2022. [CrossRef]
- P. Majumdar, S. Mitra, and D. Bhattacharya, “IoT for Promoting Agriculture 4.0: a Review from the Perspective of Weather Monitoring, Yield Prediction, Security of WSN Protocols, and Hardware Cost Analysis,” Journal of Biosystems Engineering, vol. 46, no. 4. Springer Science and Business Media Deutschland GmbH, pp. 440–461, Dec. 01, 2021. [CrossRef]
- L. O. Colombo-Mendoza, M. A. Paredes-Valverde, M. D. P. Salas-Zárate, and R. Valencia-García, “Internet of Things-Driven Data Mining for Smart Crop Production Prediction in the Peasant Farming Domain,” Appl. Sci., vol. 12, no. 4, Feb. 2022. [CrossRef]
- R. M. G PG Student, A. Professor, and G. L. Assistant Professor, “Environment Change Prediction to Adapt Climate-Smart Agriculture Using Big Data Analytics Chetan Balaji,” 2015.
- M. Jagatheesan and G. Janaki, “Weather Monitoring System using IoT for Smart Farming,” ECS Trans., vol. 107, no. 1, pp. 17439–17445, Apr. 2022. [CrossRef]
- M. Satish, Prakash, S. M. Babu, P. P. Kumar, S. Devi, and K. P. Reddy, “Artificial Intelligence (AI) and the Prediction of Climate Change Impacts,” in 5th IEEE International Conference on Cybernetics, Cognition and Machine Learning Applications, ICCCMLA 2023, Institute of Electrical and Electronics Engineers Inc., 2023, pp. 660–664. [CrossRef]
- T. Dhar, B. S. Rawat, S. Pandev, V. Pachouri, and A. Kathuria, “Artificial Intelligence in Contending Climate Change to Achieve Environmental Justice,” in Proceedings - 2023 3rd International Conference on Pervasive Computing and Social Networking, ICPCSN 2023, Institute of Electrical and Electronics Engineers Inc., 2023, pp. 502–506. [CrossRef]
- Ahmad Pandow, K. Ali Ganai, and G. Hussain, A Review on AI-powered Advancements in Climate Finance and its Impact.
- N. Duklan, S. Ghildiyal, H. Maheshwari, K. Joshi, S. Kumar, and Umang, “Artificial Intelligence in Adherence of Climate Change Estimation: Opportunities and Challenges,” in 2023 4th International Conference on Electronics and Sustainable Communication Systems, ICESC 2023 - Proceedings, Institute of Electrical and Electronics Engineers Inc., 2023, pp. 1102–1107. [CrossRef]
- M. Algarni, “Deploying Artificial Intelligence for Optimized Flood Forecasting and Mitigation,” in Proceedings of IEEE/ACS International Conference on Computer Systems and Applications, AICCSA, IEEE Computer Society, 2023. [CrossRef]
- S. Elghamrawy, “An AI-Based Prediction Model for Climate Change Effects on Crop production using IoT,” in 2023 International Telecommunications Conference, ITC-Egypt 2023, Institute of Electrical and Electronics Engineers Inc., 2023, pp. 497–503. [CrossRef]
- Rehman, S. Tariq, A. Farrakh, M. Ahmad, and M. S. Javeid, “A Systematic Review of Machine Learning and Artificial Intelligence Methods to Tackle Climate Change Impacts,” in 2nd International Conference on Business Analytics for Technology and Security, ICBATS 2023, Institute of Electrical and Electronics Engineers Inc., 2023. [CrossRef]
- N. Mahankale, S. Gore, D. Jadhav, G. S. P. S. Dhindsa, P. Kulkarni, and K. G. Kulkarni, “AI-based spatial analysis of crop yield and its relationship with weather variables using satellite agrometeorology,” in Proceedings of 3rd International Conference on Advanced Computing Technologies and Applications, ICACTA 2023, Institute of Electrical and Electronics Engineers Inc., 2023. [CrossRef]
- J. Jāmiʻat Fīlādilfiyā (Amman, Jāmiʻah al-Hāshimīyah (Jordan), and IEEE Communications Society., An Interactive Predictive System for Weather Forecasting.
- S. Joshi, M. Sharma, D. Kaushal, A. Misra, P. Gupta, and S. Gopal, “Optimizing Productivity and Efficiency in Agriculture through the Integration of Digital Technologies: A Smart Agriculture Perspective,” in 9th International Conference on Smart Computing and Communications: Intelligent Technologies and Applications, ICSCC 2023, Institute of Electrical and Electronics Engineers Inc., 2023, pp. 119–125. [CrossRef]
- Ullah, M. Fayaz, M. Aman, and D. Kim, “Toward Autonomous Farming - A Novel Scheme Based on Learning to Prediction and Optimization for Smart Greenhouse Environment Control,” IEEE Internet Things J., vol. 9, no. 24, pp. 25300–25323, Dec. 2022. [CrossRef]
- N. Sylvѐre and R. Jean D’amour, “Updates on Modern Agricultural Technologies Adoption and Its Impacts on the Improvement of Agricultural Activities in Rwanda: A Review,” 2020. [Online]. Available: www.ijisrt.com.
- R. SISODIA and R. Sharma, “Bibliometric Analysis of Peer-Reviewed Literature on Stress Factors Affecting Agricultural Productivity,” Curr. Agric. Res. J., vol. 10, no. 3, pp. 170–180, Jan. 2023. [CrossRef]
- J. Liu, W. Jiang, H. Han, M. He, and W. Gu, “Satellite Internet of Things for Smart Agriculture Applications: A Case Study of Computer Vision,” in Annual IEEE Communications Society Conference on Sensor, Mesh and Ad Hoc Communications and Networks workshops, IEEE Computer Society, 2023, pp. 66–71. [CrossRef]
- X. Li, Y. Sun, and Z. Yang, “UAVs-Based Smart Agriculture IoT Systems: An Application-Oriented Design,” in 2023 6th International Symposium on Autonomous Systems, ISAS 2023, Institute of Electrical and Electronics Engineers Inc., 2023. [CrossRef]
- R. Marini, E. Testi, C. Buratti, A. Giorgetti, and R. Verdone, “A Sensing-without-Sensors System for Soil Moisture Estimation,” in 2021 IEEE International Workshop on Metrology for Agriculture and Forestry, MetroAgriFor 2021 - Proceedings, Institute of Electrical and Electronics Engineers Inc., 2021, pp. 192–196. [CrossRef]
- M. Alsmirat et al., Remote Sensing Data: Useful Way for the Precision Agriculture.
- F. K. Shaikh, S. Karim, S. Zeadally, and J. Nebhen, “Recent Trends in Internet-of-Things-Enabled Sensor Technologies for Smart Agriculture,” IEEE Internet of Things Journal, vol. 9, no. 23. Institute of Electrical and Electronics Engineers Inc., pp. 23583–23598, Dec. 01, 2022. [CrossRef]
- M. Mehedi, M. S. Hanif, M. Bilal, M. T. Vellingiri, and T. Palaniswamy, “Remote Sensing and Decision Support System Applications in Precision Agriculture: Challenges and Possibilities,” IEEE Access, vol. 12, pp. 44786–44798, 2024. [CrossRef]
- N. Victor et al., “Remote Sensing for Agriculture in the Era of Industry 5.0-A Survey,” IEEE J. Sel. Top. Appl. Earth Obs. Remote Sens., vol. 17, pp. 5920–5945, 2024. [CrossRef]
- S. Arjune and V. Srinivasa Kumar, “Smart Agriculture adoption based on Farmer’s Perspective,” in International Interdisciplinary Humanitarian Conference for Sustainability, IIHC 2022 - Proceedings, Institute of Electrical and Electronics Engineers Inc., 2022, pp. 376–379. [CrossRef]
- S. Taylor’s University (Subang Jaya, IEEE Consumer Electronics Society. Malaysia Chapter, and Institute of Electrical and Electronics Engineers, Smart Agriculture Management System with Remote Sensing Technology for Corn.
- M. Hasan, K. N. W. Uddin, A. Sayeed, and T. Tasneem, “Smart Agriculture Robotic System Based on Internet of Things to Boost Crop Production,” in International Conference on Robotics, Electrical and Signal Processing Techniques, 2021, pp. 157–162. [CrossRef]
- IEEE Computer Society. Malaysia Chapter and Institute of Electrical and Electronics Engineers, Smart Agriculture Using Internet of Things.
- S. Rosewick, F. Schorlemer, and F. Kunemund, “System Architecture for a Wireless Sensor Network for Sustainable Agriculture, Forestry and Green Spaces in Smart Cities,” in Proceedings of the IEEE International Conference on Intelligent Data Acquisition and Advanced Computing Systems: Technology and Applications, IDAACS, Institute of Electrical and Electronics Engineers Inc., 2023, pp. 181–186. [CrossRef]
- F. Liu and X. Yan, “The application of Machine Learning and IOT in Smart Agriculture,” in Proceedings - 2022 Global Conference on Robotics, Artificial Intelligence and Information Technology, GCRAIT 2022, Institute of Electrical and Electronics Engineers Inc., 2022, pp. 50–53. [CrossRef]
- R. Vaddi, M. A. Kumar, and L. N. P. Boggavarapu, “A survey on electromagnetic radiation based remote sensing applications to agriculture,” in Proceedings of the 3rd International Conference on Intelligent Sustainable Systems, ICISS 2020, Institute of Electrical and Electronics Engineers Inc., Dec. 2020, pp. 1197–1202. [CrossRef]
- Y. Alebele et al., “Estimation of Crop Yield from Combined Optical and SAR Imagery Using Gaussian Kernel Regression,” IEEE J. Sel. Top. Appl. Earth Obs. Remote Sens., vol. 14, pp. 10520–10534, 2021. [CrossRef]
- SCAD Institute of Technology, IEEE Electron Devices Society, and Institute of Electrical and Electronics Engineers, Internet of Things Application for Implementation of Smart Agriculture System.
- S. Bouarourou, A. Zannou, A. Boulaalam, and E. H. Nfaoui, “IoT Based Smart Agriculture Monitoring System with Predictive Analysis,” in 2022 2nd International Conference on Innovative Research in Applied Science, Engineering and Technology, IRASET 2022, Institute of Electrical and Electronics Engineers Inc., 2022. [CrossRef]
- K. Kamalesh Kumar, V. V. Khairnar, and B. V. Kadam, “LoRa-based Novel System for Smart Agriculture,” in 2nd International Conference on Wireless, Antenna and Microwave Symposium, WAMS 2023, Institute of Electrical and Electronics Engineers Inc., 2023. [CrossRef]
- R. Vijay, Y. V. Priya, P. C. Reddy, S. Monisha, and V. Ramasamy, “A IoT based Smart Auto Irrigation system,” in 2023 International Conference on Computer Communication and Informatics, ICCCI 2023, Institute of Electrical and Electronics Engineers Inc., 2023. [CrossRef]
- S. Mishra, S. Nayak, and R. Yadav, “An Energy Efficient LoRa-based Multi-Sensor IoT Network for Smart Sensor Agriculture System,” in 2023 IEEE Topical Conference on Wireless Sensors and Sensor Networks, WiSNeT 2023, Institute of Electrical and Electronics Engineers Inc., 2023, pp. 28–31. [CrossRef]
- S. K. Niranjan, K.L.S. Gogte Institute of Technology, Institute of Electrical and Electronics Engineers. Bangalore Section., and Institute of Electrical and Electronics Engineers, Remote Sensing Technology and Applications in Agriculture.
- N. Zhang, Y. Qu, Z. Song, Y. Chen, and J. Jiang, “Responses and sensitivities of maize phenology to climate change from 1971 to 2020 in Henan Province, China,” PLoS One, vol. 17, no. 1 1, Jan. 2022. [CrossRef]
- H. A. Dwamena, K. Tawiah, and A. S. Akuoko Kodua, “The Effect of Rainfall, Temperature, and Relative Humidity on the Yield of Cassava, Yam, and Maize in the Ashanti Region of Ghana,” Int. J. Agron., vol. 2022, 2022. [CrossRef]
- Z. Wei et al., “An Increase in Solar Radiation in the Late Growth Period of Maize Alleviates the Adverse Effects of Climate Warming on the Growth and Development of Maize,” Agronomy, vol. 13, no. 5, May 2023. [CrossRef]
- Y. Li et al., “Weather Forecasting Using Ensemble of Spatial-Temporal Attention Network and Multi-Layer Perceptron,” Asia-Pacific J. Atmos. Sci., vol. 57, no. 3, pp. 533–546, 2021. [CrossRef]
- EAOS Data Analytics;" Soil Temperature for Optimal Crop Growth and Development",at https://eos.com › Blog.
Figure 1.
Map of the Republic of Rwanda with a blue arrow indicating area of study.
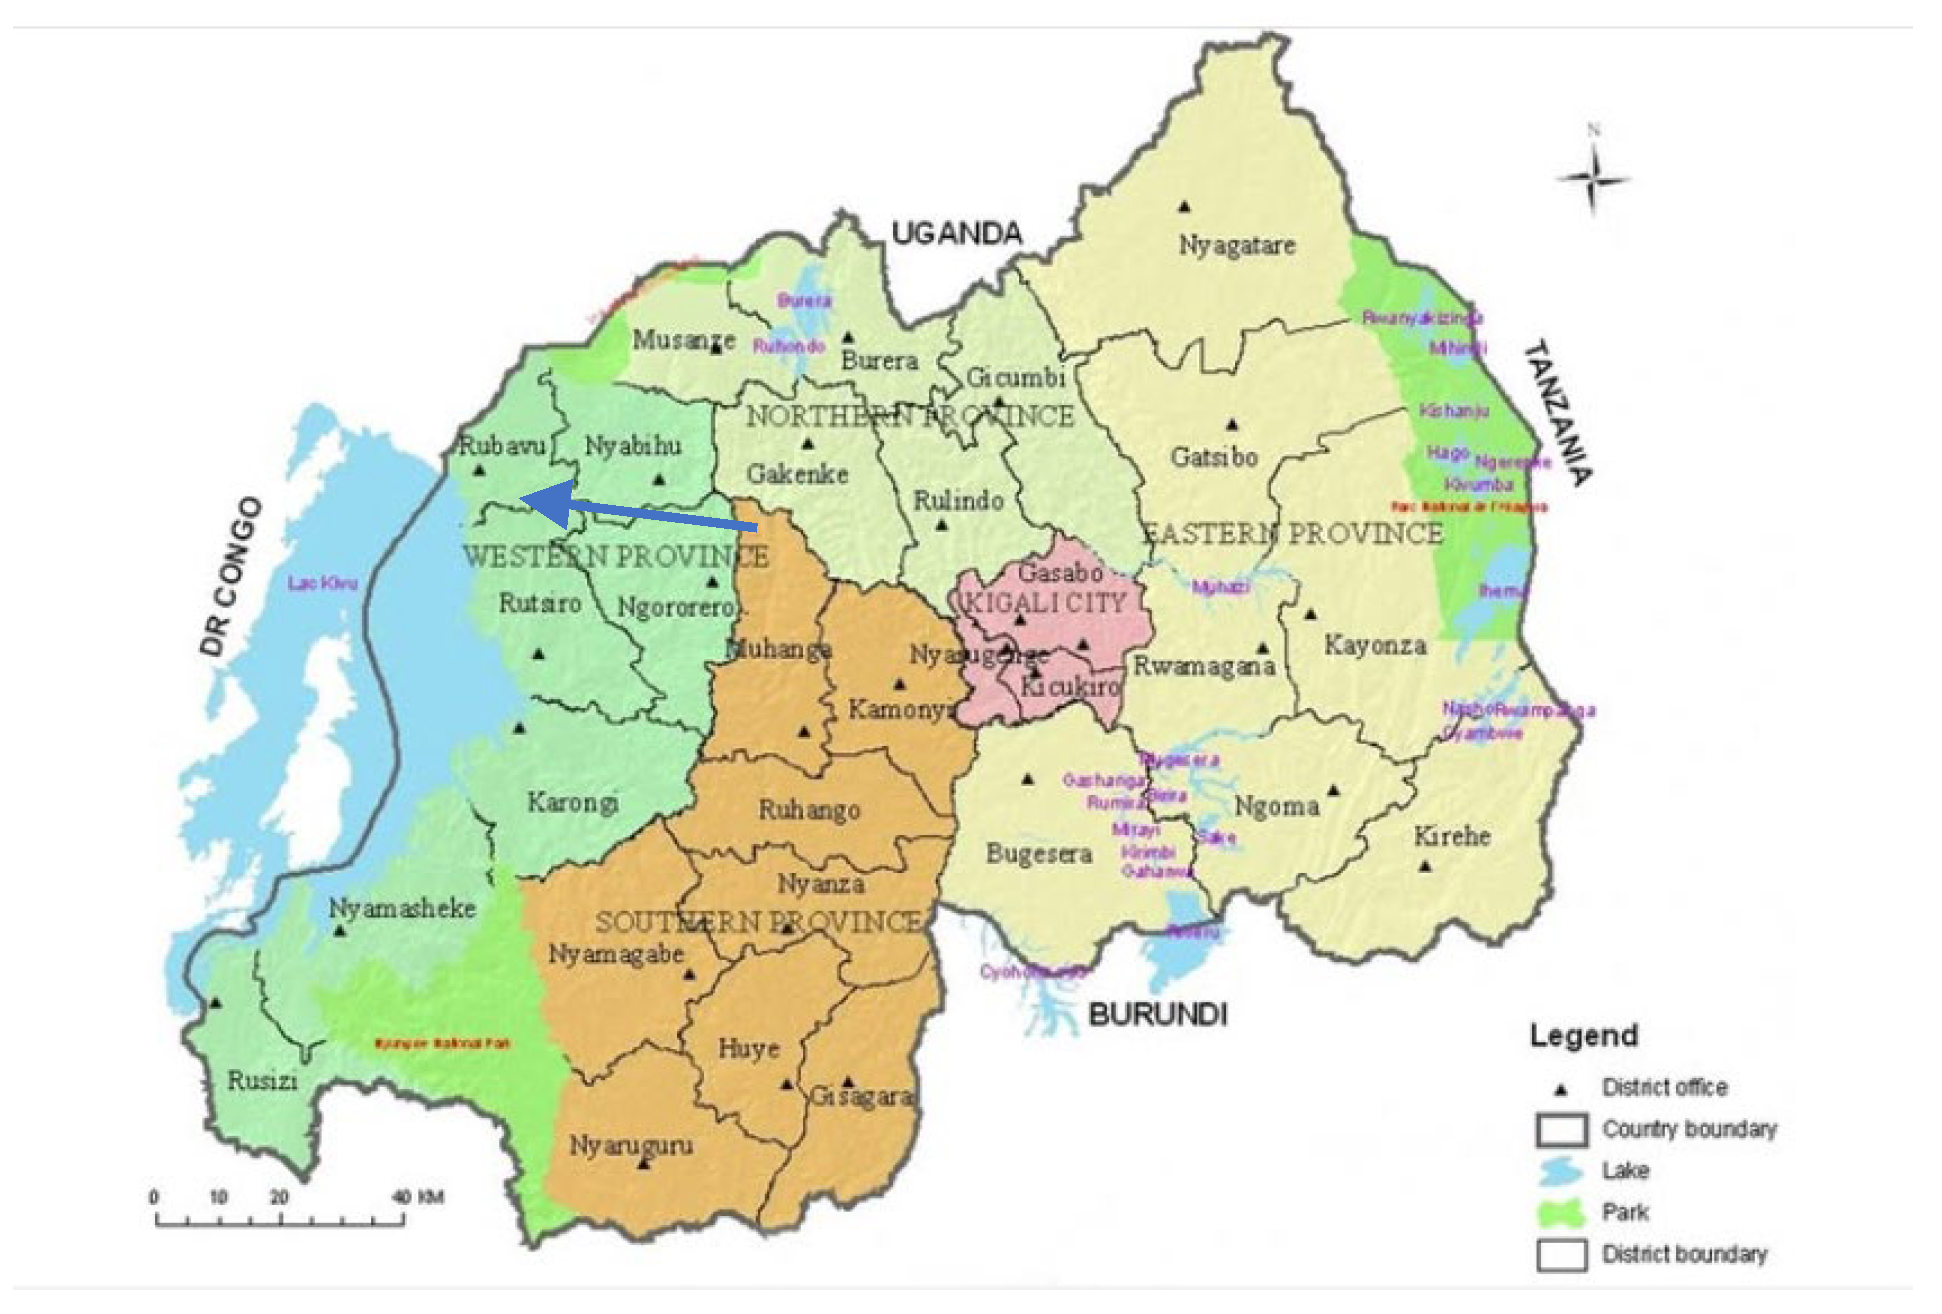
Figure 2.
Land zoning distribution of Kayonza district.
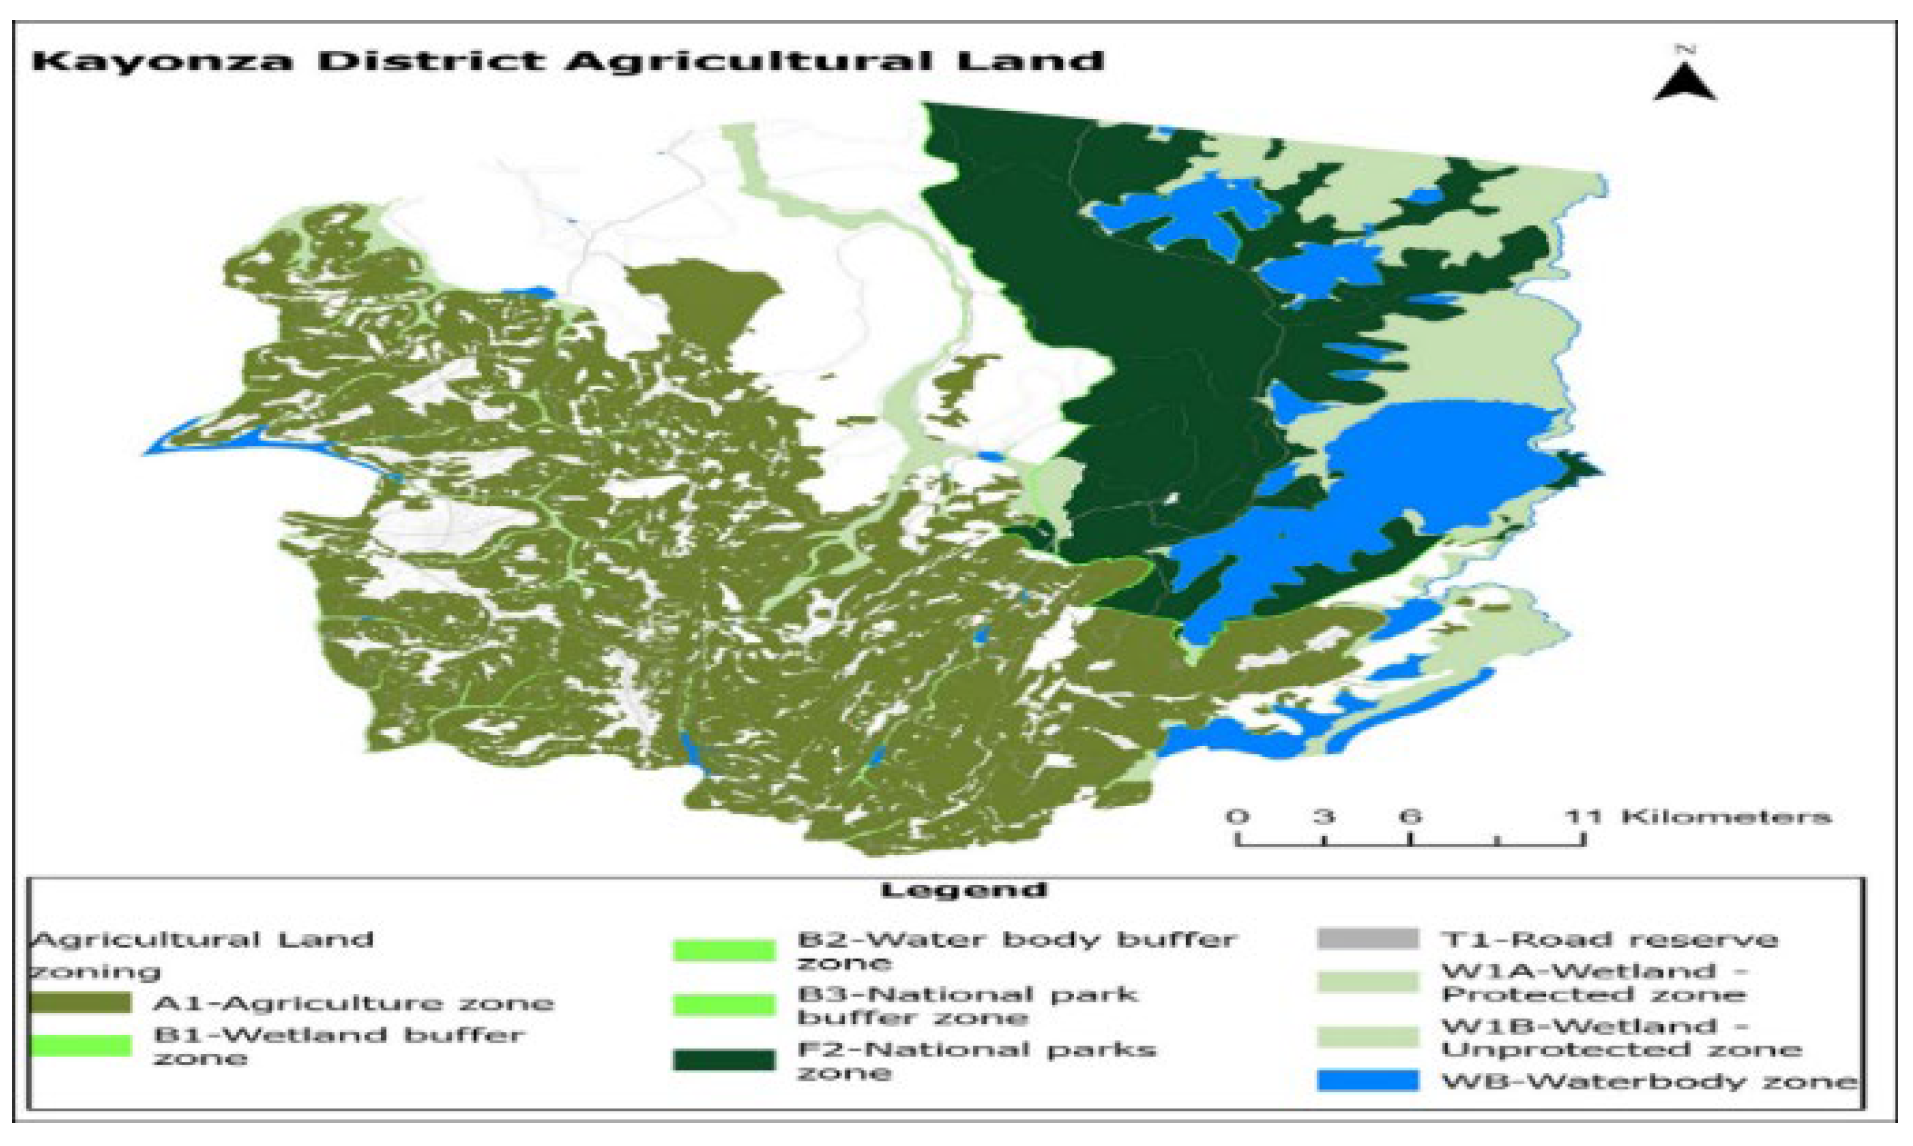
Figure 3.
Land use distribution of the district per Ha.
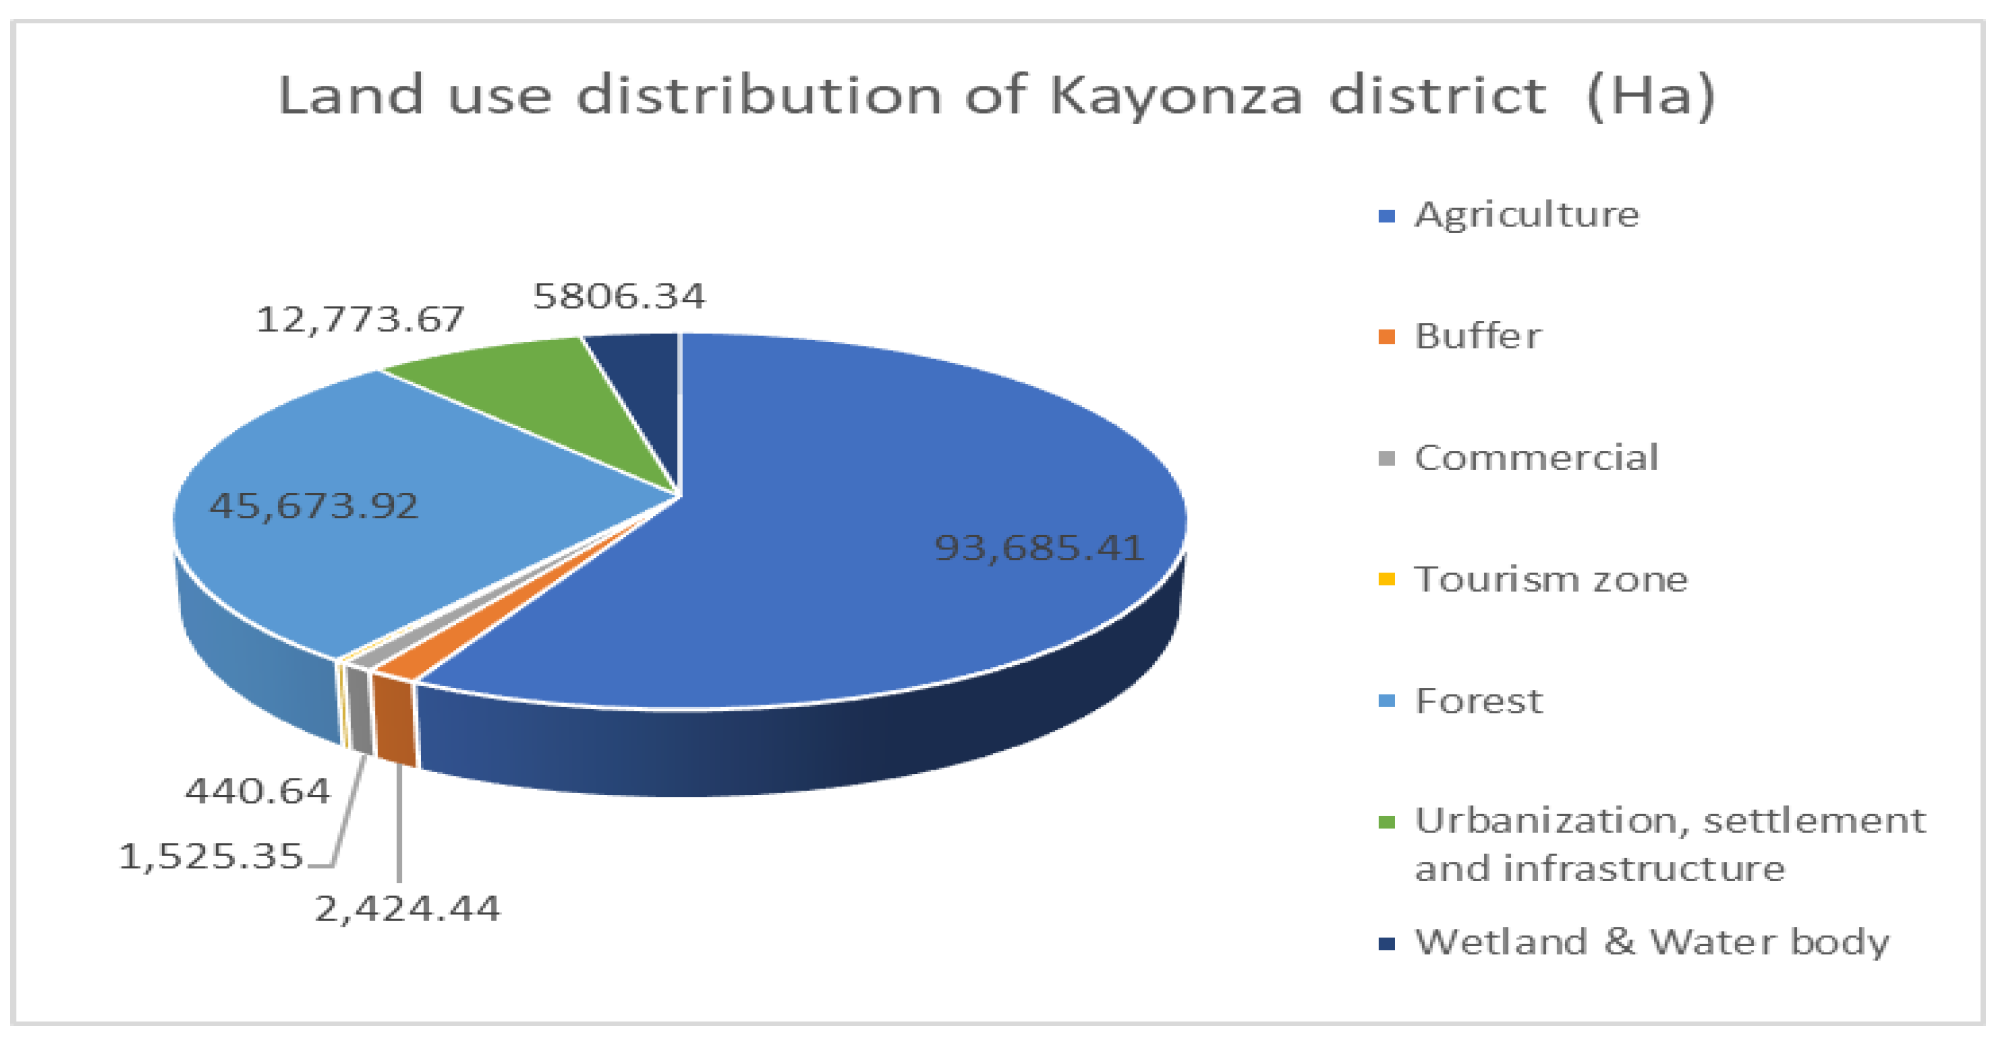
Figure 4.
Meteorological data collection process and data analysis.
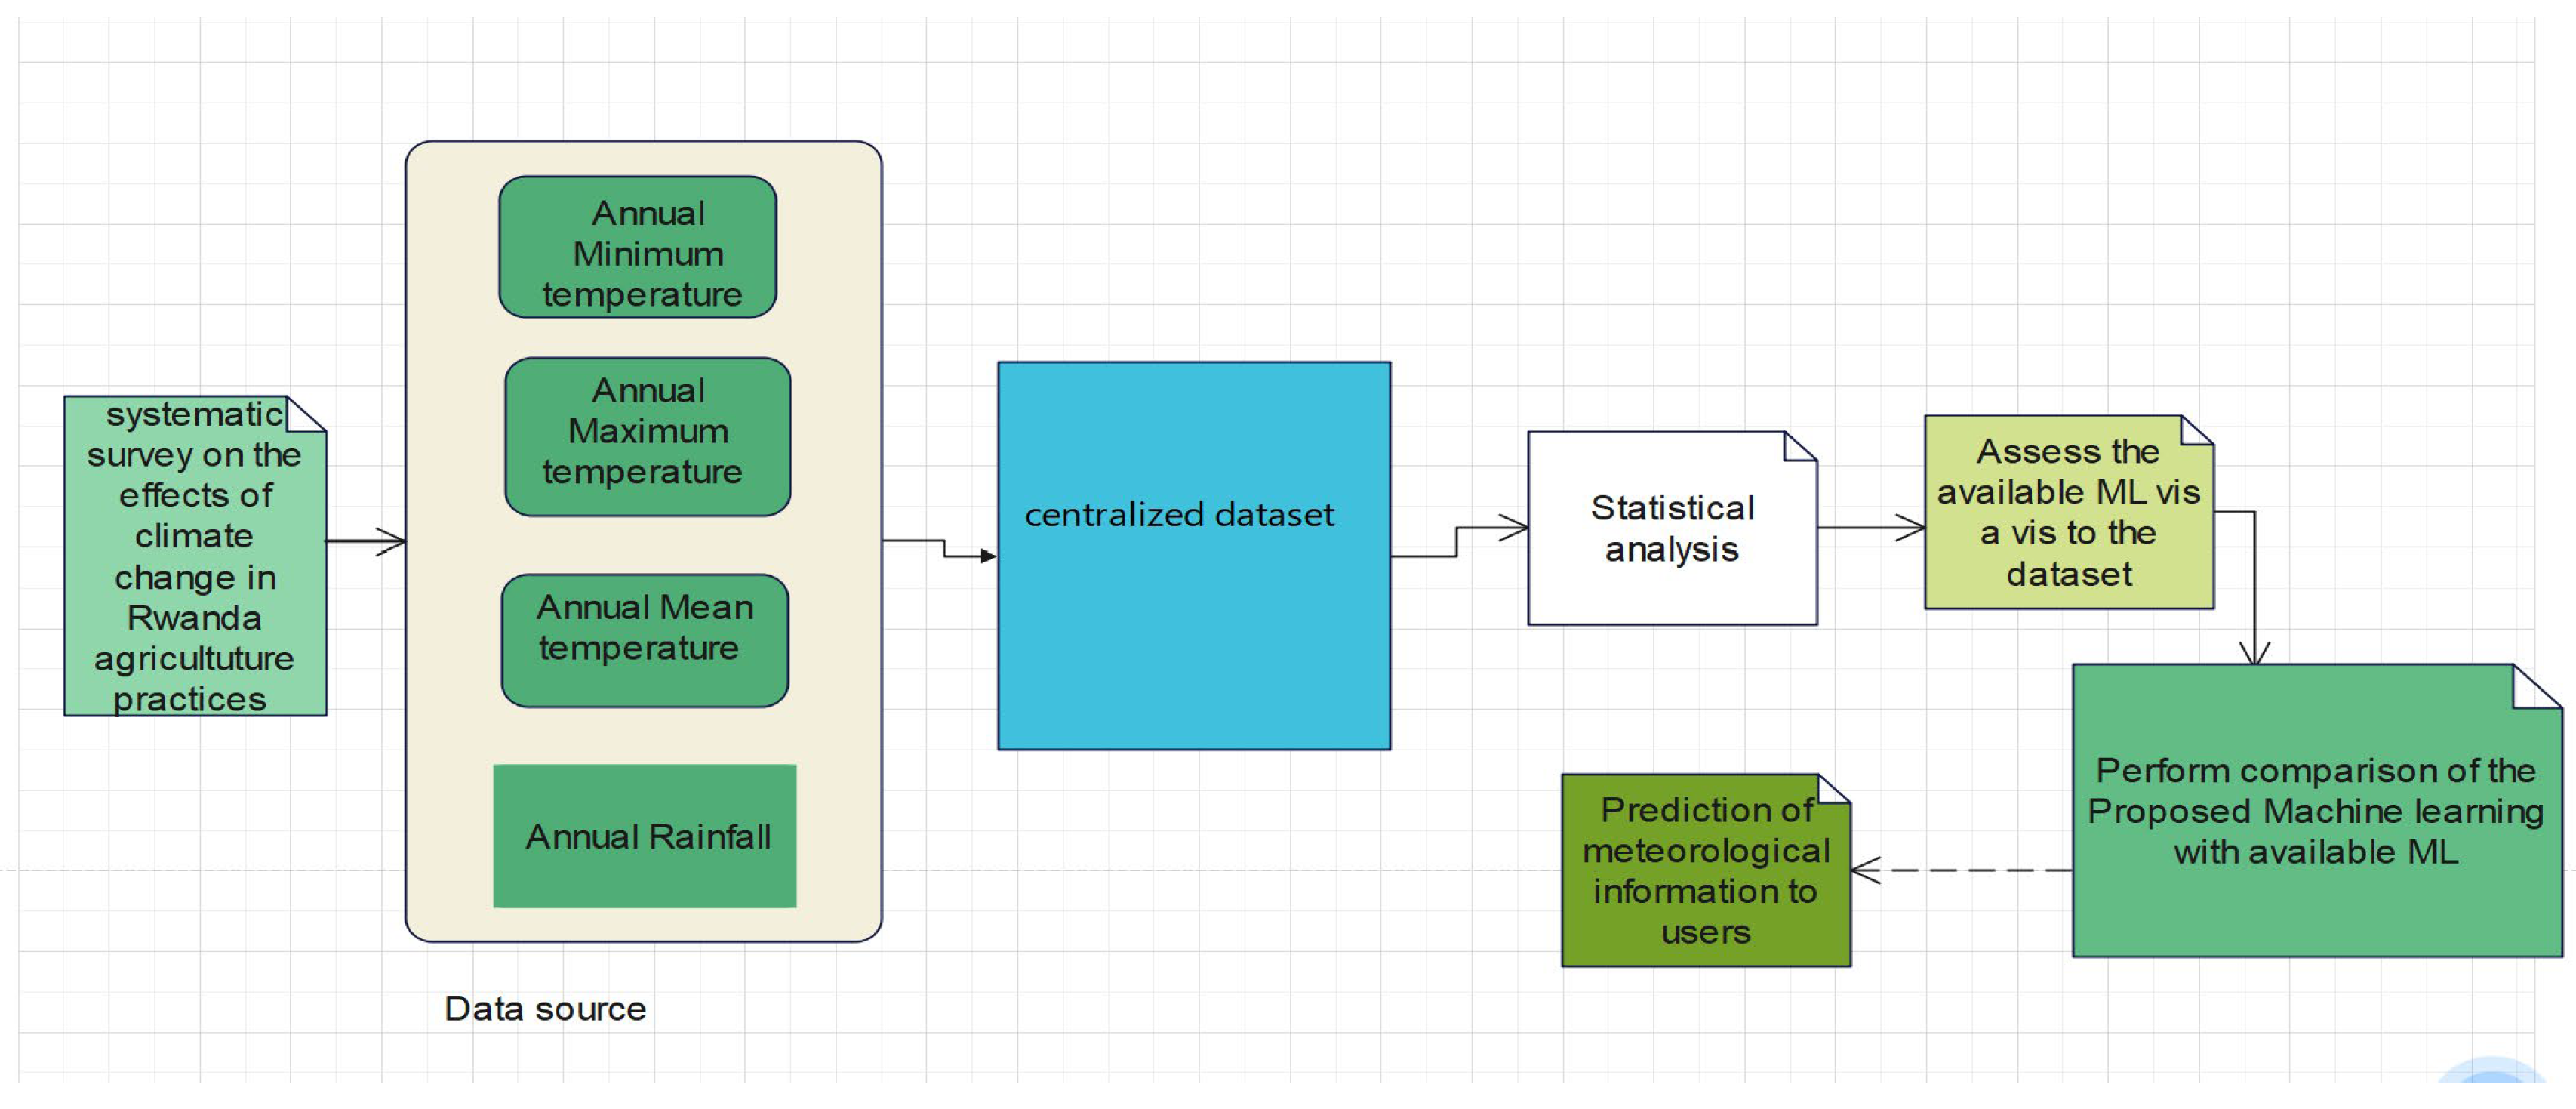
Figure 5.
Trend of daily rainfall in the area under study in Kayonza sector.
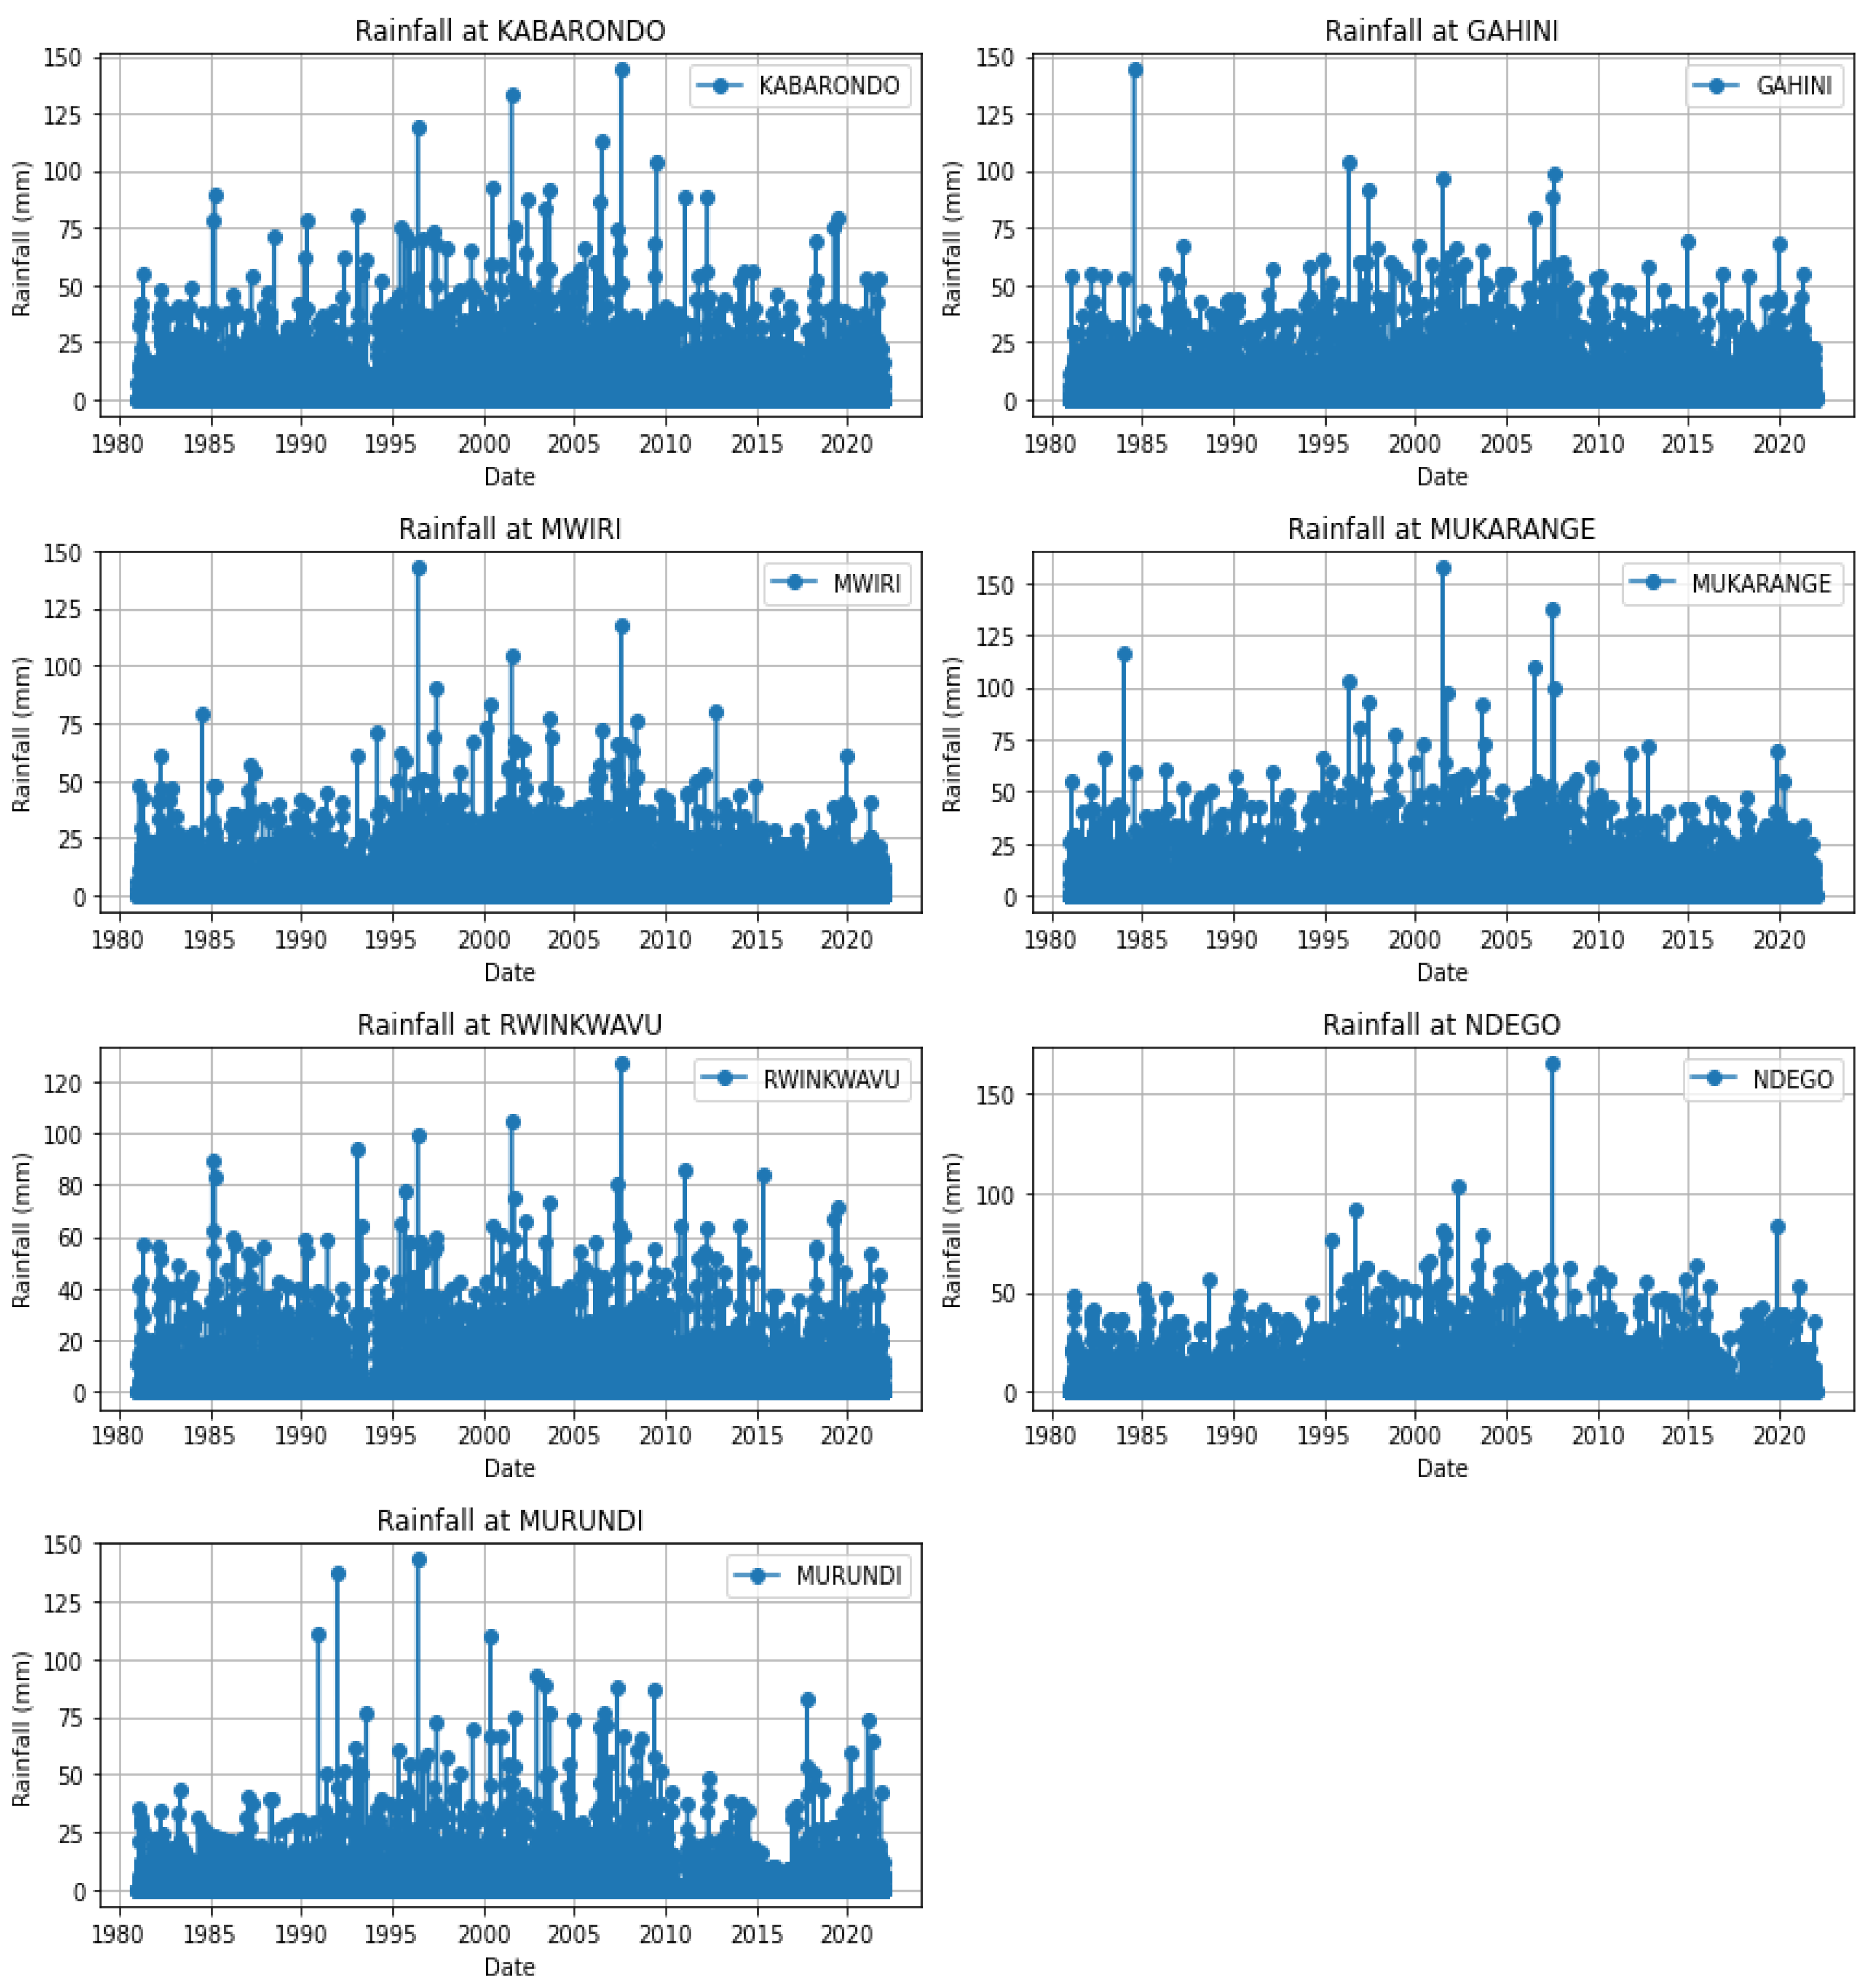
Figure 6.
Annual mean temperature.
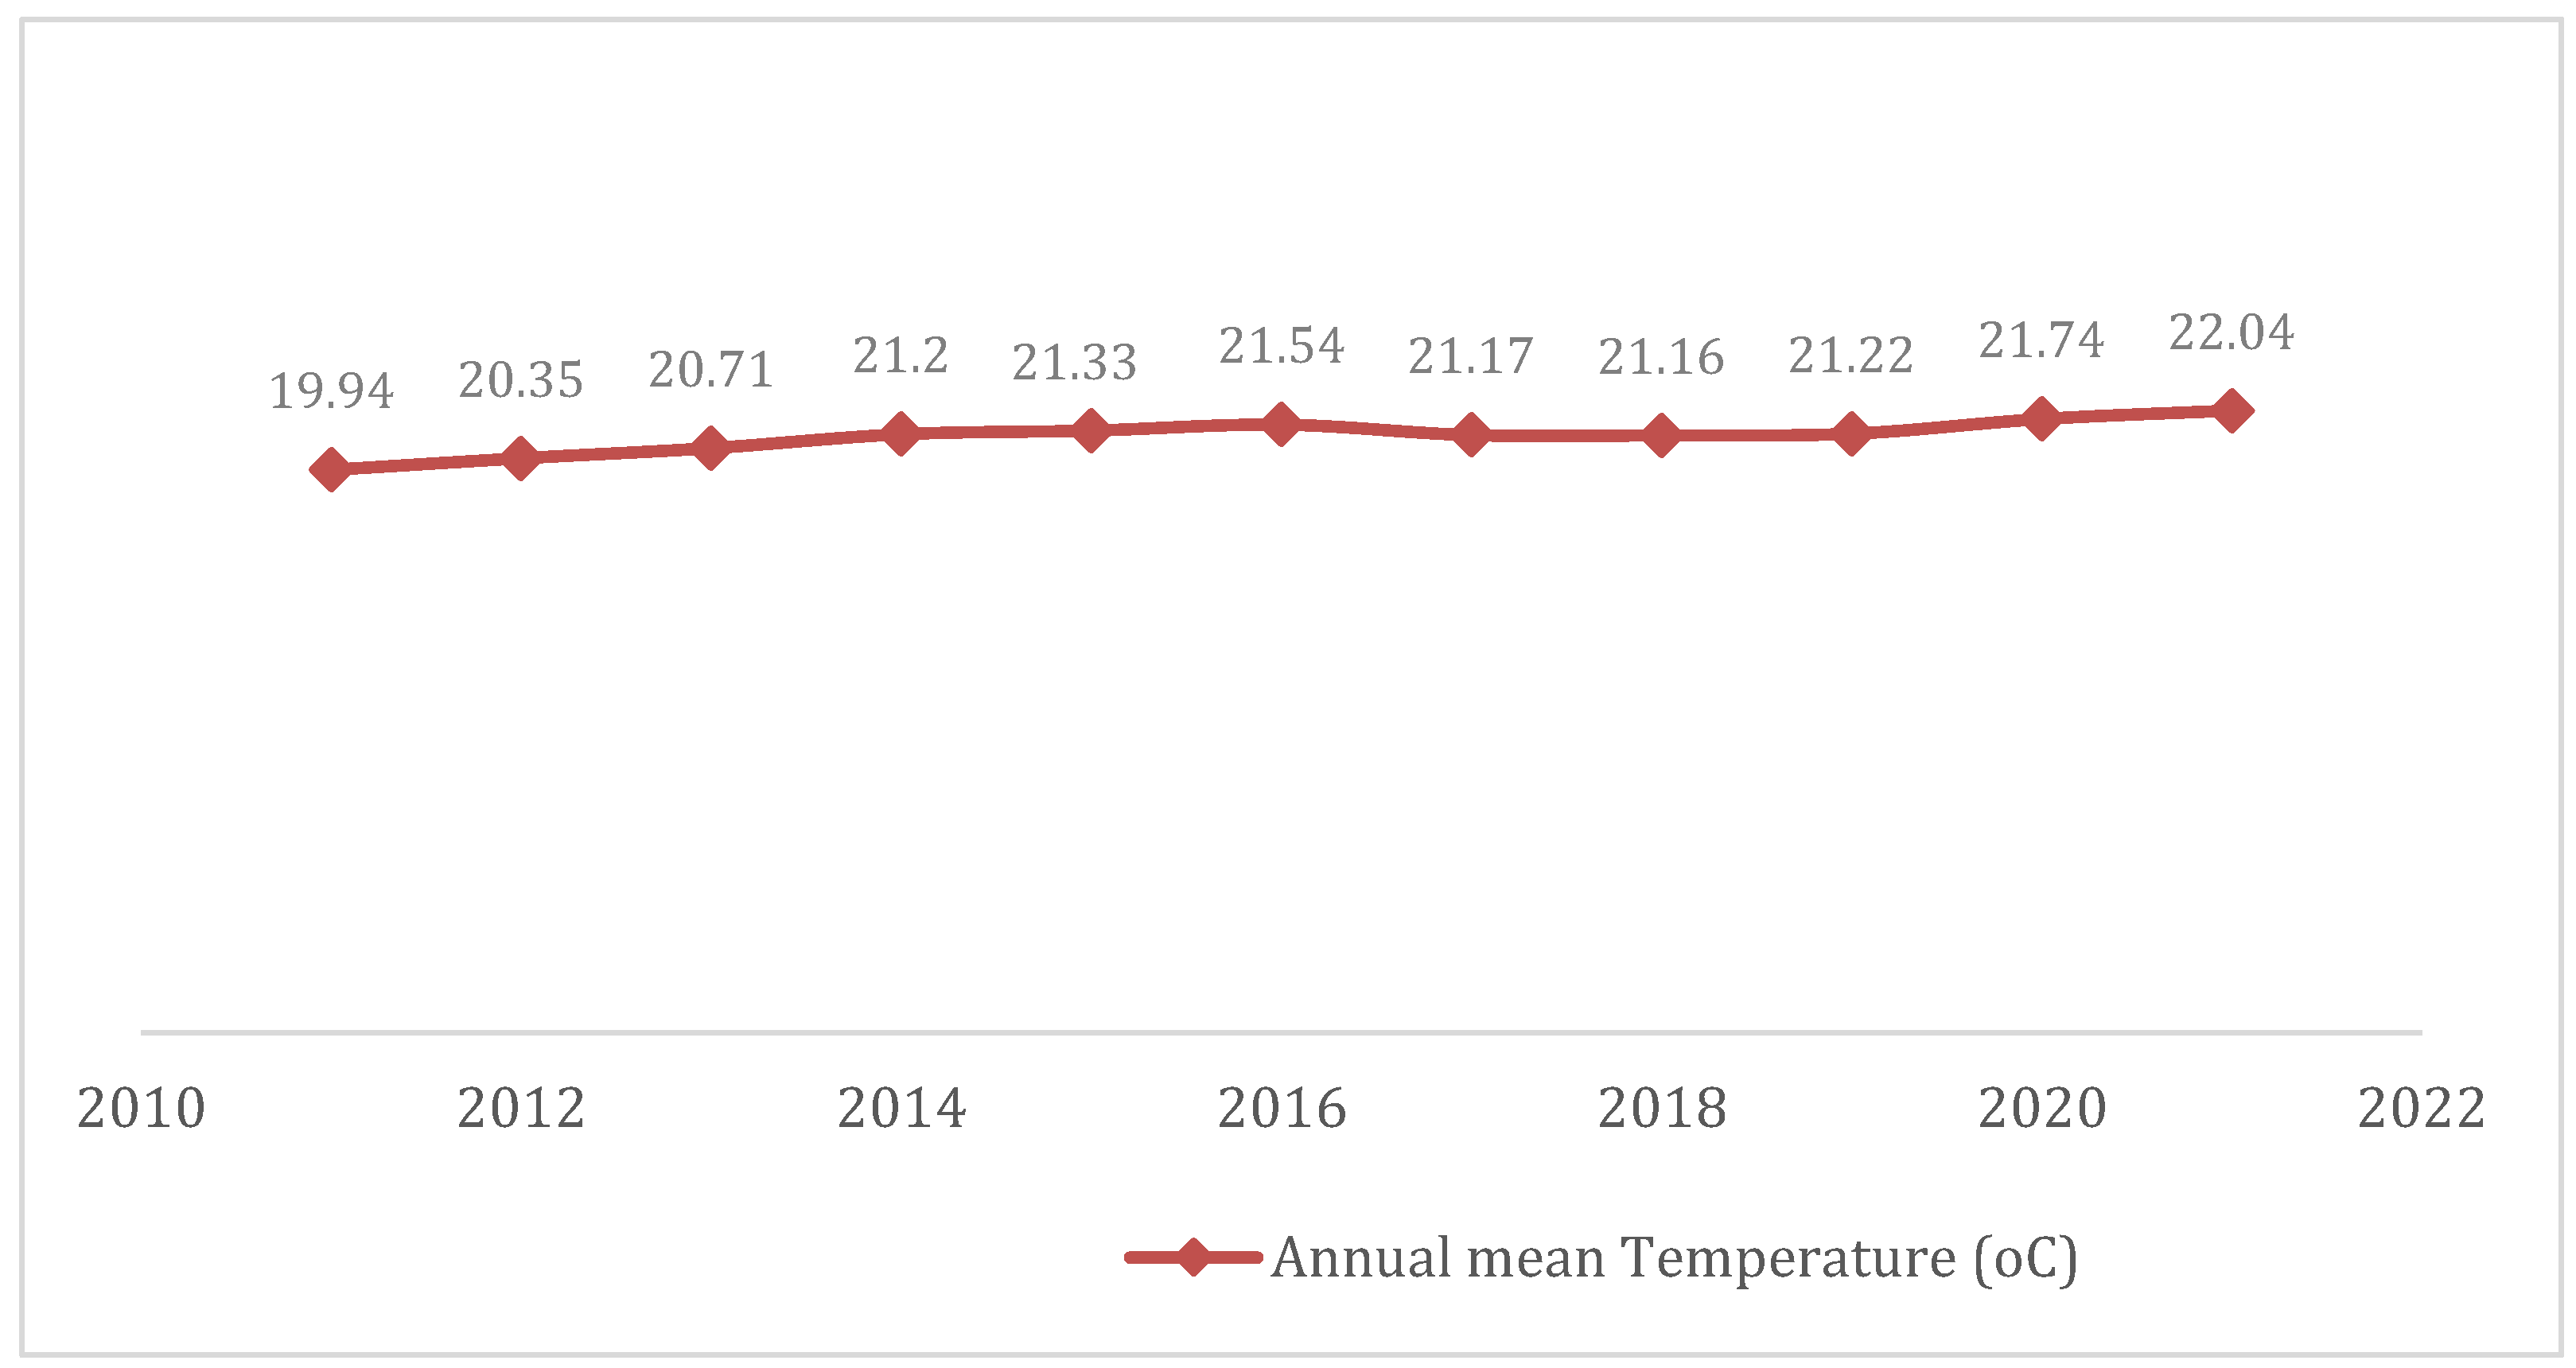
Figure 7.
Annual Soil temperature.
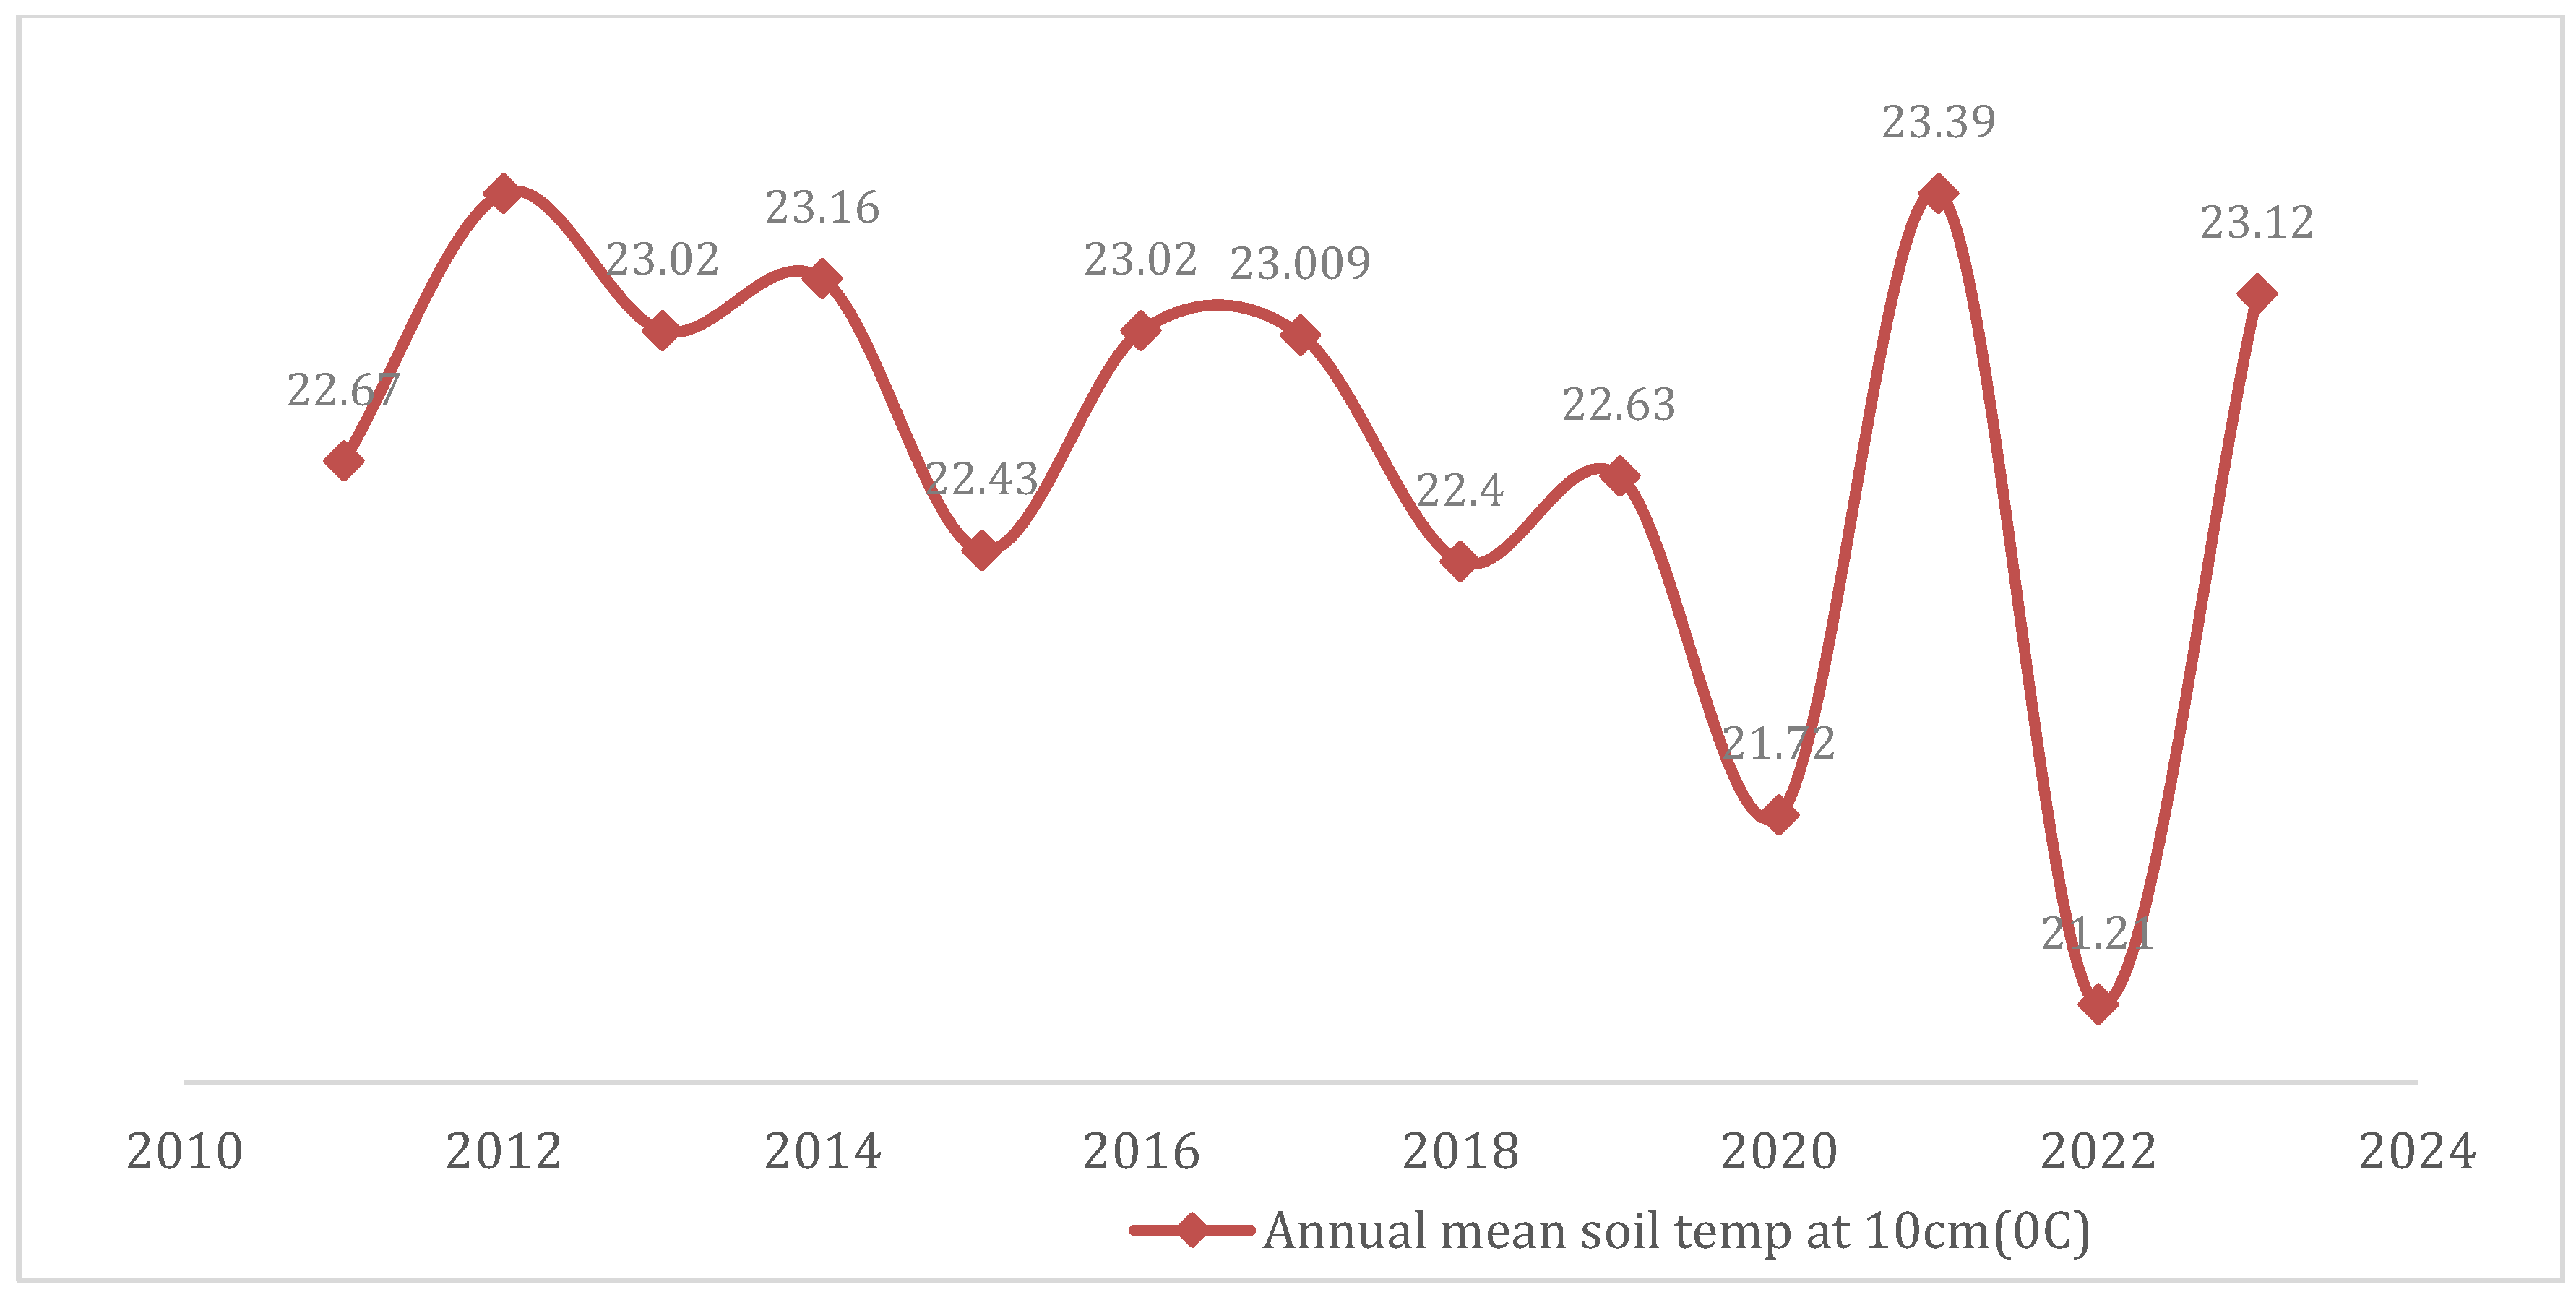
Figure 8.
Maize production of the district from 2011 to 2024.
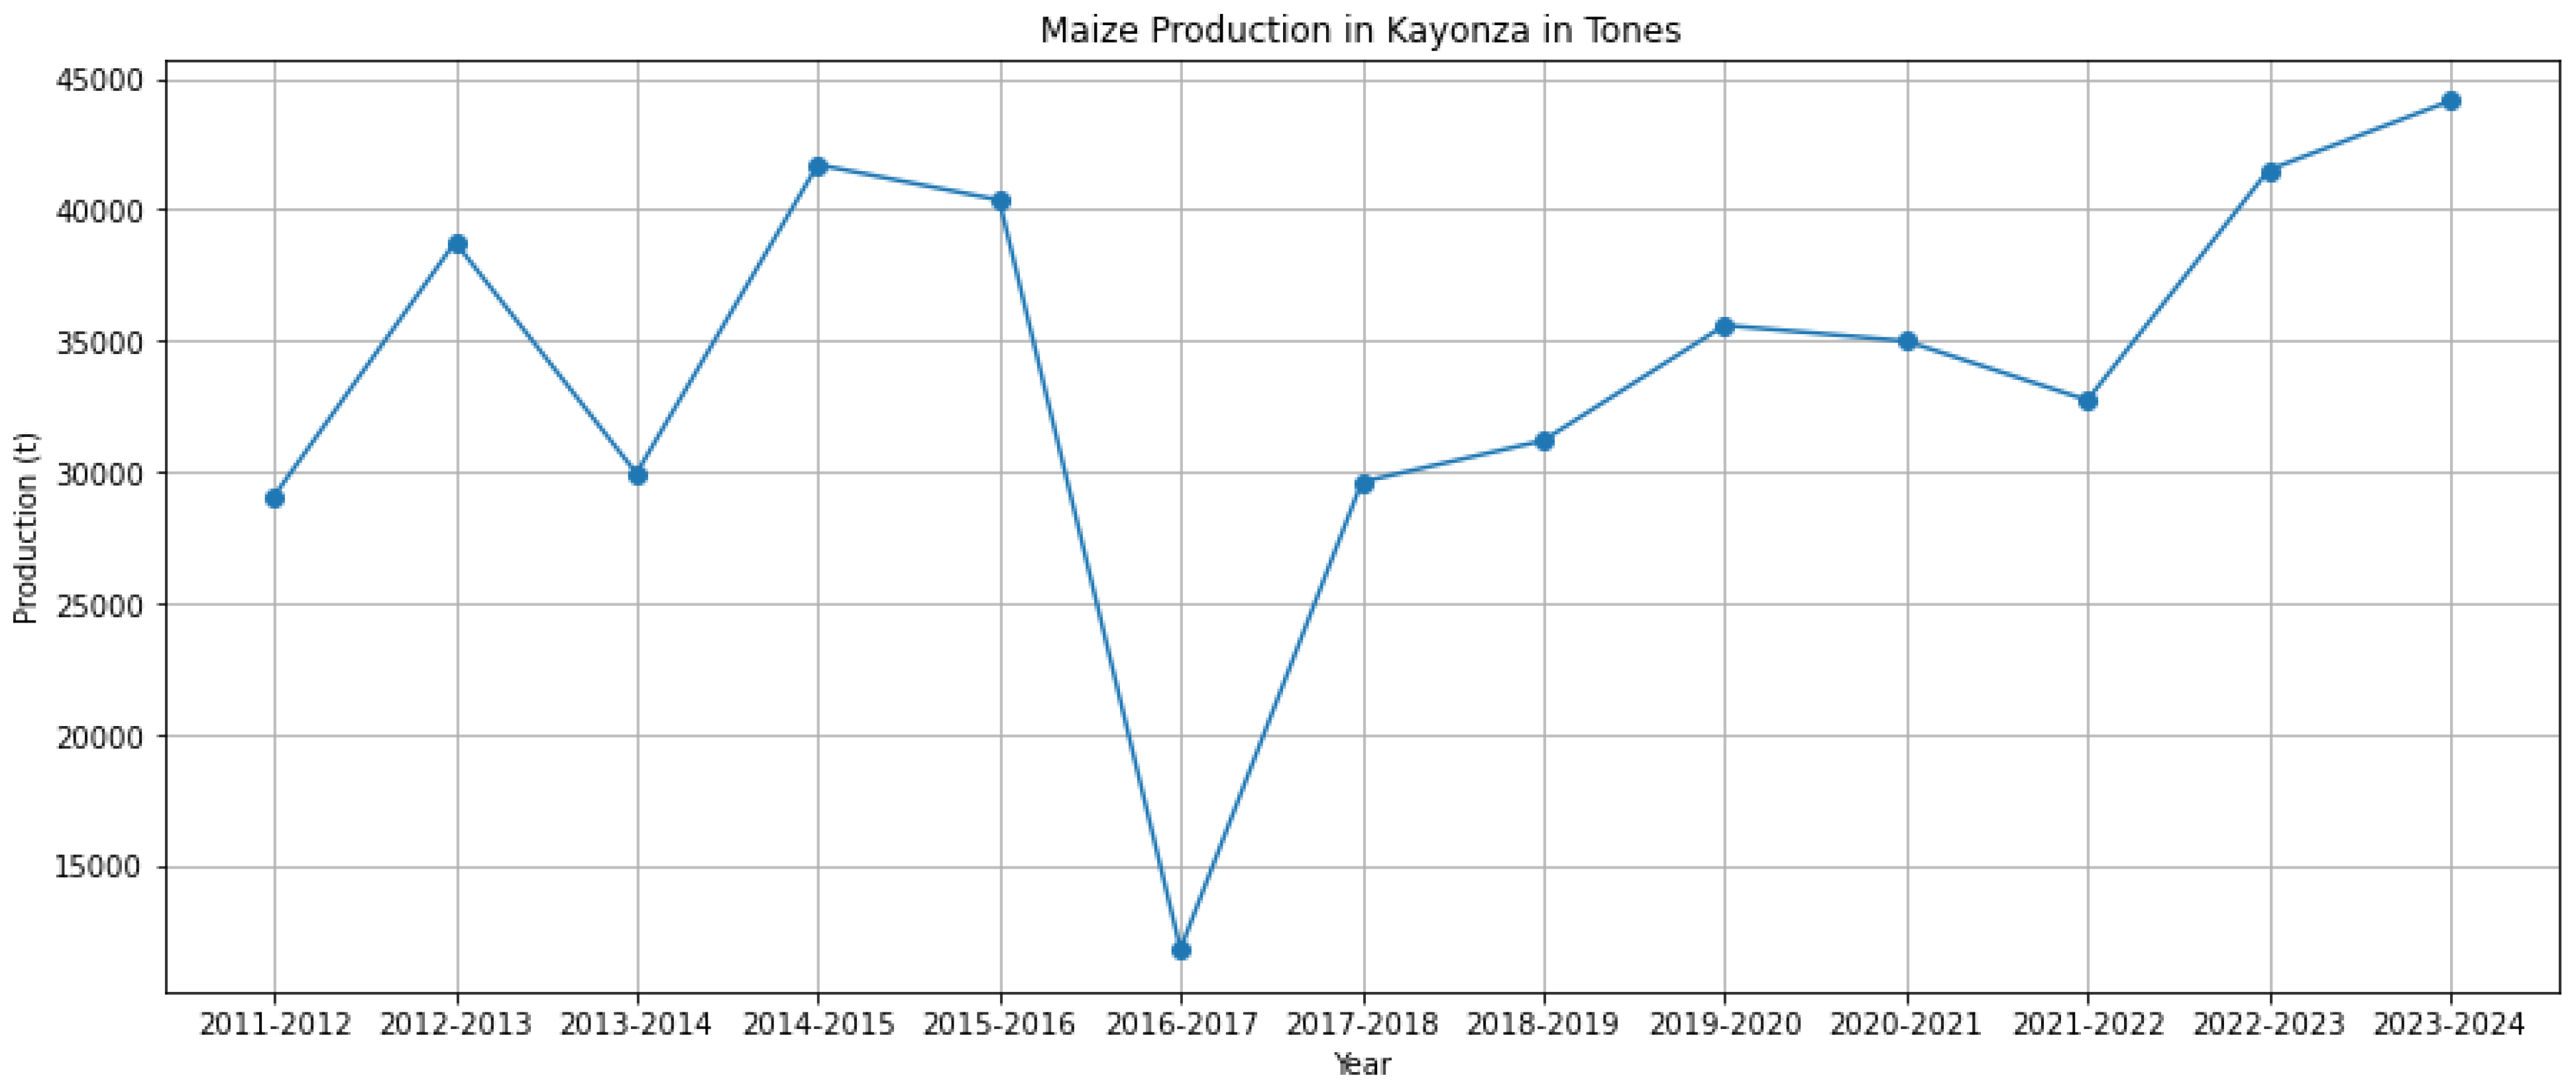
Figure 9.
Random forest model.
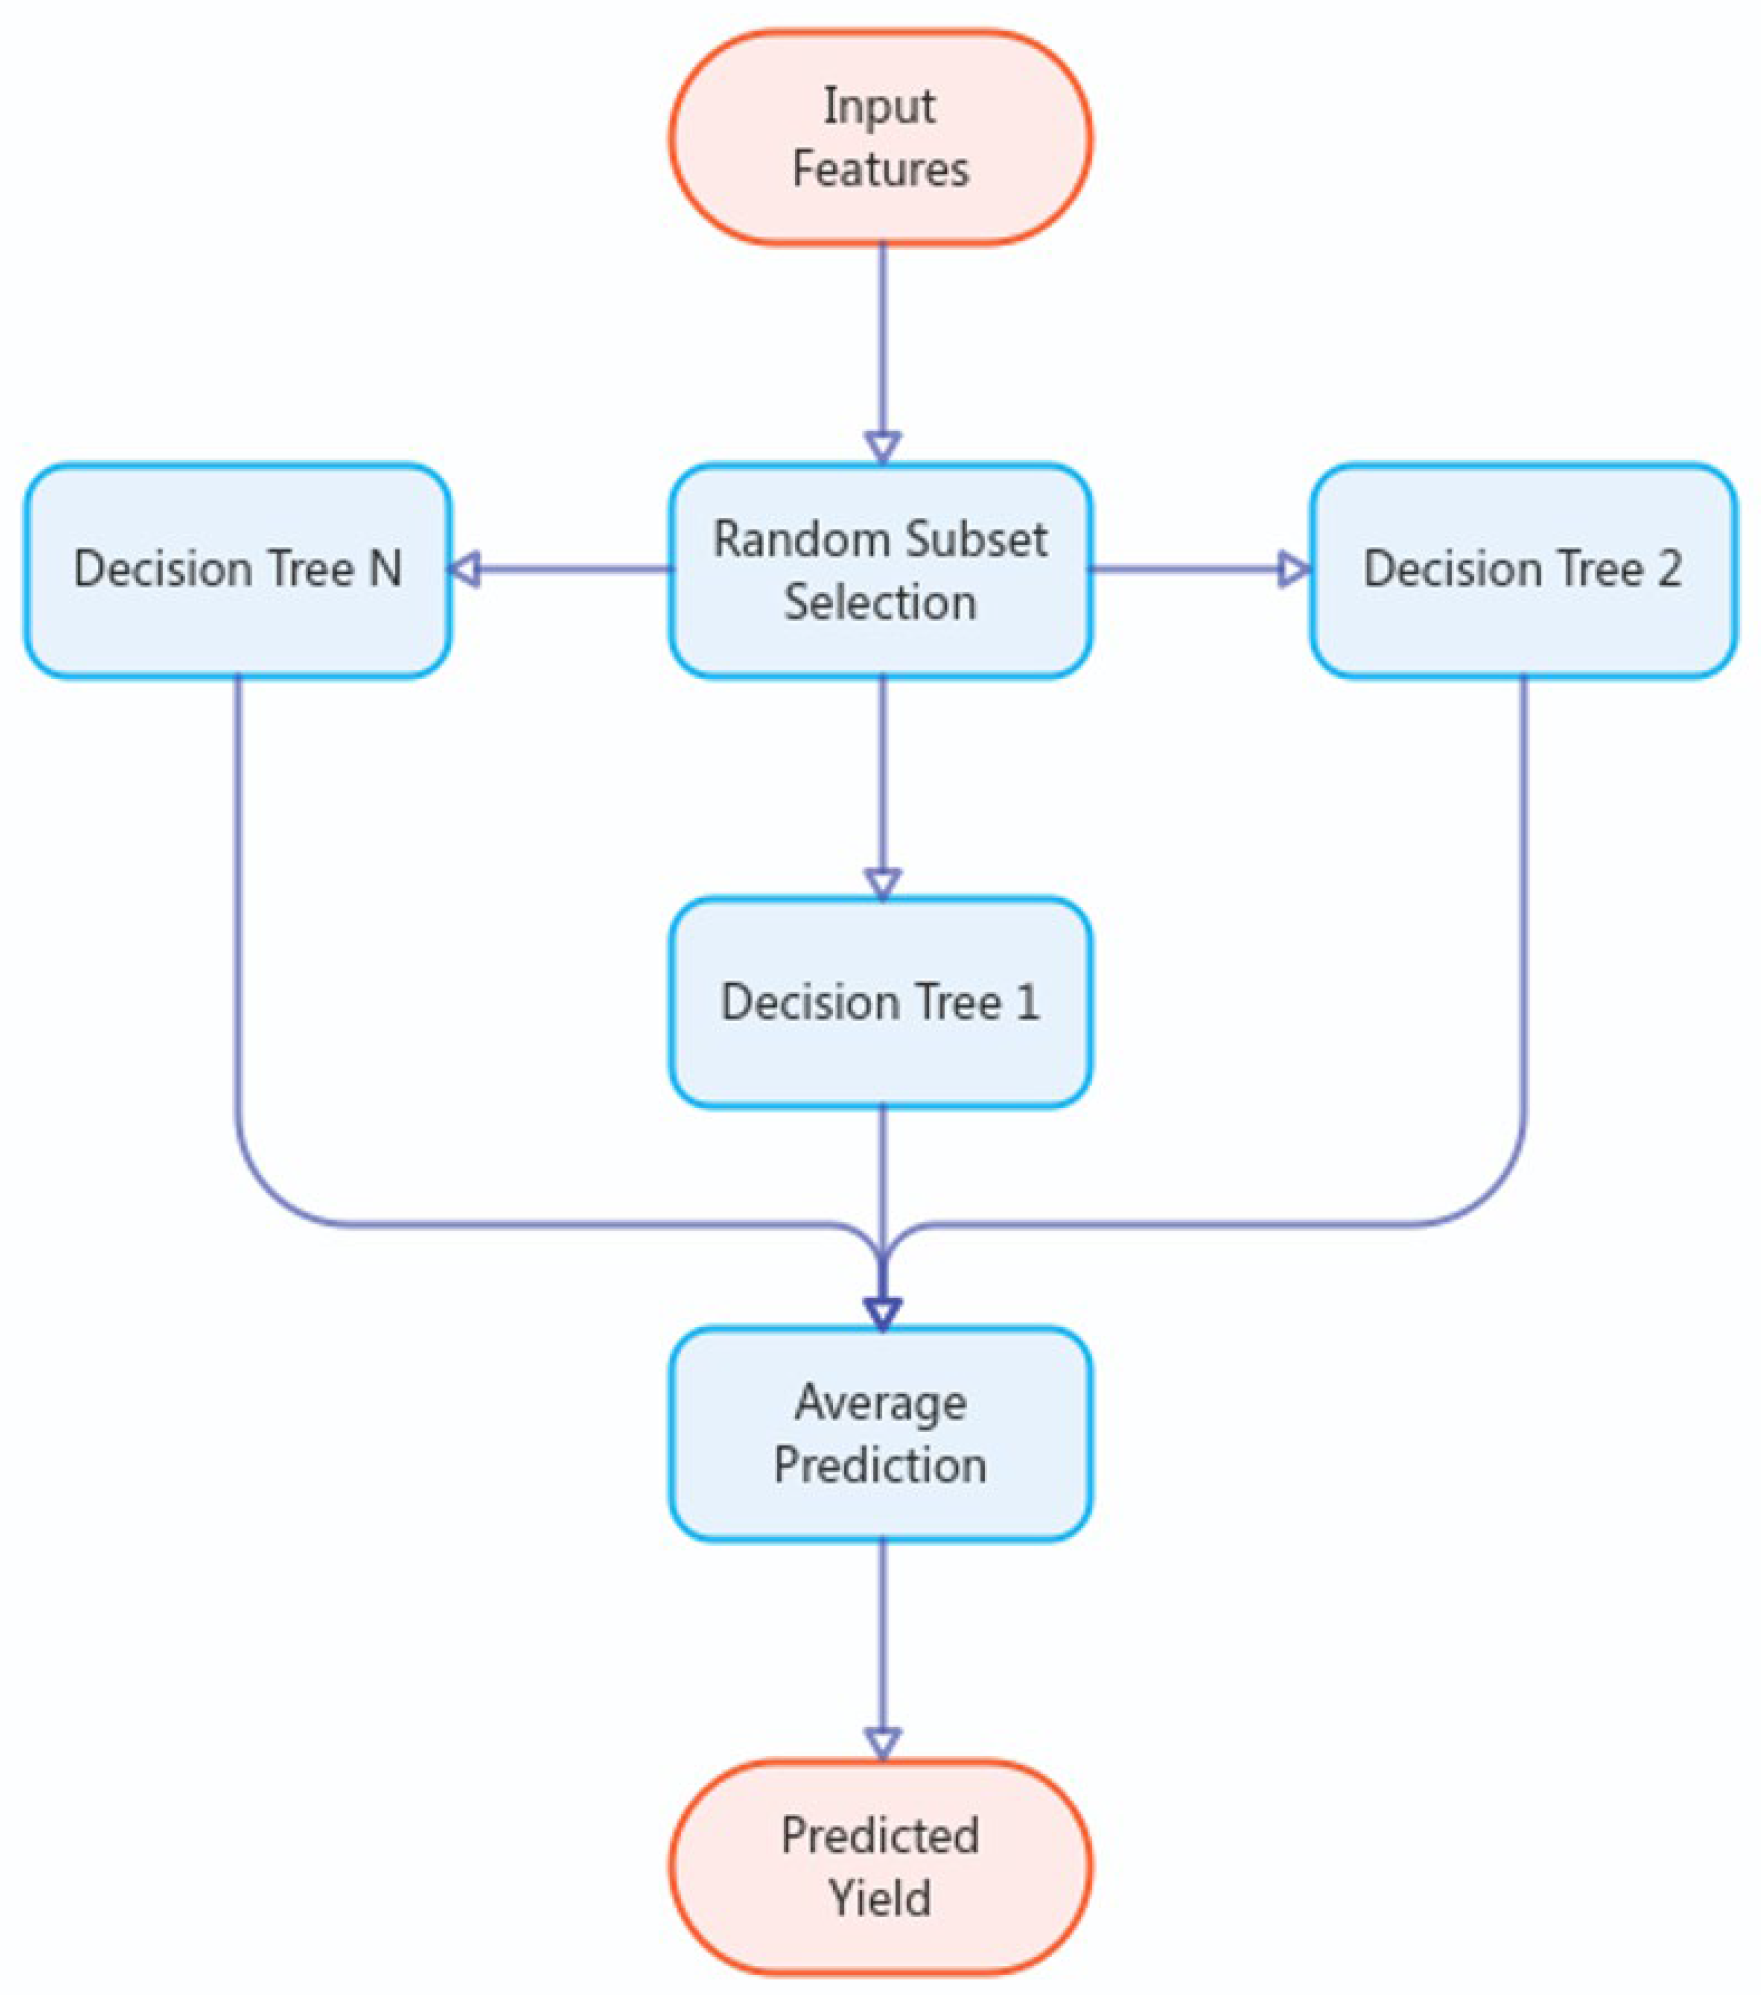
Figure 10.
Block diagram of XBoost gradient.
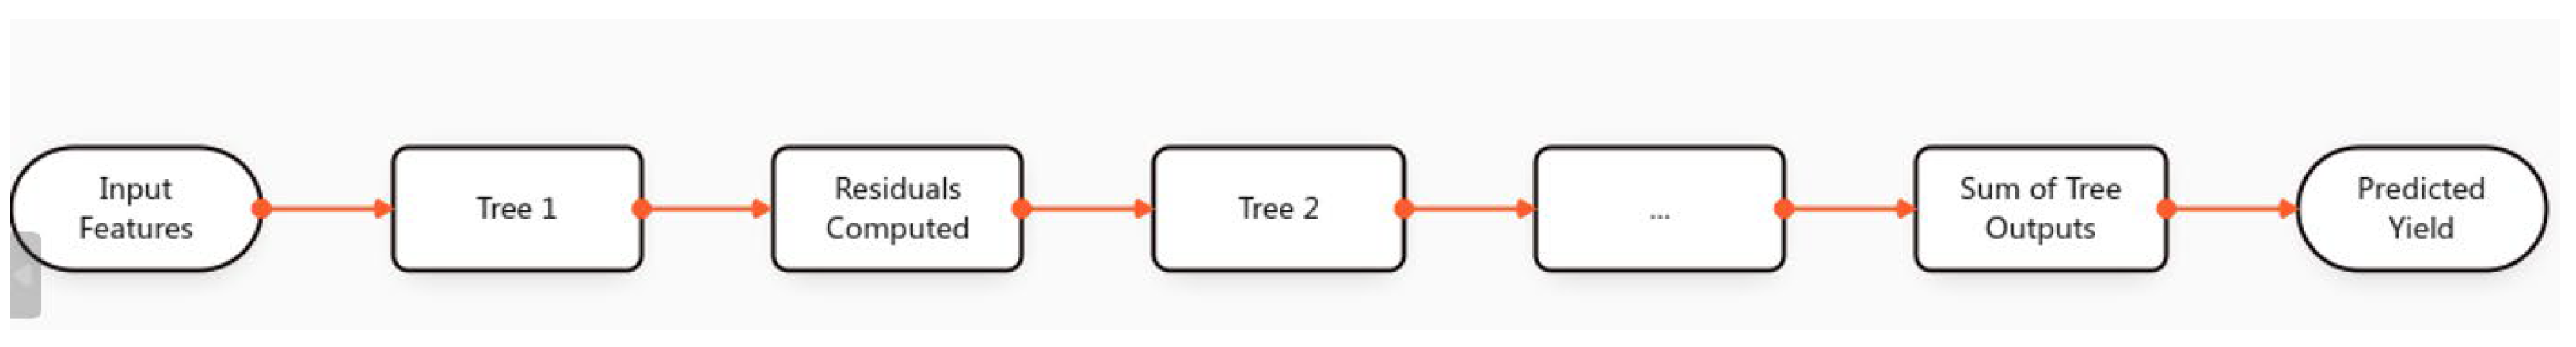
Figure 11.
SVM block diagram concept.
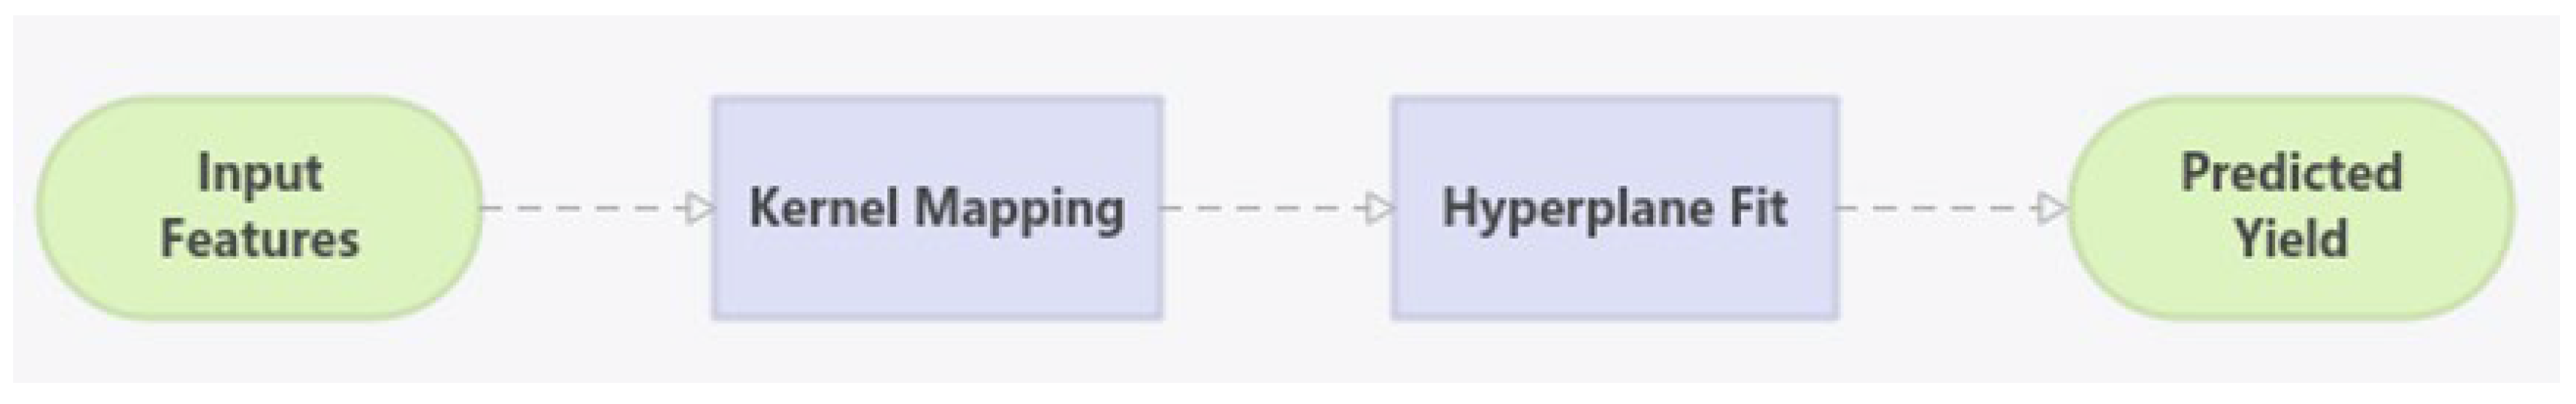
Figure 12.
LASSO diagram concept.
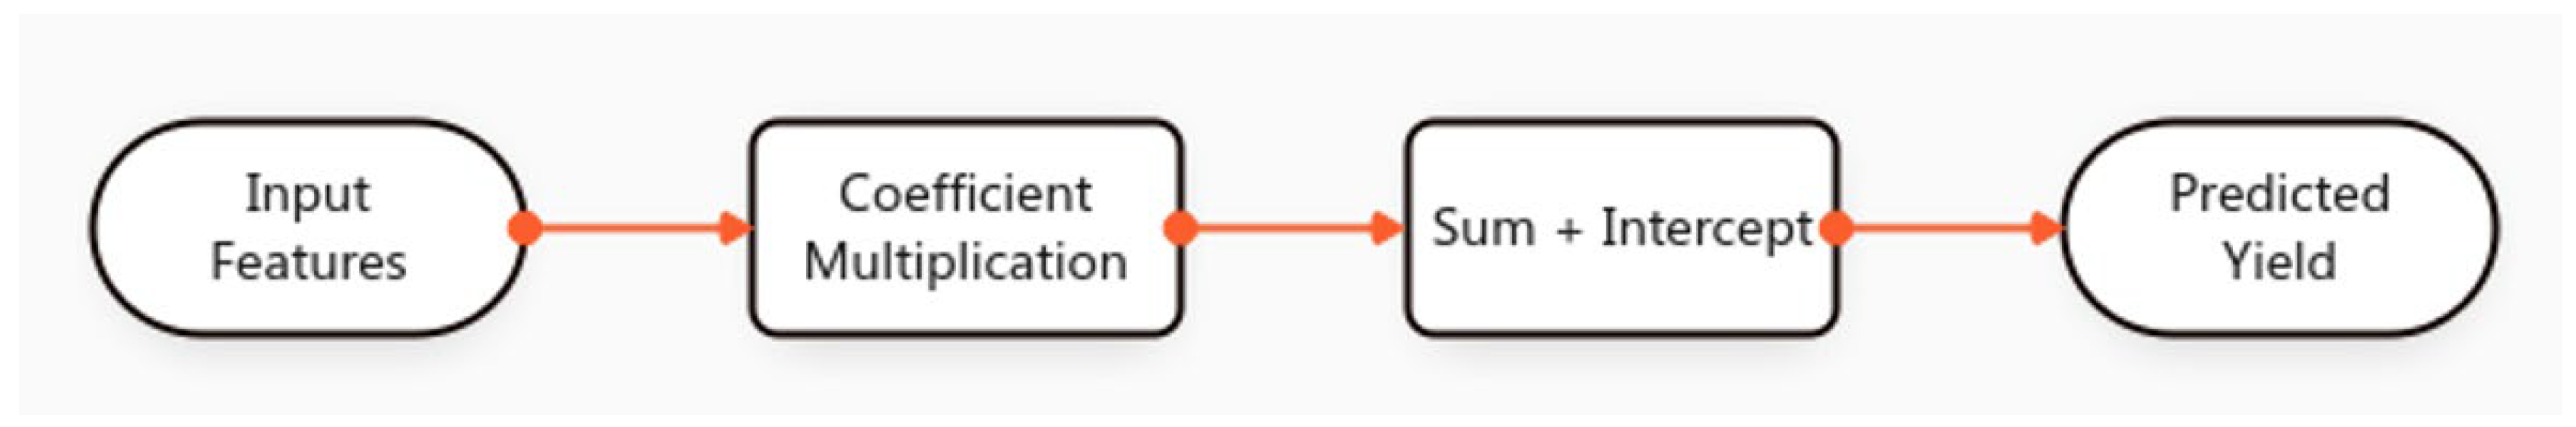

Table 1.
Model performance.
| Model | R² | MAE (t/ha) | RMSE (t/ha) |
| Random Forest | 0.957 | 1.018 | 1.279 |
| SVM | 0.955 | 1.047 | 1.311 |
| XGBoost | 0.953 | 1.058 | 1.334 |
| LASSO | 0.256 | 4.026 | 5.302 |
Table 2.
Proportion of features importance.
| Feature | Importance |
| annual_mean_temp | 0.276 |
| annual_max_temp | 0.126 |
| annual_min_temp | 0.151 |
| annual_rainfall | 0.444 |
| soil_temp | 0.003 |
Table 3.
contribution of features importance of XGBoost Model.
| Feature | Importance |
| annual_mean_temp | 0.299 |
| annual_max_temp | 0.155 |
| annual_min_temp | 0.116 |
| annual_rainfall | 0.388 |
| soil_temp | 0.043 |
Disclaimer/Publisher’s Note: The statements, opinions and data contained in all publications are solely those of the individual author(s) and contributor(s) and not of MDPI and/or the editor(s). MDPI and/or the editor(s) disclaim responsibility for any injury to people or property resulting from any ideas, methods, instructions or products referred to in the content. |
© 2026 by the authors. Licensee MDPI, Basel, Switzerland. This article is an open access article distributed under the terms and conditions of the Creative Commons Attribution (CC BY) license.
Copyright: This open access article is published under a Creative Commons CC BY 4.0 license, which permit the free download, distribution, and reuse, provided that the author and preprint are cited in any reuse.


