Submitted:
22 January 2026
Posted:
26 January 2026
You are already at the latest version
Abstract
For effectively assessing bloods, red blood cells (RBCs) aggregation and blood viscosity have been measured in microfluidic environments. However, the previous methods still face several challenges (dead-volume loss, RBCs sedimentation, hematocrit-sensitive blood velocity, and precise flow-rate control). In this study, a novel method is suggested to resolve several issues. Air cavity (Vair = 250 μL) is secured above blood column (at least 100 μL) loaded into a driving syringe. To probe RBCs aggregation and blood viscosity, a microfluidic chip consists of a main channel (γ > 1000 s-1) and an aggregation channel (γ < 50 s-1). Blood is supplied into a microfluidic chip with two-step blood delivery (i.e., air-compression for RBCs aggregation, and syringe pump for blood viscosity). RBCs aggregation index and blood viscosity are obtained from time-lapse image intensity and blood flow-rate in both channels. As performance demonstrations, first, measurement accuracy of fluid viscosity is validated with glycerin solution. Then, the present method is adopted to probe difference in hematocrit and dextran concentration. At last, the proposed method is employed to detect heat-shocked RBCs (45 ~ 50 °C for 40 min). In conclusion, the proposed method has the ability to accurately measure substantial changes in RBCs or blood medium.
Keywords:
blood flow-dependent RBCs aggregation
; blood viscosity
; two- step blood delivery
; microfluidic chip
; blood velocity fields
; and blood image rate
1. Introduction
Blood as complex fluid is composed of cell (i.e., red blood cell [RBC], white blood cell, and platelet) and plasma. In particular, intrinsic properties of RBCs (i.e., membrane viscoelasticity, cytosol viscosity, and morphological parameters) have a strong impact on dynamic blood flows[1,2,3,4]. Plasma protein also involves in RBC-to-RBC interaction. Several hemorheological properties, including, blood viscosity[5,6,7,8,9], RBCs aggregation[10,11,12,13,14,15,16], RBC deformability[17,18,19,20,21,22,23,24,25,26,27], and sedimentation rate[28,29,30] have been suggested for effectively monitoring physiological alternations in patient blood (i.e., cardiovascular disease[5,6], acute myocardial infarction[11], stroke[12,13], sickle cell anemia[17,18,19,22,31,32,33], and malaria[20]). Among them, under continuous blood flow, blood viscosity has been determined by several factors, such as, hematocrit[34], plasma proteins, RBC aggregation at low shears, and RBC deformability at high shears. On the other hand, at stasis or extremely lower blood-flow, RBCs aggregation has been employed to investigate RBC–to-RBC interaction which has been strongly influenced by plasma proteins and RBC intrinsic properties.
When compared with conventional methods (i.e., a cone-and-plate viscometer, and an ektacytometry[17,18,19]), a microfluidic chip has ability to probe hemorheological properties with small volume, to control shearing blood-flow precisely, and to provide microvascular-mimicked environments[1,2,16,26,29,31,35,36,37,38]. Thus, it provides rapid, quantitative, and reproducible multi-parameter readouts[3,22,39] (i.e., blood viscosity[40,41], RBCs aggregation, RBC deformability[24,42], RBC sedimentation rate[30,43]).
First, according to the Hagen-Poiseuille law (i.e., pressure difference = fluidic resistance × flow rate)[44], blood viscosity could be estimated by quantifying pressure difference or blood flow-rate. Under constant flow-rate condition, blood viscosity could be assessed by monitoring parallel-stream interface in single channel[45], microflow compartments in multiple channels[8,46], flow-switching in a microfluidic bridge channel[47], and flow-reversal time in a closed channel[29]. Interface-front tracking is used to estimate blood viscosity under controlled pressure[48,49,50,51,52,53,54] or capillary force[7,40,55,56]. Blood viscosity could be assessed by a microstructure deflection[57], a resonant-frequency shift[58,59], and droplet kinetics[60].
Second, after aggregated RBCs are fully disaggregated by an external agitator, RBC aggregation could be estimated by analyzing syllectogram. According to the previous studies[15,61,62,63,64,65,66,67,68], RBC aggregation initiates below = 10 or 50 s-1. Novel methodologies related to RBC-to-RBC disaggregation agitator (i.e., motor[69,70], pump[15,71], bubble-motion[12,67], and pinch valve[72]) and RBC-to-RBC aggregation quantification (i.e., phototransistor[69,71], microscopic imaging[15], and electrical impedance[37,70]) have been demonstrated to assess RBCs aggregation consistently.
Blood viscosity, which has been probed in microfluidic chip, represents the dominant effect of RBC deformability where shear rate is estimated as high value of > 103 s-1. Blood viscosity is limited at low shear rates. In particular, at low shear rates, RBCs aggregation is then quantified independently. Thus, blood viscosity and RBC aggregation have been then quantified by stopping and operating two syringe pumps periodically[73]. The previous method requires two bulky syringe pumps and periodic on-off flow-rate control. More recently, our group has suggested a new quantification method of aggregation index under continuous blood flow supplied from single syringe pump[15]. Since RBC aggregation index is highly dependent on fluidic resistance[15,29,63,66,74,75,76,77,78,79], the previous approach should be substantially refined to enable blood viscosity. The RBC aggregation index also should be represented at shear rates. Furthermore, a non-negligible dead volume (approximately 100 μL) is present along the fluidic path from the syringe to the inlet port[80,81]. Consequently, a portion of blood must be wasted during each run[9,82]. Therefore, a new approach is required to reduce unavoidable blood loss, under the specific dead-volume in the fluidic path.
In this study, a novel method is suggested to resolve several issues (i.e., dead volume loss, RBC sedimentation, and flow-dependent RBC aggregation as well as blood viscosity) raised by the previous methods. To reduce blood loss within the fluidic path, air cavity of Vair = 250 μL is intentionally maintained above blood column (Vb = 100 ~ 200 μL) loaded into the syringe. When air is injected from the syringe into a microfluidic chip, most of the blood initially loaded in the syringe is subsequently delivered into the microfluidic chip. Thus, securing air cavity in the syringe eliminates unavoidable blood loss in the fluidic path, which reduces the minimum blood loading-volume to 100 μL. To eliminate on–off operation of the single syringe pump, the syringe plunger is manually advanced by approximately 50 μL to increase the air pressure inside the syringe. The pressure difference contributes to loading blood into the fluidic path and microfluidic channels. Blood flow decreases gradually over time, which induces RBC aggregation in a microfluidic channel. Based on blood flow image in a straight main channel (i.e., high shear rates) and bifurcation channel (i.e., low shear rates), flow-dependent RBCs aggregation index is continuously obtained by calculating relative ratio of blood image intensity. After an elapse of certain time, to minimize RBC sedimentation in driving syringe during blood delivery[83], syringe pump set to high value of flow-rate (Qsp = 10 mL/h). Due to compliance effect, the blood velocity rises transiently over time and then reaches a plateau value. When blood velocity is measured by a time-resolved micro particle image velocimetry (PIV), the results are strongly affected by hematocrit[84]. Herein, since flow-rate of syringe pump and steady-state blood velocity are specified, the blood velocity can be converted into a blood flow rate (i.e., Q = U/Uss×Qsp, Uss: steady-state blood velocity, Qsp: setting flow-rate of syringe pump). Air pressure inside the driving syringe is then estimated by analyzing time-lapse blood flow as well as ideal-gas law (i.e., air volume × air pressure = constant)[53]. Blood viscosity is then determined by the Hagen-Poiseuille law. Thus, RBC aggregation and blood viscosity are obtained during two stages of blood delivery (i.e., air-compression, and syringe pump). To validate the performance of the suggested method (i.e., RBC aggregation, and blood viscosity), first, viscosity of glycerin solution (Cgl = 20% ~ 50%) is obtained. Second, using two kinds of blood medium (i.e., 1× PBS, and dextran solution [20 mg/ml]), the effect of RBC sedimentation in driving syringe is quantified from blood viscosity with respect to delivery flow-rate (Qsp). Third, to find out the effect of hematocrit on RBCs aggregation and blood viscosity, test blood is adjusted to Hct = 30% ~ 50% by suspending normal RBCs into dextran solution (20 mg/mL)[69]. Fourth, to induce RBC aggregation in a certain level, test blood is prepared by adding normal RBCs into various concentrations of dextran solution. Fifth, the minimum blood-loading volume into a driving syringe (Vb = 100 ~ 200 μL) is evaluated by measuring RBCs aggregation and blood viscosity. At last, to investigate biomechanical difference in heat-shocked RBCs, normal RBCs are exposed to 45 °C for up to 40 min and 50 °C for up to 20 min.
Compared to previous methods, first, unavoidable blood loss in the fluidic path is completely eliminated by securing air cavity above blood column in a driving syringe. Minimum blood loading-volume can be decreased to Vb = 100 μL. Second, by introducing test blood using an air-compression and a syringe pump, RBCs aggregation and blood viscosity are obtained at shear rates. Herein, to minimize the effect of RBC sedimentation on blood viscosity, syringe pump set to high flow-rate, which blood behaves as Newtonian fluid. Overall blood delivery time is less than 200 s.
2. Materials and Methods
2.1. A Microfluidic Rheometry for Probing Biomechanical Properties from Blood Flows
As shown in Figure 1A, to get flow-dependent RBCs aggregation and blood viscosity, a suggested experimental setup was composed of a microfluidic chip, a blood delivery method, and an imaging acquisition system.
A microfluidic chip was designed to have an inlet, a main channel (mc), aggregation channel (ac), and two outlets (m, and a). As a key design concept, to minimize RBC sedimentation in a driving syringe, flow rate set to high value of Qsp = 10 mL/h with a syringe pump. As a shear rate was estimated as s-1 in the main channel (width = 1 mm, and length = 14.6 mm), RBCs were fully disaggregated. Thus, it was certain that blood viscosity remained consistent with respect to the higher shear rates. On the other hand, to probe RBCs aggregation, the aggregation channel was bifurcated from the main channel. Based on fluidic resistance formular of a rectangular channel with low aspect ratio (i.e., Rf = , μ: viscosity, w: width, h: depth, L: length)[44], fluidic resistance of the aggregation channel increased substantially by decreasing channel width. That is, RBCs aggregation did not occur in the narrow-width channel. RBC aggregation was generated by intentionally positioning a wide-width channel region between the narrow-width channels[15]. The aggregation channel was then designed to have three segments connected in series: the first channel (width = 0.1 mm, length = 4.9 mm), the second channel (width = 1 mm, length = 2 mm) and the third channel (width = 0.1 mm, length = 8.8 mm). All channels had the same channel depth of h = 0.05 mm.
A four-inch silicon master mold was produced using standard microelectromechanical-system processes, including, photolithography, and deep reactive ion etching. PDMS
(Sylgard 184, Dow Corning, Midland, MI, USA) was prepared by mixing the elastomer base and curing agent at 10:1 (w/w). To remove entrapped air, the mixture was degassed under vacuum for 1 h. The PDMS was then cured in a convection oven at 70 °C for 1 h, peeled off from the master, and trimmed with a razor blade. One inlet and two outlets (m, and a) were formed using a biopsy punch (outer diameter = 2 mm). The PDMS block was subsequently bonded to a glass substrate via oxygen plasma treatment (CUTE-MPR, Femto Science Co., South Korea). To enhance adhesion between the PDMS channel walls and the glass substrate, the microfluidic chip was heated on a hot plate at 120 °C for 10 min[85,86].
To minimize non-specific adsorption of plasma proteins on the inner channel surfaces, 0.2% bovine serum albumin (BSA) solution was introduced into the microfluidic channels. After 10 min of incubation, the BSA solution was removed by flushing the device with 1× PBS.
Air cavity secured in a driving syringe was employed to minimize blood loss resulting from dead volume in a fluidic path. After attaching a 20-gauge needle to the syringe, air (Vair = 250 μL) and blood (Vb = 100 ~ 200 μL) were sequentially aspirated into the driving syringe. Air cavity was then positioned above the blood against gravitational direction. A polyethylene tubing (i. d. = 0.25 mm, and length = 300 mm) was connected between the syringe needle tip and the inlet port.
Air trapped along the fluidic pathway was expelled by compressing the air pocket in the driving syringe from 250 to 200 μL[85]. Based on an ideal-gas law (i.e., air pressure × air volume = constant)[44,53], air pressure increased to P = 1.25 P0. Herein, the P0 denoted atmospheric pressure (P0 = 101 kPa). Air pressure difference (ΔP = 0.25 P0) contributed to loading blood into a microfluidic chip from the syringe. After expelling air through the outlets, all channels became fully filled with blood. As air cavity increased gradually in the syringe, air pressure difference decreased gradually over time. Accordingly, when the blood flow-rate was reduced below a threshold, RBCs aggregation occurred in the aggregation channel. In contrast, the blood flow-rate in the main channel remained sufficiently high to keep RBCs fully disaggregated. By comparing the image intensity of blood in the two channels, RBC aggregation could be quantified. After an elapse of certain time (about 120 s), to measure blood viscosity, a syringe pump set to constant value of flow rate (Qsp = 10 mL/h). Aggregated RBCs were fully dispersed at the higher flow rate. Owing to the air-compliance effect, the blood flow rate rose progressively over time before stabilizing at a plateau value.
The microfluidic device was placed on an inverted microscope (IX81, Olympus, Tokyo, Japan) equipped with a 4× objective (NA = 0.10). Blood-flow images were acquired using a high-speed camera at 5000 frames per second, with an external trigger interval set to T = 0.25 s. All experiments were conducted at a constant room temperature of 25 °C.
2.2. Quantification of Image Intensity and Blood Flow-Rate in Main and Aggregation Channels
In this study, variation of RBCs aggregation was quantified by comparing image intensities of blood flow in the main channel (i.e., fully disaggregated RBCs) and the aggregation channel (i.e., aggregated RBCs), respectively. In addition, to obtain blood viscosity, time-dependent flow rate in main channel and aggregation channel was required. For the reasons, it was necessary to obtain image intensity as well as blood velocity in both channels.
As shown in Figure 1B, two ROIs (regions-of-interest) were selected in the main channel and aggregation channels. The area of each ROI was set to 1.8 mm2. Blood-flow direction in the microfluidic channels was marked by red arrows. The scalar bar denoted 1 mm.
First, to assess contribution of RBCs in each channel, a subtracted image was calculated by subtracting each image from the initial background[29]. All calculations were performed using an image processing toolbox in MATLAB (Version: 2025b, MathWorks, Natick, MA, USA). Based on ROIs defined in the main and aggregation channels, the mean value of grayscale intensity was calculated as Imc (main channel) and Iac (aggregation channel), respectively. Time-lapse image intensity was subsequently determined by applying the same image-processing procedure to all recorded images.
Second, time-lapse velocity fields were measured using open source PIV software (PIVlab, version: 3.12)[87]. To obtain velocities within each ROI, an interrogation window of 13 × 13 µm² with 50% overlap was used[15]. The resulting velocity vectors were post-processed using local median and standard-deviation filters. Based on the analytical depth-of-correlation (DOC) formula[88], the DOC of the imaging system (Figure 1A) was estimated as DOC > 300 µm. Because the DOC was much larger than the channel depth (i.e., DOC > h), the micro-PIV results were considered as depth-averaged velocity within each interrogation window. Mean velocity was calculated by averaging velocity values over each ROI, yielding Umc for the main channel and Uac for the aggregation channel. Time-lapse velocities were then obtained by repeating the same micro-PIV procedure for all recorded images. Considering that blood velocity had been strongly impacted by hematocrit[84], it was necessary to calibrate velocity fields obtained by the micro-PIV technique. To do simple calibration procedure, syringe pump set to constant value of flow rate (Qsp). Owing to air compliance effect in a driving syringe, blood velocity increased gradually and reached a steady value (Ust) after a certain period. The blood flow-rate in each channel was calculated from Qsp and Ust, eliminating the need for any further calibration steps. That is, the corresponding flow-rate in each channel was compensated as Qmc(t) = Umc(t) / Ust × Qsp and Qac(t) = Uac(t) / Ust × Qsp, respectively.
To demonstrate time-dependent image intensity and blood velocity, test blood (hematocrit [Hct] = 50%) was prepared by suspending normal RBCs into dextran solution (20 mg/mL). By referring to the previous studies[15,83], the specific concentration of dextran solution was selected as blood medium for maximizing RBC aggregation. Blood volume of Vb =200 μL was suctioned into the syringe. Blood flow-rate set to Qsp = 10 mL/h. As shown in Figure 1C-i, blood image was summarized with respect to time (t = 44, 128, 190, and 210 s). Herein, the red arrow indicated blood-flow direction in channels. The microscopic image acquired at t = 128 s showed clearly enhanced RBC aggregation compared with the image acquired at t = 44 s. Specifically, the ROI in the aggregation channel exhibited higher brightness than the corresponding region in the main channel. Finally, at t = 210 s, syringe delivered air into the main channel, which resulted in stopping blood flows completely. However, owing to higher fluidic resistance, air did not invade into aggregation channel, which was filled only with blood.
As depicted in Figure 1C-ii, the suggested protocols were used to get time-dependent image intensity (Imc, Iac) and blood velocity (Umc, Uac). The upper panel showed temporal variations of Iac and Uac obtained in the aggregation channel. The lower panel depicted time-lapse Imc and Umc acquired in the main channel. Firstly, as shown in green-dashed line, air volume (50 μL) in a deriving syringe was compulsorily compressed to load blood. Because pressure difference between air pressure in the syringe and atmospheric pressure increased, blood was supplied into microfluidic channels through fluidic path. As air volume increased over time, the pressure difference decreased over time. For the reason, blood velocity (Umc, Uac) tended to decrease over time. The Imc remained unchanged for up to t = 90 s. After t = 90 s, it tended to decrease slightly over time, which denoted that RBC aggregation occurred in fluidic path. Aggregated RBCs came into microfluidic channels. As shear rate in the aggregation channel decreased sufficiently below a threshold ( = 50 ~ 100 s-1), RBCs aggregation occurred in the aggregation channel. Transiently decreasing blood flow contributed to increasing Iac significantly. Thus, RBC aggregation index (AI) could be obtained continuously by analyzing time-dependent Imc and Iac, respectively. Secondly, as depicted in blue-dashed line, syringe pump set to constant flow-rate (Qsp). Due to air-compliance effect in a driving syringe, Umc and Uac increased gradually and reached a plateau value. The Iac increased gradually because full disaggregated RBCs were flowed into both channels. Above t = 199 s, the Imc tended to decrease. The Umc tended to increase significantly. As Umc and Uac were strongly impacted by blood viscosity, they were participated in obtaining blood viscosity.
From the preliminary demonstration, image intensity (Imc, Iac) and blood velocity (Umc, Uac) could be used effectively to probe RBCs aggregation and blood viscosity.
2.3. Mathematical Representation of Proposed Microfluidic System
To derive blood viscosity formula, firstly, it was necessary to obtain air pressure in the syringe. As shown in Figure 1D-i, a driving syringe partially filled with air and blood was positioned against gravitational direction. A polyethylene tubing was connected between needle tip and inlet port. Initially (t = t1), air volume was defined as Vair = V0 and air pressure equaled atmospheric pressure (Pair = P0). Over the period from t = t1 to t = t2, the air cavity decreased by because piston moved downward. In contrast, the air cavity increased by because the volume decreased at the flow rate of Qmc. Based on the mass-balance law in a driving syringe, air volume (Vair) inside the syringe was estimated as,
According to ideal-gas law[53] (i.e., , the air pressure (Pair) inside the driving syringe was determined as Pair = P0 ×V0 /Vair. The analytical expression of Pair was derived as,
Using the Eqn (2), the pressure difference (ΔP = Pair - P0) was given as,
According to the Eqn (3), the pressure difference (ΔP) could be obtained consistently if time-dependent Qmc was obtained accurately.
Next, a fluidic circuit model was constructed to derive analytical expression of blood viscosity. As shown in Figure 1D-ii, the fluidic circuit model of the proposed microfluidic platform was composed of air pressure source (Pair), fluidic resistance element (i.e., Rtb: inlet tubing, Rmc: main channel, and Rac: aggregation channel). Herein, assuming that blood behaved as Newtonian fluid, the ratio of Rmc to Rac was calculated as Rmc/Rac = 19.04. Accordingly, the flow was split such that 5% of the supplied blood passed through the aggregation channel, whereas the other 95% proceeded through the main channel. The ground (‘▼’) denoted atmospheric pressure (P0 = 101 kPa). The Pj denoted blood pressure at the junction between main channel and aggregation channel. With regard to fluidic path (i.e., syringe - inlet tubing - upper main channel – junction point), pressure difference (i.e., Pair - Pj) was derived as,
In addition, with regard to lower main channel (i.e., junction point – lower main channel – outlet [m]), pressure difference (i.e., Pj – P0) was derived as,
By summing Eqn (4) and Eqn (5), pressure difference (ΔP = Pair - P0) was given as,
In the Eqn (6), the formula of Rmc and Rtb were analytically given as,
and
In the Eqns (7) and (8), Lmc and Ltb denoted channel length of main channel and inlet tubing. The r meant inner radius of inlet tubing. The pressure difference was then simplified as
In the Eqn (9), the and λ were given as
and
Using the Eqn (9), the analytical formula of blood viscosity was finally derived as,
In the Eqn (12), considering that and λ were fixed, blood viscosity (μb) could be then obtained from time-lapse Qmc, Qac, and ΔP.
At last, as shown in Figure 1D-iii, variations of shear rate () in fluidic path (i.e., inlet tubing, ROI in the main channel, and ROI in the aggregation channel) were obtained with respect to Qsp. The Qsp was ranged from 0.1 mL/h to 10 mL/h. Based on shear rate formular (i.e., for a rectangular channel, and for a circular channel, Q: blood flow-rate)[44], the corresponding shear rate of each channel was simulated with respect to Qsp. From the simulation results, below Qsp = 1 mL/h, RBCs aggregation occurred in the aggregation channel. Above Qsp = 3 mL/h, shear rate was estimated as above =100 s-1 for all channels. As aggregated RBCs were fully disaggregated, its contribution on blood viscosity could be neglected under blood delivery of syringe pump.
2.4. Preparation of Test Blood
This study was conducted in compliance with the Declaration of Helsinki and received approval from the Ethics Committee of Chosun University (reference code: 2-1041055-AB-N-01-2021-80). Concentrated red blood cells were supplied by the Gwangju–Chonnam Blood Bank (Gwangju, South Korea) and stored under refrigerated conditions prior to experimental preparation. Following established washing procedures[86], normal RBCs were isolated by sequentially removing blood suspended medium and the buffy coat.
First, to visualize velocity fields of glycerin solution, normal RBCs (30 μL) were added to 1 mL of each concentration of glycerin solution. Second, to assess the effect of hematocrit on RBCs aggregation and blood viscosity, hematocrit of test blood was adjusted to Hct = 30% ~ 50% by suspending normal RBCs into dextran solution (20 mg/mL). Third, to examine how the suspending medium influences these hemorheological properties, normal RBCs were suspended into dextran solution (Cdex = 5 ~ 20 mg/mL), which were prepared by dissolving dextran powder (Leuconostoc spp., MW 450–650 kDa; Sigma–Aldrich, USA) into 1× PBS. Herein, hematocrit was fixed at 50%. Finally, to investigate thermal-shocked effects, control blood (Hct = 50%) was prepared by suspending normal RBCs into 1× PBS. Using a thermomixer (Eppendorf, Hamburg, Germany), the control blood was incubated under heat-shock conditions (45 °C for up to 40 min or 50 °C for up to 20 min). Following the established washing protocols, test blood (Hct = 50%) was then prepared by suspending the thermally shocked RBCs into dextran solution (20 mg/mL).
2.5. Statistical Analysis
All statistical computations were carried out with MINITAB software (Version 22.4, Minitab Inc., State College, PA, USA). Under assumption of normal distributed data, results were presented as mean () ± standard deviation (σ), where Sn represented experimental replication number. The bounds of 95% CI (confidential interval) were computed as and . Statistical differences among groups were evaluated by one-way ANOVA. Statistical significance was set to p-value < 0.05 (95 % CI).
3. Results and Discussion
3.1. Proposed Protocols of Flow-Dependent RBCs Aggregation and Blood Viscosity
In this subsection, using time-lapse image intensity and blood velocity as illustrated in Figure 1C, full methodology for quantifying flow-dependent RBCs aggregation and blood viscosity were described in details.
As shown in Figure 2A-i, shear-dependent RBCs aggregation was quantified using time-lapse Imc, Iac, and Qac. Initially, due to air-compliance effect in a driving syringe, blood was loaded into a microfluidic chip from the syringe. With an elapse of period, air cavity inside the syringe increased over time. As air pressure decreased over time, the blood flow-rate in the aggregation channel (Qac) tended to decrease gradually over time. The Imc remained relative constant for a certain time (t = 40 s). Above t = 40 s, it tended to decrease slightly over time. That is, as delivery flow-rate decreased sufficiently, RBCs aggregation occurred from syringe needle to inlet port. The aggregated RBCs were flowed into the main channel and aggregation channel. Thus, the Iac decreased significantly over time.
From the experimental investigation, image intensity difference (ΔI = Imc - Iac) was strongly related to RBCs aggregation[15]. To make RBC aggregation dimensionless parameter, the ΔI was normalized by Imc. Thus, RBC aggregation index (AI) was defined as AI = ΔI/Imc. The flow-dependent AI could be evaluated from time-lapse Iac and Imc. Based on time-lapse Qac, as shown in Figure 2A-ii, variations of AI and were obtained over time. Herein, based on the shear rate formular of a rectangular channel (i.e., , w = 1 mm, h = 0.05 mm)[44], shear rate within the ROI of the aggregation channel were estimated over time. Initially, the AI was estimated as near zero where shear rate was estimated as about = 90 s-1. Considering that the previous studies[64,89] reported a threshold for RBCs aggregation as = 50 ~ 100 s-1, the initial value of AI was regarded as reasonable. Furthermore, when the shear rate decreased gradually over time, the AI increased significantly.
To analyze shear-dependent AI quantitatively, as shown in Figure 2A-iii, variations of AI were represented with respect to . According to the previous study[89,90], variations of AI were best fitted using a sigmoidal function and a power-law function. Considering that AI had steady value at low shear rates, for convenience, the sigmoidal function was selected to fit shear-dependent AI. That is, to probe shear-dependent AI quantitatively, the AI was best fitted as AI = . Based on a curve-fitter toolbox in MATLAB (Version: 2025b, MathWorks, Natick, MA, USA), non-linear regression analysis was carried out for estimating three unknown parameters (i.e., AI0, a, and b). The red line indicated the best-fit function, which accurately described the shear-dependent AI. Three unknown parameters were then extracted as AI0 = 0.8113, a = 0.059 s, and b = 44.3671 s-1. Regression coefficient was obtained as high value of R2 = 0.9359. Reproducibility of the proposed method was assessed by measuring variations in three parameters across nine test bloods (Sn = 9). Figure 2A-iv exhibited variations of three parameters (i.e., AI0, a, and b) with respect to test blood. The dashed lines indicated both bounds of 95% CI. Specifically, within the 95% CI, three parameters were estimated as 0.577 < AI0 < 0.896, 0.0463 s < a < 0.0608 s, and 41.641s-1 < b < 54.506 s-1.
Next, using syringe pump, blood was loaded into microfluidic channels. Blood viscosity could be estimated by analyzing time-lapse Qmc and Qac. As shown in Figure 2B-i, due to air-compliance effect in the driving syringe, Qmc and Qac were increased gradually over time. Based on Eqn (1) and Eqn (2), Vair and Pair were obtained over time. The air volume (Vair) gradually decreased from 0.25 mL to 0.196 mL, while the air pressure (Pair) increased over time and then stabilized at 129.15 kPa. Figure 2B-iii depicted the variation of ΔP as a function of Qmc, where ΔP was defined as Pair − P0. Maximum value of ΔP was given as ΔPmax = 28.15 kPa. The ΔP was approximately proportional to Qmc. The blood viscosity (μb) was then calculated by substituting time-resolved Qmc, Qac, and ΔP into Eqn (12). Figure 2B-iv showed variations of blood viscosity (μb) as a function of Qmc. The results indicated that blood viscosity remained consistent with respect to Qmc. Based on the shear-rate formula, time-lapse Qmc was converted into shear rate. As shown in Figure 2B-v, variations of μb were then represented with respect to . Above = 2500 s-1, the blood viscosity (μb) remained constant with respect to . As expected, blood behaved as Newtonian fluid[91,92,93,94]. The viscosity was summarized as μb = 2.313 ± 0.303 cP (n = 227). COV (coefficient of variance, standard deviation/mean) was calculated as 13.1%. With regard to nine test bloods (Sn = 9), reproducibility of the proposed method was evaluated by measuring μb and ΔPmax. Under 95% CI, the μb and ΔPmax were estimated as 2.416 cP < μb < 2.629 cP and 28.981 kPa < ΔPmax < 31. 732 kPa.
From the preliminary demonstration, it was confirmed that the proposed method was able to measure flow-resolved AI and viscosity by analyzing time-lapse image intensity (Imc, Iac) and flow-rate (Qmc, Qac). The method gave consistent results sufficiently.
3.2. Accuracy Validation of Viscosity Measured by the Proposed Method for RBCs-Free Solution
Given that blood viscosity is strongly influenced by several factors (i.e., hematocrit, RBC aggregation, RBC deformability, and RBC sedimentation in driving syringe)[46,61,62,65,83,95,96], the presence of RBCs complicates reliable viscosity measurement. Accordingly, validation can be simplified by eliminating RBCs from blood suspension[97,98,99]. The remaining medium behaves as Newtonian fluid. In this subsection, to verify the accuracy of viscosity values obtained with the proposed method, glycerin solutions were prepared as test fluids. To demonstrate that the proposed method provided shear-rate independent viscosity, the viscosity of glycerin solution was evaluated by varying flow rate ranging from Qsp = 1 mL/h to Qsp = 8 mL/h using a syringe pump. In addition, to substantially elevate viscosity, glycerin concentration was increased from 20% to 50%. The measurement results were quantitatively compared with reference data[100].
First, to validate Newtonian behavior of glycerin solution, as shown in Figure 3A-i, time-resolved Qmc and ΔP were summarized with respect to Qsp = 2, 4, 6, and 8 mL/h. Herein, 30% glycerin solution was selected as test fluid. As expected, Qmc and ΔP increased gradually over time and eventually stabilized. The time required to reach the plateau decreased markedly at higher flow rates. Viscosity of the glycerin solution was estimated by substituting Qmc, Qac, and ΔP into Eqn (12). As shown in Figure 3A-ii, by adjusting Qsp ranging from 2 mL/h to 8 mL/h, the viscosity (μ) was plotted as a function of Qmc. From the results, the measured viscosity remained steady and did not correlate with Qmc. As expected, glycerin solution behaved as Newtonian fluid. The corresponding viscosity of each setting flow-rate (Qsp) was estimated as μ = 2.66 ± 0.05 cP (n = 426) for Qsp = 2 mL/h, μ = 2.84 ± 0.05 cP (n = 668) for Qsp = 4 mL/h, μ = 3.03 ± 0.07 cP (n = 421) for Qsp = 6 mL/h, and μ = 2.84 ± 0.05 cP (n = 379) for Qsp = 8 mL/h. As depicted in Figure 3A-iii, variations of μ and ΔPmax were plotted as a function of Qsp. For confirming reproducibility, the experiments were repeated five times (Sn = 5). Linear regression analysis was carried out to find out contributions of Qsp to μ and ΔPmax. According to linear regression analysis, regression coefficient of μb gave lower value of R2 = 0.246. The results indicated that the μb did not show substantial difference with respect to Qsp. The experimental results confirmed that glycerin solution behaved Newtonian fluid. In addition, a strong regression fit was obtained for ΔPmax (R2 = 0.9546) which confirmed that ΔPmax was linear proportional to Qsp. The results were consistent and reasonable because pressure was directly proportional to the delivered flow-rate.
Second, to measure accuracy of viscosity obtained by the proposed method, four different concentrations of glycerin solution (Cgl = 20%, 30%, 40%, and 50%) were prepared by diluting pure glycerin solution with 1× PBS. Herein, flow rate was fixed at Qsp = 4 mL/h. According to the reference data[100], the corresponding viscosity of each glycerin solution was given as μ = 1.72 cP for Cgl = 20%, μ = 2.57 cP for Cgl = 30%, μ = 4.05 cP for Cgl = 40%, and μ = 6.86 cP for Cgl = 50%. As shown in Figure 3B-i, time-lapse Qmc and ΔP were with respect to concentration of glycerin solution (Cgl = 20% ~ 50%). From the results, the Qmc was increased more slowly as the glycerin concentration increased. In contrast, the plateau value of ΔP increased substantially at higher concentrations of glycerin solution. As shown in Figure 3B-ii, by varying Cgl ranging from 20% to 50%, the viscosity (μ) was plotted as a function of Qmc. Except higher concentration of Cgl = 50%, the μ remained consistent with respect to Qmc. The corresponding viscosity of each concentration of glycerin solution was evaluated as μ = 2.27 ± 0.09 cP (n = 626) for Cgl = 20%, μ = 3.00 ± 0.05 cP (n = 865) for Cgl = 30%, μ = 4.29 ± 0.12 cP (n = 799) for Cgl = 40%, and μ = 5.66 ± 0.24 cP (n = 783) for Cgl = 50%. Figure 3B-iii depicted variations of μ and ΔPmax with respect to Cgl. Experiments were repeated four times (Sn = 4). The results showed that the CI width increased with higher glycerin concentration. To validate performance of the proposed method, as shown in Figure 3C-i, viscosity values obtained by both methods (i.e., proposed method, and reference data), were plotted simultaneously with respect to Cgl. From the results, both methods gave consistent results. To find out linear correlation between both methods, as shown in Figure 3C-ii, viscosity values obtained by both methods were overlapped in a scatter plot, where the horizontal axis corresponded to the reference data (ref. data) and the vertical axis corresponded to the viscosity obtained by the proposed method (pro. method). Red dashed line indicated linear regression curve (i.e., μ [pro. method] = 0.9715 × μ [ref. data], R2 = 0.9835). Because the linear regression yielded a high value of regression coefficient, the viscosity values obtained with the proposed method showed strong agreement with the reference data.
From the experimental investigations, the viscosity of glycerin solution remained constant with respect to delivered flow-rate. Viscosity exhibited substantial difference with respect to concentration of glycerin solution. The quantitative evaluation confirmed that the proposed method could provide accurate viscosity.
3.3. Determination of Supplied Blood Flow-Rate (Qsp) with Syringe Pump
RBC sedimentation in the driving syringe altered the hematocrit of the test blood during blood delivery[83,95,101,102,103]. In particular, hematocrit markedly influenced the blood velocity measured using time-resolved micro-PIV[104,105]. In this subsection, during syringe pump operation, selecting a suitable flow-rate was essential to reduce the contribution of RBC sedimentation in the syringe[83]. To intentionally enhance sedimentation in the syringe, a dextran solution of 20 mg/mL was chosen as blood medium[15,69,83]. After performing RBC aggregation protocols for 120 s, the syringe pump was activated to load the blood into the microfluidic chip. For simplicity, blood viscosity was quantified only as a function of the applied flow rate. Herein, test blood (Hct = 50%) was prepared by mixing normal RBCs into 1× PBS and dextran solution (20 mg/mL). Each blood (Vb = 200 μL) was loaded into the syringe. Flow rate of syringe pump set to Qsp = 2 ~ 10 mL/h.
First, to avoid RBC sedimentation in a driving syringe, 1× PBS was selected as blood medium. Control blood (Hct = 50%) was prepared by suspending normal RBCs into 1× PBS. As shown in Figure 4A-i, time-lapse Qmc and ΔP were represented with respect to Qsp = 4 and 10 mL/h. Delivery time decreased as the delivered flow rate increased, whereas ΔP increased with increasing delivered flow rate. Based on time-lapse Qmc and ΔP, blood viscosity was obtained with respect to Qsp. As shown in Figure 4A-ii, by varying Qsp ranging from 4 mL/h to 10 mL/h, blood viscosity (μb) was calculated and plotted as a function of Qmc. From the results, variation ranges of Qmc were determined by the Qsp. Herein, within short variations of the Qmc, blood viscosity decreased slightly with respect to Qmc. For convenience, with respect to Qsp, blood viscosity was summarized as mean ± standard deviation (n: numbers of data point). That is, the corresponding viscosity of each Qsp was summarized as μ = 2.10 ± 0.05 cP (n = 371) for Qsp = 4 mL/h, μ = 1.92 ± 0.03 cP (n = 371) for Qsp = 6 mL/h, μ = 1.79 ± 0.03 cP (n = 311) for Qsp = 8 mL/h, and μ = 1.67 ± 0.04 cP (n = 191) for Qsp = 10 mL/h. As shown in Figure 4A-iii, blood viscosity (μb) and maximum pressure difference (ΔPmax) were plotted as a function of Qsp = 2 ~ 10 mL/h. From the results, above Qsp = 4 mL/h, overall variations of μb tended to decrease gradually over Qmc. The results confirmed that control blood behaved as non-Newtonian fluid. Furthermore, the delivered flow-rate (Qsp) contributed to increasing ΔPmax linearly.
Second, to induce RBCs sedimentation in a driving syringe, test blood (Hct = 50%) was prepared by suspending normal RBCs into dextran solution (20 mg/mL). Herein, RBC sedimentation occurred during two steps of blood loading (i.e., air-compression-based blood loading: RBCs aggregation quantification, and syringe pump-based blood loading: blood viscosity quantification). As depicted in Figure 4B-i, time-resolved Qmc and ΔP were obtained with respect to Qsp = 4, and 10 mL/h. Interestingly, the plateau value of ΔP exhibited a small increase as the Qsp was increased from 4 mL/h to 10 mL/h. As shown in Figure 4B-ii, by varying Qsp ranging from 4 mL/h to 10 mL/h, blood viscosity (μb) was plotted as a function of Qmc. With the exception of Qsp = 4 mL/h, the μb remained unchanged with respect to Qmc. The corresponding blood viscosity of each Qsp was obtained as μb = 6.16 ± 0.37 cP (n = 303) for Qsp = 4 mL/h, μb = 4.46 ± 0.17 cP (n = 326) for Qsp = 6 mL/h, μb = 3.30 ± 0.09 cP (n = 299) for Qsp = 8 mL/h, and μb = 2.32 ± 0.08 cP (n = 247) for Qsp = 10 mL/h. Notably, the μb increased markedly when Qsp was reduced from 10 mL/h to 4 mL/h. As shown in Figure 4B-iii, variations of μb and ΔPmax were obtained with respect to Qsp = 2, 4, 6, 8, and 10 mL/h. With regard to μb, when Qsp exceeded 4 mL/h, increasing Qsp caused to reduce blood viscosity, suggesting that RBC sedimentation became pronounced at lower value of Qsp. Furthermore, the ΔPmax increased gradually for up to Qsp = 6 mL/h. For Qsp > 6 mL/h, the ΔPmax showed no appreciable change with respect to Qsp. Because blood viscosity decreased substantially at higher flow-rate, the ΔPmax remained constant within the specific range of Qsp. Compared with results for control blood (Figure 4A-iii), the RBC sedimentation in the driving syringe contributed to altered values of μb and ΔPmax.
Third, to compare with results obtained by the proposed method, viscosities of control blood and test blood were measured with the coflowing laminar streams[1,84,106,107,108,109]. In contrast to the proposed method, the previous approach measured blood viscosity without quantifying RBC aggregation. Therefore, RBC sedimentation occurred only during blood delivery. Figure 4C-i depicted coflowing streams for measurement of blood viscosity. Herein, flow rate of test blood set to Qb = 10 mL/h. To shift the interface near channel center (i.e., β = Wb/W = 0.52), flow rate of reference fluid was adjusted to Qr = 35 mL/h. Considering that both streams had the same pressure drop in single channel, formula of blood viscosity (μb) was given as . Herein, the μr denoted viscosity of reference fluid (1× PBS). As shown in Figure 3C-ii, temporal variations of μb were obtained with respect to blood medium (i.e., 1× PBS, and dextran sol. [20 mg/mL]) and blood flow-rate (i.e., Qb =1, and 10 mL/h). With regard to control blood (1× PBS, Hct = 50%), the corresponding viscosity of each blood flow-rate was obtained as μb = 3.71 ± 0.04 cP (n = 411) for Qsp = 1 mL/h, and μb = 2.85 ± 0.02 cP (n = 626) for Qsp = 10 mL/h. Additionally, for test blood (i.e., dextran sol. [20 mg/mL], Hct = 50%), the corresponding viscosity of each blood flow-rate was measured as μb = 5.36 ± 0.12 cP (n = 2234) for Qsp = 1 mL/h, and μb = 4.89 ± 0.04 cP (n = 302) for Qsp = 10 mL/h. As shown in Figure 4C-iii, for different bloods (i.e., control blood, and test blood), the μb was plotted as a function of blood flow-rate (Qb). From the results, blood viscosity tended to decrease gradually when Qb was increased from 2 mL/h to 6 mL/h. Above Qb = 6 mL/h, blood viscosity remained unchanged with respect to Qb. With regard to blood medium, dextran solution (20 mg/mL) increased blood viscosity markedly when compared with 1× PBS.
At last, for two bloods (i.e., control blood, and test blood), blood viscosity obtained by both methods (i.e., proposed method: pro. m., previous method: prev. m.) were compared quantitatively. As shown in Figure 4D-i, with regard to control blood, blood viscosity (μb) obtained by both methods was plotted as a function of delivered blood flow-rate (Qsp). In the inset, a scatter plot was drawn to represent linear correlation between blood viscosities measured using both methods. The regression formula was obtained as μb (pro. m.) = 0.6778μb (prev. m.) +1.6581 (R2 = 0.7235). Because the linear regression yielded a high value of R², blood viscosity obtained by both methods could be considered comparable. Similarly, as shown in Figure 4D-ii, with respect to test blood, blood viscosity (μb) obtained by both methods were plotted as a function of Qsp. As shown in the inset, a scatter plot was drawn to indicate linear relationship between blood viscosities obtained by both methods. According to linear regression analysis, a linear regression curve was obtained as μb (pro. m.) = 11.396μb (prev. m.) - 51.72 (R2 = 0.6193). In particular, blood flow-rate of syringe pump had a strong influence on blood viscosity. As shown in Figure 4D-i, for control blood, both methods gave comparable viscosity. None-the-less, for test blood, both methods exhibited substantial differences with respect to Qsp. In the previous approach, blood viscosity was quantified without incorporating an RBC aggregation assessment. As a result, the previous method did not require the ~120 s aggregation-quantification interval, thereby minimizing the possibility of RBC sedimentation in the driving syringe. It can be inferred that sedimentation during the aggregation-quantification step contributed to variations in the measured viscosity. Moreover, blood viscosity determined by the proposed method was highly dependent on the delivered blood flow rate. As shown un in Figure 4C-iii, the previous method yielded nearly constant viscosity values when Qsp exceeded 6 mL/h. Therefore, the Qsp should be maintained above 6 mL/h for ensuring flow-rate–independent viscosity. In addition, to reduce large fluctuations resulting from RBC sedimentation in the driving syringe, the blood flow-rate should be set to the highest feasible level. Unless otherwise specified, in the subsequent experiments, for convenience, the blood flow rate was set to Qsp = 10 mL/h.
3.4. Contribution of Hematocrit (Hct)
Because hematocrit strongly influences RBCs aggregation and blood viscosity, the hematocrit of test blood is typically adjusted to a specified value[62,95,110]. In this subsection, the contribution of hematocrit was validated using the proposed method. Herein, to induce RBCs aggregation, the concentration of dextran solution (20 mg/mL) was selected as blood medium. Hematocrit of test blood was then adjusted to Hct = 30% ~ 60% by suspending normal RBCs into the specific dextran solution. Blood (Vb = 200 μL) was loaded into a driving syringe.
First, to quantify RBCs aggregation, as shown in Figure 5A-i, time-lapse Imc, Iac, and Qac were plotted with respect to Hct = 30%, and 60%. RBC aggregation index (AI) was calculated using time-lapse Imc and Iac. Simultaneously, shear rate () was estimated by substituting time-resolved Qac into shear rate formula. As shown in Figure 5A-ii, by varying hematocrit ranging from Hct = 30% to Hct =60%, the AI was plotted as a function of . The shear-dependent AI was best fitted as AI = . The green dashed line represented the best-fitting regression curve. The corresponding curve-fitting formula of each hematocrit was obtained as AI = 0.7649 / (1 + exp [0.039(- 50.0872)]) for Hct = 30%, AI = 0.7275 / (1 + exp [0.0398( - 31.5752)]) for Hct = 40%, and AI = 0.3914 / (1 + exp [0.0902( – 29.8718)]) for Hct = 60%. Based on three parameters (i.e., AI0, a, and b) estimated by conducting non-linear regression analysis, as shown in Figure 5A-iii, variations of three parameters were represented with respect to Hct = 30% ~ 60%. Herein, the number of test blood was set to Sn = 4 ~ 9. Based on statistical test (i.e., one-way ANOVA), the corresponding p-value of each parameter was obtained as p-value < 0.001 for parameter AI0, p-value < 0.001 for parameter a, and p-value = 0.062 for parameter b. The AI0 decreased slightly from Hct = 30% to Hct = 50%, but declined markedly between Hct = 50% and Hct = 60%. The parameter a was unchanged between Hct = 30% and 40%, but increased gradually from Hct = 40% to Hct = 60%. The parameter b did not show a clear trend because it exhibited large scatter with respect to Hct. However, the b showed a substantial difference between Hct = 30% and Hct = 60%. Given that the conventional RBC aggregation index showed substantial hematocrit-dependent variation[16,111], the parameters obtained using the proposed method (i.e., AI0 and a) could be used as promising indices.
Second, after RBCs aggregation quantification, contribution of hematocrit to blood viscosity was assessed using the proposed method. As shown in Figure 5B-i, time-dependent Qmc and ΔP were obtained with respect to Hct = 30% and 60%. The rising time increased markedly as hematocrit rose from Hct = 30% to Hct = 60%. In addition, the plateau value of ΔP increased substantially at the highest hematocrit. Figure 5B-ii showed
variations of μb with respect to shear rate (). The μb did not exhibit substantial variation with respect to shear rate. The corresponding viscosity of each hematocrit was summarized as μb = 2.34 ± 0.06 cP (n = 208) for Hct = 30%, μb = 2.24 ± 0.06 cP (n = 199) for Hct = 40%, and μb = 3.23 ± 0.10 cP (n = 233) for Hct = 60%. That is, blood viscosity showed no substantial difference between Hct = 30% and Hct = 40%. However, blood viscosity increased significantly as hematocrit increased from Hct = 40% to Hct = 60%. As shown in Figure 5B-iii, variations of μb and ΔPmax were plotted as a function of hematocrit. According to statistical test (i.e., one-way ANOVA), the p-value was less than 0.001 for both properties. According to the previous studies[62,95,112], hematocrit contributed to increasing blood viscosity significantly. However, both properties remained unchanged from Hct = 30% and Hct = 50%, but increased markedly from Hct = 50% to Hct = 60%. In contrast to the previous methods, the present method quantified RBC aggregation before measuring blood viscosity. During aggregation quantification, RBC sedimentation inevitably occurred in the driving syringe while blood was delivered at low flow-rate by air compression. In addition, the dextran solution (20 mg/mL) markedly accelerated sedimentation in the syringe. This phenomenon was expected to be more pronounced at low hematocrit (Hct = 30% or 40%)[113]. After RBC aggregation quantification, when the test blood with low hematocrit (i.e., Hct = 30% ~ 50%) was introduced into the microfluidic channels, the allocated hematocrit exhibited no substantial difference. Consequently, blood viscosity was inferred to show little difference over Hct = 30% ~ 50%.
From the experimental investigation, RBC aggregation index (AI) exhibited greater sensitivity to hematocrit variations than blood viscosity. Interestingly, owing to RBC sedimentation in a driving syringe, blood viscosity showed no substantial difference among low-hematocrit blood (i.e., Hct < 50%).
3.5. Contribution of Blood Medium (Dextran Concentration)
According to previous studies, the autologous plasma (i.e., plasma proteins) strongly affects RBCs aggregation and blood viscosity[62,95,114,115]. Instead of diluting autologous plasma, diluted dextran solutions have been widely used as standard aggregating medium and can increase blood viscosity[109,116,117,118]. In this subsection, to quantify the effect of blood medium, test blood (Hct = 50%) was prepared by suspending normal RBCs into dextran solution (Cdex = 0, 5, 10, 15, and 20 mg/mL). The Cdex = 0 denoted pure 1× PBS. Blood (200 μL) was loaded into a driving syringe.
First, to quantify RBCs aggregation under different blood medium, as shown in Figure 6A-i, time-lapse Imc, Iac, and Qac were obtained with respect to Cdex = 5, 10, and 15 mg/mL. According to the results, the intensity difference (i.e., ΔI = Imc – Iac) increased substantially when concentrations of dextran solution increased from 5 mg/mL to 15 mg/mL. Based on regression model of the AI, three parameters (i.e., AI0, a, and b) were obtained by conducting non-linear regression analysis. Figure 6A-ii depicted variations of three parameters with respect to Cdex. The number of control blood was set to Sn = 4 ~ 9. Since the AI variation at Cdex = 5 was not well fitted, the corresponding parameters (a, b) were excluded from the scatter plot. According to statistical test (i.e., one-way ANOVA), the corresponding p-value of each parameter was obtained as p-value < 0.0001 for parameter AI0, p-value = 0.001 for parameter a, and p-value = 0.0003 for parameter b. From the results, three parameters exhibited substantial differences with respect to Cdex. The previous studies also reported that the conventional aggregation index exhibited substantial difference with respect to the specific concentration of dextran solution[95,109,117,119]. From the experimental investigation, three parameters obtained by the proposed method could be used effectively as promising indices for quantifying RBCs aggregation.
Second, the present method was employed to measure blood viscosity with respect to Cdex. As shown in Figure 6B-i, time-dependent Qmc and ΔP were obtained with respect to Cdex = 5 and 15 mg/mL. The rising time of Qmc and the plateau value of the ΔP were increased significantly when dextran concentration was increased from 5 mg/mL to 15 mg/mL. As shown in Figure 6B-ii, by changing concentration of dextran solution ranging from Cdex = 0 to Cdex = 15 mg/mL, the μb was plotted as a function of . From the results, blood viscosity tended to decrease slightly with respect to shear rate. A pronounced increase in blood viscosity was observed at higher concentrations. Instead of conducting s best-fitted curve, blood viscosity values were summarized as mean ± standard deviation (n: number of data points). The corresponding viscosity of each Cdex was estimated as μb = 1.65 ± 0.09 cP (n = 218) for 1× PBS, μb = 2.1 ± 0.07 cP (n = 221) for Cdex = 5 mg/mL, and μb = 2.35 ± 0.1 cP (n = 221) for Cdex = 15 mg/mL. Figure 6B-iii showed variations of μb and ΔPmax with respect to Cdex. The number of test blood was set to Sn = 4 ~ 9. According to statistical test (i.e., one-way ANOVA), the corresponding p-value of both parameters was less than 0.0001. The results indicated that dextran solution contributed to increasing μb and ΔPmax markedly. To quantitatively compare with blood viscosity values obtained by the proposed method, as shown in Figure 6B-iv, the previous method was applied to measure blood viscosity of the same test bloods. Herein, as the previous method was only aimed at measuring blood viscosity, it did exclude RBC aggregation quantification.
In particular, from the perspective of the proposed method, the effect of RBC sedimentation during the blood-delivery step used for aggregation quantification was eliminated. The left-side panel showed microscopic images for quantifying blood viscosity. Herein, flow rate of test blood set to Qb = 10 mL/h. To maintain interface between test blood and reference fluid (1× PBS) near the channel center, flow rate of reference fluid was adjusted as Qr = 25 mL/h for Cdex = 5 mg/mL, Qr = 30 mL/h for Cdex = 10 mg/mL, and Qr = 35 mL/h for Cdex = 15 mg/mL. Herein, the corresponding interface of each test blood was calculated as β = 0.52 for Cdex = 5 mg/mL, β = 0.52 for Cdex = 10 mg/mL, and β = 0.49 for Cdex = 15 mg/mL. The right-side panel showed temporal variations of μb with respect to Cdex = 0 ~ 20 mg/mL. As expected, blood viscosity increased markedly when the dextran concentration increased from Cdex = 0 to Cdex = 20 mg/mL. The corresponding viscosity of each concentration of dextran solution was obtained as μb = 2.28 ± 0.04 cP (n = 494) for 1× PBS, μb = 2.67 ± 0.05 cP (n = 355) for Cdex = 5 mg/mL, μb = 3.24 ± 0.04 cP (n = 261) for Cdex = 10 mg/mL, μb = 3.42 ± 0.06 cP (n = 354) for Cdex = 15 mg/mL, and μb = 4.17 ± 0.06 cP (n = 288) for Cdex = 20 mg/mL. To quantitively compare with viscosity values obtained by both methods, as shown in Figure 6B-v, a scatter plot was created by plotting μb (prev. m.) along the horizontal axis and μb (pro. m.) along the vertical axis. A linear regression analysis was performed to probe the correlation between both methods. According to linear regression analysis, regression formula was obtained as μb (pro. m.) = 0.6895μb (prev. m.) (R2 = 0.9879). As the regression coefficient was calculated as higher value of R2 = 0.9879, viscosity values obtained by the both methods could be regarded as comparable, and exhibited strong linearity.
From the experimental investigation, the proposed method was successfully employed to prove the contribution of blood medium (i.e., dextran solution) to RBCs aggregation and blood viscosity. Specifically, the proposed method had the ability to provide consistent results compared with previous method.
3.6. Contribution of Blood-Loading Volume (Vb) into a Driving Syringe
For all experiments, 200 μL blood was loaded into a driving syringe. As shown in Figure 7A-i, air cavity of 250 μL was secured in the syringe, after which the blood volume (Vb) was suctioned. In the two-step delivery procedure, the air cavity was first compressed by approximately 50 μL, which drove blood from the syringe into the microfluidic channels. This initial air-driven step also removed pre-existing air bubbles in the fluidic path, resulting in complete blood-filling of the channels. Once 50 μL blood was discharged, delivery was stopped immediately. Subsequently, the remaining blood (~150 μL) was infused into the microfluidic channels using a syringe pump. Notably, about 150 μL blood was still considered as a sufficiently large volume for blood viscosity measurements. In this study, the blood flow rate was calibrated using the steady-state blood velocity. Due to air compliance effect in the syringe, blood velocity did not reach its plateau immediately after the syringe pump was activated. Therefore, blood had to be delivered continuously until the velocity stabilized at the plateau. Accordingly, this subsection aimed to determine the minimum blood-loading volume required to ensure reliable blood viscosity measurements. Test blood (Hct = 50%) was prepared by suspending normal RBCs into dextran solution (20 mg/mL). As shown in Figure 7A-i, blood-loading volume set to Vb = 100, 150, and 200 μL.
Figure 7A-ii showed time-lapse Imc and Iac with respect to Vb. As expected, Imc and Iac did not exhibit notable changes with respect to Vb during air-compression delivery. However, during syringe-pump delivery, the plateau periods of Imc and Iac increased as the Vb increased. As shown in Figure7A-iii, variations of three parameters (i.e., AI0, a, and b) were obtained with respect to Vb. The number of test blood was set to Sn = 2 ~ 3. According to statistical test (i.e., one-way ANOVA), the corresponding p-value of each parameter was obtained as p-value = 0.379 for parameter AI0, p-value = 0.347 for parameter a, and p-value = 0.731for parameter b. The results indicated that the specified ranges of blood-loading volume did not significantly affect RBCs aggregation.
As shown in Figure 7B-i, time-lapse Qmc and ΔP were obtained with respect to Vb. Increasing Vb led to a longer rising time of Qmc. When Vb was set to 100 μL, the steady-state ΔP was reduced compared with the other conditions. However, the steady plateau of ΔP remained unchanged as Vb increased from 150 μL to 200 μL. Figure 7B-ii depicted variations of μb with respect to . The correspond viscosity of each Vb was obtained as μb = 2.89 ± 0.22 cP (n = 119) for Vb = 100 μL, μb = 3.00 ± 0.12 cP (n = 182) for Vb = 150 μL, and μb = 2.75 ± 0.11 cP (n = 232) for Vb = 200 μL. As shown in Figure 7B-iii, variations of μb and ΔPmax were obtained with respect to Vb. According to statistical test (i.e., one-way ANOVA), the corresponding p-value of each parameter was obtained as p-value = 0.421 for μb, and p-value = 0.147 for ΔPmax. The results indicated that consistent blood viscosity measurement was achievable with blood-loading volume from 100 μL to 200 μL.
From the experimental measurements, it was confirmed that at least 100 μL blood was required to ensure consistent results.
3.7. Detection of Heat-Shocked RBCs
According to earlier studies[91,114,120,121,122], when normal RBCs are subjected to elevated temperatures exceeding 40 °C, both blood viscosity and RBC aggregation differ substantially from those under normal physiological temperature of 37 °C. In this subsection, the proposed method was employed to probe contribution of heat-shocked RBCs to blood viscosity and RBCs aggregation. Herein, exposure time of each temperature set to 40 min for 45ºC and 20 min for 50 ºC. Test blood (Hct = 50%) was prepared by suspending heat-shocked RBCs into dextran solution (20 mg/mL). Blood (Vb = 200 μL) was loaded into a driving syringe.
First, variations of RBC aggregation index (AI) were quantitatively assessed as a function of thermal exposure conditions. As shown in Figure 8A-i, RBC aggregation was quantified for RBCs exposed to 45 °C for up to 40 min. The first panel showed variations of AI with respect to . As the thermal expose duration increased, the variation of AI decreased significantly. Herein, as variations of AI was not well represented by a sigmodal function, the regression formula of AI was replaced by AI = AI0 exp (-a ). Two unknown parameters (i.e., AI0, and a) were then obtained by conducting non-linear regression analysis. The second panel showed variations of parameter AI0 with respect to thermal expose time (texp). Number of test blood was set to Sn = 2 ~ 3. The statistical test (i.e., one-way ANOVA) indicated a p-value of 0.051. Except texp = 10 min, the AI0 did not exhibit statistical significance with respect to texp. The last panel showed variations of parameter a with respect to texp. According to statistical test (i.e., one-way ANOVA), the p-value of parameter a was obtained as 0.088. As exposure time became longer, the overall magnitude of parameter a decreased progressively. As depicted in Figure 8A-ii, RBC aggregation was quantified for RBCs exposed to 50 °C for up to 20 min. The first panel showed variations of AI with respect to . A significant reduction in AI variation was observed with longer exposure times. The second panel showed variations of parameter AI0 with respect to texp. The one-way ANOVA gave a p-value of 0.007. The number of test blood was set to Sn = 2 ~ 4. In comparison with AI0 obtained at 45 °C (Figure 8A-i), the AI0 exhibited large fluctuations. The last panel showed variations of parameter a with respect to texp. According to statistical test (i.e., one-way ANOVA-test), the p-value was obtained as less than 0.0001. The parameter a decreased significantly as exposure time increased longer. From the results, the parameter a changed substantially when normal RBCs were exposed to higher temperatures and for longer durations.
Second, blood viscosity was assessed for RBCs exposed to specific temperatures and durations. Figure 8B-i showed quantification of blood viscosity for RBCs exposed to 45 ºC for up to 40 min. The first panel showed time-lapse Qmc and ΔP with respect exposure time. The second panel showed variations of μb with respect to texp. According to statistical test (i.e., one-way ANOVA), p-value was obtained as 0.983. From the results, no significant change in blood viscosity was observed after exposing RBCs to 45 °C for up to 40 minutes. The last panel showed variations of ΔPmax with respect to texp. According to the statistical test (i.e., one-way ANOVA), p-value was obtained as 0.915. The ΔPmax did not exhibit a statistically meaningful difference under 45 °C exposure for as long as 40 minutes.
Figure 8B-ii depicted quantification of blood viscosity for RBCs exposed to 50 ºC for up to 20 min. The first panel showed time-lapse Qmc and ΔP with respect to exposure time. When RBCs were exposed to 50 °C for 10 min, the rising time of Qmc increased and the steady plateau of ΔP became higher. No additional substantial changes were observed when the exposure duration was extended from 10 to 20 minutes. The second panel showed variations of μb with respect to texp. The statistical test (i.e., one-way ANOVA) gave p-value = 0.001. A marked difference in blood viscosity was observed for RBCs exposed to 50 °C for 10 minutes, whereas no statistically significant change occurred when the exposure duration was increased from 10 min to 20 min. The last panel showed ΔPmax with respect to texp. The pattern of ΔPmax was very similar to that of blood viscosity. The statistical test (i.e., one-way ANOVA) resulted in statistical significance (p - value = 0.006). Experimental results indicated that RBC structural integrity was preserved after exposure to 45 °C for up to 40 minutes[123,124]. In contrast, exposure to 50 °C for 10 minutes may have induced structural damage[123,125,126], which was accompanied by increase in blood viscosity (μb) and maximum pressure difference (ΔPmax)[96,127].
From the experimental investigation, with regard to RBCs exposed to 45 °C, RBC aggregation exhibited substantial difference. However, no significant difference of blood viscosity was observed. Thus, it was confirmed that RBC aggregation index could be used effectively for monitoring thermal-induced damages of RBCs.
As a limitation, the proposed method could not measure RBC aggregation and blood viscosity simultaneously. During the time interval (~120 s) required for RBC aggregation quantification, RBC sedimentation occurred, which impeded the subsequent viscosity determination. Further methodological improvements are therefore needed to allow both parameters to be measured concurrently.
4. Conclusions
In this study, a novel method was demonstrated to resolve several issues (i.e., dead volume loss in fluid path, hematocrit-sensitive blood velocity calibration, RBC sedimentation in a driving syringe, and flow-dependent hemorheological properties) raised by the previous methods. First, to reduce dead volume loss in the fluidic path (i.e., syringe needle, inlet tubing, and channels), air cavity (Vair = 250 μL) was secured above blood column (at least 100 μL) loaded into a driving syringe. Second, to calibrate hematocrit-sensitive blood velocity fields and minimize RBC sedimentation in a driving syringe, single syringe pump set to higher value of flow rate (Qsp = 10 mL/h). Third, to probe flow-dependent RBCs aggregation and blood viscosity sequentially, a microfluidic channel was carefully designed to have a main channel (i.e., high shear rate: > 1000 s-1) and an aggregation channel (i.e., low shear rate: < 50 s-1). RBCs aggregation index (AI) was then assessed by comparing image intensity of blood flow in both channels, especially under air-compression delivery. Shear rate-dependent AI was quantitively analyzed by conducting non-linear regression fitting. A micro-PIV technique was used to obtain blood flow-rate in each channel (i.e., Qmc for main channel and Qac for aggregation channel), where blood flow-rate was maintained constant. Both flow rates were obtained accurately by calibrating velocity fields in terms of Qsp and plateau value of blood velocity. Next, viscosity formular was derived by constructing fluidic circuit model. Air pressure difference in a driving syringe was estimated using ideal-gas law (i.e., pressure difference = fluidic resistance × flow rate) and time-lapse Qmc. Blood viscosity was then obtained by substituting air pressure difference (ΔP), Qmc, and Qac into blood viscosity formula. To validate performance of the proposed method, first, measurement accuracy of fluid viscosity was validated with glycerin solution (Cgl = 20% ~ 50%). The proposed method gave comparable results when compared with reference data. Second, using two kinds of blood medium (i.e., 1× PBS, and dextran solution [20 mg/ml]), the effect of RBC sedimentation in driving syringe was quantified with respect to blood flow-rate (Qsp). RBCs sedimentation had a strong impact on blood viscosity rather than RBC aggregation. To minimize the contribution of RBC sedimentation, the blood flow-rate set to higher value of flow rate (Qsp = 10 mL/h). Third, to probe the effect of RBCs volume (i.e., hematocrit) and blood medium (i.e., dextran solution) on RBCs aggregation and blood viscosity, test blood was prepared by suspending normal RBCs into dextran solution (i.e., Hct = 30% ~ 50%, Cdex = 0 ~ 20 mg/mL). RBCs aggregation exhibited substantial difference with respect to hematocrit and dextran concentration. Interestingly, blood viscosity did not show substantial difference in ranges of hematocrit (Hct = 30% ~ 50%) and higher concentration of dextran (above 10 mg/mL), which was resulted from RBCs sedimentation in a driving syringe. Fourth, at least 100 μL blood was required to ensure consistent results of RBCs aggregation and blood viscosity. At last, the proposed method was applied to investigate biomechanical difference in heat-shocked RBCs (i.e., 45 °C for 40 min, and 50 °C for 20 min). RBC aggregation index (AI) was superior to blood viscosity for monitoring thermal-induced damages of RBCs. In conclusion, the suggested method can accurately measure flow-dependent hemorheological properties, where air cavity (Vair = 250 μL) was secured above blood column (at least 100 μL) loaded into a driving syringe and syringe pump set to constant flow rate. Flow-dependent RBCs aggregation and blood viscosity could be used to detect substantial changes in RBCs or blood medium.
Author Contributions
Conceptualization, Y.J.K.; methodology, Y.J.K.; validation, Y.J.K.; formal analysis, Y.J.K.; investigation; data curation, Y.J.K.; writing—original draft preparation, Y.J.K.; writing—review and editing, Y.J.K.; visualization, Y.J.K.; supervision, Y.J.K.; project administration, Y.J.K.; funding acquisition, Y.J.K.
Funding
This study was supported by a research fund from the Chosun University in 2025.
Data Availability Statement
The original contributions presented in this study are included in the article material. Further inquiries can be directed to the corresponding author.
Conflicts of Interest
The authors declare no conflicts of interest.
References
- Kim, H.; Zhbanov, A.; Yang, S. Microfluidic systems for blood and blood cell characterization. Biosensors (Basel) 2022, 13, 13. [Google Scholar] [CrossRef]
- Grigorev, G.V.; Lebedev, A.V.; Wang, X.; Qian, X.; Maksimov, G.V.; Lin, L. Advances in microfluidics for single red blood cell analysis. Biosensors (Basel) 2023, 13, 117. [Google Scholar] [CrossRef]
- Isiksacan, Z.; D'Alessandro, A.; Wolf, S.M.; McKenna, D.H.; Tessier, S.N.; Kucukal, E.; Gokaltun, A.A.; William, N.; Sandlin, R.D.; Bischof, J.; Mohandas, N.; Busch, M.P.; Elbuken, C.; Gurkan, U.A.; Toner, M.; Acker, J.P.; Yarmush, M.L.; Usta, O.B. Assessment of stored red blood cells through lab-on-a-chip technologies for precision transfusion medicine. Proc Natl Acad Sci U S A 2023, 120, e2115616120. [Google Scholar] [CrossRef]
- Tavakolidakhrabadi, A.; Stark, M.; Bacher, U.; Legros, M.; Bessire, C. Optimization of microfluidics for point-of-care blood sensing. Biosensors (Basel) 2024, 14, 266. [Google Scholar] [CrossRef] [PubMed]
- Peters, S.A.; Woodward, M.; Rumley, A.; Tunstall-Pedoe, H.D.; Lowe, G.D. Plasma and blood viscosity in the prediction of cardiovascular disease and mortality in the Scottish Heart Health Extended Cohort Study. Eur. J. Prev. Cardiol. 2017, 24, 161–167. [Google Scholar] [CrossRef] [PubMed]
- Lowe, G.D.; Lee, A.J.; Rumley, A.; Price, J.F.; Fowkes, F.G. Blood viscosity and risk of cardiovascular events: the Edinburgh artery study. Br. J. Haematol. 1997, 96, 163–173. [Google Scholar] [CrossRef]
- Bakhtiaridoost, S.; Musuroi, C.; Volmer, M.; Florescu, M. Optoelectronic microfluidic device for point-of-care blood plasma viscosity measurement. Lab Chip 2024, 24, 3305–3314. [Google Scholar] [CrossRef]
- Chang, Y.N.; Yao, D.J. Development of a microfluidic viscometer for non-Newtonian blood analog fluid analysis. Bioengineering (Basel) 2024, 11, 1298. [Google Scholar] [CrossRef] [PubMed]
- Kang, Y.J. A microfluidic-based blood viscometer. Physics of Fluids 2025, 37. [Google Scholar] [CrossRef]
- Gyawali, P.; Ziegler, D.; Cailhier, J.F.; Denault, A.; Cloutier, G. Quantitative measurement of erythrocyte aggregation as a systemic inflammatory marker by ultrasound imaging: a systematic review. Ultrasound Med. Biol. 2018, 44, 1303–1317. [Google Scholar] [CrossRef]
- Ami, R.B.; Barshtein, G.; Zeltser, D.; Goldberg, Y.; Shapira, I.; Roth, A.; Keren, G.; Miller, H.; Prochorov, V.; Eldor, A.; Berliner, S.; Yedgar, S. Parameters of red blood cell aggregation as correlates of the inflammatory state. Am. J. Physiol. Heart Circ. Physiol. 2001, 280, H1982–H1988. [Google Scholar] [CrossRef] [PubMed]
- Charansonney, O.L.; Meseguer, E.; Goube, P.; Vicaut, E. Erythrocyte aggregation kinetics for studying the vascular phase of inflammation in patients with suspected acute coronary syndrome or acute stroke. Sci Rep 2025, 15, 38049. [Google Scholar] [CrossRef]
- Mury, P.; Faes, C.; Millon, A.; Mura, M.; Renoux, C.; Skinner, S.; Nicaise, V.; Joly, P.; Della Schiava, N.; Lermusiaux, P.; Connes, P.; Pialoux, V. Higher Daily Physical Activity Level Is Associated with Lower RBC Aggregation in Carotid Artery Disease Patients at High Risk of Stroke. Front Physiol 2017, 8, 1043. [Google Scholar] [CrossRef]
- Gholivand, A.; Korculanin, O.; Dahlhoff, K.; Babaki, M.; Dickscheid, T.; Lettinga, M.P. Effect of in-plane and out-of-plane bifurcated microfluidic channels on the flow of aggregating red blood cells. Lab Chip 2024, 24, 2317–2326. [Google Scholar] [CrossRef]
- Kang, Y.J. Assessment of continuous flow-dependent red cell aggregation using a microfluidic chip. Applied Sciences 2025, 15. [Google Scholar] [CrossRef]
- Kang, Y.J. Microfluidic chip for quantitatively assessing hemorheological parameters. Micromachines 2025, 16, 567. [Google Scholar] [CrossRef] [PubMed]
- Sadaf, A.; Seu, K.G.; Thaman, E.; Fessler, R.; Konstantinidis, D.G.; Bonar, H.A.; Korpik, J.; Ware, R.E.; McGann, P.T.; Quinn, C.T.; Kalfa, T.A. Automated Oxygen Gradient Ektacytometry: A Novel Biomarker in Sickle Cell Anemia. Front Physiol 2021, 12, 636609. [Google Scholar] [CrossRef]
- Boisson, C.; Nader, E.; Renoux, C.; Gauthier, A.; Poutrel, S.; Bertrand, Y.; Stauffer, E.; Virot, E.; Hot, A.; Fort, R.; Cannas, G.; Joly, P.; Connes, P. Shear-Stress-Gradient and Oxygen-Gradient Ektacytometry in Sickle Cell Patients at Steady State and during Vaso-Occlusive Crises. Cells 2022, 11. [Google Scholar] [CrossRef]
- Rab, M.A.E.; Kanne, C.K.; Boisson, C.; Bos, J.; van Oirschot, B.A.; Houwing, M.E.; Renoux, C.; Bartels, M.; Rijneveld, A.W.; Nur, E.; Cnossen, M.H.; Joly, P.; Nader, E.; Fort, R.; Connes, P.; van Wijk, R.; Sheehan, V.A.; van Beers, E.J. Oxygen gradient ektacytometry-derived biomarkers are associated with acute complications in sickle cell disease. Blood Adv 2024, 8, 276–286. [Google Scholar] [CrossRef]
- Barber, B.E.; Russell, B.; Grigg, M.J.; Zhang, R.; William, T.; Amir, A.; Lau, Y.L.; Chatfield, M.D.; Dondorp, A.M.; Anstey, N.M.; Yeo, T.W. Reduced red blood cell deformability in Plasmodium knowlesi malaria. Blood Adv 2018, 2, 433–443. [Google Scholar] [CrossRef]
- Renoux, C.; Faivre, M.; Bessaa, A.; Da Costa, L.; Joly, P.; Gauthier, A.; Connes, P. Impact of surface-area-to-volume ratio, internal viscosity and membrane viscoelasticity on red blood cell deformability measured in isotonic condition. Sci Rep 2019, 9, 6771. [Google Scholar] [CrossRef]
- Williams, D.C.; Wood, D.K. High-throughput quantification of red blood cell deformability and oxygen saturation to probe mechanisms of sickle cell disease. Proc Natl Acad Sci U S A 2023, 120, e2313755120. [Google Scholar] [CrossRef]
- Kang, Y.J.; Serhrouchni, S.; Makhro, A.; Bogdanova, A.; Lee, S.S. Simple assessment of red blood cell deformability using blood pressure in capillary channels for effective detection of subpopulations in red blood cells. ACS Omega 2022, 7, 38576–38588. [Google Scholar] [CrossRef]
- Liu, W.; Xie, L.; Yang, J.; Gong, X.; Sun, D.; Zhang, C. A microfluidic device for detecting the deformability of red blood cells. Biosensors (Basel) 2025, 15, 758. [Google Scholar] [PubMed]
- Kajitani, K.; Ohtani, T.; Higuchi, R.; Chimura, M.; Sera, F.; Tsai, C.D.; Ueda, Y.; Nishimura, J.I.; Sakata, Y. An on-chip deformability checker demonstrates that the severity of iron deficiency is associated with increased deformability of red blood cells. Sci Rep 2025, 15, 19994. [Google Scholar] [PubMed]
- Jiang, H.; Li, X.; Liu, Z.; Luo, S.; Huang, J.; Chen, C.; Chen, R.; Li, F. A microfluidic approach for assessing the rheological properties of healthy versus thalassemic red blood cells. Micromachines (Basel) 2025, 16, 957. [Google Scholar] [CrossRef]
- You, J.; Park, C.-A.; Kim, A.-K.; Jeon, H.R.; Kim, D.-I.; Shin, S. Ultrasensitive microfluidic detection of red blood cell deformability: Age-related decline in deformability. Physics of Fluids 2025, 37. [Google Scholar] [CrossRef]
- Jou, J.M.; Lewis, S.M.; Briggs, C.; Lee, S.H.; De La Salle, B.; McFadden, S.; International Council for Standardization in; H. ICSH review of the measurement of the erythocyte sedimentation rate. Int J Lab Hematol 2011, 33, 125–32. [Google Scholar]
- Kang, Y.J. Multiple-parameter sensing using an autonomous blood flow in a microfluidic chip. Results in Engineering 2025, 28. [Google Scholar] [CrossRef]
- Passos, A.; Louka, M.; Vryonidis, C.; Inglezakis, A.; Loizou, C.; Nikiphorou, E.; Psarelis, S.; Kaliviotis, E. Red blood cell sedimentation rate measurements in a high aspect ratio microchannel. Clin Hemorheol Microcirc 2022, 82, 313–322. [Google Scholar] [CrossRef]
- Oshabaheebwa, S.; Delianides, C.A.; Patwardhan, A.A.; Evans, E.N.; Sekyonda, Z.; Bode, A.; Apio, F.M.; Mutuluuza, C.K.; Sheehan, V.A.; Suster, M.A.; Gurkan, U.A.; Mohseni, P. A miniaturized wash-free microfluidic assay for electrical impedance-based assessment of red blood cell-mediated microvascular occlusion. Biosens. Bioelectron. 2024, 258, 116352. [Google Scholar] [CrossRef] [PubMed]
- Williams, D.C.; Higgins, J.M.; Wood, D.K. Quantifying the unique mechanical properties of irreversibly sickled cells in sickle cell disease. Blood Vessel Thromb Hemost 2025, 2, 100077. [Google Scholar]
- Szafraniec, H.M.; Valdez, J.M.; Iffrig, E.; Lam, W.A.; Higgins, J.M.; Pearce, P.; Wood, D.K. Feature tracking microfluidic analysis reveals differential roles of viscosity and friction in sickle cell blood. Lab Chip 2022, 22, 1565–1575. [Google Scholar] [CrossRef]
- Li, G.; Ye, T.; Yang, B.; Wang, S.; Li, X. Temporal-spatial heterogeneity of hematocrit in microvascular networks. Physics of Fluids 2023, 35, 021906. [Google Scholar] [CrossRef]
- Lai, B.J.; Zhu, L.T.; Chen, Z.; Ouyang, B.; Luo, Z.H. Review on Blood Flow Dynamics in Lab-on-a-Chip Systems: An Engineering Perspective. Chem Bio Eng 2024, 1, 26–43. [Google Scholar]
- Xu, J.; Harasek, M.; Gfohler, M. From soft lithography to 3D printing: current status and future of microfluidic device fabrication. Polymers (Basel) 2025, 17, 455. [Google Scholar] [CrossRef] [PubMed]
- Antonova, N.; Khristov, K. Microrheological and microfluidic approaches for evaluation of the mechanical properties of blood cells. Applied Sciences 2025, 15, 8291. [Google Scholar] [CrossRef]
- Kang, Y.J.; Lee, S.J. In vitro and ex vivo measurement of the biophysical properties of blood using microfluidic platforms and animal models. Analyst 2018, 143, 2723–2749. [Google Scholar]
- Del Giudice, F. A review of microfluidic devices for rheological characterisation. Micromachines (Basel) 2022, 13, 167. [Google Scholar] [CrossRef]
- Jang, I.; Berg, K.E.; Henry, C.S. Viscosity measurements utilizing a fast-flow microfluidic paper-based device. Sensors and Actuators B: Chemical 2020, 319, 128240. [Google Scholar]
- Kang, H.; Jang, I.; Song, S.; Bae, S.C. Development of a paper-based viscometer for blood plasma using colorimetric analysis. Anal Chem 2019, 91, 4868–4875. [Google Scholar]
- Man, Y.; Maji, D.; An, R.; Ahuja, S.P.; Little, J.A.; Suster, M.A.; Mohseni, P.; Gurkan, U.A. Microfluidic electrical impedance assessment of red blood cell-mediated microvascular occlusion. Lab Chip 2021, 21, 1036–1048. [Google Scholar] [CrossRef] [PubMed]
- Chaturvedi, A.; Nagaraj, S.K.; Gorthi, S.S.; Seelamantula, C.S. An efficient microscale technique for determining the erythrocyte sedimentation rate. SLAS Technol 2017, 22, 565–572. [Google Scholar] [CrossRef]
- Oh, K.W.; Lee, K.; Ahn, B.; Furlani, E.P. Design of pressure-driven microfluidic networks using electric circuit analogy. Lab Chip 2012, 12, 515–45. [Google Scholar] [CrossRef]
- Vilimi, Z.; Papay, Z.E.; Basa, B.; Orekhova, X.; Kallai-Szabo, N.; Antal, I. Microfluidic rheology: an innovative method for viscosity measurement of gels and various pharmaceuticals. Gels 2024, 10, 464. [Google Scholar] [CrossRef]
- Kim, B.J.; Lee, Y.S.; Zhbanov, A.; Yang, S. A physiometer for simultaneous measurement of whole blood viscosity and its determinants: hematocrit and red blood cell deformability. Analyst 2019, 144, 3144–3157. [Google Scholar] [CrossRef] [PubMed]
- Kang, Y.J.; Yeom, E.; Lee, S.J. Microfluidic biosensor for monitoring temporal variations of hemorheological and hemodynamic properties using an extracorporeal rat bypass loop. Anal Chem 2013, 85, 10503–11. [Google Scholar] [CrossRef]
- Kapadia, W.; V Giri, N.; Qin, N.; Zhao, P.; Phan, C.-M.; Haines, L.; Jones, L.; Ren, C.L. A novel microfluidic viscometer for measuring viscosity of ultrasmall volumes of Newtonian and non-Newtonian liquids. Journal of Micromechanics and Microengineering 2025, 35, 055005. [Google Scholar] [CrossRef]
- Khnouf, R.; Karasneh, D.; Abdulhay, E.; Abdelhay, A.; Sheng, W.; Fan, Z.H. Microfluidics-based device for the measurement of blood viscosity and its modeling based on shear rate, temperature, and heparin concentration. Biomed Microdevices 2019, 21, 80. [Google Scholar] [CrossRef]
- Riera-Llobet, C.; Méndez-Mora, L.; Cabello-Fusarés, M.; Hernández-Machado, A. Altered blood rheology in multiwidth microchannels: Hematocrit and tonicity variation. Physics of Fluids 2023, 35, 082017. [Google Scholar] [CrossRef]
- Mendez-Mora, L.; Cabello-Fusares, M.; Ferre-Torres, J.; Riera-Llobet, C.; Lopez, S.; Trejo-Soto, C.; Alarcon, T.; Hernandez-Machado, A. Microrheometer for biofluidic analysis: electronic detection of the fluid-front advancement. Micromachines (Basel) 2021, 12, 726. [Google Scholar] [CrossRef]
- Trejo-Soto, C.; Costa-Miracle, E.; Rodriguez-Villarreal, I.; Cid, J.; Alarcon, T.; Hernandez-Machado, A. Capillary Filling at the Microscale: Control of Fluid Front Using Geometry. PLoS One 2016, 11, e0153559. [Google Scholar] [CrossRef]
- Phu Pham, L.H.; Bautista, L.; Vargas, D.C.; Luo, X. A simple capillary viscometer based on the ideal gas law. RSC Adv 2018, 8, 30441–30447. [Google Scholar] [CrossRef]
- Kang, Y.J. Microfluidic viscometer using capillary pressure sensing. Physics of Fluids 2023, 35, 121907. [Google Scholar] [CrossRef]
- Gautam, N.; Ram, R.; Bishnoi, V.; Sarkar, A. A low-cost and disposable capillary-based paper sensor for measuring blood-plasma viscosity using a smartphone app. Microfluidics and Nanofluidics 2023, 27, 41. [Google Scholar]
- Uno, M.O.; Omori, M.; Sakamoto, K. Nonwoven-fabric-based microfluidic devices for solution viscosity measurements. Sensors & Diagnostics 2024, 3, 1551–1561. [Google Scholar]
- Mustafa, A.; Haider, D.; Barua, A.; Tanyeri, M.; Erten, A.; Yalcin, O. Machine learning based microfluidic sensing device for viscosity measurements. Sensors & Diagnostics 2023, 2, 1509–1520. [Google Scholar] [CrossRef]
- Eidi, A. Blood Viscosity Biosensor Based on Electromagnetic Resonator. Cardiovasc Eng Technol 2023, 14, 526–533. [Google Scholar] [CrossRef]
- Liao, S.; Ye, P.; Chen, C.; Zhang, J.; Xu, L.; Tan, F. Comparing of frequency shift and impedance analysis method based on QCM sensor for measuring the blood viscosity. Sensors (Basel) 2022, 22. [Google Scholar] [CrossRef]
- Chen, L.; Li, D.; Liu, X.; Xie, Y.; Shan, J.; Huang, H.; Yu, X.; Chen, Y.; Zheng, W.; Li, Z. Point-of-care blood coagulation assay based on dynamic monitoring of blood viscosity using droplet microfluidics. ACS Sens 2022, 7, 2170–2177. [Google Scholar] [CrossRef]
- Wu, Y.F.; Hsu, P.S.; Tsai, C.S.; Pan, P.C.; Chen, Y.L. Significantly increased low shear rate viscosity, blood elastic modulus, and RBC aggregation in adults following cardiac surgery. Sci Rep 2018, 8, 7173. [Google Scholar] [CrossRef]
- Nader, E.; Skinner, S.; Romana, M.; Fort, R.; Lemonne, N.; Guillot, N.; Gauthier, A.; Antoine-Jonville, S.; Renoux, C.; Hardy-Dessources, M.D.; Stauffer, E.; Joly, P.; Bertrand, Y.; Connes, P. Blood rheology: key parameters, impact on blood flow, role in sickle cell disease and effects of exercise. Front Physiol 2019, 10, 1329. [Google Scholar]
- Lee, C.A.; Farooqi, H.M.U.; Paeng, D.G. Axial shear rate: A hemorheological factor for erythrocyte aggregation under Womersley flow in an elastic vessel based on numerical simulation. Comput Biol Med 2023, 157, 106767. [Google Scholar]
- Shin, S.; Nam, J.H.; Hou, J.X.; Suh, J.S. A transient, microfluidic approach to the investigation of erythrocyte aggregation: the threshold shear-stress for erythrocyte disaggregation. Clin Hemorheol Microcirc 2009, 42, 117–25. [Google Scholar] [CrossRef]
- Reinhart, W.H.; Piety, N.Z.; Shevkoplyas, S.S. Influence of red blood cell aggregation on perfusion of an artificial microvascular network. Microcirculation 2017, 24, e12317. [Google Scholar] [CrossRef]
- Lee, C.A.; Paeng, D.G. Numerical simulation of spatiotemporal red blood cell aggregation under sinusoidal pulsatile flow. Sci Rep 2021, 11, 9977. [Google Scholar] [CrossRef]
- Charansonney, O.L.; Morel, P.; Dufaux, J.; Vicaut, E. Description and validation of a new, simple, easy-to handle, point-of-care technique for measuring erythrocyte aggregation kinetics. Sci Rep 2022, 12, 14798. [Google Scholar] [CrossRef] [PubMed]
- Alexandrova-Watanabe, A.; Abadjieva, E.; Ivanova, M.; Gartcheva, L.; Langari, A.; Guenova, M.; Tiankov, T.; Nikolova, E.V.; Krumova, S.; Todinova, S. Quantitative assessment of red blood cell disaggregation in chronic lymphocytic leukemia via software image flow analysis. Fluids 2025, 10, 167. [Google Scholar] [CrossRef]
- Namgung, B.; Lee, T.; Tan, J.K.S.; Poh, D.K.H.; Park, S.; Chng, K.Z.; Agrawal, R.; Park, S.Y.; Leo, H.L.; Kim, S. Vibration motor-integrated low-cost, miniaturized system for rapid quantification of red blood cell aggregation. Lab Chip 2020, 20, 3930–3937. [Google Scholar] [CrossRef] [PubMed]
- Wen, J.; Wan, N.; Bao, H.; Li, J. Quantitative measurement and evaluation of red blood cell aggregation in normal blood based on a modified Hanai equation. Sensors (Basel) 2019, 19, 1095. [Google Scholar]
- Isiksacan, Z.; Serhatlioglu, M.; Elbuken, C. In vitro analysis of multiple blood flow determinants using red blood cell dynamics under oscillatory flow. Analyst 2020, 145, 5996–6005. [Google Scholar]
- Isiksacan, Z.; Erel, O.; Elbuken, C. A portable microfluidic system for rapid measurement of the erythrocyte sedimentation rate. Lab Chip 2016, 16, 4682–4690. [Google Scholar] [PubMed]
- Kang, Y.J. Continuous and simultaneous measurement of the biophysical properties of blood in a microfluidic environment. Analyst 2016, 141, 6583–6597. [Google Scholar] [CrossRef]
- Nam, J.H.; Xue, S.; Lim, H.; Shin, S. Study of erythrocyte aggregation at pulsatile flow conditions with backscattering analysis. Clin Hemorheol Microcirc 2012, 50, 257–66. [Google Scholar]
- Kang, Y.J. Biomechanical assessment of red blood cells in pulsatile blood flows. Micromachines (Basel) 2023, 14, 317. [Google Scholar] [CrossRef]
- Omura, M.; Yagi, K.; Nagaoka, R.; Hasegawa, H. Contrast analysis in ultrafast ultrasound blood flow imaging of jugular vein. J Med Ultrason (2001) 2023, 50, 131–141. [Google Scholar] [PubMed]
- Lee, C.A.; Paeng, D.G. Spatiotemporal blood viscosity by local hematocrit under pulsatile flow: Whole blood experiments and computational analysis. Comput Biol Med 2025, 198, 111253. [Google Scholar]
- Maung Ye, S.S.; Kim, S. A mechanistic model of cross-bridge migration in RBC aggregation and disaggregation. Front Bioeng Biotechnol 2022, 10, 1049878. [Google Scholar] [CrossRef]
- Fenech, M.; Garcia, D.; Meiselman, H.J.; Cloutier, G. A particle dynamic model of red blood cell aggregation kinetics. Ann Biomed Eng 2009, 37, 2299–309. [Google Scholar] [PubMed]
- Shi, X.; Tan, W.; Lu, Y.; Cao, W.; Zhu, G. A needle tip CCEA microfluidic device based on enhanced Dean flow for cell washing. Microsyst Nanoeng 2021, 7, 81. [Google Scholar] [CrossRef] [PubMed]
- Ernits, M.; Reinsalu, O.; Kyritsakis, A.; Linko, V.; Zadin, V. Low-cost, open-source, high-precision pressure controller for multi-channel mcrofluidics. Biosensors (Basel) 2025, 15, 154. [Google Scholar] [CrossRef]
- Akh, L.; Jung, D.; Frantz, W.; Bowman, C.; Neu, A.C.; Ding, X. Microfluidic pumps for cell sorting. Biomicrofluidics 2023, 17, 051502. [Google Scholar] [CrossRef]
- Kang, Y.J. Red blood cell sedimentation index using shear stress of blood flow in microfluidic channel. Biosensors (Basel) 2022, 12, 547. [Google Scholar] [CrossRef]
- Kang, Y.J. Microfluidic-based biosensor for blood viscosity and erythrocyte sedimentation rate using disposable fluid delivery system. Micromachines (Basel) 2020, 11, 215. [Google Scholar] [CrossRef]
- Kang, Y.J. Blood viscometer using capillary blood flow under disposable compliance pump. International Journal of Mechanical Sciences 2024, 277, 109456. [Google Scholar] [CrossRef]
- Kim, G.; Jeong, S.; Kang, Y.J. Ultrasound standing wave-based cell-to-liquid separation for measuring viscosity and aggregation of blood sample. Sensors (Basel) 2020, 20, 2284. [Google Scholar] [CrossRef] [PubMed]
- Thielicke, W.; Stamhuis, E.J. PIVlab – towards user-friendly, affordable and accurate digital particle image velocimetry in MATLAB. Journal of Open Research Software 2014, 2, e30. [Google Scholar] [CrossRef]
- Kloosterman, A.; Poelma, C.; Westerweel, J. Flow rate estimation in large depth-of-field micro-PIV. Experiments in Fluids 2010, 50, 1587–1599. [Google Scholar] [CrossRef]
- Kang, Y.J. Microfluidic-based effective monitoring of bloods by measuring RBC aggregation and blood viscosity under stepwise varying shear rates. Korea-Australia Rheology Journal 2020, 32, 15–27. [Google Scholar] [CrossRef]
- Kounov, N.B.; Petrov, V.G. Determination of erythrocyte aggregation. Math. Biosci. 1999, 157, 345–356. [Google Scholar] [CrossRef]
- Rodriguez-Villarreal, A.I.; Carmona-Flores, M.; Colomer-Farrarons, J. Effect of temperature and flow rate on the cell-free area in the microfluidic channel. Membranes (Basel) 2021, 11, 109. [Google Scholar] [CrossRef] [PubMed]
- Castellini, M.A.; Baskurt, O.; Castellini, J.M.; Meiselman, H.J. Blood rheology in marine mammals. Front Physiol 2010, 1, 146. [Google Scholar] [CrossRef] [PubMed]
- Krisher, J.A.; Malinauskas, R.A.; Day, S.W. The effect of blood viscosity on shear-induced hemolysis using a magnetically levitated shearing device. Artif Organs 2022, 46, 1027–1039. [Google Scholar] [CrossRef] [PubMed]
- Lee, C.Y.; Lee, S.L.; Kim, E.; Kang, J.; Jung, S.; Kim, N.; Jung, J.; Lee, D.H.; Roh, Y.H.; Lee, D. Whole Blood Viscosity Reference Intervals and Its Correlation with Hematology and Serum Chemistry in Cats Using Scanning Capillary Method. Animals (Basel) 2023, 13. [Google Scholar] [CrossRef]
- Baskurt, O.K.; Meiselman, H.J. Blood rheology and hemodynamics. Semin. Thromb. Hemost. 2003, 29, 435–450. [Google Scholar] [CrossRef]
- Mehri, R.; Mavriplis, C.; Fenech, M. Red blood cell aggregates and their effect on non-Newtonian blood viscosity at low hematocrit in a two-fluid low shear rate microfluidic system. PLoS One 2018, 13, e0199911. [Google Scholar] [CrossRef]
- Sadek, S.H.; Rubio, M.; Lima, R.; Vega, E.J. Blood particulate analogue fluids: A review. Materials (Basel) 2021, 14, 2451. [Google Scholar] [CrossRef]
- Knüppel, F.; Thomas, I.; Wurm, F.-H.; Torner, B. Suitability of different blood-analogous fluids in determining the pump characteristics of a ventricular assist device. Fluids 2023, 8. [Google Scholar] [CrossRef]
- Lenzen, P.S.; Dingfelder, F.; Muller, M.; Arosio, P. Portable microfluidic viscometer for formulation development and in situ quality control of protein and antibody solutions. Anal Chem 2024, 96, 13185–13190. [Google Scholar] [CrossRef]
- Cheng, N.-S. Formula for the viscosity of a glycerol−water mixture. Industrial & Engineering Chemistry Research 2008, 47, 3285–3288. [Google Scholar] [CrossRef]
- Zhbanov, A.; Yang, S. Effects of Aggregation on Blood Sedimentation and Conductivity. PLoS One 2015, 10, e0129337. [Google Scholar] [CrossRef]
- Fabry, T.L. Mechanism of rbc aggregation and sedimentation. Blood 1987, 70, 1572–1576. [Google Scholar] [PubMed]
- Zydney, A.L.; Oliver, J.D.; Colton, C.K. A constitutive equation for the viscosity of stored red cell suspensions: Effect of hematocrit, shear rate, and suspending phase. J. Rheol. 1991, 35, 1639–1680. [Google Scholar] [CrossRef]
- Kang, Y.J. Microfluidic-based measurement method of red blood cell aggregation under hematocrit variations. Sensors (Basel) 2017, 17. [Google Scholar] [CrossRef]
- Ji, H.S.; Lee, S.J. In vitro hemorheological study on the hematocrit effect of human blood flow in a microtube. Clin. Hemorheol. Microcirc. 2008, 40, 19–30. [Google Scholar] [CrossRef] [PubMed]
- Kang, Y.J. Quantitative monitoring of dynamic blood flows using coflowing laminar streams in a sensorless approach. Applied Sciences 2021, 11, 7260. [Google Scholar] [CrossRef]
- Gupta, S.; Wang, W.S.; Vanapalli, S.A. Microfluidic viscometers for shear rheology of complex fluids and biofluids. Biomicrofluidics 2016, 10, 043402. [Google Scholar] [CrossRef]
- Guillot, P.; Panizza, P.; Salmon, J.-B.; Joanicot, M.; Colin, A. Viscosimeter on a microfluidic chip. Langmuir 2006, 22, 6438–6445. [Google Scholar] [CrossRef]
- Kang, Y.J. Microfluidic-based technique for measuring RBC aggregation and blood viscosity in a continuous and simultaneous fashion. Micromachines (Basel) 2018, 9, 467. [Google Scholar] [CrossRef]
- Baskurt, O.K.; Boynard, M.; Cokelet, G.C.; Connes, P.; Cooke, B.M.; Forconi, S.; Liao, F.; Hardeman, M.R.; Jung, F.; Meiselman, H.J.; Nash, G.; Nemeth, N.; Neu, B.; Sandhagen, B.; Shin, S.; Thurston, G.; Wautier, J.L. International Expert Panel for Standardization of Hemorheological, M. New guidelines for hemorheological laboratory techniques. Clin. Hemorheol. Microcirc. 2009, 42, 75–97. [Google Scholar]
- Baskurt, O.K.; Uyuklu, M.; Hardeman, M.R.; Meiselman, H.J. Photometric measurements of red blood cell aggregation: light transmission versus light reflectance. J. Biomed. Opt. 2009, 14, 054044. [Google Scholar] [CrossRef]
- Trejo-Soto, C.; Hernandez-Machado, A. Normalization of blood viscosity according to the hematocrit and the shear rate. Micromachines (Basel) 2022, 13, 357. [Google Scholar] [CrossRef] [PubMed]
- Kang, Y.J. Biomechanical investigation of red cell sedimentation using blood shear stress and blood flow image in a capillary chip. Micromachines (Basel) 2023, 14, 1594. [Google Scholar] [CrossRef] [PubMed]
- Weber-Fishkin, S.; Seidner, H.S.; Gunter, G.; Frame, M.D. Erythrocyte aggregation in sudden flow arrest is linked to hyperthermia, hypoxemia, and band 3 availability. J. Thromb. Haemost. 2022, 20, 2284–2292. [Google Scholar] [CrossRef]
- Flormann, D.; Aouane, O.; Kaestner, L.; Ruloff, C.; Misbah, C.; Podgorski, T.; Wagner, C. The buckling instability of aggregating red blood cells. Sci Rep 2017, 7, 7928. [Google Scholar] [CrossRef]
- Lee, K.; Shirshin, E.; Rovnyagina, N.; Yaya, F.; Boujja, Z.; Priezzhev, A.; Wagner, C. Dextran adsorption onto red blood cells revisited: single cell quantification by laser tweezers combined with microfluidics. Biomed Opt Express 2018, 9, 2755–2764. [Google Scholar] [CrossRef]
- Neu, B.; Wenby, R.; Meiselman, H.J. Effects of dextran molecular weight on red blood cell aggregation. Biophys. J. 2008, 95, 3059–65. [Google Scholar] [CrossRef]
- Xu, X.; Yu, L.; Chen, Z. Velocity variation assessment of red blood cell aggregation with spectral domain Doppler optical coherence tomography. Ann. Biomed. Eng. 2010, 38, 3210–3217. [Google Scholar] [CrossRef]
- Kang, Y.J. Periodic and simultaneous quantification of blood viscosity and red blood cell aggregation using a microfluidic platform under in-vitro closed-loop circulation. Biomicrofluidics 2018, 12, 024116. [Google Scholar] [CrossRef]
- Matrai, A.A.; Varga, G.; Tanczos, B.; Barath, B.; Varga, A.; Horvath, L.; Bereczky, Z.; Deak, A.; Nemeth, N. In vitro effects of temperature on red blood cell deformability and membrane stability in human and various vertebrate species. Clin Hemorheol Microcirc 2021, 78, 291–300. [Google Scholar] [CrossRef] [PubMed]
- Eckmann, D.M.; Bowers, S.; Stecker, M.; Cheung, A.T. Hematocrit, volume expander, temperature, and shear rate effects on blood viscosity. Anesth. Analg. 2000, 91, 539–545. [Google Scholar] [CrossRef] [PubMed]
- Zupančič Valant, A.; Žiberna, L.; Papaharilaou, Y.; Anayiotos, A.; Georgiou, G.C. The influence of temperature on rheological properties of blood mixtures with different volume expanders—implications in numerical arterial hemodynamics simulations. Rheol. Acta 2011, 50, 389–402. [Google Scholar] [CrossRef]
- Lee, S.; Lee, S.; Oh, J.E.; Shin, W.J.; Min, W.K.; Gwak, M. Hemolysis of irradiated leukoreduced red blood cells during rapid warming: An in vitro experimental study. J. Dent. Anesth. Pain Med. 2015, 15, 229–233. [Google Scholar] [CrossRef]
- Walt, J.H.V.D.; Russell, W.J. The effect of heating on the osmotic fragility of stored blood Br. J. Anaesth. 1978, 50, 815–820. [Google Scholar] [CrossRef]
- Liu, Z.L.; Li, H.; Qiang, Y.; Buffet, P.; Dao, M.; Karniadakis, G.E. Computational modeling of biomechanics and biorheology of heated red blood cells. Biophys. J. 2021, 120, 4663–4671. [Google Scholar] [CrossRef]
- Lepock, J.R.; Frey, H.E.; Bayne, H.; Markus, J. Relationship of hyperthermia-induced hemolysis of human erythrocytes to the thermal denaturation of membrane proteins. Biochim. Biophys. Acta 1989, 980, 191–201. [Google Scholar] [PubMed]
- Perazzo, A.; Peng, Z.; Young, Y.-N.; Feng, Z.; Wood, D.K.; Higgins, J.M.; Stone, H.A. The effect of rigid cells on blood viscosity: linking rheology and sickle cell anemia. Soft Matter 2022, 18, 554–565. [Google Scholar] [CrossRef] [PubMed]
Figure 1.
A proposed microfluidic rheometry for probing RBCs aggregation and blood viscosity. (A) Experimental setup, including, a microfluidic chip, single syringe pump, and imaging acquisition system. A microfluidic chip was designed to have an inlet, main channel (mc), aggregation channel (ac), and two outlets. A disposable syringe was partially filled with air (Vair = 250 μL) and blood (Vb = 100 ~ 200 μL), and connected to the inlet with a polyethylene tubing (i.d. = 0.25 mm, length = 300 mm). Blood flow images were recorded using an imaging acquisition setup consisting of a microscope (4× objective lens, NA = 0.1), and a high-speed camera operating at 5000 frames per second. An external trigger interval set to a specific period (T = 0.25 s). (B) Quantification of blood velocity and blood imaging intensity in the microfluidic channels. Blood velocity (Umc) and imaging intensity (Imc) was evaluated by selecting a specific ROI (1.8 mm2) in the main channel. Similarly, blood velocity (Uac) and imaging intensity (Iac) were obtained from a specific ROI (1.8 mm2) positioned within the large-sized chamber of the aggregation channel. (C) Preliminary demonstration of the suggested method. Herein, test blood (hematocrit [Hct] = 50%) was prepared by suspending normal RBCs into dextran solution (20 mg/mL). Blood (Vb =200 μL) was loaded into a syringe. Blood flow-rate set to Qsp = 10 mL/h. (i) Time-lapse blood flow imaging with an elapse of time (t = 44, 128, 190, and 210 s). The arrow indicated blood flow direction in main channel and aggregation channel. (ii) Time-lapse image intensity (Imc, Iac) and blood velocity (Umc, Uac). Firstly, using manual delivery of syringe, compliance effect in the syringe contributed to transient blood flow. Due to RBC aggregation in the aggregation channel, the Iac was decreased over time substantially. Secondly, by supplying blood with a syringe pump, time-lapse Umc and Uac were used to obtain blood viscosity. (D) Mathematica representation of blood viscosity. (i) Estimation of air pressure in a driving syringe (Pair). (ii) Fluidic circuit model of the proposed microfluidic platform. The upper panel showed discrete fluidic circuit model, including, pressure source (Pair), fluidic resistance element (Rtb: inlet tubing, Rmc: main channel, and Rac: aggregation channel). The ground, P0, denoted an atmospheric pressure (P0 = 101 kPa). The Pj denoted blood pressure at the junction between main channel and aggregation channel. Based on fluidic circuit analysis, pressure difference () was derived as . (iii) Variations of shear rate () in fluidic path (i.e., inlet tubing, ROI in the main channel, and ROI in the aggregation channel).
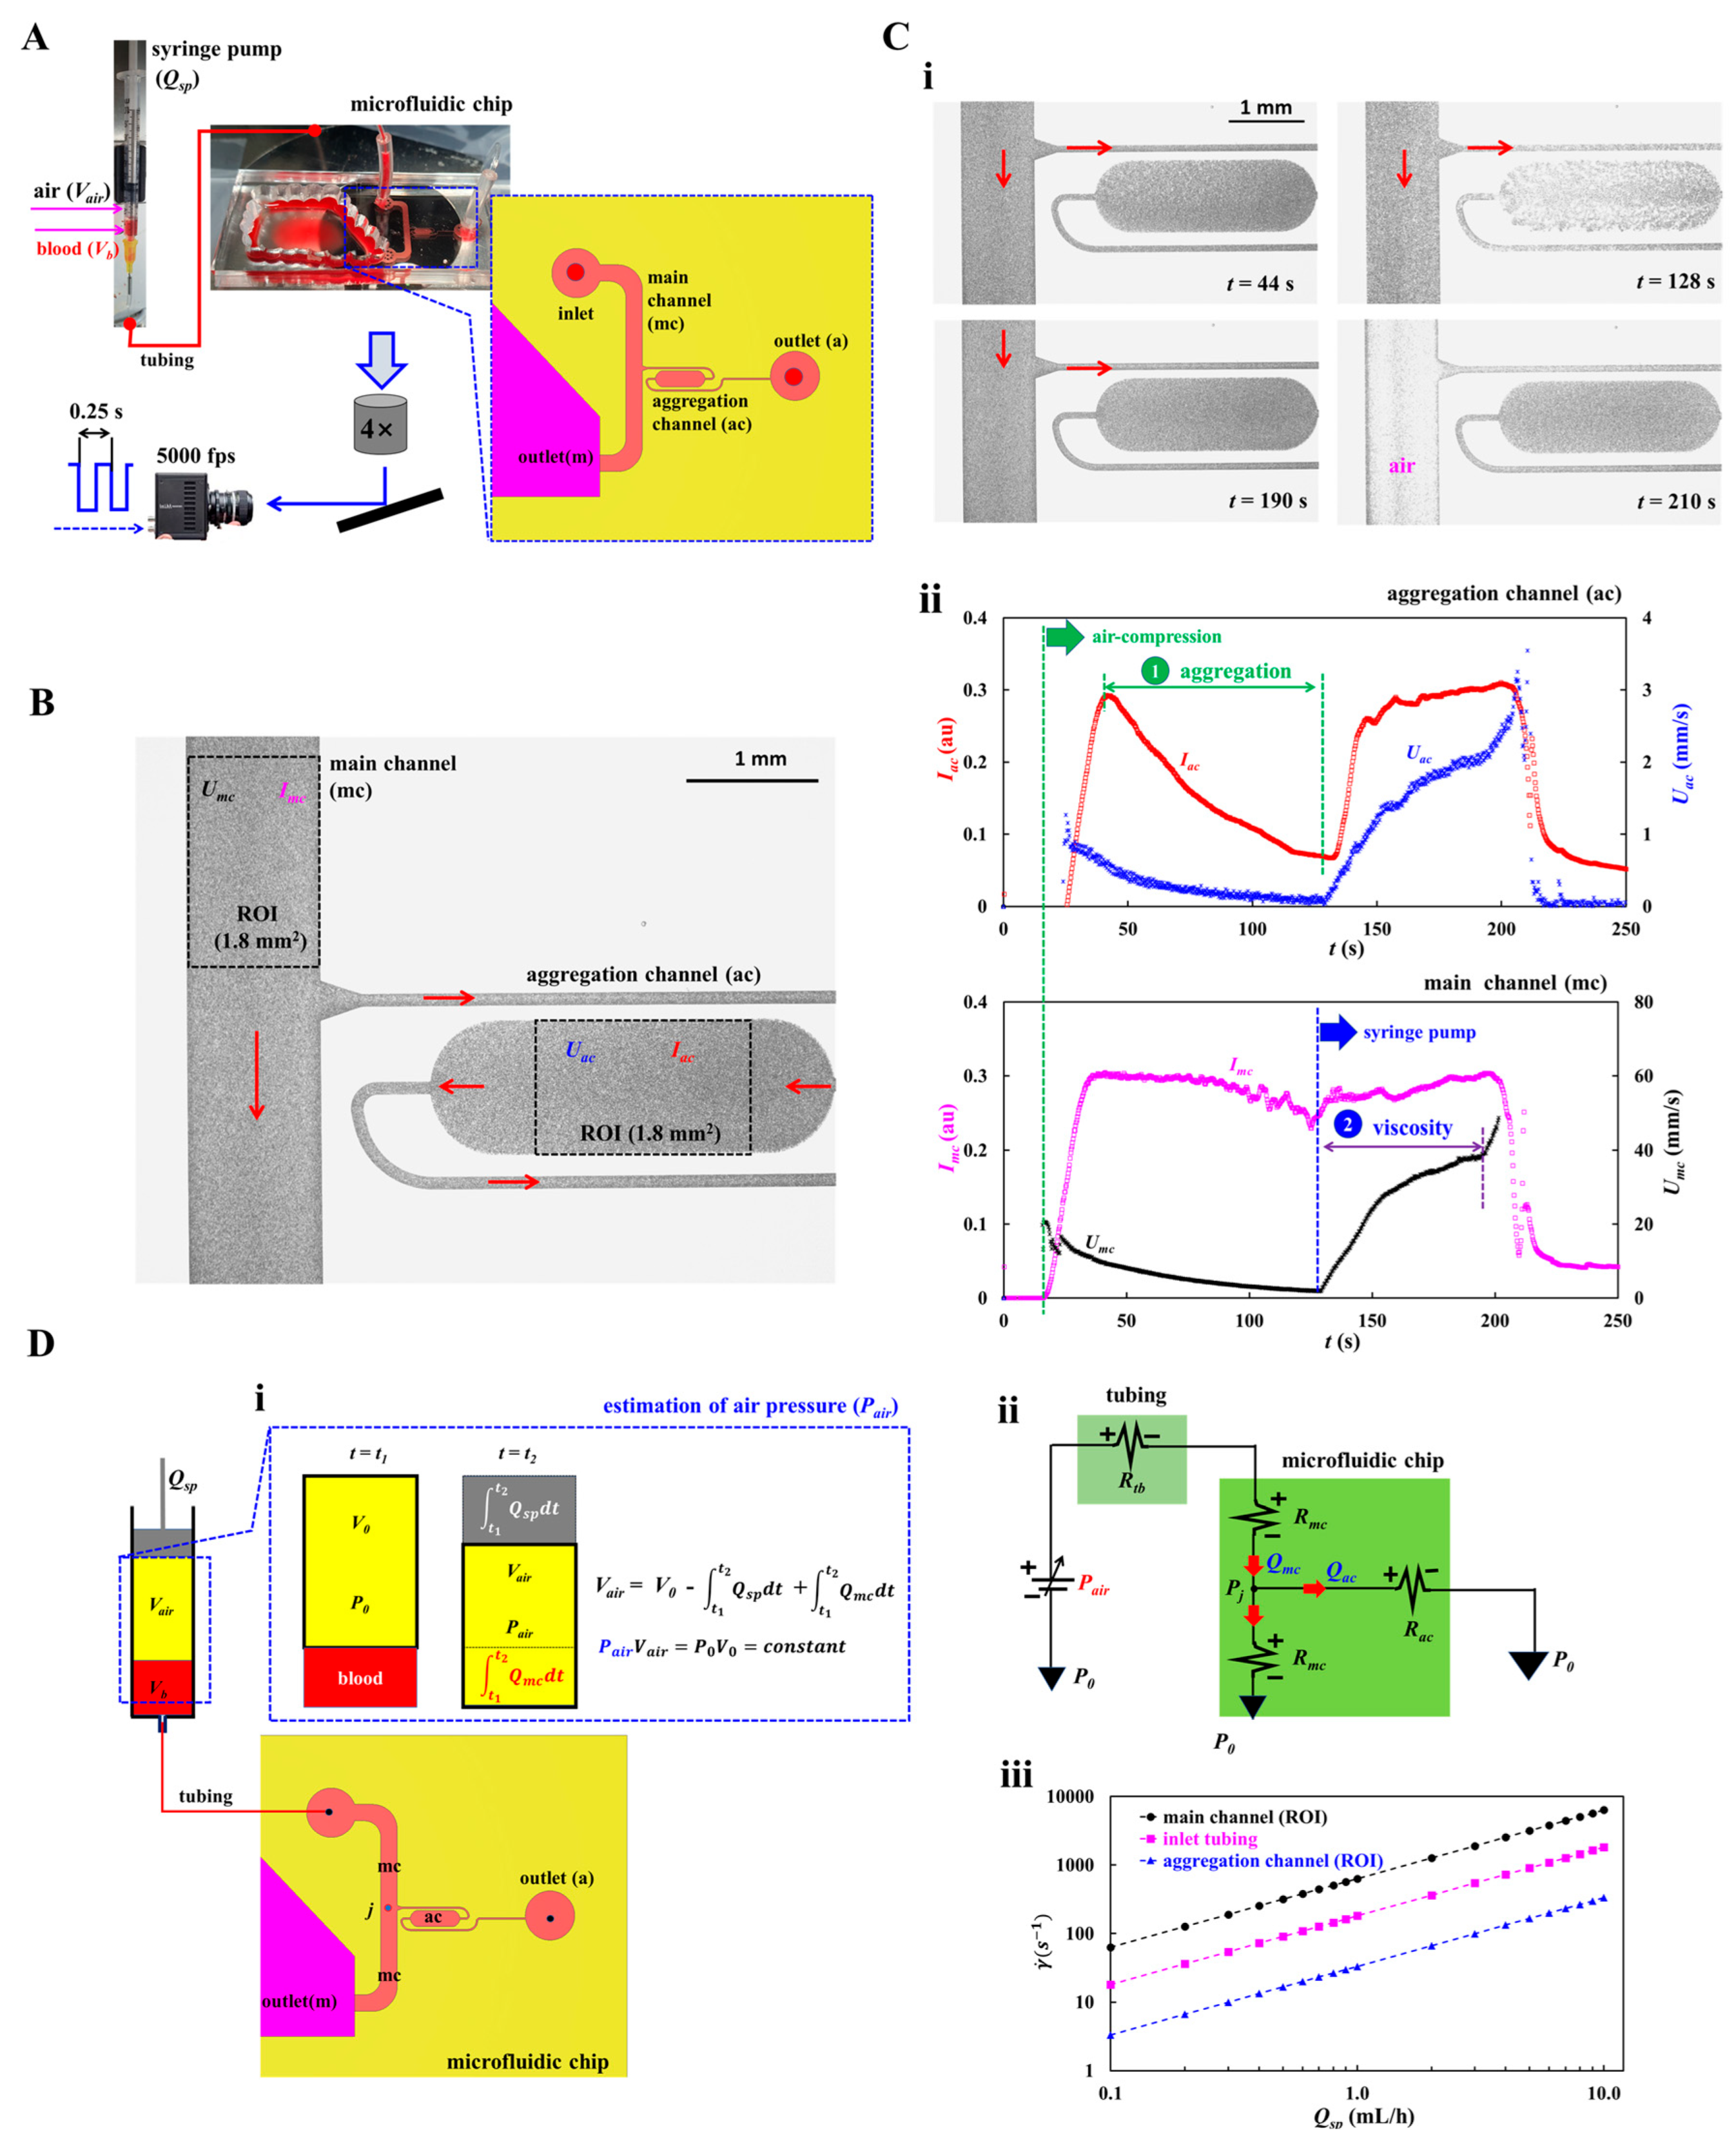
Figure 2.
Quantification procedures of flow-dependent RBCs aggregation and blood viscosity. (A) Assessment of shear-lapse RBCs aggregation. (i) Temporal variations of Iac, Imc, and Uac. At a lower flow-rate of the aggregation channel, RBC aggregation caused to decrease Iac over time gradually. RBC aggregation index (AI) as dimensionless parameter was expressed as AI = ΔI/Imc, where the ΔI was defined as ΔI = Imc - Iac. (ii) Temporal variations of AI and shear rate (). (iii) Variations of AI with respect to shear rate (). To assess AI quantitatively, the AI was best fitted as AI = . Non-linear regression analysis gave three unknown parameters (i.e., AI0 = 0.8113, a = 0.059 s, and b = 44.3671 s-1). (iv) Variations of three parameters obtained for nine bloods (Sn = 9). The dashed lines indicated the bounds of 95% confidence interval (CI). Based on the 95% CI, three parameters were obtained as 0.577 < AI0 < 0.896, 0.0463 s < a < 0.0608 s, and 41.641s-1 < b < 54.506 s-1. (B) Assessment of flow-dependent blood viscosity. (i) Time-lapse Qmc and Qac. (ii) Temporal variations of Vair and Pair. (iii) Variations of ΔP with respect to Qmc. (iv) Variations of blood viscosity (μb) with respect to Qmc. (v) Variations of μb with respect to . The μb remained constant with respect to shear rate. (vi) Variations of μb and ΔPmax obtained for nine bloods (Sn = 9). Based on the 95% CI, the μb and ΔPmax were obtained as 2.416 cP < μb < 2.629 cP and 28.981 kPa < ΔPmax < 31. 732 kPa.
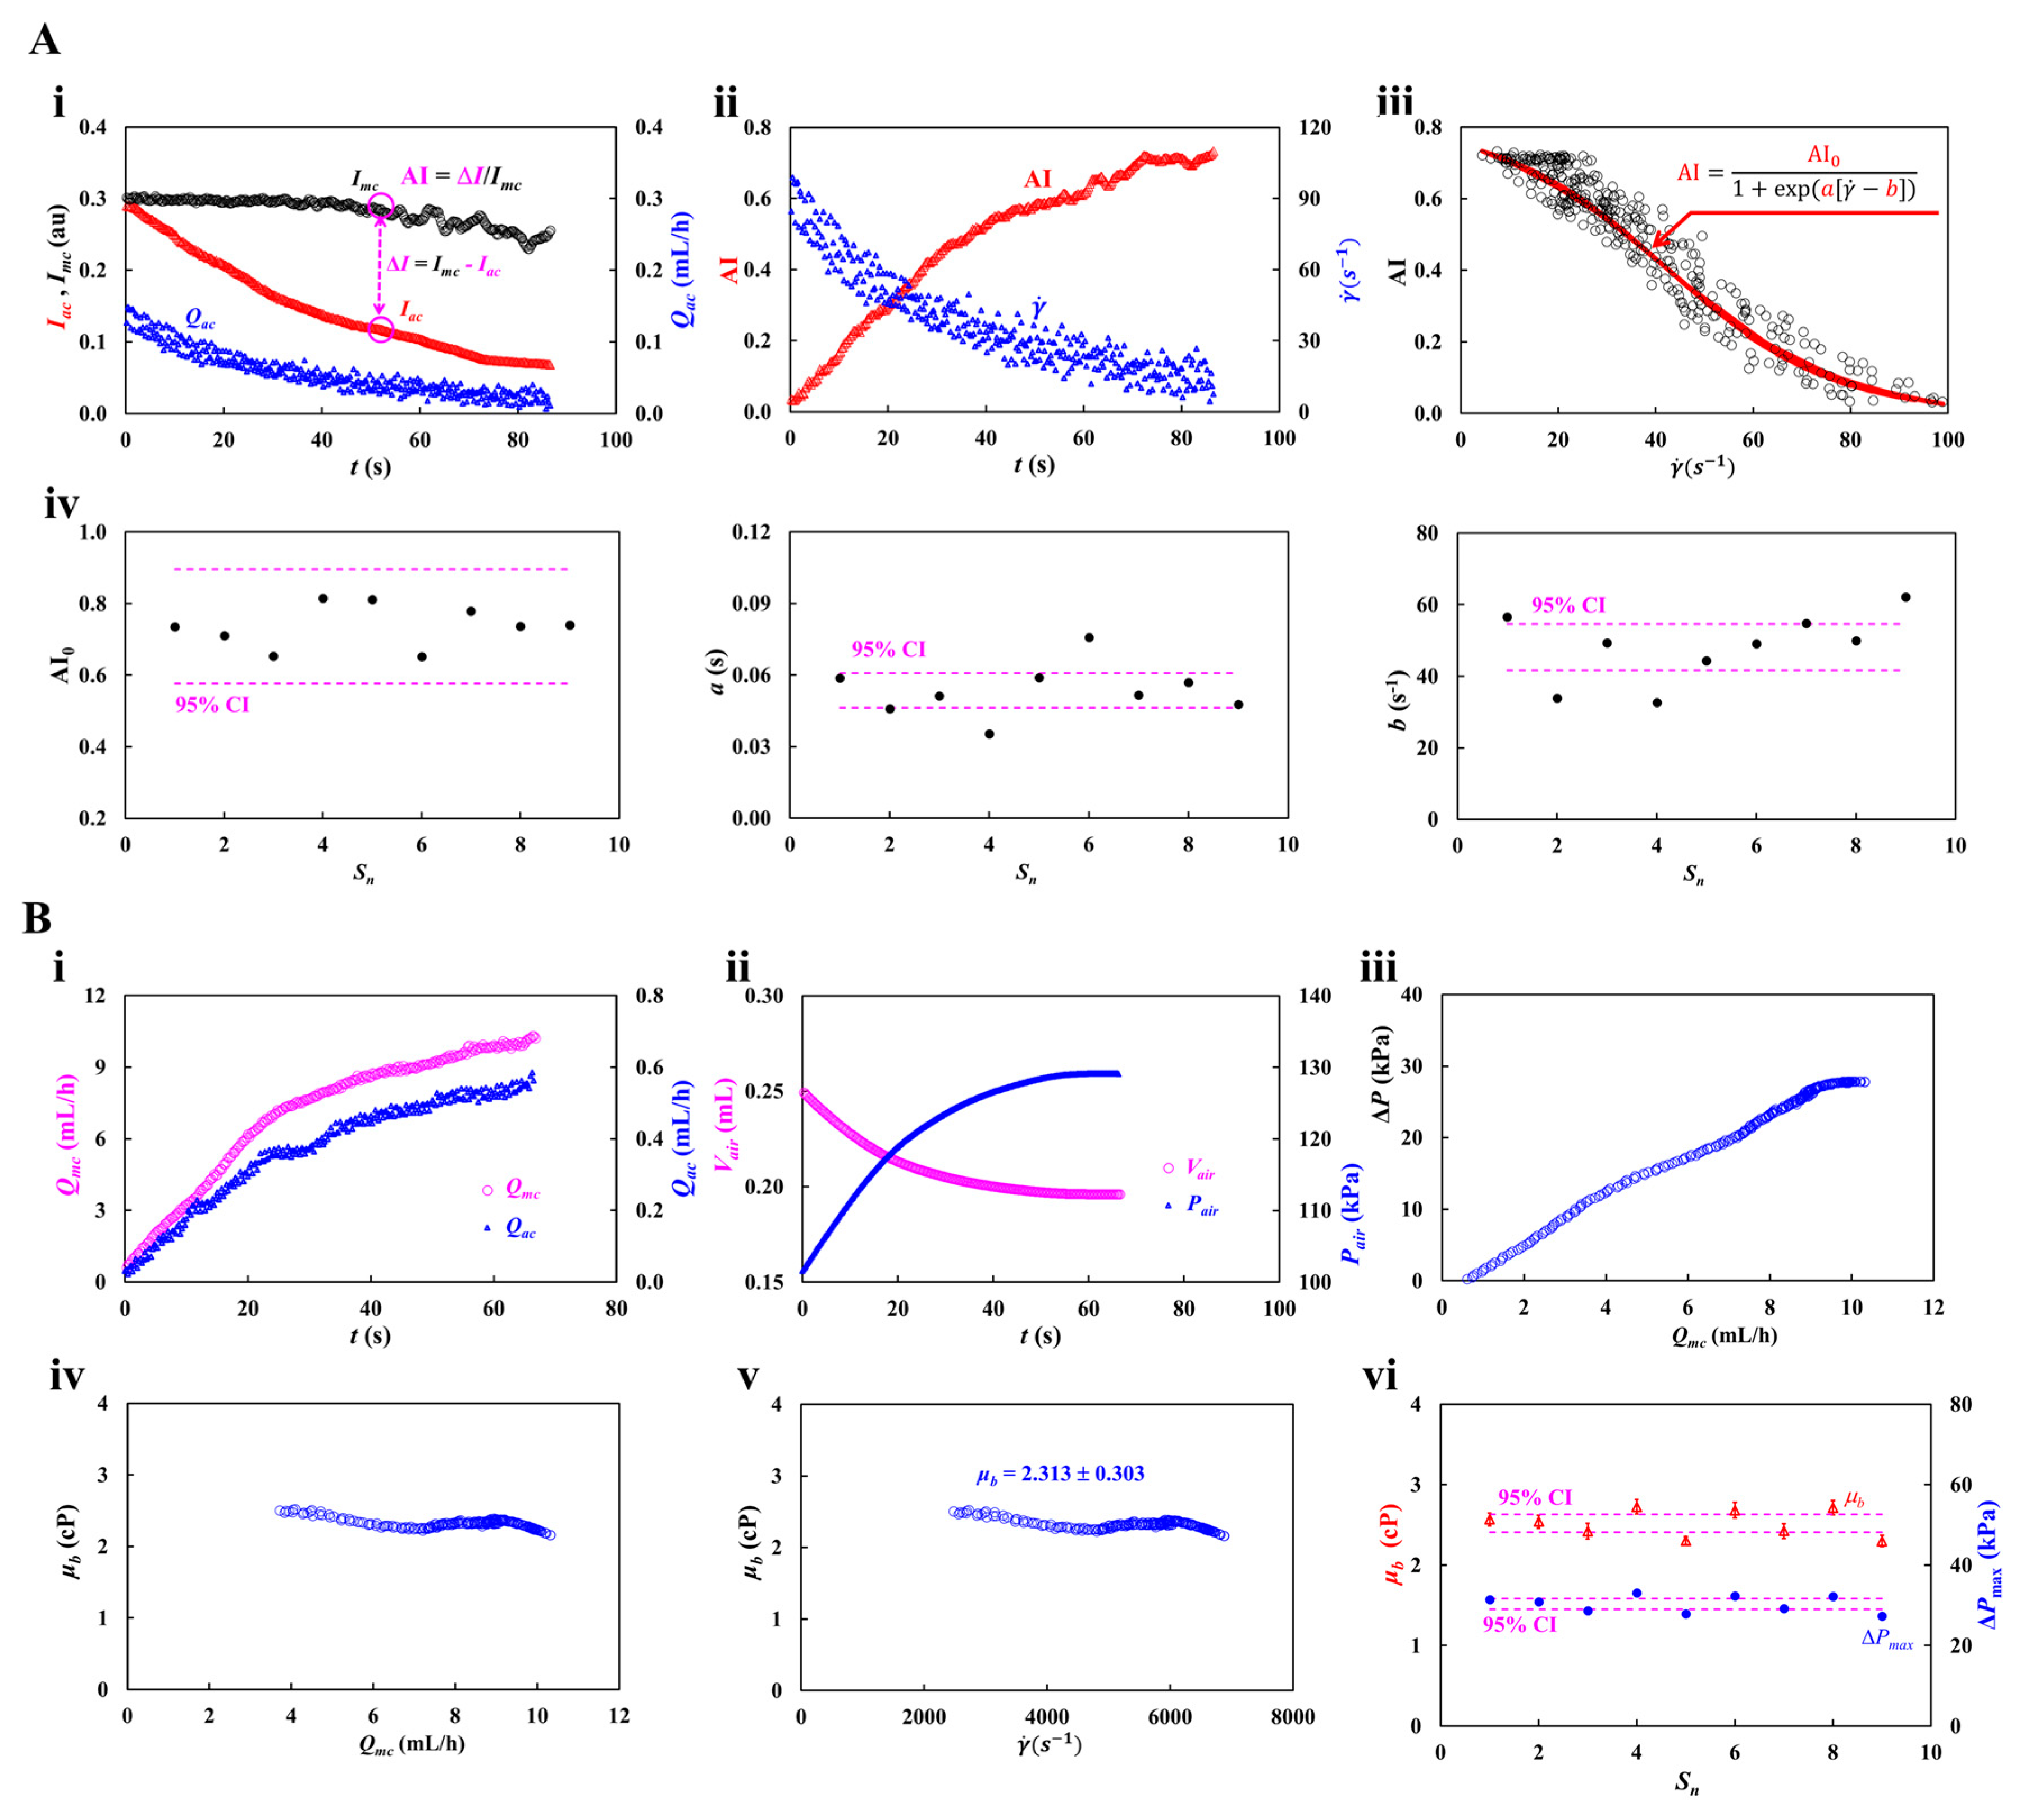
Figure 3.
Accuracy validation of viscosity for glycerin solution. (A) Contribution of flow-rate to viscosity. Herein, 30% glycerin solution was selected as test fluid. (i) Time-lapse Qmc and ΔP with respect to Qsp = 2, 4, 6, and 8 mL/h. (ii) Variation of viscosity (μ) with respect to Qmc and Qsp. The viscosity was independent of Qmc and remained unchanged. (iii) Variations of μ and ΔPmax with respect to Qsp. (B) Contribution of glycerin concentration (Cgl) to viscosity. Herein, flow rate was fixed at Qsp = 4 mL/h. (i) Time-lapse Qmc and ΔPmax with respect to concentration of glycerin solution (Cgl = 20%, 30%, 40%, and 50%). (ii) Variation of μ with respect to Qmc and Cgl. (iii) Variations of μ and ΔPmax with respect to Cgl. (C) Quantitative comparison between proposed method and reference data. (i) Variations of viscosity obtained by both methods with respect to Cgl. (ii) Linear regression of viscosity obtained by both methods.
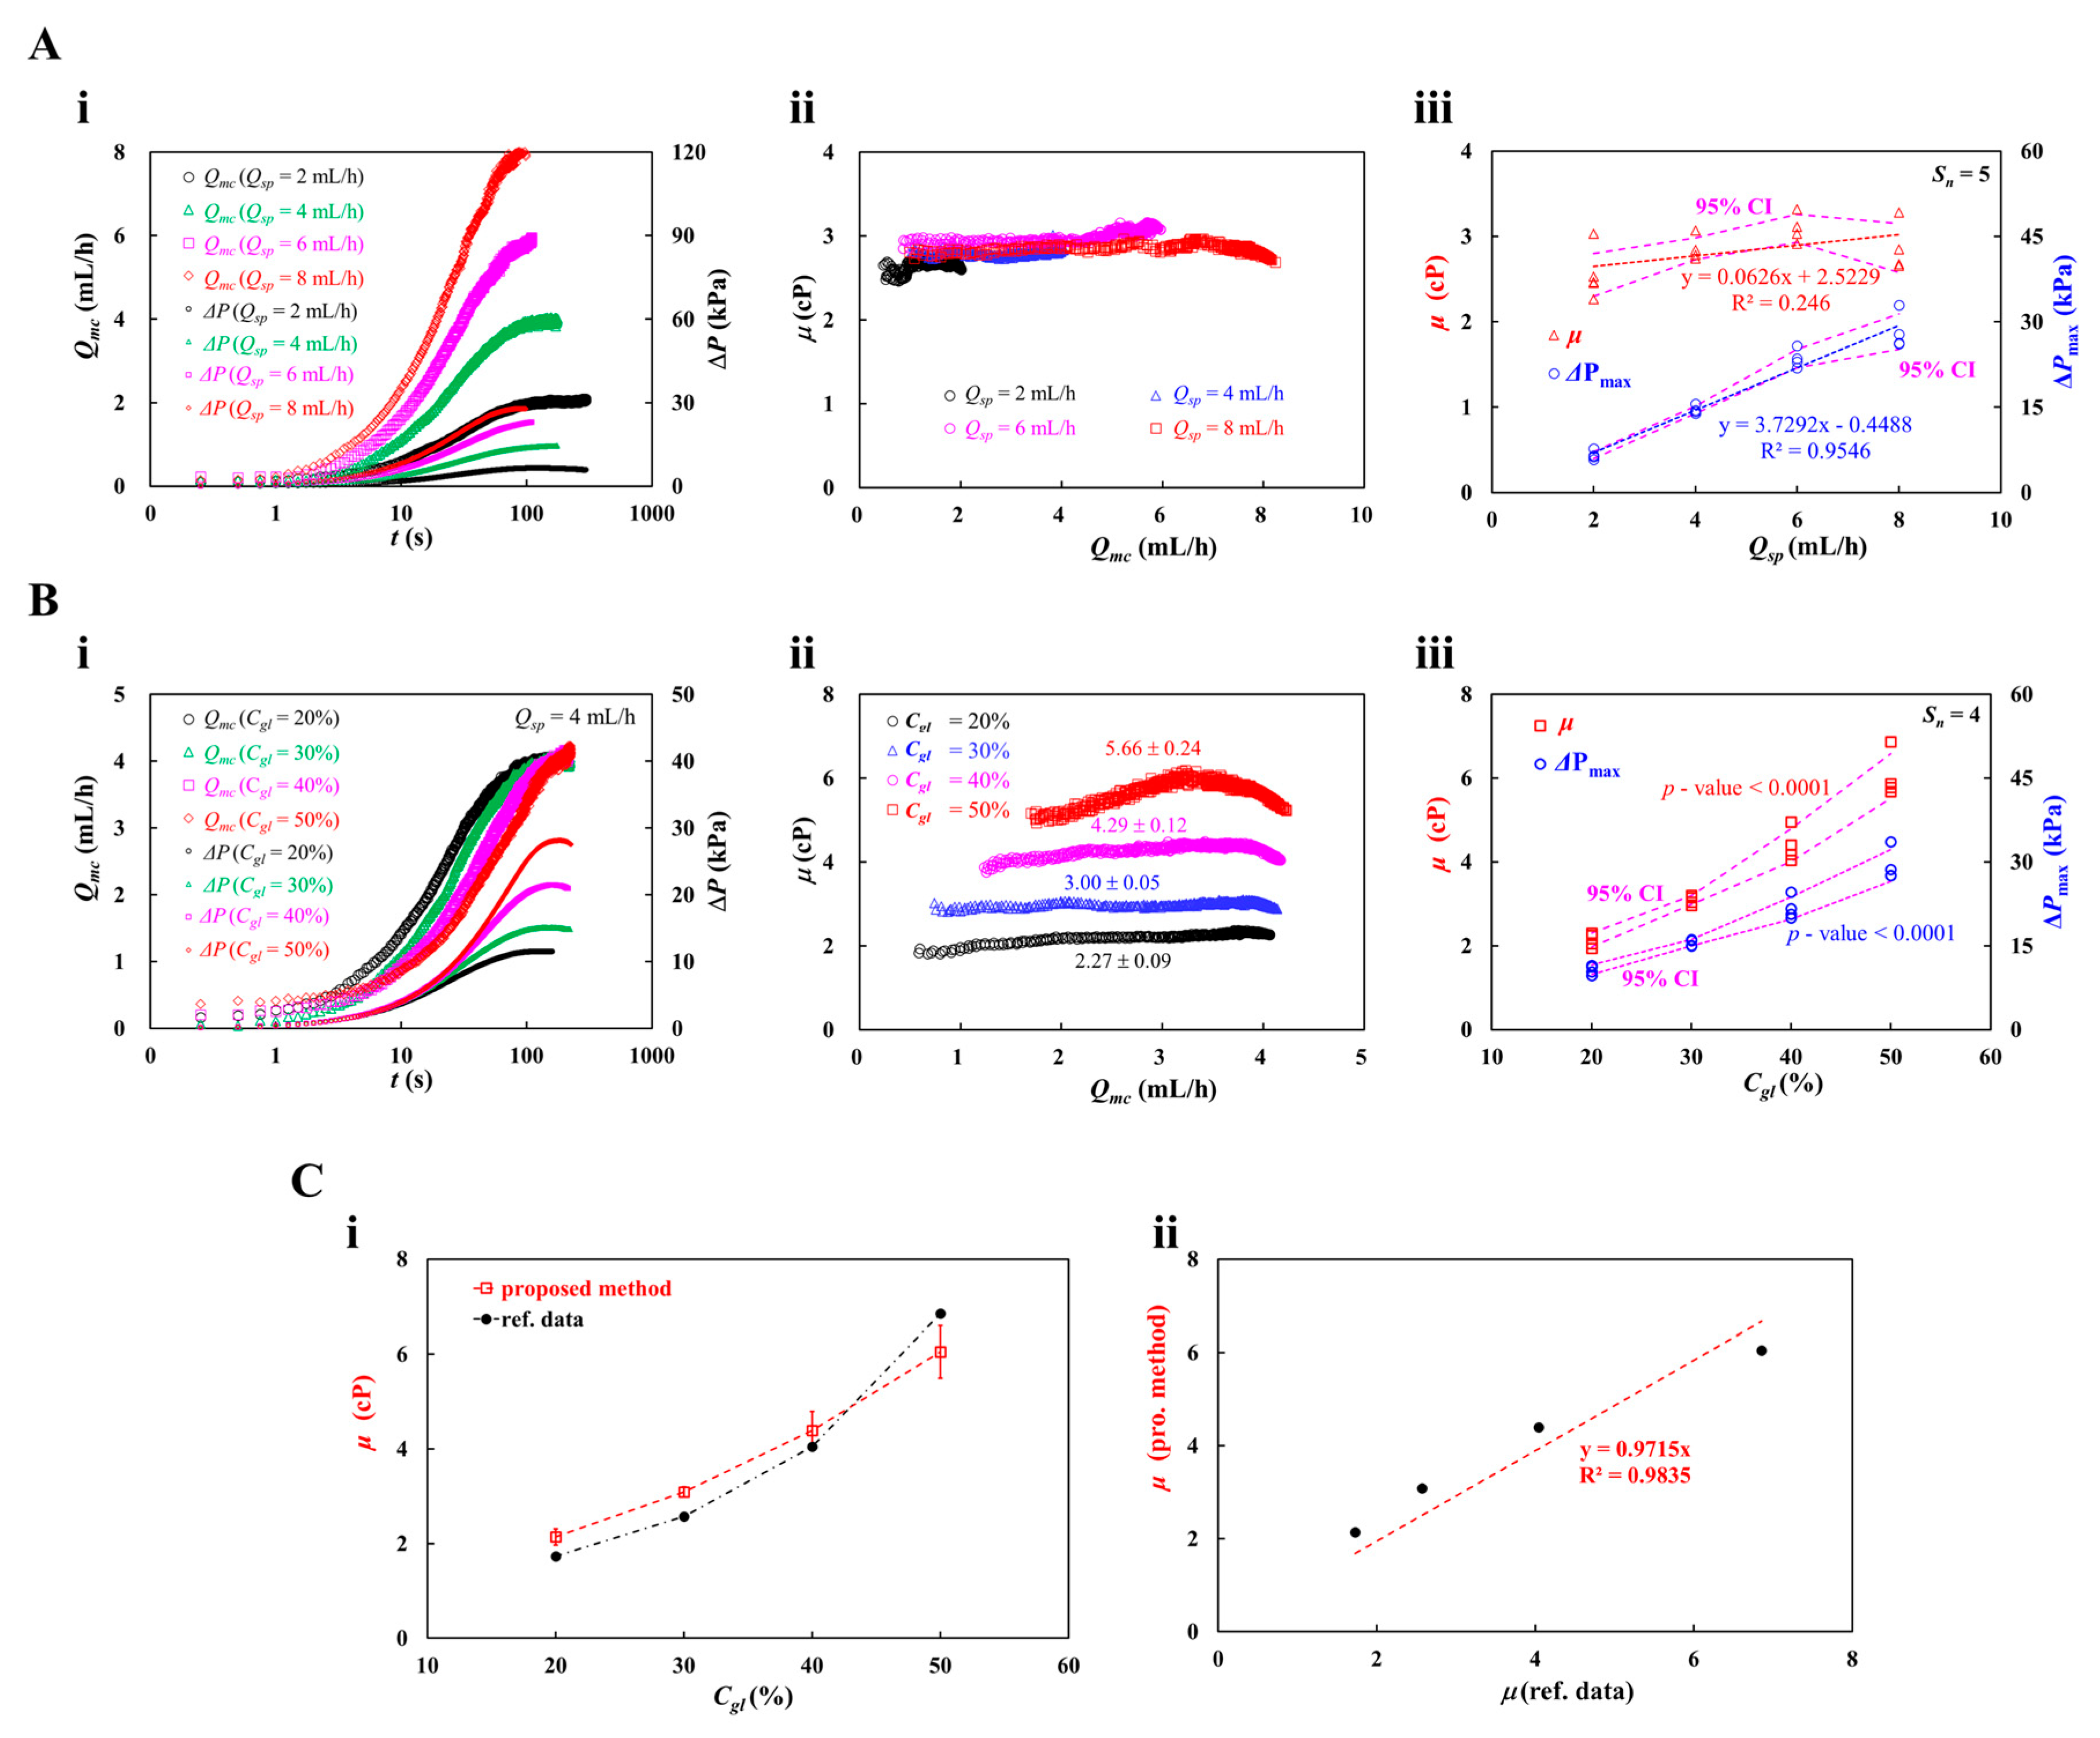
Figure 4.
Determination of delivered blood flow-rate for effectively measuring blood viscosity under RBCs sedimentation a driving syringe. Herein, two kinds of blood (Hct = 50%) were prepared by suspending normal RBCs into each blood medium (i.e., 1× PBS: control blood, and dextran solution [20 mg/mL]: test blood). (A) Viscosity of control blood obtained by the proposed method. (i) Time-lapse Qmc and ΔP with respect to Qsp = 4, and 10 mL/h. (ii) Variations of blood viscosity (μb) with respect to Qmc and Qsp = 4, 6, 8, and 10 mL/h. (iii) Variations of μb and ΔPmax with respect to Qsp. (B) Viscosity of test blood obtained by the proposed method. (i) Time-lapse Qmc and ΔP with respect to Qsp = 4, and 10 mL/h. (ii) Variations of μb with respect to Qmc and Qsp. (iii) Variations of μb and ΔPmax with respect to Qsp. (C) Viscosity of both bloods obtained by the previous method (i.e., coflowing streams method). (i) Blood viscosity assessment using coflowing method. (ii) Temporal variations of μb with respect to each blood and blood flow-rate (Qb =1, and 10 mL/h). (iii) Variations of μb of with respect to blood flow-rate and each blood. (D) Quantitative comparison of blood viscosity obtained by proposed method (pro. m.) and previous method (pre. m.). (i) Quantitative comparison of μb obtained by both methods for control blood. (ii) Quantitative comparison of μb obtained by both methods for test blood.
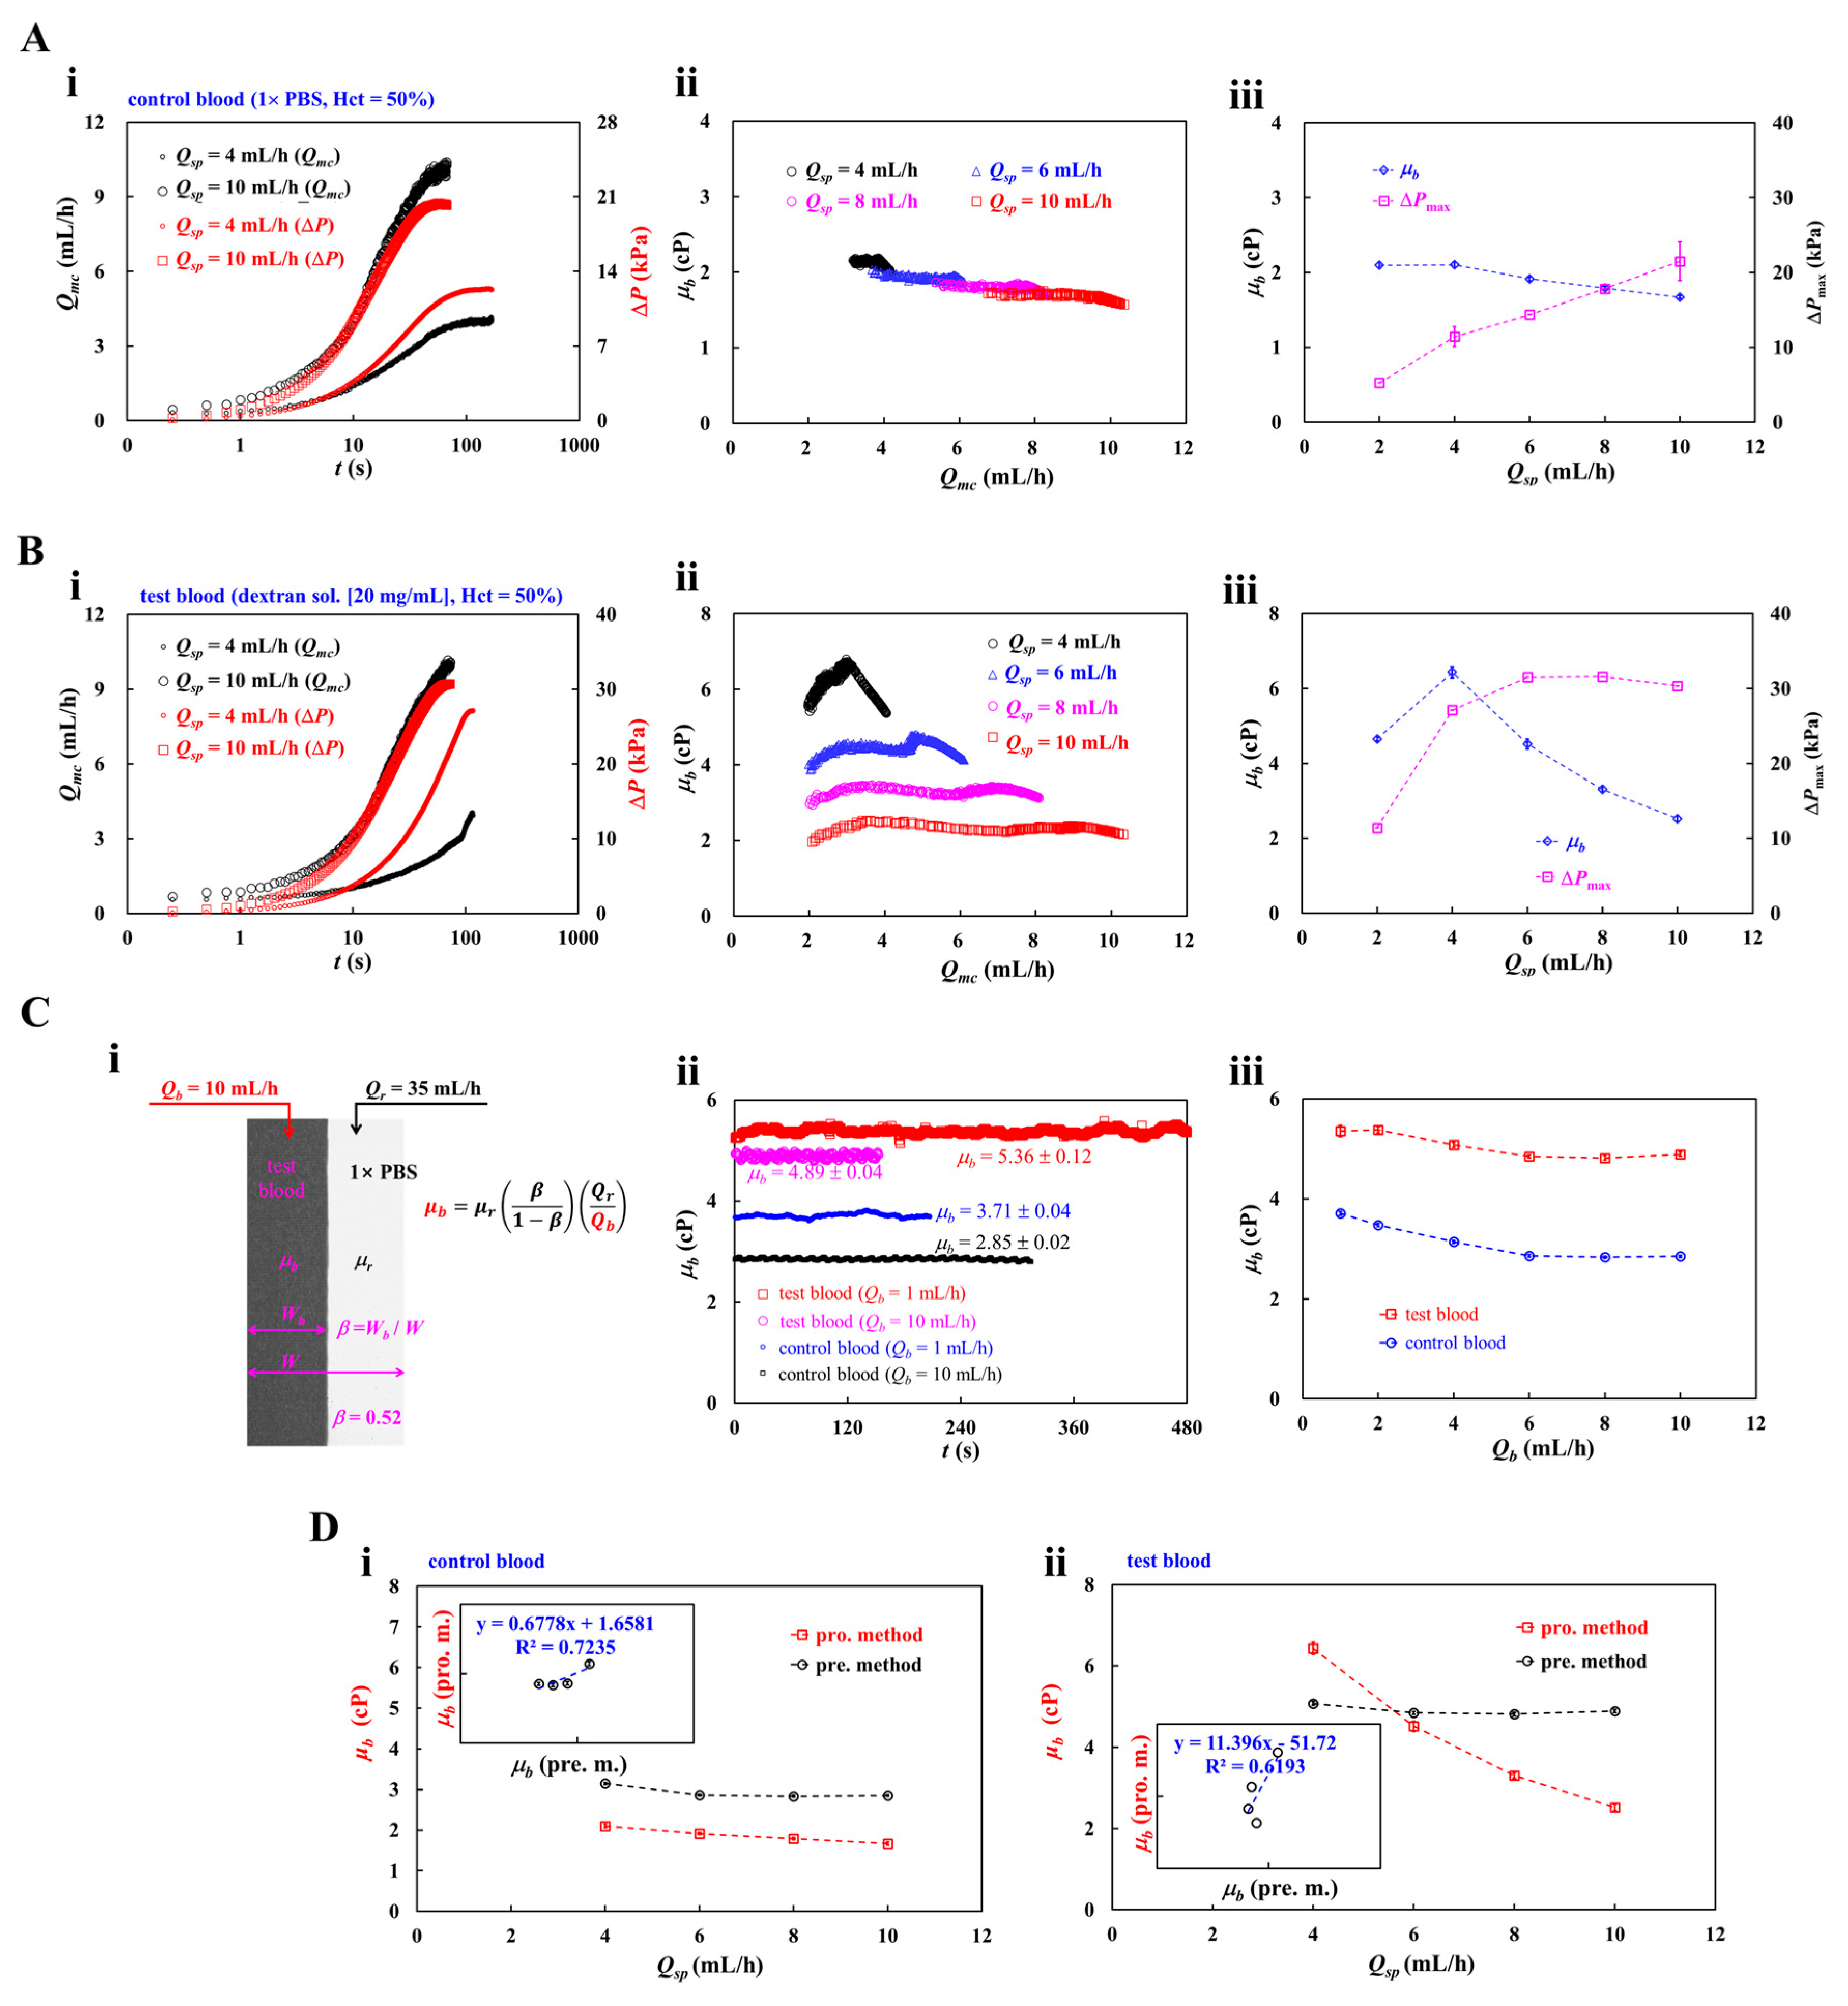
Figure 5.
Contribution of hematocrit to RBCs aggregation and blood viscosity obtained by the proposed method. Herein, hematocrit of test blood was adjusted to Hct = 30% ~ 60% by suspending normal RBCs into dextran solution (20 mg/mL). Blood (200 μL) was loaded into a driving syringe. Flow rate of syringe pump set to Qsp =10 mL/h. (A) Quantification of RBCs aggregation with respect to hematocrit. (i) Temporal variations of Imc, Iac, and Qac with respect to Hct = 30% and 60%. (ii) Shear rate ()-dependent AI with respect to Hct = 30%, 40%, and 60%. Based on the specified regression formula (i.e., AI = ), the corresponding regression formula of each hematocrit was obtained as AI = 0.7649 / (1 + exp [0.039 (- 50.0872)]) for Hct = 30%, AI = 0.7275 / (1 + exp [0.0398 ( - 31.5752)]) for Hct = 40%, and AI = 0.3914 / (1 + exp [0.0902 ( – 29.8718)]) for Hct = 60%. (iii) Variations of three parameters (i.e., AI0, a, and b) obtained by conducting regression analysis. (B) Contribution of hematocrit to blood viscosity. (i) Time-dependent Qmc and ΔP with respect to Hct = 30%, and 60%. (ii) Variations of μb with respect to . (iii) Variations of μb and ΔPmax with respect to Hct.
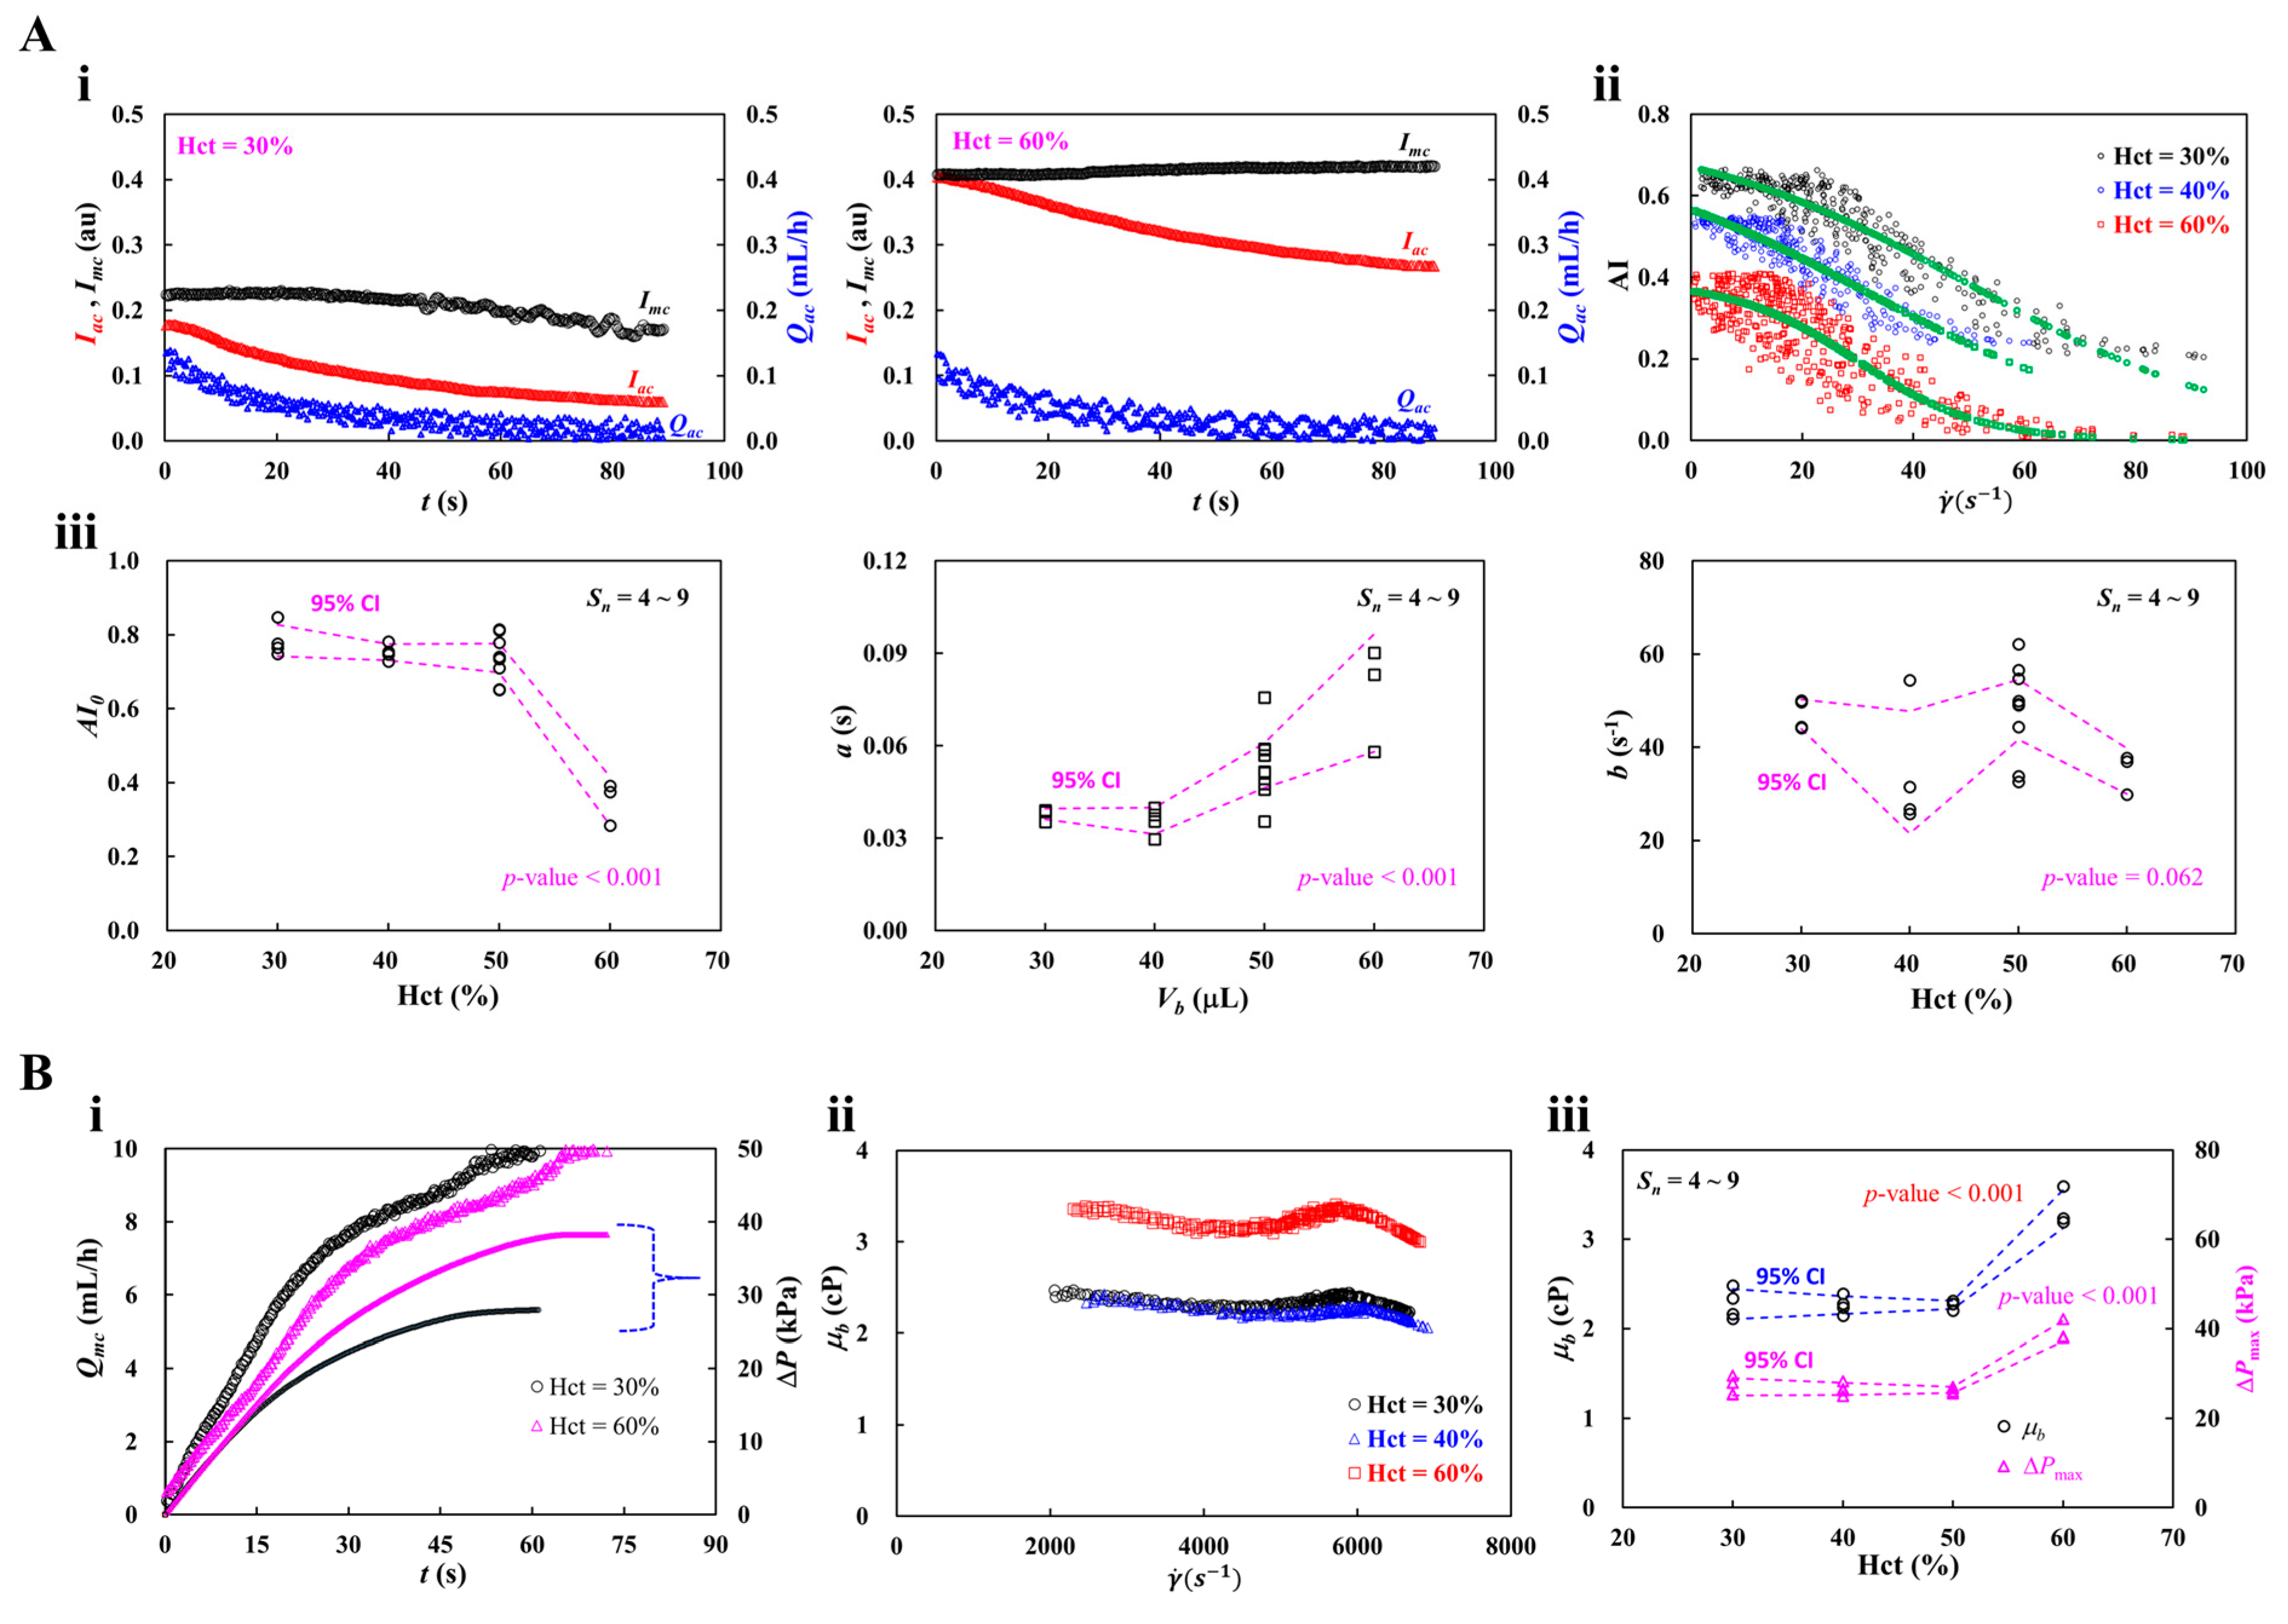
Figure 6.
Contribution of blood medium (i.e., dextran solution) to RBCs aggregation and blood viscosity. To quantify the effect of blood medium, test blood (Hct = 50%) was prepared by adding normal RBCs into dextran solution (Cdex = 0, 5, 10, 15, and 20 mg/mL). (A) Contribution of dextran solution to RBCs aggregation. (i) Time-lapse Imc, Iac, and Qac with respect to Cdex = 5, 10, and 15 mg/mL. (ii) Variations of three parameters obtained by regression analysis with respect to Cdex. (B) Contribution of dextran solution to blood viscosity. (i) Time-dependent Qmc and ΔP with respect to Cdex = 5, and 15 mg/mL. (ii) Variations of μb with respect to shear rate (). (iii) Variations of μb and ΔPmax with respect to Cdex. (iv) Blood viscosity obtained by the previous method (i.e., coflowing streams method). The left-side panel showed microscopic images for quantifying blood viscosity. The right-side panel showed temporal variations of μb with respect to Cdex = 0 ~ 20 mg/mL. (iv) Quantitative comparison between blood viscosity obtained by both methods. According to linear regression analysis, regression formula was obtained as μb (pro. m.) = 0.6895μb (prev. m.) (R2 = 0.9879).
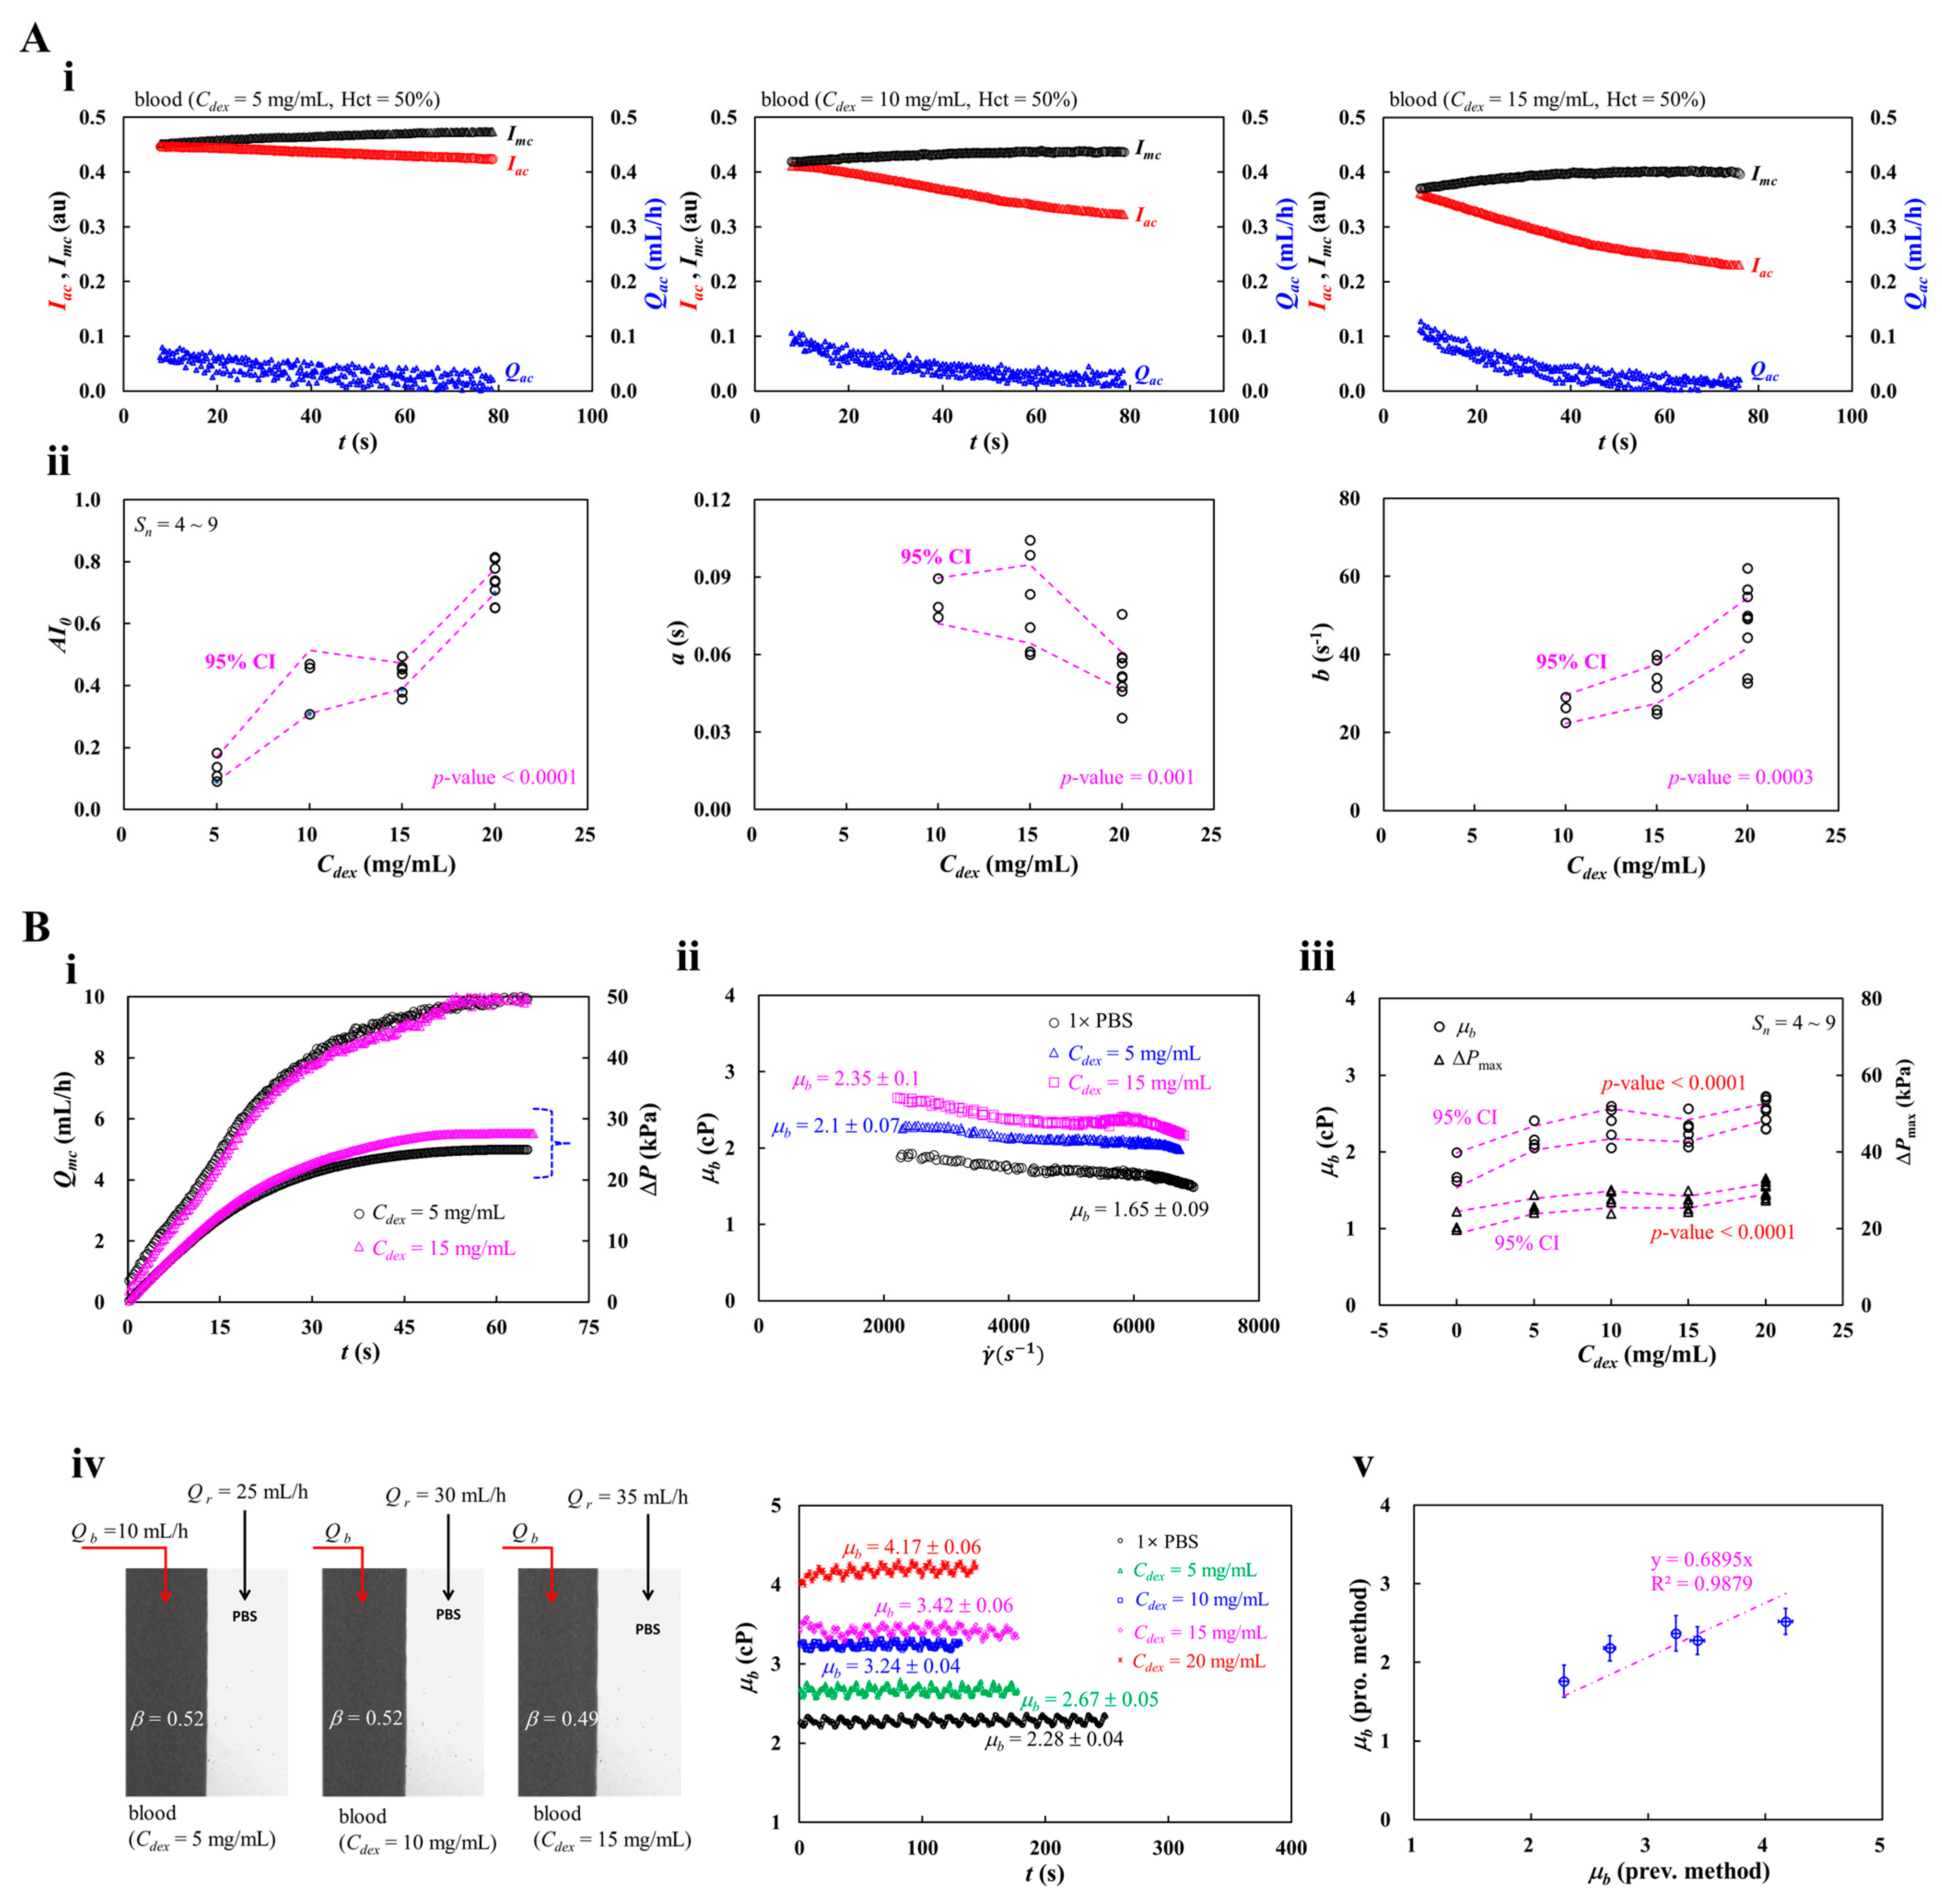
Figure 7.
Contribution of blood-loading volume to RBCs aggregation and blood viscosity. Test blood (Hct = 50%) was prepared by suspending normal RBCs into dextran solution (20 mg/mL). (A) Contribution of blood-loading volume (Vb = 100. 150, and 200 μL) to RBCs aggregation. (i) Snapshot for showing blood volume (Vb) supplied into a driving syringe. (ii) Time-lapse Imc and Iac with respect to Vb. (iii) Variations of three parameters (i.e., AI0, a, and b) with respect to Vb. (B) Contribution of blood-loading volume (Vb) to blood viscosity. (i) Time-lapse Qmc and ΔP with respect to Vb. (ii) Variations of μb with respect to . (iii) Variations of μb and ΔPmax with respect to Vb.
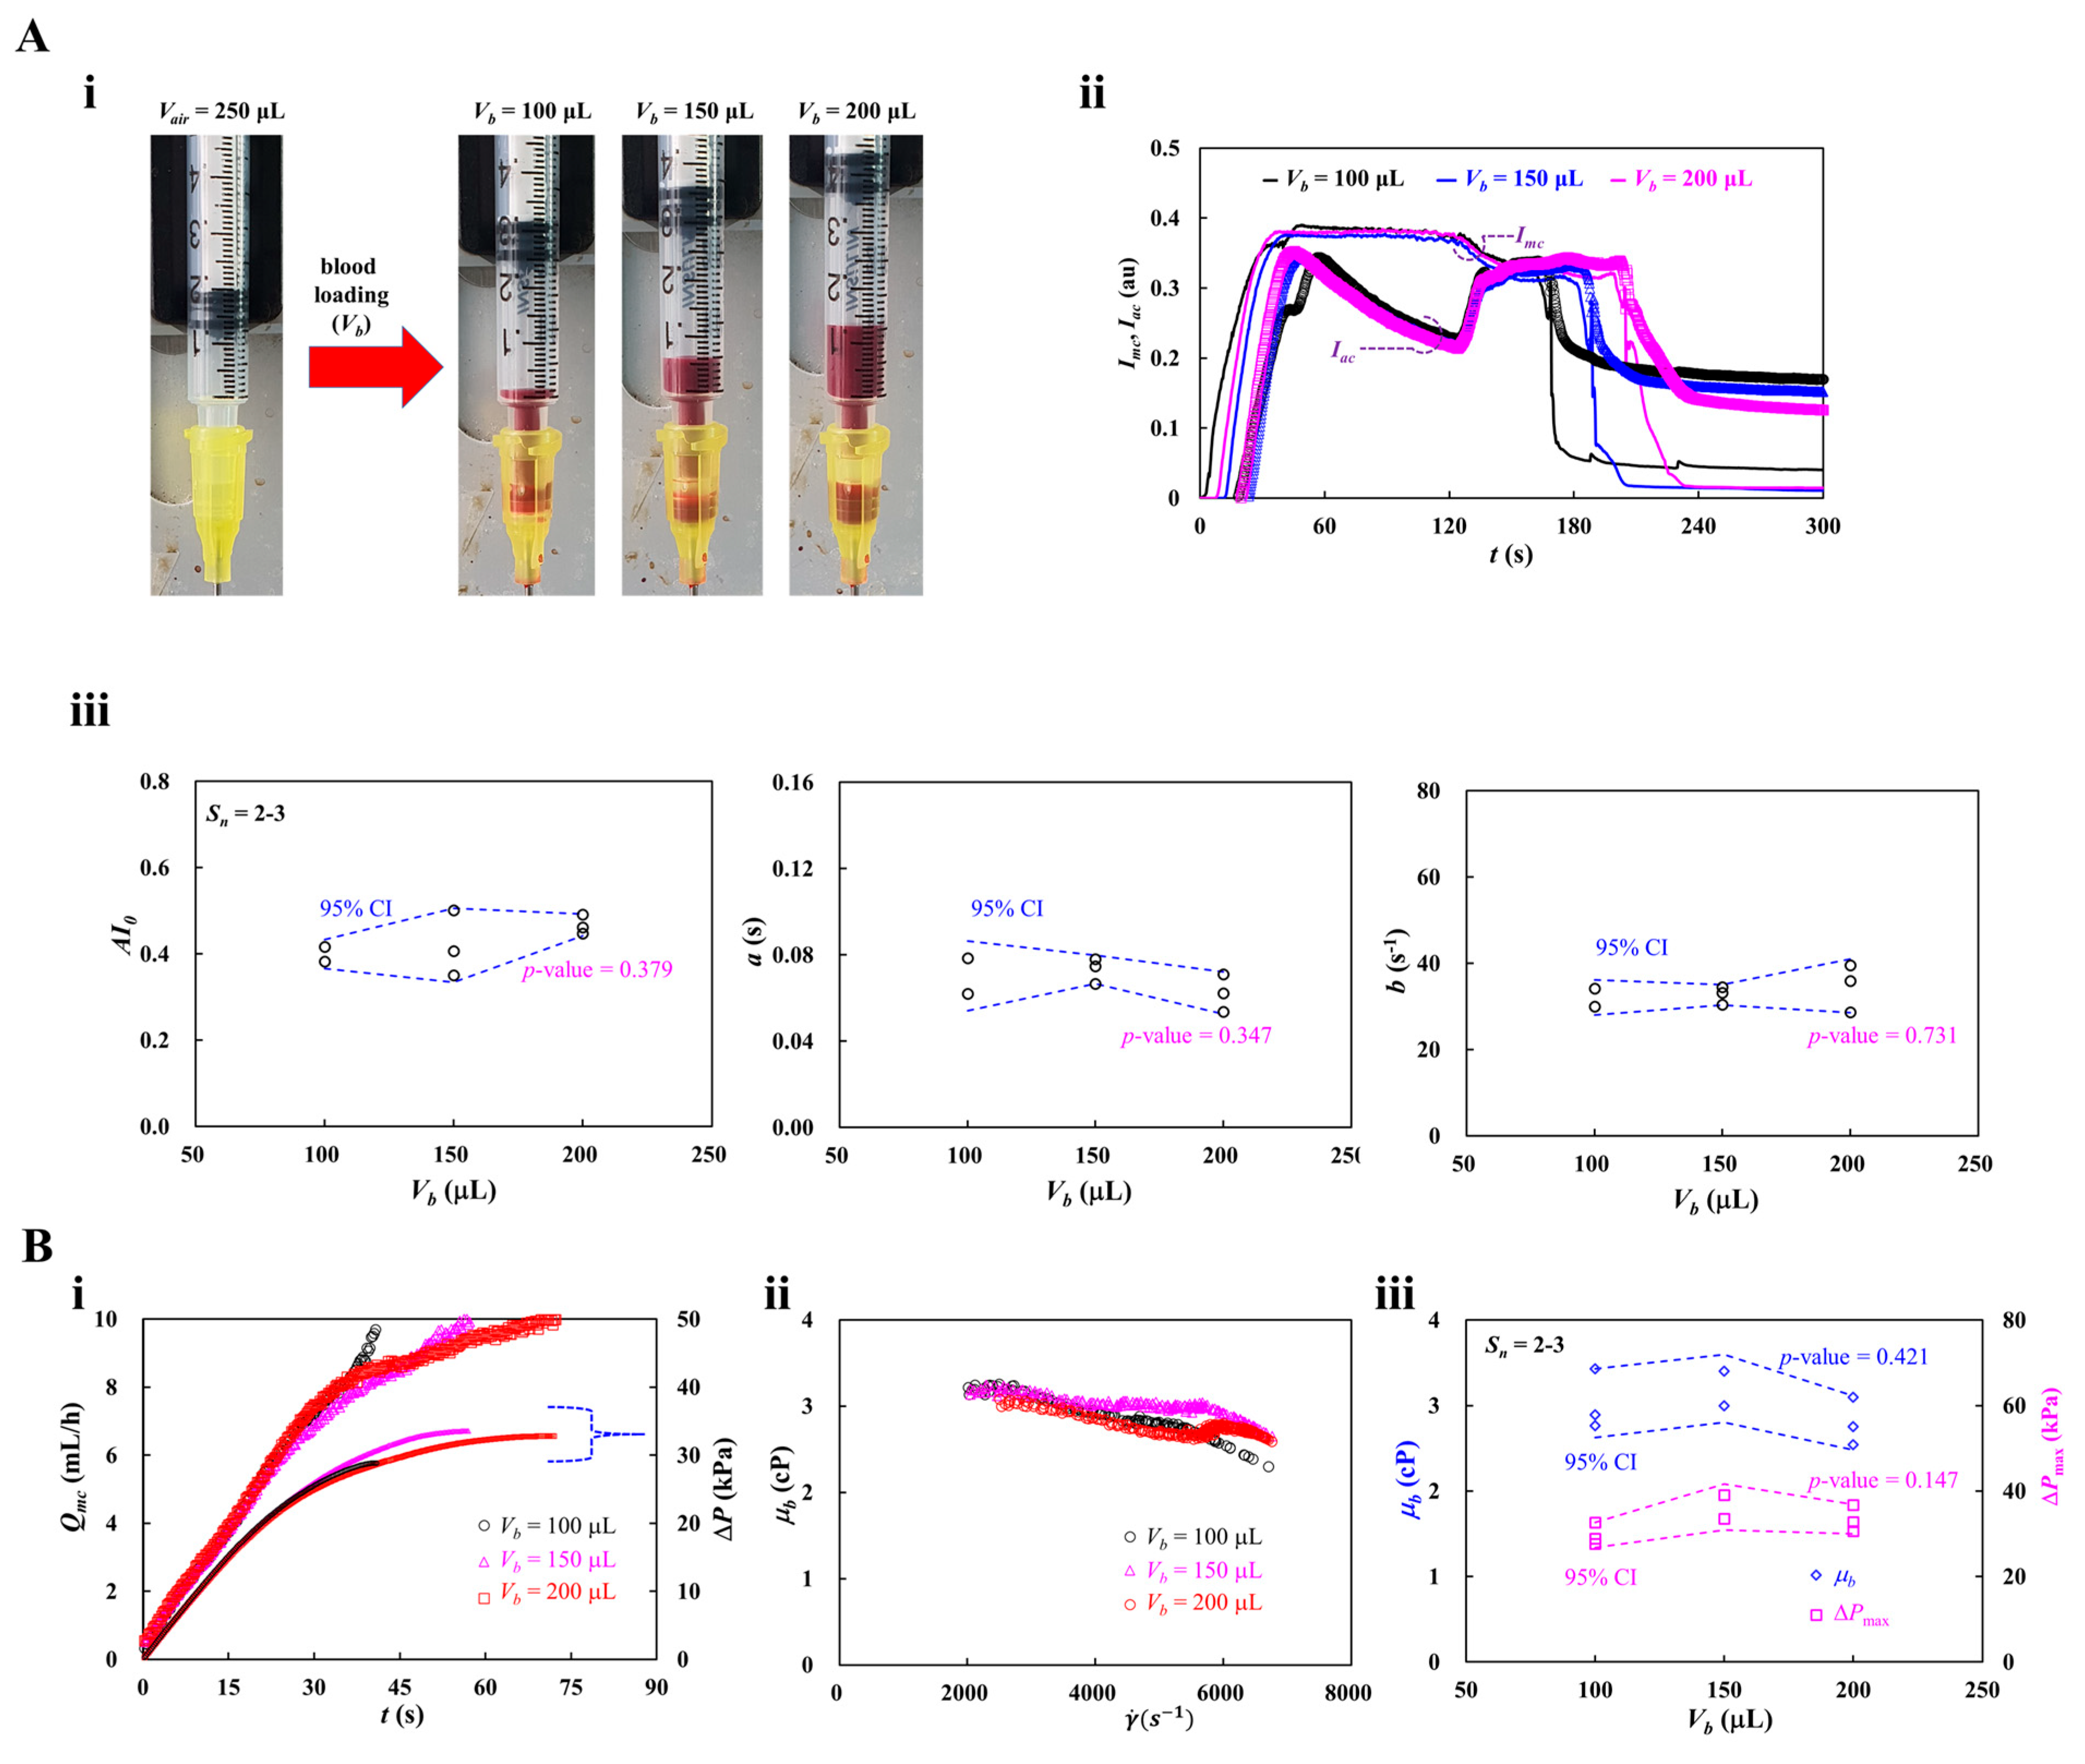
Figure 8.
Contribution of heat-shocked RBCs to RBCs aggregation and blood viscosity. Herein, exposure time of each temperature set to 40 min for 45ºC and 20 min for 50 ºC. Test blood (Hct = 50%) was prepared by suspending heat-shocked RBCs into dextran solution (20 mg/mL). (A) Contribution of heat-exposed RBCs to RBCs aggregation. (i) Quantification of RBCs aggregation using RBCs exposed to 45 ºC for up to 40 min. The first panel showed variations of AI with respect to . The AI was best fitted as AI = AI0 exp (-a ). The second panel showed variations of parameter AI0 with respect to exposed time (texp). The last panel showed variations of parameter a with respect to texp. (ii) Quantification of RBCs aggregation using RBCs exposed to 50 ºC for up to 20 min. The first panel showed variations of AI with respect to . The second panel showed variations of parameter AI0 with respect to exposed time (texp). The last panel showed variations of parameter a with respect to texp. (B) Contribution of heat-shocked RBCs to blood viscosity. (i) Quantification of blood viscosity for RBCs exposed to 45 ºC for up to 40 min. The first panel showed time-lapse Qmc and ΔP. The second panel showed variations of μb with respect to texp. The last panel showed ΔPmax with respect to texp. (ii) Quantification of blood viscosity for RBCs exposed to 50 ºC for up to 20 min. The first panel showed time-lapse Qmc and ΔP. The second panel showed variations of μb with respect to texp. The last panel showed ΔPmax with respect to texp.
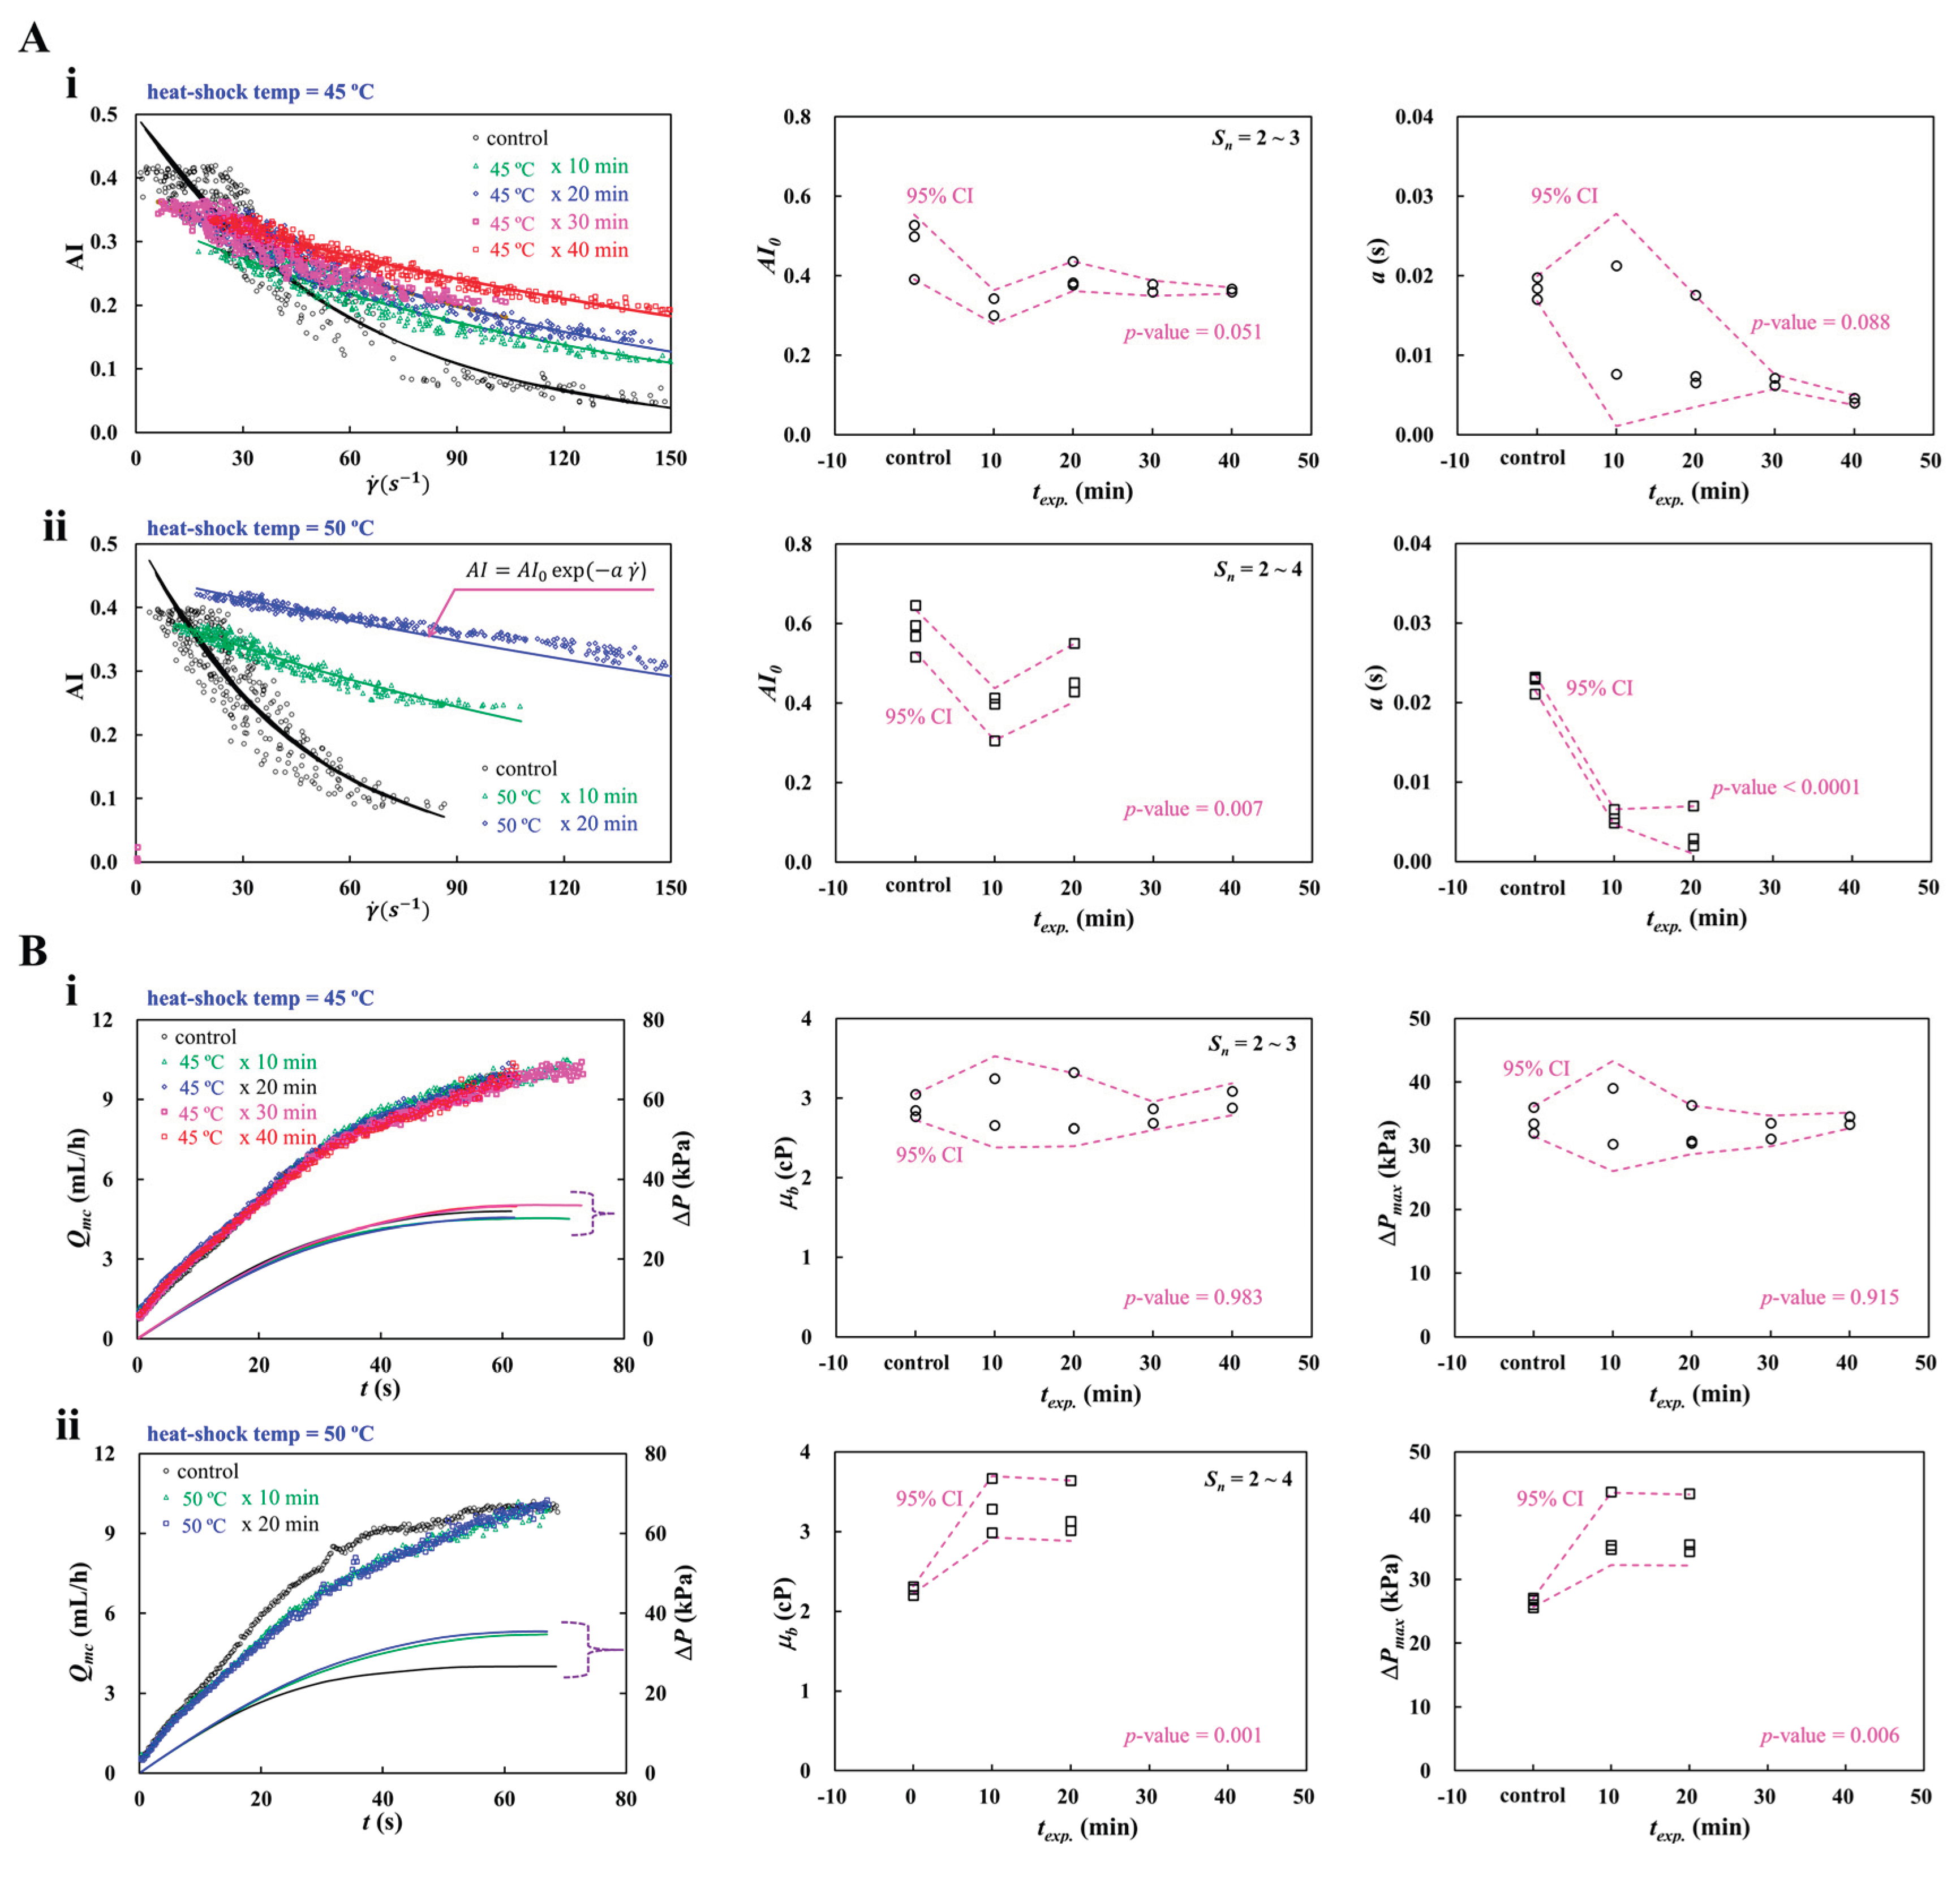
Disclaimer/Publisher’s Note: The statements, opinions and data contained in all publications are solely those of the individual author(s) and contributor(s) and not of MDPI and/or the editor(s). MDPI and/or the editor(s) disclaim responsibility for any injury to people or property resulting from any ideas, methods, instructions or products referred to in the content. |
© 2026 by the authors. Licensee MDPI, Basel, Switzerland. This article is an open access article distributed under the terms and conditions of the Creative Commons Attribution (CC BY) license (http://creativecommons.org/licenses/by/4.0/).
Copyright: This open access article is published under a Creative Commons CC BY 4.0 license, which permit the free download, distribution, and reuse, provided that the author and preprint are cited in any reuse.


