
Submitted:
22 January 2026
Posted:
23 January 2026
You are already at the latest version
Abstract
This paper examines the connection between Environmental, Social, and Governance (ESG) factors and the risk of geopolitics, as defined by the Geopolitical Risk (GPR) index. The concept of geopolitical risk is conventionally defined as the direct result of political incidents, war, and international tensions. The current study argues that the concept should be understood in a more structural and sustainable manner, relating to the underlying forces driving geopolitical risk. The main research question is whether and how the three pillars of the ESG factors contribute to the explanation and understanding of cross-country and over-time variations in geopolitical risk. In an effort to avoid the information losses associated with the aggregate nature of the ESG index, the three factors are considered separately and the three pillars are analyzed individually. The empirical context is a balanced cross-country panel data set including 42 countries over the 2000-2023 time period. The data for the three factors is obtained from the World Bank dataset in an effort to standardize and compare the data in a cross-country and cross-time manner. The GPR index is used to measure the level of geopolitical risk and is defined by Dario Caldara and Matteo Iacoviello. The GPR index captures the level of geopolitical tensions based on the analysis of media signals. The combination of the three sources allows for the direct connection and correlation between the three factors and the internationally recognized GPR index. The paper uses an integrated methodological approach that combines the results from three different approaches. The first method uses panel data analysis in an effort to identify the average marginal effects while controlling for unobserved heterogeneity. The second method uses the technique of clustering in an effort to identify structural patterns and divide the countries into groups based on their unique characteristics and risk profiles. The third method uses machine learning regressions and nonparametric analysis in an effort to capture the complex relationships and interactions in the data. The three-step method is used for each pillar in an effort to ensure consistency and comparability. The results suggest that the three factors contribute to the GPR index in a unique manner. The environment and energy structure contribute to the GPR index as a risk multiplier, the social factor is related to the exposure to instability, and the governance factor is a central stabilizing factor. The paper makes a unique contribution to the literature by defining the concept of the three factors and their relationship to the GPR index in a unique and sustainable manner.
Keywords:
ESG
; geopolitical risk
; sustainability
; environmental and social factors
; governance quality
1. Introduction
Geopolitical risk is a characteristic of the modern global order and plays a significant role in international politics and economics and in making global investments and development paths. Events of political instability and conflict, international tensions and institutional failures are increasingly impacting global and national economics and finance in a significant way, as is reflected in an emerging literature that treats geopolitical risk as a quantifiable and dynamic phenomenon and not a mere subjective concept (Caldara and Iacoviello, 2022). These types of risk are often manifested in terms of policy uncertainty and confidence shocks and are often accompanied by spillovers in international markets (Caldara et al., 2020). Simultaneously, the concept of Environmental, Social, and Governance (ESG) has also emerged as a holistic framework for country and corporate level sustainability and risk analyses in a world facing climate change and global systemic instability in finance (Bolton et al., 2020; Pedersen et al., 2021). While both concepts of geopolitical risk and ESG are rising in equal measures in global literature and policy discourse, they are largely progressing in parallel channels of research and policy discourse. This paper takes up this gap in literature and research by asking a primary research question: How far can the country-level Environment, Social, and Governance aspects of ESG help in explaining international and temporal variations in country-level geopolitical risk? The need to undertake this research arises from an increasingly acknowledged understanding that geopolitical instabilities are increasingly becoming a result of structural factors such as climate-related pressures, resource constraints, demographic factors, inequality, and a lack of effective governance structures and processes. Environmental degradation and climate change can contribute to increased resource competitions, increased instances of extreme weather events, and increased tensions between different international entities, with far-reaching macroeconomic and political repercussions (Kahn et al., 2021). There is a considerable body of literature that identifies a link between climatic shocks and conflict and political instabilities, and this highlights how environmental factors can become a threat multiplier in a fragile situation (Burke et al., 2015; Ide et al., 2021). Social factors, including inequality, migration pressures, and political polarization, can contribute to instabilities and instigations in a situation, and a lack of effective governance structures reduces a country’s ability and capacity to withstand both internal and external shocks and instabilities. Political economy theories highlight how changes in power and governance structures affect instabilities in a situation (Acemoglu et al., 2011). Governance factors, including rule of law, protection from corruption, and effectiveness in governance structures, are factors that affect political stability and are not new in understanding political stability and macroeconomic factors (Kaufmann et al., 2007). Even though these mechanisms are often analyzed from a qualitative point of view when it comes to strategic assessments, there is a lack of comprehensive evidence on how ESG variables are related to geopolitical risk. The reason behind this is that most studies are focused on treating geopolitical risk as an exogenous factor influencing economic outcomes, or they are focused on individual variables related to corporate governance without integrating them into an ESG framework (Caldara & Iacoviello, 2022). Even when it comes to outcomes on a corporate level, it’s often focused on finance or legal aspects rather than macro-political stability (Wang & Overby, 2022). The originality of this article is that it clearly recasts the concept of geopolitical risk in terms of an outcome that is embedded in sustainability conditions. Instead of focusing on the concept of geopolitical risk in terms of its relationship to conflict events in the international realm, this article recasts ESG factors in terms of structural drivers that determine the vulnerability/resilience of countries to geopolitical risk. This recasting of the concept of geopolitical risk makes it possible to examine this concept in terms of its relationship to the cumulative outcome of environmental factors, societal factors, and governance factors. This article thus seeks to combine two bodies of knowledge that have hitherto been quite unrelated to each other. These two bodies of knowledge that this article seeks to combine relate to the growing body of knowledge that has been focused primarily upon ESG factors in terms of sustainability (Pedersen et al., 2021). The methodological design of the study also makes an innovative contribution. While previous research on this topic has generally used only one empirical methodology, this article uses a multi-method design combining panel econometrics, clustering analysis, and machine learning regression techniques, which captures nonlinear relationships in macro-political risk research in an effective manner. Another innovative aspect of this article is the decomposition of ESG into its three-pillar structure in a systematic manner. While most of the previous research on this topic uses aggregated ESG scores, this article breaks down E, S, and G into separate categories and examines their individual impact on geopolitical risk, which makes it possible to compare the relative weights of climate-related variables, social issues, and institutional factors. In conclusion, the article makes an important contribution to existing literature by presenting a new conceptual and empirical connection between ESG and geopolitical risk. The article presents an integrated approach, breaks down ESG into basic elements, and shifts the focus of geopolitical risk as a result of basic sustainability factors. In doing so, it fills an important gap existing in existing literature while presenting important insights with clear policy implications for risk, sustainability, and geopolitics.
2. Literature Review
Common to these is the understanding that GPR is not only a shock, or exogenous event, but also a structural driver of sustainability, finance, and business behavior. Studies such as Benammar et al. (2026) and Doğan & Zeren (2025) illustrate the role of GPR in increasing ESG-related uncertainty, suggesting that the outcomes of sustainability are extremely sensitive to strategic and political tensions. This is reflected in the panel and machine-learning findings in the attached analysis, suggesting that GPR is the product of underlying conditions rather than a shock. A number of articles, including Boccaletti et al. (2026), Sovbetov (2025), and Sha et al. (2025), use significant geopolitical events, such as the Russia-Ukrainian war or the tensions between China and the USA, to illustrate that ESG performance is asymmetrically affected. This is reflected in the clustering findings in the analysis, in which countries with lower ESG performance are grouped with regimes of higher GPR. Some articles, such as Huo & Shi (2025) and Newaz & Aslam (2025), examine ESG rating disparities and ESG-related instruments, illustrating that GPR leads to greater disparities, volatilities, and portfolio rebalancing. This is reflected in the machine-learning findings, in which non-linear ESG-GPR correlations are identified that may not be observable in traditional models. Articles that examine specific channels, such as climate promises and green bonds (Das et al., 2026), clean energy markets (Akadiri & Özkan, 2026), or innovation and supply chains (Li et al., 2026), illustrate that ESG dimensions have multiple mechanisms. The attached analysis reflects the multidimensionality of the literature in that the E, S, and G dimensions of ESG are examined in separate analysis, illustrating that each ESG pillar drives GPR in distinct, yet related, ways. The literature on ESG-related connectivity and spillovers, such as Abdelkader & Si Mohammed, 2025; Ha, 2025; and Shen et al. 2025, provides robust support for the methodology used in the analysis, namely the use of panel analysis, clustering, and machine-learning. Taken as a whole, the literature provides support for the major finding of the analysis: ESG dimensions are structural, rather than peripheral, determinants of GPR. According to Kuai and Wang (2025), Al Amosh and Khatib (2025), and Cheng et al. (2025), the stronger the geopolitical risk, the weaker the ESG performance, although this effect is nonlinear and conditional on governance, attention, and policies. These findings correspond closely with the panel data estimates in this research, which also reveal governance factors as the strongest stabilizers of geopolitical risk and institutional deficiencies as risk multipliers. Likewise, the estimates in the research correspond with the findings in Xie et al. (2025) and Al-Yafei and Bennasr (2025), which demonstrate the structural economic and institutional mechanisms through which geopolitical risk is an outcome, and not an exogenous constraint on economic performance. On the financial market side, the role of spillovers, higher-order moments, and portfolio diversification in geopolitical risk is emphasized in the works of Karkowska and Urjasz (2025), Cui and Maghyereh (2025), Bajra et al. (2025), and Fabozzi (2025). These works correspond with the machine learning estimates in this research, which also found nonlinear responses and regime-dependent effects of ESG on geopolitical risk. Moreover, the clustering results in this research correspond with these works, which also found that stronger ESG performance in markets and countries is associated with reduced volatility transmission and resilience in geopolitical risk. Some works in this stream of research have extended the focus on sustainability beyond financial and capital markets. Thus, geopolitical risk is shown in the works of Kuzina and Steiner (2025) to suppress progress on the achievement of the SDGs in the supranational framework, while new methods for measuring sustainability in uncertain environments have been proposed in the works of Ma et al. (2025) and Ongan et al. (2025). These works correspond with this research in its methodology, which also decomposed ESG performance into Environmental, Social, and Governance dimensions, rather than using overall indices. Finally, works in this stream of research have emphasized the role of artificial intelligence and machine learning in risk research, such as in the works of Lin et al. (2025), which correspond with this research in its use of machine learning regression techniques, and which also highlight the role of flexible and adaptable methods in research on ESG and geopolitical risk interactions. Taken together, this stream of research reinforces the finding in this research that ESG dimensions have an active role in shaping geopolitical risk, through governance, expectations, and resilience, rather than being passive constraints on economic performance. Some works in this stream of research have emphasized the role of methodological innovation and artificial intelligence in research on risk and sustainability. As Gupta and Yan (2025), Pham (2025), Alam et al. (2025), and Lin et al. (2025) illustrate, large language models, AI analytical tools, and reinforcement learning techniques improve the detection and quantification of new risks. These techniques heavily validate the regression component of the attached analysis, a component using machine learning to identify non-linear correlations between ESG and GPR, beyond the capacities of traditional econometric models. The emphasis on information uncertainty and structural vulnerabilities also corresponds with the study’s definition of geopolitical risk as a result of endogenous processes, defined by expectations and vulnerabilities. There also exist analyses on the topic of resilience and various sectors and assets. Papathanasiou et al. (2025), Fabozzi (2025), and Loukil et al. (2025) examine how diversification, centrality, and cross-asset volatility transmissions function within conditions of extreme uncertainty, further supporting the clustering findings on high-resilience and high-fragility regimes. There also exist analyses on specific sectors, such as those on port sectors by Nagararan et al. (2025), supply chain sectors by Bai et al. (2025), and AI and sustainability sectors by Yu et al. (2025), further supporting the breakdown of ESG into Environmental, Social, and Governance categories, and how these categories expose varying levels of systemic risk. There also exist analyses on the topic of institutions and regulations. Zambelli (2025), Lin (2025), and Matviienko et al. (2025) place a strong emphasis on the need for legal systems, financial regulation, and climate-related banking regulation to reduce risks. These findings also support the panel data findings of the study, in which strong governance was repeatedly shown to be a stabilizing influence on geopolitical risk. Finally, analyses on ethical finance, Islamic risk management, and SDG development further support the study’s findings on sustainability and geopolitical risk, suggesting a deep and abiding link between sustainability and resilience. Taken together, these papers support the study’s major conclusion: ESG factors, when approached using a combination of econometric, clustering, and machine learning techniques, represent a structural, rather than a peripheral, driver of geopolitical risk (Table 1).
3. Methodology: An Integrated ESG-Based Multi-Method Framework for Geopolitical Risk Analysis
The research follows a methodological approach that clearly breaks down the ESG concept by its three pillars of Environmental (E), Social (S), and Governance (G). This helps to examine the individual effects of each of these ESG aspects in creating geopolitical risk, which is measured by the Geopolitical Risk (GPR) index introduced by Caldara and Iacoviello in 2022. Instead of focusing on ESG as an aggregate measure, this analysis distinguishes among the three factors to enable an individual investigation of each. This is because it has been argued that environmental factors, societal factors, and governance factors affect the creation of geopolitical risk in different channels, to say nothing of their relative strength in this regard, especially in the context of structural changes like climate change (Bolton et al., 2020; Kahn et al., 2021). For each ESG factor, these three steps of the methodology are systematically followed. To begin with, the panel econometric models are estimated to identify the relationships over time as well as across different countries by considering unobserved heterogeneity. This makes it possible to identify the statistically significant relationships that are interpretable from an economic theory point of view. This is similar to the empirical literature that suggests geopolitical risk as a measurable phenomenon that changes over time (Caldara & Iacoviello, 2022). Second, the application of clustering methods helps to uncover the heterogeneity of the underlying structure and the presence of hidden group memberships of countries according to their characteristics related to ESG. Clustering allows the exploration of the interconnections of ESG variables such as environmental vulnerability, social vulnerability, and governance capacity and the levels of geopolitical risks. This approach fits the perception of systemic risks being driven not only by isolated shocks but also through the interconnections of several dimensions of sustainability (Bolton et al., 2020). Thirdly, machine learning regression techniques are utilized to account for nonlinear relationships and patterns that could not be accounted for in econometric models. Such techniques are particularly useful in analyzing heterogeneous and nonlinear responses to environmental and climate-related variables in macroeconomic and political outcomes (Kahn et al., 2021). The approach combines panel data analysis, machine learning regression, and clustering techniques separately applied to each pillar of ESG factors in a manner that compares results while making use of their complementary advantages. In summary, this integrated framework for methodologies provides a holistic and strong evaluation of individual and combined influences of Environmental, Social, and Governance variables in relation to geopolitical risk and going beyond reduced forms to a more sustainability-focused perspective of geopolitical instability. See Figure 1.
4. Environmental ESG Drivers of Geopolitical Risk: Evidence from Panel Models, Clustering, and Machine Learning
This section explores the link between the E dimension of ESG, which stands for Environment, and geopolitical risk, as measured by the Geopolitical Risk Index (GPR). The hypothesis is that, besides being ecological outcomes, environmental conditions represent the structural risk drivers of instability, which can shape climate risk, pollution, resource depletion, as well as energy structure, thereby impacting the magnitude of occurrence of geopolitical risk, as captured by GPR. To test the link between the two, an empirical model is built, which uses the set of E dimension variables as the basis for an explanation of the values of GPR, using a panel of 42 countries between 2000 and 2023. The following subsections fulfill the above aim through three approaches: panel data, which estimates average effects of E dimension variables on GPR; clustering, which identifies groups of countries characterized by similar E dimension patterns, which are associated with varying levels of GPR; finally, machine learning regression, which explores non-linear patterns of interaction between E dimension variables, which would not be captured through traditional regression models.
4.1. Panel Data Evidence on the Environmental (E) Dimension of ESG and Geopolitical Risk
To analyze the relationship between the E-Environment component of the ESG model and the GPR dimension, i.e. geopolitical risk, we estimated the following equation:
Where and .
Specifically, the variables analyzed are described in the following Table 2.
For the analysis, the dependent variable is Geopolitical Risk (GPR) and is captured using the Caldara and Iacoviello (2022) index, which measures the level of geopolitical risk for a country by counting the number of news stories that are conflict-, politically tension-, and institutional instability-related. This approach has made it possible for GPR to be treated as a time-varying and measurable macro-political phenomenon that has significant economic effects (Caldara & Iacoviello, 2022; Caldara et al., 2020). The research will investigate how well the chosen factors are able to explain the differences in GPR levels for a panel data sample of 32 countries for 16-19 years, which will result in a sample size of 600 data points. This is consistent with the growing literature that focuses on the role of climate change, the degradation of the environment, and the structure of the energy system as the source of economic and political instability (Bolton et al., 2020; Kahn et al., 2021). Four different econometric models were estimated: Pooled OLS, Fixed Effects Model, Random Effects Model via GLS, and Weighted Least Squares. This allows for easy robustness checks under different assumptions regarding the nature of heterogeneity and country-specific structural differences. The Hausman test helped select between fixed and random effects models. It produced a p-value of 0.0086 and rejected the null hypothesis of consistency of the GLS estimator. This supported the fixed effects model. The fixed effects model had a very high R-squared of 0.92 under the LSDV model. This suggests that GPR is driven mostly by country-specific variables. However, the R-squared of 0.14 under the fixed effects model suggests a low explanatory power of the variables. The coefficients are comparable under the different models. This suggests that the results are robust. Natural Resource Depletion: The coefficient on Natural Resource Depletion is negative and significant in all models, suggesting that as natural resource depletion increases, geopolitical risk decreases. While this result might seem counterintuitive at first, it could be because resource-exploiting countries tend to adopt rent-based economies, which in turn might suppress political instabilities in the short run, as per political economy theories on resource rent and stability. The electricity from coal has a positive significant coefficient, meaning that higher dependence on coal to produce electricity is associated with higher GPR, which suggests vulnerability to systemic fragility. This implies that countries dependent on fossil fuels are vulnerable to global shocks, global decarbonization, or conflicts related to energy resources (Bolton et al., 2020). Methane emissions appear as one of the most significant factors, and they have a positive and highly significant coefficient in all models. An increase in methane emission could also indicate an unsustainable development trend, which could lead to social unrest, health issues, and climate change, all of which could contribute to an increase in geopolitical risk. This could also be linked to the fact that environmental stress and emission have been found to contribute to economic and political instability (Kahn et al., 2021; Miah et al., 2021). Safe Drinking Water also has a positive and significant coefficient. Care should be exercised in interpreting this result, since availability of safe water is usually a proxy for development, though in some cases it may be related to rapid urbanization and population concentration, which in institutionally weak environments may produce a different type of inequality and conflict dynamics (Böhmelt et al., 2014). Results for Renewable Energy Consumption are mixed, as it is positive in the Random Effects, Fixed Effects, and Random & Fixed Effects models, but negative in the Pooled OLS and Weighted Least Squares models. This volatility could be an indicator of endogeneity, as there might be correlation between Renewable Energy Consumption and country-specific effects. In the more accurate models, the positive sign may be an indicator of the fact that the transition process, especially during the initial stages, is associated with transition costs, which increase political uncertainties, as discussed by Bolton et al. (2020). Tree Cover Loss has a positive and significant coefficient, which means that deforestation is positively related to geopolitical risk. This is supported by literature that connects the degradation of the environment, rural livelihoods, and land use conflicts, especially in environments with low adaptive capacity (Burke et al., 2018). The fixed effects model has a strong explanatory ability, but there are a number of econometric issues that need to be noted. The White test for heteroskedasticity and the Wald test both reject the null hypothesis of homoskedasticity of the residuals, suggesting the presence of heteroskedasticity of residuals across countries. The Pesaran CD tests show the presence of cross-section dependence, suggesting the presence of cross-country spillovers in the sense that the shock in one country can spill over into other countries, which can be true in the sense of global geopolitical risks associated with the global energy markets (Pesaran & Tosetti, 2011). The Wooldridge test suggests the presence of first-order autocorrelation, while the tests for In sum, the findings of the analysis demonstrate that the role of environmental and energy-related dynamics is a crucial determinant of GPR. While the use of coal, methane emissions, and the destruction of forests are related to GPR, the relationship between GPR and the use of natural resources is much more complex and may be mediated by institutional and economic mechanisms. The relationship between the energy transition and GPR is not one-dimensional and may be contingent on various country-specific factors and adjustment costs. The findings of the analysis provide evidence that the role of environmental policy is not limited to its relationship with the environment, as the increasing relevance of environmental disasters to financial and geopolitical risk is well established in the literature, including the role of climate change in shaping global economic policy, including the prevention of global conflicts, as established in Caldara et al. (2020) and Pankratz et al. (2023). In addition, despite the econometric challenges of heteroscedasticity, cross-sectional dependence, and the possibility of endogeneity, the analysis provides clear evidence that the role of environmental sustainability is a structural determinant of GPR and should be mainstreamed in the strategies of policymakers seeking to contribute to long-term GPR. See Table 3.
4.2. Environmental Risk Regimes and Geopolitical Risk: A Clustering-Based Assessment
The choice of the most appropriate clustering algorithm must be based on a balanced evaluation of several performance indicators, since each metric captures a different aspect of clustering quality (Arbelaitz et al., 2013). In this comparison, all indicators have been normalized so that higher values always correspond to better performance, allowing a coherent cross-algorithm assessment. Among these indicators, particular attention is devoted to the HH index, which measures concentration and balance in cluster sizes and is especially relevant when interpretability and representativeness of clusters are important. Hierarchical clustering clearly stands out in terms of internal cohesion and separation. It achieves the maximum normalized score for minimum separation, Pearson’s γ, Dunn index, and entropy, and also performs very well on the Calinski–Harabasz index. These results indicate that hierarchical clustering produces well-separated and compact clusters with high structural quality (Arbelaitz et al., 2013). However, its HH index is equal to zero, signaling a very high concentration of observations in a small number of clusters. This severe imbalance reduces the practical usefulness of the solution, especially when the objective is to obtain clusters of comparable size or to avoid dominance by a few large groups. K-Means also shows excellent performance on some classical validity indices, particularly Pearson’s γ and the Calinski–Harabasz index, where it reaches the maximum normalized value. Nevertheless, its HH index is extremely low, indicating strong concentration and limited balance in cluster sizes. This makes K-Means less suitable in contexts where cluster size homogeneity is a priority. Density-based methods display the opposite profile. While they perform weakly on separation and compactness metrics, they achieve the maximum score on the HH index. This indicates a very balanced distribution of observations across clusters, which is a desirable property when the goal is to avoid overrepresentation and ensure interpretability; moreover, density-based clustering frameworks are explicitly designed to capture heterogeneous structures and distinguish clusters from noise (Campello et al., 2015). However, the poor performance on most quality indices suggests limited overall clustering structure. Random Forest–based clustering emerges as the most balanced solution. It does not dominate in any single metric, but it consistently performs well across all indicators and shows a high HH index, second only to the density-based approach. This implies a good compromise between cluster quality and size balance. More broadly, machine learning approaches are often preferred in applied settings when the underlying relationships are complex and potentially nonlinear, as they can enhance robustness and discriminative power across high-dimensional feature spaces (Martínez Torres et al., 2019). Considering all indicators jointly, and giving particular weight to the HH index, Random Forest appears to be the most appropriate algorithm, as it provides a robust trade-off between structural quality and balanced cluster composition. See Table 4.
This analysis endeavors to assess the role of variables included in the Environment dimension of ESG ratings on the explanation of geopolitical risk, as captured by the Geopolitical Risk (GPR) index. In grouping countries into clusters using a broad set of data on the environment, energy, climate, and natural resources, the analysis allows for the determination of persistent patterns of the environment, which correspond with levels of geopolitical risk. In this context, the Geopolitical Risk is understood not as an exclusively political phenomenon but as a phenomenon influenced by pressures of the environment, energy patterns, as well as climate exposure, consistent with the view that climate shocks have the role of systemic risk multipliers (Bolton et al., 2020; Kahn et al., 2021). Those with higher GPR values (such as clusters 1, 3, 5, 6, and 7) are likely to reflect a set of undesirable environmental factors. These are likely to be associated with high emissions of CO₂, methane, and the use of fossil fuel or coal-based power. In some cases, these are also likely to be associated with high Cooling Degree Days, Heat Index values, or energy intensity, reflecting a high degree of climate stress. This is consistent with the idea that environmental degradation and climate stress are associated with geopolitical instability in that these factors increase costs, tensions, and reliance on foreign energy sources (Bolton et al., 2020; Kahn et al., 2021). Further information on emissions dynamics is that energy shocks and emissions-intensive structures of production can be associated with economic and political stress (Şahin & Chen, 2023). Resource depletion indicators are also important for the differentiation of clusters. Losses of adjusted savings because of natural resource depletion or forest depletion are regularly found to be higher for clusters that have a higher GPR, implying that mismanagement of natural resources can impact negatively upon resilience as well as geopolitical risk. Similarly, Tree Cover Loss as well as a decrease in the area covered by forests is regularly found to be higher for clusters that have a higher geopolitical risk, as land degradation or deforestation can lead to increased conflict over natural resources as well as livelihoods (Burke et al., 2018). On the other hand, the probability of having less favorable environments would be associated with the lower or negative GPR value countries (e.g., countries 2 and 8). These countries would generally display a positive performance in terms of access to clean fuels and electricity, lower emissions intensity, and a higher share of renewable energy consumption/output. They would also display a lower level of pollution, such as PM2.5, along with a strong performance in the indicators related to the use of water, namely access to a safely managed drinking water source and sanitation facility. From the ESG point of view, these factors would denote a strong performance in terms of environmental sustainability, which would be associated with a low probability of having a geopolitical risk (Bolton et al., 2020). Also, the indicators of climate variability and water stress add more evidence for the above analysis. The regions that have higher levels of water stress, freshwater abstraction, and SPEI are more likely to be linked with higher levels of GPR. Water scarcity and climate conditions are structural risk multipliers that increase the level of resource competition and the chances of conflict both domestically and internationally. The existence of such regions in the higher levels of GPR adds evidence for the significance of environmental conditions as drivers for geopolitical events, as discussed in the literature on the relationship between conflict and cooperation and water (Böhmelt et al., 2014). The energy structure is seen as a significant channel in particular. The reliance on fossil fuels, electricity generated by coal, and energy imports is more prominent in clusters that are highly dependent on GPR, while those that are more reliant on renewable energy are associated with a low level of geopolitical risk. This is in line with the ESG framework where the Environment pillar focuses heavily on energy transition and its importance in terms of mitigation and adaptation to climate change but also in terms of minimizing reliance on global shocks and geopolitics (Bolton et al., 2020; Şahin and Chen, 2023). On the whole, the outcome of the cluster analysis indicates that the Environmental factor in the ESG is strongly related to GPR. Nations under strong environmental pressure, having inefficient energy resources, and being climate change vulnerable are more GPR-prone. The opposite is true for nations enhancing their environment, resource sustainably managed, and advancing in the clean energy transition. The result confirms the strategic importance of environmental sustainability for GPR and the relevance of including environment factors in the GPR model as explanatory variables (Kahn et al., 2021). Table 5.
This analysis uses the Environmental, Social, and Governance (ESG) approach, focusing specifically on the role of the Environmental (E) aspect in relation to geopolitical risk as defined by the Geopolitical Risk (GPR) index. The importance of the individual environmental variables in the explanation of the GPR index can be understood from the mean decrease in the Gini importance, which highlights the role of the environmental variables in the explanation of the GPR index rather than focusing on the direct relationships of the variables. The most important variables in the explanation of the GPR index are related to climate and temperature variables: Heating Degree Days (HDD), Land Surface Temperature (LST), Cooling Degree Days (CDD), and Energy Use per capita (ENU) rank among the highest variables. The results of the analysis imply the importance of the vulnerability of the environment to climate and temperature factors in the explanation of the GPR index, suggesting the vulnerability of the regions to climate and temperature factors, which are also characterized by increased requirements for energy in terms of heating and cooling, indicating increased structural pressures in terms of the infrastructure, financial, and energy sectors of the regions, which can be reflected in increased geopolitical risk vulnerability. The results of the analysis, from the ESG aspect, imply the importance of climate vulnerability in the explanation of political risk, which suggests a direct link to political risk factors, indicating the importance of climate vulnerability in the explanation of political risk factors, which support the idea of the role of weather and climate factors in the explanation of economic and social risk factors (Dong & Tremblay, 2021; Carleton & Hsiang, 2016). Energy-related factors also appear prominently. Energy imports (ENI), energy intensity (EINT), electricity from coal (ECOA), fossil fuel consumption (FOS), and renewable energy consumption (REN) appear prominently. This helps to reinforce the idea that energy systems and their efficiencies represent basic channels of transmission of environmental performance to geopolitical risk. High levels of energy imports and fossil fuel use increase risk vulnerability to global risk sources, while inefficient use of energy adds to environmental pressures. The prominence of renewable energy factors suggests that the issue of the energy transition has become increasingly important in terms of both environmental impacts and geopolitics, in accordance with the strategic-political economy approaches to climate/green transformation (Saidin & O'Neill, 2022). Depletion and land-use indicators: natural resource depletion (NRD), tree cover loss (TCL), forest area (FOR), and agricultural land (AGL) are also highly ranked. This is evidence that unsustainable use of natural capital can weaken resilience and heighten geopolitical risk through increased competition for land, food, and ecological services. The weight for agriculture, forestry, and fishing value added (AFF) supports the importance of resource-based economic systems to resilience to environmental and geopolitical shocks, as seen by evidence of relationships between environmental pressure, biocapacity, and economic resilience (Nathaniel, 2021). The water-related indicators are an integral part of this framework and include annual water withdrawal (WAT), water stress (WSTR), safely managed drinking water (SMDW), sanitation (SMSS), and water quality (WQG). The importance of water scarcity and mismanagement as a risk multiplier and potential cause of social unrest, international conflict, and instabilities in a region underlines its relevance in GPR and supports the hypothesis that water security and sustainability are inextricably intertwined and carry direct geopolitical significance in regions prone to climate change and instabilities in governance. Indicators of pollution and emissions such as CO2, CH4, N2O, and PM2.5 air pollution also carry significant weight in this context. These variables address not only climate change externalities but also damages to the local environment that may impact health, efficiency, and stability in social and economic terms. This significance further underscores that not only climate change, but overall degradation in the environment, is a component of geopolitical risk in a variety of ways. On the whole, the results for the feature importances offer strong empirical support for the relevance of the Environmental pillar of ESG as a whole for the explanation of geopolitical risk. GPR is clearly associated with climate change, the structure of the energy system, resource depletion, water scarcity, and overall pollution. The fact that some variables have a less strong explanatory power does not mean that they are irrelevant, but that they could be drivers of GPR along paths and processes that are difficult to distinguish from the paths and processes for other types of risk, at least in the short term, while they could be distinguished over the medium and longer term. What the study clearly shows, however, is that the consideration of environmental factors and sustainability issues is a must for the understanding of geopolitical risk as a whole. The Environmental pillar of ESG clearly represents a key element for the explanation of GPR, and confirms the idea that climate change, resource management, and the energy transition, and more generally the environmental issues, represent the foundation for the building of geopolitical resilience and stability. Table 6.
The following is a representation of the results of the Random Forest-based clustering technique on the Environment (E) dimension of ESG, which helps understand the impact of ESG on geopolitical risk (GPR). In panel A, the model selection step is depicted, which helps derive the appropriate number of clusters for the model. The graph of the Within-Cluster Sum of Squares (WSS) measure, together with the information criteria AIC and BIC, decreases as the number of clusters is incremented, thereby implying an improvement in the model's fit. However, the graph of the BIC reaches a trough at approximately nine clusters, marked with a red circle. This result helps derive an appropriate balance between model fit, as captured by the model's explanatory power, and model simplicity, thereby implying that nine clusters are appropriate for adequately characterizing the underlying structure of the data without falling prey to model complexity. The strategy of using multiple internal criteria for validating clusters is consistent with the literature on clustering, which suggests an appropriate balance between compactness, separation, and simplicity of clusters for adequately characterizing underlying patterns of multidimensional data (Arbelaitz et al., 2013). Panel B above shows a two-dimensional representation of this clustering outcome. Each data point in this graph represents an observation described by a variety of environmental factors, and these factors are grouped based on their cluster identities signified by different colors. This shows that the countries have been effectively grouped or partitioned based on their environmental characteristics through the use of the Random Forest method, and this is a clear indication that this method is capable of handling a variety of nonlinear relationships in a dataset (Martínez Torres et al., 2019). These groups or regimes represent different factors such as climate vulnerability, energy systems, resource use, and environmental distress that fall within the Environmental pillar of ESG analysis. In general, the use of sophisticated machine learning algorithms for representation learning and pattern extraction helps to provide a more complex description of environmental regimes compared to traditional linear approaches (Ismail Fawaz et al., 2019). The identification of different environmental profiles related to different degrees of GPR helps to interpret the concept of geopolitical risk as an effect driven by environmental sustainability, climate-related stress, and energy dependence. This further emphasizes the importance of the Environmental dimension in the ESG framework analysis of geopolitical risk. See Figure 2.
4.3. Machine Learning Prediction of Geopolitical Risk from Environmental ESG Indicators: Model Comparison and Key Drivers
On the basis of the normalized results (where a scale from 0 to 1 has been used, with higher results indicating better performance), it can be concluded that the best-performing model is indeed the KNN model. The objective evidence clearly reveals that for all the tested parameters, such as MSE, scaled MSE, RMSE, MAE/MAD, MAPE, and R², the best possible result of 1.00 has been achieved by the KNN model. It is clear that the model has been able to achieve the minimum possible error along with the maximum possible goodness of fit. Moreover, it can also be concluded that there is no trade-off between accuracy and goodness of fit because the minimum error is achieved at the highest value of R². The second-best algorithm here turns out to be the Random Forest algorithm. The performance of the algorithm is consistent in all aspects, particularly in terms of MSE, RMSE, and R², where it comes very close to the best results obtained by the KNN algorithm. It doesn’t obtain the highest score in all aspects, indicating a slightly lower accuracy than the KNN algorithm, though its robustness is very high. Linear Regression and Regularized Linear Models give intermediate results. They display good interpretability but moderate levels of error, which is clearly inferior to the performance of KNN and Random Forest Algorithms, but which could be useful if interpretability is of primary importance. Boosting, Decision Tree, and SVM have relatively weaker performances. Specifically, the Decision Tree has close to zero scores for some metrics, which shows that the model lacks the ability to generalize, while the SVM model has relatively low scores for most metrics, especially with regards to overall fit. In conclusion, KNN is the best method in the context of predictive accuracy, and Random Forest is a good alternative if robustness and generalization are the main priorities. Table 7.
The outcome of the KNN model provides a straightforward interpretation of the role of environmental factors in the explanation of geopolitical risk in the ESG model. The importance of the variables, considering the capability of the KNN model to identify nonlinear patterns, focuses on the actual role of environmental stressors in the explanation of geopolitical risk (GPR) rather than the importance based on a linear model. The most important variable in the model is the annual freshwater withdrawal (WAT) because it has the highest dropout loss in the model. The importance of the WAT variable positions the role of water availability as a pivotal environmental factor in the explanation of geopolitical risk. High freshwater withdrawal often indicates a stress situation in the availability of water resources, competition among sectors, and cross-boundary conflicts, especially in regions characterized by limited access to water resources, consistent with the theoretical explanation of the role of water scarcity in conflict patterns (Böhmelt et al., 2014). Very closely related to the importance of WSTR are the indicators of water infrastructure, including the safely managed sanitation (SMSS) and the safely managed drinking water (SMDW) variables, which also appear among the most important variables in the model. Emission-related variables also feature largely in terms of their importance. The emissions of nitrous oxide (N₂O), the usage of fossil fuels (FOS), CO2 emissions, methane emissions (CH₄), and pollution by particulate matter (PM2.5) are variables that feature large importance values and are thus closely linked to changes in GPR and feature a strong structural relationship with polluting production structures and energy types that are particularly susceptible to international climate policy pressure and costs of adaptation in terms of social tensions linked to environmental damage (Kahn et al., 2021; Şahin & Chen, 2023). Land use and environmental degradation also appear as prominent drivers. Tree cover loss (TCL), agricultural land (AGL), forest area (FOR), and agriculture, forestry, and fishing value added (AFF) score highly, indicating the impact of unsustainable use of the land and dependence on resource-intensive industries on geopolitical risk. Such drivers have been found to be associated with food security issues, subsistence in rural areas, and resource use disputes, as described in research on agricultural ecology and environmental degradation (Chowdhury et al., 2022). Another important dimension is energy structure and strength. Renewable energy use (REN), energy intensity (EINT), electricity generated from coal (ECOA), energy use per capita (ENU), as well as energy imports (ENI) all have been found to be of considerable importance, thus confirming that the way energy is generated as well as consumed is an important underlying factor of geopolitical risk. The importance of renewables, on the other hand, suggests that energy transition is an important factor of geopolitics, especially during structural changes in energy systems (Şahin & Chen, 2023). The role of Climate Variability Indices such as SPEI, Heat Index 35 (HI35), HDD, CDD, and Land Surface Temperature (LST) cannot be underestimated in this regard, further proving that vulnerability to extreme climatic conditions has the effect of acting as a risk multiplier in terms of geopolitical instabilities (Kahn et al., 2021). In conclusion, the KNN outcomes strongly verify the conclusion that geopolitical risk is ingrained in the environment. Water stress, emissions, land degradation, energy structure, and climate-related risks are found to be crucial components of the Environmental factor of ESG. These results emphasize that environmental sustainability is a concern that goes beyond ecology to become a core element of geopolitical risk. See Table 8.
From the table above, it can be seen that the local explanation for the GPR predictions based on the KNN model is provided, focusing clearly on the Environmental (E) factor of the ESG approach. For each of the five cases, a predicted GPR value is compared to a baseline value, with the individual contributions of the environmental variables explaining how the difference from the baseline is achieved. Positive contributions show factors increasing the level of geopolitical risk above the baseline, while negative contributions show factors that mitigate against it. For all five cases, the predicted GPR is always below the baseline value of 0.224, indicating that the environmental profiles for these five cases work to decrease geopolitical risk. This fits the definition of geopolitical risk as a measurable, dynamic process affected by structural factors rather than short-term political considerations (Caldara & Iacoviello, 2022). However, the decrease in GPR is due to the combined effect of different dimensions in the environment and not a single one. Energy structure and use stand out as a significant dimension in this respect. Variables like electricity from coal (ECOA), fossil fuel use (FOS), and energy use per capita (ENU) often display a negative contribution in many scenarios, especially in scenarios 1, 2, and 5, signifying that a lower dependence on carbon-rich energy and a moderate use level is correlated with a decrease in geopolitical risk. This result is consistent with the ESG view that cleaner and better energy systems result in a lower vulnerability to external shocks and geopolitical tensions (Bolton et al., 2020). Renewable energy use (REN) often shows a positive contribution in many scenarios, especially in scenario 1, signifying that a cleaner energy transition has a stabilizing effect in the geopolitical system and is consistent with evidence on climate transition and risk reduction and building resilience (Pankratz et al., 2023). Another important pathway involves water-related variables. Annual water withdrawal (WAT) and water stress (WSTR) often include negative weights, indicating that lower water pressure is a factor that decreases GPR. However, a high level of water withdrawal, as seen in case 5, positively affects GPR and confirms the idea that water scarcity and competition are important environmental risk-multipliers. This finding is supported by the literature that shows the impact of water availability and water-related variables on political instability and conflict (Böhmelt et al., 2014). Emissions and pollution indicators also demonstrate systemic effects. Methane emissions (CH₄) are always lowering the GPR, while nitrous oxide (N₂O) emissions have a positive impact. The impact of CO₂ emissions on GPR remains small and positive, indicating that higher emissions lead to higher geopolitical risks. The impact of particulate matter (PM2.5) on GPR remains inconclusive, with higher positive effects observed on some occasions, emphasizing the importance of environmental degradation to political stability. This confirms that climate change and environmental externalities impose systemic macroeconomic and political costs that may lead to higher geopolitical vulnerability (Kahn et al., 2021). Land use and ecosystem variables further influence the predictions. Agricultural land (AGL), forest area (FOR), and tree cover loss (TCL) are always negative factors, suggesting that better management of land and less degradation of ecosystems are factors that lead to a reduction in geopolitical risk. At the same time, variables associated with climate-related stress, such as Cooling Degree Days (CDD), Heating Degree Days (HDD), land surface temperature (LST), and Heat Index (HI35), are small but consistent factors, thus validating that climate-related extremes are a background driver of geopolitical risk (Kahn et al., 2021). In sum, these case-level findings further emphasize the overarching theme from the ESG analysis: the GPR is significantly impacted by the environment. Water security, energy mix, emissions, land use, and climate together drive whether a nation’s environment is an exacerbator or reducer of GPR. The clear pattern from these five cases that the predicted GPR is below the baseline in each one makes clear the benefit for geopolitical stability from enhancements in the Environmental component of the ESG and further supports the notion that environmental sustainability is a structural part of the GPR and the broader risk and resilience landscape (Bolton et al., 2020; Pankratz et al., 2023). See Table 9.
The figure provides a diagnostic summary of the K-Nearest Neighbors algorithm used for the estimation of geopolitical risk (GPR) based on environmental factors in the ESG model. The three graphs in the figure combine to illustrate the model's accuracy, the process of parameter determination, and the weighting system used in the model. Panel A of the figure illustrates the relationship between the actual values of GPR and the model's predictions for the values of GPR in the testing data set. The scatter diagram in the panel illustrates a very strong positive linear relationship, where most of the data points are closely aligned along the reference line representing a 45-degree angle, thus indicating the model's ability to accurately reproduce the actual values of GPR in the data set. The deviations from the reference line are small but slightly larger for the data points representing the highest GPR, thus indicating a slight worsening of the model's prediction accuracy in extreme GPR conditions, which aligns with the expected limitations of the model in extreme conditions based on the established principles of instance-based learning algorithms in model predictions (Kuhn & Johnson, 2019). Panel B focuses on model tuning, plotting the mean squared error against the number of nearest neighbors. The dashed line indicates the training error, which monotonically increases with the number of neighbors, as expected with the accompanying growth in bias. The solid line indicates the validation error, which decreases to a minimum around two nearest neighbors before growing again. The red dot indicates the optimal value of k that achieves a balance between bias and variance. This captures the traditional bias/variance tradeoff observed in non-parametric machine learning models, indicating that a small neighborhood size is all that is needed to identify local data structures (Kuhn & Johnson, 2019). This trend has been observed in applied studies on complex relationships using KNN in machine learning (García Rodríguez et al., 2021). Panel C shows the relative weights of neighbors by distance. The flat line represents uniform weights, which means that each of the selected neighbors has an equal say in the prediction. This selection aligns with the local averaging concept of the KNN algorithm to counterbalance the possibility of focusing too much on one observation. From an interpretability perspective, uniform weights make it easier to interpret local predictions. It follows best practices in interpretable machine learning for distance-based algorithms (Molnar, 2020). Together, the above figures show how the KNN model is a calibration, a stability, and a strong link between the Environmental aspect of ESG and geopolitical risks. Using its high predictability, clear parameters, and weighting, the model is a perfect solution to identify the non-linear and specific environmental factors influencing geopolitical risks. See Figure 3.
5. Social Foundations of Geopolitical Risk: An ESG-Based Multi-Method Assessment
In this section, we evaluate the impact of the Social (S) element of the ESG framework on geopolitical risk, as measured by the Geopolitical Risk (GPR) index. The primary research hypothesis is that geopolitical risk is a phenomenon that not only stems from political conditions in the present but also from deeper social structures such as demographically contingent risks, vulnerabilities to labor market risk, and dynamics of inclusion, which cumulatively may increase a nation's susceptibility to geopolitical risk. In order to capture the intricacies of such a relationship between these social structures and geopolitical risk, we use a combination of three different methods. First, we use a panel data econometric model to estimate a conditional relationship between GPR and a set of social variables such as net migration (MIG), unemployment (UNEM), and population aged 65 years or older (POP65), which are controlled for in a model that also accounts for unobservable country-specific heterogeneity. This allows for a meaningful point estimate to be derived that can be used to evaluate whether a relationship between these social factors and the variability of geopolitical risk exists. Second, we use a clustering analysis that groups countries on a set of additional social factors such as health, inequality, education, participation, and demographics. These allow for a mean difference analysis of country-specific groups on GPR to identify which groups of countries on these additional sets of social factors are associated with varying levels of geopolitical risk. Finally, we use machine learning models of regression analysis that focus on non-parametric models to identify any non-linear relationships between these sets of social factors that may exist in relation to geopolitical risk that are currently unidentified in standard econometric models of analysis.
5.1. Estimating the Social Pillar’s Effect on Geopolitical Risk: A Panel Econometric Approach
To estimate the impact of the S-Social component on geopolitical risk, we estimated the following equation:
Where i=42 and t=[2000;2023].
The description of the variables used is given in the Table 10 below.
The research is deliberately positioned within the ESG framework—Environmental, Social, and Governance issues—which is currently a prominent method for evaluating country and economic system sustainability and risk profiles (Iwanicz-Drozdowska et al., 2025). The current research focuses on the Social aspect of ESG and investigates its relationship to demographic and labor-market factors in explaining GPR (geo-political risk). The dependent variable is GPR (Geo-Political Risk), which is an indicator calculated by the number of news articles related to conflicts and political instability. The relationship of GPR to migration rates, unemployment levels, and aging populations is used to explain geo-political risk as a social-structural phenomenon (Kharlamova et al., 2025). The data set provides a panel of 42 countries over a period of 22-24 years, yielding a total of 1,006 observations. Four econometric models were applied: Fixed Effects, Random Effects GLS, Pooled OLS, and Weighted Least Squares (WLS). The Hausman test overwhelmingly rejects the null hypothesis of consistency for the GLS estimators (p = 7.8e-05), suggesting the fixed effects model as the best fit. The result matches the ESG view, which suggests that social factors are primarily explained by country-specific institutional differences rather than random variables. The LSDV R-squared measure of 0.81 for the fixed effects model suggests the explanation of a large part of the variation in GPR by structural factors of countries, whereas the within R-squared measure of 0.02 suggests the importance of the remaining social factors in the short run. The joint significance tests of the variables are highly significant in all four models, thus affirming the importance of migration, unemployment, and demographic factors in the explanation of GPR (Onomakpo, 2025). From the point of view of the ESG Social factor, the variable MIG (net migration) is a very important one. The migration process is a reflection of demographic pressure, labor market opportunities, and the ability for social integration (Zatonatskiy et al., 2024). The sign and significance of the coefficient for the variable MIG are positive in all models, and this indicates that the higher the net migration, the higher the level of geopolitical risk. This result can be explained in a number of ways: a large number of migrants can create tensions in society, competition for public services, and political polarization in countries that do not have effective policies for integrating migrants (Petrović & Vesković, 2025). At the same time, migration can be a result of regional conflicts, and thus a relationship exists in both directions between GPR and MIG (Rostetska et al., 2023). The high significance level for this variable indicates the importance of effective migration management for the ESG Social factor. Unemployment (UNEM) has a negative and significant coefficient in all specifications, which suggests that an increase in the level of unemployment is related to lower GPR. While this could be considered paradoxical, it could be argued that GPR reflects international political tensions rather than domestic instabilities (Adebanjo & Sibeate, 2022). Economies that have low levels of unemployment could be more active in the global economy, leading to greater levels of activity in geopolitical tensions. Alternatively, it could be that economic stagnation, which could be related to high levels of unemployment, results in less media coverage, leading to lower GPR. From an ESG perspective, this implies that the relationship between labor market conditions and GPR is complex. Population aged 65 years or older (POP65) has a positive and significant coefficient in both FE and RE models. Aging populations are often associated with a higher level of geopolitical risk, which may be explained in a number of social ways: pressure on welfare, pension, and healthcare systems; generational conflicts; unresponsiveness to economic change; and opposition to migration and globalization, which may cause political instability (Vollset et al., 2020). The significance of POP65 further reinforces that demographic sustainability is a key aspect of the Social dimension of ESG. The diagnostic tests identify econometric problems with important ESG considerations. The results from the White and Wald tests fail to support homoskedasticity, suggesting that differences in geopolitical risk are not constant from one country to another because of differing social structures. The results from the CD tests in Pesaran are highly significant (p-values close to zero) and support cross-sectional linkages in social factors such as migration crises and labor market shocks, thus confirming that the ESG Social pillar follows a transnational approach (Oliver-Smith, 2022). The results from Wooldridge tests reveal the presence of first-order autocorrelation, suggesting that geopolitical risk follows a persistent pattern in time and supports the idea that social tensions are cumulative and not easily overturned. From a substantive perspective, the findings indicate a number of implications from an ESG perspective. Firstly, geopolitical risks cannot be viewed independently of demographic and labor market dynamics, where the forces of migration and an aging population appear as the underlying causes of instability (Ongan et al., 2025). Secondly, the Social aspect is intertwined with political stories and media perception, where the GPR index is built upon. Thirdly, the management of social inclusion and demographic transition appears as a major tool for the mitigation of geopolitical risks. In summing up, the S (Social) component in ESG has a defining influence on geopolitical risk. Migration processes, labor markets, and a country’s aging population are not only social parameters in a country but also factors in global stability. Nations that do not address issues in integration, labor markets, and a balance between different age groups may end up with political instability expressed in a high level of GPR. Thus, ESG analysis has a correct perspective on this issue and shows that a country’s social sustainability has a defining influence on geopolitical security (Kharlamova et al., 2025; Iwanicz-Drozdowska et al., 2025). Improvement in the S component in ESG analysis may contribute to a reduction in geopolitical risks in a globalized world. See Table 11.
5.2. Clustering Social Structures and Geopolitical Risk: A Comparative Algorithmic Assessment
However, the choice of the best clustering algorithm must be based on a fair consideration of all the normalized measures, focusing on both the quality and the balance of the resulting clusters. Since each of the metrics is normalized such that the best result is denoted by a higher value, it is easy to compare the results across the algorithms. The hierarchical algorithm shows a marked superiority concerning the internal quality of the resulting clusters, achieving the highest value for minimum separation, Pearson's γ, Dunn's index, and entropy, which are combined indicators of highly compact and well-separated and internally consistent clusters (Hindupur et al., 2025). This level of superiority comes with a significant disadvantage: the value for the HH index for the hierarchical algorithm is zero, which is a clear indicator that the data points are highly concentrated around a few clusters. This level of unbalance makes the result less interpretable and less useful, especially for situations that call for a relatively balanced partitioning of the data points. On the contrary, the density-based algorithm shows the highest level of balance as far as the size of the resulting clusters is concerned, achieving the highest value for the HH index (Hindupur et al., 2025). This level of balance comes with a level of structural superiority that is remarkably low for all the metrics, which are combined indicators of the level of separation and internal cohesion of the resulting clusters (Hindupur et al., 2025). This indicates that while the algorithm produces a relatively balanced number of data points, the resulting data points are evenly distributed without any clear level of separation and internal cohesion. k-Means performs well on the Calinski-Harabasz index, as well as on Pearson's γ, but has a rather low HH index, indicating a preference for the concentration of observations into larger clusters. Model-based and Fuzzy C-Means methods result in medium values, neither of which is outstanding regarding structural quality, on the one hand, nor balance, on the other hand. Random Forest-based clustering is clearly the most balanced approach. Although it is not outstanding on any of the individual criteria, it is always close to the best values on all of them. In particular, it combines good separation and compactness (Dunn index, Pearson's γ, Minimum separation) with an extremely high HH index, which is an important indicator of a balanced distribution of observations into clusters (Sondag et al., 2025). This is particularly important if the aim is to identify heterogeneous structure without allowing a single cluster, or a small set of clusters, to dominate the others. Taking into consideration both quality of clustering, on the one hand, and concentration, on the other, Random Forest is clearly the best-performing algorithm, which provides the best balance of all the considered approaches (Sondag et al., 2025; Hindupur et al., 2025). See Table 12.
Results of the Random Forest clustering procedure paint a complex picture of the relationship between the Social (S) dimension of ESG ratings and geopolitical risk (GPR). By grouping countries on the basis of a broad set of social, demographic, health, inequality, and institutional variables, the results highlight specific social patterns, as well as illustrate how particular patterns of social characteristics are associated with varying levels of geopolitical risk. The results are given as standard scores, focusing attention on differences between clusters. Clusters with low or highly negative GPR, such as clusters 1 and 6, have relatively strong social fundamentals. These clusters have stronger performance in Economic and Social Rights (ESR), greater access to public services like education and healthcare, lower rates of undernourishment (UND), lower child mortality rates (U5MR), and higher female labor force participation (FLFP). However, life expectancy at birth (LEX) can be lower because of the composition of the population; nonetheless, these clusters tend to denote a society with greater cohesion and inclusiveness. From an ESG perspective, this data implies that a society that is more inclusive, less unequal, and has stronger social welfare systems acts as a factor that can offset the risks associated with geopolitics (Larson et al., 2025; Koumpagioti et al., 2025). On the contrary, the clusters that correspond to high GPR values, such as clusters 2, 3, 5, 7, 9, and 10, often indicate the presence of social vulnerabilities. These factors include high fertility (FER), undernourishment or prevalence of overweight individuals, high unemployment (UNEM), and poor education and healthcare infrastructure. Some of these clusters have been shown to have high income inequality, which is represented by high Gini coefficients and low income shares of the poorest 20 percent (INC20). These factors can often increase tensions in society, reduce trust in institutions, and increase political instabilities, which is represented by high geopolitical risk (Rao et al., 2023). Demographic dynamics are a crucial factor. Clusters that have a fast-growing population, a higher birth rate, or a large migration stream (MIG) are likely to have a higher GPR. Similarly, the density of the population (PDEN) or the dynamics of older ages (POP65) distinguish clusters, which suggests that demographic pressure as well as demographic imbalance can work as a risk multiplier (Gebreegziabher et al., 2024). Indicators linked to health care, such as the availability of hospital beds per 1,000 or child mortality rates or life expectancy rates, emphasize the need for social resilience to cushion the impact of geopolitical instability (Larson et al., 2025). Socio variables related to governance issues, Women’s Political Representation (WIP), Labor Force Participation (LFP), and Female to Male Labor Participation (FLFP), also explain variations in GPR across clusters. The more socially inclusive and economically participative clusters are associated with lower levels of GPR and thus strengthen the relationship between social inclusion and political stability (Koumpagioti et al., 2025). In sum, the Random Forest clustering approach confirms that geopolitical risk is firmly embedded within social structures. Inequality, exclusion, poor health and education infrastructure, and demographically stressed countries are all vulnerability-enhancing factors, while robust social structures and development on an inclusive basis are vulnerability-reducing (Rao et al., 2023; Gebreegziabher et al., 2024). The key takeaway from these results is that S, the pillar on Environmental, Social, and Governance criteria, remains an important factor influencing GPR, and hence, social equity-enhancing, health, education, and inclusion-focused policies are not only socially valuable goals, but they are absolutely necessary to ensure long-term geopolitical stability (Larson et al., 2025; Koumpagioti et al., 2025). See Table 13.
The results of the Random Forest clustering analysis provide a systematic explanation of the role of the Social (S) factor in the ESG model in terms of geopolitical risk (GPR). The importance of variables in terms of the average Gini reduction highlights the social factors most relevant to the identification of groups in terms of GPR. Rather than reflecting a linear relationship, the results point to the social factors with the strongest influence on the geopolitical risk posture of countries. The most influential variables are closely related to the outcome of healthcare, population structure, and inequality. The most important feature is the under-5 mortality rate (U5MR), which reflects the fundamental importance of healthcare conditions and the survival of children as a measure of social vulnerability. High child mortality rates are a measure of poor healthcare systems, poverty, and a lack of access to essential services, which can lead to social instability and increased geopolitical risk (Rangachari & Thapa, 2025; Crawshaw & Gray, 2025). Similarly, the role of population ageing (POP65) in the model suggests the importance of demographic imbalances, either due to ageing or dependency pressures, as a structural determinant of geopolitical risk (Lakioti et al., 2025). The role of income distribution and social inequality also stands out. The strong importance of the Gini index (GINI) and the share of the income of the lowest 20 percent of the population (INC20) suggests a positive relationship between inequality and geopolitical risk. Increased inequality can lead to social unrest, a breakdown of institutions, and a lack of political legitimacy, all of which are reflected in the increased levels of geopolitical risk (Lompo & Diendere, 2025). On the other hand, the importance of economic and social rights (ESR) performance and the role of increased life expectancy (LEX) suggest a stabilizing factor in terms of the role of social development in reducing geopolitical risk. The importance of human capital participation variables further strengthens the results. The importance of variables such as the use of the internet (INT), the participation of females in the workforce (FLFP), total labor participation (LFP), education expenditure (GEDU), school enrollment (PRIM, GPI), and the representation of women in the country's parliament (WIP) suggests the importance of social inclusion, knowledge access, and institutional participation in terms of the role of societies with a strong sense of inclusion in terms of managing social instability and geopolitical risk (Lakioti et al., 2025). Labor market dynamics and demographic factors are also important. Unemployment (UNEM), fertility rate (FER), migration (MIG), and population density (PDEN) are important for cluster differentiation. High unemployment rates and a rapidly changing demographic can heighten conflict over distribution as well as political instabilities, while mismanaged migration can heighten social and political tensions at a national as well as global level (Vesco et al., 2025). Overall, the results from the Random Forest clustering algorithm strongly support that geopolitical risk is integral to social structure. Rather than being ancillary issues, health outcomes, inequality, demographic trends, education, and engagement are fundamental to GPR. Under the ESG rubric, the Social factor is a fundamental foundation for geopolitical risk mitigation as well as a complement to the Environmental and Governance factors. Socially progressive policies that promote equality, improve health outcomes and educational attainment, as well as improve social inclusion are therefore important for a host of reasons that are simultaneously socially well-founded as well as fundamental to reducing geopolitical risk over the long term (Lakioti et al., 2025; Lompo & Diendere, 2025). See Table 14.
The figure illustrates the application of Random Forest clustering to the Social (S) aspect of ESG analysis in particular to investigate its connection to geopolitical risk (GPR). Together, the two panels in this figure illustrate both the model selection step and the clustering result obtained. Panel A illustrates the criteria used to determine the appropriate number of clusters to retain in this analysis. In this panel, note that both the Within Sum of Squares (WSS) and the AIC and BIC measures decrease continuously with an increase in the number of clusters, indicating a corresponding improvement in homogeneity within each cluster. Also in this panel, a red spot marks the minimum BIC point that occurs when using ten clusters. This finding suggests that a ten-cluster solution is preferred in terms of a balance between simplicity and explanatory power to allow for a meaningful differentiation in social conditions without overfitting to observations on geopolitical risk (Taye et al., 2025). Panel B in this figure shows a two-dimensional representation of the clustering result obtained using a Random Forest method. Each point in this panel stands for an observation characterized by a very large number of social variables such as health metrics, levels of inequality, education levels, demographic characteristics, and measures of social inclusion. In this panel, different clusters have been colored to distinguish them based on their differences in social variables using a ten-cluster solution based on a Random Forest method developed in this analysis. These clusters appear to be compact and well-separated in this panel, indicating that this method has been very effective in distinguishing different social characteristics (Sahin, 2025). These characteristics differ in terms of varying degrees of vulnerability and resilience that influence differences in geopolitical risk (Taye et al., 2025). From this figure, it is clear that a Random Forest method is very effective in capturing a nonlinear connection between different social variables that contribute to geopolitical risk (Taye et al., 2025). This analysis has been able to distinguish different regimes in a broader ESG analysis to reaffirm a finding that geopolitical risk is a result deeply embedded in social structures like those based on inequality, health, education, and demographics (Bendavid et al., 2025; Sahin, 2025). See Figure 4.
5.3. Predicting Geopolitical Risk from Social ESG Factors: A Machine Learning Comparison
From the normalized performance table, the best-performing algorithm is the k-Nearest Neighbors (KNN). The normalization was set in such a way that the best performance is indicated by higher values, and the metrics for error (MSE, scaled MSE, RMSE, MAE/MAD, and MAPE) are set to “to minimize” while R² is set to “to maximize.” Using this common platform, KNN has a highest score of 1.00 for all the metrics, meaning that KNN is the best model in terms of both squared error, absolute error, and percentage error, as well as the best fit. This is in line with the studies that found KNN to be the best predictive model in various fields, including energy prediction and epidemiology (Rakshit & Sengupta, 2024; Kaliappan et al., 2021). This implies that KNN is the best model in the competition and does so in the absence of any trade-off in predictive and explanatory fit. The other models are more variable in their performances. The best-performing models in the case of the error metrics are the Support Vector Machines (SVM), with the highest score being 0.92 for MSE, 0.78 for RMSE, 0.76 for MAE/MAD, and 0.63 for MAPE, while the best explanatory fit is indicated by an R² score of 0.59. The linear models with regularization are reasonably good in the case of the error metrics, especially in the case of MSE (0.85), while the explanatory fit is poor, indicated by an R² score of 0.28. The Random Forest model has a good explanatory fit indicated by an R² score of 0.78, while the other metrics are less competitive than the SVM and KNN models, especially in the case of the MAPE (0.39). The Linear Regression model is in the middle for most metrics, while the Boosting model has a very low scaled MSE and R² score in this normalized analysis (Sibai et al., 2024). The Decision Tree is the worst-performing model, with a score of 0.00 for most metrics. These results together suggest that the best model for the task is KNN when the goal is to maximize the performance for the various metrics related to the error while simultaneously having the highest explanatory fit. The dominance in the case of the KNN model for the various metrics is in line with the studies that found KNN to be one of the most robust and interpretable models for continuous prediction tasks (Rakshit & Sengupta, 2024; Sibai et al., 2024). See Table 15.
These results outline the importance of features in terms of mean dropout loss, which represents the magnitude of predictive performance degradation when each feature is excluded. Thus, the features that have high values represent the most important social factors in capturing the concept of Geopolitical Risk (GPR) in the Social (S) dimension of ESG. Net migration (MIG) is ranked as the most important feature by a large gap. Its high importance implies that migration trends represent one of the primary drivers of Geopolitical Risk. Migration can be viewed as an indicator of economic, political, and societal pressures but can also be considered an accelerator of Geopolitical Risks by triggering distributional tensions, political polarization, and tensions among countries (Zatonatskiy et al., 2024). The variables population density (PDEN), fertility rate (FER), and prevalence of overweight (OVW) correlate closely with each other, reflecting the measure of demographic pressure. Nations undergoing rapid population change, having a high density, or undergoing changes in health/nutrition status tend to have a high degree of geopolitical vulnerability. Such factors can act as stressors for public facilities, the workforce, or social cohesion, thus increasing instability (Conduah & Ofoe, 2025). The role of the labor market indicators and economic inclusion factors should also not be underestimated. Unemployment (UNEM), the income share of the lowest 20 percent (INC20), the Gini index (GINI), and economic and social rights (ESR) are of great importance, thus confirming the importance of inequality and exclusion as the basic social determinants of geopolitical risk. Those societies which are marked by great inequality and limited economic opportunities tend to be more susceptible to unrest, the erosion of institutional trust, and political fragmentation (Zatonatskiy et al., 2024). Another important factor is human capital, which is defined by access to services, education, and healthcare. Indicators of education, such as expenditure on education by the government (GEDU), primary school enrollment rate (PRIM), as well as gender parity for education (GPI), combined with healthcare indicators like number of hospital beds per 1,000 population (HOSP), life expectancy at birth (LEX), as well as deaths of children under five per 1,000 live births (U5MR), suggest that the gaps between healthcare and education infrastructure have a profound effect on geopolitical risk. Finally, inclusion and participation indicators like internet access (INT), women’s inclusion in parliament (WIP), women’s participation in the workforce (FLFP), and general workforce participation (LFP) all point to the need for social inclusion. This suggests that greater inclusion helps to offset geopolitical risks through improved social cohesion (Conduah & Ofoe, 2025). Taken together, the findings strongly validate that the roots of geopolitical risk are entrenched in social structures. Migration, inequality, population pressures, and health, education, and participation are identified as the key drivers of the Social component of ESG that shape GPR (Zatonatskiy et al., 2024; Blukacz et al., 2025; Conduah & Ofoe, 2025). See Table 16.
The above results provide a localized explanation of the predictions made by the K-Nearest Neighbors algorithm regarding the role of the Social (S) aspect in the ESG framework and its effect on Geopolitical Risk (GPR). In each of the five instances, the predicted GPR is compared to a standard baseline of 0.210, while the role of individual social variables is also reflected in terms of how each variable contributes to or reduces GPR from the standard baseline. The most notable thing that stands out in the above results is that in all five instances, the predicted values of GPR are lower, though to varying levels. This is indicative of the fact that in the five instances, the collective social setup is working towards reducing GPR rather than increasing it. Variables related to education, economic inclusion, and human capital take a pivotal stance in this context. The indicators including government educational spending (GEDU), labor force participation (LFP), enrollment in primary schooling, and gender parity in education (PRIM and GPI), along with the use of the internet (INT), typically feature negative contributions. This indicates that the more advanced the educational structure and the more access to information, the lower the GPR (Shergill et al., 2025). From an ESG perspective, these findings reinforce the notion that a society with advanced human capital and connectivity is more resilient in the face of geopolitical uncertainties (Seow, 2025). The state of the labor markets and social inclusion also plays a crucial role. Unemployment (UNEM), the variables of income distribution (INC20), and the participation of females in the workforce (FLFP) all show a consistent role in reducing the expected GPR, especially in the instance where the expected risk is the lowest. This further supports the idea of a more socially cohesive and stable political system when the labor markets are more inclusive and there are reduced levels of inequality (Dincă et al., 2025). Demographic trends and migration patterns also appear to be a prominent factor in the model. The net migration (MIG) has a strong negative role in all instances, suggesting a positive correlation between well-managed migration patterns and a reduced risk of geopolitical instability. Fertility rates (FER), aging population (POP65), and population density (PDEN) also show a smaller but consistent role in the model, suggesting a positive correlation between demographic imbalances and GPR, though the role of demographic factors may not be as direct in reducing the risk of GPR (Onomakpo, 2025). Lastly, measures of health and social well-being, such as life expectancy (LEX), under-five mortality rate (U5MR), and availability of hospital infrastructure (HOSP), also play a part in minimizing geopolitical risks. These factors indicate the ability of societies to offer basic welfare provisions and protect those who need to be safeguarded in a way that enhances social stability (Shergill et al., 2025). In conclusion, KNN-based results consistently affirm that GPR remains deeply embedded in social factors. Improvements in education, healthcare, inclusion, and demographic control are reflected in a GPR reduction. From an ESG perspective, this highlights that the Social dimension plays a pivotal role in underpinning geopolitical stability, in addition to environmental and governance factors (Seow, 2025; Dincă et al., 2025; Onomakpo, 2025). See Table 17.
The figure provides an evaluation of the performance and parameter tuning of the K-Nearest Neighbors (KNN) algorithm in terms of the analysis of the Social (S) dimension within the ESG analysis framework and its role in shaping geopolitical risk (GPR). The two graphs provide complementary insights into model performance in terms of predictive accuracy. Graph A illustrates the relationship between the actual and predicted GPR in the test data. The scatter chart shows that there is an excellent fit of data points to the 45-degree reference line. This implies that the KNN model has successfully predicted actual levels of GPR in the data (Baihaqi & Fakhriza, 2025). Most data points lie very close to the reference line, especially in the lower to medium GPR range. This implies that the model has been able to capture the role of the S dimension in shaping GPR in standard situations. Small departures from the reference line in the high GPR range indicate that there is an element of uncertainty in the model predictions of extreme GPR (Trianda et al., 2025). Panel B focuses on the process of choosing the optimal number of nearest neighbors. The dotted line in the graph marks the training error, whereas the solid line marks the validation error. As expected, the training error tends to rise with the number of neighbors, which implies a larger bias, whereas the validation error tends to first fall and then rise. The minimum point of the validation error, marked by the red spot, tends to happen when the number of neighbors is small. It can be concluded from the results that a local model performs the best, which matches the idea of geopolitical risk being a function of social factors specific to the context of a country, such as inequality, healthcare, education, and demographic factors (Saltık, 2024). In general, the above figure supports the fact that the use of KNN is appropriate in the modeling of the nonlinear and localized impacts of the social variables on the geopolitical risk within the ESG framework. The use of the ESG framework, which is characterized by its complexity, requires the use of models that have the properties of being able to predict well, being transparent, and being able to respond well to localized conditions, as in the case of the KNN model, which is sensitive to the mentioned properties (Trianda et al., 2025; Baihaqi & Fakhriza, 2025). See Figure 5.
6. Governance as a Structural Driver of Geopolitical Risk: An ESG Perspective
This section will analyze the impact of Governance (G) in ESG on geopolitical risk (GPR) and aims to explain its relationship by focusing on institutional quality and its impact on a country’s vulnerability to geopolitical risk. The underlying assumption is that a country’s vulnerability to geopolitical risk is not just driven by international tensions and sudden political instability but also by underlying governance structures that affect its strength and positioning in international politics. An integrated approach using three methodologies is used in this section to explain the relationship. First, a panel econometric model is employed to estimate the average relationship between GPR and the set of key governance indicators, including control of corruption, political stability, and innovation, while controlling for individual country-specific and time-specific effects. The aim is to provide a clear benchmark that allows one to determine if the quality of governance is related to GPR. Second, a clustering technique segments countries on the basis of a large number of variables relating to institutions and innovation, to identify different regimes of governance. The comparison of averages of levels of GPR between clusters helps to identify how different regimes are associated with greater or lesser geopolitical risk. Thirdly, machine learning regression methods are used to identify nonlinear relationships and importance in the Governance domain. These methods allow for a better representation of the channels through which governance influences geopolitical risk and increase the accuracy of predictions. Together, these three approaches provide a well-rounded and multi-faceted analysis on the G–Governance → GPR relationship in a structured ESG framework that combines inference, recognition, and predictions.
6.1. Modeling the G–GPR Link: Corruption Control, Political Stability, and Innovation Capacity in Panel Regression
Below we analyse the impact of the G-Governance component within the ESG context on the GPR variable or geopolitical risk through the estimation of the indicated equation:
Where i=42 and t=[2000;2023]. The variables used in the model are summarized in the Table 18 below.
The research examines the correlation between geopolitical risk and a series of variables in the Governance category of the ESG model. GPR, the dependent variable, is an index measuring the geopolitical risk of a country according to the number of news stories featuring mentions of political tensions, conflicts, and instability (Ferreira et al., 2023). Explanatory variables describe fundamental governance qualities: Control of Corruption, Political Stability, and the number of Scientific and Technical Articles, which represents institutional capabilities for innovation and knowledge development (Babarinde et al., 2025). This research seeks to uncover the relationship between the existence of effective governance structures and their relationship with reduced geopolitical risk and resilience (Reyad et al., 2024). The data set includes a balanced panel of 42 countries over a period of 22 years, resulting in a total of 924 observations. Four different econometric models were estimated: Weighted Least Squares, GLS (Random Effects), Pooled OLS, and Fixed Effects. The Hausman test shows a p-value of 1.4e-08, which rejects the null hypothesis of consistency for the GLS estimator and suggests that a fixed-effects model is more suitable. This result is consistent with the assumption that governance features are institutionally ingrained at a national level and therefore should not be modeled as country-random (Laureti et al., 2023). The fixed-effects model shows an R-squared value of 0.78 for the LSDV regression, which indicates that a major portion of the variation in GPR can be explained by country-specific factors as well as governance features. Within R-squared is 0.08, which suggests that while governance features are important over time, cross-sectional differences are more prominent (Guo et al., 2024). All three joint significance tests for the regression parameters are highly significant, confirming the importance of the Governance factor for explaining GPR. The Control of Corruption variable has a strongly positive and significant coefficient in all cases. While at first puzzling, since a strong control of corruption should lower instability, the GPR index captures the level of media coverage of geopolitical topics rather than actual governance. A strong control of corruption might result in a higher level of public discussion and international engagement, thus bringing the topic of geopolitical tensions into the public eye (Onomakpo, 2025). A reform process targeting the fight against corruption might take place in a context of political tensions and thus temporarily boost the perception of risk (Budanov et al., 2025). Political Stability has a negative and highly significant coefficient for all models. This is as predicted by the Governance view of ESG, which states that countries that lack political stability but have low levels of violence risk and strong institutions have low levels of GPR (Yılmaz, 2024). The strength of this coefficient also shows that Political Stability is the most significant factor for GPR among the factors identified in this model (Almulla et al., 2025). These findings confirm that the Governance factor is a key factor in overcoming uncertainty and tension between countries. Scientific and Technical Articles have a positive and significant coefficient. This means that the higher the number of publications, which represents the capacity for innovation and knowledge infrastructure, the higher the level of geopolitical risk. This could be attributed to the fact that more advanced countries are being integrated into the global economy and politics, which makes them more susceptible to global conflicts (Alam et al., 2024). Innovation could also increase the level of strategic rivalry with regard to areas such as digitalization, the energy sector, and military security, which could increase the value of GPR (Babarinde et al., 2025). From the ESG analysis, it shows that the interaction between the Governance variable and technological innovation is complex (Guo et al., 2024). Diagnostic tests indicate the presence of several econometric concerns. White and Wald tests show that homoscedasticity can be rejected in favor of heteroscedastic error variance by country, in accordance with samples of governance diverse in this regard (Laureti et al., 2023). The results of the Pesaran CD test indicate high cross-sectional dependence (p-values ≈ 0), suggesting that spillover effects of governance-related shocks exist among countries, in accordance with the interconnectivity of modern political systems and the global spread of institutional crisis (Ferreira et al., 2023). The Wooldridge test detects first-order autocorrelation in the error terms, in accordance with the idea that problems of governance and political tensions build up rather than abate rapidly (Reyad et al., 2024). Normality of error terms can be rejected in all cases; in any case, this does not affect the overall results in terms of sample size (Cordero-Barrero et al., 2024). The Breusch-Pagan test confirms the significance of individual effects, in accordance with the use of panel data estimators instead of OLS (Bunzel et al., 2024). The test of group-specific intercepts strongly rejects the hypothesis of a common intercept, in accordance with the idea that each country has its own basic level of risk of this type, historically affected by its institutions (Budanov et al., 2025). Substantively, the ESG analysis provides the following findings. The quality of governance is identified as a core determinant of GPR, wherein the presence of political stability is found to be significantly reducing GPR, in line with the assumption that good institutions are the foundation of global security (Yılmaz, 2024; Almulla et al., 2025). The correlation between the control of corruption and GPR is complex, wherein transparency, reform, and media attention mediate between the two variables (Onomakpo, 2025). The innovation capability, measured through scientific output, connects the ESG Governance dimension to economic competitiveness and strategic competition in the global arena (Babarinde et al., 2025). The highly correlated nature of the GPR variable across the countries implies that ESG-related reforms in the realm of governance should take note of the role of global cooperation, regulatory alignment, and multilateral institutions in managing GPR (Budanov et al., 2025; Reyad et al., 2024). ESG professionals must, therefore, evaluate the quality of both the environment and the quality of institutions, acknowledging the relevance of the latter in the global context (Guo et al., 2024). In conclusion, the above analysis shows that the Governance factor of the ESG is an important driver of geopolitical risks. A stable political environment leads to a decrease in risks due to the controlled impact of corruption and technological advancements (Laureti et al., 2023; Ferreira et al., 2023). This suggests that the ESG model is an effective tool for analyzing the geopolitical environment and the important role of the Governance factor as a strategic asset in a globally interconnected world (Alam et al., 2024; Almulla et al., 2025). See Table 19.
6.2. Governance Regimes and Geopolitical Risk: Evidence from Multicriteria Clustering Analysis
From the normalized values of the metrics used, K-Means is shown to be the best-performing algorithm, which provides a good balance between the structural quality of the clusters, separation, compactness, and balance of the clusters (Abadi et al., 2025). Hierarchical clustering provides excellent values on a number of structural parameters such as Maximum Diameter, γ of Pearson, and the Dunn Index, which highlight the superior ability of the algorithm to produce compact and well-separated clusters (Aselnino & Wijayanto, 2024). However, the poor value of the HH Index of the algorithm highlights a higher level of concentration, which leads to unbalanced clusters that are less apt to be used when the aim is to produce clusters that are both structurally good and evenly distributed. Density-Based clustering performs excellently on separation and entropy measures, which highlight superior internal cohesion and a lack of disorder. However, their poor performance on the Calinski-Harabasz Index and HH Index highlights inferior global structure and unbalanced clusters that may be challenging to interpret when viewed in a global scenario. Model-Based clustering provides the highest value of the HH Index, which highlights a superior balance between the sizes of the clusters. However, their poor performance on a number of structural parameters such as Pearson γ, Dunn Index, and entropy highlights that balance is achieved at the cost of inferior cluster structure and separation. Fuzzy C-Means provides a superior value on balance, which is indicated by a high HH Index. However, their poor performance on a number of compactness and separation parameters highlights their inferiority in distinguishing between groups effectively (Sihombing et al., 2022). Random Forest clustering provides a decent value on balance parameters and moderate structural parameters. However, their inferiority to K-Means on global validity parameters highlights their inferiority on a number of parameters. K-Means is superior in that it provides the highest value on the Calinski-Harabasz Index, performs excellently on Maximum Diameter, provides decent separation, and provides a very high value on the HH Index (Abadi et al., 2025). These parameters highlight that the clusters are superior in structure, interpretable, and are also well-balanced. Therefore, K-Means is stated to be the most robust and reliable algorithm of the tested algorithms (Aselnino & Wijayanto, 2024; Sihombing et al., 2022). See Table 20.
The above results are a compilation of the clusters obtained from the KNN algorithm to gauge the effects of the Governance (G) factor under the ESG approach on geopolitical risk (GPR). All values are standardized; therefore, the results are focused more on relative differences rather than absolute values. One of the most important observations from the above result is that GPR varies greatly from governance structure to governance structure. Clusters 1, 2, and 4 have a positive value for GPR, which shows that they have a higher geopolitical risk. However, clusters 3, 5, 6, 8, and 9 have a negative value for GPR, which shows that they have a lower geopolitical risk. This goes to show that governance structure is directly connected to geopolitical risk but is not linear (Cheng et al., 2025). Those with high GPR have been observed to have strong institutional capacity and high innovation intensity. For example, cluster 1 has high GPR, as well as high government effectiveness (GOV), regulatory quality (REG), rule of law (ROL), R&D expenses (RDG), and scientific and technical articles (STJA). Likewise, cluster 4 shows high GPR, accompanied by high political stability (PSAV), regulatory quality, rule of law, and governance effectiveness. This suggests that countries with developed institutions and developed structures of governance are usually countries that have higher geopolitical visibility or relevance, hence higher geopolitical risk (Kim et al., 2025). On the other hand, those with a low or strongly negative GPR, like clusters 3, 5, 8, and 9, have poor governance fundamentals. These groups record negative indices for control of corruption (COR), government effectiveness, regulatory quality, rule of law, and voice and accountability (VAC). Also, innovation indices like patents (PAT) and scientific achievements (STJA) are poor in these groups. This indicates vulnerability and poor global integration with possibly lower geopolitical risk but increased country vulnerability (Iwanicz-Drozdowska et al., 2025). A case of intermediate interest is cluster 6, which exhibits low GPR while having very high innovation indicators (PAT and STJA). This is an indication that innovation, per se, is not necessarily a guarantee of lower GPR if the latter is combined with lack of political stability or good governance, as in the case of cluster 6, which also exhibits lack of voice and accountability, as well as mixed indicators of good governance, according to Maghami (2024). In summary, the KNN clustering method shows that the Governance dimension of ESG is a significant driver of GPR in a multichannel manner. High-quality governance and innovation are positively related to international relevance and exposure and can raise GPR levels, while low-quality governance is related to a lack of visibility but can also hide structural vulnerabilities and thus are significant drivers in ESG-based GPR studies (Cheng et al., 2025; Kim et al., 2025; Iwanicz-Drozdowska et al., 2025; Maghami, 2024). See Table 21.
The figure illustrates the application of the K-Nearest Neighbors (KNN) algorithm to analyze the Governance (G) aspect of the ESG factor regarding Geopolitical Risk (GPR), incorporating model selection diagnostics and the clustering outcome. This sequence of analysis and modeling corresponds to the latest trends in ESG analysis, where machine learning algorithms are applied to detect the complex and non-linear nature of the underlying governance phenomena (Seow, 2025). Panel A of the figure illustrates the trajectory of several model selection statistics: Within Sum of Squares (WSS), Akaike Information Criterion (AIC), and Bayesian Information Criterion (BIC), as the number of clusters increases. It is observable that all three statistics show a downward trend as the number of clusters increases; however, the rate of decrease becomes significantly slower beyond a certain number of clusters. The red dot in the graph points towards the number of clusters that corresponds to the minimum value of the BIC index; hence, it seems that there is an optimal number of clusters that strikes a balance between goodness of fit and model simplicity. This aspect assumes greater importance when analyzing the phenomenon of governance, since an overly fine-grained classification of the phenomenon may lead to a loss of interpretability without adding much to the explanation of the phenomenon itself (Saraswati et al., 2024). Panel B of the figure illustrates the clustering outcome in a lower-dimensional space. It is observable that the points are well-clustered and distinct from each other; hence, the application of the KNN technique seems to be effective in accounting for the heterogeneity of the variables related to the phenomenon of governance. The spatial distribution of the points suggests the presence of several regimes of governance, ranging from regimes characterized by high levels of institutional quality and regulatory effectiveness to regimes characterized by low levels of the aforementioned and a high degree of instability. The points highlighted in the figure indicate the boundary points of the respective regimes and are typical of the KNN technique; hence, the points indicate countries that lie close to the boundaries of the regimes (Morelli et al., 2025). The figure above illustrates the application of the KNN technique and its effectiveness in deriving meaningful results related to the phenomenon of governance and its impact on GPR. The application of an evidence-based technique to select the number of clusters and the transparent cluster topology adds to the robustness of the results. The results of the analysis above are consistent with the idea that the characteristics of the phenomenon of governance affect the phenomenon of GPR in a complex and non-linear manner and that the KNN technique provides a flexible and effective tool for analyzing the phenomenon (Seow, 2025; Saraswati et al., 2024; Morelli et al., 2025). See Figure 6.
6.3. Machine Learning Evidence on Governance and Geopolitical Risk: KNN Dominance and Nonlinear Effects
Based on the normalized performance metrics, KNN stands out clearly as the best-performing method among those compared in this analysis. KNN maintains a consistently high or highest score in all evaluation criteria, indicating its high predictive accuracy and strong explanatory power (Iaousse et al., 2023). Looking at error-oriented criteria, KNN maintains a score of nearly or exactly 1.00 in terms of MSE, scaled MSE, RMSE, MAE/MAD, and MAPE. Being normalized to indicate a lower forecasting error with a higher score, KNN’s superiority in this respect clearly indicates a better capability to minimize absolute and relative forecasting error compared to other methods. More specifically, its perfect score in both MAE/MAD and MAPE clearly indicates its robust nature in capturing local structures and suppressing extreme observations, a desirable property especially when analyzing a complicated and heterogeneous phenomenon like geopolitical risk (Hajirahimova & Aliyeva, 2023). KNN maintains a normalized R² score of 1.00, indicating its highest explanatory power compared to other methods in this analysis. This finding clearly suggests that KNN not only makes accurate predictions but also captures a significant variation in the dependent variables. This property is hard to find in a single method and further strengthens KNN’s appropriateness in this analysis context (Priyanto et al., 2025). Although not perfect in terms of overall performance, Decision Trees and Regularized Linear methods perform relatively better than others in this analysis. However, in terms of overall error metrics, they lack KNN’s stability. Although strong in terms of MAPE performance, RF fails in overall error metrics, whereas Linear Regression is clearly inferior in all aspects. Boosting and SVM methods score moderately well in this analysis but clearly lack overall stability compared to KNN in this analysis (Iaousse et al., 2023; Hajirahimova & Aliyeva, 2023; Priyanto et al., 2025). See Table 21.

Table 21.
Comparative Predictive Performance of Models for Governance (G) ESG and Geopolitical Risk (GPR).
Table 21.
Comparative Predictive Performance of Models for Governance (G) ESG and Geopolitical Risk (GPR).
| Metric | Boosting | Decision Tree | KNN | Linear Regression | Random Forest | Regularized Linear | SVM |
| MSE | 0.44 | 1.00 | 0.96 | 0.49 | 0.00 | 0.82 | 0.64 |
| MSE (scaled) | 0.52 | 0.67 | 1.00 | 0.00 | 0.66 | 0.78 | 0.70 |
| RMSE | 0.36 | 1.00 | 0.93 | 0.41 | 0.00 | 0.72 | 0.59 |
| MAE / MAD | 0.27 | 0.68 | 1.00 | 0.00 | 0.53 | 0.36 | 0.48 |
| MAPE | 0.00 | 0.77 | 1.00 | 0.00 | 0.88 | 0.00 | 0.63 |
| R² | 0.53 | 0.69 | 1.00 | 0.00 | 0.68 | 0.82 | 0.69 |
Note. KNN shows the most stable and balanced performance across error and fit metrics, capturing significant variation in GPR. Other models perform well on specific criteria but lack KNN’s overall robustness and consistency.
Analysis of importance shows a complex correlation between the Governance (G) factor of ESG and Geopolitical Risk (GPR). The ordered ranking, derived from mean dropout loss, shows variables related to governance are most relevant to country-level geopolitical risk. The most significant factor is Scientific and Technical Articles (STJA), which has an importance value significantly higher than all other factors. This implies that countries with an excellent knowledge foundation, high scientific production, and an advanced innovation infrastructure are more vulnerable to geopolitical risks (Ferreira et al., 2023). This may be attributed to their global stature, strategic importance, and participation in global tech competitions, among other considerations. Political Stability (PSAV) is the second most crucial determinant. The significance of the variable is supported as the presence of political instability, disruption in the government, or the possibility of violence and unrest is one of the most crucial aspects in the formation of GPR. A state experiencing political instability is most prone to the possibility of higher GPR, which is due to both internal and external viewpoints of threats (Almulla et al., 2025). The relevance of innovation capability is again supported due to the significance of R&D expenditure (RDG) and patents (PAT). Although the significance of patents is less than that of RDG and STJA, the relevance of the variable in the formation of GPR is supported, as the presence of a technology-driven economy or the presence of technological competition is most closely related to GPR, specifically in strategic areas (Ding et al., 2025; Babarinde et al., 2025). The most important factors for institutions—Control of Corruption (COR), Government Effectiveness (GOV), Regulatory Quality (REG), and Rule of Law (ROL)—have a level of importance that is equivalent in magnitude. The results suggest that sound institutions matter in a systematic and non-mechanistic way for GPR. Sound institutions can counter domestic challenges and leverage international connectivity, thus potentially adding to the rise in GPR (Ferreira et al., 2023; Almulla et al., 2025). In addition, Voice and Accountability (VAC) and GDP growth (GDPG) have a secondary but not-insignificant level of importance, suggesting that democracy and economic growth matter for GPR, although to a lesser extent than political stability and innovation factors. The results suggest that GPR is primarily a function of governance and innovation capability, thus further emphasizing the fundamental importance of the ESG Governance pillar in being a driving factor for GPR (Babarinde et al., 2025; Ding et al., 2025). See Table 22.
The outcome presented in this study provides a precise analysis of the extent to which the Governance (G) factor in the ESG set is contributing to the variance in Geopolitical Risk (GPR) at the level of individual cases. The table above breaks down the predicted GPR into a baseline and the marginal contributions of the most important governance factors, thus allowing for a precise analysis to be made. For the five cases considered together, the predicted GPR is consistently below the baseline at 0.231, thus implying that the net impact of the governance factors is contributing to a reduction in geopolitical risk from the standard level. In terms of the set of governance indicators, Political Stability (PSAV) is the most significant variable. In the case of 1, 2, and 3, the positive and significant contribution of PSAV reduces GPR, thus validating the fact that higher levels of political stability are related to lower geopolitical risk. In the case of 4 and 5, the negative contribution of PSAV to GPR enhances the perceived level of geopolitical risk, thus validating the fact that a moderate level of instability can easily lead to a rise in perceived geopolitical risk. The set of institutional quality indicators, namely Control of Corruption (COR), Government Effectiveness (GOV), Regulatory Quality (REG), and Rule of Law (ROL), have a relatively small negative contribution. This implies that institutions have a moderating effect on reducing geopolitical risk, though the magnitude of the effect is relatively small. The innovation-related variables of Scientific and Technical Articles (STJA), R&D expenditure (RDG), and Patent applications (PAT) are the major negative contributing variables to GPR here, indicating that innovation capacity is more closely related to resilience rather than geopolitical vulnerability (Alam et al., 2024). Finally, GDP growth (GDPG) and Voice and Accountability (VAC) show a weaker but significant effect and again confirm the assumption of a second-order effect of short-term economy and democratic participation (Reyad et al., 2024; Almulla et al., 2025). On the whole, the above findings affirm the Governance pillar of ESG as a determinant of GPR in a variety of ways, with political stability and institutional quality having been established as pivotal factors in reducing the risk of geopolitics (Alam et al., 2024; Almulla et al., 2025; Reyad et al., 2024). See Table 23.
The figure below is an evaluation of the K-Nearest Neighbors algorithm in terms of its prediction and its main hyperparameter, which is the number of neighbors, k. From Panel A of the figure, a comparison of observed test values and predicted test values is shown. Most points are closely aligned along a straight line representing a 45-degree angle, showing a strong fit and a strong ability of KNN to approximate true values. The points are in line, showing that the algorithm is able to identify local trends and is able to approximate true values effectively (Ekinci and Ozturk, 2025). However, some points are deviating from the straight line, particularly those points where observed test values are high. This is an indication that KNN might underestimate or overestimate those points (Gunawan and Ihsan, 2024). Panel B is focused on model calibration, showing the mean squared error of both training and validation data as a function of k. When k is small, the training error is small, but the validation error is still large, which is an indicator of overfitting. As k is increased, the validation error decreases, reaching a minimum at k ≈ 3-4, marked by the red dot, which is the best compromise between bias and variance (Inyang et al., 2023). After that, the training as well as the validation error increases, which is an indicator of underfitting, as the model is too smooth, losing local information. In general, the graph confirms that KNN is a good algorithm if properly parameterized. With an intermediate number of neighbors, the algorithm strikes a good balance between accuracy and generalization, making it a good, reliable algorithm for the task at hand (Ekinci & Ozturk, 2025; Gunawan & Ihsan, 2024; Inyang et al., 2023). See Figure 7.
7. Integrated Discussion of Results: ESG Components and Geopolitical Risk
This study provides a comprehensive assessment of how the Environmental (E), Social (S), and Governance (G) dimensions of the ESG framework influence geopolitical risk (GPR) by combining panel data econometrics, unsupervised clustering, and machine-learning regression models. See Figure 8.
The multi-method design allows both causal explanation and pattern recognition, providing a comprehensive and sophisticated explanation of GPR dynamics. From an econometric perspective, panel models have repeatedly shown ESG factors to be statistically significant determinants of GPR. With regard to the Environmental part, fixed-effects models have shown that greenhouse gas releases (CH4, CO2), fossil fuel dependence (coal-fired power), deforestation (TCL), and water stress significantly contribute to geopolitical risk, while renewable energy sources have an ambiguous role, which captures transition costs in the short term (Onomakpo, 2025; Akadiri & Özkan, 2025). The strong rejection of the Hausman test confirms the relevance of country-specific effects, suggesting a structural national channel through which environmental risk is transformed into geopolitical instability. For the Social part, migratory movements and aging contribute significantly to geopolitical risk, while unemployment presents a more complex, sometimes counterintuitive relationship, which captures the difference between internal social turmoil and publicly visible geopolitical tensions. For the Governance part, political stability, regulation, corruption control, and innovation capabilities have all been shown to reduce geopolitical risk, thus confirming the role of governance as a stabilizing factor (Dipierro et al., 2025). Cluster analyses offer additional insights into these findings, which have revealed specific ESG profiles. For all three dimensions (Environment, Social, and Governance), clustering based on the Random Forest algorithm repeatedly offers the best trade-off between internal cluster quality and size homogeneity, as confirmed by the HH index, which reaches high levels while maintaining good separation and shape measures. Environmentally vulnerable clusters, defined by high releases, water stress, and fossil fuel dependence, have been found associated with higher GPR, while socially inclusive and governance-friendly clusters have been found to have low geopolitical risk. Finally, machine learning regression models, and in particular k-Nearest Neighbors (KNN), have reached the highest accuracy on all three ESG dimensions. The superiority of the KNN model shows the relationship between ESG and GPR is highly nonlinear and context-dependent. Results on feature importances and local explanation have shown climate-related stress, water scarcity, inequality, migratory movements, and governance capabilities all contribute simultaneously to geopolitical risk, thus confirming the multidimensionality of GPR (Dipierro et al., 2025). In general, the findings support the conclusion that geopolitical risk is firmly embedded in ESG frameworks. The negative aspects of the environment, social issues, and poor governance are strong risk multipliers, while sustainability, inclusion, and good institutions increase the ability to resist geopolitical risk. Thus, the ESG framework is not only a sustainability perspective, but also a strategic approach to the assessment and mitigation of geopolitical risk (Onomakpo, 2025; Akadiri & Özkan, 2025). See Table 24.
8. ESG-Based Policy Strategies for Enhancing Geopolitical Resilience
The empirical results of the present study have significant policy implications, illustrating the deep entanglement of geopolitical risk with the E, S, and G aspects of the ESG framework (Reyad et al., 2024; Kharlamova et al., 2025). Therefore, the mitigation of risk requires multidisciplinary policy action. In the environmental sphere, the findings of the study illustrate that climate-related stress, water scarcity, deforestation, and the use of fossil fuels are structural sources of geopolitical risk. In terms of policy, the urgent promotion of energy diversification, reducing the use of coal and fossil fuels, and increasing the use of renewable energy sources is of prime importance (Akadiri & Özkan, 2025). The development of resilient water infrastructure is also essential, and in the context of water-stressed and climate-disrupted countries, its development is of the highest priority. Land use policy and the protection of forests may also help in reducing the long-run negative impacts of environmental conditions, which contribute to social unrest and international disputes. It is also important that the design of environmental policy should be supported by the development of international cooperation mechanisms to prevent short-run instability in the context of energy policy shifts (Alam et al., 2024). The role of social policy in managing the risk of geopolitics by addressing the vulnerability of society that spills over to the external realm cannot be overstated. The results highlight the significance of managing migration, inequality, healthcare, education, and basic services. It is essential that the government focuses on labor market policies that address the demographic challenges of society. Addressing the grievances of society that often manifest in political instabilities can be achieved by improving the delivery of basic services. Social cohesion policies have been found to be very successful in conjunction with regional cooperation in managing migration and labor mobility (Reyad et al., 2024). Governance stands out as having the most significant stabilizing factor in the ESG model. This can be explained by the fact that high standards of governance are always negatively associated with geopolitical risk (Kharlamova et al., 2025). On this note, policies should focus on anti-corruption policies and judicial independence and efficiency. On a different note, a favorable regulatory system and technological advancement can always contribute to increased global exposure but can also contribute to increased resilience if aligned with effective governance (Akadiri & Özkan, 2025). In general, the results indicate that the issue of geopolitical risks can and should be resolved not only through foreign policy and security strategies but also through long-term strategies focused on ESG. Environmental sustainability, social integration, and good governance are the three components of a well-rounded policy that can increase the country's geopolitical resilience and minimize systemic risks (Alam et al., 2024; Kharlamova et al., 2025).
9. Limitations of the Empirical Framework and Data Constraints
The analysis also reveals several limitations that should be taken into account while drawing inferences regarding the relationship between ESG factors and geopolitical risk. Firstly, despite the richness of the dataset, the presence of heteroscedasticity, autocorrelation, and cross-sectional correlation is always present in the panel specifications. These econometric properties of the dataset signify that the shock propagation from one country to others is considerable, and the presence of significant temporal persistence in geopolitical risk may generate biased standard error estimates, which may be affected if not properly accounted for in the analysis (Khatib et al., 2025). Although robust standard error correction techniques and alternative panel specifications are used, these properties signify that more sophisticated models, such as spatial models or common-factor models, may be used to further improve the robustness of the results. Secondly, the possibility of endogeneity is also a concern, which is specifically pertinent in the case of variables such as migration, energy composition, and environmental degradation, which may be both causes and effects of geopolitical risk. Although the use of panel data analysis, clustering, and machine learning models may help in reducing the biases that may be present in the analysis due to the use of linear models, the possibility of endogeneity makes it difficult to infer the causal relationship between the variables (Cheng et al., 2025). Thirdly, the GPR index used in the analysis is constructed based on the media representation of the respective countries, which may be representative of the intensity of reporting rather than objective risk measurement, thus introducing biases in the analysis. This may be the reason for the unexpected signs of the variables in the analysis (Khatib et al., 2025). Fourthly, the use of clustering analysis and machine learning models, although successful in estimating the nonlinear relationship between the variables, may also introduce biases in the analysis due to the lack of transparency in the analysis. The models may also be sensitive to the choice of the normalization procedure used in the analysis, thus making the analysis less transparent and less reliable in terms of providing information regarding the relationship between the variables (Drago et al., 2025). Fifthly, the ESG framework used in the analysis is broad, and some of the related institutional, cultural, or geopolitical variables may not be completely captured in the analysis. Therefore, the analysis should be used to infer the robust relationship between the ESG framework and geopolitical risk, thus providing scope for further analysis rather than conclusive evidence of the relationship between the variables.
10. Conclusions
The article seeks to provide an analysis of the concept of geopolitical risk by transcending the traditional understanding of it as an array of exogenous political events in favor of an understanding of it as an outcome of deep-seated sustainability factors. The article seeks to provide an integrated analysis of the Environmental, Social, and Governance factors of the ESG Framework in terms of their relationship to the Geopolitical Risk (GPR) Index. The article seeks to provide evidence of the relationship in terms of an analysis of 42 countries from 2000 to 2023, validated by panel econometrics, clustering analysis, and machine learning analysis. All three factors of ESG have been shown to be important in understanding the concept of geopolitical risk in their own right. Environmental factors of ESG have been shown to be important in terms of their relationship to greenhouse gases, water scarcity, land degradation, and the structure of the energy sector. It has been shown that these factors have been important in terms of their role in shaping the vulnerability of countries to political shocks. The Social factors of ESG have been shown to be important in terms of their relationship to cohesion, inequality, and demographic factors. The Governance factor has been shown to be the most important in terms of its role in shaping political stability. One of the important aspects of this article is that it seeks to provide an analysis of ESG in terms of its factors. This has been important in terms of providing an understanding of ESG in terms of its factors. It has been shown that an analysis of ESG in terms of its factors has been important in terms of understanding the role of transparency, innovation, and institutions in terms of shaping political stability. It has been shown that these factors have been important in terms of shaping the role of transparency in terms of shaping political stability. It has been shown that an analysis of ESG in terms of its factors has been important in terms of understanding the role of ESG in shaping political risk. It has been shown that an analysis of ESG in terms of its factors has been important in terms of understanding the role of ESG in shaping political risk. The article seeks to provide an analysis of ESG in terms of its factors. It has been shown that an analysis of ESG in terms of its factors has been important in terms of understanding the role of ESG in shaping political risk. It has been shown that an analysis of ESG in terms of its factors has been important in terms of understanding ESG. It has been shown that an analysis of ESG in terms of its factors has been important in terms of understanding ESG. It has been shown that an analysis of ESG in terms of its factors has been important in terms of understanding ESG. It has been shown that an analysis of ESG in terms of its factors has been important in terms of understanding ESG. It has been shown that an analysis of ESG in terms of its factors has been important in terms of understanding ESG. It has been shown that an analysis of ESG in terms of its factors has been important in terms of understanding ESG. It has been shown that an analysis of ESG in terms of its factors has been important in terms of understanding ESG. It This approach improves the strength of the results and illustrates the benefits of data-driven approaches’ integration with macro-political risk analysis. The results’ implications have a dual nature: They can be interpreted from an academically oriented perspective, as well as from a policy perspective. From a policy perspective, it can be argued that policymakers should perceive investments in environmental sustainability, social resilience, and, especially, good governance as objectives for sustainable growth, but also as tools for mitigating geopolitics-related risks. From the perspective of investors or international institutions, ESG factors can be interpreted as significant signals for the future resilience or vulnerability of geopolitics, complementing traditional approaches to risk analysis, which focus on short-term events. The analysis has some limitations. It is not possible to exclude potential endogeneity between ESG factors or variables and geopolitical risk completely, but it can be addressed by future research based on dynamic panels or IV analysis. It is also possible to expand the analysis to company or regional data, which can add more depth to understanding ESG factors’ influence on GPR. The article’s main strength is its ability to position geopolitics-related risks from a sustainability perspective. It also illustrates that ESG fundamentals have a strong position as determinants for the stability of geopolitics at a global level. It can be argued that in a world dominated by climate change, transitions in the energy industry, or stress at institutions, ESG factors’ consideration for geopolitics-related risks analysis is not a recommendation but a necessity for understanding and managing a system’s stability.
11. List of Acronyms
Table 25.
List of Acronyms.
| ESG | Variable | Acronym |
| E | Access to clean fuels and technologies | ACF |
| Access to electricity | ELEC | |
| Adjusted savings: natural resources depletion | NRD | |
| Adjusted savings: net forest depletion | NFD | |
| Agricultural land | AGL | |
| Agriculture, forestry & fishing value added | AFF | |
| Annual freshwater withdrawals | WAT | |
| CO2 emissions | CO2 | |
| Cooling Degree Days | CDD | |
| Electricity from coal | ECOA | |
| Energy imports | ENI | |
| Energy intensity | EINT | |
| Energy use per capita | ENU | |
| Forest area | FOR | |
| Fossil fuel consumption | FOS | |
| Heat Index 35 | HI35 | |
| Heating Degree Days | HDD | |
| Land Surface Temperature | LST | |
| Water stress | WSTR | |
| Methane emissions | CH4 | |
| Nitrous oxide emissions | N2O | |
| PM2.5 pollution | PM25 | |
| Safely managed drinking water | SMDW | |
| Safely managed sanitation | SMSS | |
| Water quality | WQG | |
| Renewable electricity output | RELE | |
| Renewable energy consumption | REN | |
| SPEI index | SPEI | |
| Tree Cover Loss | TCL | |
| Country GPR: Percent of articles | GPR | |
| S | Access to clean fuels and technologies for cooking (% pop.) | ACF |
| Access to electricity (% pop.) | ELEC | |
| Adjusted savings: natural resources depletion (% GNI) | NRD | |
| Adjusted savings: net forest depletion (% GNI) | NFD | |
| Agricultural land (% land area) | AGL | |
| Agriculture, forestry & fishing, value added (% GDP) | AFF | |
| Annual freshwater withdrawals (% internal resources) | WAT | |
| CO2 emissions (metric tons per capita) | CO2 | |
| Control of Corruption: Estimate | COR | |
| Cooling Degree Days | CDD | |
| Economic and Social Rights Performance Score | ESR | |
| Electricity production from coal sources (% total) | ECOA | |
| Energy imports, net (% of energy use) | ENI | |
| Energy intensity level of primary energy | EINT | |
| Energy use (kg oil eq. per capita) | ENU | |
| Fertility rate, total | FER | |
| Food production index | FPI | |
| Forest area (% of land area) | FOR | |
| Fossil fuel energy consumption (% total) | FOS | |
| GDP growth (annual %) | GDPG | |
| Gini index | GINI | |
| Government Effectiveness: Estimate | GOV | |
| Gov. expenditure on education (% of gov exp.) | GEDU | |
| Heat Index 35 | HI35 | |
| Heating Degree Days | HDD | |
| Hospital beds (per 1,000 people) | HOSP | |
| Income share held by lowest 20% | INC20 | |
| Individuals using the Internet (% pop.) | INT | |
| Labor force participation rate (ages 15–64) | LFP | |
| Land Surface Temperature | LST | |
| Level of water stress | WSTR | |
| Life expectancy at birth | LEX | |
| Methane emissions (t CO2 eq. per capita) | CH4 | |
| Mortality rate, under-5 | U5MR | |
| Net migration | MIG | |
| Nitrous oxide emissions (t CO2 eq. per capita) | N2O | |
| Patent applications, residents | PAT | |
| People using safely managed drinking water services | SMDW | |
| People using safely managed sanitation services | SMSS | |
| PM2.5 air pollution, mean annual exposure | PM25 | |
| Political Stability & Absence of Violence | PSAV | |
| Population ages 65+ (% total) | POP65 | |
| Population density | PDEN | |
| Prevalence of overweight (adults) | OVW | |
| Prevalence of undernourishment | UND | |
| Water bodies with good ambient quality | WQG | |
| Seats held by women in parliament | WIP | |
| Female/male labor force participation ratio | FLFP | |
| Regulatory Quality: Estimate | REG | |
| Renewable electricity output | RELE | |
| Renewable energy consumption | REN | |
| Research and development expenditure (% of GDP) | RDG | |
| Rule of Law: Estimate | ROL | |
| School enrollment, primary (% gross) | PRIM | |
| School enrollment primary & secondary, GPI | GPI | |
| Scientific and technical journal articles | STJA | |
| Standardised Precipitation–Evapotranspiration Index | SPEI | |
| Tree Cover Loss (hectares) | TCL | |
| Unemployment, total (% labor force) | UNEM | |
| Voice and Accountability: Estimate | VAC | |
| G | Control of Corruption | COR |
| Government Effectiveness | GOV | |
| Political Stability | PSAV | |
| Regulatory Quality | REG | |
| Rule of Law | ROL | |
| Voice & Accountability | VAC | |
| Research & development expenditure | RDG | |
| Scientific & technical articles | STJA | |
| Patent applications | PAT | |
| GDP growth | GDPG |
References
- Abadi, A. M., Fauzan, M., Caturiyati, C., Mahardika, B. W., Yazid, M. F., & Septianto, Y. (2025). Determining River Water Quality in the Special Region of Yogyakarta Using K-Means and Fuzzy C-Means Clustering. TEM Journal, 14(2).
- Abdelkader, S. B., & Si Mohammed, K. (2025). Dynamic connectedness between artificial intelligence, ESG, and brown asset markets: Evidence from energy, metals, and rare earth commodities. Sustainability, 17(24), 10885. [CrossRef]
- Acemoglu, D., Golosov, M., & Tsyvinski, A. (2011). Power fluctuations and political economy. Journal of Economic Theory, 146(3), 1009-1041.
- Akadiri, S. S., & Özkan, O. (2026). Navigating uncertainty: The impact of ESG factors on clean energy markets and investment dynamics. Corporate Social Responsibility and Environmental Management, 33(1), 1270–1285.
- Al Amosh, H., & Khatib, S. F. A. (2025). Adversity and accountability: Unravelling the nexus between geopolitical risks and ESG performance in the USA. Competitiveness Review. Advance online publication. [CrossRef]
- Alam, A., Banna, H., Alam, A. W., Bhuiyan, M. B. U., & Mokhtar, N. B. (2024). Climate change and geopolitical conflicts: The role of ESG readiness. Journal of environmental management, 353, 120284.
- Alam, M., Ansari, Z. A., & Jafar, S. H. (2025). The technological landscape of AI and sustainable finance: An exploration. In Green horizons: Role of AI in sustainable finance (pp. 37–53). Springer.
- Almulla, S., Albaity, M., & Al-Tamimi, H. A. H. (2025). The effects of ESG and institutional quality on financial stability: evidence from GCC banks. International Journal of Economics and Financial Issues, 15(2), 309.
- Al-Yafei, W. B., & Bennasr, H. (2025). The impact of geopolitical risk on trade credit. International Journal of Finance & Economics. Advance online publication. [CrossRef]
- Arbelaitz, O., Gurrutxaga, I., Muguerza, J., Pérez, J. M., & Perona, I. (2013). An extensive comparative study of cluster validity indices. Pattern recognition, 46(1), 243-256.
- Aselnino, P., & Wijayanto, A. W. (2024). Analisis Perbandingan Metode Hierarchical dan Non-Hierarchical dalam Pembentukan Cluster Provinsi di Indonesia Berdasarkan Indikator Women Empowerment. Indonesian Journal of Applied Statistics, 6(1), 57-68.
- B ai, S., He, H., Han, C., Shang, W.-L., & Fan, W. (2025). What is the focus of energy supply chain relationship management during geopolitical risks? Evidence from the stock market based on transaction cost economics. Energy Economics, 148, 108629. [CrossRef]
- BABARINDE, G. F., ORUGUN, F. I., ABDULMAJEED, T. I., & MALDAMA, A. Y. DRIVERS OF GREEN INNOVATION IN NIGERIA: EVIDENCE FROM GOVERNANCE QUALITY.
- Baihaqi, A. A., & Fakhriza, M. (2025). K-Nearest Neighbors (KNN) to Determine BBRI Stock Price. SISTEMASI, 14(2), 969-984.
- Bajra, U. Q., Aliu, F., & Prenaj, V. (2025). Connectivity of green financial assets under geopolitical risks and market-implied volatility. Finance Research Letters, 76, 107037. [CrossRef]
- Barman, S., & Mahakud, J. (2025). Assessing the impact of policy uncertainty, geopolitical risk, and sustainable disclosure on corporate performance. Asia-Pacific Financial Markets, 32(1), 167–203. [CrossRef]
- Ben Ameur, H., Ftiti, Z., & Louhichi, W. (2025). Do ESG investments improve portfolio diversification and risk management during times of uncertainty? Journal of International Financial Markets, Institutions and Money, 103, 102199. [CrossRef]
- Benammar, R., Mohammed, K. S., & Arfaoui, N. (2026). Exploring the impact of geopolitical risk and global uncertainty on ESG-based sustainability uncertainty: Evidence from Vietnam. Finance Research Letters, 89, 109323.
- Bendavid, E., Littleton, A. K., Mejía-Guevara, I., Fenyo, M., & Miller, G. (2025, October). A Global Analysis of Within-Country Health Inequalities. In JAMA Health Forum (Vol. 6, No. 10, pp. e253611-e253611). American Medical Association.
- Blukacz, A., Oyarte, M., Cabieses, B., & Díaz, J. (2025). Education as a social determinant of the health of international migrants and locals in Chile between 2013 and 2022. Journal of Migration and Health, 11, 100320.
- Boccaletti, S., Maranzano, P., Morelli, C., & Ossola, E. (2026). ESG performance and stock market responses to geopolitical turmoil: Evidence from the Russia–Ukraine war. Economic Modelling, 154, 107380.
- Böhmelt, T., Bernauer, T., Buhaug, H., Gleditsch, N. P., Tribaldos, T., & Wischnath, G. (2014). Demand, supply, and restraint: determinants of domestic water conflict and cooperation. Global Environmental Change, 29, 337-348.
- Bolton, P., Despres, M., Da Silva, L. A. P., Samama, F., & Svartzman, R. (2020). The green swan. BIS Books.
- Bongermino, G., & Romagnoli, S. (2025). ESG rating and ambiguity: An informative and distorted signal-based approach. Decisions in Economics and Finance. Advance online publication. [CrossRef]
- Bose, S., Akhtaruzzaman, M., Zaman, R., & Abbassi, W. (2025). Global cybersecurity, cyber risks and firm value: International evidence. The International Journal of Accounting, Article 2542007. [CrossRef]
- Bouzguenda, M., & Jarboui, A. (2025). Navigating the green frontier: Dynamic risk and return transmission between clean energy ETFs and ESG indexes in emerging markets. Journal of Risk and Financial Management, 18(10), 557. [CrossRef]
- Braiek, S., Alsagr, N., Syed, A. A., & Jeribi, A. (2025). Waves of uncertainty: Crude oil under geopolitical, economic, and ESG turbulence. Energy Science & Engineering. Advance online publication. [CrossRef]
- BUDANOV, K., VERESHCHAK, V., KUDRIAVTSEV, V., MOKLIAK, S., & RUBEL, K. (2025). A Strategy for Global Engagement. Revista de cercetare și intervenție socială, 89, 48-60.
- Burke, M., Alampay Davis, W. M., & Diffenbaugh, N. S. (2018). Large potential reduction in economic damages under UN mitigation targets. Nature, 557(7706), 549-553.
- Burke, M., Hsiang, S. M., & Miguel, E. (2015). Climate and conflict. Annu. Rev. Econ., 7(1), 577-617.
- Caldara, D., & Iacoviello, M. (2022). Measuring geopolitical risk. American economic review, 112(4), 1194-1225.
- Caldara, D., Iacoviello, M., Molligo, P., Prestipino, A., & Raffo, A. (2020). The economic effects of trade policy uncertainty. Journal of Monetary Economics, 109, 38-59.
- Campello, R. J., Moulavi, D., Zimek, A., & Sander, J. (2015). Hierarchical density estimates for data clustering, visualization, and outlier detection. ACM Transactions on Knowledge Discovery from Data (TKDD), 10(1), 1-51.
- Carleton, T. A., & Hsiang, S. M. (2016). Social and economic impacts of climate. Science, 353(6304), aad9837.
- Cheng, P., Wang, M., Li, K., Choi, B., & Chen, W. (2025). The impact mechanism of geopolitical risks on ESG performance: The moderating effects of investor attention and government subsidies. PloS one, 20(1), e0311659.
- Chowdhury, S., Khan, S., Sarker, M. F. H., Islam, M. K., Tamal, M. A., & Khan, N. A. (2022). Does agricultural ecology cause environmental degradation? Empirical evidence from Bangladesh. Heliyon, 8(6).
- Conduah, A. K., & Ofoe, S. H. (2025). Intersecting impacts of ageing, migration, and socioeconomic disparities on health equity: a post-pandemic policy review. International Journal for Equity in Health, 24(1), 304.
- Crawshaw, P., & Gray, J. (2025). Health Inequalities in Crisis Times: Questions for Global Health Governance. International Journal of Social Determinants of Health and Health Services, 27551938251381110.
- Cui, J., & Maghyereh, A. (2025). Higher-order moment spillovers among global ESG stock markets: The impacts of geopolitical risks, sustainability uncertainty and climate policy uncertainty. International Journal of Finance & Economics. Advance online publication. [CrossRef]
- Das, N., Pradhan, R. P., & Janjua, L. R. (2026). Climate commitments and market risks: Analysing the drivers of sovereign green bond issuance in India. Finance Research Letters, 90, 109365.
- Dimic, N., Piljak, V., Swinkels, L., & Vulanovic, M. (2025). ESG thematic bonds in emerging markets: Risk, uncertainty, and ambiguity. European Financial Management. Advance online publication. [CrossRef]
- Dincă, M. S., Ciotlăuși, V., & Akomeah, F. (2025). Estimating the Impact of ESG on Financial Forecast Predictability Using Machine Learning Models. International Journal of Financial Studies, 13(3), 166.
- Ding, Y., Yin, F., Chin, L., Zhou, K., Taghizadeh-Hesary, F., & Li, Y. (2025). Can government R&D expenditure promote innovation? New evidence from 37 OECD countries. Technological and Economic Development of Economy, 31(2), 572-596.
- Dipierro, A. R., Barrionuevo, F. J., & Toma, P. (2025). Predicting ESG Controversies in Banks Using Machine Learning Techniques. Corporate Social Responsibility and Environmental Management, 32(3), 3525-3544.
- Doğan, M., & Zeren, F. (2025). Do geopolitical shocks threaten ESG sustainability uncertainty? Insights from individual G7 economies via wavelet and quantile-based approaches. Journal of Environmental Management, 395, 127744.
- Dong, M., & Tremblay, A. (2021). Does the weather influence global stock returns?. Critical Finance Review, 10(2), 207-249.
- Drago, C., Arnone, M., & Leogrande, A. (2025). A Machine Learning and Panel Data Analysis of N2O Emissions in an ESG Framework. Sustainability, 17(10), 4433.
- Ekinci, G., & Ozturk, H. K. (2025). Forecasting Wind Farm Production in the Short, Medium, and Long Terms Using Various Machine Learning Algorithms. Energies, 18(5), 1125.
- Erzurumlu, Y. O., Gozgor, G., Lau, C. K. M., Soliman, A. M., & Turkkan, M. (2025). The effects of geopolitical and political risks on corporate ESG practices. Journal of Environmental Management, 386, 125747. [CrossRef]
- Essayem, A. (2025). Dissecting the tail: Assessing global drivers of French sustainable markets. Journal of Capital Markets Studies. Advance online publication. [CrossRef]
- Fabozzi, F. J. (2025). ARMOR-CAP investing: Building resilient portfolios for a geopolitical era. The Journal of Portfolio Management, 51(10), 153–167. [CrossRef]
- Ferreira, J. J., Gomes, S., Lopes, J. M., & Zhang, J. Z. (2023). Ticking time bombs: The MENA and SSA regions' geopolitical risks. Resources Policy, 85, 103938.
- Garcia Rodriguez, M. J., Rodriguez Montequin, V., Aranguren Ubierna, A., Santana Hermida, R., Sierra Araujo, B., & Zelaia Jauregi, A. (2021). Award price estimator for public procurement auctions using machine learning algorithms: case study with tenders from Spain. Studies in informatics and control.
- Gebreegziabher, E., Bui, D., Cummings, K. J., Frederick, M., Nguyen, A., Collins, C., ... & Vergara, X. (2024). Demographic changes in COVID-19 mortality during the pandemic: analysis of trends in disparities among workers using California’s mortality surveillance system. BMC Public Health, 24(1), 1822.
- Ghani, M., Qin, Q., & Khan, S. (2025). Modeling volatility dynamics in emerging markets: Novel evidence from a large set of predictors. Journal of Forecasting, 44(8), 2364–2385. [CrossRef]
- Gheorghe, C., Panazan, O., Alnafisah, H., & Jeribi, A. (2025). ETF resilience to uncertainty shocks: A cross-asset nonlinear analysis of AI and ESG strategies. Risks, 13(9), 161. [CrossRef]
- Guenichi, H., Omri, N. A.-E., & Khaskhoussi, T. (2025). Geopolitical risk, economic and climate policy uncertainty and ESG disclosure: Evidence from U.S. firms. Management of Environmental Quality: An International Journal, 36(7), 1758–1785. [CrossRef]
- Guj, P., & Schodde, R. (2025). Will future copper resources and supply be adequate to meet the net zero emission goal? Geosystems and Geoenvironment, 4(1), 100320. [CrossRef]
- Gunawan, A. B. M., & Ihsan, A. F. (2024, July). Implementation of the K-Nearest Neighbor Algorithm for Forecasting the Operational Conditions of Natural Gas Pipeline Transmission Networks. In 2024 International Conference on Data Science and Its Applications (ICoDSA) (pp. 439-444). IEEE.
- Guo, X., Cheng, P., & Choi, B. (2024). Impact of corporate environmental uncertainty on environmental, social, and governance performance: The role of government, investors, and geopolitical risk. Plos one, 19(8), e0309559.
- Guo, Z., Liang, Y., Yang, R., & Zhang, J. (2025). The impact of geopolitical risks on the ESG performance of Chinese multinational enterprises: The moderating role of firm-specific advantages and country-specific advantages. Sustainability, 17(23), 10748.
- Gupta, M., & Panda, A. K. (2025). Do ESG indices react to macroeconomic and global risks? An empirical analysis. Asia-Pacific Financial Markets. Advance online publication. [CrossRef]
- Gupta, S., & Yan, H. (2025). Using large language models to estimate novel risk: Impact on volatility. The Journal of Portfolio Management, 51(7), 230–247. [CrossRef]
- Ha, L. T. (2025). From wars to dynamic waves: Scrutinizing connectedness between geopolitical risk index, green and non-green crypto volatility by quantile spillovers. Physica A: Statistical Mechanics and Its Applications, 679, 131001. [CrossRef]
- Hajirahimova, M. S., & Aliyeva, A. S. (2023). Development of a Prediction Model on Demographic Indicators based on Machine Learning Methods: Azerbaijan Example. International Journal of Education and Management Engineering, 13(2), 1.
- Halim, A. H. A., Razif, N. F. M., & Ali, A. K. (2025). Sadd al-Zarai’ and Fath al-Zarai’ approaches in Islamic financial risk management: Implications for sustainability. Global Journal Al Thaqafah, 15(2), 258–274.
- Haseeb, M., Usman, M., & Fan, F. (2025). Understanding financial stability through the lens of geopolitical risk in China: The influence of policy uncertainty on climate change. Finance Research Letters, 85, 107944. [CrossRef]
- Hau, L., Xue, W., & Liu, Q. (2025). Multiscale information network among fossil energy, renewable energy and ESG investment under the Russo–Ukrainian conflict. Research in International Business and Finance, 80, 103154. [CrossRef]
- Hindupur, J. T. K., Navaneeth, A. D., PH, H. F., & Sharma, S. Analyzing Clustering Algorithms for Non-Linear Data to Evaluate Robustness and Scalability.
- Huo, X., & Shi, H. (2025). Geopolitical risk and ESG rating divergence: Global evidence. Finance Research Letters, 86, 108483.
- Hurtado, J.-N., Herberger, T. A., & Charifzadeh, M. (2025). Does socially non-compliant corporate behavior lead to underperformance? Event analysis related to the Russia–Ukraine conflict and the CELI list. Journal of Sustainable Finance & Investment. Advance online publication. [CrossRef]
- Iacoviello, G. (2025). Editorial: New frontiers in risk governance — From ESG disclosure to geopolitical risk. Risk Governance and Control: Financial Markets and Institutions, 15(2), 4–5. [CrossRef]
- Iaousse, M., Jouilil, Y., Bouincha, M., & Mentagui, D. (2023). A comparative simulation study of classical and machine learning techniques for forecasting time series data. iJOE, 19(08), 57.
- Ide, T. (2021). COVID-19 and armed conflict. World development, 140, 105355.
- Ide, T., Kristensen, A., & Bartusevičius, H. (2021). First comes the river, then comes the conflict? A qualitative comparative analysis of flood-related political unrest. Journal of Peace Research, 58(1), 83-97.
- Inyang, U. G., Ijebu, F. F., Osang, F. B., Afolorunso, A. A., Udoh, S. S., & Eyoh, I. J. (2023). A Dataset-Driven Parameter Tuning Approach for Enhanced K-Nearest Neighbour Algorithm Performance. International Journal on Advanced Science, Engineering & Information Technology, 13(1).
- Ismail Fawaz, H., Forestier, G., Weber, J., Idoumghar, L., & Muller, P. A. (2019). Deep learning for time series classification: a review. Data mining and knowledge discovery, 33(4), 917-963.
- Iwanicz-Drozdowska, M., Lament, M., & Witkowski, B. (2025). ESG Performance and Economic Growth in Europe. Sustainable Development, 33(6), 9180-9196.
- Kahn, M. E., Mohaddes, K., Ng, R. N., Pesaran, M. H., Raissi, M., & Yang, J. C. (2021). Long-term macroeconomic effects of climate change: A cross-country analysis. Energy Economics, 104, 105624.
- Kaliappan, J., Srinivasan, K., Mian Qaisar, S., Sundararajan, K., Chang, C. Y., & C, S. (2021). Performance evaluation of regression models for the prediction of the COVID-19 reproduction rate. Frontiers in Public Health, 9, 729795.
- Kanu, I. A., Bazza, M. B., & OMOJOLA, I. O. (2019). A Discourse on Migration and Unemployment in the Context of Africa. Nnadiebube Journal of Education in Africa, 4(2).
- Karima, T., Hidayat, K., Nuzula, N. F., & Damayanti, C. R. (2025). The effect of risk on capital structure, profitability, and firm value with sustainability report as a moderating variable. OIDA International Journal of Sustainable Development, 18(12), 475–488.
- Karkowska, R., & Urjasz, S. (2025). How does the volatility of ESG stock indices spill over in times of high geopolitical risk? New insights from emerging and developed markets. Journal of Sustainable Finance & Investment, 15(3), 577–623. [CrossRef]
- Kaufmann, D., Kraay, A., & Mastruzzi, M. (2007). The worldwide governance indicators project.
- Kaur, S., Singh, M., & Pant, M. (2025). Navigating financial risk: Hedging and derivatives in international reporting and cross-border deals. In Aligning financial reporting standards with global trade needs (pp. 205–250). Springer.
- Kharlamova, G., Shchur, D., & Humenna, O. (2025). S + ESG as a new dimension of resilience: Security at the core of sustainable business development. Sustainability, 17(18), 8425. [CrossRef]
- Khatib, S. F., Abbas, A. F., Igwe, M. N., Yue, S., & Sulimany, H. G. H. (2025). Mind the Tides: A Systematic Review of the Geopolitical Risk Literature. Politics & Policy, 53(3), e70028.
- Kim, J. H., Kwak, J., & Park, H. K. (2025). ESG as a nonmarket strategy to cope with geopolitical tension: Empirical evidence from multinationals' ESG performance. Strategic Management Journal, 46(3), 693-722.
- Koumpagioti, D., Moriki, D., Boutopoulou, B., Perdikaris, P., & Douros, K. (2025). Social Determinants of Health in Pediatric Asthma and Allergic Diseases: A Systematic Review. Epidemiologia, 6(3), 56.
- Kuai, Y., & Wang, H. (2025). Geopolitical risk and corporate ESG performance: Evidence from China. Emerging Markets Finance and Trade, 61(4), 1010–1029. [CrossRef]
- Kuhn, M., & Johnson, K. (2019). Feature engineering and selection: A practical approach for predictive models. Chapman and Hall/CRC.
- Kuzina, R., & Steiner, B. E. (2025). Barriers to progress: How geopolitical risks affect the EU’s SDG agenda. In Bridging governance, public support, innovation and transparency: A combined approach to sustainable development in Europe (pp. 133–170). Springer.
- Lakioti, E., Pagonis, N., Flegkas, D., Itziou, A., Moustakas, K., & Karayannis, V. (2025). Social Factors and Policies Promoting Good Health and Well-Being as a Sustainable Development Goal: Current Achievements and Future Pathways. Sustainability, 17(11), 5063.
- Larson, S., John, S., Gowrisankar, S., Zhao, M., Piner, B., Dallasta, I., & Marsh, E. B. (2025). Social Determinants of Health Framework Identifies Patients at Risk for Loss to Follow-Up After Stroke. Journal of the American Heart Association, 14(9), e040986.
- Laureti, L., Costantiello, A., & Leogrande, A. (2023). The role of government effectiveness in the light of esg data at global level. Available at SSRN 4324938.
- Lei, X., Wang, N., Liu, X., Zhang, B., & Wang, X. (2025). Enhancing corporate sustainability under uncertainty: The roles of geopolitical risks and carbon market in shaping ESG performance. Journal of Environmental Management, 395, 127881.
- Li, C., Liu, Y., Xu, R., & Xu, X. (2025). Insuring legitimacy: The role of uncertainty perceptions in shaping corporate insurance demand. Economic Modelling, 151, 107157. [CrossRef]
- Li, J., Guo, Y., Wei, L., Niu, X., & Li, W. (2026). Patient capital and supply chain resilience in manufacturing enterprises: An analysis from the perspectives of funding, governance, and innovation. International Review of Financial Analysis, 110, 104905.
- Lin, C.-Y., Tseng, T.-L., & Xu, H. (2025). GPT-augmented Bayesian reinforcement learning framework for multi-objective supplier selection. IEEE Transactions on Engineering Management. Advance online publication. [CrossRef]
- Lin, L. Y.-H. (2025). Securities markets regulation. In Comparative financial regulation (pp. 103–118). Springer.
- Liu, J., Gong, Y., Gu, B., & Chen, J. (2025). Investor-driven ESG integration for maritime supply chain resilience: A BWM–QFD framework. International Journal of Logistics Research and Applications. Advance online publication. [CrossRef]
- Lompo, A. V., & Diendere, A. A. (2025). Effect of political instability on income inequality within the West African Economic and Monetary Union. Journal of Public Finance and Public Choice, 1-21.
- Loukil, S., Zulfiqar, N., Paparas, D., & Ghosh, B. (2025). The dynamic volatility nexus of blue-green economy, cryptocurrency and gold indices during uncertain times. International Journal of Energy Economics and Policy, 15(1), 281–291.
- Ma, Y., Yin, Z.-J., & Fu, Q. (2025). A national Blue-ESG index: Measurement of marine sustainability. Innovation and Green Development, 4(4), 100274. [CrossRef]
- Macpherson, M., & Rimmel, G. (2025). Financial market perspective on sustainability reporting. In Accounting for sustainability (2nd ed., pp. 255–274). Routledge. [CrossRef]
- Maghami, M. (2024). New Global Governance and Overreaching Frameworks: Reimagining the Rule of Law, AI and ESG for the Betterment of the World. Denning LJ, 33, 177.
- Martínez Torres, J., Iglesias Comesana, C., & García-Nieto, P. J. (2019). Machine learning techniques applied to cybersecurity. International Journal of Machine Learning and Cybernetics, 10(10), 2823-2836.
- Matviienko, H., Shatrava, S., Mozghovyi, O., Butkevych, O., & Shkliar, S. (2025). Economic-legal regulation of bank liquidity in the context of environmental and climate change. In Proceedings of the International Multidisciplinary Scientific Geoconference SGEM (Vol. 25, No. 5.1, pp. 675–684). STEF92 Technology Ltd. [CrossRef]
- Meng, X., Wong, K.-P., Zhang, C., & Qin, T. (2025). Mapping the sustainability–resilience nexus: A scientometric analysis of global supply chain risk management. Eng, 6(12), 357. [CrossRef]
- Miah, M. D., Hasan, R., & Usman, M. (2021). Carbon emissions and firm performance: evidence from financial and non-financial firms from selected emerging economies. Sustainability, 13(23), 13281.
- Molnar, C. (2020). Interpretable machine learning. Lulu. com.
- Morelli, C., Boccaletti, S., Maranzano, P., & Otto, P. (2025). Multidimensional spatiotemporal clustering–an application to environmental sustainability scores in europe. Environmetrics, 36(2), e2893.
- Muddasir, M., & Ramon-Llorens, M. C. (2025). Impact of macroeconomic factors on the S&P Europe 350 ESG Index during the Russo–Ukrainian war. Scientific Annals of Economics and Business, 72(1), 145–164. [CrossRef]
- N Sibai, F., El-Moursy, A., & Sibai, A. (2024). Forecasting the consumer price index: a comparative study of machine learning methods. International Journal of Computing and Digital Systems, 15(1), 1-10.
- Nagararan, C., Ananth, I., & Ramasubramaniam, M. (2025). Designing for resilience: A comparative analysis of the ports of Mundra and Tanjung Pelepas. In National competitive advantage amid rapid global transformation (pp. 351–381). Springer.
- Nathaniel, S. P. (2021). Biocapacity, human capital, and ecological footprint in G7 countries: the moderating role of urbanization and necessary lessons for emerging economies. Energy, Ecology and Environment, 6(5), 435-450.
- Newaz, M. K., & Aslam, A. (2025). Geopolitical risks and ESG bonds: Portfolio implications for sustainable investing. Journal of Environmental Management, 395, 127750.
- Oliver-Smith, A. (2022). The social construction of disaster: Economic anthropological perspectives on the COVID-19 pandemic. Economic Anthropology, 9(1), 167-171.
- Ongan, S., Işık, C., Aydın, R., Alvarado, R., & Ahmad, M. (2025). Measuring sustainability under uncertainty: Introducing net ESG (N-ESG) performance. Business Strategy and the Environment. Advance online publication. [CrossRef]
- Onomakpo, H. O. (2025). Determinants of Renewable Energy Investment: An Integrated Analysis of ESG, Geopolitical Risk, and Finance.
- Özkan, O., Naimoğlu, M., & Dam, M. (2025). The impact of ESG-related, financial, and geopolitical uncertainties on the renewable energy transition in the United States. Business Strategy and the Environment, 34(6), 7864–7877. [CrossRef]
- Pankratz, N., Bauer, R., & Derwall, J. (2023). Climate change, firm performance, and investor surprises. Management science, 69(12), 7352-7398.
- Papathanasiou, S., Kenourgios, D., Koutsokostas, D., & Christopoulos, A. (2025). Unveiling the 60/40 portfolio’s network centrality: A study of diversification in extreme weighting scenarios. Euromed Journal of Business. Advance online publicatio.
- Pedersen, L. H., Fitzgibbons, S., & Pomorski, L. (2021). Responsible investing: The ESG-efficient frontier. Journal of financial economics, 142(2), 572-597.
- Pesaran, M. H., & Tosetti, E. (2011). Large panels with common factors and spatial correlation. Journal of Econometrics, 161(2), 182-202.
- Petrović, I., & Vesković Anđelković, M. (2025). Immigration between Needs and Fears–Attitudes of Serbian Citizens toward Immigrants. In International Scientific Conference" New Divisions, Struggles and Solidarities in South East Europe" Book of Proceedings (pp. 173-191). Sociološko naučno društvo Srbije.
- Pham, T. T. (2025). Global information uncertainty and real estate stock valuation in emerging markets: An integrated behavioral–theoretical and machine learning framework. In Real estate management and valuation. Springer.
- Priyanto, A., Listari, E. S. A., Maisa, K. N., Hapidin, D. A., & Khairurrijal, K. (2025). Novel Estimation of Nanofiber Diameter from SEM Images Using Deep Feature Embeddings and Machine Learning Models. Advanced Theory and Simulations, 2401489.
- Rahman, T., Paul, S. K., & Moktadir, M. A. (2025). A digital analytics model for evaluating onshoring production strategies towards supply chain resilience. IFAC-PapersOnLine, 59(10), 1981–1985. [CrossRef]
- Rakshit, S., & Sengupta, A. R. (2024). Comparison of Machine Learning and Deep Learning Models Performance in predicting wind energy. EAI Endorsed Transactions on Energy Web, 12.
- Ramlall, I. (2025). Optimizing asset allocation in the COVID-19 era: Curtailing variance and VaR while enhancing Sharpe ratio across conventional and green assets. Journal of Asset Management, 26(7), 788–803. [CrossRef]
- Rana, A., Sahu, A. K., & Debata, B. (2025). Managerial sentiment, life cycle and corporate investment: A large language model approach. International Journal of Managerial Finance, 21(1), 87–110. [CrossRef]
- Rangachari, P., & Thapa, A. (2025). Impact of hospital and health system initiatives to address Social Determinants of Health (SDOH) in the United States: a scoping review of the peer-reviewed literature. BMC Health Services Research, 25(1), 342.
- Rao, N., Bala, M., Ranganathan, N., Anand, U., Dhingra, S., Costa, J. C., & Weber, A. M. (2023). Trends in the prevalence and social determinants of stunting in India, 2005–2021: findings from three rounds of the National Family Health Survey. BMJ Nutrition, Prevention & Health, 6(2), 357.
- Reyad, H. M., Ayesha, M., Iqbal, M. M., & Zariyawati, M. A. (2024). The role of ESG in enhancing firm resilience to geopolitical risks: An eastern European perspective. Business Strategy & Development, 7(4), e70027.
- Rostetska, S., Shvets, S., & Ilkiv, O. (2023). Formation of a new paradigm of global political and migration processes under the influence of military activities in Ukraine. Baltic Journal of Economic Studies, 9(5), 241-251.
- Sahin, B. (2025). Gender Knowledges, Cultures of Equality, and Structural Inequality: Interpreting Female Employment Patterns in Manufacturing Through Interpretable Machine Learning. Social Sciences, 14(9), 545.
- Şahin, U., & Chen, Y. (2023). Assessing the current and future effects of Covid-19 on energy related-CO2 emissions in the United States using seasonal fractional grey model. Energy Strategy Reviews, 50, 101234.
- Saidin, M. I. S., & O’Neill, J. (2022). Climate change and the diversification of green social capital in the international political economy of the Middle East and North Africa: a review article. Sustainability, 14(7), 3756.
- Saini, M., Yadav, M., Agoba, A., Danso, A., & Adu-Ameyaw, E. (2025). Geopolitical risk, market indices, and ESG performance during crises. Business Strategy and the Environment, 34(7), 9421–9440. [CrossRef]
- Saltık, Ö. (2024). Algorithmic Approaches to Unraveling ESGC Impact on Financial Per-formance Based on the Ethical Investing in the Energy Sector. International Journal of Pure and Applied Sciences, 10(2), 459-517.
- Sanath Kumar, K., Deepak, K. V., Neethi, & Akshatha, P. (2025). Impact of geopolitical risks on the sustainability index of the Indian share market. In Studies in Systems, Decision and Control (Vol. 607, pp. 343–351). Springer. [CrossRef]
- Saraswati, E., Ghofar, A., Atmini, S., & Dewi, A. A. (2024). Clustering of companies based on sustainability performance using ESG materiality approach: evidence from Indonesia. International Journal of Energy Economics and Policy, 14(2), 112-125.
- Seow, R. Y. C. (2025). Transforming ESG analytics with machine learning: A systematic literature review using TCCM framework. Corporate Social Responsibility and Environmental Management, 32(6), 7358-7389.
- Sha, F., Meng, J., Zheng, X., & Jiang, Y. (2025). Sustainability under fire: How China–US tensions impact corporate ESG performance? Finance Research Letters, 85, 107882. [CrossRef]
- Shen, Y., Cui, X., Zhu, Y., & Cai, Y. (2025). The causal dynamics between geopolitical risks, climate risks, and Global ESG Equity & Green Bond Balanced Index. Finance Research Letters, 85, 107775. [CrossRef]
- Shergill, M., Durant, S., Birdi, S., Rabet, R., Ziegler, C., Ali, S., ... & Pinto, A. D. (2025). Machine learning used to study risk factors for chronic diseases: A scoping review. Canadian Journal of Public Health, 1-15.
- Sihombing, P. R., Yuda, Y. P. A. C., Busminoloan, B., & Islam, I. H. N. (2022). KOMPARASI PERFORMA K-MEANS DAN FUZZY C-MEANS: Studi Kasus: Indeks Pembangunan Ekonomi Inkslusif Indonesia. Jurnal Bayesian: Jurnal Ilmiah Statistika dan Ekonometrika, 2(2), 125-132.
- Singhania, M., Seth, S., & Saini, C. (2025). Volatility spillovers across fintech, digital economy, and ESG indices in India: A quantile time-frequency connectedness analysis. Australasian Accounting, Business and Finance Journal, 19(4), 83–111.
- Soltani, H., & Abbes, M. B. (2025). Does U.S. financial instability matter for clean, green, and sustainable investment indices? Evidence from TVP-VAR and wavelet coherence approaches. Asia-Pacific Financial Markets. Advance online publication. [CrossRef]
- Sondag, M., Meinecke, C., Collaris, D., Von Landesberger, T., & Elzen, S. V. D. (2025). Cluster-Based Random Forest Visualization and Interpretation. arXiv preprint arXiv:2507.22665.
- Sovbetov, I. (2025). The price of backlash: Performance of Israeli firms post–Gaza war. Borsa Istanbul Review, 25(6), 1486–1506. [CrossRef]
- Su, X., Razi, U., Zhao, S., Gu, X., & Yan, J. (2025). Geopolitical risk and energy markets in China. International Review of Financial Analysis, 103, 104187. [CrossRef]
- Suska, M. (2025). Summary and conclusions. In Central and Eastern European business environment: Economic, environmental and political dimensions (pp. 176–179). Springer.
- Taye, E. A., Woubet, E. Y., Hailie, G. Y., Zegeye, A. T., Arage, F. G., Zerihun, T. E., & Kassaw, A. T. (2025). Random forest algorithm for predicting tobacco use and identifying determinants among pregnant women in 26 sub-Saharan African countries: a 2024 analysis. BMC Public Health, 25(1), 1506.
- Trianda, D., Hartama, D., & Solikhun, S. (2025). Comparison of Hyperparameter Tuning Methods for Optimizing K-Nearest Neighbor Performance in Predicting Hypertension Risk. JURNAL TEKNIK INFORMATIKA, 18(1), 111-121.
- Vesco, P., Baliki, G., Brück, T., Döring, S., Eriksson, A., Fjelde, H., ... & Hegre, H. (2025). The impacts of armed conflict on human development: A review of the literature. World Development, 187, 106806.
- Visser, N. W. Projecting long-term armed conflict risk: an underappreciated field of inquiry? 2. inquiry, 2, 3.
- Vivoda, V., Overland, I., & Vakulchuk, R. (2025). Navigating ASEAN’s critical materials future: Opportunities, risks and strategic imperatives. Mineral Economics. Advance online publication. [CrossRef]
- Vollset, S. E., Goren, E., Yuan, C. W., Cao, J., Smith, A. E., Hsiao, T., ... & Murray, C. J. (2020). Fertility, mortality, migration, and population scenarios for 195 countries and territories from 2017 to 2100: a forecasting analysis for the Global Burden of Disease Study. The Lancet, 396(10258), 1285-1306.
- Wang, H., & Overby, E. M. (2022). How does online lending influence bankruptcy filings?. Management Science, 68(5), 3309-3329.
- Wang, L., Chen, P., Zhao, K., & Bian, J. (2025). Analysis on the “going global” path of mining enterprises under the concept of green mining development. China Mining Magazine, 34(8), 38–44.
- Xie, Y., Kang, S. B., & Zhao, J. (2025). ESG practices and corporate financial performance: Evidence from the airline industry during the Russian–Ukrainian war. Economics Bulletin, 45(3), 1421–1430.
- Yılmaz, A. (2024). Do Geopolitical Risks and Political Stability Drive Foreign Direct Investments? New Evidence from Dynamic Panel CS-ARDL Model. Ekonomi Politika ve Finans Araştırmaları Dergisi, 9(1), 61-87.
- Yu, J., Cao, J., Budría, S., & Zhou, H. (2025). Artificial intelligence: A solution to enhance sustainability in a turbulent world? Emerging Markets Finance and Trade. Advance online publication. [CrossRef]
- Zambelli, M. (2025). International banking law and regulation. Springer.
- Zatonatskiy, D., Leonov, S., Cieśliński, W., & Vasa, L. (2024). Determinants of global migration: The impact of ESG investments and foreign direct investment. Economics & Sociology, 17(1), 215-235.
Figure 1.
Integrated ESG–Geopolitical Risk Framework: A Multi-Method Analytical Approach. Note. The figure illustrates how governance capacity, environmental stress, and social structures jointly shape geopolitical risk through interconnected channels. By combining panel models, clustering, and machine learning, the framework captures systemic, nonlinear sustainability-driven sources of geopolitical instability.
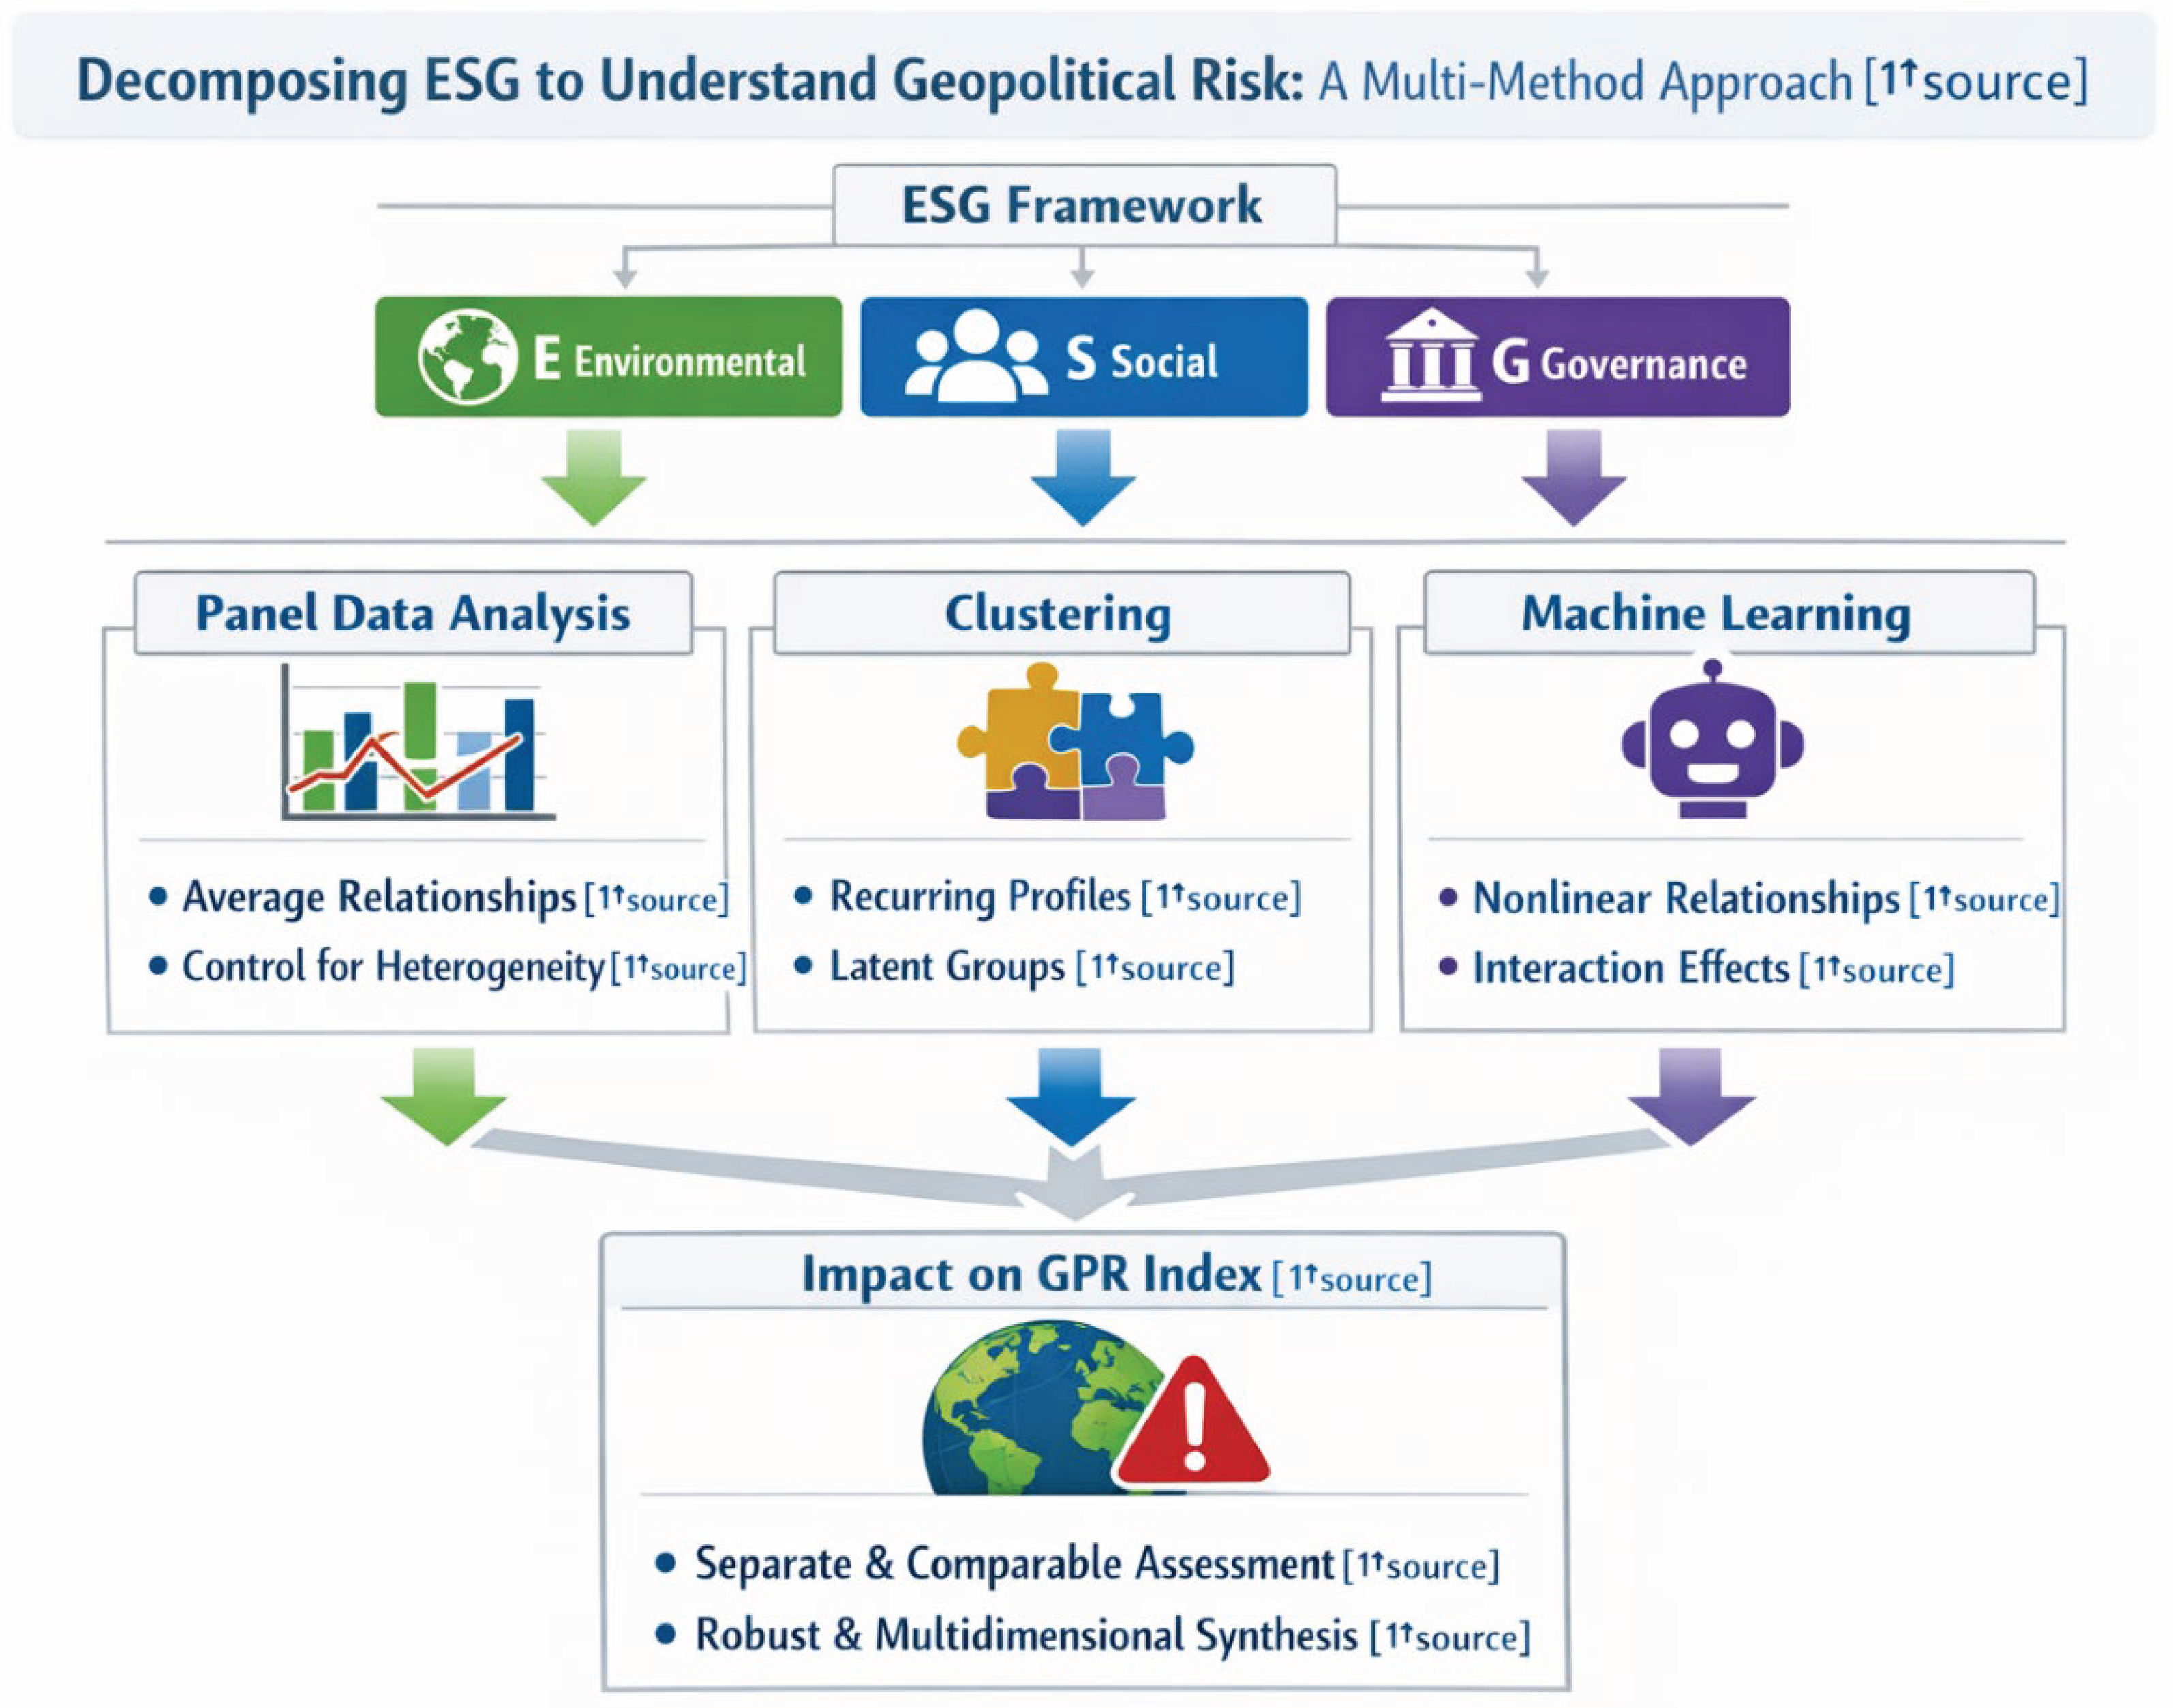
Figure 2.
Random Forest–Based Clustering of the Environmental (E) ESG Dimension. Note. Panel A shows cluster selection using WSS, AIC, and BIC, with the BIC minimum indicating nine optimal clusters. Panel B visualizes the resulting environmental regimes, highlighting nonlinear patterns in climate stress, energy structure, and resource use relevant to GPR.
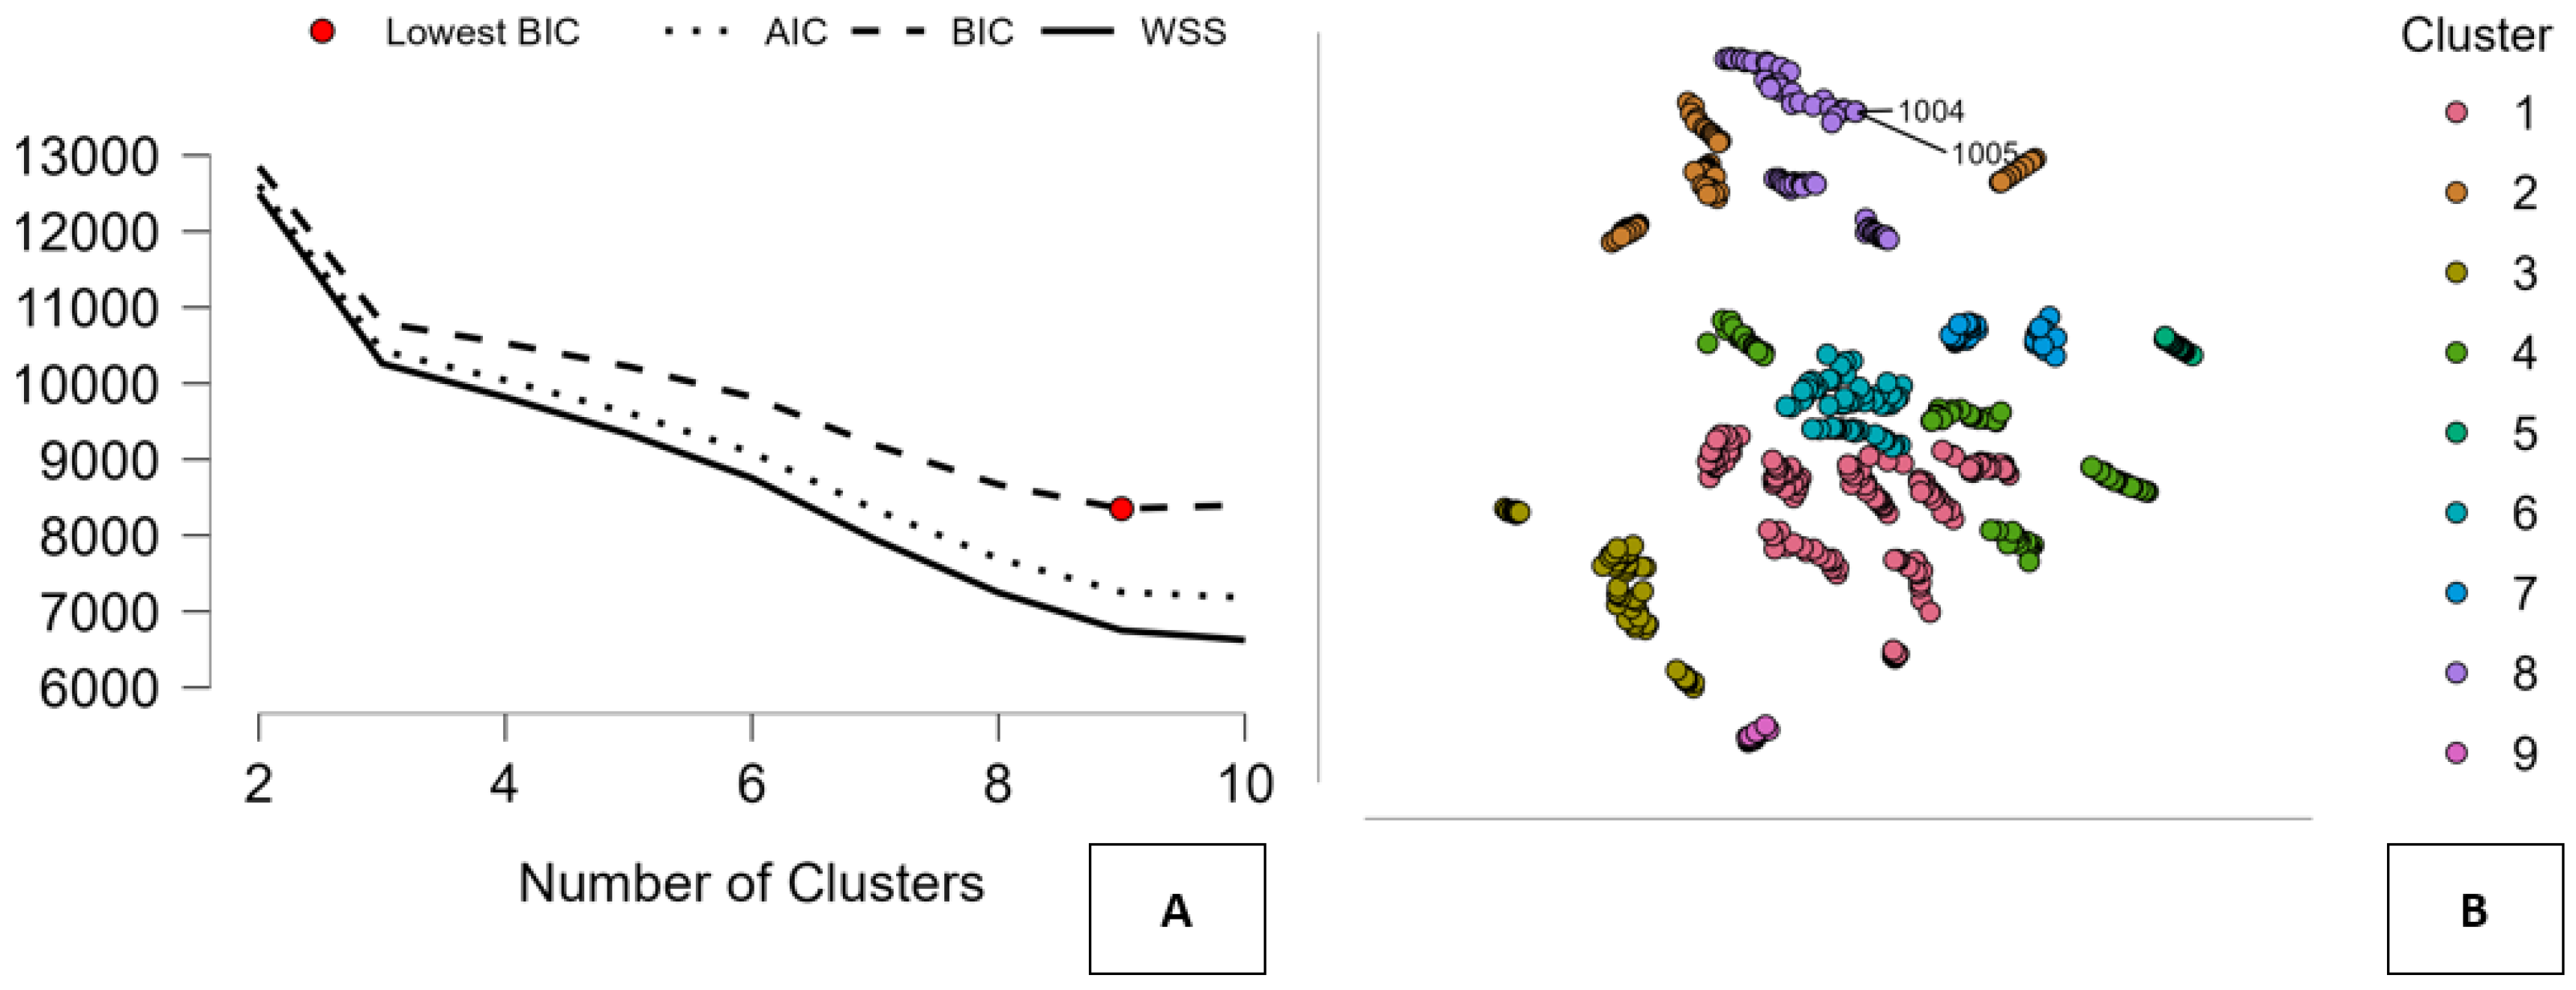
Figure 3.
KNN Model Diagnostics and Calibration for Environmental ESG and Geopolitical Risk. Note. Panels illustrate KNN performance: prediction accuracy, neighbor selection, and uniform distance weights. Equal weighting enhances interpretability and stability, supporting local averaging. Together, results confirm KNN as a reliable tool linking ESG factors to geopolitical risk.
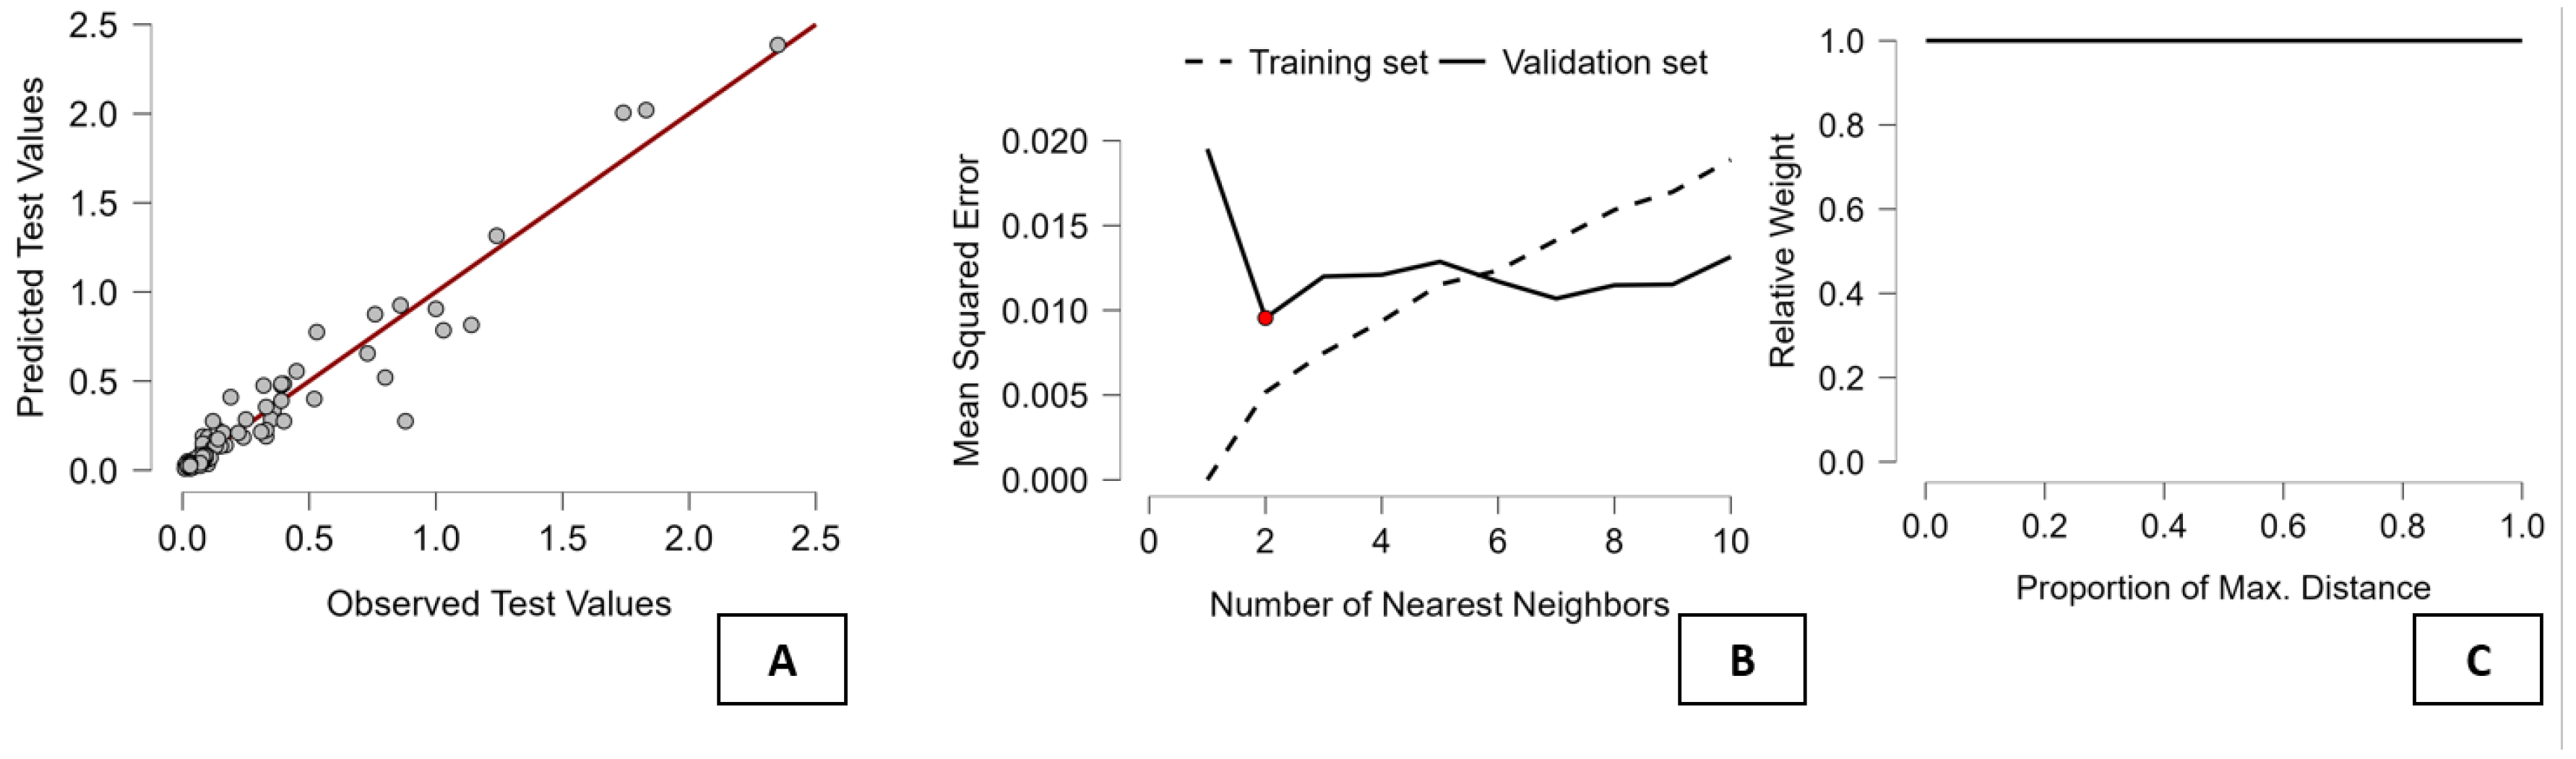
Figure 4.
Random Forest–Based Clustering of the Social (S) ESG Dimension. Note. Panel A shows cluster selection using WSS, AIC, and BIC, supporting a ten-cluster solution. Panel B visualizes compact, well-separated social clusters, indicating that Random Forest effectively captures nonlinear social structures linked to vulnerability, resilience, and geopolitical risk.
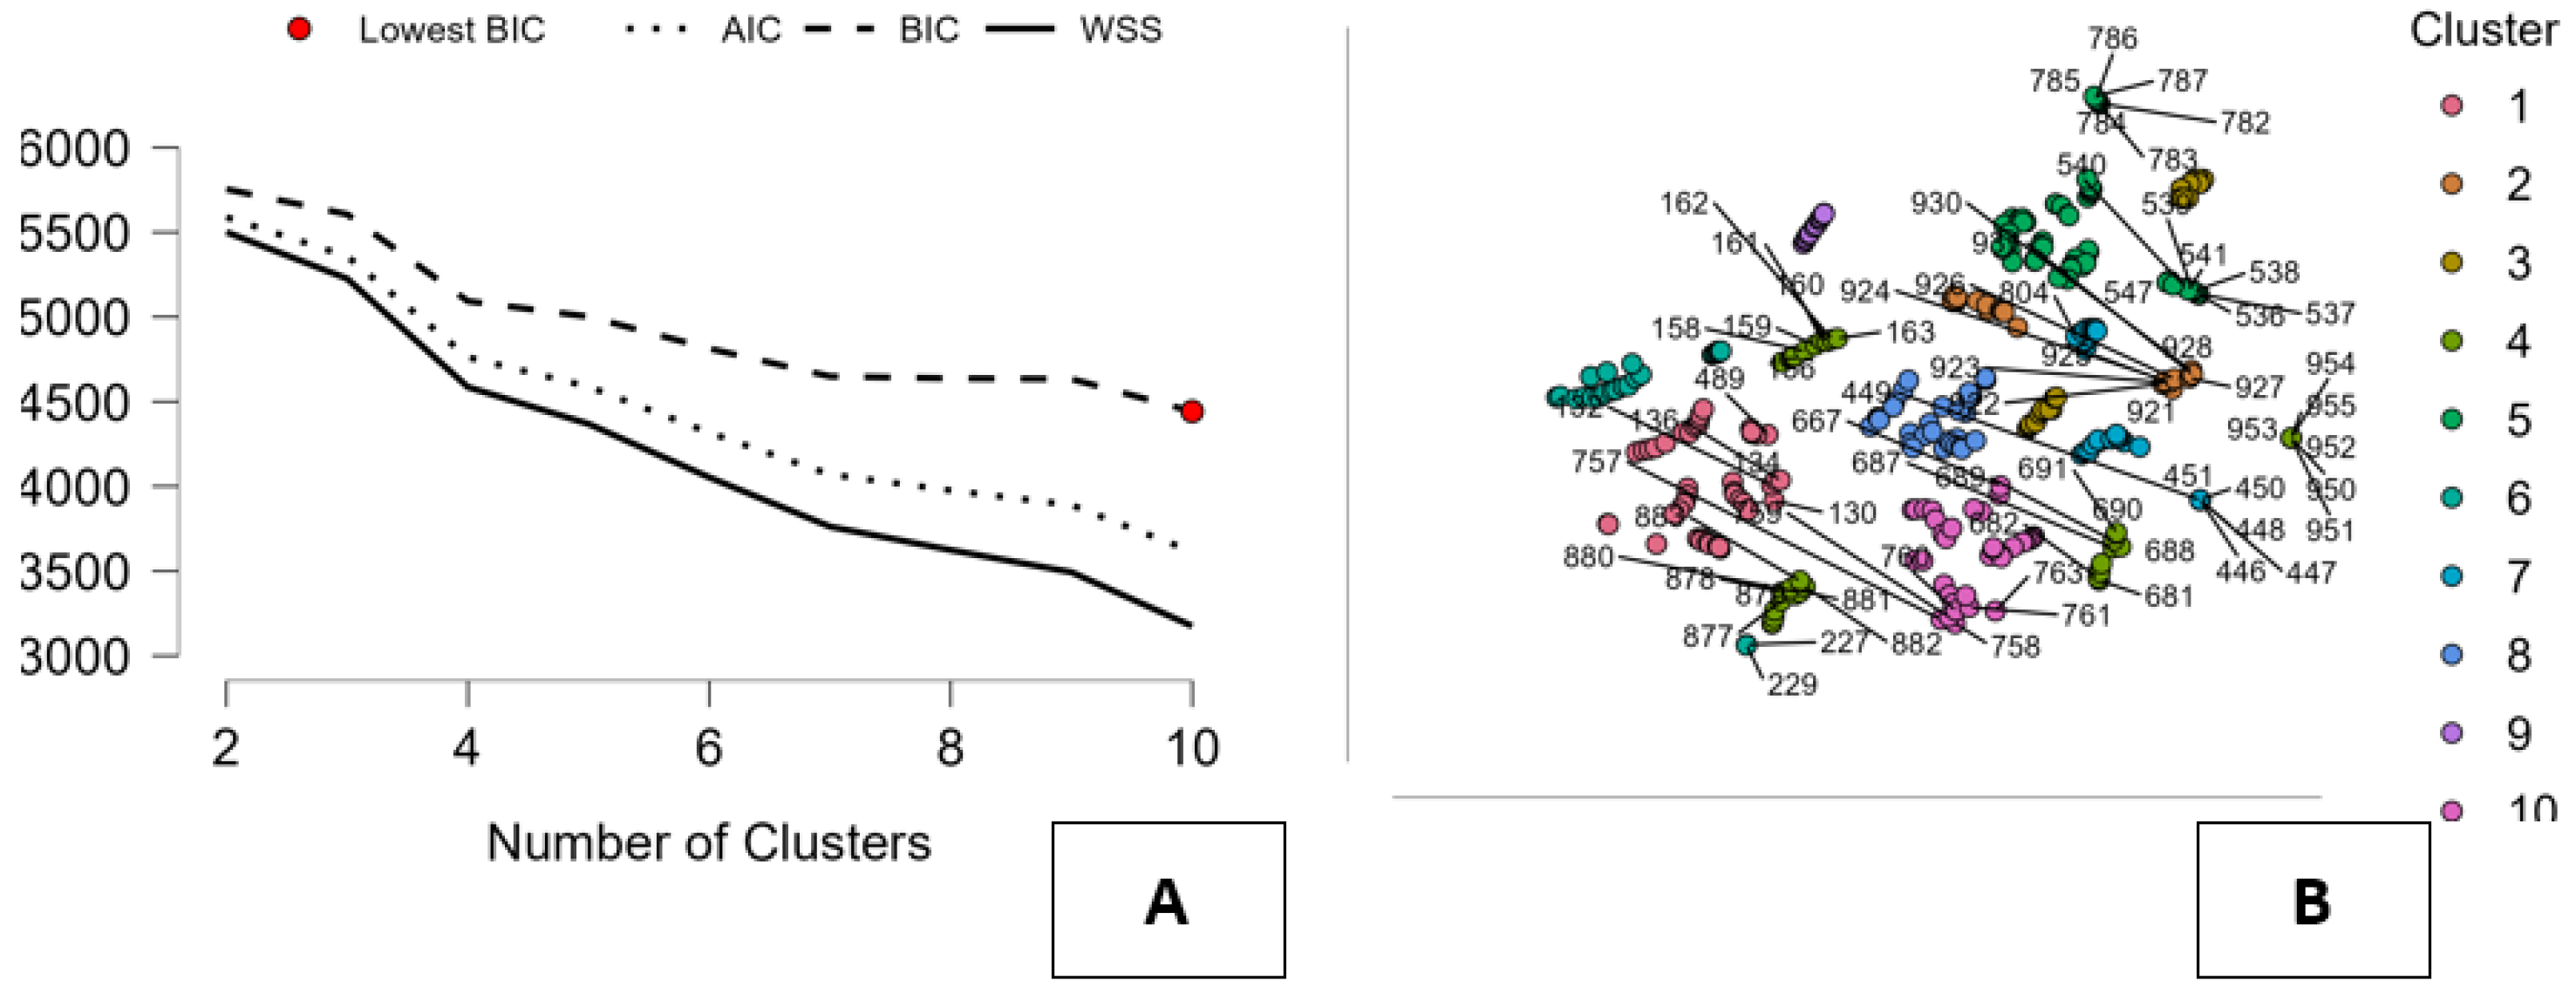
Figure 5.
KNN Model Performance and Neighbor Selection for the Social (S) ESG Dimension. Note. Panel A shows a strong fit between observed and predicted GPR. Panel B illustrates the bias–variance trade-off in KNN, with validation error minimized at a small number of neighbors, supporting localized, nonlinear social drivers of geopolitical risk.
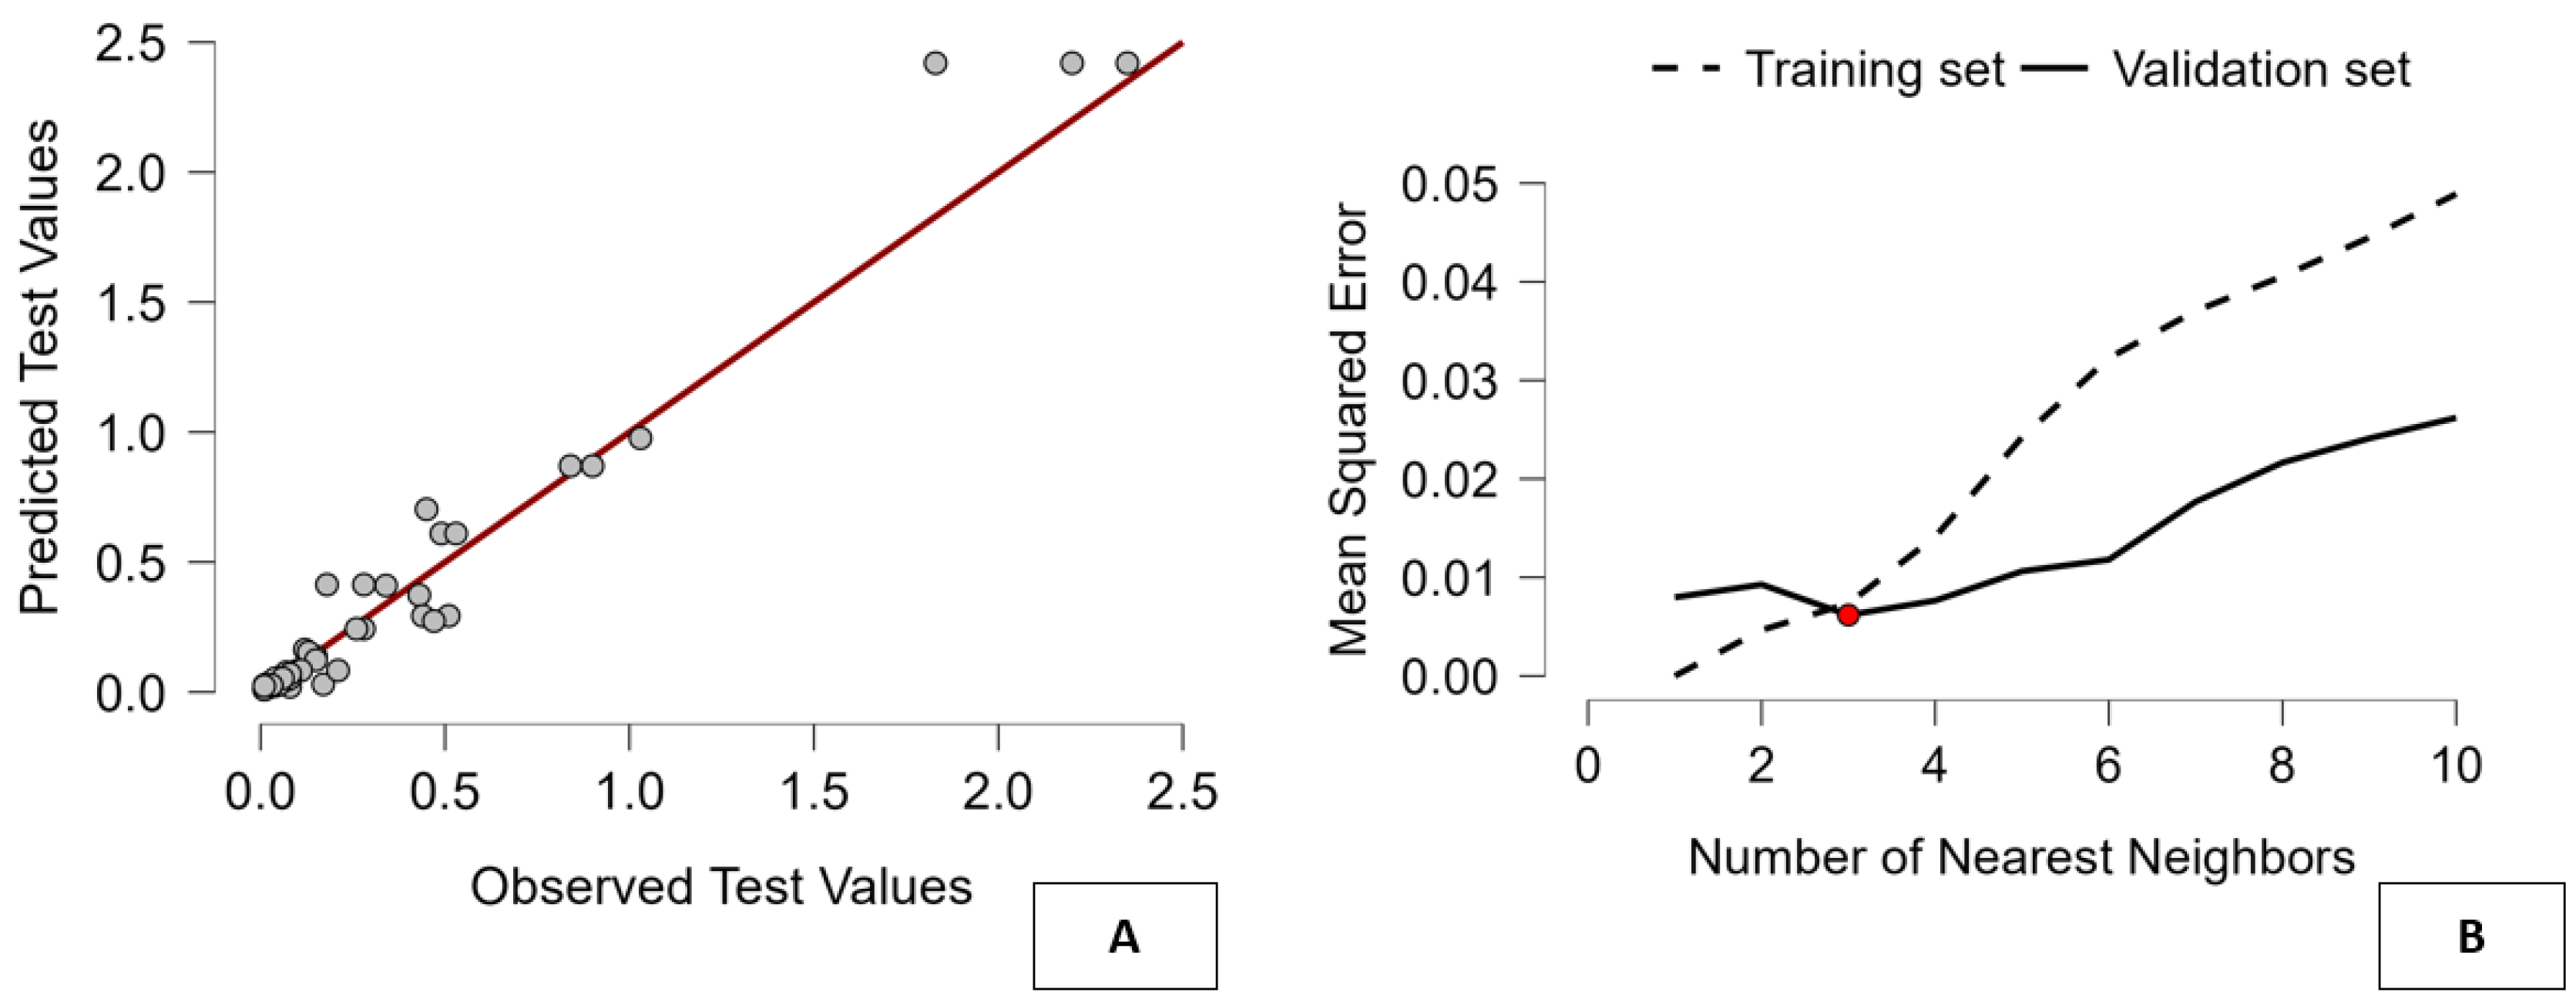
Figure 6.
KNN-Based Clustering of Governance (G) ESG Regimes and Geopolitical Risk. Panel A shows evidence-based cluster selection using WSS, AIC, and BIC. Panel B reveals distinct governance regimes, from high institutional quality to unstable systems. Boundary points highlight countries near regime thresholds, underscoring governance’s nonlinear influence on geopolitical risk.
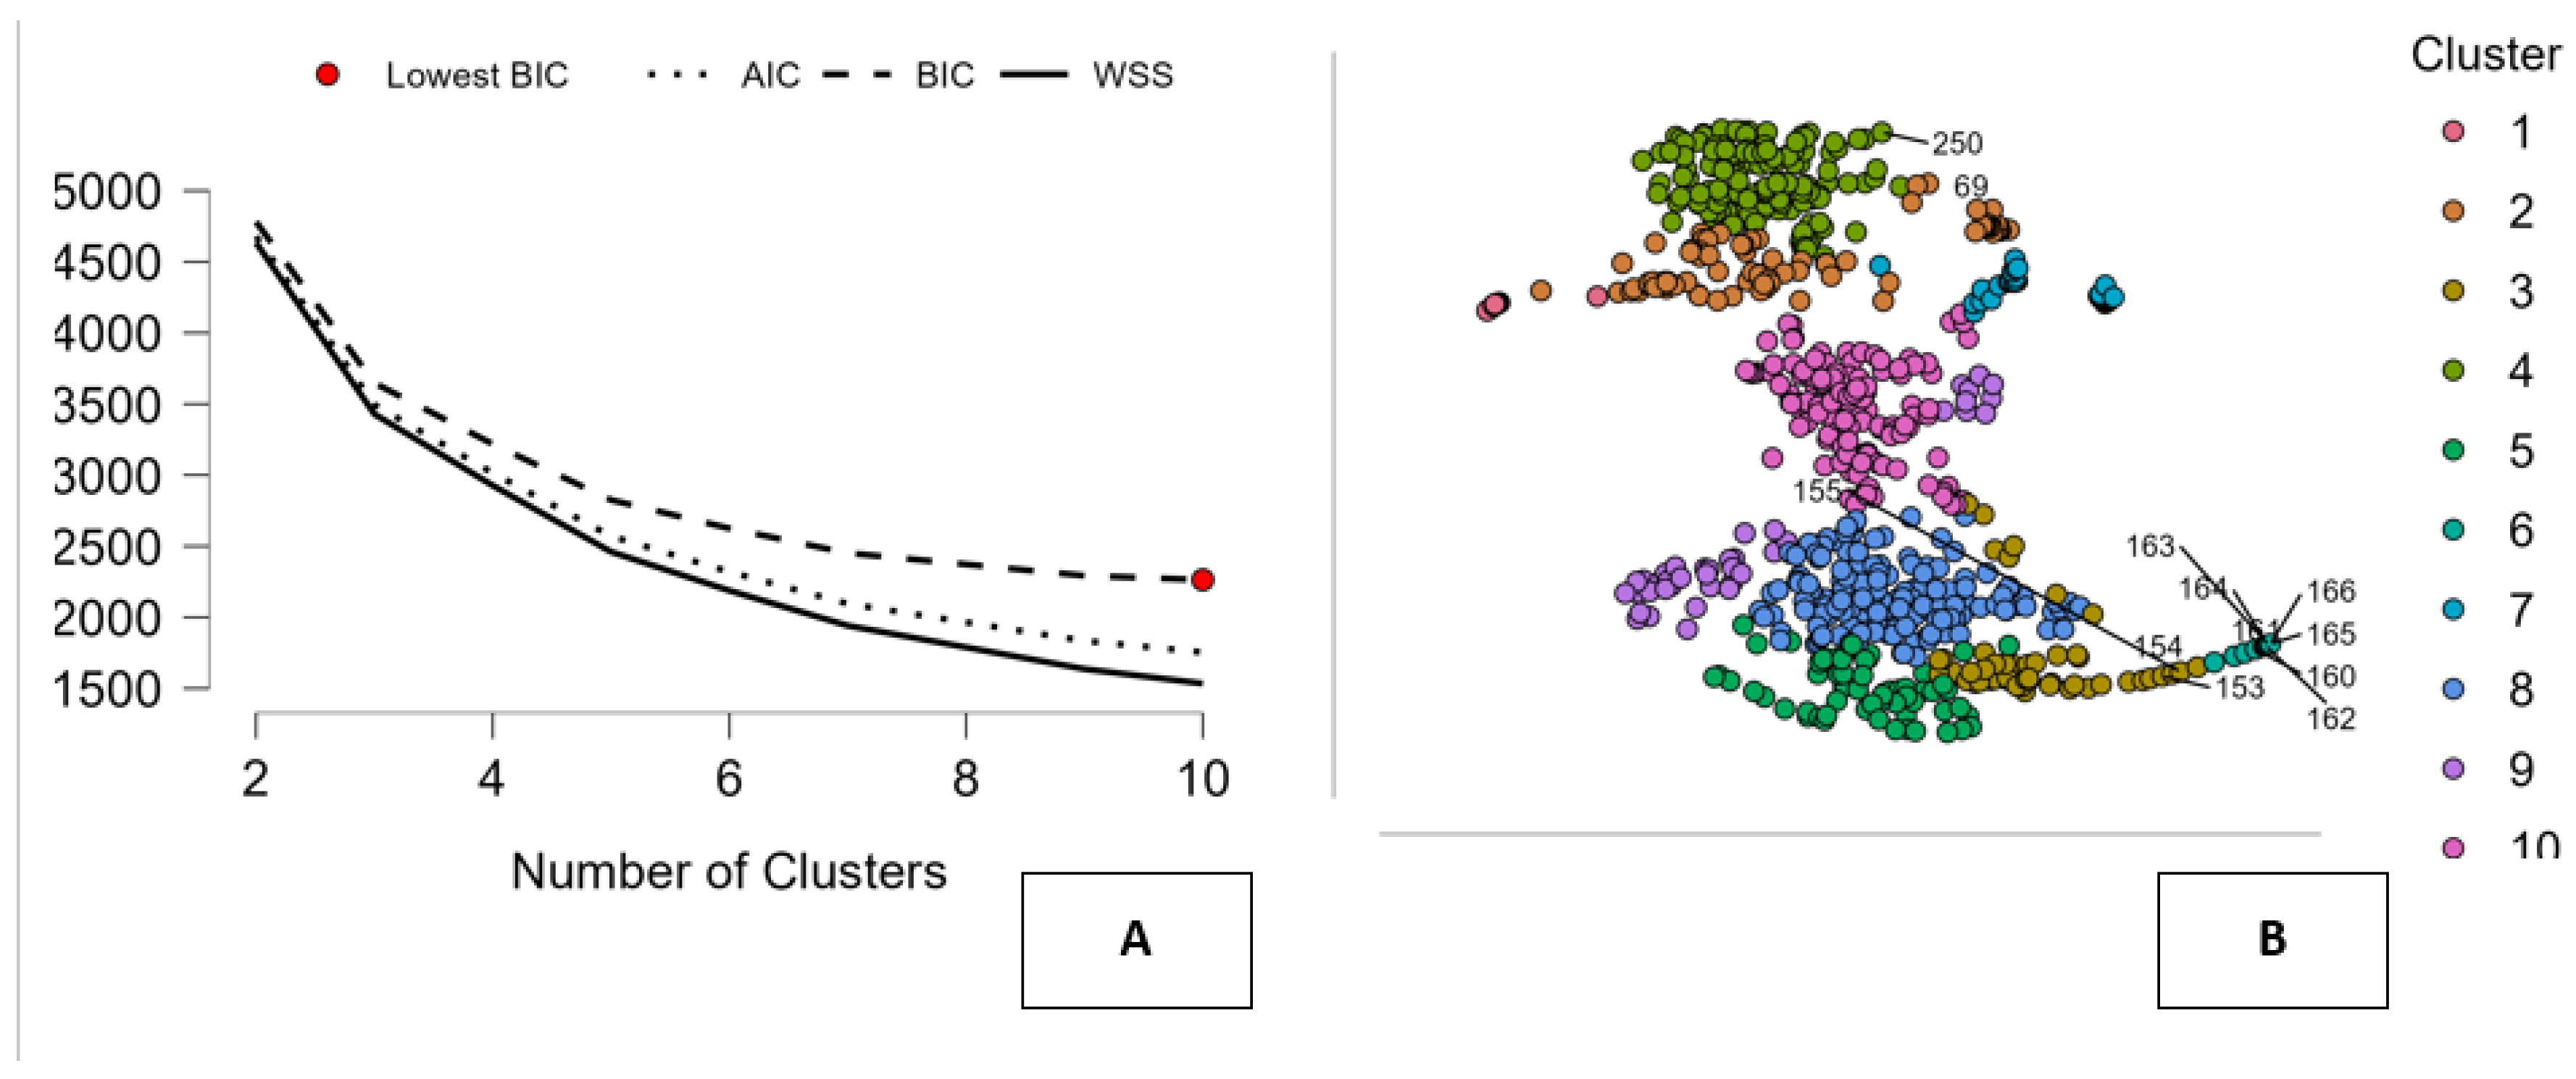
Figure 7.
KNN Model Calibration and Predictive Performance. Note. Panel A compares observed and predicted values, showing strong fit but minor deviations at extremes. Panel B illustrates bias–variance trade-off, with optimal performance at k≈3–4, confirming KNN reliability when appropriately tuned.
Figure 7.
KNN Model Calibration and Predictive Performance. Note. Panel A compares observed and predicted values, showing strong fit but minor deviations at extremes. Panel B illustrates bias–variance trade-off, with optimal performance at k≈3–4, confirming KNN reliability when appropriately tuned.
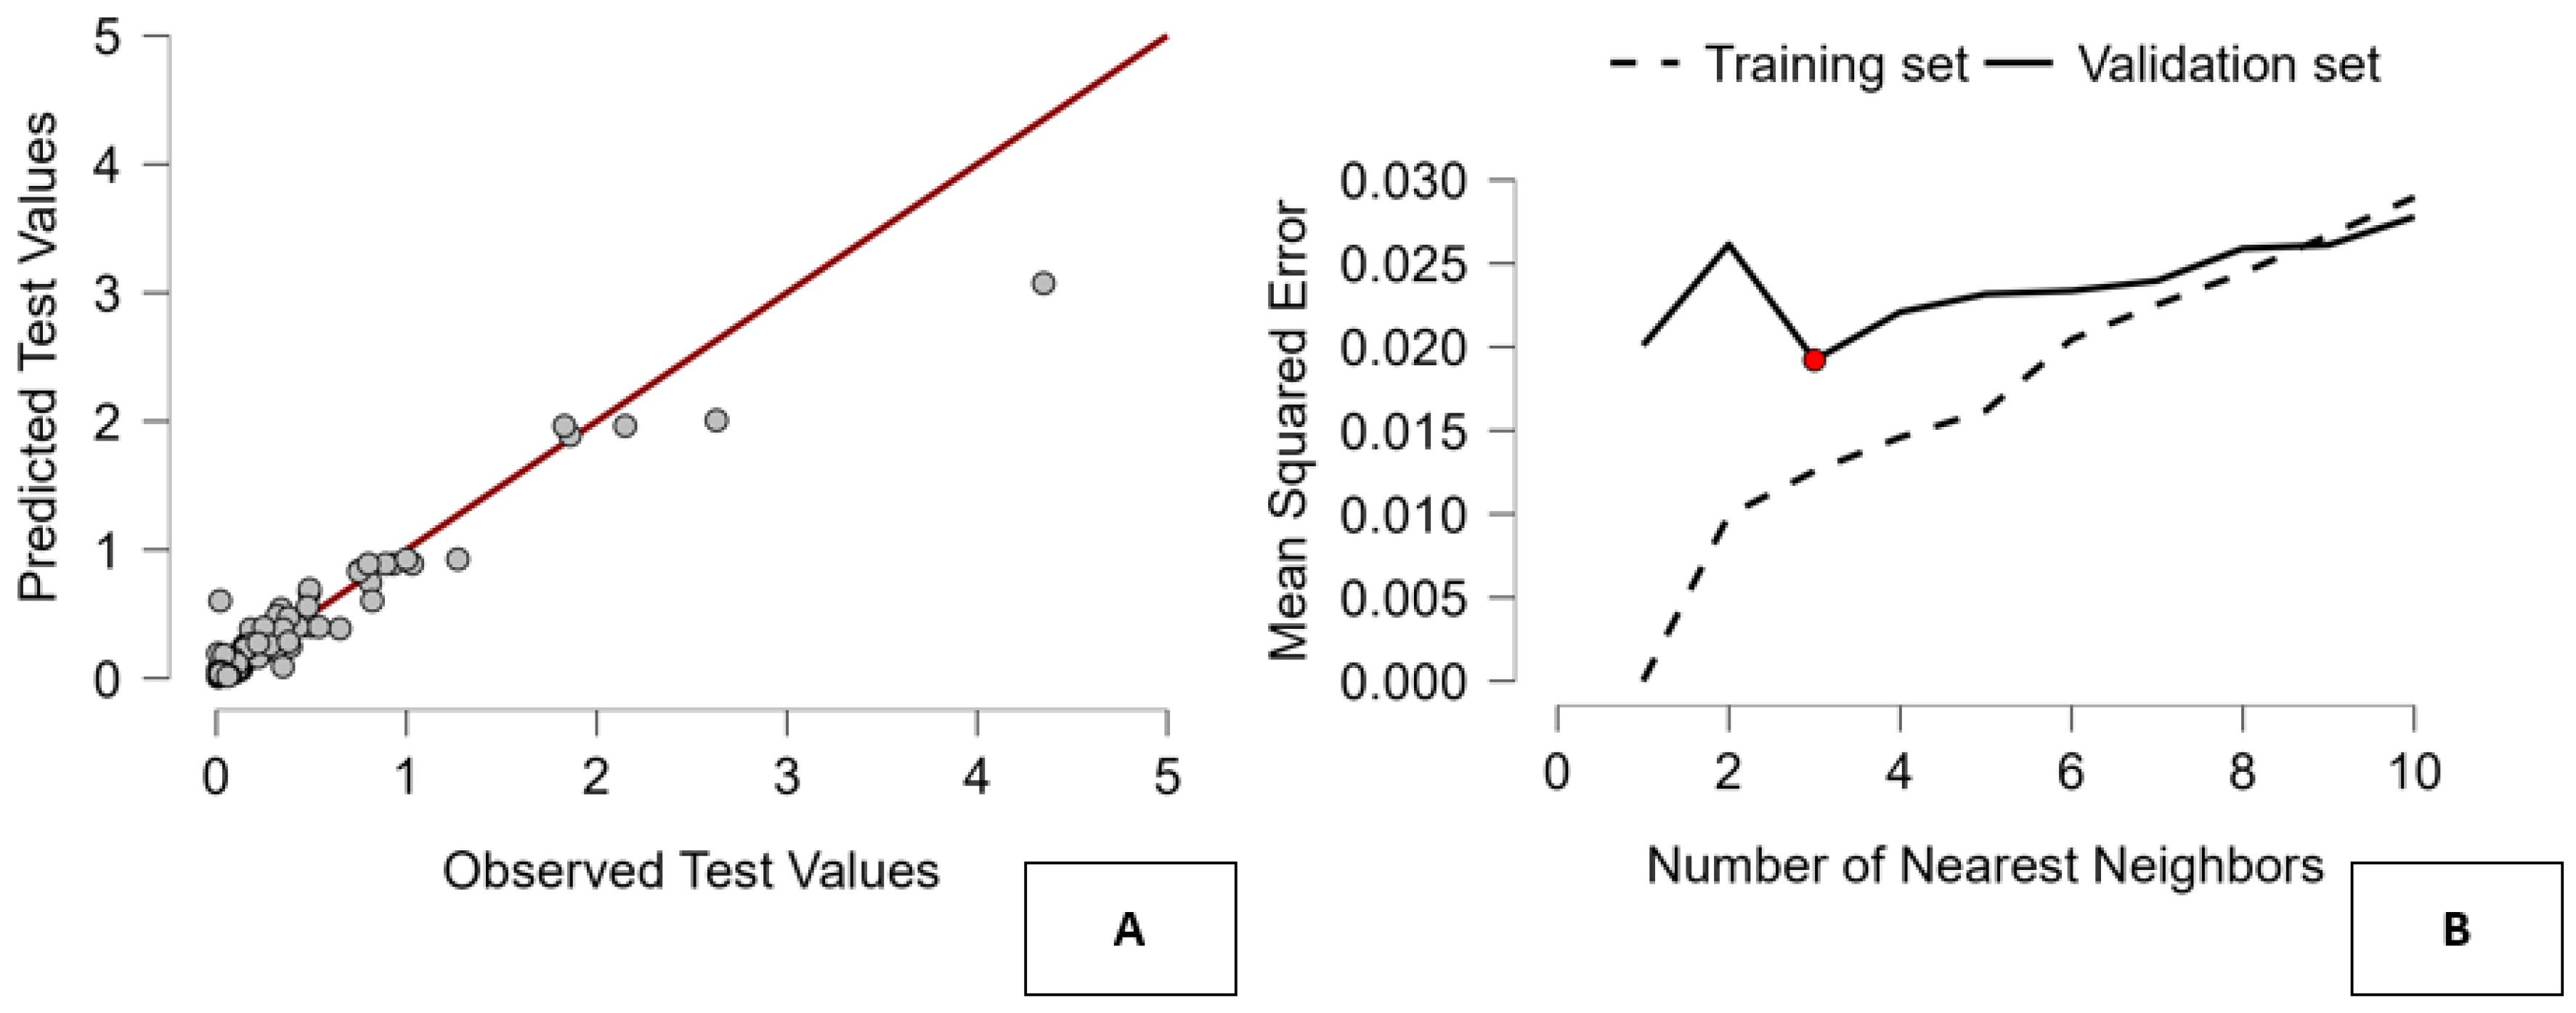
Figure 8.
ESG Pathways to Geopolitical Risk: Environmental, Social, and Governance Channels. Note. The figure summarizes how environmental stress, social fragility, and governance capacity jointly shape geopolitical risk. It illustrates the multidimensional, nonlinear ESG–GPR nexus identified through panel models, clustering, and machine-learning approaches.
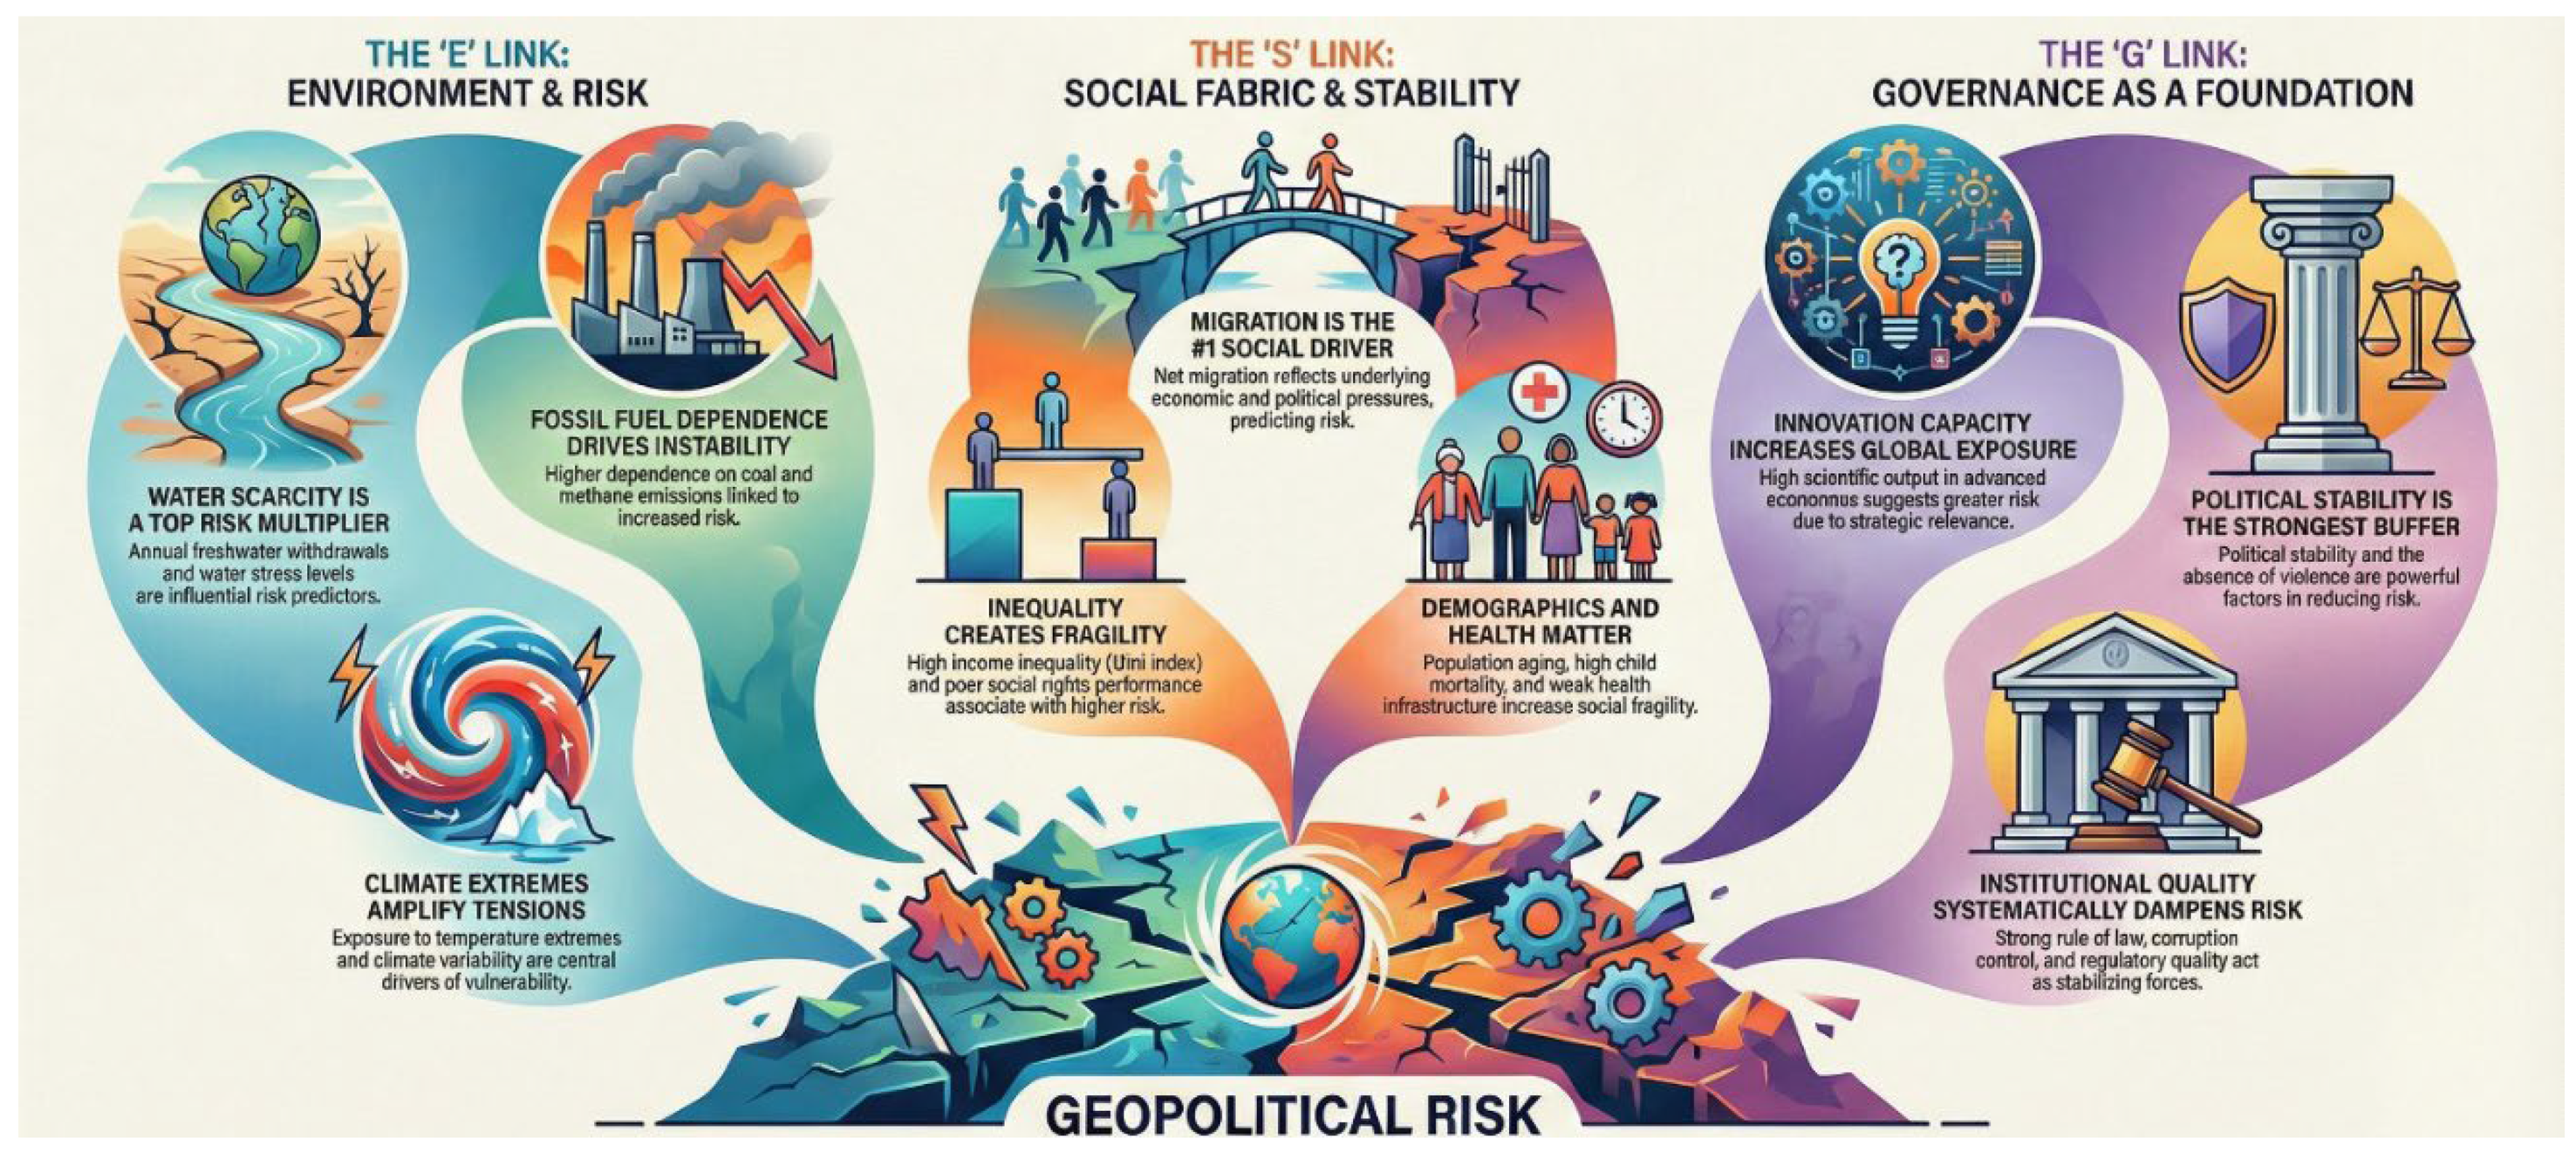
Table 1.
Main Research Streams on Geopolitical Risk and ESG: Themes, Focus Areas, and Key Contributions.
Table 1.
Main Research Streams on Geopolitical Risk and ESG: Themes, Focus Areas, and Key Contributions.
| Macro-theme | Focus | Key Articles |
| Geopolitical Risk, ESG Performance and Sustainability Uncertainty | Examines how geopolitical risk, wars, and global uncertainty affect ESG performance, ESG ratings, sustainability uncertainty, and corporate behavior | Benammar et al. (2026); Boccaletti et al. (2026); Huo & Shi (2025); Guo et al. (2025); Lei et al. (2025); Doğan & Zeren (2025); Sha et al. (2025); Haseeb et al. (2025); Sovbetov (2025); Kuai & Wang (2025); Al Amosh & Khatib (2025); Cheng et al. (2025); Erzurumlu et al. (2025) |
| Financial Markets, ESG Assets and Portfolio Dynamics under Geopolitical Risk | Focuses on ESG indices, green bonds, ETFs, commodities, cryptocurrencies, volatility spillovers, asset allocation, and portfolio resilience during geopolitical shocks | Das et al. (2026); Newaz & Aslam (2025); Shen et al. (2025); Saini et al. (2025); Bouzguenda & Jarboui (2025); Ben Ameur et al. (2025); Gheorghe et al. (2025); Bajra et al. (2025); Karkowska & Urjasz (2025); Cui & Maghyereh (2025); Fabozzi (2025); Soltani & Abbes (2025); Muddasir & Ramon-Llorens (2025) |
| Energy Transition, Climate Risk and Sectoral Resilience | Addresses clean energy, fossil fuels, supply chains, mining, ports, maritime systems, and climate transition under geopolitical and policy uncertainty | Akadiri & Özkan (2026); Özkan et al. (2025); Bai et al. (2025); Hau et al. (2025); Su et al. (2025); Guj & Schodde (2025); Ma et al. (2025); Nagararan et al. (2025); Loukil et al. (2025); Vivoda et al. (2025); Xie et al. (2025) |
| Governance, Institutions, Disclosure and Advanced Methodologies | Explores governance quality, ESG disclosure, regulation, policy uncertainty, AI, machine learning, digital analytics, and methodological innovation | Guenichi et al. (2025); Macpherson & Rimmel (2025); Kharlamova et al. (2025); Barman & Mahakud (2025); Rana et al. (2025); Gupta & Yan (2025); Lin et al. (2025); Pham (2025); Alam et al. (2025); Papathanasiou et al. (2025); Iacoviello (2025); Zambelli (2025); Halim et al. (2025); Bose et al. (2025) |
Note. Table summarizes dominant research streams linking geopolitical risk and ESG, highlighting thematic focuses and representative studies. It organizes literature into coherent macro-themes, clarifying how sustainability, markets, energy transitions, and governance intersect with geopolitical uncertainty globally.
Table 2.
Environmental (E) Variables Used to Analyze the Impact of ESG on Geopolitical Risk.
| Variable | Full name | Description | |
| Y | GPR | Country GPR – Geo Political Risk | Index measuring a country’s geopolitical risk based on the percentage of news articles related to political tensions, conflicts, and instability. |
| X | NRD | Adjusted savings: natural resources depletion | Indicator of the reduction in natural capital due to the extraction of resources such as minerals, energy, and forests, expressed as a share of national income. |
| ECOA | Electricity from coal | Share of total electricity generation produced from coal-fired power plants. | |
| CH4 | Methane emissions | Amount of methane emissions generated by human activities such as agriculture, waste management, and energy production, a gas with high climate impact. | |
| SMDW | Safely managed drinking water | Percentage of the population with access to safely managed and continuously available drinking water services. | |
| REN | Renewable energy consumption | Share of total energy consumption derived from renewable energy sources. | |
| TCL | Tree Cover Loss | Area of forest cover lost over a given period, used as an indicator of deforestation and environmental degradation. |
Note: The table reports the dependent variable and the set of environmental indicators representing the E pillar of ESG. These variables capture natural resource depletion, energy structure, emissions, ecosystem degradation, and access to essential environmental services relevant for explaining geopolitical risk.
Table 3.
Environmental (E) Variables Used to Analyze the Impact of ESG on Geopolitical Risk.
| Dependent variable: | GPR | |||||||||||
| Time-series length | minimum 16, maximum 19 | |||||||||||
| Cross Sectional units | 32 | |||||||||||
| Observation | 600 | |||||||||||
| Models | Random-effects (GLS) |
Fixed-effects |
Pooled OLS |
WLS |
||||||||
| Coefficient | Std. Error | z | Coefficient | Std. Error | t-ratio | Coefficient | Std. Error | t-ratio | Coefficient | Std. Error | t-ratio | |
| const | −1.00*** | 0.20 | −4.84 | −1.30*** | 0.24 | −5.41 | −0.06*** | 0.08 | −0.79 | 0.02 | 0.01 | 1.55 |
| NRD | −0.008** | 0.004 | −2.06 | −0.009** | 0.004 | −2.25 | −0.01** | 0.006 | −3.07 | −0.007*** | 0.001 | −4.28 |
| ECOA | 0.001** | 0.0007 | 2.04 | 0.001** | 0.0007 | 2.03 | 0.001*** | 0.0007 | 2.20 | 0.001*** | 0.0002 | 6.62 |
| CH4 | 0.374*** | 0.04 | 7.74 | 0.45*** | 0.05 | 8.29 | 0.11*** | 0.03 | 3.00 | 0.04*** | 0.01 | 4.27 |
| SMDW | 0.007*** | 0.001 | 3.93 | 0.009*** | 0.002 | 3.91 | 0.002*** | 0.0007 | 3.81 | 0.001*** | 0.0001 | 6.99 |
| REN | 0.005*** | 0.001 | 3.68 | 0.007*** | 0.001 | 4.69 | −0.007*** | 0.001 | −7.01 | −0.004*** | 0.0002 | −14.91 |
| TCL | 3.11675e-08** | 1.50640e-08 | 2.06 | 3.13847e-08** | 1.50946e-08 | 2.07 | 1.02196e-07*** | 2.65296e-08 | 3.85 | 6.11747e-08*** | 1.11685e-08 | 5.47 |
| Statistics | Mean dependent var | 0.21 | Mean dependent var | 0.21 | Mean dependent var | 0.21 | Sum squared resid | 400.54 | ||||
| Sum squared resid | 100.93 | Sum squared resid | 7.07 | Sum squared resid | 67.55 | R-squared | 0.42 | |||||
| Log-likelihood | −316.62 | LSDV R-squared | 0.92 | R-squared | 0.30 | F(6, 593) | 72.26 | |||||
| Schwarz criterion | 678.03 | LSDV F(37, 562) | 193.31 | F(6, 593) | 43.29 | Log-likelihood | −730.13 | |||||
| rho | 0.45 | Log-likelihood | 480.65 | Log-likelihood | −196.17 | Schwarz criterion | 1505.04 | |||||
| S.D. dependent var | 0.40 | Schwarz criterion | −718.22 | Schwarz criterion | 437.13 | S.E. of regression | 0.82 | |||||
| S.E. of regression | 0.41 | rho | 0.45 | rho | 0.92 | Adjusted R-squared | 0.41 | |||||
| Akaike criterion | 647.25 | S.D. dependent var | 0.40 | S.D. dependent var | 0.40 | P-value(F) | 1.73e-67 | |||||
| Hannan-Quinn | 659.23 | S.E. of regression | 0.11 | S.E. of regression | 0.33 | Akaike criterion | 1474.26 | |||||
| Durbin-Watson | 1.03 | Within R-squared | 0.14 | Adjusted R-squared | 0.29 | Hannan-Quinn | 1486.24 | |||||
| P-value(F) | 4.9e-293 | P-value(F) | 6.97e-44 | |||||||||
| Akaike criterion | −885.30 | Akaike criterion | 406.35 | |||||||||
| Hannan-Quinn | −820.26 | Hannan-Quinn | 418.34 | |||||||||
| Durbin-Watson | 1.03 | Durbin-Watson | 0.11 | |||||||||
| Test | 'Between' variance = 0.136124 'Within' variance = 0.0125928 mean theta = 0.92988 Joint test on named regressors - Asymptotic test statistic: Chi-square(6) = 89.4446 with p-value = 3.9518e-17 |
Joint test on named regressors - Test statistic: F(6, 562) = 15.6715 with p-value = P(F(6, 562) > 15.6715) = 1.12878e-16 |
White's test for heteroskedasticity - Null hypothesis: heteroskedasticity not present Test statistic: LM = 396.416 with p-value = P(Chi-square(27) > 396.416) = 2.68196e-67 |
Test for normality of residual - Null hypothesis: error is normally distributed Test statistic: Chi-square(2) = 3049.14 with p-value = 0 |
||||||||
| Breusch-Pagan test - Null hypothesis: Variance of the unit-specific error = 0 Asymptotic test statistic: Chi-square(1) = 3126.34 with p-value = 0 |
Test for differing group intercepts - Null hypothesis: The groups have a common intercept Test statistic: F(31, 562) = 154.929 with p-value = P(F(31, 562) > 154.929) = 1.34555e-252 |
Null hypothesis: No cross-sectional dependence Asymptotic test statistic: z = 4.39143 with p-value = 1.12605e-05 |
Pesaran CD test for cross-sectional dependence - Null hypothesis: No cross-sectional dependence Asymptotic test statistic: z = 9.83327 with p-value = 8.0945e-23 |
|||||||||
| Hausman test - Null hypothesis: GLS estimates are consistent Asymptotic test statistic: Chi-square(6) = 17.1979 with p-value = 0.00858286 |
Distribution free Wald test for heteroskedasticity - Null hypothesis: the units have a common error variance Asymptotic test statistic: Chi-square(32) = 60214.9 with p-value = 0 |
|||||||||||
| Test for normality of residual - Null hypothesis: error is normally distributed Test statistic: Chi-square(2) = 87.8246 with p-value = 8.49441e-20 |
Test for normality of residual - Null hypothesis: error is normally distributed Test statistic: Chi-square(2) = 235.745 with p-value = 6.4377e-52 |
|||||||||||
| Wooldridge test for autocorrelation in panel data - Null hypothesis: No first-order autocorrelation (rho = -0.5) Test statistic: F(1, 31) = 31.1906 with p-value = P(F(1, 31) > 31.1906) = 4.01527e-06 |
Pesaran CD test for cross-sectional dependence - Null hypothesis: No cross-sectional dependence Asymptotic test statistic: z = 11.1264 with p-value = 9.33577e-29 |
|||||||||||
| Pesaran CD test for cross-sectional dependence - Null hypothesis: No cross-sectional dependence Asymptotic test statistic: z = 12.1346 with p-value = 6.92413e-34 |
||||||||||||
Note: The table reports the dependent variable and the set of environmental indicators representing the E pillar of ESG. These variables capture natural resource depletion, energy structure, emissions, ecosystem degradation, and access to essential environmental services relevant for explaining geopolitical risk.
Table 4.
Environmental (E) Variables Used to Analyze the Impact of ESG on Geopolitical Risk.
| Metric | Density Based | Fuzzy C-Means | Hierarchical | Model Based | K-Means | Random Forest | |
| Maximum diameter | 0.326 | 0.500 | 1.000 | 0.000 | 0.837 | 0.674 | |
| Minimum separation | 0.161 | 0.000 | 1.000 | 0.665 | 0.238 | 0.558 | |
| Pearson’s γ | 0.103 | 0.017 | 1.000 | 0.000 | 1.000 | 0.140 | |
| Dunn index | 0.095 | 0.000 | 1.000 | 0.471 | 0.232 | 0.494 | |
| Entropy | 0.000 | 0.822 | 1.000 | 0.997 | 0.943 | 0.601 | |
| Calinski–Harabasz index | 0.653 | 0.000 | 0.816 | 0.001 | 1.000 | 0.509 | |
| HH-Index | 1.000 | 0.585 | 0.000 | 0.219 | 0.055 | 0.743 | |
Note: The table reports the dependent variable and the set of environmental indicators representing the E pillar of ESG. These variables capture natural resource depletion, energy structure, emissions, ecosystem degradation, and access to essential environmental services relevant for explaining geopolitical risk.
Table 5.
Environmental Clusters and Geopolitical Risk (GPR): Cluster-Level Standardized Environmental Indicators.
Table 5.
Environmental Clusters and Geopolitical Risk (GPR): Cluster-Level Standardized Environmental Indicators.
| GPR | ACF | ELEC | NRD | NFD | AGL | AFF | WAT | CO2 | CDD | ECOA | ENI | EINT | ENU | |
| Cluster 1 | 0.384 | -0.701 | 0.760 | -0.667 | -0.009 | 0.476 | 0.014 | -0.412 | 0.346 | 0.284 | 0.470 | -0.666 | -0.093 | 0.705 |
| Cluster 2 | -0.503 | 0.800 | -0.465 | 1.725 | 0.502 | -0.961 | -0.522 | -0.351 | -0.744 | -0.487 | -1.008 | 1.133 | 0.027 | -0.455 |
| Cluster 3 | 0.384 | -0.535 | -1.545 | -0.806 | 0.261 | 0.721 | -0.717 | 0.648 | 0.346 | -1.164 | 1.591 | 0.897 | -1.323 | -0.356 |
| Cluster 4 | 0.272 | 0.306 | 0.622 | -0.564 | -0.504 | -0.342 | 0.865 | 0.703 | 0.241 | 0.327 | -0.484 | -0.706 | 0.215 | -0.405 |
| Cluster 5 | 0.384 | -0.556 | -0.589 | 0.800 | -0.122 | 0.423 | 1.693 | -0.507 | 0.346 | 0.570 | -0.300 | -1.528 | 1.440 | 0.429 |
| Cluster 6 | 0.384 | -0.395 | 0.499 | -0.270 | -0.288 | -0.219 | -0.193 | -0.730 | 0.346 | 0.567 | -0.374 | -0.104 | 0.288 | -0.333 |
| Cluster 7 | 0.384 | -0.545 | -1.061 | -0.199 | -1.081 | 0.874 | 0.663 | 0.419 | 0.346 | 0.598 | 0.492 | 1.596 | 0.606 | 0.137 |
| Cluster 8 | -1.677 | 1.649 | 0.537 | 1.409 | -0.403 | -1.159 | -0.208 | -0.370 | -1.112 | 0.045 | -1.258 | -0.513 | 0.160 | -0.422 |
| Cluster 9 | 0.356 | 0.028 | -1.196 | -0.738 | 3.784 | 1.165 | -0.296 | 2.447 | -0.109 | -0.643 | 0.778 | 0.695 | 0.960 | 1.095 |
| FOR | FOS | HI35 | HDD | LST | WSTR | CH4 | N2O | SMDW | SMSS | PM25 | REN | SPEI | TCL | |
| Cluster 1 | 0.226 | -0.322 | -0.296 | 0.304 | -0.192 | -0.540 | -0.508 | -0.447 | 0.612 | 0.778 | -0.011 | -0.185 | 0.035 | 0.070 |
| Cluster 2 | -1.213 | 0.030 | 1.054 | -0.079 | 1.289 | 1.154 | 0.611 | 0.568 | -0.720 | -1.398 | -0.325 | 0.621 | -0.693 | -0.851 |
| Cluster 3 | 1.548 | -0.350 | -1.626 | 1.560 | -0.197 | 0.071 | -1.365 | 1.449 | 0.633 | 0.398 | 0.622 | 0.261 | -0.673 | -0.793 |
| Cluster 4 | 0.222 | -0.350 | -0.104 | 0.065 | -0.197 | -0.017 | 0.792 | -0.309 | 0.115 | 0.020 | -0.286 | -0.380 | 0.187 | -0.351 |
| Cluster 5 | -1.027 | -0.214 | 1.569 | -0.742 | -0.197 | -0.622 | 0.971 | -0.844 | 0.679 | 0.515 | -0.473 | -0.441 | 4.004 | 3.111 |
| Cluster 6 | -0.414 | -0.349 | 0.471 | -0.541 | -0.164 | -0.635 | -0.323 | -0.104 | 0.479 | 0.187 | -0.330 | -0.391 | -0.073 | 0.169 |
| Cluster 7 | -0.040 | -0.143 | -0.194 | -1.152 | -0.197 | -0.652 | 0.358 | -0.992 | 0.588 | 0.865 | 0.265 | -0.414 | 0.138 | 1.234 |
| Cluster 8 | -1.149 | 1.853 | 1.261 | -0.926 | -0.115 | 0.367 | 0.970 | 0.237 | -2.006 | -1.202 | 0.113 | -0.323 | 0.232 | 0.489 |
| Cluster 9 | 2.375 | -0.348 | -2.065 | -0.376 | -0.197 | 2.147 | -0.295 | -1.005 | -0.744 | -0.789 | 0.400 | 3.221 | -0.683 | -0.822 |
Note: Countries under strong environmental pressure, inefficient energy use, and high climate vulnerability exhibit higher GPR, while environmental sustainability, efficient resource management, and progress in clean energy transition reduce geopolitical risk.
Table 6.
Feature Importance for Explaining the Geopolitical Risk (GPR) Index: Mean Decrease in Gini.
Table 6.
Feature Importance for Explaining the Geopolitical Risk (GPR) Index: Mean Decrease in Gini.
| Feature Importance | Mean decrease in Gini Index | Feature Importance | Mean decrease in Gini Index |
| HDD | 38.579 | ENI | 20.409 |
| LST | 35.864 | NRD | 18.926 |
| ENU | 33.333 | TCL | 18.739 |
| CDD | 30.943 | REN | 18.035 |
| SMDW | 27.971 | CH4 | 17.672 |
| WAT | 26.039 | PM25 | 16.723 |
| AFF | 25.857 | N2O | 15.744 |
| CO2 | 25.358 | FOS | 15.436 |
| WSTR | 24.620 | EINT | 13.549 |
| AGL | 24.450 | ELEC | 13.399 |
| SMSS | 24.095 | HI35 | 11.669 |
| FOR | 22.500 | ECOA | 11.394 |
| ACF | 20.975 | GPR | 9.214 |
| SPEI | 3.726 | NFD | 5.262 |
Note: The table reports feature importance based on the mean decrease in the Gini index from the machine-learning model. Higher values indicate greater explanatory power in predicting the GPR index, highlighting the relative relevance of environmental, energy, and climate-related variables.
Table 7.
Comparative Performance of Machine-Learning Algorithms for Predicting the Geopolitical Risk (GPR) Index.
Table 7.
Comparative Performance of Machine-Learning Algorithms for Predicting the Geopolitical Risk (GPR) Index.
| Metric | Boosting | Decision Tree | KNN | Linear Regression | Random Forest | Regularized Linear | SVM |
| MSE | 0.35 | 0.00 | 1.00 | 0.58 | 0.96 | 0.60 | 0.53 |
| MSE (scaled) | 0.51 | 0.00 | 1.00 | 0.68 | 0.99 | 0.66 | 0.24 |
| RMSE | 0.25 | 0.00 | 1.00 | 0.45 | 0.92 | 0.47 | 0.40 |
| MAE / MAD | 0.14 | 0.25 | 1.00 | 0.12 | 0.85 | 0.00 | 0.23 |
| MAPE | 0.36 | 0.86 | 1.00 | 0.18 | 0.75 | 0.00 | 0.30 |
| R² | 0.43 | 0.00 | 1.00 | 0.64 | 0.98 | 0.61 | 0.22 |
Note: The table compares predictive performance across several algorithms using error and goodness-of-fit metrics. KNN achieves the highest overall accuracy, while Random Forest emerges as the second-best method, showing consistently strong performance and high robustness across metrics. Linear and regularized regression models provide intermediate results with greater interpretability but higher errors. Boosting, Decision Tree, and SVM display weaker performance, with the Decision Tree showing limited generalization ability.
Table 8.
Environmental Feature Importance from the KNN Model Based on Mean Dropout Loss.
| Feature Importance Metrics | Mean dropout loss | Feature Importance Metrics | Mean dropout loss |
| WAT | 0.190 | WSTR | 0.083 |
| N2O | 0.165 | SMSS | 0.082 |
| FOS | 0.110 | NRD | 0.081 |
| SPEI | 0.109 | NFD | 0.079 |
| TCL | 0.109 | ENU | 0.079 |
| REN | 0.099 | HI35 | 0.078 |
| EINT | 0.097 | SMDW | 0.075 |
| ECOA | 0.095 | ACF | 0.075 |
| AFF | 0.092 | ELEC | 0.074 |
| AGL | 0.092 | HDD | 0.074 |
| PM25 | 0.088 | ENI | 0.074 |
| CO2 | 0.087 | LST | 0.074 |
| CH4 | 0.085 | CDD | 0.074 |
| FOR | 0.084 |
Note: The table reports environmental feature importance derived from the KNN model using mean dropout loss. Emissions, land degradation, energy structure, and climate-related risks emerge as key components of the Environmental pillar of ESG, highlighting environmental sustainability as a core determinant of geopolitical risk rather than a purely ecological concern.
Table 9.
Local Environmental Contributions to Predicted Geopolitical Risk (GPR) Across Five Cases.
| Case | Predicted | Base | ACF | ELEC | NRD | NFD | AGL | AFF | WAT | CO2 | CDD | ECOA | ENI | EINT |
| 1 | 0.115 | 0.224 | 0.003 | 0.003 | 0.006 | 4.247×10⁻⁴ | -0.036 | 0.002 | 8.904×10⁻⁴ | 0.004 | 3.699×10⁻⁴ | -0.062 | 0.001 | 0.004 |
| 2 | 0.085 | 0.224 | -8.767×10⁻⁴ | 0.004 | 0.008 | 4.110×10⁻⁵ | -0.033 | -0.003 | -0.011 | 0.003 | 0.002 | -0.003 | 2.055×10⁻⁴ | -0.017 |
| 3 | 0.190 | 0.224 | 0.002 | 0.003 | 0.006 | 0.001 | -0.004 | -0.002 | -0.012 | 0.004 | 0.007 | -0.008 | 5.479×10⁻⁴ | 0.008 |
| 4 | 0.190 | 0.224 | 0.002 | 0.003 | 0.008 | 4.521×10⁻⁴ | -0.012 | 0.003 | 0.011 | -0.001 | 0.009 | -0.028 | 0.001 | 0.009 |
| 5 | 0.185 | 0.224 | 0.002 | 0.005 | 7.123×10⁻⁴ | 0.001 | 0.010 | 3.288×10⁻⁴ | 0.025 | 0.003 | 0.005 | -0.070 | 0.002 | 0.024 |
| ENU | FOR | FOS | HI35 | HDD | LST | WSTR | CH4 | N2O | SMDW | SMSS | PM25 | REN | SPEI | TCL |
| -0.008 | -0.004 | -0.009 | -0.001 | 1.096×10⁻⁴ | -0.005 | -0.031 | -0.019 | 0.017 | 3.151×10⁻⁴ | 0.008 | -0.009 | 0.041 | -0.009 | -0.006 |
| -0.027 | -0.006 | -0.011 | -0.002 | -1.096×10⁻⁴ | 0.004 | -5.479×10⁻⁵ | -0.067 | 0.017 | -6.164×10⁻⁴ | 0.002 | 7.808×10⁻⁴ | 0.018 | -0.010 | -0.007 |
| -0.020 | -0.005 | 0.001 | 1.507×10⁻⁴ | 0.009 | 0.013 | -0.022 | -0.060 | 0.019 | -0.002 | 0.005 | 0.023 | 0.004 | 0.001 | -0.008 |
| -0.008 | 0.013 | -0.019 | -1.644×10⁻⁴ | 0.012 | -0.003 | -0.038 | -0.051 | 0.019 | -0.004 | 0.008 | 0.039 | 0.000 | 0.002 | -0.008 |
| 0.011 | 0.006 | -0.029 | -9.589×10⁻⁵ | 0.002 | 0.004 | -0.008 | -0.075 | 0.019 | -9.315×10⁻⁴ | 0.002 | 0.011 | -0.001 | 0.022 | -0.011 |
Note: Geopolitical risk is shaped by environmental conditions: water security, energy mix, emissions, land use, and climate. In all five cases, predicted GPR falls below baseline, underscoring environmental sustainability as a structural stabilizer of geopolitical risk.
Table 10.
Social (S) ESG Variables Used in the Geopolitical Risk (GPR) Model.
| Variable | Full name | Description | |
| Y | GPR | Country GPR – Geo Political Risk | Index measuring a country’s geopolitical risk based on the percentage of news articles related to political tensions, conflicts, and instability. |
| X | MIG | Net migration | Difference between the number of immigrants and emigrants in a country during a given period, reflecting migration balance and demographic pressure. |
| UNEM | Unemployment | Share of the labor force that is without work but actively seeking employment, indicator of economic and social conditions. | |
| POP65 | Population 65+ | Percentage of the total population aged 65 years or more, used as a measure of population ageing and demographic structure. |
Note: The table defines social variables used to estimate GPR within the ESG framework. Migration, unemployment, and population ageing capture structural social pressures that influence geopolitical risk through demographic dynamics and labor-market conditions.
Table 11.
Panel Regression Results for the Social (S) ESG Component and Geopolitical Risk (GPR).
| Time-series length | minimum 22, maximum 24 | |||||||||||
| Dependent variable | GPR | |||||||||||
| Cross-sectional units | 42 | |||||||||||
| Observations | 1006 | |||||||||||
| Models | Fixed-effects, | Random-effects (GLS) | Pooled OLS | WLS | ||||||||
| Coefficient | Std. Error | t-ratio | Coefficient | Std. Error | z | Coefficient | Std. Error | t-ratio | Coefficient | Std. Error | t-ratio | |
| const | 0.14** | 0.05 | 2.57 | 0.14* | 0.08 | 1.77 | 0.26*** | 0.03 | 7.62 | 0.11*** | 0.01 | 8.90 |
| MIG | 5.84411e-08* | 3.47289e-08 | 1.68 | 8.04722e-08** | 3.43160e-08 | 2.34 | 8.12297e-07*** | 3.67460e-08 | 22.11 | 2.68920e-07*** | 2.60941e-08 | 10.31 |
| UNEM | −0.006** | 0.003 | −2.21 | −0.006** | 0.002 | −2.24 | −0.01*** | 0.002 | −4.03 | −0.003*** | 0.0008 | −4.37 |
| POP65 | 0.01*** | 0.003 | 2.87 | 0.01*** | 0.003 | 2.93 | −0.001 | 0.002 | −0.57 | 0.001 | 0.0007 | 1.40 |
| Statistics |
Mean dependent var | 0.23 | Mean dependent var | 0.23 | Mean dependent var | 0.23 | Sum squared resid | 555.22 | ||||
| Sum squared resid | 38.17 | Sum squared resid | 191.91 | Sum squared resid | 137.30 | R-squared | 0.15 | |||||
| LSDV R-squared | 0.81 | Log-likelihood | −594.13 | R-squared | 0.34 | F(3, 1002) | 60.92 | |||||
| LSDV F(44, 961) | 98.35 | Schwarz criterion | 1215.91 | F(3, 1002) | 177.10 | Log-likelihood | −1128.48 | |||||
| Log-likelihood | 218.08 | rho | 0.42 | Log-likelihood | −425.69 | Schwarz criterion | 2284.63 | |||||
| Schwarz criterion | −125.04 | S.D. dependent var | 0.45 | Schwarz criterion | 879.04 | S.E. of regression | 0.74 | |||||
| rho | 0.42 | S.E. of regression | 0.43 | rho | 0.82 | Adjusted R-squared | 0.15 | |||||
| S.D. dependent var | 0.45 | Akaike criterion | 1196.26 | S.D. dependent var | 0.45 | P-value(F) | 3.48e-36 | |||||
| S.E. of regression | 0.19 | Hannan-Quinn | 1203.73 | S.E. of regression | 0.37 | Akaike criterion | 2264.97 | |||||
| Within R-squared | 0.02 | Durbin-Watson | 1.079 | Adjusted R-squared | 0.34 | Hannan-Quinn | 2272.44 | |||||
| P-value(F) | 0.000000 | P-value(F) | 4.06e-92 | |||||||||
| Akaike criterion | −346.16 | Akaike criterion | 859.39 | |||||||||
| Hannan-Quinn | −262.14 | Hannan-Quinn | 866.86 | |||||||||
| Durbin-Watson | 1.07 | Durbin-Watson | 0.39 | |||||||||
| Statistics | Joint test on named regressors - Test statistic: F(3, 961) = 7.03306 with p-value = P(F(3, 961) > 7.03306) = 0.000111402 |
'Between' variance = 0.159637 'Within' variance = 0.0379519 mean theta = 0.900858 Joint test on named regressors - Asymptotic test statistic: Chi-square(3) = 25.0435 with p-value = 1.51203e-05 |
White's test for heteroskedasticity - Null hypothesis: heteroskedasticity not present Test statistic: LM = 173.839 with p-value = P(Chi-square(9) > 173.839) = 9.77682e-33 |
Test for normality of residual - Null hypothesis: error is normally distributed Test statistic: Chi-square(2) = 5956.9 with p-value = 0 |
||||||||
| Test for differing group intercepts - Null hypothesis: The groups have a common intercept Test statistic: F(41, 961) = 60.8521 with p-value = P(F(41, 961) > 60.8521) = 8.00815e-236 |
Breusch-Pagan test - Null hypothesis: Variance of the unit-specific error = 0 Asymptotic test statistic: Chi-square(1) = 3679.53 with p-value = 0 |
Test for normality of residual - Null hypothesis: error is normally distributed Test statistic: Chi-square(2) = 1800.14 with p-value = 0 |
Pesaran CD test for cross-sectional dependence - Null hypothesis: No cross-sectional dependence Asymptotic test statistic: z = 29.7152 with p-value = 4.88104e-194 |
|||||||||
| Distribution free Wald test for heteroskedasticity - Null hypothesis: the units have a common error variance Asymptotic test statistic: Chi-square(42) = 668171 with p-value = 0 |
Hausman test - Null hypothesis: GLS estimates are consistent Asymptotic test statistic: Chi-square(3) = 21.6305 with p-value = 7.78584e-05 |
Chow test for structural break at observation 22:02 - Null hypothesis: no structural break Test statistic: F(4, 998) = 62.4249 with p-value = P(F(4, 998) > 62.4249) = 4.08276e-47 |
||||||||||
| Test for normality of residual - Null hypothesis: error is normally distributed Test statistic: Chi-square(2) = 1405.14 with p-value = 7.53969e-306 |
Test for normality of residual - Null hypothesis: error is normally distributed Test statistic: Chi-square(2) = 6500.58 with p-value = 0 |
Wooldridge test for autocorrelation in panel data - Null hypothesis: No first-order autocorrelation (rho = 0) Test statistic: t(41) = 25.453 with p-value = P(|t| > 25.453) = 9.68356e-27 |
||||||||||
| Wooldridge test for autocorrelation in panel data - Null hypothesis: No first-order autocorrelation (rho = -0.5) Test statistic: F(1, 41) = 7.32631 with p-value = P(F(1, 41) > 7.32631) = 0.00986009 |
Wooldridge test for autocorrelation in panel data - Null hypothesis: No first-order autocorrelation (rho = -0.5) Test statistic: F(1, 41) = 7.32631 with p-value = P(F(1, 41) > 7.32631) = 0.00986009 |
Pesaran CD test for cross-sectional dependence - Null hypothesis: No cross-sectional dependence Asymptotic test statistic: z = 14.0199 with p-value = 1.1785e-44 |
||||||||||
| Pesaran CD test for cross-sectional dependence - Null hypothesis: No cross-sectional dependence Asymptotic test statistic: z = 38.4238 with p-value = 0 |
Pesaran CD test for cross-sectional dependence - Null hypothesis: No cross-sectional dependence Asymptotic test statistic: z = 37.4161 with p-value = 2.13906e-306 |
|||||||||||
Note: The table reports panel estimates linking social factors to geopolitical risk. Migration, unemployment, and population ageing capture social security pressures affecting stability, indicating that improvements in the ESG Social component can mitigate geopolitical risk in a globalized context.
Table 12.
Comparative Clustering Performance Across Algorithms for the Social (S) ESG Dimension.
| Metric | Density Based | Fuzzy C-Means | Hierarchical | Model Based | k-Means | Random Forest |
| Maximum diameter | 0.01 | 0.58 | 1.00 | 0.00 | 0.80 | 0.74 |
| Minimum separation | 0.07 | 0.00 | 1.00 | 0.56 | 0.20 | 0.56 |
| Pearson’s γ | 0.00 | 0.32 | 1.00 | 0.08 | 0.62 | 0.29 |
| Dunn index | 0.02 | 0.00 | 1.00 | 0.35 | 0.15 | 0.46 |
| Entropy | 0.00 | 0.56 | 1.00 | 0.74 | 0.55 | 0.45 |
| Calinski–Harabasz index | 0.00 | 0.31 | 0.26 | 0.09 | 1.00 | 0.49 |
| HH index | 1.00 | 0.75 | 0.00 | 0.56 | 0.71 | 0.86 |
Note: Random Forest clustering offers the best overall balance between cluster quality and concentration, combining strong separation and compactness with a high HH index, ensuring heterogeneous yet well-balanced clusters without dominance by few groups.
Table 13.
Social (S) ESG Clusters and Geopolitical Risk (GPR): Cluster-Level Standardized Indicators.
Table 13.
Social (S) ESG Clusters and Geopolitical Risk (GPR): Cluster-Level Standardized Indicators.
| GPR | ESR | FER | FPI | GINI | GEDU | HOSP | INC20 | INT | LFP | LEX | |
| Cluster 1 | -0.984 | 0.763 | -0.681 | -0.310 | 1.173 | 1.700 | 0.410 | -0.493 | -0.782 | -1.563 | -0.742 |
| Cluster 2 | 0.735 | -0.196 | 0.587 | -0.089 | 0.029 | -0.213 | -0.053 | 0.795 | -0.556 | 0.151 | 0.831 |
| Cluster 3 | 0.539 | 0.116 | 0.360 | 0.159 | -0.713 | -0.679 | 1.356 | 0.276 | 0.849 | 0.686 | 0.519 |
| Cluster 4 | -0.395 | 0.028 | -0.652 | -0.025 | -0.319 | 0.755 | -0.600 | 1.514 | 0.056 | -0.753 | -0.440 |
| Cluster 5 | 0.909 | -0.084 | 0.889 | 0.016 | -0.237 | -1.067 | 0.379 | -0.476 | -0.198 | 1.128 | 1.037 |
| Cluster 6 | -1.935 | 1.122 | -1.299 | 0.292 | 1.003 | 0.183 | -0.134 | -0.422 | -1.164 | 0.315 | -1.806 |
| Cluster 7 | 0.168 | -0.788 | 0.197 | 0.260 | -0.437 | -0.456 | -0.921 | -0.008 | 1.536 | 0.459 | 0.789 |
| Cluster 8 | -0.054 | -0.946 | 0.164 | -0.605 | -0.164 | -0.808 | -0.453 | -0.403 | 1.278 | 0.767 | -0.494 |
| Cluster 9 | 0.341 | 2.780 | 0.529 | -0.157 | 1.428 | 0.801 | 0.285 | 0.388 | -0.390 | -1.259 | 0.147 |
| Cluster 10 | 0.453 | -1.053 | -0.106 | 0.492 | -0.961 | 0.028 | -0.252 | -0.384 | -0.374 | -0.410 | -0.208 |
| U5MR | MIG | POP65 | PDEN | OVW | UND | WIP | FLFP | PRIM | GPI | UNEM | |
| Cluster 1 | -0.811 | -0.312 | -0.457 | 0.719 | -0.821 | -1.271 | 0.764 | 0.915 | 0.533 | -0.122 | -0.144 |
| Cluster 2 | 0.649 | 0.674 | 0.538 | 0.769 | -0.098 | 0.293 | -0.356 | -0.404 | -0.359 | -0.128 | -0.165 |
| Cluster 3 | 0.692 | -0.465 | -0.125 | -0.572 | 0.808 | 0.627 | -0.128 | -0.504 | -0.359 | 0.310 | 0.468 |
| Cluster 4 | -0.698 | -0.559 | 1.003 | 0.210 | -0.503 | -0.724 | -0.340 | 0.306 | -0.340 | -0.095 | -0.816 |
| Cluster 5 | 0.619 | 0.925 | -0.209 | -0.083 | -0.114 | 0.570 | 0.012 | -0.602 | -0.359 | -0.312 | 1.269 |
| Cluster 6 | -1.628 | -0.724 | -0.553 | -1.653 | 0.334 | -1.534 | 0.766 | 2.112 | 2.665 | -0.745 | -1.032 |
| Cluster 7 | 0.835 | 0.978 | 0.369 | -0.745 | 0.837 | 1.194 | -0.031 | -0.542 | -0.348 | -0.642 | 0.079 |
| Cluster 8 | -0.886 | -0.771 | -0.299 | 0.425 | -0.269 | 0.225 | -0.727 | -0.176 | -0.359 | 0.185 | -1.077 |
| Cluster 9 | 0.794 | 0.020 | -0.284 | 0.358 | 1.816 | -0.775 | -1.164 | -0.504 | -0.359 | -0.173 | -0.420 |
| Cluster 10 | 0.762 | -0.291 | 0.027 | 0.135 | -0.031 | 0.957 | 0.197 | -0.569 | -0.359 | 1.537 | 0.464 |
Note: Clusters with higher labor force participation and female-to-male participation show lower GPR. Social inclusion, equality, health, and education reduce vulnerability, while inequality, exclusion, and demographic stress raise geopolitical risk, confirming GPR’s deep social foundations globally.
Table 14.
Social (S) ESG Clusters and Geopolitical Risk (GPR): Cluster-Level Standardized Indicators.
Table 14.
Social (S) ESG Clusters and Geopolitical Risk (GPR): Cluster-Level Standardized Indicators.
| Feature Importance | Mean decrease in Gini Index | Feature Importance | Mean decrease in Gini Index |
| U5MR | 23.097 | GEDU | 13.975 |
| POP65 | 22.210 | LFP | 13.515 |
| GINI | 21.066 | PDEN | 12.408 |
| ESR | 20.532 | OVW | 12.281 |
| INT | 18.356 | MIG | 11.162 |
| LEX | 18.348 | PRIM | 9.745 |
| INC20 | 17.162 | UNEM | 9.303 |
| FLFP | 16.647 | GPI | 8.590 |
| HOSP | 16.244 | UND | 8.250 |
| FER | 14.986 | GPR | 8.102 |
| WIP | 14.054 | FPI | 6.520 |
Note: Clusters with higher labor force participation and female-to-male participation show lower GPR. Social inclusion, equality, health, and education reduce vulnerability, while inequality, exclusion, and demographic stress raise geopolitical risk, confirming GPR’s deep social foundations globally.
Table 15.
Comparative Predictive Performance of Machine-Learning Models for the Social (S) ESG–GPR Framework.
Table 15.
Comparative Predictive Performance of Machine-Learning Models for the Social (S) ESG–GPR Framework.
| Metric | Boosting | Decision Tree | KNN | Linear Regression | Random Forest | Regularized Linear | SVM |
| MSE | 0.71 | 0.00 | 1.00 | 0.75 | 0.71 | 0.85 | 0.92 |
| MSE (scaled) | 0.00 | — | 1.00 | 0.76 | 0.81 | 0.40 | 0.69 |
| RMSE | 0.52 | 0.00 | 1.00 | 0.56 | 0.52 | 0.68 | 0.78 |
| MAE / MAD | 0.46 | 0.00 | 1.00 | 0.43 | 0.58 | 0.62 | 0.76 |
| MAPE | 0.54 | 0.00 | 1.00 | 0.43 | 0.39 | 0.57 | 0.63 |
| R² | 0.00 | — | 1.00 | 0.70 | 0.78 | 0.28 | 0.59 |
Note: KNN delivers the strongest overall performance, combining the lowest errors with the highest explanatory power. Random Forest shows good fit but weaker error metrics, Linear Regression performs moderately, while Boosting and Decision Tree models display limited explanatory capacity.
Table 16.
Social (S) ESG Feature Importance for Geopolitical Risk (GPR) Based on Mean Dropout Loss.
| Feature Importance Metrics | Mean dropout loss | UND | 0.089 |
| MIG | 0.355 | INC20 | 0.088 |
| PDEN | 0.116 | INT | 0.088 |
| FER | 0.111 | WIP | 0.088 |
| OVW | 0.110 | U5MR | 0.087 |
| UNEM | 0.102 | POP65 | 0.086 |
| FPI | 0.095 | GINI | 0.086 |
| GEDU | 0.094 | ESR | 0.086 |
| HOSP | 0.093 | LFP | 0.085 |
| LEX | 0.090 | FLFP | 0.085 |
| GPI | 0.089 | PRIM | 0.085 |
Note. Social inclusion mitigates geopolitical risk through stronger cohesion. Migration, inequality, population pressure, health, education, and participation emerge as key Social ESG drivers shaping GPR, confirming geopolitical risk as structurally embedded within social systems.
Table 17.
Local Social Contributions to Predicted Geopolitical Risk (GPR) Across Five Cases.
| Case | Predicted | Base | ESR | FER | FPI | GINI | GEDU | HOSP | INC20 | INT | LFP |
| 1 | 0.020 | 0.210 | -0.008 | -0.001 | -0.004 | -0.002 | -0.010 | -6.076×10⁻⁴ | -0.014 | -8.210×10⁻⁵ | -0.009 |
| 2 | 0.020 | 0.210 | 0.007 | 0.010 | -0.013 | 8.210×10⁻⁴ | -0.010 | -1.642×10⁻⁵ | 0.020 | 4.598×10⁻⁴ | -0.017 |
| 3 | 0.077 | 0.210 | -0.004 | -0.012 | -0.035 | 0.000 | 0.002 | -0.011 | 0.005 | -0.001 | -0.018 |
| 4 | 0.163 | 0.210 | -9.852×10⁻⁴ | -0.004 | -0.035 | 0.052 | -0.002 | -0.007 | -0.008 | 0.006 | -0.018 |
| 5 | 0.040 | 0.210 | -0.015 | -4.105×10⁻⁴ | 0.005 | 2.299×10⁻⁴ | -0.027 | 0.002 | 0.003 | -0.116 | -0.026 |
| LEX | U5MR | MIG | POP65 | PDEN | OVW | UND | WIP | FLFP | PRIM | GPI | UNEM |
| -0.006 | 0.000 | -0.041 | 0.005 | -0.020 | -0.017 | 4.433×10⁻⁴ | -0.009 | -0.002 | -0.037 | -0.013 | -3.777×10⁻⁴ |
| 0.015 | 3.284×10⁻⁵ | -0.041 | 0.010 | -0.020 | -0.034 | 8.210×10⁻⁵ | -0.029 | -0.001 | -0.018 | -0.033 | -0.035 |
| -0.002 | 0.001 | -0.041 | -0.009 | 0.037 | -0.014 | 1.314×10⁻⁴ | -0.007 | -0.004 | 5.583×10⁻⁴ | -0.015 | -0.005 |
| 0.001 | 0.002 | -0.041 | 9.852×10⁻⁴ | 0.029 | -0.016 | 8.867×10⁻⁴ | 1.806×10⁻⁴ | 8.210×10⁻⁵ | 9.524×10⁻⁴ | -0.006 | 2.463×10⁻⁴ |
| 0.019 | 1.149×10⁻⁴ | -0.045 | 0.029 | -0.022 | -0.046 | 9.195×10⁻⁴ | 0.141 | -0.011 | -0.055 | -0.010 | 0.003 |
Note. KNN results show GPR is strongly shaped by social conditions. Improvements in education, healthcare, inclusion, and demographic balance consistently reduce GPR, confirming the Social ESG pillar as a core determinant of long-term geopolitical stability.
Table 18.
Governance (G) ESG Variables Used in the Geopolitical Risk (GPR) Model.
| Variable | Full name | Description |
| GPR | Country GPR – Geo Political Risk | Index measuring a country’s geopolitical risk based on the percentage of news articles related to political tensions, conflicts, and instability. |
| COR | Control of Corruption | Indicator measuring the extent to which public power is exercised for private gain, including both petty and grand forms of corruption, and the effectiveness of anti-corruption policies. |
| PSAV | Political Stability | Measure of the likelihood of political instability, government disruption, or violence, including terrorism and social unrest. |
| STJA | Scientific & Technical Articles | Number of scientific and technical journal articles published, used as a proxy for innovation capacity and knowledge development in a country. |
Note. The table defines governance indicators used to assess GPR within the ESG framework. Control of corruption, political stability, and innovation capacity capture institutional quality, highlighting how effective governance structures contribute to lower geopolitical risk and greater resilience.
Table 19.
Governance (G) ESG Panel Regression Results for Geopolitical Risk (GPR).
| Models | WLS | Random-effects (GLS) | Pooled OLS | Fixed-effects | ||||||||
| Time-series length | 22 | |||||||||||
| Dependent variable | GPR | |||||||||||
| Cross Sectional Units | 42 | |||||||||||
| Observations | 924 | |||||||||||
| Coefficient | Std. Error | t-ratio | Coefficient | Std. Error | z | Coefficient | Std. Error | t-ratio | Coefficient | Std. Error | t-ratio | |
| const | 0.02*** | 0.003 | 8.02 | 0.09** | 0.04 | 2.27 | 0.01 | 0.01 | 1.36 | 0.10*** | 0.02 | 3.91 |
| COR | 0.06*** | 0.004 | 12.91 | 0.17*** | 0.0 | 5.55 | 0.13*** | 0.01 | 7.85 | 0.19*** | 0.04 | 4.53 |
| PSAV | −0.09*** | 0.005 | −16.76 | −0.17*** | 0.02 | −7.42 | −0.17*** | 0.02 | −8.33 | −0.17*** | 0.02 | −7.05 |
| STJA | 2.46654e-06*** | 1.32101e-07 | 18.67 | 1.08737e-06 | 1.81757e-07 | 5.98 | 3.21973e-06*** | 1.22395e-07 | 26.31 | 6.24325e-07*** | 1.93110e-07 | 3.23 |
| Statistics | Sum squared resid | 662.83 | Mean dependent var | 0.227771 | Mean dependent var | 0.227771 | Mean dependent var | 0.227771 | ||||
| R-squared | 0.41 | Sum squared resid | 134.2991 | Sum squared resid | 100.7815 | Sum squared resid | 40.81468 | |||||
| F(3, 920) | 217.33 | Log-likelihood | −420.0663 | R-squared | 0.466698 | LSDV R-squared | 0.784022 | |||||
| Log-likelihood | −1157.62 | Schwarz criterion | 867.4474 | F(3, 920) | 268.3671 | LSDV F(44, 879) | 72.51967 | |||||
| Schwarz criterion | 2342.573 | rho | 0.562045 | Log-likelihood | −287.4193 | Log-likelihood | 130.1884 | |||||
| S.E. of regression | 0.848806 | S.D. dependent var | 0.452484 | Schwarz criterion | 602.1535 | Schwarz criterion | 46.91517 | |||||
| Adjusted R-squared | 0.412849 | S.E. of regression | 0.381862 | rho | 0.912620 | rho | 0.562045 | |||||
| P-value(F) | 1.5e-106 | Akaike criterion | 848.1326 | S.D. dependent var | 0.452484 | S.D. dependent var | 0.452484 | |||||
| Akaike criterion | 2323.258 | Hannan-Quinn | 855.5017 | S.E. of regression | 0.330976 | S.E. of regression | 0.215483 | |||||
| Hannan-Quinn | 2330.627 | Durbin-Watson | 0.902322 | Adjusted R-squared | 0.464959 | Within R-squared | 0.078325 | |||||
| P-value(F) | 4.2e-125 | P-value(F) | 1.9e-259 | |||||||||
| Akaike criterion | 582.8386 | Akaike criterion | −170.3769 | |||||||||
| Hannan-Quinn | 590.2077 | Hannan-Quinn | −87.47462 | |||||||||
| Durbin-Watson | 0.439222 | Durbin-Watson | 0.902322 | |||||||||
| Tests | Test for normality of residual - Null hypothesis: error is normally distributed Test statistic: Chi-square(2) = 4120.55 with p-value = 0 |
'Between' variance = 0.0575146 'Within' variance = 0.0464331 theta used for quasi-demeaning = 0.811857 Joint test on named regressors - Asymptotic test statistic: Chi-square(3) = 103.816 with p-value = 2.34904e-22 |
White's test for heteroskedasticity - Null hypothesis: heteroskedasticity not present Test statistic: LM = 192.814 with p-value = P(Chi-square(9) > 192.814) = 1.0606e-36 |
Joint test on named regressors - Test statistic: F(3, 879) = 24.8995 with p-value = P(F(3, 879) > 24.8995) = 1.81499e-15 |
||||||||
| Pesaran CD test for cross-sectional dependence - Null hypothesis: No cross-sectional dependence Asymptotic test statistic: z = 38.6787 with p-value = 0 |
Breusch-Pagan test - Null hypothesis: Variance of the unit-specific error = 0 Asymptotic test statistic: Chi-square(1) = 2314.09 with p-value = 0 |
Distribution free Wald test for heteroskedasticity - Null hypothesis: the units have a common error variance Asymptotic test statistic: Chi-square(42) = 369131 with p-value = 0 |
Test for differing group intercepts - Null hypothesis: The groups have a common intercept Test statistic: F(41, 879) = 31.4992 with p-value = P(F(41, 879) > 31.4992) = 1.21321e-143 |
|||||||||
| Hausman test - Null hypothesis: GLS estimates are consistent Asymptotic test statistic: Chi-square(3) = 39.4114 with p-value = 1.42007e-08 |
Test for normality of residual - Null hypothesis: error is normally distributed Test statistic: Chi-square(2) = 635.197 with p-value = 1.17146e-138 |
Wooldridge test for autocorrelation in panel data - Null hypothesis: No first-order autocorrelation (rho = -0.5) Test statistic: F(1, 41) = 60.9601 with p-value = P(F(1, 41) > 60.9601) = 1.2226e-09 |
||||||||||
| Test for normality of residual - Null hypothesis: error is normally distributed Test statistic: Chi-square(2) = 6213.77 with p-value = 0 |
Pesaran CD test for cross-sectional dependence - Null hypothesis: No cross-sectional dependence Asymptotic test statistic: z = 34.07 with p-value = 2.05168e-254 |
|||||||||||
Note. Results show governance quality reduces geopolitical risk: controlling corruption, political stability, and technological capacity significantly lower GPR. This confirms the ESG framework’s effectiveness and highlights governance as a strategic asset for risk mitigation globally.
Table 20.
Comparative Clustering Performance for the Governance (G) ESG Dimension.
| Metric | Density Based | Fuzzy C-Means | Hierarchical | Model Based | K-Means | Random Forest |
| Maximum diameter | 0.11 | 0.16 | 1.00 | 0.09 | 0.79 | 0.00 |
| Minimum separation | 1.00 | 0.00 | 0.35 | 0.02 | 0.15 | 0.09 |
| Pearson’s γ | 0.63 | 0.20 | 1.00 | 0.00 | 0.40 | 0.07 |
| Dunn index | 1.00 | 0.00 | 0.77 | 0.00 | 0.42 | 0.07 |
| Entropy | 1.00 | 0.11 | 0.58 | 0.00 | 0.09 | 0.21 |
| Calinski–Harabasz index | 0.00 | 0.33 | 0.42 | 0.30 | 1.00 | 0.34 |
| HH Index | 0.00 | 0.89 | 0.64 | 1.00 | 0.95 | 0.88 |
Note. K-Means outperforms alternative clustering methods by combining strong structural quality, high interpretability, and balanced cluster sizes, as indicated by superior Calinski–Harabasz and HH indices, making it the most robust approach for governance-based clustering.
Table 21.
Governance (G) ESG Clusters and Geopolitical Risk (GPR): Cluster-Level Standardized Indicators.
Table 21.
Governance (G) ESG Clusters and Geopolitical Risk (GPR): Cluster-Level Standardized Indicators.
| GPR | COR | GDPG | GOV | PAT | PSAV | REG | RDG | ROL | STJA | VAC | |
| Cluster 1 | 0.748 | -0.175 | 0.879 | 4.779 | 1.385 | 0.263 | 1.043 | 0.903 | 0.948 | 3.847 | 0.615 |
| Cluster 2 | 0.900 | -0.453 | 0.847 | 0.636 | 0.355 | 0.636 | 0.882 | 0.829 | 0.907 | 0.451 | 0.744 |
| Cluster 3 | -0.912 | 1.267 | -0.866 | -0.171 | -0.034 | -0.431 | -0.730 | -1.022 | -0.852 | -0.014 | -1.981 |
| Cluster 4 | 1.337 | -0.263 | 1.271 | -0.366 | -0.261 | 1.144 | 0.756 | 1.153 | 1.218 | -0.278 | 1.051 |
| Cluster 5 | -1.347 | 0.258 | -1.489 | 0.161 | -0.215 | -1.439 | -0.736 | -1.496 | -1.504 | -0.291 | -1.422 |
| Cluster 6 | -0.830 | 1.092 | -0.419 | 0.874 | 7.280 | -0.613 | 0.520 | -1.197 | -0.952 | 4.936 | -2.325 |
| Cluster 7 | 0.120 | 0.253 | 0.476 | 0.258 | 0.174 | -0.628 | 2.265 | 0.436 | 0.375 | -0.191 | 0.173 |
| Cluster 8 | -0.912 | 0.429 | -0.905 | -0.357 | -0.263 | -0.894 | -0.906 | -0.837 | -0.923 | -0.333 | -0.452 |
| Cluster 9 | -0.774 | -2.285 | -0.793 | -0.313 | -0.256 | -0.417 | -0.661 | -0.814 | -0.789 | -0.258 | -0.310 |
| Cluster 10 | 0.041 | 0.070 | 0.054 | -0.387 | -0.238 | 0.480 | -0.441 | 0.268 | 0.161 | -0.276 | 0.357 |
Note. The table reports standardized governance-related indicators across clusters. Variations in corruption control, political stability, institutional quality, and innovation capacity explain substantial cross-cluster differences in GPR, highlighting the non-linear and structural role of governance in shaping geopolitical risk.
Table 22.
Governance (G) ESG Feature Importance for Geopolitical Risk (GPR) Based on Mean Dropout Loss.
Table 22.
Governance (G) ESG Feature Importance for Geopolitical Risk (GPR) Based on Mean Dropout Loss.
| Feature Importance Metrics | STJA | PSAV | RDG | COR | GOV | ROL | REG | GDPG | VAC | PAT |
| Mean dropout loss | 0.489 | 0.371 | 0.183 | 0.170 | 0.164 | 0.159 | 0.157 | 0.156 | 0.152 | 0.150 |
Note. Governance and innovation dominate GPR determination. Political stability and scientific capacity are the strongest drivers, while corruption control and economic growth play secondary roles, confirming the Governance pillar as a key structural determinant of geopolitical risk.
Table 23.
Local Governance Contributions to Predicted Geopolitical Risk (GPR) Across Five Cases.
| Case | Predicted | Base | COR | GDPG | GOV | PAT | PSAV | REG | RDG | ROL | STJA | VAC |
| 1 | 0.040 | 0.231 | -0.013 | -0.108 | -0.013 | -0.008 | 0.175 | -0.113 | -0.022 | 0.003 | -0.081 | -0.010 |
| 2 | 0.040 | 0.231 | -0.040 | -0.004 | -0.061 | -0.005 | 0.164 | -0.098 | -0.004 | -0.040 | -0.086 | -0.017 |
| 3 | 0.020 | 0.231 | -0.044 | -0.001 | -0.036 | -0.006 | 0.143 | -0.101 | -0.009 | -0.039 | -0.093 | -0.024 |
| 4 | 0.090 | 0.231 | 0.018 | -0.018 | -0.014 | -0.008 | -0.050 | 0.005 | -0.004 | 0.010 | -0.088 | 0.006 |
| 5 | 0.080 | 0.231 | 0.018 | -0.010 | -0.017 | -0.014 | -0.050 | 0.008 | 0.002 | -0.012 | -0.087 | 0.010 |
Note. The table decomposes predicted GPR into baseline and governance contributions. Political stability and institutional quality most strongly reduce GPR, while GDP growth and voice and accountability show weaker, second-order effects, confirming governance as a core ESG driver of geopolitical risk.
Table 24.
Integrated ESG Evidence on Geopolitical Risk (GPR) Across Empirical Approaches.
| ESG Component | Panel Data Models | Clustering Analysis | ML Regression Models |
| E – Environment | Environmental variables display a strong and statistically significant impact on GPR. Higher emissions (CO₂, CH₄), fossil fuel dependence, deforestation, and water stress increase geopolitical risk, while renewable energy shows mixed short-term effects. Fixed-effects dominance indicates that environmental risks are deeply embedded in country-specific structural characteristics. | Clustering reveals distinct environmental risk profiles. Clusters characterized by high pollution, climate stress, and resource depletion are consistently associated with higher GPR. Random Forest clustering produces the most balanced and interpretable environmental regimes, highlighting systemic environmental vulnerability as a geopolitical risk multiplier. | ML regressions, particularly KNN, confirm the non-linear relationship between environmental stress and GPR. Water scarcity, climate extremes, emissions, and land degradation emerge as the most influential predictors, indicating that localized environmental pressures strongly affect geopolitical risk dynamics. |
| S – Social | Social indicators show a significant but heterogeneous relationship with GPR. Migration flows, population ageing, inequality, and access to basic services affect geopolitical risk differently across countries. Unemployment and demographic pressures are relevant, but their effects depend on structural and institutional contexts. | Social clustering identifies groups with contrasting vulnerability profiles. Clusters with high inequality, demographic stress, and weak access to services tend to exhibit higher GPR, while socially inclusive clusters show lower risk. Balanced cluster structures suggest that social fragility operates through combined effects rather than isolated indicators. | ML regression highlights the importance of migration, inequality, health outcomes, and education. KNN results indicate strong local and nonlinear effects, confirming that social instability and exclusion are key drivers of geopolitical risk when interacting with other societal factors. |
| G – Governance | Governance variables have a robust and stabilizing effect on GPR. Political stability, rule of law, regulatory quality, corruption control, and government effectiveness significantly reduce geopolitical risk. Innovation-related governance indicators (R&D, scientific output) also play a relevant role, sometimes increasing exposure due to higher global relevance. | Governance clustering separates countries into distinct institutional regimes. Strong-governance clusters are associated with lower GPR, while weak-governance clusters exhibit higher risk. The clustering results confirm that governance quality is a central structural determinant of geopolitical stability. | ML regression models show governance as one of the strongest predictors of GPR. Political stability and institutional quality dominate feature importance rankings. KNN captures nonlinear interactions, revealing that both very strong and very weak governance configurations are associated with distinct geopolitical risk patterns. |
Note. The table synthesizes panel, clustering, and machine-learning evidence, showing that environmental sustainability, social inclusion, and governance quality jointly enhance countries’ ability to resist geopolitical risk, confirming ESG as a strategic framework for risk mitigation.
Disclaimer/Publisher’s Note: The statements, opinions and data contained in all publications are solely those of the individual author(s) and contributor(s) and not of MDPI and/or the editor(s). MDPI and/or the editor(s) disclaim responsibility for any injury to people or property resulting from any ideas, methods, instructions or products referred to in the content. |
© 2026 by the authors. Licensee MDPI, Basel, Switzerland. This article is an open access article distributed under the terms and conditions of the Creative Commons Attribution (CC BY) license (http://creativecommons.org/licenses/by/4.0/).
Copyright: This open access article is published under a Creative Commons CC BY 4.0 license, which permit the free download, distribution, and reuse, provided that the author and preprint are cited in any reuse.


