
Submitted:
22 January 2026
Posted:
23 January 2026
You are already at the latest version
Abstract
Water quality is traditionally assessed using epidemiological, organoleptic, sanitary-toxicological, and radiation criteria. However, recently, increasing evidence points to the need to consider the structure of aqueous solutions, especially when used for therapeutic purposes. In this study, electrophysical methods were used to study aqueous solutions of sodium chloride of varying concentrations, drinking water, mineral water, and seawater. Patterns in the frequency and amplitude changes of a sinusoidal oscillator compared to distilled water were identified. Based on experimental data, the Ks coefficient is proposed for assessing the structure of drinking and mineral waters. It is defined as the ratio of the oscillation amplitude of the generator at its minimum frequency to the oscillation amplitude at its maximum frequency. A theoretical justification for the formation of the structural organisation of aqueous solutions depending on the concentration of dissolved salts is presented, taking into account the presence of associated and "free" water dipoles, as well as the formation of hydrate formations in a liquid medium. The need to account for intermolecular interaction forces involving water dipoles is emphasised.
Keywords:
water structure
; the structure of aqueous solutions
; drinking and mineral waters
; hydration of ions
; forces of intermolecular interaction
1. Introduction
According to established global practice, the suitability of water for drinking and other purposes is assessed according to the following main criteria: epidemiological, organoleptic, sanitary-toxicological, and radiation [1]. However, in recent years, increasing evidence has emerged indicating the need to utilise another criterion—the structure of drinking and mineral water used in various technologies [1,2,3,4].
It has been established that the structure of water and aqueous solutions is determined by interactions occurring in the solution between atoms, molecules, and ions [5,6]. The structure of water, formed by molecules linked by hydrogen bonds, includes various water dipoles—clusters—and “free” (more mobile) dipoles [5,7,8]. According to [9], van der Waals bonds also appear in liquid water, which contribute to the formation of water structure. At the same time, the continuous formation and destruction of water molecule associations—clusters—occurs in water and its solutions.
Dielectrometry has previously been used to evaluate the structure of water, its aqueous solutions, and drinking and mineral waters [10]. During experiments, the liquids being studied were placed in a measuring cell (Figure 1), which contains a standard glass test tube with a diameter of 20 mm and a length of 200 mm, containing two capacitor plates. Based on the obtained results, the Ks criterion was proposed, which allows for the evaluation of the ratio of water dipole mobility at different frequencies.
However, the surface material of the above-mentioned measuring cell significantly influences the properties of water and water-containing systems (the effect of the near-wall layer) [11]. Given the above data, for studies with distilled water and water-containing systems, it is advisable to use measuring cells in which the capacitor plates are located 5 to 10 cm apart and more than 1 cm from the tank walls [11,12].
In recent years, studies have appeared that utilise a method for assessing structural changes in water and aquatic systems, in which a measuring cell is connected in parallel with the inductance of a sine-wave generator’s oscillatory circuit [13,14]. This method determines the change in the amplitude and frequency of the sine-wave generator’s oscillations under various influences, and also evaluates the dynamics of the electrical capacitance and active resistance of the equivalent electrical circuit of the measuring cell.
This review aims to show the possibilities of new methods for the estimation of the structure of drinking and mineral waters.
2. Materials and Methods
The studies were conducted using measuring cells, a non-destructive and reproducible method for assessing the structure of water and water-containing systems, and data from [11,12,13,14,15,16]. These studies used distilled water with a specific conductivity of 1.2–1.4 μS/cm, as well as aqueous solutions of sodium chloride in concentrations from 1.10-6 M to 1.10-1 M. The liquids under study were placed in a rectangular measuring cell with dimensions of 7x7x13 cm, on opposite walls of which two capacitor plates made of non-magnetic material, isolated from the liquid, were placed, each of which had an area of 60 cm2 (Figure 1).
The measuring cell was connected in parallel with the inductance of the oscillatory circuit of the sinusoidal oscillator according to the method [15,16]. The change in the amplitude and frequency of the oscillations of the sinusoidal oscillator, as well as the electrical capacitance and active resistance of the equivalent electrical circuit of the measuring cell, were determined (Figure 2)
In the first series of experiments, at a liquid temperature of 20 °C, the effect of increasing the concentration of sodium chloride solution from 1.10-6 to 1.10-1 M on the amplitude and frequency of generator oscillations was assessed. Using distilled water, the generator frequencies (initial frequencies) were f1 - 3.62 + 0.02 kHz; f2 - 10.03 + 0.01 kHz; f3 - 32.38 + 0.01 kHz; f4 - 117 + 0.05 kHz; f5 - 327.87+ 0.10 kHz and f6 - 1142.70 + 0.33 kHz.
In the second series of experiments, the influence of drinking water (Fiji, Rogla, Yana), mineral water (DonatMg) and sea water from the Adriatic Sea with a mineralisation of 0.317, 0.348, 0.478, 14 and 37 g/liter, respectively, on the amplitude and frequency of oscillations of the generator was assessed.
Considering that the differences between the studied liquids increase with increasing reactive current frequency [10], generator frequencies of up to 1 MHz were used in the work.
To identify the differences between the studied liquids, a coefficient for assessing their structure (Ks) was proposed, which was calculated as the ratio of the amplitude of the generator oscillations at the minimum frequency – f1 to the amplitude of the oscillations at the maximum frequency of the generator – f6.
3. Results of Research
3.1. Changes in the Frequency and Amplitude of Generator Oscillations with Increasing Concentration of Aqueous Solutions of Sodium Chloride
The effect of increasing the concentration of sodium chloride solutions on the change in frequency (f1, f2, f3, f4, f5 and f6) and the amplitude of generator oscillations at a liquid temperature of 20 °C is shown in [16], Figure 3 and Figure 4.
With an increase in the concentration of sodium chloride solutions from 1.10-6 M to 1.10-1 M, all initial frequencies of sinusoidal oscillations of the generator (f1, f2, f3, f4, f5 and f6) compared to distilled water monotonically decreased (Figure 3) by 1.5%, 5.4%, 10.8%, 15.5%, 15.4% and 14.3%, respectively (P<0.001 in all cases). A more pronounced decrease in the frequency of oscillations of the generator was at high frequencies (f4, f5 and f6) and, obviously, indicated that with an increase in the concentration of solutions, the destruction of the cluster structure of distilled water occurs [6]. As a result, the number of “free” dipoles of water, which rotate in an alternating electric field at higher frequencies, increases, the electrical capacitance of liquids increases and, accordingly, the frequency of oscillations of the generator decreases.
With an increase in the concentration of sodium chloride solutions from 1.10-6 M to 1.10-1 M, the amplitude of the generator oscillations (Figure 4) at frequencies f1, f2, f3, f4, f5 and f6, compared to distilled water, increased by 2.9%; 75.4%; 286%; 21%; 1.2% and 9%, respectively (P<0.001 in all cases). At the same time, at frequencies f1 and f2, with an increase in the concentration of sodium chloride solution to 1.10-1 M, the amplitude of oscillations increased monotonically, and at frequencies f3, f4, f5 and f6, with an increase in the concentration of sodium chloride solution, the amplitude of the generator oscillations, compared to distilled water, initially decreased and then increased.
It should be noted that at frequencies f3 and f5 in the experiments with distilled water and at a sodium chloride solution concentration of 1.10-6 M, 1.10-5 M and 1.10-4 M, there were pronounced local minima. At frequency f3 and a solution concentration of 1.10-5 M, the oscillation amplitude decreased to 15.6%, and at frequency f5 and a concentration of 1.10-4 M, the oscillation amplitude decreased to 7.6%. With an increase in the sodium chloride solution concentration to 1.10-3 M and 1.10-2 M, local minima at frequencies f3 and f5 were not observed (P<0.001 in these cases). Only at a solution concentration of 1.10-6 M was a slight local decrease in the amplitude to 78%.
According to [16], the presence of the above-mentioned local minima at frequencies f3 and f5 in experiments with distilled water and at sodium chloride concentrations of 1.10-6 M, 1.10-5 M and 1.10-4 M obviously indicates a decrease in the quality factor of the oscillatory circuit at these frequencies, caused by a decrease in the mobility of water dipoles. These minima in distilled water are probably due to a significant number of water dipoles in it being in clusters [6,7]. In sodium chloride solutions, there is an increase in the number of “free” water dipoles and a decrease in the size of water clusters [6], in which, obviously, the expression of the bonds between water dipoles increases and, accordingly, their mobility decreases
The absence of the aforementioned minima at frequencies f3 and f5 as the sodium chloride solution concentration in the measuring cell increases from 1 x 10⁻³ M to 1 x 10⁻² M likely occurs due to an increase in the number of “free” water dipoles (which have greater mobility) and water dipoles located in hydrate formations in the region of distant hydration. Moreover, the total mobility of water dipoles increases with increasing sodium chloride solution concentration at all frequencies studied, resulting in a further decrease in frequency and an increase in the amplitude of the generator’s sinusoidal oscillations.
In evaluating the literature data on structural changes in water under various influences, it should be noted that, according to [17], water can exist in several structural states depending on the concentration of the sodium chloride solution and the temperature of the solution. The transition from one state to another occurs with an increase in the concentration of the solution or its temperature. Taking into account the obtained results and these literature data, it can be assumed that with a stepwise increase in the concentration of the sodium chloride solution to 1.10-4 M, the presence of local minima on the oscillation amplitude curves at frequencies f3 and f5 may be associated with the presence of structural formations in water (“water I” and “water II” according to [18]), which change relatively discretely with an increase in the concentration of the sodium chloride solution.
3.2. Changes in the Frequency and Amplitude of Generator Oscillations When Exposed to Drinking and Mineral Waters
When exposed to drinking and mineral waters (Fiji, Rogla, Jana, DonatMg, sea water), the differences between them at each frequency (f1, f2, f3, f4, f5 and f6) did not exceed 1.5%. The influence of drinking and mineral waters on the amplitude of generator oscillations was more pronounced and is shown in Figure 5.
It turned out that the differences between the minimum and maximum values of the generator oscillation amplitude at each frequency were f1, f2, f3, f4, f5 and f6 were 0.22%; 0.32%; 3.99%; 5.7%; 138% and 325.4%. More pronounced differences in the decrease in amplitude between the waters were at a high frequency (f6).
3.3. Changes in the Electrical Capacitance and Active Resistance of the Equivalent Electrical Circuit of a Measuring Cell with Increasing Concentration of Sodium Chloride Solutions and When Exposed to Drinking and Mineral Waters
With an increase in the concentration of sodium chloride solutions from 1.10-6 to 1.10-1 M, the electrical capacitance of the equivalent electrical circuit of the measuring cell at frequencies f1, f2, f3, f4, f5 and f6 increased by 6.3%; 44.7%; 112%; 153%; 164% and 153%, respectively (Figure 6) [16]. These changes were several times greater than the above-mentioned frequency changes.
With an increase in the concentration of sodium chloride solutions from 1.10-6 to 1.10-1 M, the active resistance of the equivalent electrical circuit of the measuring cell at frequencies f1, f2, f3, f4 and f5 increased by 558%; 1080%; 1063%; 453%; 98.8%, and at frequency f6 the active resistance decreased by 61.5% [16]. These changes were also several times greater than the above-mentioned amplitudes of the generator oscillations.
It should be noted that the above-mentioned changes in the generator’s oscillation frequency with increasing sodium chloride solution concentration correlate with changes in the equivalent circuit’s capacitance at all frequencies used (f1, f2, f3, f4, f5, and f6). The correlation coefficient ranges from 0.95 to 0.99 (P < 0.001). This allows us to conclude that the equivalent circuit’s capacitance adequately reflects changes in the generator’s oscillation frequency and, consequently, the electrical capacitance of sodium chloride solutions.
The above-noted changes in the generator oscillation amplitude with increasing sodium chloride solution concentration correlate with changes in the active resistance of the equivalent circuit at frequencies (f1–f6). The correlation coefficient ranges from 0.82 to 0.97 (P<0.001 and P<0.05). This allows us to conclude that the equivalent circuit resistance adequately reflects the change in the generator oscillation amplitude when a measuring cell with water-containing systems is included in the oscillatory circuit and indicates a change in the mobility of water dipoles. The correlation data are consistent with the results of [16].
3.4. Evaluation of Changes in the Coefficient Ks for Assessing the Structure of Aqueous Solutions of Sodium Chloride, Drinking and Mineral Waters
Taking into account the above-obtained changes in the frequency and amplitude of the sinusoidal oscillation generator, as well as the data from [10], the coefficient Ks was proposed for assessing the structure of drinking and mineral waters, which was calculated as the ratio of the amplitude of the generator oscillations at the minimum frequency – f1 to the amplitude of the oscillations at the maximum frequency of the generator – f6. The change in the value of the coefficient Ks with an increase in the concentration of the sodium chloride solution in the measuring cell is shown in Figure 7.
It turned out that in distilled water and at NaCl concentrations of 1.10-6 M, 1.10-5 M and 1.10-4 M, the values of the Ks coefficient were 1.22, 1.24, 1.31 and 1.99, respectively (Figure 6). At a concentration of 1.10-3 M, the Ks coefficient had a maximum value of 9.68. This means that the mobility of water dipoles at frequencies f1 and f6 at low NaCl concentrations does not differ significantly, but increases many times over with an increase in the solution concentration to 1.10-3 M. With an increase in the concentration of calcium chloride to 10−2 and 10−1 M, the Ks values were 1.85 and 1.15, respectively. The indicated changes in Ks are consistent with the results of [10].
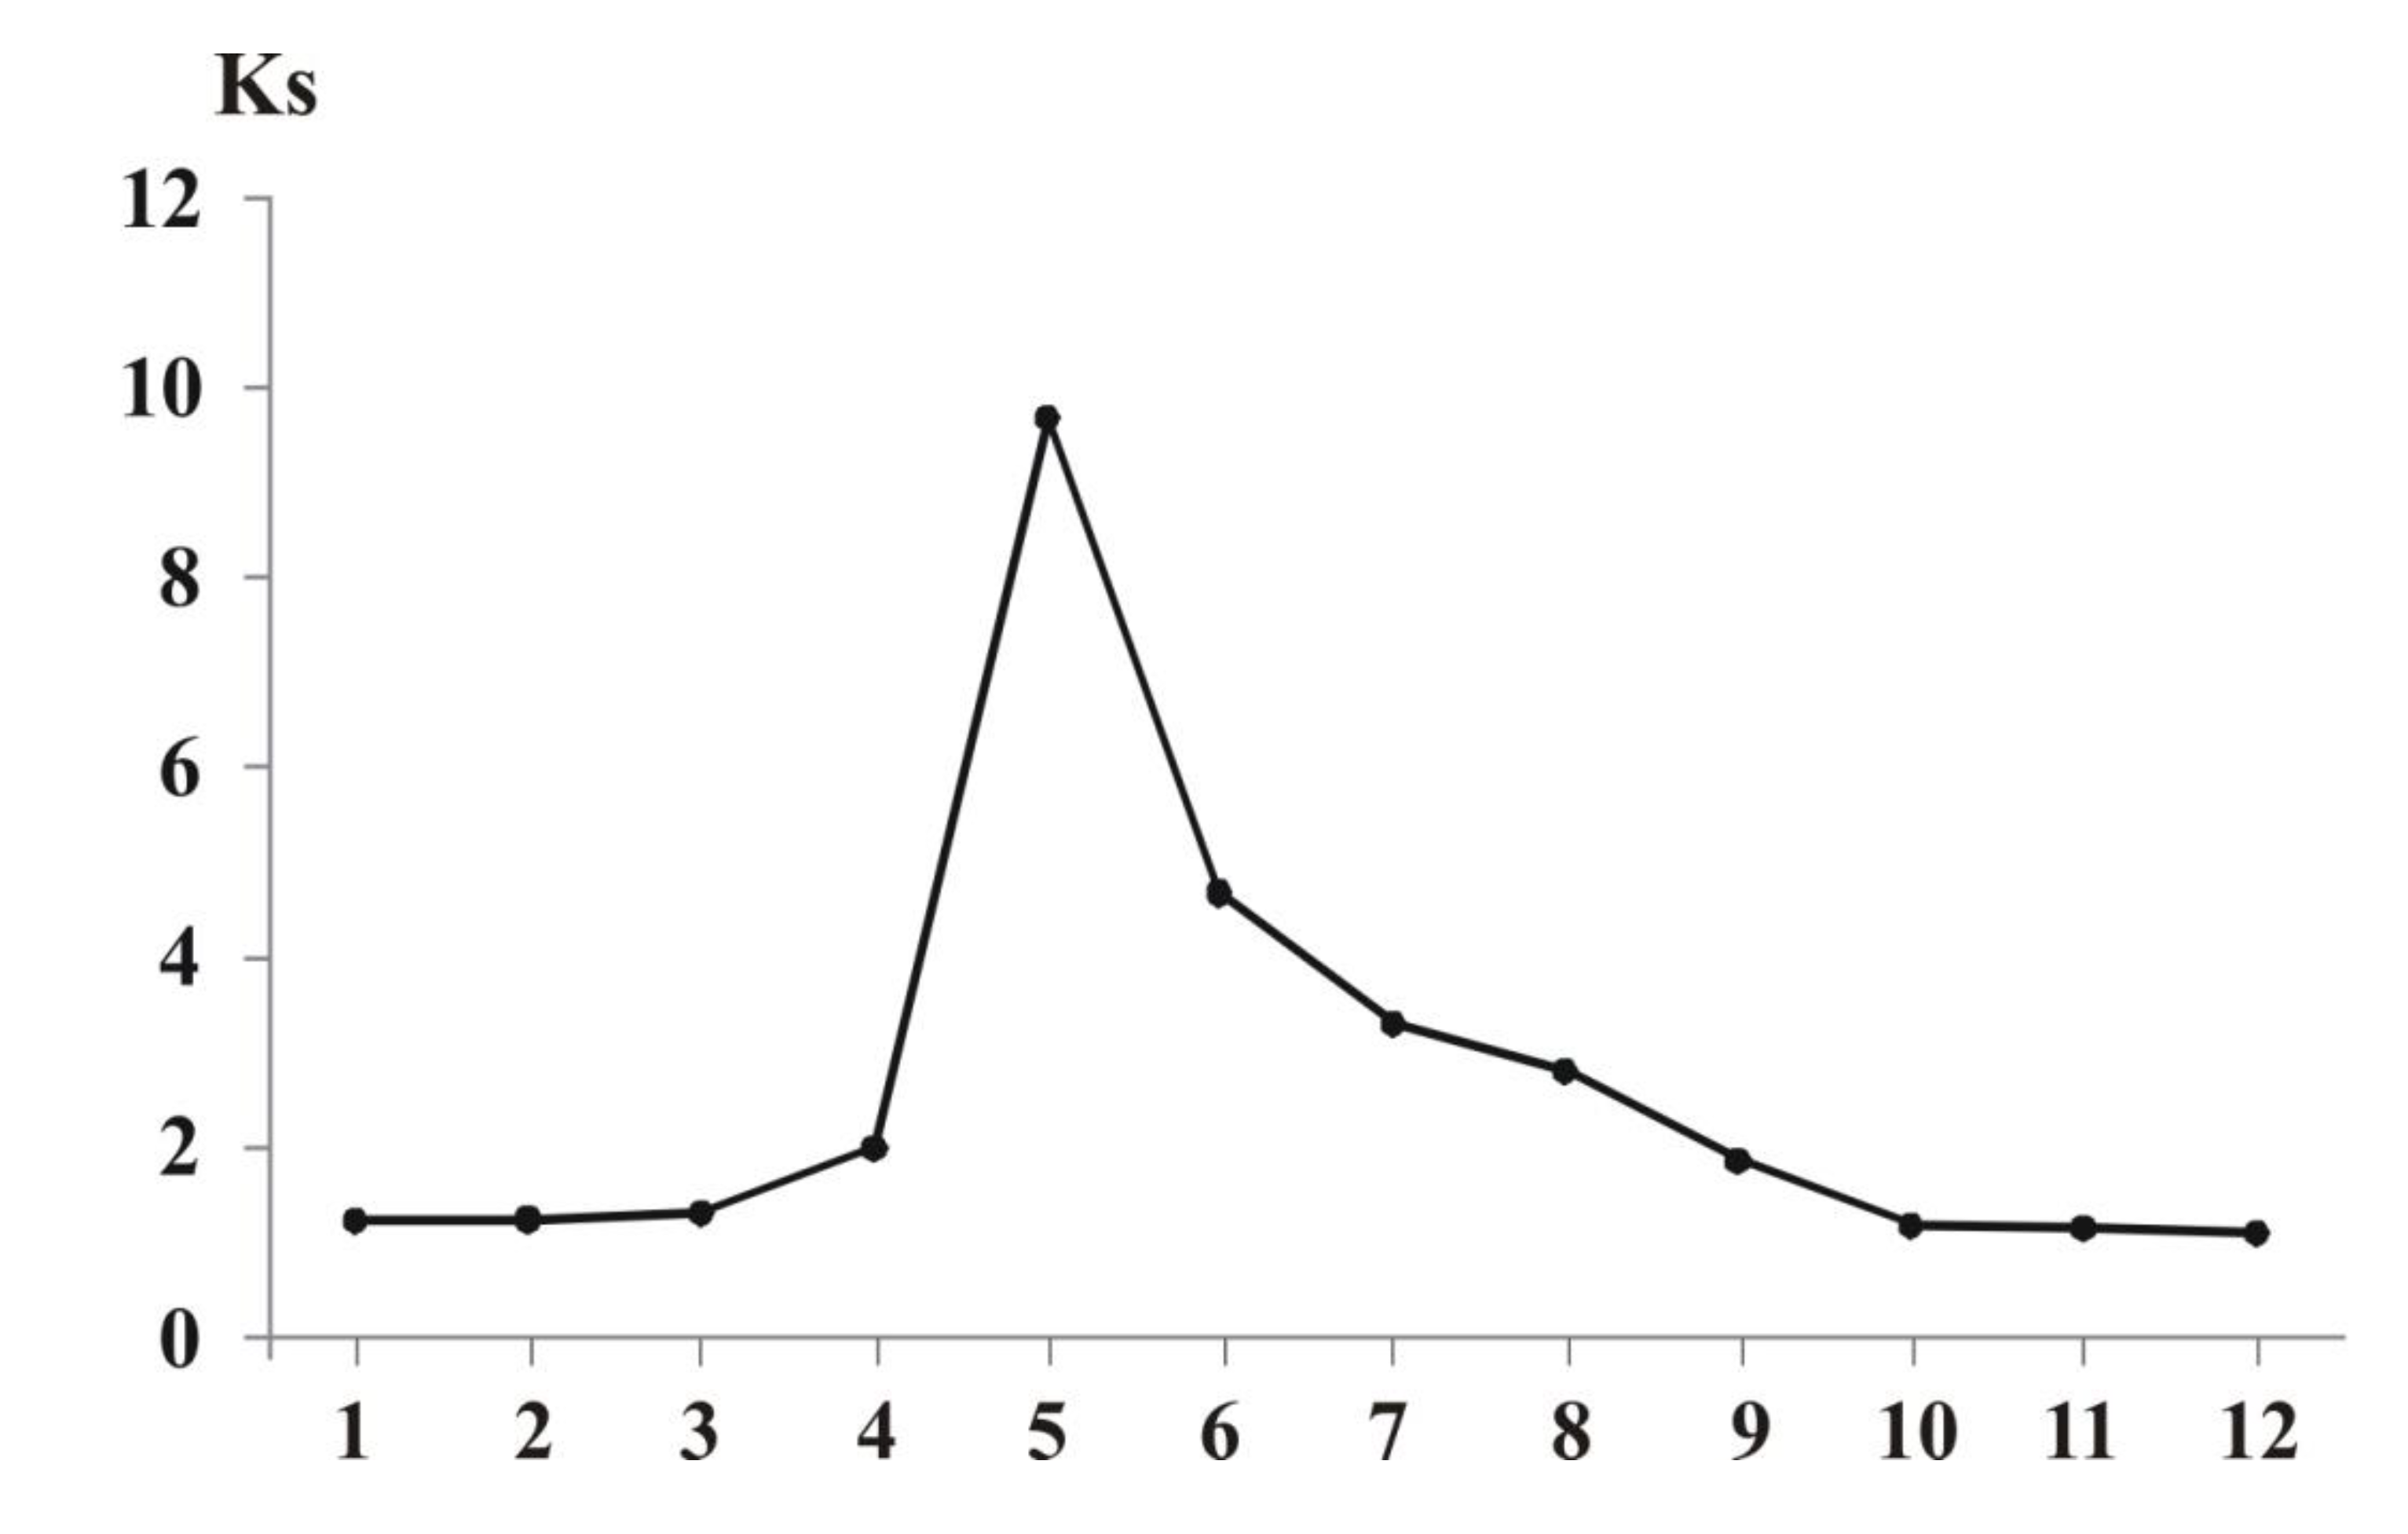
Next, the Ks coefficient values of drinking and mineral waters were determined in comparison with the value of this parameter for sodium chloride solutions (Figure 8). It turned out that the Ks coefficient of drinking water lies between the Ks of 1.10-3 M of an aqueous sodium chloride solution and the Ks of 1.10-2 M of a sodium chloride solution. Donat mineral water and sea water have Ks close to the Ks of a NaCl solution at a concentration of 1.10-1 M. The indicated changes in Ks are consistent with the results of work [10].
From Figure 7,8 it follows that Ks is a quantitative characteristic of the qualitative transition of an aqueous salt solution from one structural state to another, which is probably due to an increase in ion hydration. The presence of ions in water leads to a decrease in the size of clusters [6] and their partial destruction already at a concentration of 1.10-5 M [18]. In addition, when water molecules are oriented within the boundaries of the hydrate formation, van der Waals forces [9] begin to manifest themselves during their electrostatic interaction with the relatively free dipoles of water.
According to [19], if the number of water molecules in an associate is 103 units or more, then against the background of thermal motion of the molecules, they can stably exist as a single structurally organised kinetic whole (cluster) under given thermodynamic conditions. Such clusters are formed and are stable in distilled water and in aqueous solutions of sodium chloride at concentrations of 1.10-6 M and 1.10-5 M (points 1, 2, 3; Figure 7). It is their structures that influence the Ks values, which have similar values. With an increase in the solution concentration to 1.10-4 M (point 4, Figure 7), the size and number of associates decrease, which leads to a slight increase in the Ks coefficient.
The Ks coefficient has a maximum value at an aqueous solution concentration of 1.10-3 M (Figure 7). This concentration represents the boundary between competing structures of an aqueous sodium chloride solution. As the solution concentration increases further to 1.10-2 M and 1.10-1 M (points 9, 11; Figure 7), strong ion-dipole and ion-ion interactions begin to manifest themselves, resulting in the main contribution to the Ks value coming from the hydrated structures of the ions.
For drinking and mineral waters, the Ks value allows us to determine the structural state of the solutions. As Figure 7 shows, drinking waters contain associates of water dipoles and hydrated complexes, while mineral waters predominantly consist of hydrated ionic formations or more complex structures.
4. Conclusions
The data obtained in this study are consistent with current understanding of changes in the structure and other properties of water and water-containing systems under various influences and likely indicate that increasing the concentration of sodium chloride solution results in a relatively discrete transition from one structural state of water and water-containing systems to another.
The Ks criterion, along with the electrical capacitance of liquids, can be used to assess the structure of drinking and mineral waters and allows for the evaluation of the mobility of water dipoles at different frequencies. Drinking waters contain associates of water dipoles and hydrated complexes, while mineral waters predominantly consist of hydrated ion formations or more complex structures.
Incorporating a measuring cell or its equivalent electrical circuit into the oscillatory circuit of a sinusoidal oscillator under various influences can be used to indirectly assess changes in the number of water dipoles oscillating in an electric field, their mobility, and, accordingly, to evaluate the structure and other properties of water and water-containing systems. Moreover, the electrical capacitance and active resistance of the equivalent electrical circuit have a greater dynamic range of change and, accordingly, greater sensitivity when assessing changes in the structure and other properties of water.
Author Contributions
G.S.—methodology, investigation; B.L.—methodology, investigation; M.B.— conceptualisation, resources, writing, original draft preparation; N.G.—methodology, conceptualisation; L.A.—investigation, data curation; A.V.—conceptualisation, writing—original draft preparation; A.K.—conceptualisation, writing—original draft preparation. All authors have read and agreed to the published version of the manuscript.
Funding
This research received some support from the Slovenian Research Agency (research core funding No. P2-0180).
Data Availability Statement
All data specified in the work are available via the Internet.
Acknowledgments
The authors kindly acknowledge the financial support from the Slovenian Research Agency (research core funding No. P2-0180).
Conflicts of Interest
The authors declare no conflict of interest.
References
- Savostikova, O.N. Hygienic assessment of the effect of structural changes in water on its physicochemical and biological properties. In Abstract of the Dissertation for the Degree of Candidate of Medical Sciences; Research Institute of Human Ecology and Environmental Hygiene; Russian Academy of Medical Sciences: Moscow, Russia, 2008. [Google Scholar]
- Rakhmanin, Y.A.; Kondratov, V.K. Water Is a Cosmic Phenomenon; Russian Academy of Medical Sciences: Moscow, Russia, 2002. [Google Scholar]
- Farashchuk, N.F.; Rakhmanin, Y.A. Water Is the Structural Basis for Adaptation; Russian Academy of Medical Sciences: Moscow, Russia, 2004. [Google Scholar]
- Lindinger, Michael I. Structured water: effects on animals. Journal of Animal Science 2021, V. 99. №. 5, Р. 1–11. [Google Scholar] [CrossRef] [PubMed]
- Syroeshkin, A.V.; Smirnov, A.N.; Goncharuk, V.V. Water is a heterogeneous structure. In Electronic journal “Investigated in Russia”; 2006; pp. 843–854. Available online: http://zhurnal.ape.relarn.ru/articles/2006/088.pdf.
- Uspenskaya, E.V. Study of the structure of water at the supramolecular level for the development of new methods of standardisation and quality control of mineral waters and liquid dosage forms. Abstract dis. cand. chem. sciences. M, 2007. [Google Scholar]
- Sidorenko, G.; Brilly, M.; Laptev, B.; Gorlenko, N.; Antoshkin, L.; Vidmar, A.; Kryžanowski, A. Using Methods to Assess the Structure of Water and Water-Containing Systems to Improve the Properties of Living and Non-Living Systems. Water 2024, 16, 1381. [Google Scholar] [CrossRef]
- Smirnov, A.N.; Syroeshkin, A.V. Supranadmolecular complexes of water. Ros. chem. j. 2004, V.48.(N. 2), 125–135. [Google Scholar]
- Roy, R.; Tiller, W.A.; Bell, I.; Hoover, M.R. The structure of liquid water; novel insights from materials research; potential relevance to homoeopathy. Materials Research Innovations 2005, V. 9.(issue 4), 577–608. [Google Scholar] [CrossRef]
- Levitsky, E. F.; Laptev, B. I.; Sidorenko, G. N.; Gorlenko, N. P.; Sarkisov, J. S.; Antoshkin, L. V. Use of the method of dielectrometry for the estimation of the structure of drinking and mineral waters. Physiatrist 2013, N.3., 3–8. [Google Scholar]
- Sidorenko, G.N.; Laptev, B.I.; Gorlenko, N.P.; Kochetkova, T.D.; Antoshkin, L.V. Variability of properties of water and water-containing systems under various external influences. Vestn. TSU. Chem. Tomsk. 2020, 51–68. [Google Scholar] [CrossRef]
- Laptev, B. I.; Sidorenko, G. N.; Gorlenko, N. P.; Sarkisov, Yu. S.; Antoshkin, L. V.; Kulchenko, A. K. Modern electrophysical methods for studying the structure of water and aqueous solutions. Water and Ecology. Problems and Solutions 2014, N3, 21–32. [Google Scholar]
- Sidorenko, G.N.; Laptev, B.I.; Gorlenko, N.P.; Antoshkin, L.V. Assessment of changes in the properties of water and water-containing systems under various influences // Fundamental and applied science: state and development trends: collection of articles from the XXXVIII International scientific and practical conference (February 20, 2024); MCNP “NEW SCIENCE”: Petrozavodsk, 2024; pp. 62–77. [Google Scholar]
- Sidorenko, G. N.; Laptev, B. I.; Gorlenko, N. P.; Antoshkin, L. V. Assessment of changes in water structure with a decrease in temperature from 10 °C to 1 °C // Fundamental and applied science: state and development trends. Collection of articles from the XXIV International scientific and practical conference, Petrozavodsk, October 31. 2022; pp. 9–20. [Google Scholar]
- Sidorenko, G. N.; Laptev, B. I.; Gorlenko, N. P.; Antoshkin, L. V. New technique for assessing the structure of water and aqueous solutions when including a measuring cell in the oscillatory circuit of a sinusoidal oscillation generator. Water purification, water treatment, water supply 2020, N. 11, 12–18. [Google Scholar]
- Sidorenko, G.N.; Laptev, B.I.; Gorlenko, N.P.; Antoshkin, L.V. Using a new technique to assess the structure of water and water-containing systems. In Proceedings of the international scientific conference “Theoretical and practical aspects of the development of science in the modern world” August 2024 / Collection of selected articles, 2024; pp. 21–28. [Google Scholar] [CrossRef]
- Semikhina, L.P. Possibilities of the inductive dielectric method for studying aqueous solutions. Scientific instrument making 2005, Vol. 15.(No. 4), 88–93. [Google Scholar]
- Baranov, A.V.; Petrov, V.I.; Fedorov, A.V. Effect of NaCl microimpurities on the dynamics of cluster formation in liquid water: low-frequency Raman spectroscopy. JETP Letters 1993, Vol. 57.(Issue 6), 356–359. [Google Scholar]
- Gorlenko, N.P.; Laptev, B.I.; Sarkisov, Y.S.; Zhuravlev, V.A.; Sidorenko, G.N.; Prishchepa, I.A. The Role of Water and Aqueous Solutions in the Formation of Induction Periods of Hydration and Structure Formation of Cement Stone. Phys. Wave Phen 2023, 31, 206–215. [Google Scholar] [CrossRef]
Figure 1.
Schematic diagram of a measuring cell for assessing the structure of water and aqueous solutions: 1 – glass container for the liquids being tested, 2 – liquid being tested, 3 – capacitor plates made of non-magnetic material with an area of 60 cm2 each, 4 – terminals for connecting the measuring cell in parallel with the inductance of the oscillatory circuit.
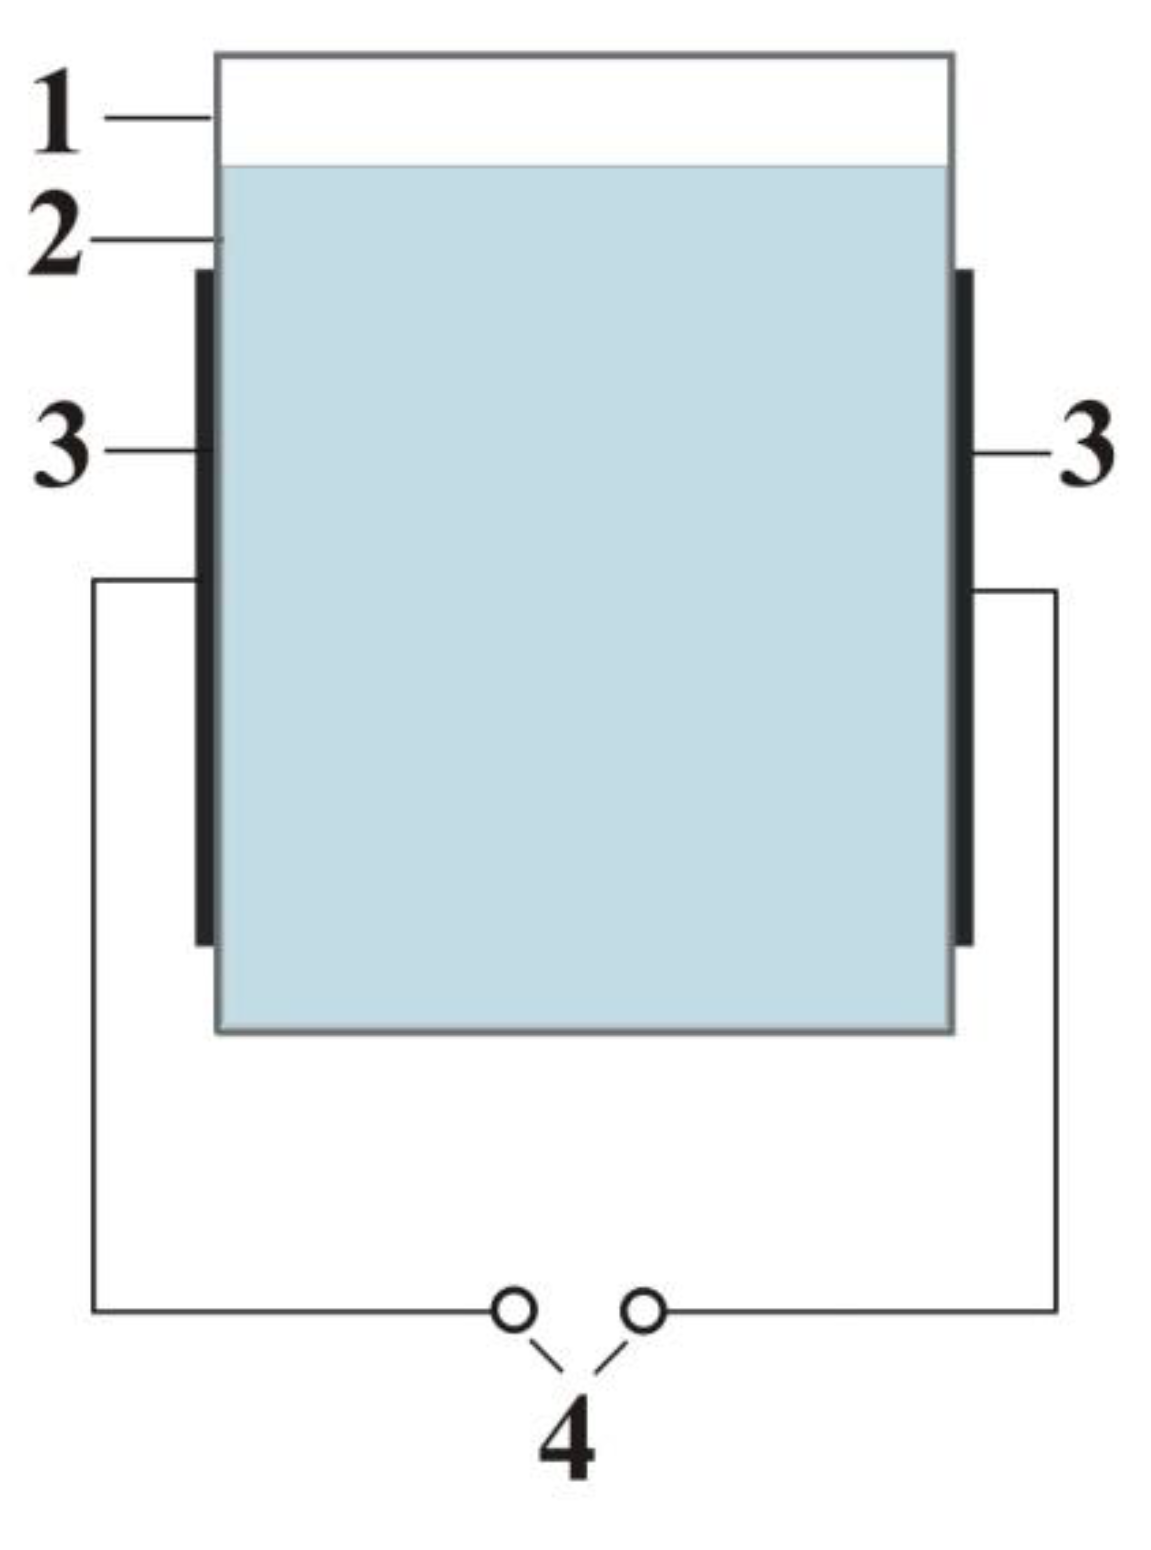
Figure 2.
Equivalent electrical circuit of a measuring cell with liquid (variable capacitor and variable active resistance connected in parallel).
Figure 2.
Equivalent electrical circuit of a measuring cell with liquid (variable capacitor and variable active resistance connected in parallel).

Figure 3.
The effect of increasing the concentration of sodium chloride solution in the measuring cell on the change in frequencies (f1, f2, f3, f4, f5 and f6) of the sinusoidal oscillation generator (in % of distilled water).
Figure 3.
The effect of increasing the concentration of sodium chloride solution in the measuring cell on the change in frequencies (f1, f2, f3, f4, f5 and f6) of the sinusoidal oscillation generator (in % of distilled water).
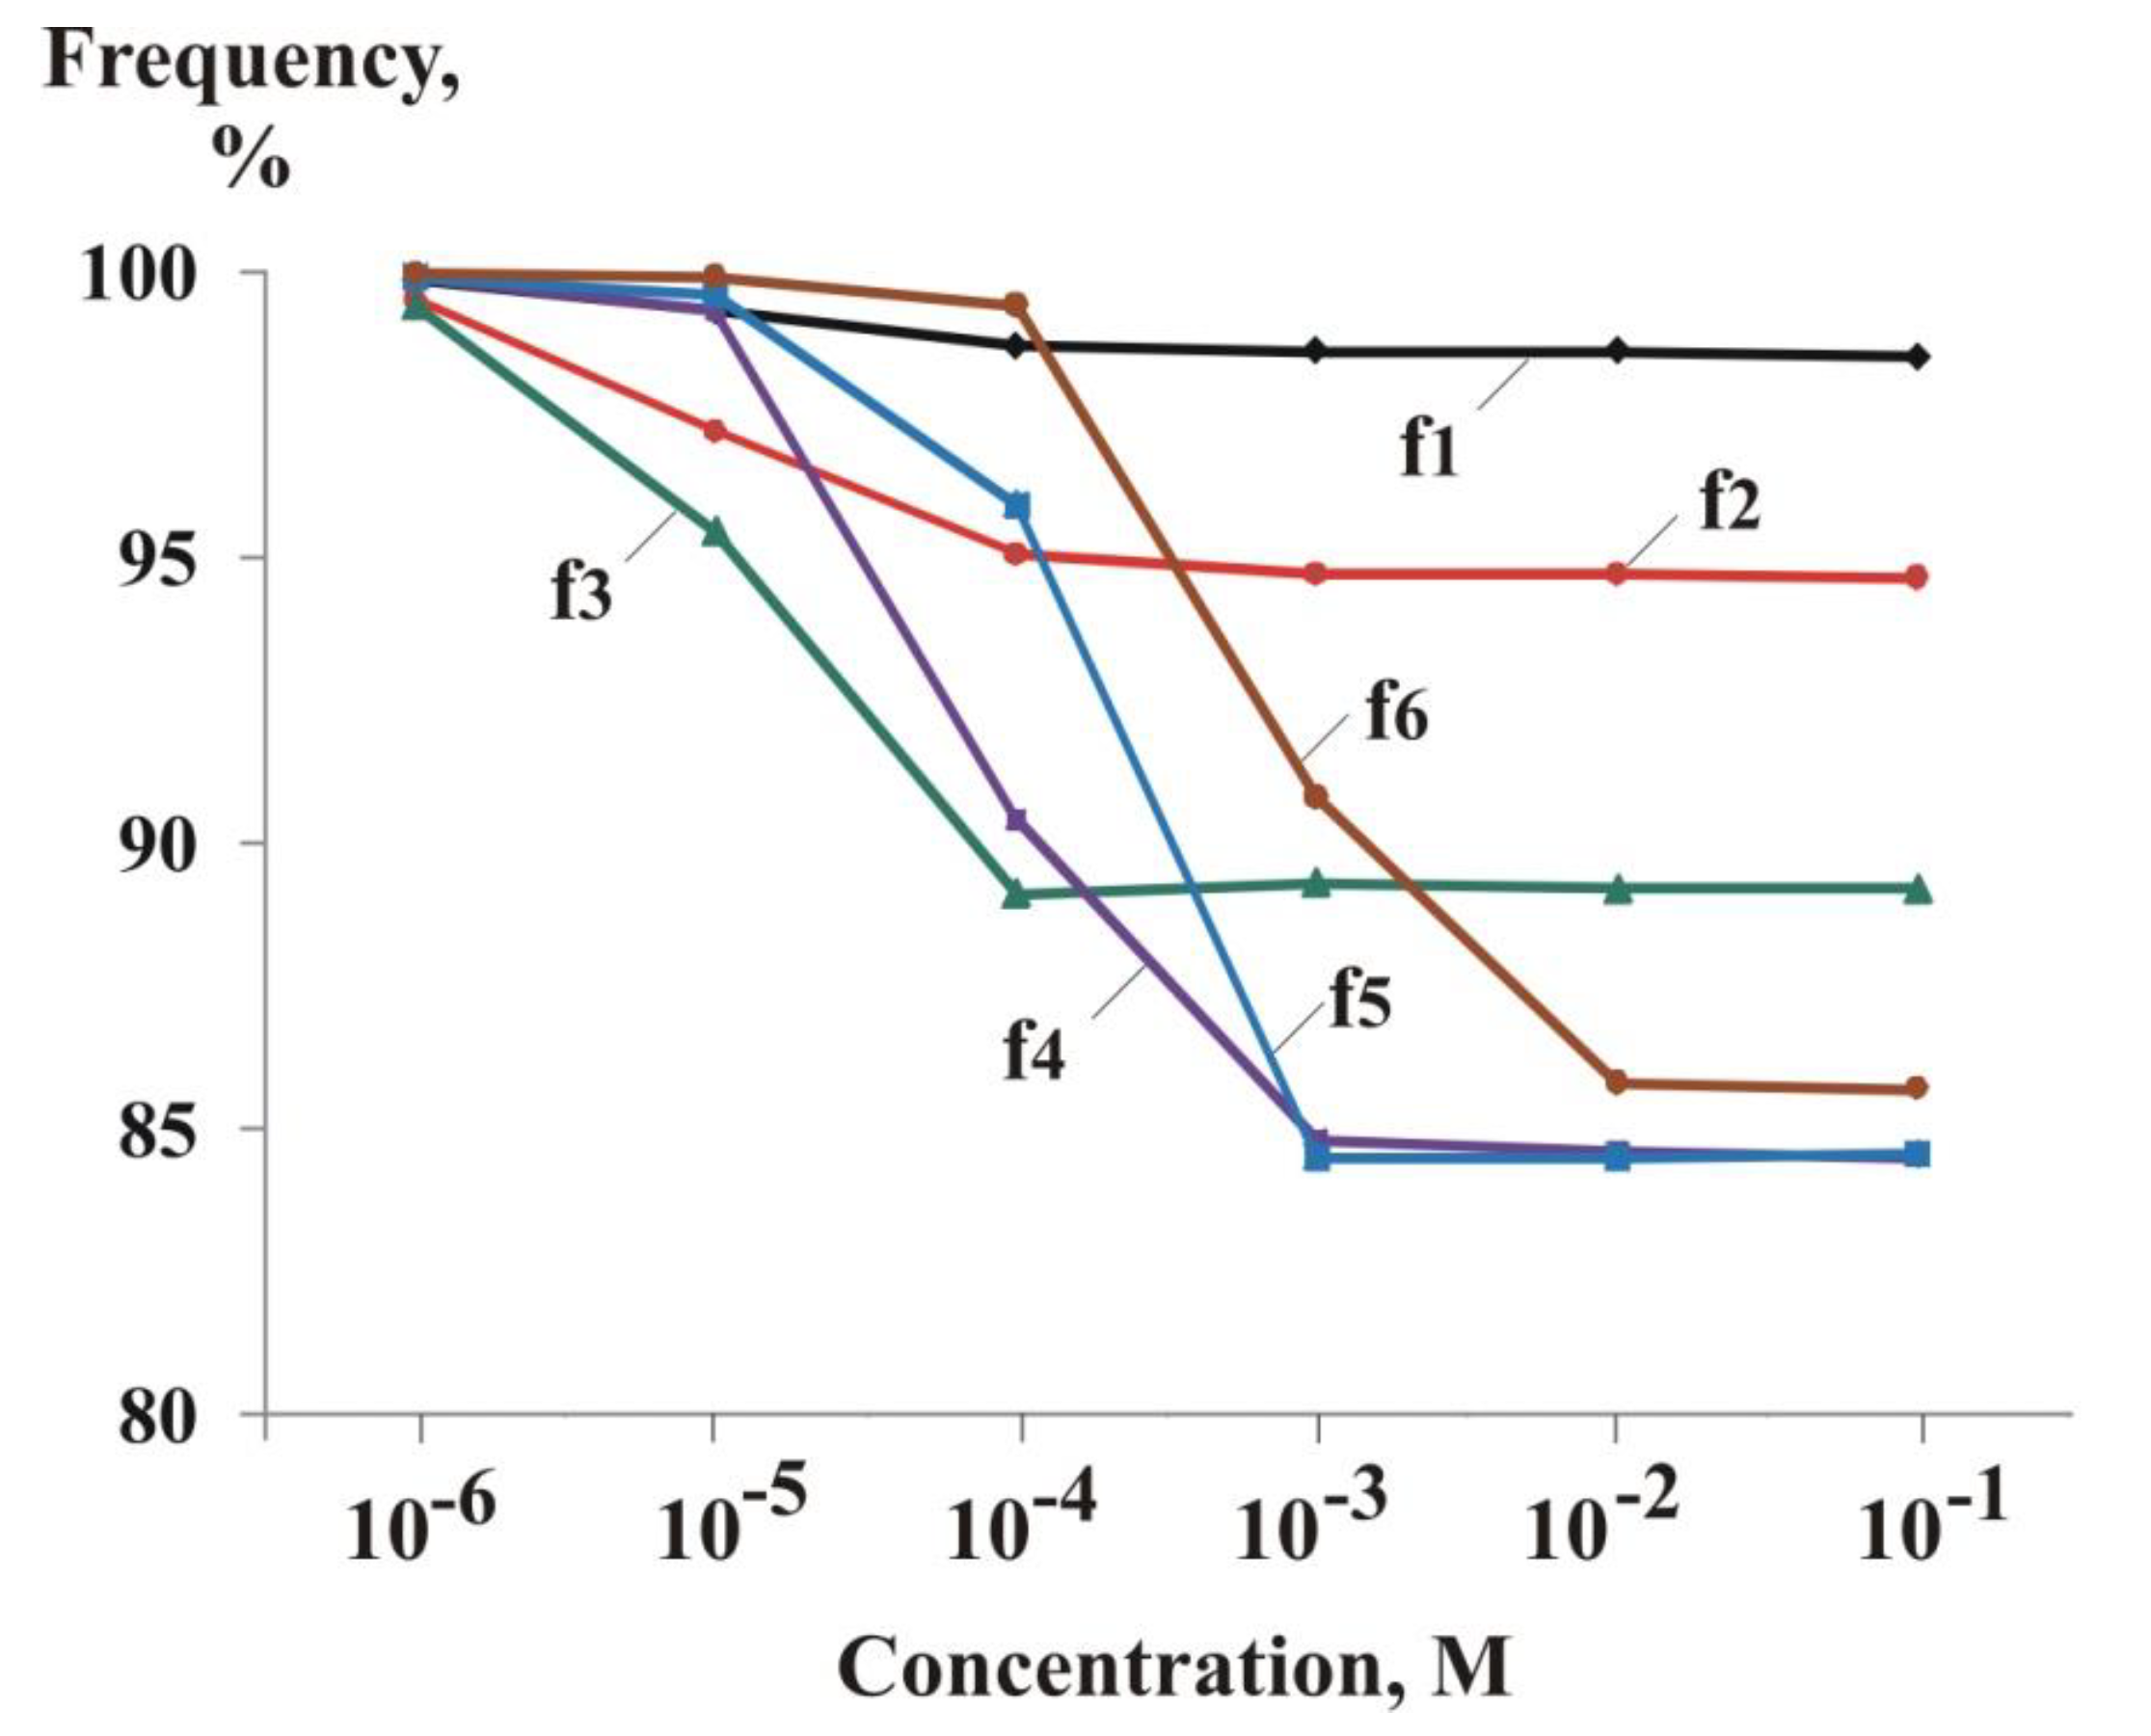
Figure 4.
The effect of increasing the concentration of sodium chloride solutions in the measuring cell on the amplitudes (volts) of oscillations of the sinusoidal oscillation generator at different initial frequencies (f1, f2, f3, f4, f5 and f6). 1 – distilled water; 2, 3, 4, 5, 6, 7 – sodium chloride solutions in concentrations of 1.10-6 M, 1.10-5 M, 1.10-4 M, 1.10-3 M, 1.10-2 M, 1.10-1 M, respectively.
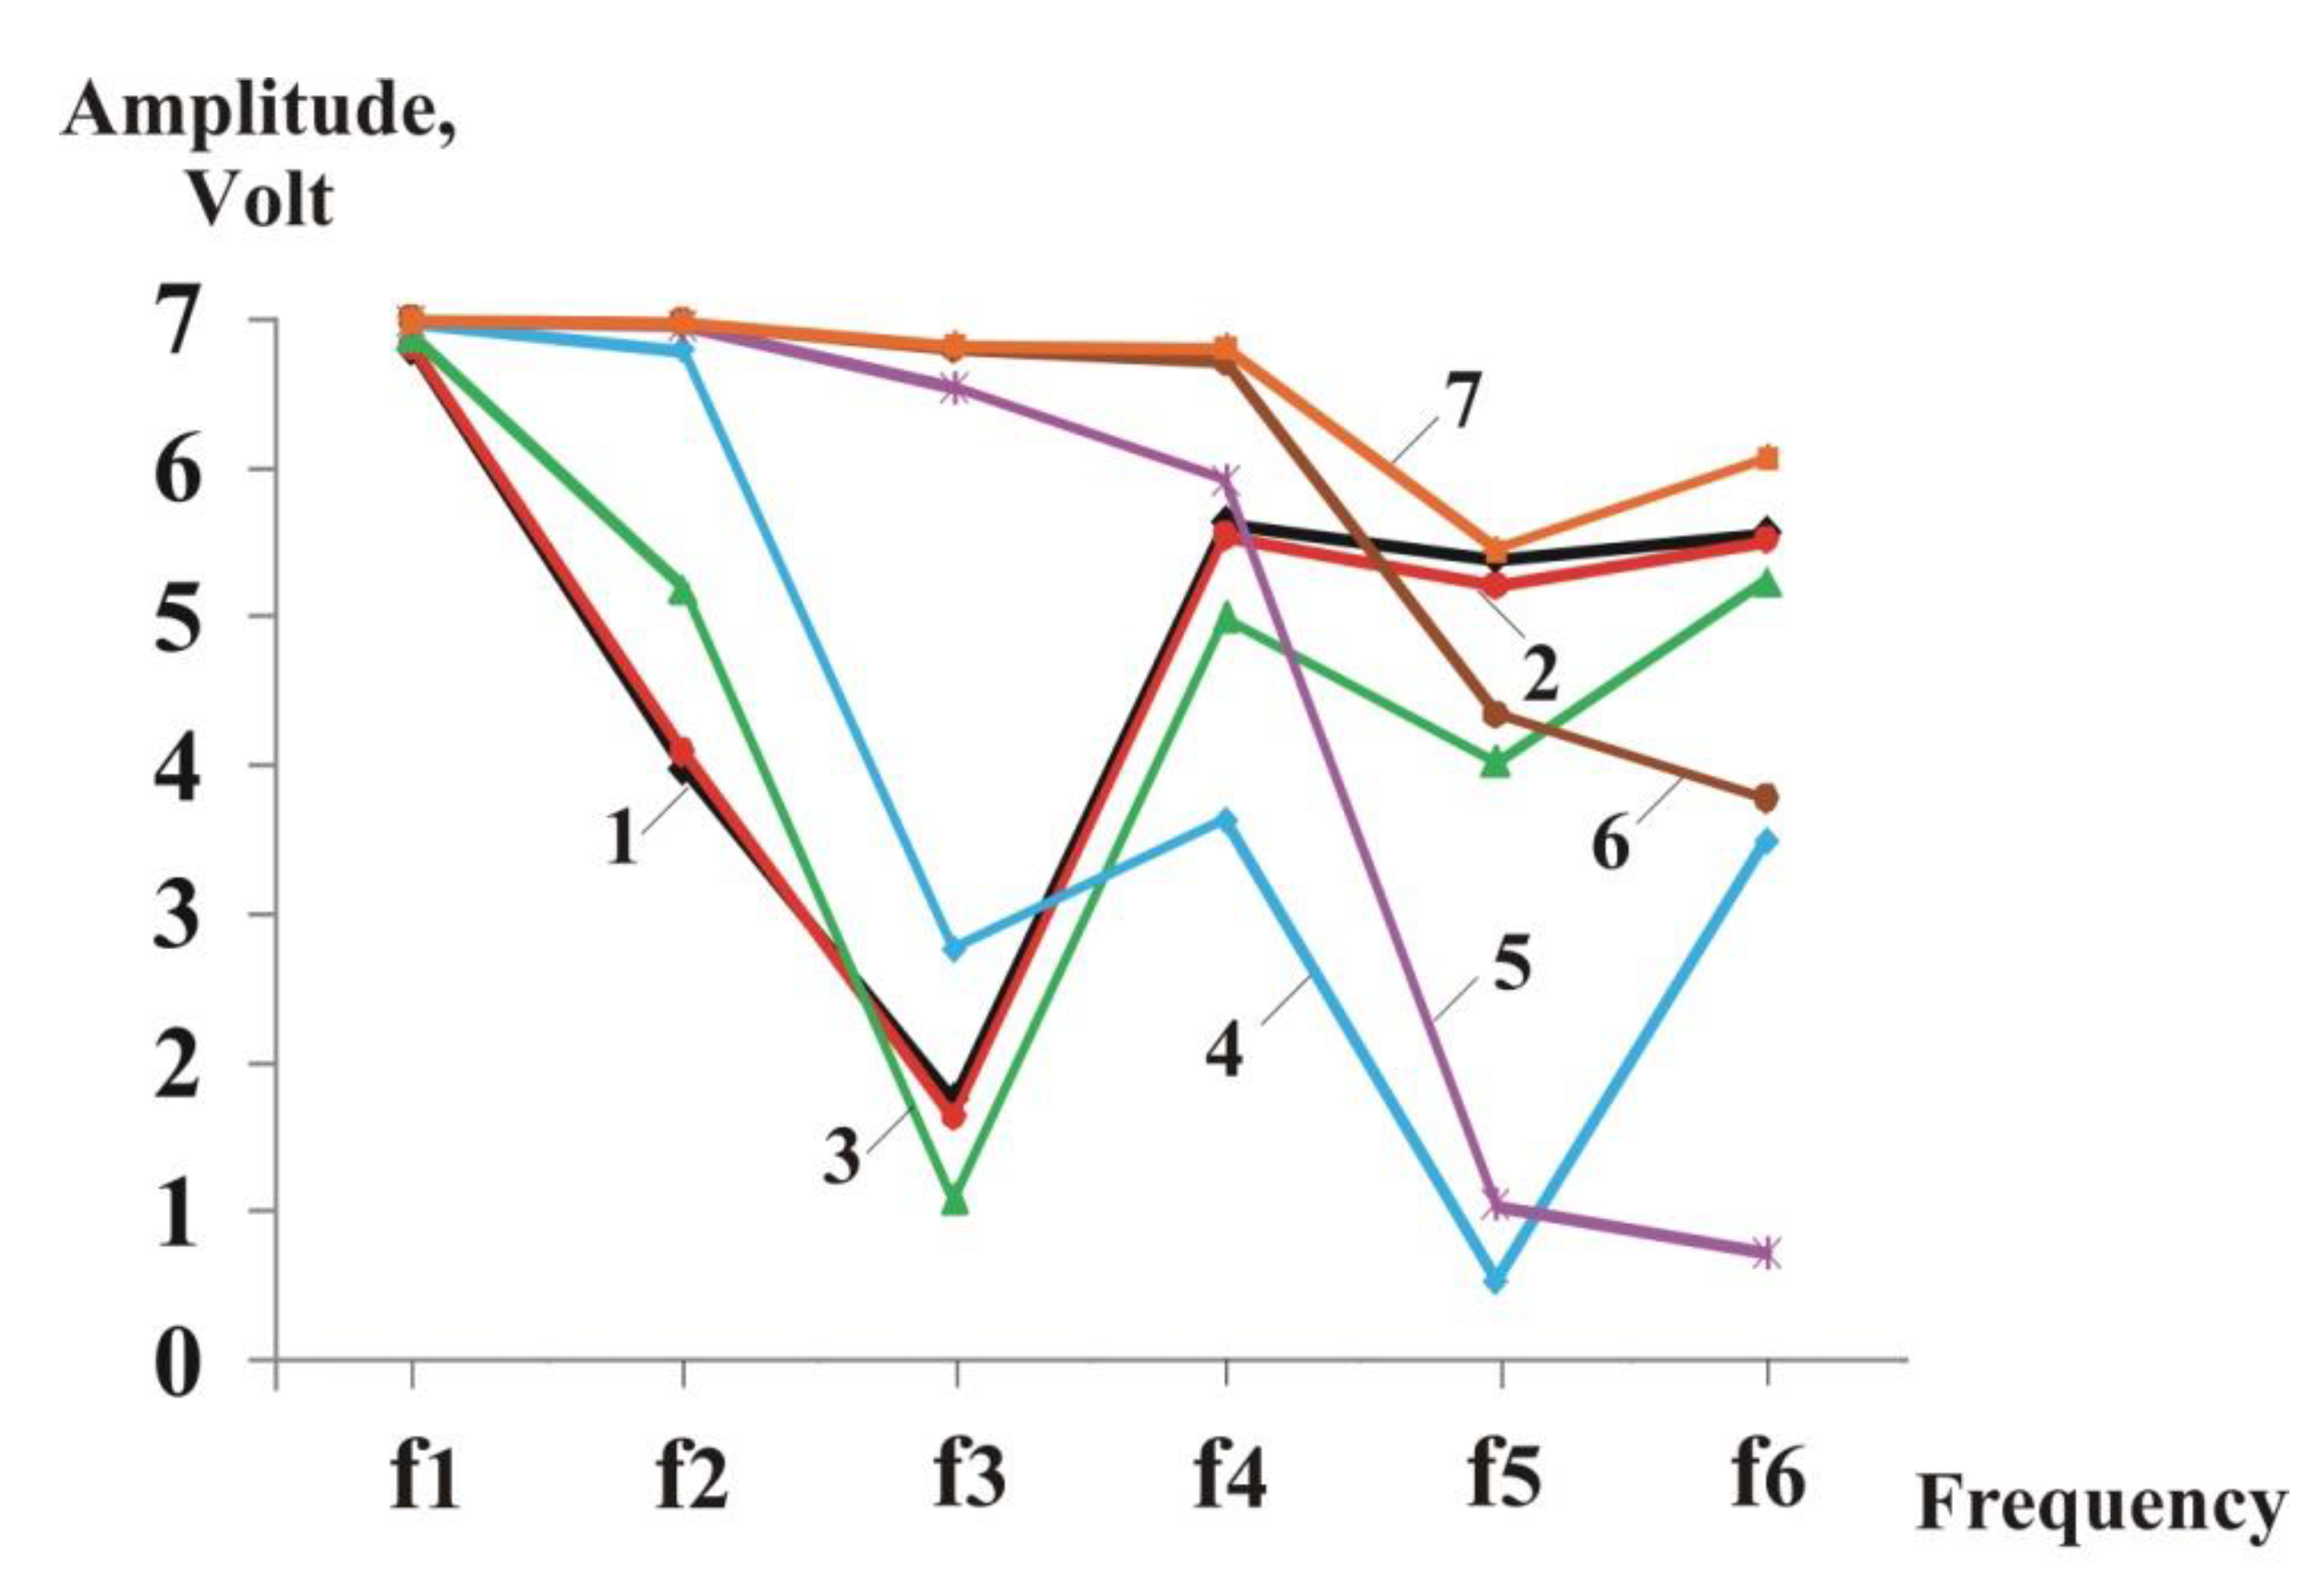
Figure 5.
The influence of drinking and mineral waters on the amplitude (volts) of the sinusoidal oscillation generator at different frequencies (f1, f2, f3, f4, f5 and f6). 1, 2, 3 – drinking waters Fiji, Rogla and Jana, respectively; 4 – mineral water DonatMg; 5 – sea water.
Figure 5.
The influence of drinking and mineral waters on the amplitude (volts) of the sinusoidal oscillation generator at different frequencies (f1, f2, f3, f4, f5 and f6). 1, 2, 3 – drinking waters Fiji, Rogla and Jana, respectively; 4 – mineral water DonatMg; 5 – sea water.
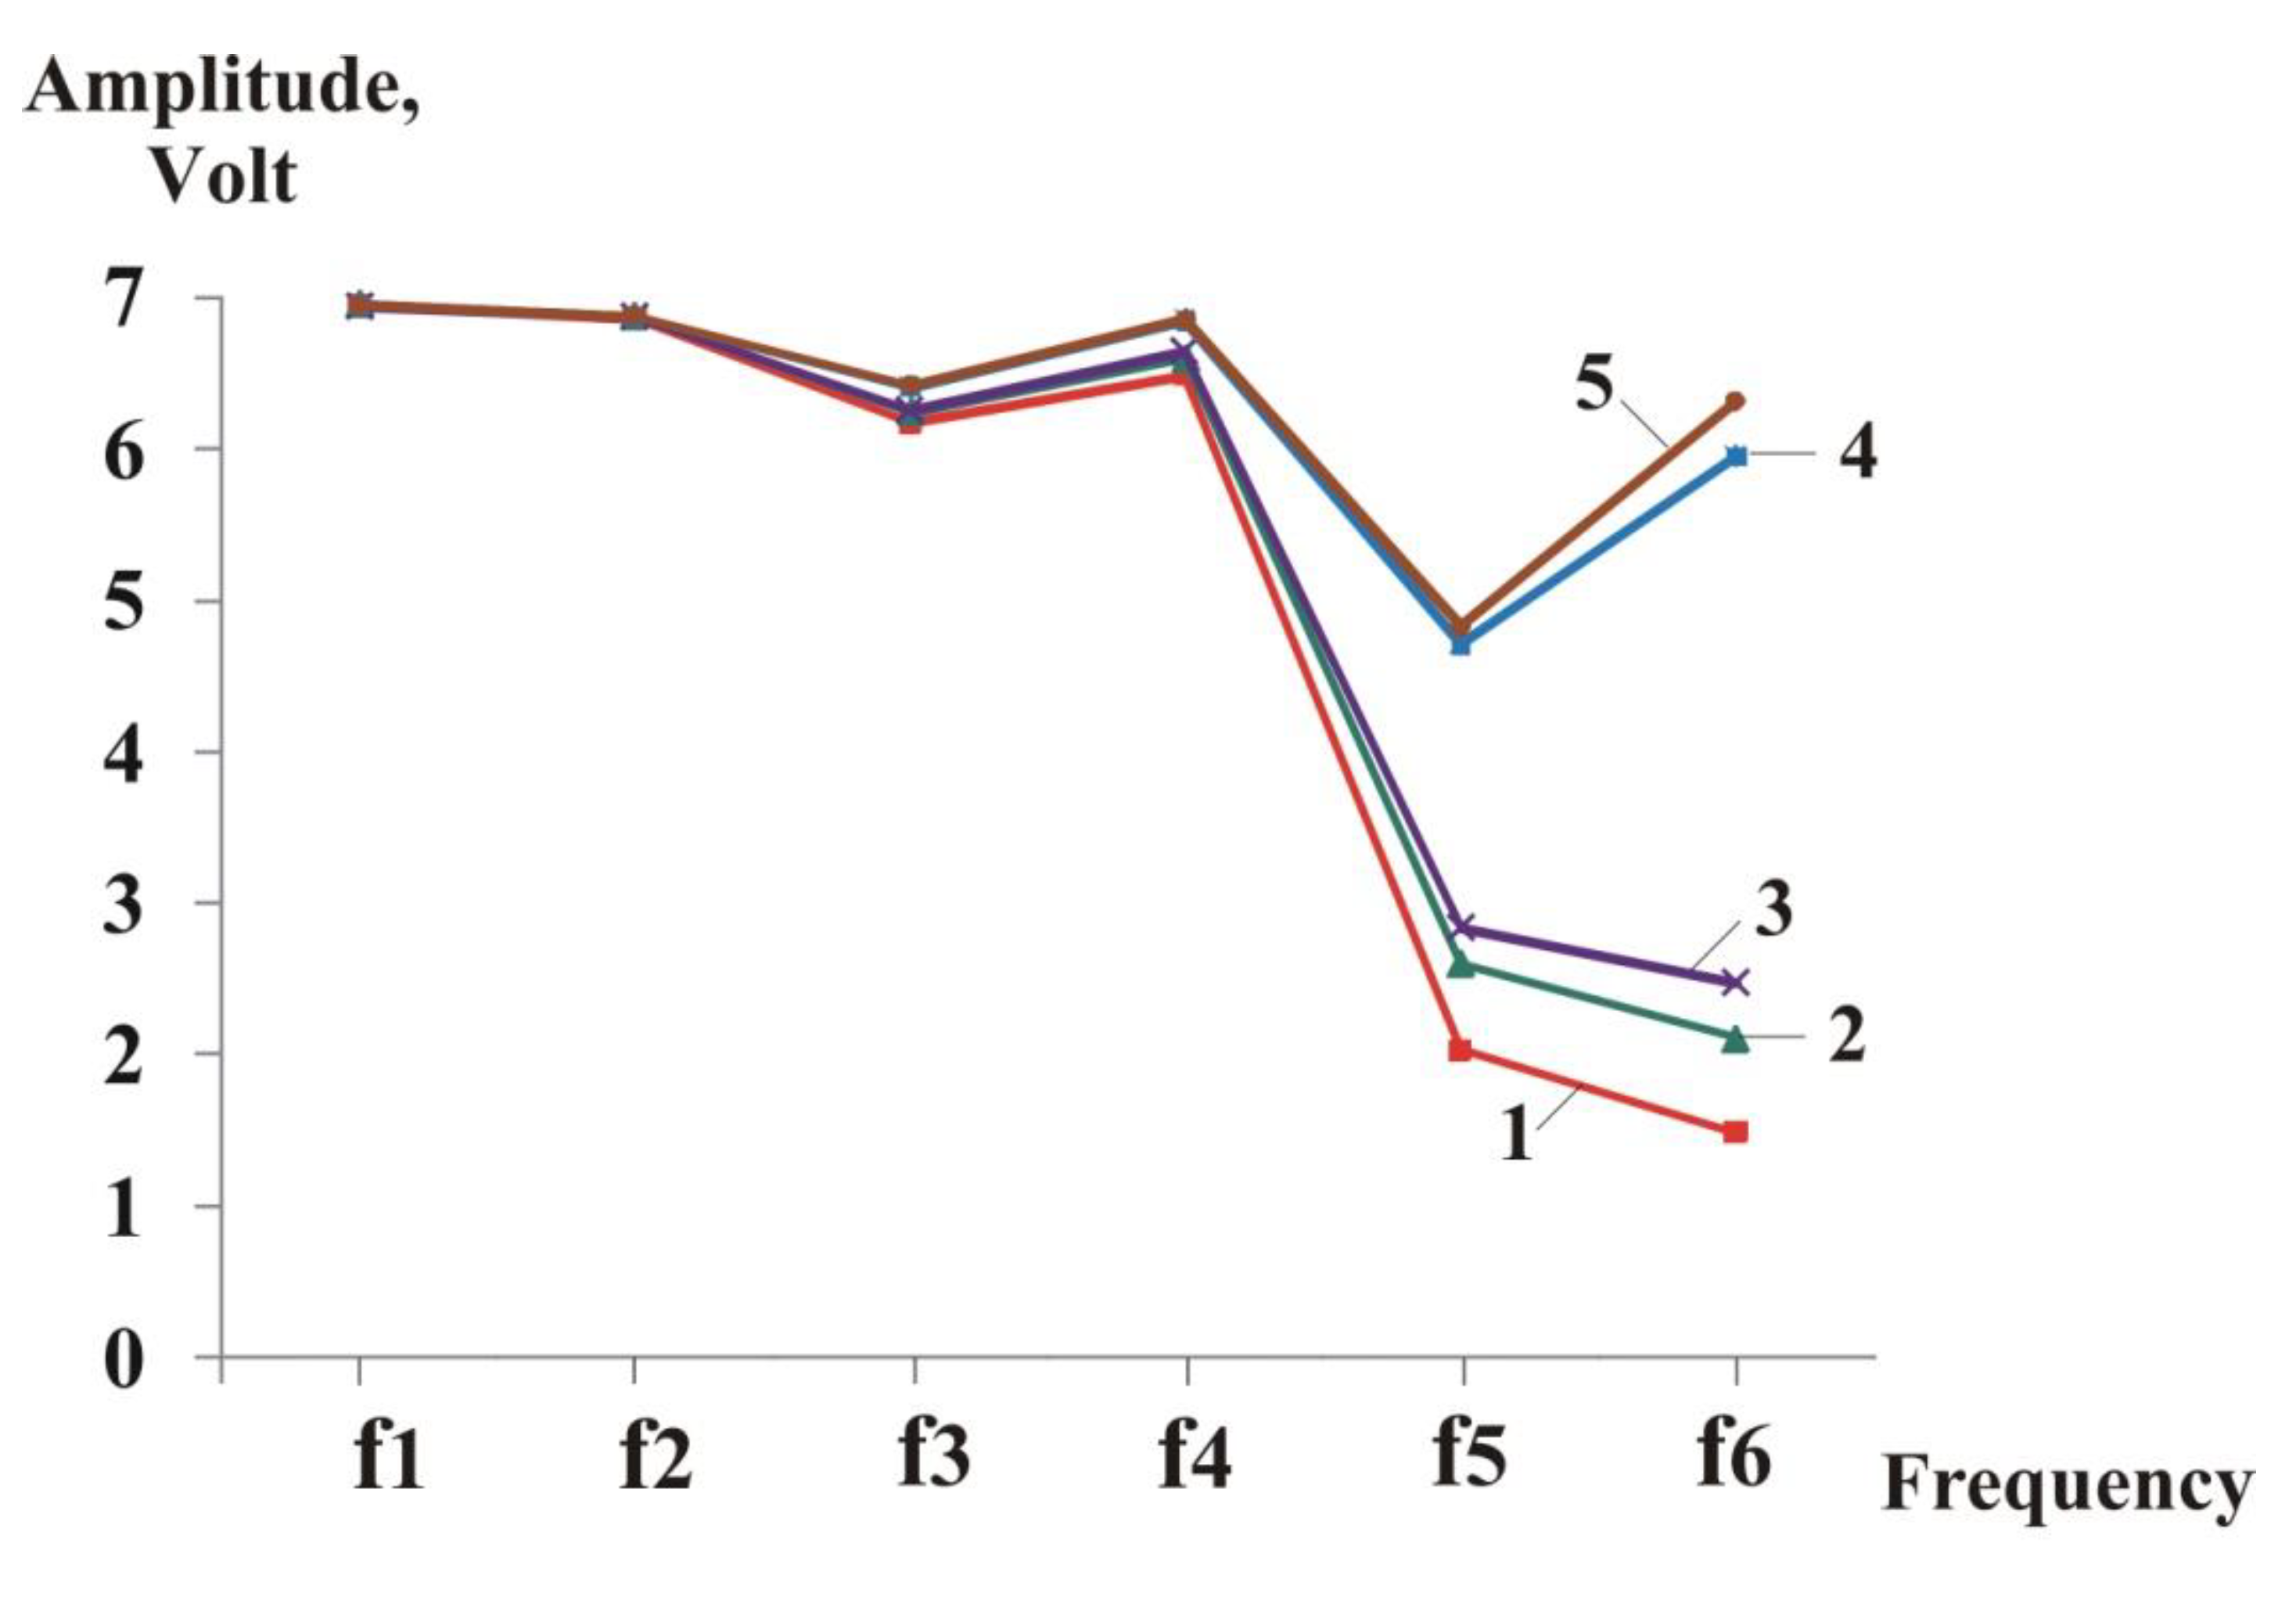
Figure 6.
The effect of increasing the concentration of sodium chloride solution in the measuring cell on the change in the electrical capacitance of the equivalent electrical circuit of the measuring cell at frequencies f1, f2, f3, f4, f5 and f6 of the sinusoidal oscillation generator (in % of distilled water).
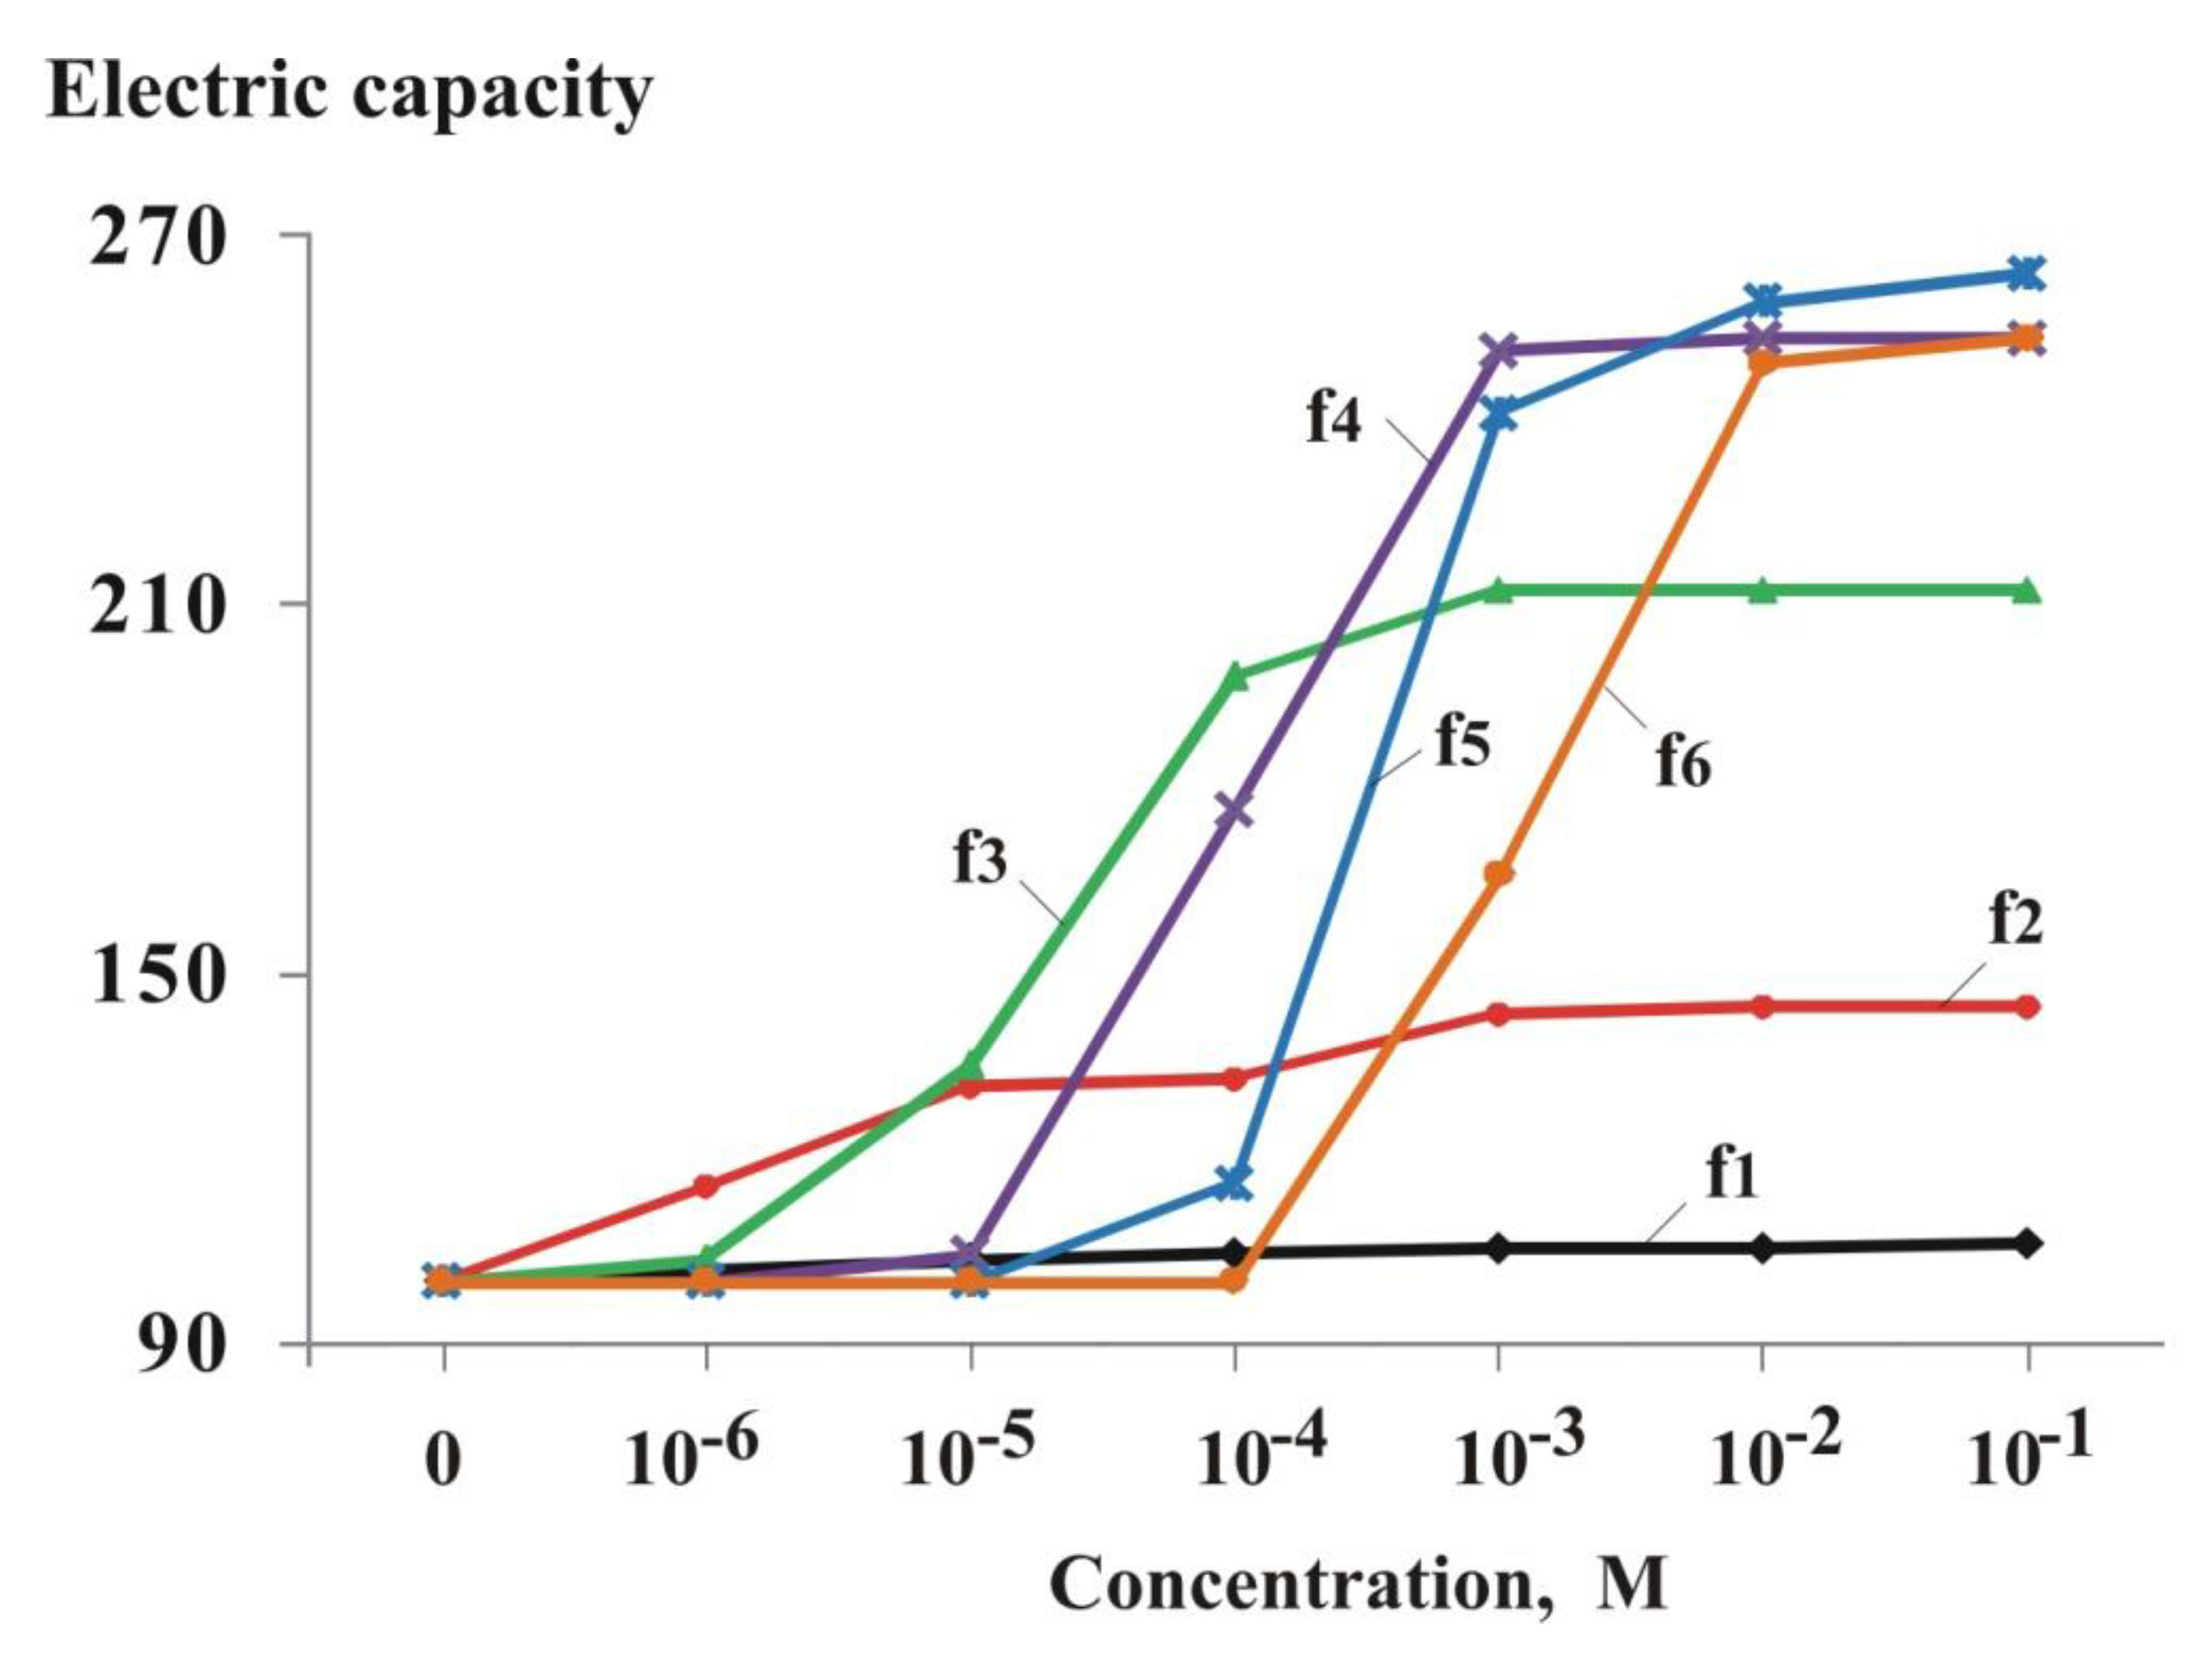
Figure 7.
Change in the coefficient Ks with increasing concentration of sodium chloride solution in the measuring cell.
Figure 7.
Change in the coefficient Ks with increasing concentration of sodium chloride solution in the measuring cell.
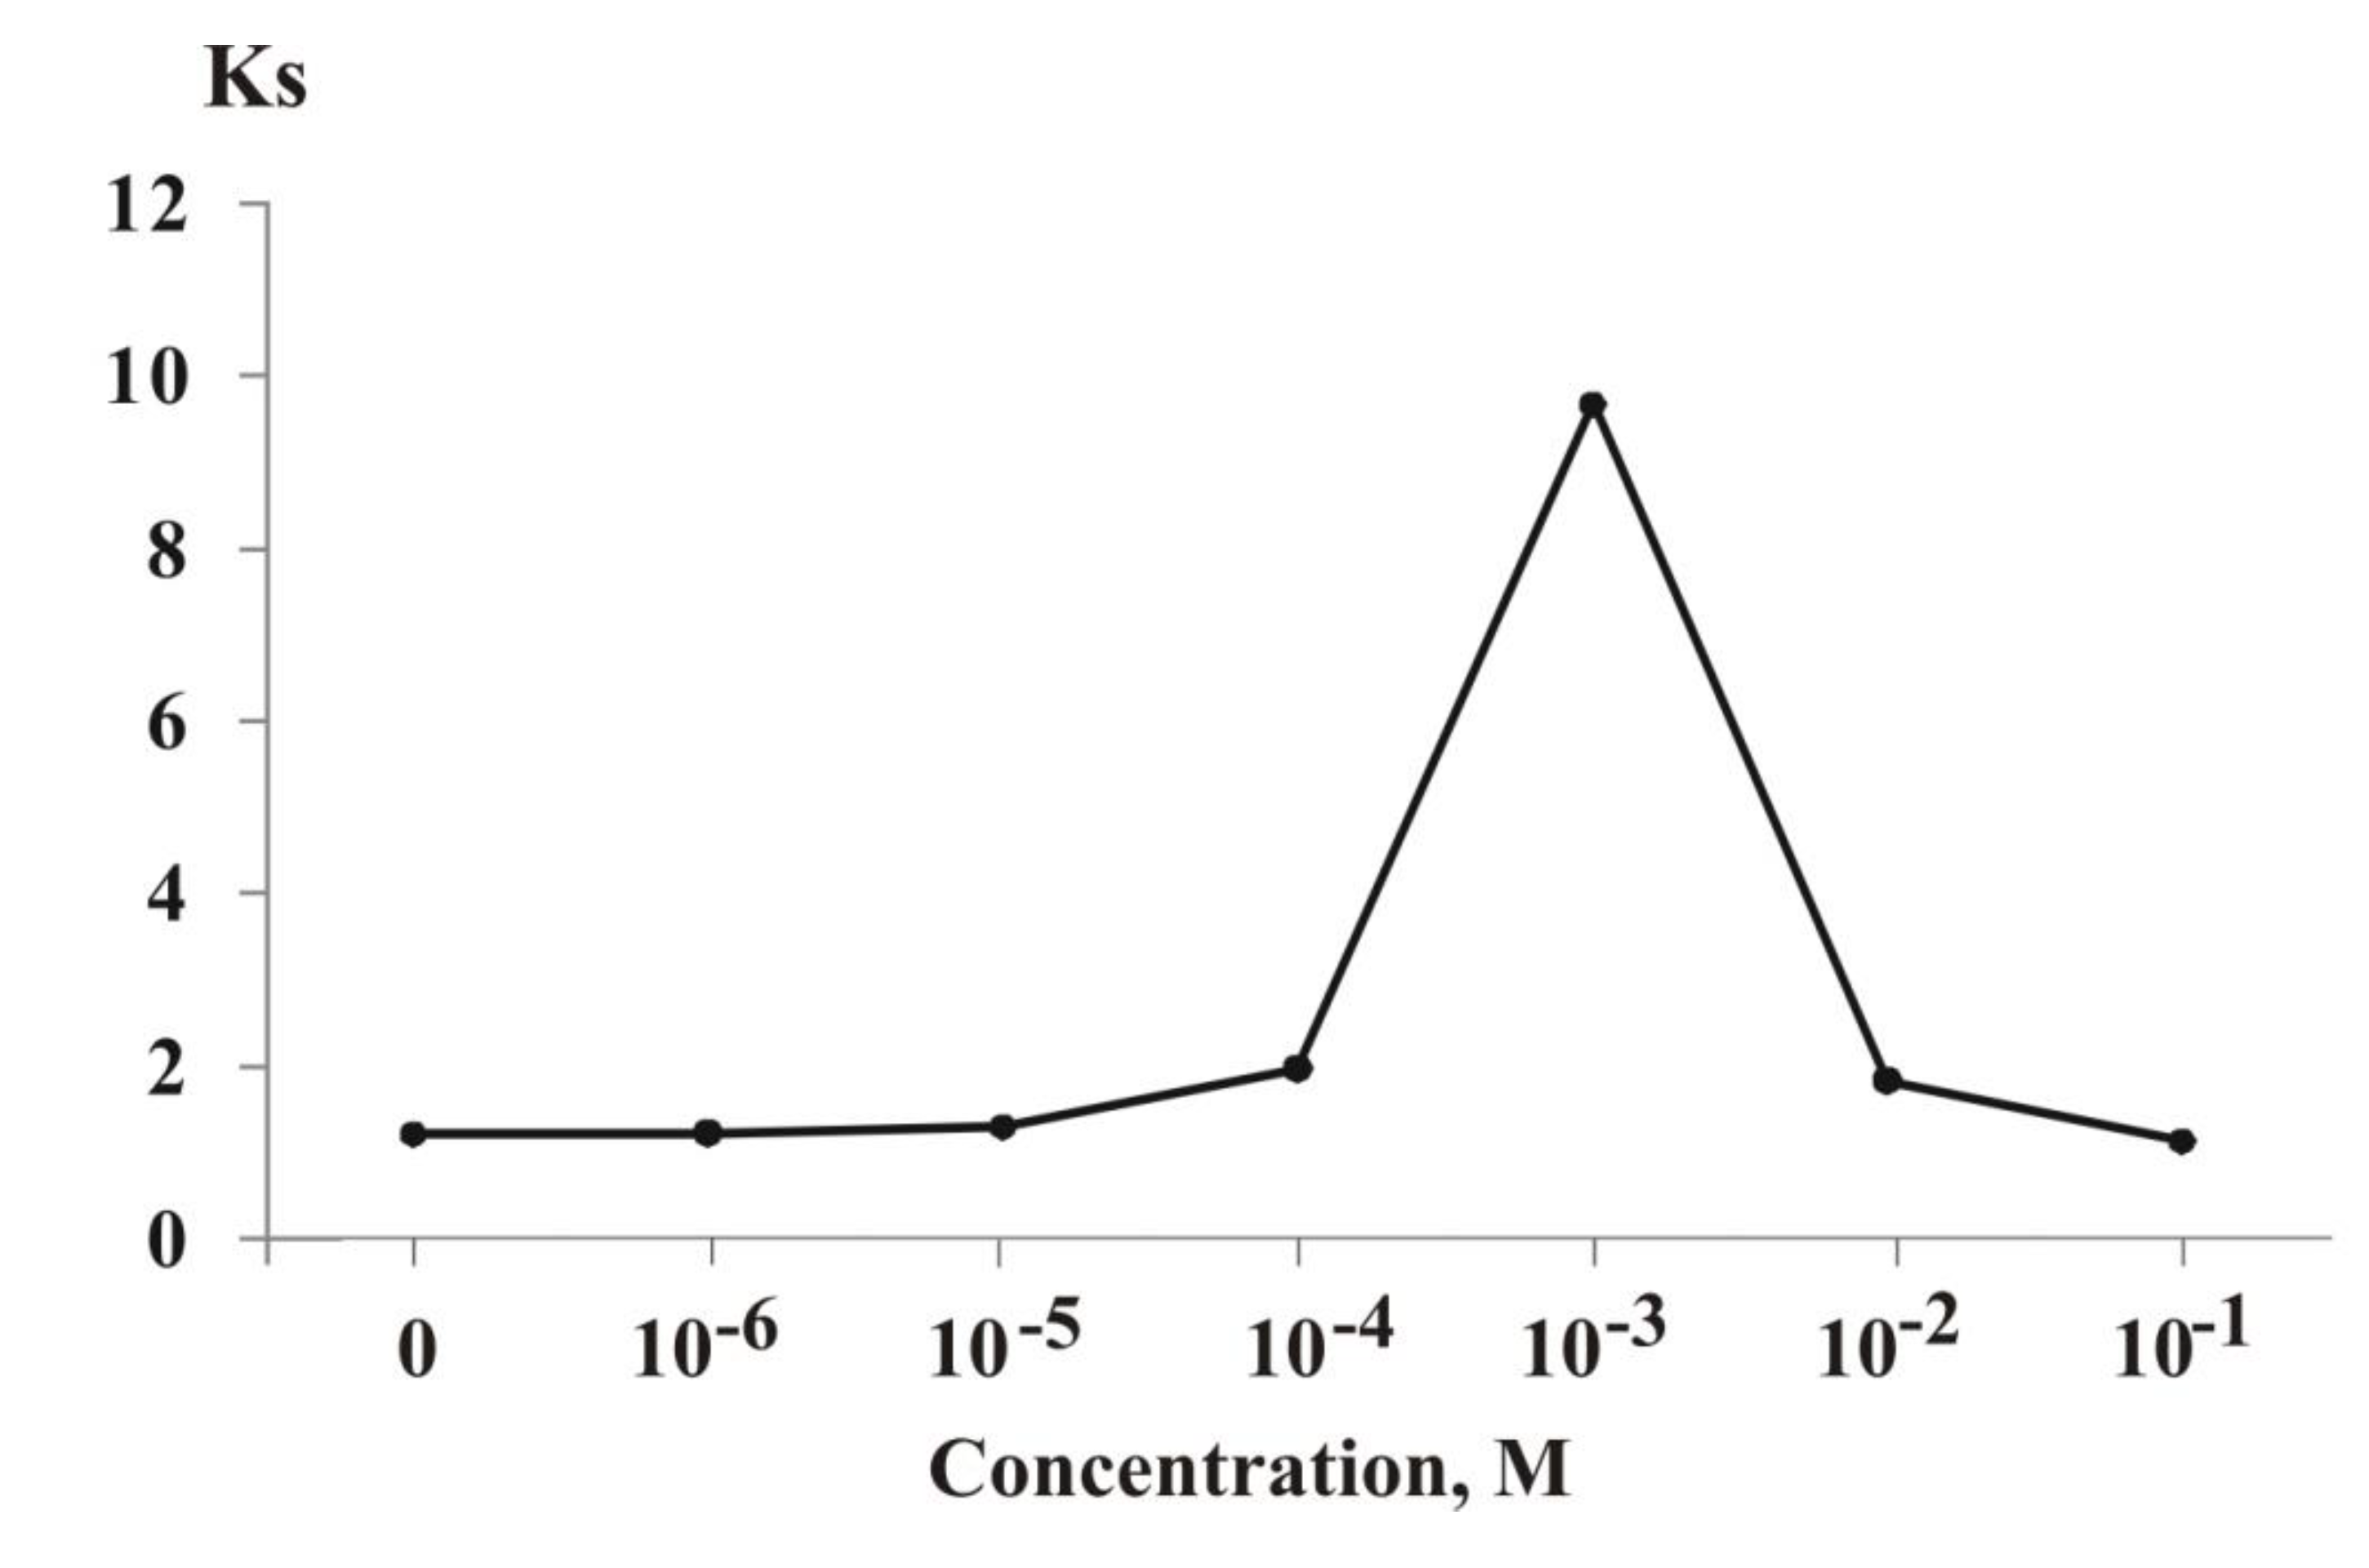
Figure 8.
Change in the Ks coefficient with an increase in the concentration of sodium chloride solution in the measuring cell and under the influence of drinking and mineral waters. 1 - distilled water; 2, 3, 4, 5, 9 and 11 - sodium chloride solutions in concentrations of 1.10-6 M, 1.10-5 M, 1.10-4 M, 1.10-3 M, 1.10-2 M and 1.10-1 M; 6, 7 and 8 - Fiji, Rogla and Jana drinking waters, respectively; 10 and 12 - Donat mineral water and sea water, respectively.
Disclaimer/Publisher’s Note: The statements, opinions and data contained in all publications are solely those of the individual author(s) and contributor(s) and not of MDPI and/or the editor(s). MDPI and/or the editor(s) disclaim responsibility for any injury to people or property resulting from any ideas, methods, instructions or products referred to in the content. |
© 2026 by the authors. Licensee MDPI, Basel, Switzerland. This article is an open access article distributed under the terms and conditions of the Creative Commons Attribution (CC BY) license (http://creativecommons.org/licenses/by/4.0/).
Copyright: This open access article is published under a Creative Commons CC BY 4.0 license, which permit the free download, distribution, and reuse, provided that the author and preprint are cited in any reuse.


