Submitted:
22 January 2026
Posted:
22 January 2026
You are already at the latest version
Abstract
Human-elephant conflict (HEC) has become a major conservation and socio-economic challenge across Asia, particularly in elephant range countries, due to rising human encroachment and habitat loss. In India, HEC escalation is linked to habitat degradation, agricultural expansion, and linear infrastructure development. In the West Singhbhum district of Jharkhand state, changes in LULC from deforestation, mining, and agricultural encroachment have severely altered elephant habitats. The loss of migratory routes has forced elephants to remain in disturbed areas, intensifying conflict. A three-year field study (2018–2020) across Porahat, Chaibasa, Kolhan, and Saranda Forest Divisions, combined with two decades (2000–2020) of LULC analysis, recorded 157 human deaths, 2837.90 acres of crop damage, 1925 house destructions, 3146 quintals of grain loss, and 35 elephant deaths, including nine poaching cases. Dense vegetation declined from 49.14% (2000) to 28.68% (2020), while sparse vegetation and agricultural land increased by 15.35% and 3.68%, respectively. Water bodies decreased by 0.33%, and barren land increased by 3.70%. Core forests (>500 acres) reduced by 16.86%, with forest perforation increasing by 15.69%. Only 6.7% of the district remains suitable for elephants, mostly in Saranda (44.2%), while NDVI shows 83.54% non-favourable change. Ensuring coexistence demands improved landscape connectivity and targeted conservation strategies, while exclusion zones need site-specific mitigation measures.
Keywords:
HEC
; LULC
; habitat suitability
; landscape dynamics
; vegetation structure
; human casualty
1. Introduction
Anthropogenic transformations of natural landscapes have drastically altered the ecosystems worldwide, leading to intensified habitat loss, fragmentation, and declines in wildlife populations. Expansion of Agriculture, infrastructure, and extractive industries continues to shrink and isolate intact habitats, forcing wildlife to share increasingly disputed spaces with people [1,2]. These ecological disruptions have profound implications for wide-ranging megaherbivores such as elephants, whose survival depends on vast and interconnected forests capable of sustaining their high resource demands [3,4].
Across elephant range countries in Asia and Africa, fragmentation of movement corridors and depletion of wild forage have escalated Human–Elephant Conflict (HEC), evident through crop depredation, property damage, and fatalities of both humans and elephants [5,6]. Globally, more than half of the historical habitat of elephants has been lost, and remaining ranges are increasingly shattered into smaller, isolated patches [7]. As a result, elephants are compelled to traverse human-dominated landscapes, increasing risk-prone encounters, and deepening socio-political tensions around conservation [8,9].
Although India is home to the world’s largest population of Asian elephant (>60% of global estimated numbers), yet the species occupies barely ~5% of the nation’s land area today [10]. With dense human populations in the fringes of the forested landscapes, HEC has escalated rapidly: each year, over 100 elephants and several hundred people are killed in conflict-related incidents, alongside substantial economic losses [11]. The elephant range of east central—covering Odisha, Jharkhand, Chhattisgarh, and parts of West Bengal—represents a critical but increasingly vulnerable region where rapid land-use change, and mineral-driven development are altering the structure of habitat and movement route [12].
Jharkhand, a critical node within this landscape, has undergone severe forest fragmentation due to expansion in mining and agriculture sector along with infrastructural growth. The Singhbhum region—the Saranda, Kolhan, Porahat, and Chaibasa, particularly Saranda forest divisions—supports the majority of Jharkhand’s elephants and forms a crucial migratory link to neighbouring West Bengal and Odisha. However, eroding habitat connectivity has led to repeated elephant incursions into settlements, resulting in rising casualties and reprisal threats to survival of elephants.
Although the region is ecologically significant and human- elephant conflict is intensifying, there is a paucity of spatially explicit research linking landscape dynamics with HEC patterns in Jharkhand. Addressing this gap is essential for developing evidence-based strategies that safeguard ecological connectivity while securing community livelihoods. Focusing on West Singhbhum district—a major elephant habitat undergoing rapid land-use transitions—this study aims to examine how landscape change and forest fragmentation influence the nature and distribution of HEC.
2. Materials and Methods
Study Area
This study was conducted in West Singhbhum district, Jharkhand, which forms the core of the Singhbhum Elephant Reserve. The region comprises four major forest divisions—Saranda, Kolhan, Porahat, and Chaibasa—characterized by tropical dry deciduous and moist deciduous forests dominated by Sal (Shorea robusta) (Figure 1). The area is also influenced by intensive mining activities, agricultural expansion, and anthropogenic growth, making it one of the most severe Human–Elephant Conflict (HEC) hotspots in India.
Methods
A multi-scale geospatial approach was employed to evaluate land use/land cover (LULC) change and landscape fragmentation. A cloud-free Landsat datasets for two temporal intervals (2000 and 2023) were acquired and pre-processed, including radiometric and atmospheric corrections. Supervised classification was performed using the maximum likelihood algorithm to categorize major LULC classes such as dense vegetation, sparse vegetation, agriculture, barren areas and mining areas. Landscape configuration and fragmentation dynamics were quantified using Landscape fragmentation analysis was carried out using LFT.2.0 tool [13]. to prepare fragmentation map which includes classes: Patch, Edge, Perforation, Core area <250 acres, Core area 250-500acres and Core area >500 acres (Figure 2).
HEC data for the period 2013–2023 were obtained from the Jharkhand Forest Department records, including incidents of crop raiding, property loss, human fatalities, and elephant deaths. Incident locations were geo-referenced to generate spatial conflict maps using hotspot analysis tool in ArcGIS (10.8) were used to identify high-conflict zones and their spatial association with changing landscape patterns.
Proximity analysis -Habitat suitability was assessed by integrating proximity to water, forest cover density, elevation, slope, and distance from settlements and roads.
3. Results
3.1. Status of Elephant Habitat
3.1.1. Land Use and Land Cover (LULC) Changes Across Four Forest Divisions (2000–2020)
Land Use and Land Cover (LULC) transformations over time have direct consequences for elephant habitat quality, movement, and conflict dynamics. Agricultural expansion has been observed in across the division except Saranda. Since (2000 to 2020), agricultural land has increased from 33.34% to 37.33% in CFD, 23.96% to 30.30% in KFD and from 27.7% to 31% in PFD (Table 1). Growth of barren patches reflects land degradation, soil loss, and deforestation—reflecting a situation unsuitable for foraging elephants and indicative of ecological stress. All divisions show substantial increase in barren land in two decades, especially CFD (0.03% to 5.26%), SFD ( 0.18% to 4.65%) and PFD (0.037% to 3.23%)(Table 1). Decline in perennial water sources is observed in three divisions within the period 2000 to 2020. In CFD water bodies has declined from 1.33% to 0.88%, followed by KFD (0.94% to 0.61%) and PFD (1.47% to 1.24%)(Table 1). Loss of dense forest is the most critical negative change with respect to conservation of elephant. As it reflects direct loss of core habitat availability, shelter, and natural forage. KFD (53.09% to 27.34%) and PFD (42.23% to 15.65%) show dramatic declines, indicating severe fragmentation. Whereas, in SFD dense vegetation has declined from 89.39% to 72.18% and in CFD from 40.81% to 32.77% (Table 1). A shift from dense to sparse vegetation signals progressive degradation. Sparse vegetation increased substantially in all divisions: SFD (2.93% to 16.16%), KFD (17.38% → 37.97%) and PFD (21.07% to 44.14%) (Table 1). Mining areas remain relatively small but persist in CFD and SFD. Roads and railways show marginal changes.
A steady degradation and agricultural expansion in Chaibasa create a more conflict-prone landscape. Saranda remains a stronghold of elephant habitat, but degradation is accelerating. Although, in SFD, dense vegetation remains dominant among the four division but its decline and sharp increase in sparse vegetation reflects that maintaining intact forest blocks is critical.
3.1.2. Transition in Vegetation Structure (NDVI) (2000–2020)
The vegetation structure of the landscape underwent a profound shift over the two decades, marked by a steady decline in high-quality forest and a corresponding rise in lower-density vegetation classes. In 2000, the system was dominated by Highly Dense Vegetation (66.01%), forming a compact, high-biomass forest matrix. By 2011, this category had sharply declined to 18.52%, and by 2020 it reduced further to just 4.4%, indicating extensive canopy loss and intensive disturbance (Table 2).
Conversely, Dense Vegetation, which was absent in 2000, expanded significantly to 31.41% in 2011 and further to 57.46% in 2020. This shift suggests that much of the forest transitioned from very high canopy cover to moderately high cover—still forested but structurally degraded compared to the original condition (Table 2).
Meanwhile, Moderately Dense Vegetation declined from 33.98% (2000) to 12.53% (2020), showing continued thinning of canopy structure. The most prominent increase was observed in Low Dense Vegetation, rising from 0.01% to 25.61% by 2020. This expansion signifies substantial opening of the canopy and conversion of mature forest into semi-open, degraded stands (Table 2).
The temporary surge in No Vegetation in 2011 (7.67%) reflects peak disturbance or extraction during that period, later reduced by 2020—possibly due to regrowth or land-use stabilization (Table 2).
Overall, the landscape shows a clear trajectory of progressive canopy reduction, with highly dense forests collapsing and being replaced by lower-density categories. This structural simplification indicates substantial fragmentation, degradation, and pressure on ecosystem functionality—conditions that directly affect species such as elephants, which are dependent on extensive, structurally complex forests for movement, shade, forage, and thermal buffering.
3.1.3. Landscape Fragmentation Analysis (2000–2020)
Landscape fragmentation patterns across the four forest divisions show a marked shift from large, intact forest cores toward more disturbed and edge-dominated conditions. In 2000, the landscape was characterized by a high proportion of large core forests (>500 acres), particularly in SFD (79.32%) and CFD (60.68%). By 2020, these areas had undergone substantial contraction, declining to 56.88% in SFD and 40.23% in CFD, while PFD showed the steepest reduction from 35.7% to 17.74% (Table 3).
At the same time, perforated classes increased sharply across all divisions (e.g., PFD: 9.90% to 24.95%; KFD: 7.68% → 24.89%), indicating internal canopy breaks and early-stage fragmentation. Patch and edge classes also expanded slightly, demonstrating increasing isolation of forest remnants and widening ecotones between forest and human-modified areas (Table 3).
Small core areas (<250 acres and 250–500 acres) increased proportionally in 2020, reflecting the breakup of large contiguous blocks into smaller, less functional core fragments. This structural shift from large cores to perforated, edge, and patch categories signifies progressive fragmentation, reduced habitat quality, and weakened ecological stability (Table 3).
Among the four divisions, Porahat Forest Division (PFD) experienced the most severe fragmentation. Large core areas (>500 acres) declined by nearly half (35.7% to 17.74%), while perforated and edge classes expanded rapidly, signalling substantial internal degradation and near-complete breakdown of contiguous forest blocks. This makes PFD the most structurally fragile division, with the highest ecological vulnerability and the greatest risk of sustained human–elephant conflict (Table 3).
In contrast, Saranda Forest Division (SFD), despite experiencing fragmentation, still retains the largest proportion of intact core forests (from 79.32% in 2000 to 56.88% in 2020). Although this decline is significant, Saranda continues to hold the most contiguous habitat and remains the strongest refuge for elephant conservation, offering the greatest potential for maintaining viable populations, stable movement routes, and long-term landscape connectivity(Table 3).
3.1.4. Habitat Suitability Analysis
Saranda offers the only stable elephant habitat in the district, with the largest proportion of highly suitable habitat (44.22%) supported by extensive dense forests and perennial water sources, which align with historical records of resident herds from census data. Kolhan holds a combined moderate-to-high suitable habitat share exceeding 66%, though the highly suitable areas are not continuous. Porahat shows a growing dominance of less suitable areas (32.49%) due to agricultural expansion and edge-zone development, indicating faster habitat functional decline. Chaibasa contains the lowest habitat quality with highly suitable areas restricted to only 9.84%, while unsuitable and less suitable classes together exceed 63%, reflecting a fragmented landscape primarily shaped by human settlements and cropland (Table 4).
3.2. Human Elephant Conflict in west Singhbhum
The nature and extent of Human-Elephant-Conflict (HEC) in four forest divisions of West Singhbhum, District during the study includes: Human Causality, Crop depredation, House damage, Grain loss, and Elephant mortality.
3.2.1. Human Casualty Patterns
A total of 157 human casualties were reported, highest in CFD (41.40%), followed by KFD (28.66%), SFD (15.92%), and PFD (14.01%). Notably, CFD recorded this maximum within only nine years (2012–2020), while the other three divisions accumulated their totals over 21 years (Figure 3).
A-Human Casualty in four Forest Divisions, B- Human Casualty in Ranges under four Forest Divisions, C- Nature of Human Casualty, and D- Gender-wise number of Victims in West Singhbhum District, Jharkhand. (CFD-Chaibasa Forest Division, KFD- Kolhan Forest Division, SFD- Saranda Forest Division, and PFD- Porahat Forest Division)
The severity of casualty showed that death was predominant (56.68%), followed by severe injury (22.29%) and moderate injury (21.01%). Most victims were male (87.26%), mostly 40–60 years old (59.12%), and most encounters occurred during 2000–2400 hrs (75.79%), especially during crop guarding or near homesteads. Intoxication was a major aggravating factor, with 57.32% of victims heavily drunk at the time of encounter (Figure 4). Seasonality was pronounced: maximum casualties occurred in December–February, coinciding with post-harvest periods, access to stored grains, and movement of migratory herds from Odisha and Saraikela–Kharsawan.
A-Age profile of the victim, B- Month-wise Human Casualty in Forest Divisions, C-Time of Encounter with Elephant, and D- Activities of the victim during encounter in west Singhbhum District, (CFD-Chaibasa Forest Division, KFD- Kolhan Forest Division, SFD- Saranda Forest Division, and PFD- Porahat Forest Division)
3.2.2. Crop Depredation
Crop damage was the major form of conflict, amounting to 2837.90 acres of crop loss. CFD experienced the highest proportion (63.48%), followed by PFD (16.19%), KFD (11.40%), and SFD (8.93%) (Table 5).
Crop-raid frequency mirrored this trend, with CFD accounting for 60.84% of raids. Paddy was the most damaged crop (1906.10 acres), with most destruction occurring during the harvesting phase (64.25%). Crop raiding peaked in November–December across all divisions (Table 6).
Along CFD’s agricultural landscape, five elephant corridors, and major migratory routes explain its disproportionate exposure to crop depredation. In contrast, SFD’s intact forests and perennial rivers reduced crop-raiding incidents.
3.2.3. House Damage and Grain Loss
During 2000–2020, elephants damaged 1925 houses, overwhelmingly in CFD (77.35%). Most houses were mud structures (91.22%). Severe house damage was also concentrated in CFD (76.83%) (Figure 5).
Grain loss amounted to 3146.002 quintals, with CFD again the highest contributor (48.37%), followed by PFD (30.74%), KFD (13.99%), and SFD (6.87%). Villages closest to migratory routes, forest fringes, and water sources showed maximum house and grain losses (Figure 6).
3.2.4. Elephant Mortality
A total of 35 elephant deaths occurred, dominated by CFD (42.85%) and KFD (40%).
Deaths were mostly unnatural (n = 21) from poaching (42.85%), train accidents, electrocution, and poisoning. Most deaths occurred inside forest (82.85%) and primarily affected males (60%)(Figure 7). Parallel to high mortality, elephant census data show a sharp decline across divisions: SFD: 371 (2005) to 200 (2017); KFD: 44 (2008) to 36 (2017) and CFD: 33 (2010) to 27 (2017).

Table 7.
Number of Elephant Counts According to Elephant Census in West Singhbhum District, Jharkhand.
Table 7.
Number of Elephant Counts According to Elephant Census in West Singhbhum District, Jharkhand.
| Year | Elephant Counts | |||
|---|---|---|---|---|
| KFD | CFD | PFD | SFD | |
| 2005 | - | - | - | 371 |
| 2008 | 44 | - | - | - |
| 2010 | 54 | 33 | - | 253 |
| 2012 | 8 | 38 | - | - |
| 2017 | 36 | 27 | - | 200 |
3.3. Hotspot Analysis
Human–Elephant Conflict (HEC) patterns in West Singhbhum were analysed using Getis-Ord Gi* hotspot analysis based on GPS conflict locations from 2018–2020. The results revealed strong spatial heterogeneity across the district (Figure 8). Chaibasa Forest Division (CFD) showed the highest positive Gi* z-scores, marking it as the primary HEC hotspot zone, while Porahat Forest Division (PFD) represented the major cold-spot region. Range-level assessment indicated concentrated hotspots in Samta and Koina (SFD), Noamundi and Hatgamariah (CFD), Santra and Kolhan (KFD), and Berra beat of Anandpur (PFD) (Figure 9).
Spatial autocorrelation (Moran’s I) further confirmed that HEC is non-random and significantly clustered in CFD. Moran’s I for CFD (0.0687; z = 15.703; p < 0.01) indicated strong positive clustering, while SFD, KFD, and PFD showed no significant autocorrelation (p > 0.05) (Figure 10). At the district level, clustering was again driven by CFD, reinforcing that conflict events are spatially concentrated rather than evenly distributed. Overall, the findings highlight CFD as the core conflict concentration zone, with implications for targeted mitigation and landscape-level management.
3.4. Proximity Analysis
A 1000-m buffer was generated around all HEC GPS points (2018–2020) to assess the landscape conditions associated with conflict events. Within this buffer, 486.73 acres of land overlapped with landscape fragmentation classes. Conflict was most concentrated in Edge habitats (193 Ac; 39.65%), followed by Core >500 Ac (121.78 Ac; 25.02%), Patch areas (76.55 Ac; 15.72%), Core <250 Ac (60.09 Ac; 12.35%), and Core 250–500 Ac (35.31 Ac; 7.26%) (Figure 11). These results indicate that HEC is highest along forest edges, where ecological productivity and human use frequently intersect.
NDVI-based analysis of the same buffer (1244.42 Ac) showed that most conflict-prone areas occur in dense vegetation zones (701.29 Ac; 56.35%), followed by low vegetation (308.18 Ac; 24.76%), moderate vegetation (181.09 Ac; 14.55%), and only a small share in highly dense vegetation (53.8 Ac; 4.32%). Conflict occurrence was almost absent in non-vegetated areas. Overall, HEC was strongly associated with productive vegetation and structurally fragmented forest edges.
4. Discussion
Our findings establish that human–elephant conflict (HEC) in West Singhbhum is a direct consequence of persistent landscape degradation and fragmentation, rather than random elephant behaviour [5,6,14].Across two decades, the district has undergone extensive loss of dense forest, progressive reduction in canopy cover, and fragmentation of core habitats, resulting in predictable spatial clustering of conflict and declining elephant populations [4,10].
The deterioration of high-quality forest structure, evidenced by NDVI transitions from highly dense to lower-density vegetation classes, indicates widespread reduction in forage quality, cover, and canopy mediated microclimatic regulation [15,16]. Elephants being an energetically constrained megaherbivores, responds to such habitat degradation by ranging more widely and increasingly rely on anthropogenic food sources [3,17].
The strong association between productive yet fragmented vegetation and conflict occurrence indicate that HEC emerges most strongly at forest–agriculture interfaces rather than in fully deforested landscapes [6,8].Fragmentation analysis revealed a marked shift from large contiguous core forests to perforated and edge-dominated habitats, particularly in Chaibasa and Porahat Forest Divisions. These structural changes disrupt movement pathways and compress elephant space use into narrow corridors adjacent to settlements [14,18].
The statistically significant clustering of Human elephant conflict in Chaibasa confirms that conflict is spatially structured and strongly linked with fragmented landscapes, supporting the global findings that increase edge density elevates encounter rates between elephants and humans [5,19].
The asymmetry in conflict across divisions is further clarified by habitat suitability modelling. Saranda Forest Division remains the only landscape retaining substantial highly suitable habitat and large core areas, enabling continued elephant occupancy and relatively lower conflict intensity [10,20] (20Graham et al. 2010; 10Williams et al. 2020). Conversely, Chaibasa and Porahat are dominated by marginal and unsuitable habitats, compelling elephants to use agricultural matrices seasonally. The resulting spatial mismatch between elephant habitat needs and available landscape conditions explains why these divisions function as conflict sinks rather than viable habitats [6,21].
Proximity analyses shows majority of the conflict events occur within 1 km of forest edges and degraded but productive vegetation, highlighting transitional habitats as critical zones for HEC interactions [8,9]. Depredation of crops peaks during harvest seasons, when caloric benefits are highest, reinforcing the role of agricultural expansion into former forest corridors as a key driver of conflict [5,17]. These observations align with the global evidence that HEC intensity increases when subsistence crops replace natural forage along elephant movement routes [4,10].
Patterns of elephant mortality and decline in population provide further evidence of landscape-driven stress. The prevalence of unnatural deaths and the decline in elephant population across divisions indicate that fragmented forests no longer function as secure refugia [11,22]. Increased anthropogenic intrusion into forest interiors—via mining, roads, and settlements—has amplified mortality risk and compromised population resilience [11,22].Collectively, the results shows that in West Singhbhum , HEC emerges from landscape configuration. Areas observed with high fragmentation, reduced habitat suitability, and corridor obstruction consistently shows intensified conflict and elephant mortality. Conversely, landscapes retaining large core forests and connectivity support coexistence at lower conflict levels [5,6,13]. Across all forms of conflict—casualty, crop loss, house damage, grain loss, and elephant mortality—Chaibasa Forest Division emerged as the dominant hotspot driven by a combination of landscape fragmentation, corridor overlap, high cultivation, and settlement proximity. Across all analytical layers—LULC change, fragmentation, NDVI decline, proximity to agriculture, suitability modelling, and elephant census trends—the evidence converges on a single conclusion: landscape dynamics overwhelmingly shape human–elephant conflict in West Singhbhum.
5. Conclusions
In landscapes such as West Singhbhum, conflict mitigation strategies cannot totally rely on reactive measures such as compensation, guarding, or early-warning systems etc. Long-term approach such restoring habitat quality, securing and reconnecting elephant movement corridors, preventing further fragmentation from mining and infrastructure, and reinforcing Saranda as the primary ecological refuge can help reduce HEC in west Singhbhum. For elephants and humans to coexist there is a need of landscape-scale planning to be integrated with conservation priorities into development decisions.
Author Contributions
For research articles with several authors, a short paragraph specifying their individual contributions must be provided. The following statements should be used “Conceptualization, SKP and AL; methodology, SKP; software, AL; validation, SKP; formal analysis, SKP and AL; investigation, AL; resources, SKP; data curation, SKP; writing—original draft preparation, AL; writing—review and editing, SKP; visualization, AL; supervision, SKP; project administration, SKP; funding acquisition, AL. All authors have read and agreed to the published version of the manuscript.”.
Funding
Please add: “This research received no external funding” or “This research was funded by University Grants Commission, New Delhi for Moulana Azad National Fellowship (MANF), F1-17.1/2017-18/MANF-2017-18-ORI-79895.
Acknowledgments
Authors are thankful to the Divisional Forest Officers of Saranda, Chaibasa, Kolhan and Porahat Forest Division, Jharkhand, India, for providing information on HEC. We thank the Forest Range Officers of the Forest Divisions for their support.
Conflicts of Interest
“The authors declare no conflicts of interest.”.
Abbreviations
The following abbreviations are used in this manuscript:
| HEC | Human Elephant Conflict |
| CFD | Chaibasa Forest Division |
| SFD | Saranda Forest Division |
| KFD | Kolhan Forest Division |
| PFD | Porahat Forest Division |
| LULC | Land Use Land Cover |
| NDVI | Normalised Difference Vegetation Index |
References
- Lambin, E.F.; Turner, B.L.; Geist, H.J.; Agbola, S.B.; Angelsen, A.; Bruce, J.W.; Coomes, O.T.; Dirzo, R.; Fischer, G.; Folke, C.; George, P.S.; Homewood, K.; Imbernon, J.; Leemans, R.; Li, X.; Moran, E.F.; Mortimore, M.; Ramakrishnan, P.S.; Richards, J.F.; Skånes, H.; Steffen, W.; Stone, G.D.; Svedin, U.; Veldkamp, T.A.; Vogel, C.; Xu, J. The causes of land-use and land-cover change: moving beyond the myths. Glob. Environ. Change 2001, 11, 261–269. [Google Scholar] [CrossRef]
- Lawler, J.J.; Lewis, D.J.; Nelson, E.; Plantinga, A.J.; Polasky, S.; Withey, J.C.; Helmers, D.P.; Martinuzzi, S.; Pennington, D.; Radeloff, V.C. Projected land-use change impacts on ecosystem services in the United States. Proc. Natl. Acad. Sci. USA 2014, 111, 7492–7497. [Google Scholar] [CrossRef] [PubMed]
- Fernando, P.; Wikramanayake, E.D.; Janaka, H.K.; Jayasinghe, L.K.A.; Gunawardena, M.; Kotagama, S.W.; Weerakoon, D.; Pastorini, J. Ranging behavior of the Asian elephant in Sri Lanka. Mamm. Biol. 2008, 73, 2–13. [Google Scholar] [CrossRef]
- Sukumar, R. The Living Elephants: Evolutionary Ecology, Behavior, and Conservation, 1st ed.; Oxford University Press, 2003; p. 478 pages. [Google Scholar]
- Hoare, R. Lessons from human–elephant conflict mitigation. Hum. Dimens. Wildl. 2015, 20, 289–295. [Google Scholar]
- Shaffer, L.J.; Khadka, K.K.; Van Den Hoek, J.; Naithani, K.J. Human-Elephant Conflict: A Review of Current Management Strategies and Future Directions. Front. Ecol. Evol. 2019, 6, 235. [Google Scholar] [CrossRef]
- Vu, H.T.; Le, D.D.; Kim, S. Land use change and biodiversity loss in Vietnam: A spatial and policy analysis. Land. Use. Pol. 2020, 99, 104850. [Google Scholar] [CrossRef]
- Barua, M.; Bhagwat, S.A.; Jadhav, S. The hidden dimensions of human– wildlife conflict: Health impacts, opportunity, and transaction costs. Biological Conservation 2013, 157, 309–316. [Google Scholar] [CrossRef]
- Dickman, A.J. Complexities of conflict: human–wildlife conflict. Anim. Conserv. 2010, 13, 365–366. [Google Scholar] [CrossRef]
- Williams, C.A.; Tiwari, S.K.; Goswami, V.R.; De Silva, S.; Kumar, A.; Baskaran, N.; et al. Elephas maximus, The IUCN Red List of Threatened Species; IUCN: Gland, Switzerland, 2020. [Google Scholar] [CrossRef]
- Pandey, R.K.; Yadav, S.P.; Selvan, K.M.; Natarajan, L.; Nigam, P. Patterns of elephant mortality in India. J. Wildl. Manag. 2024, 88, e22456. [Google Scholar]
- Menon, V.; Tiwari, S.K.; Easa, P.S.; Sukumar, R. Right of passage: Elephant corridors of India, 1st ed.; Wildlife Trust of India, India, 2017. [Google Scholar]
- Vogt, P.; Riitters, K.H.; Estreguil, C.; Kozak, J.; Wade, T.G.; Wickham, J.D. Mapping spatial patterns with morphological image processing. Landscape Ecology 2007, 22, 171–177. [Google Scholar] [CrossRef]
- Fahrig, L. Effects of habitat fragmentation on biodiversity. Annu. Rev. Ecol. Evol. Syst. 2003, 34, 487–515. [Google Scholar] [CrossRef]
- Pettorelli, N.; Vik, J.O.; Mysterud, A.; Gaillard, J.M.; Tucker, C.J.; Stenseth, N.C. Using the satellite-derived Normalized Difference Vegetation Index (NDVI) to assess ecological effects of environmental change. Trends. Ecol. Evol. 2005, 20, 503–510. [Google Scholar] [CrossRef]
- Gautam, P.; Rownock, M.S.; Gupta, A.D.; Ghatak, D.; Qureshi, S. Vegetation productivity and human–elephant conflict in fragmented landscapes. Ecological Indicators 2021, 125, 107–116. [Google Scholar]
- Chiyo, P.I.; Cochrane, E.P.; Naughton, L.; Basuta, G.I. Foraging behaviour of elephants in human-dominated landscapes. African Journal of Ecology 2011, 49, 273–283. [Google Scholar]
- Goswami, V.R.; Vasudevb, D.; Olia, M.K. The importance of conflict-induced mortality for conservation planning in areas of human–elephant co-occurrence. Biol. Conserv. 2014, 176, 191–198. [Google Scholar] [CrossRef]
- Getis, A.; Ord, J.K. The analysis of spatial association by distance statistics. Geogr. Anal. 1992, 24, 189–206. [Google Scholar]
- Graham, M.D.; Douglas-Hamilton, I.; Adams, W.M.; Lee, P.C. The movement of elephants in a human-dominated landscape. Anim. Conserv. 2009, 12, 445–455. [Google Scholar] [CrossRef]
- Pulliam, H.R. Sources, sinks, and population regulation. Am. Nat. 1988, 132, 652–661. [Google Scholar] [CrossRef]
- Thouless, C.R.; Dublin, H.; Blanc, J.; Skinner, D.; Daniel, T.; Taylor, R.; Maisels, F.; Bouché, P. African elephant status report 2016: An update from the African Elephant Database (Occasional Paper Series of the IUCN Species Survival Commission No. 60). IUCN., 2016. https://www.dropbox.com/s/7a8w3kk6r9hzm0r/AfESG%20African%20Elephant%20Status%20Report%202016.pdf?dl=1.
Figure 1.
Map of four Forest Divisions of West Singhbhum, Jharkhand, India.
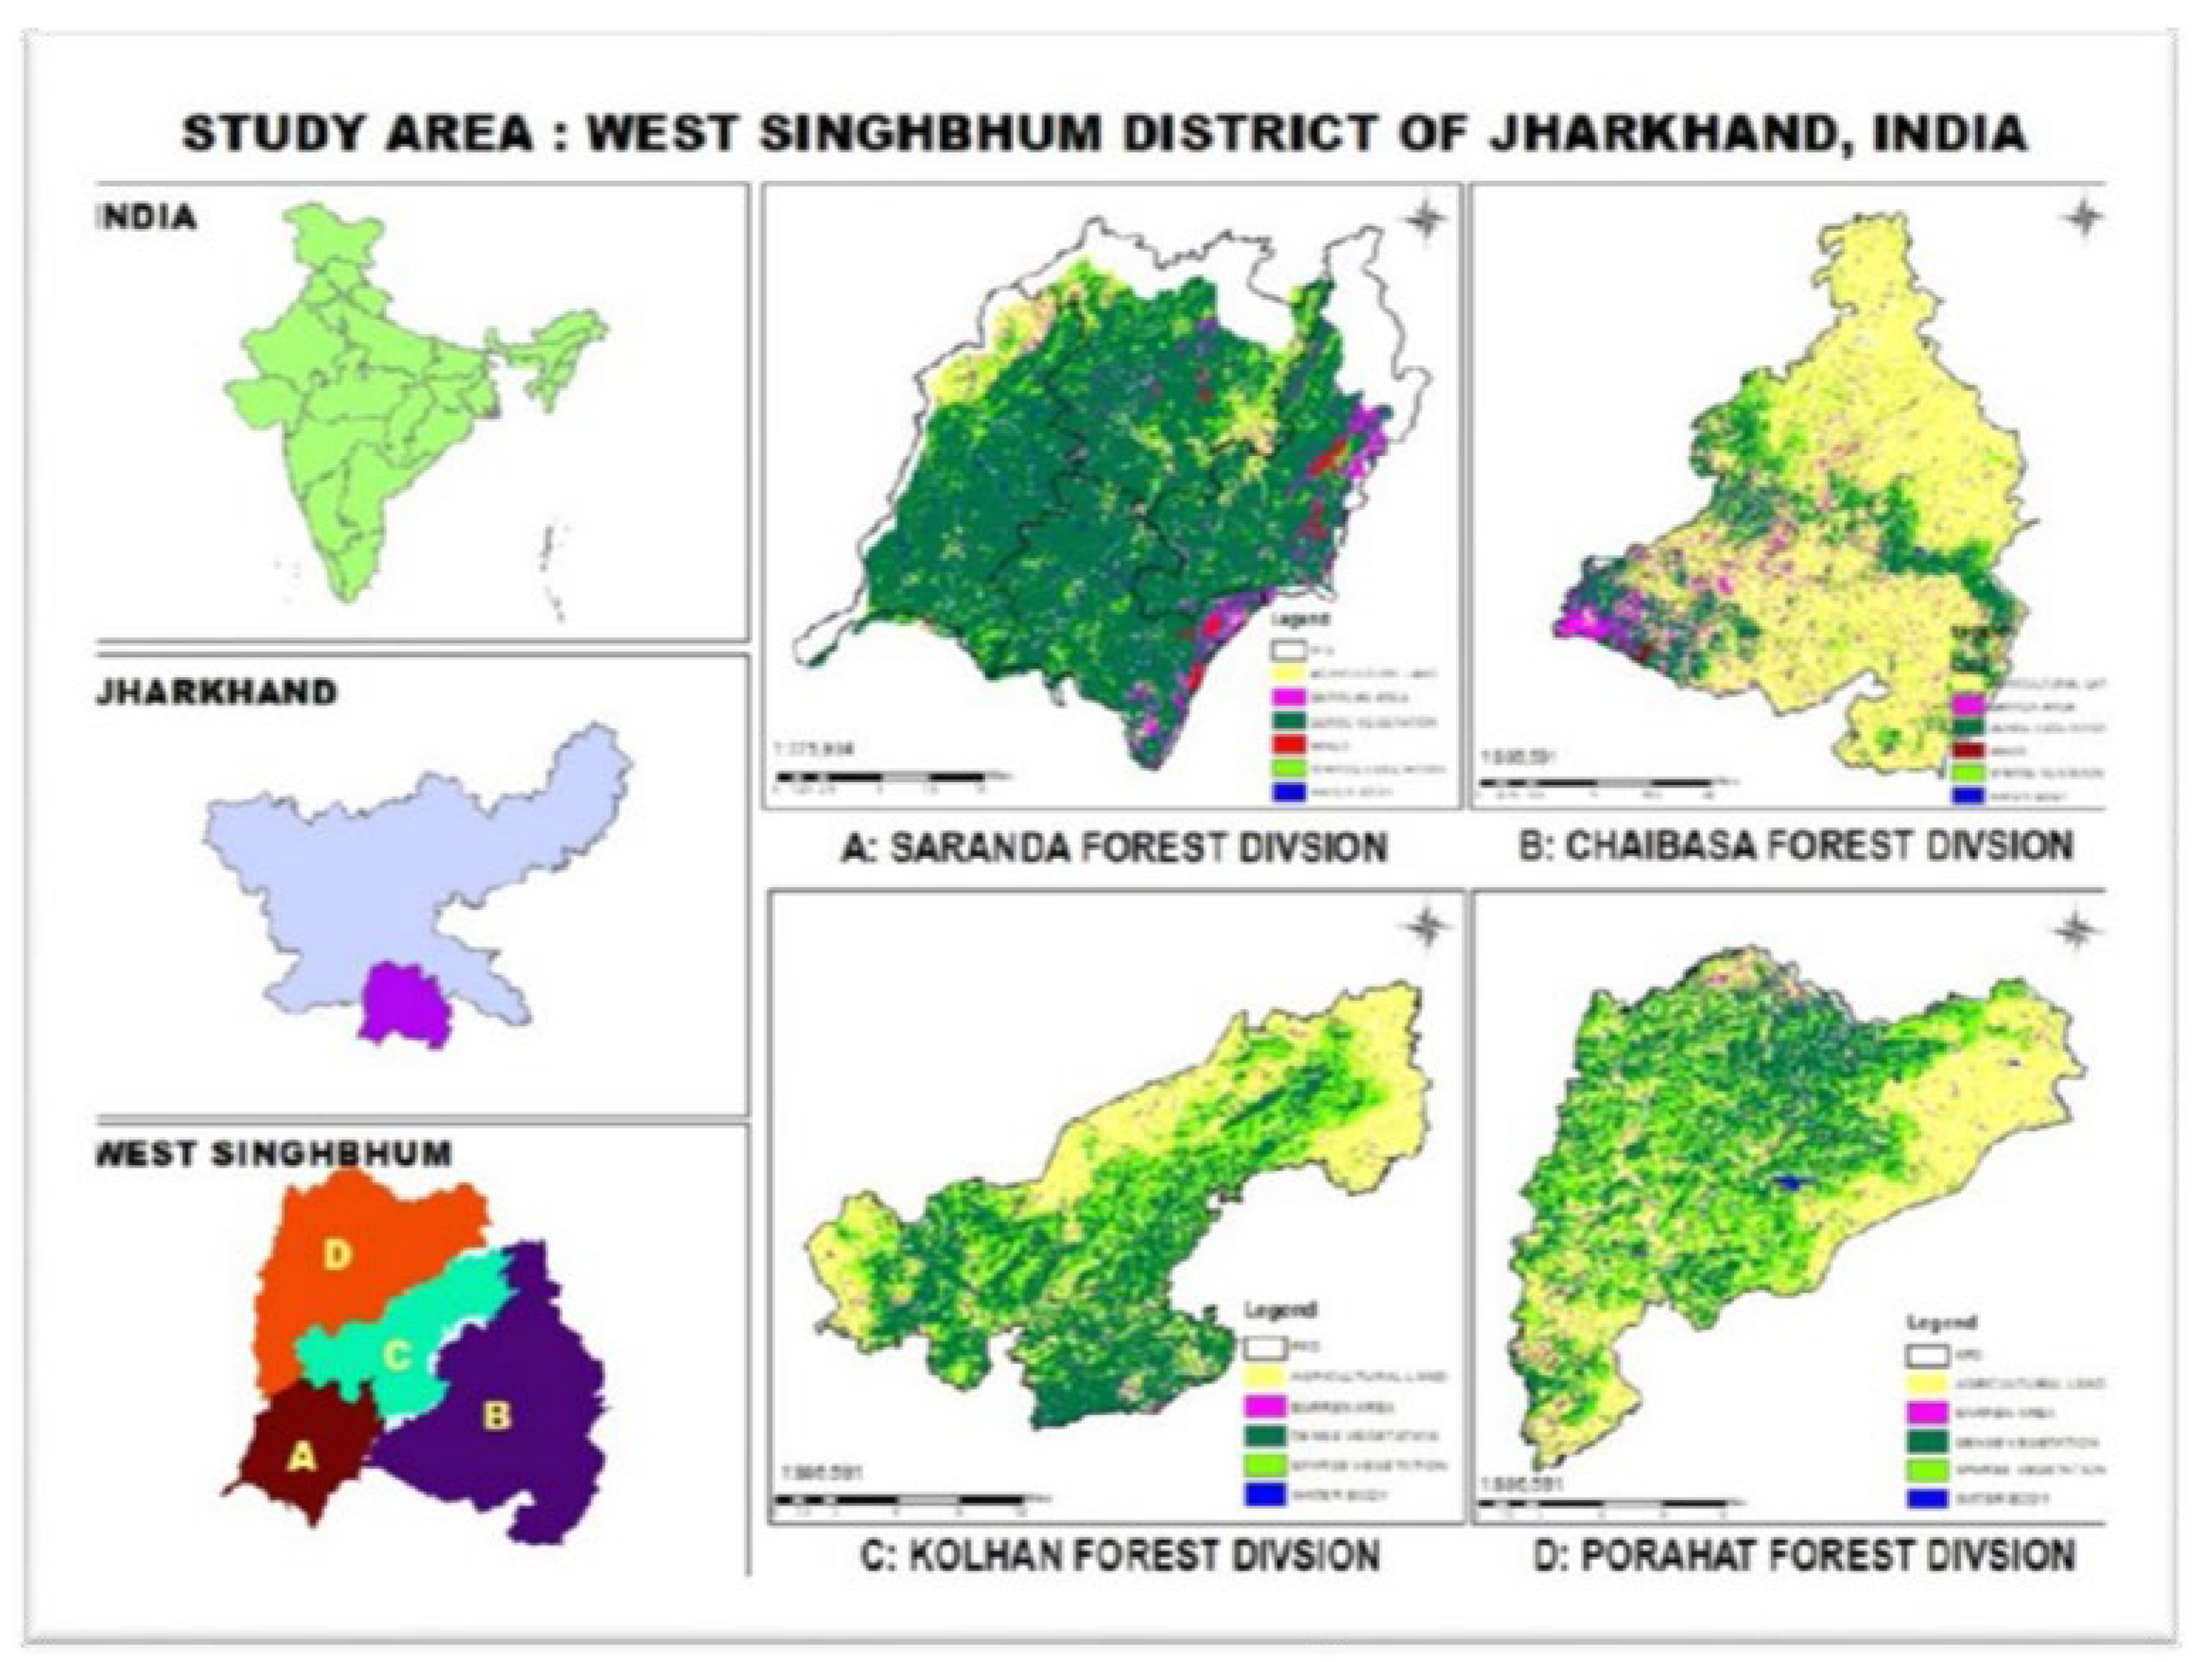
Figure 2.
Flow chart of work carried out during the study period.
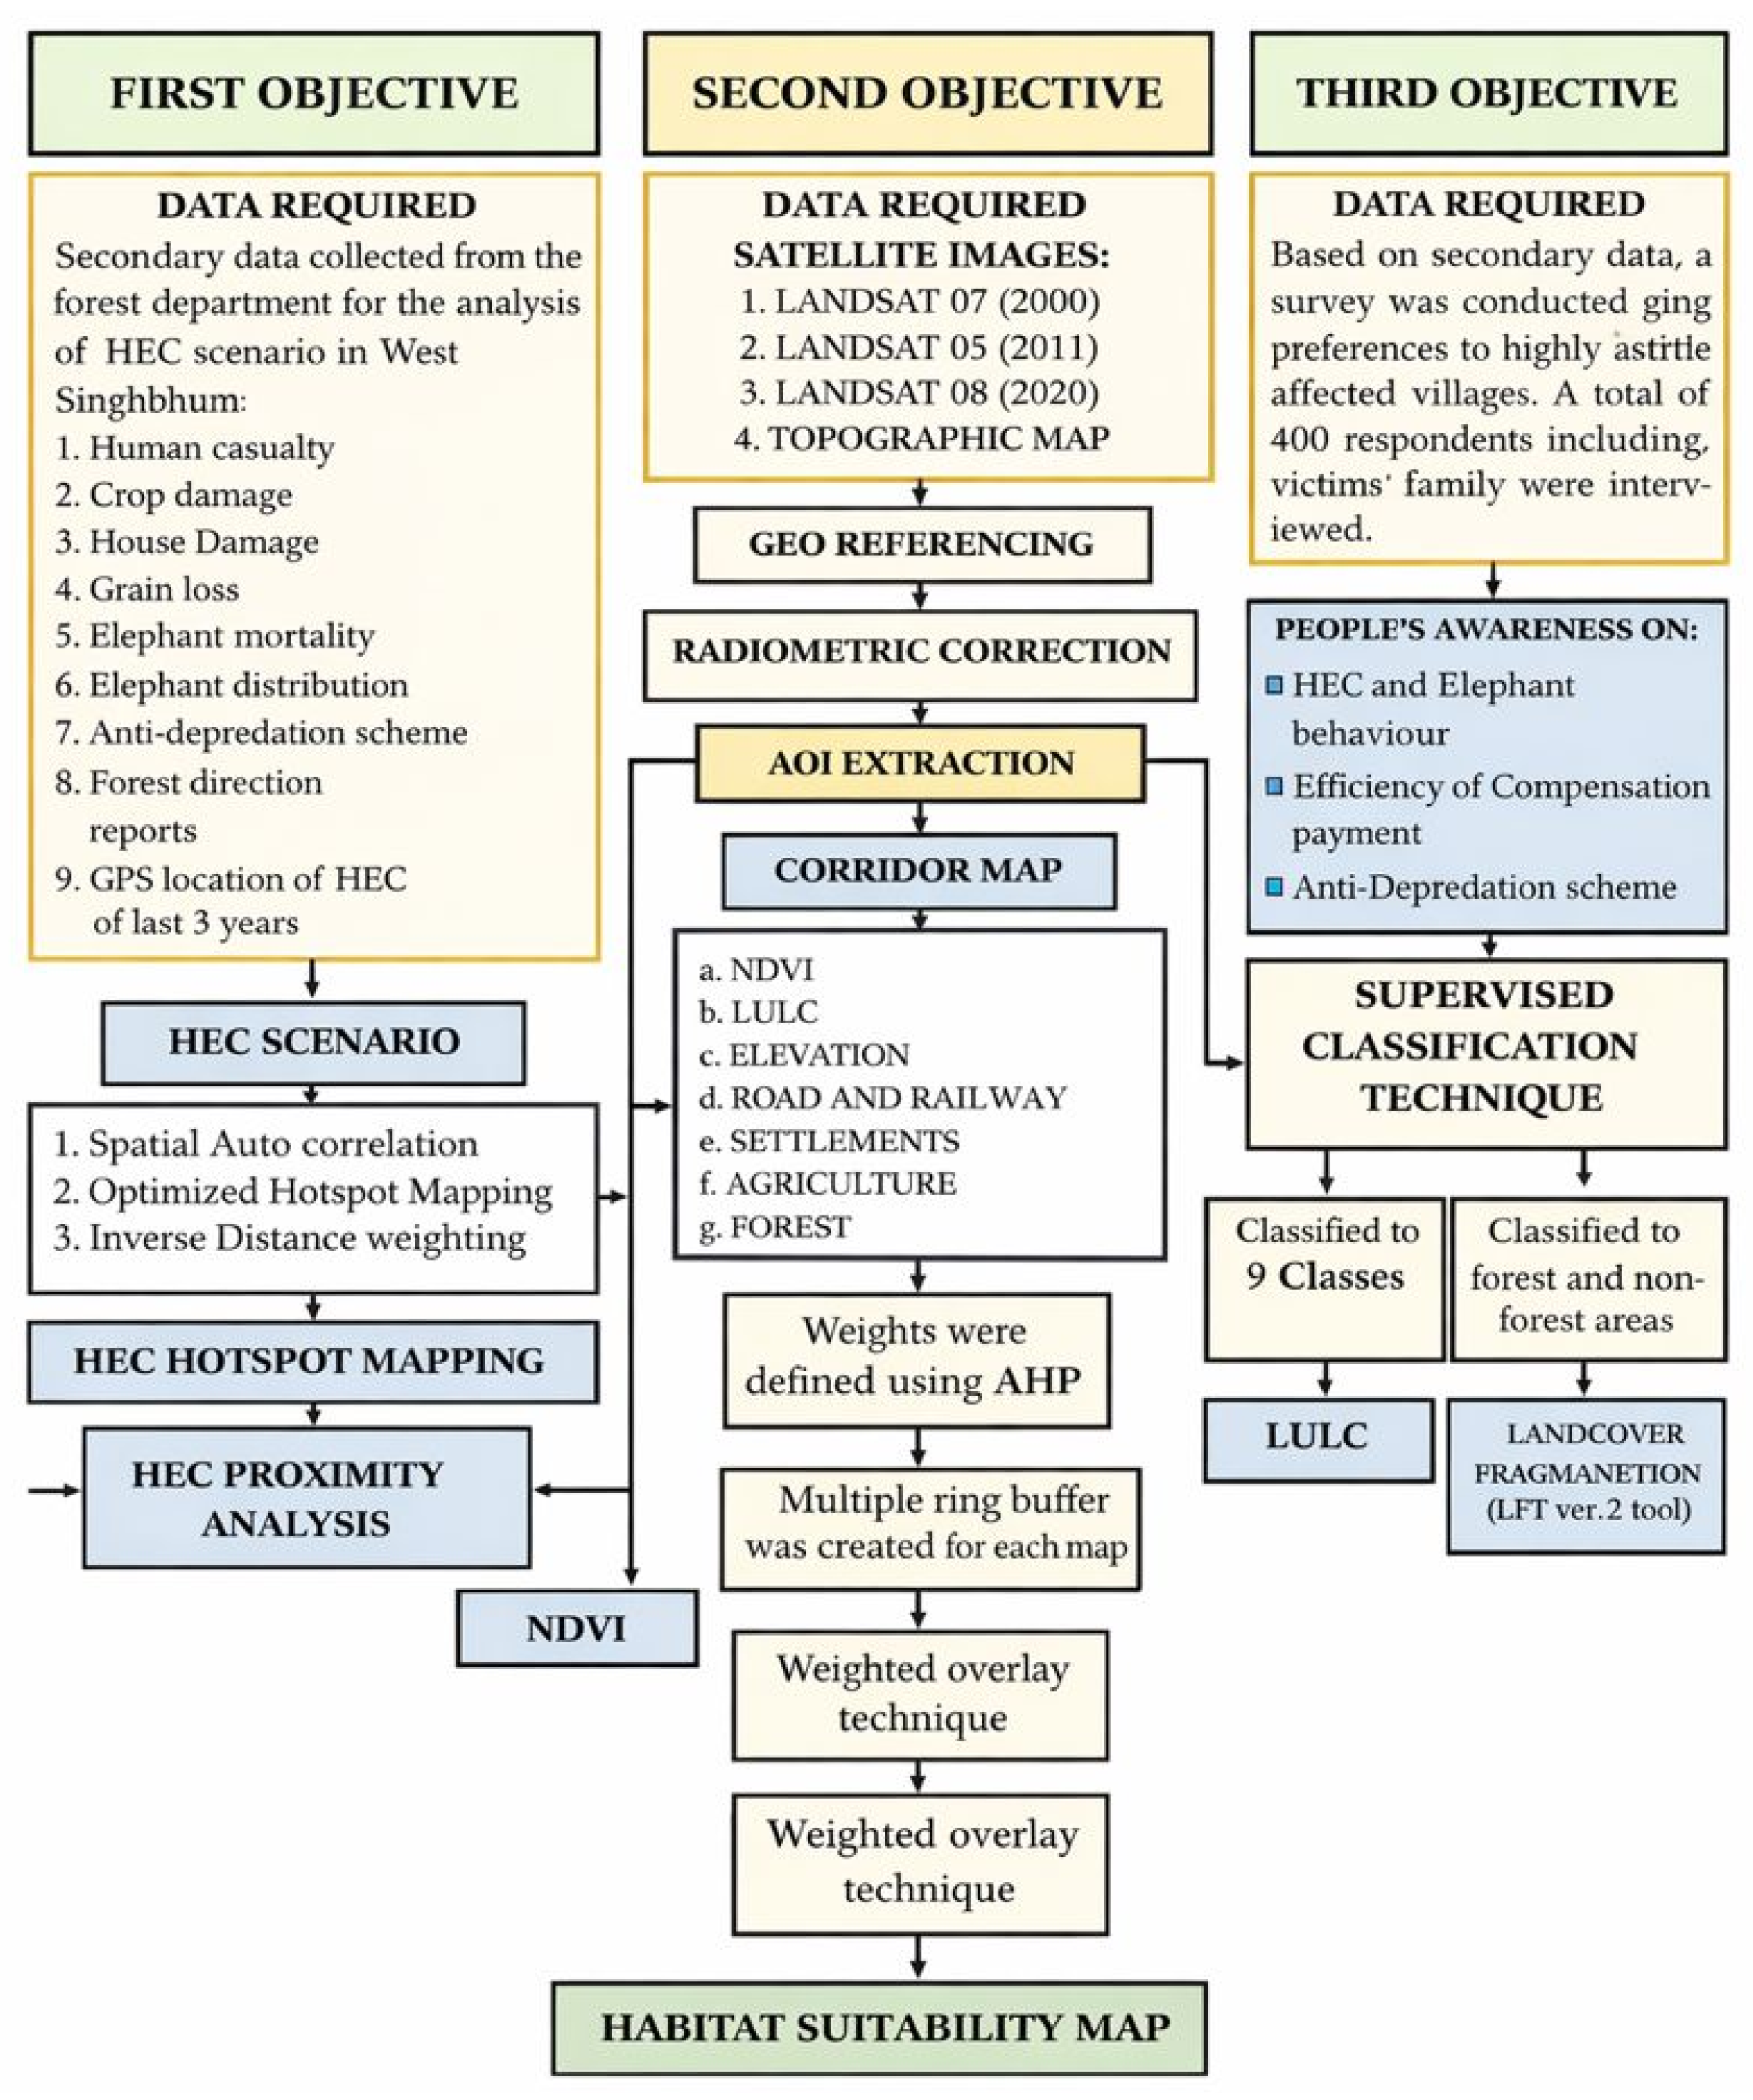
Figure 3.
Human Casualty Patterns in four Sorest Divisions of west Singhbhum, Jharkhand, India.
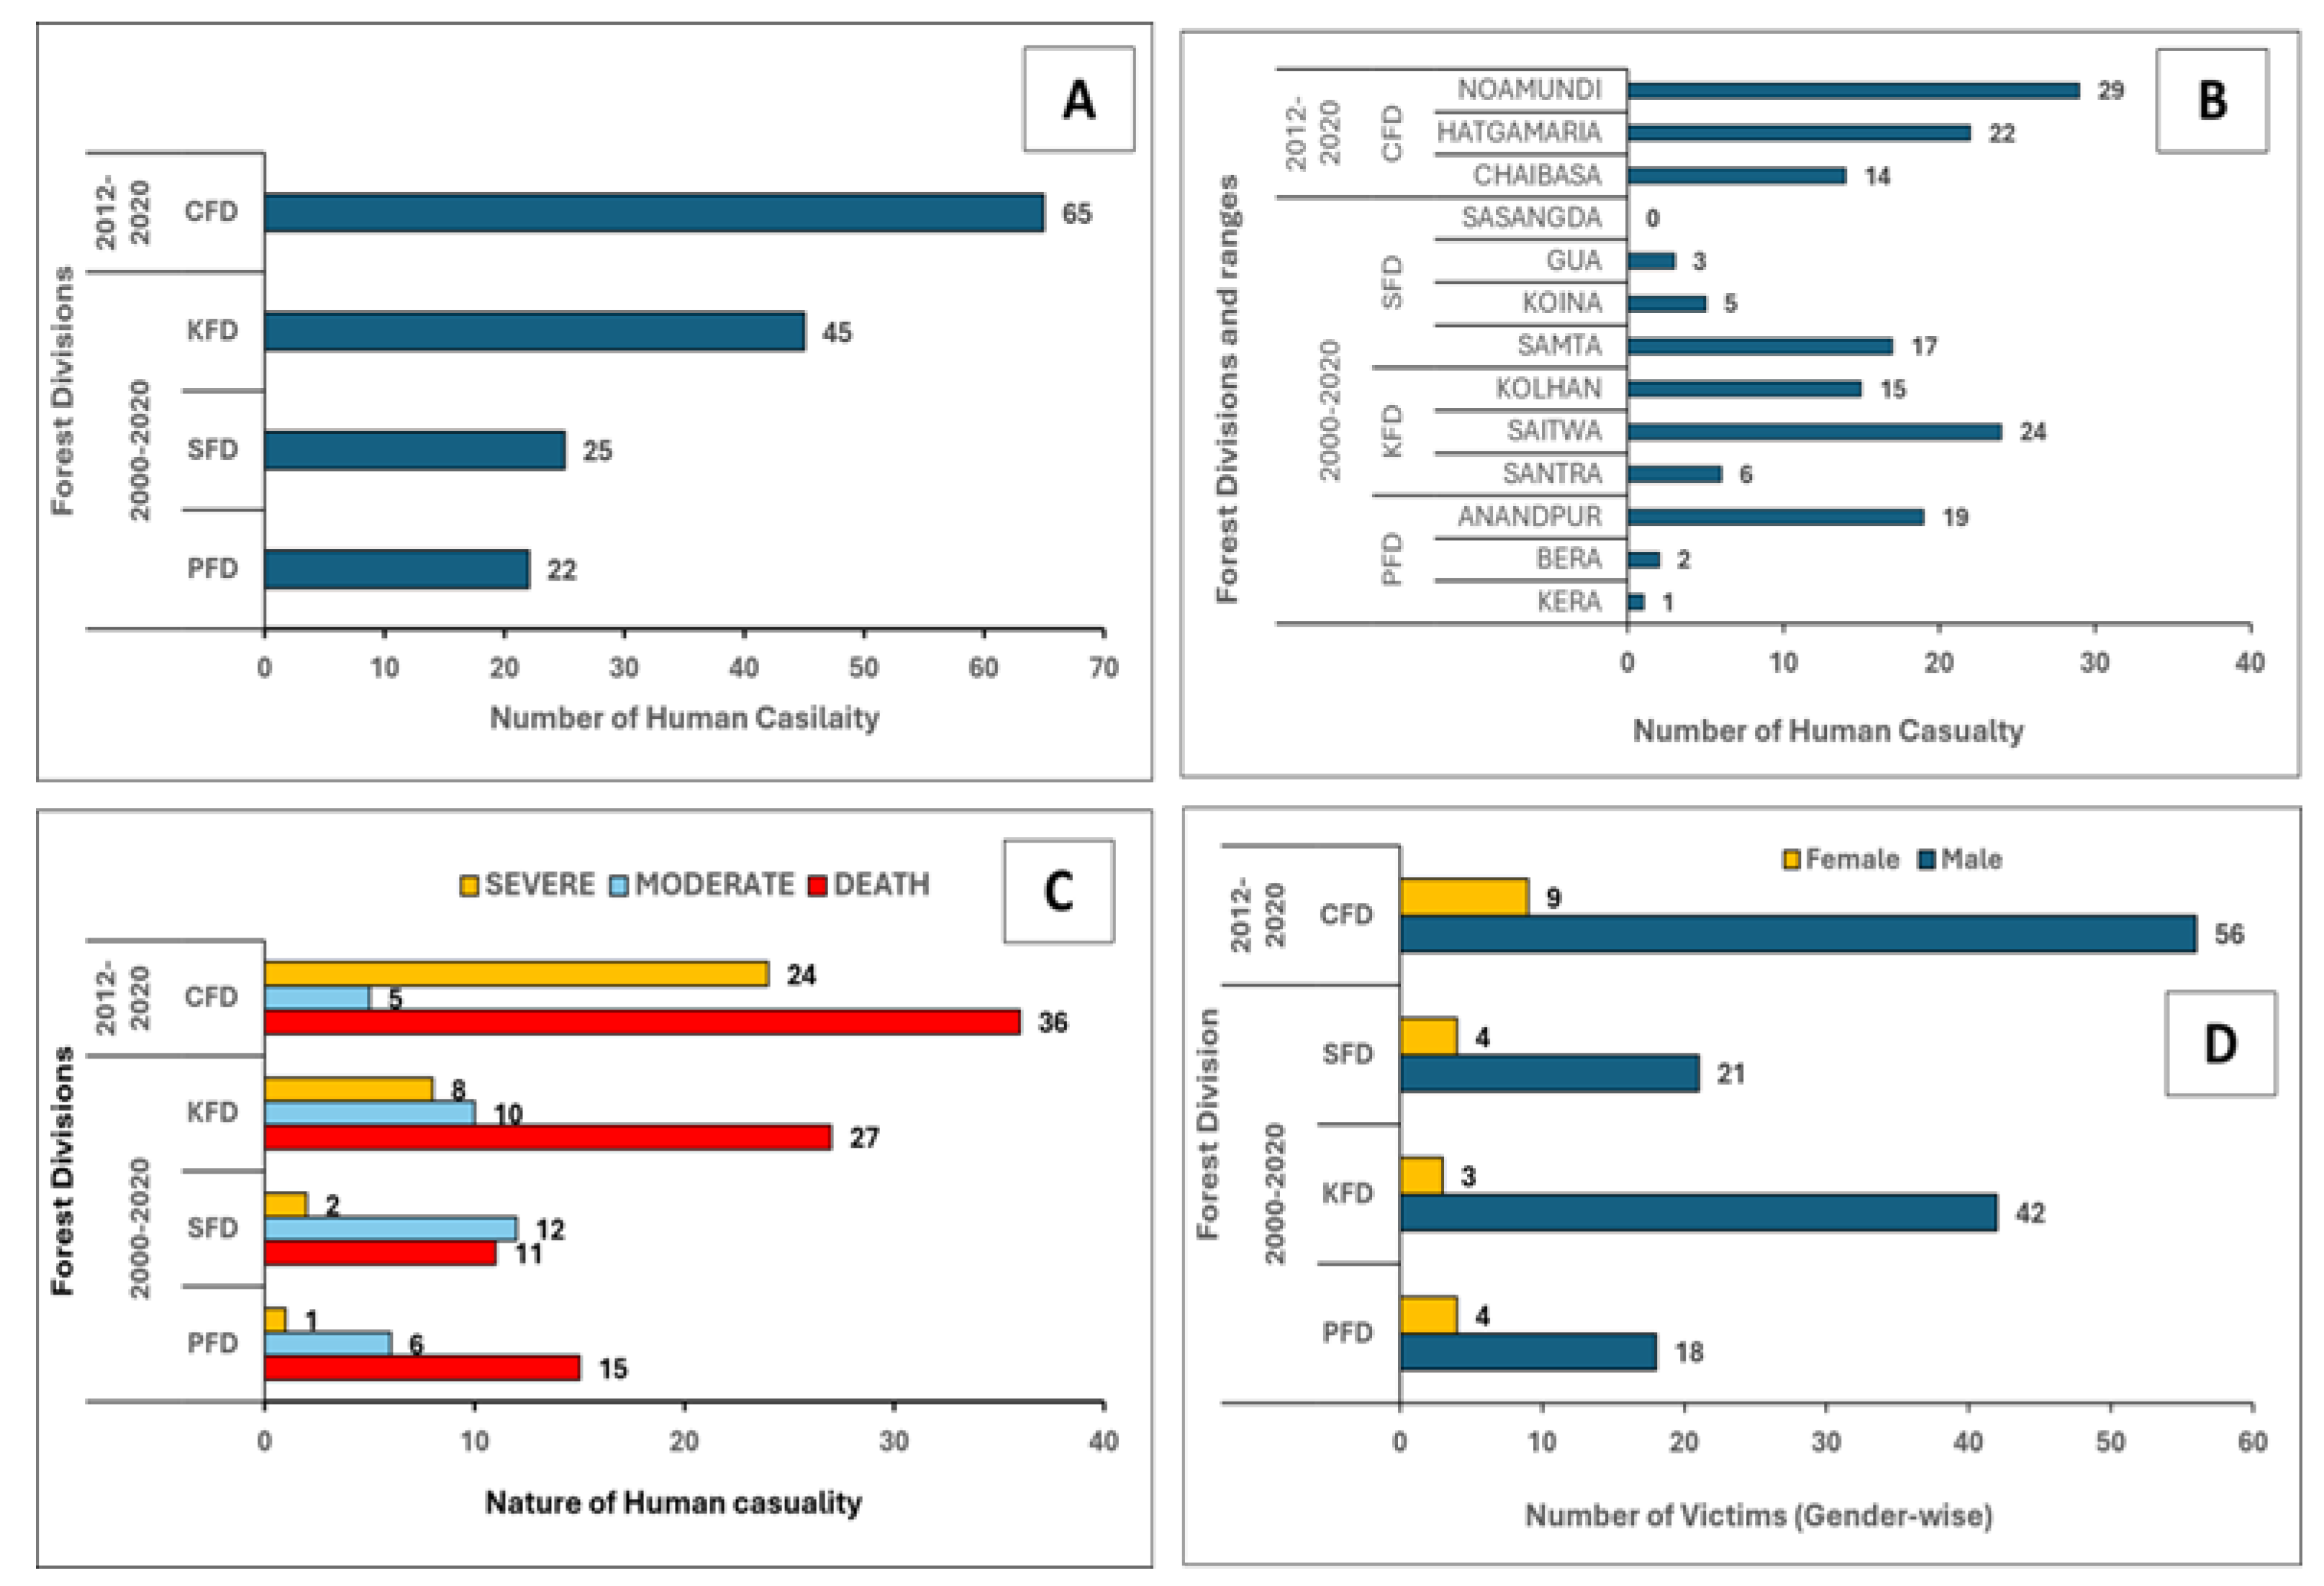
Figure 4.
Profile of the victims in four Forest Divisions of west Singhbhum, Jharkhand, India.
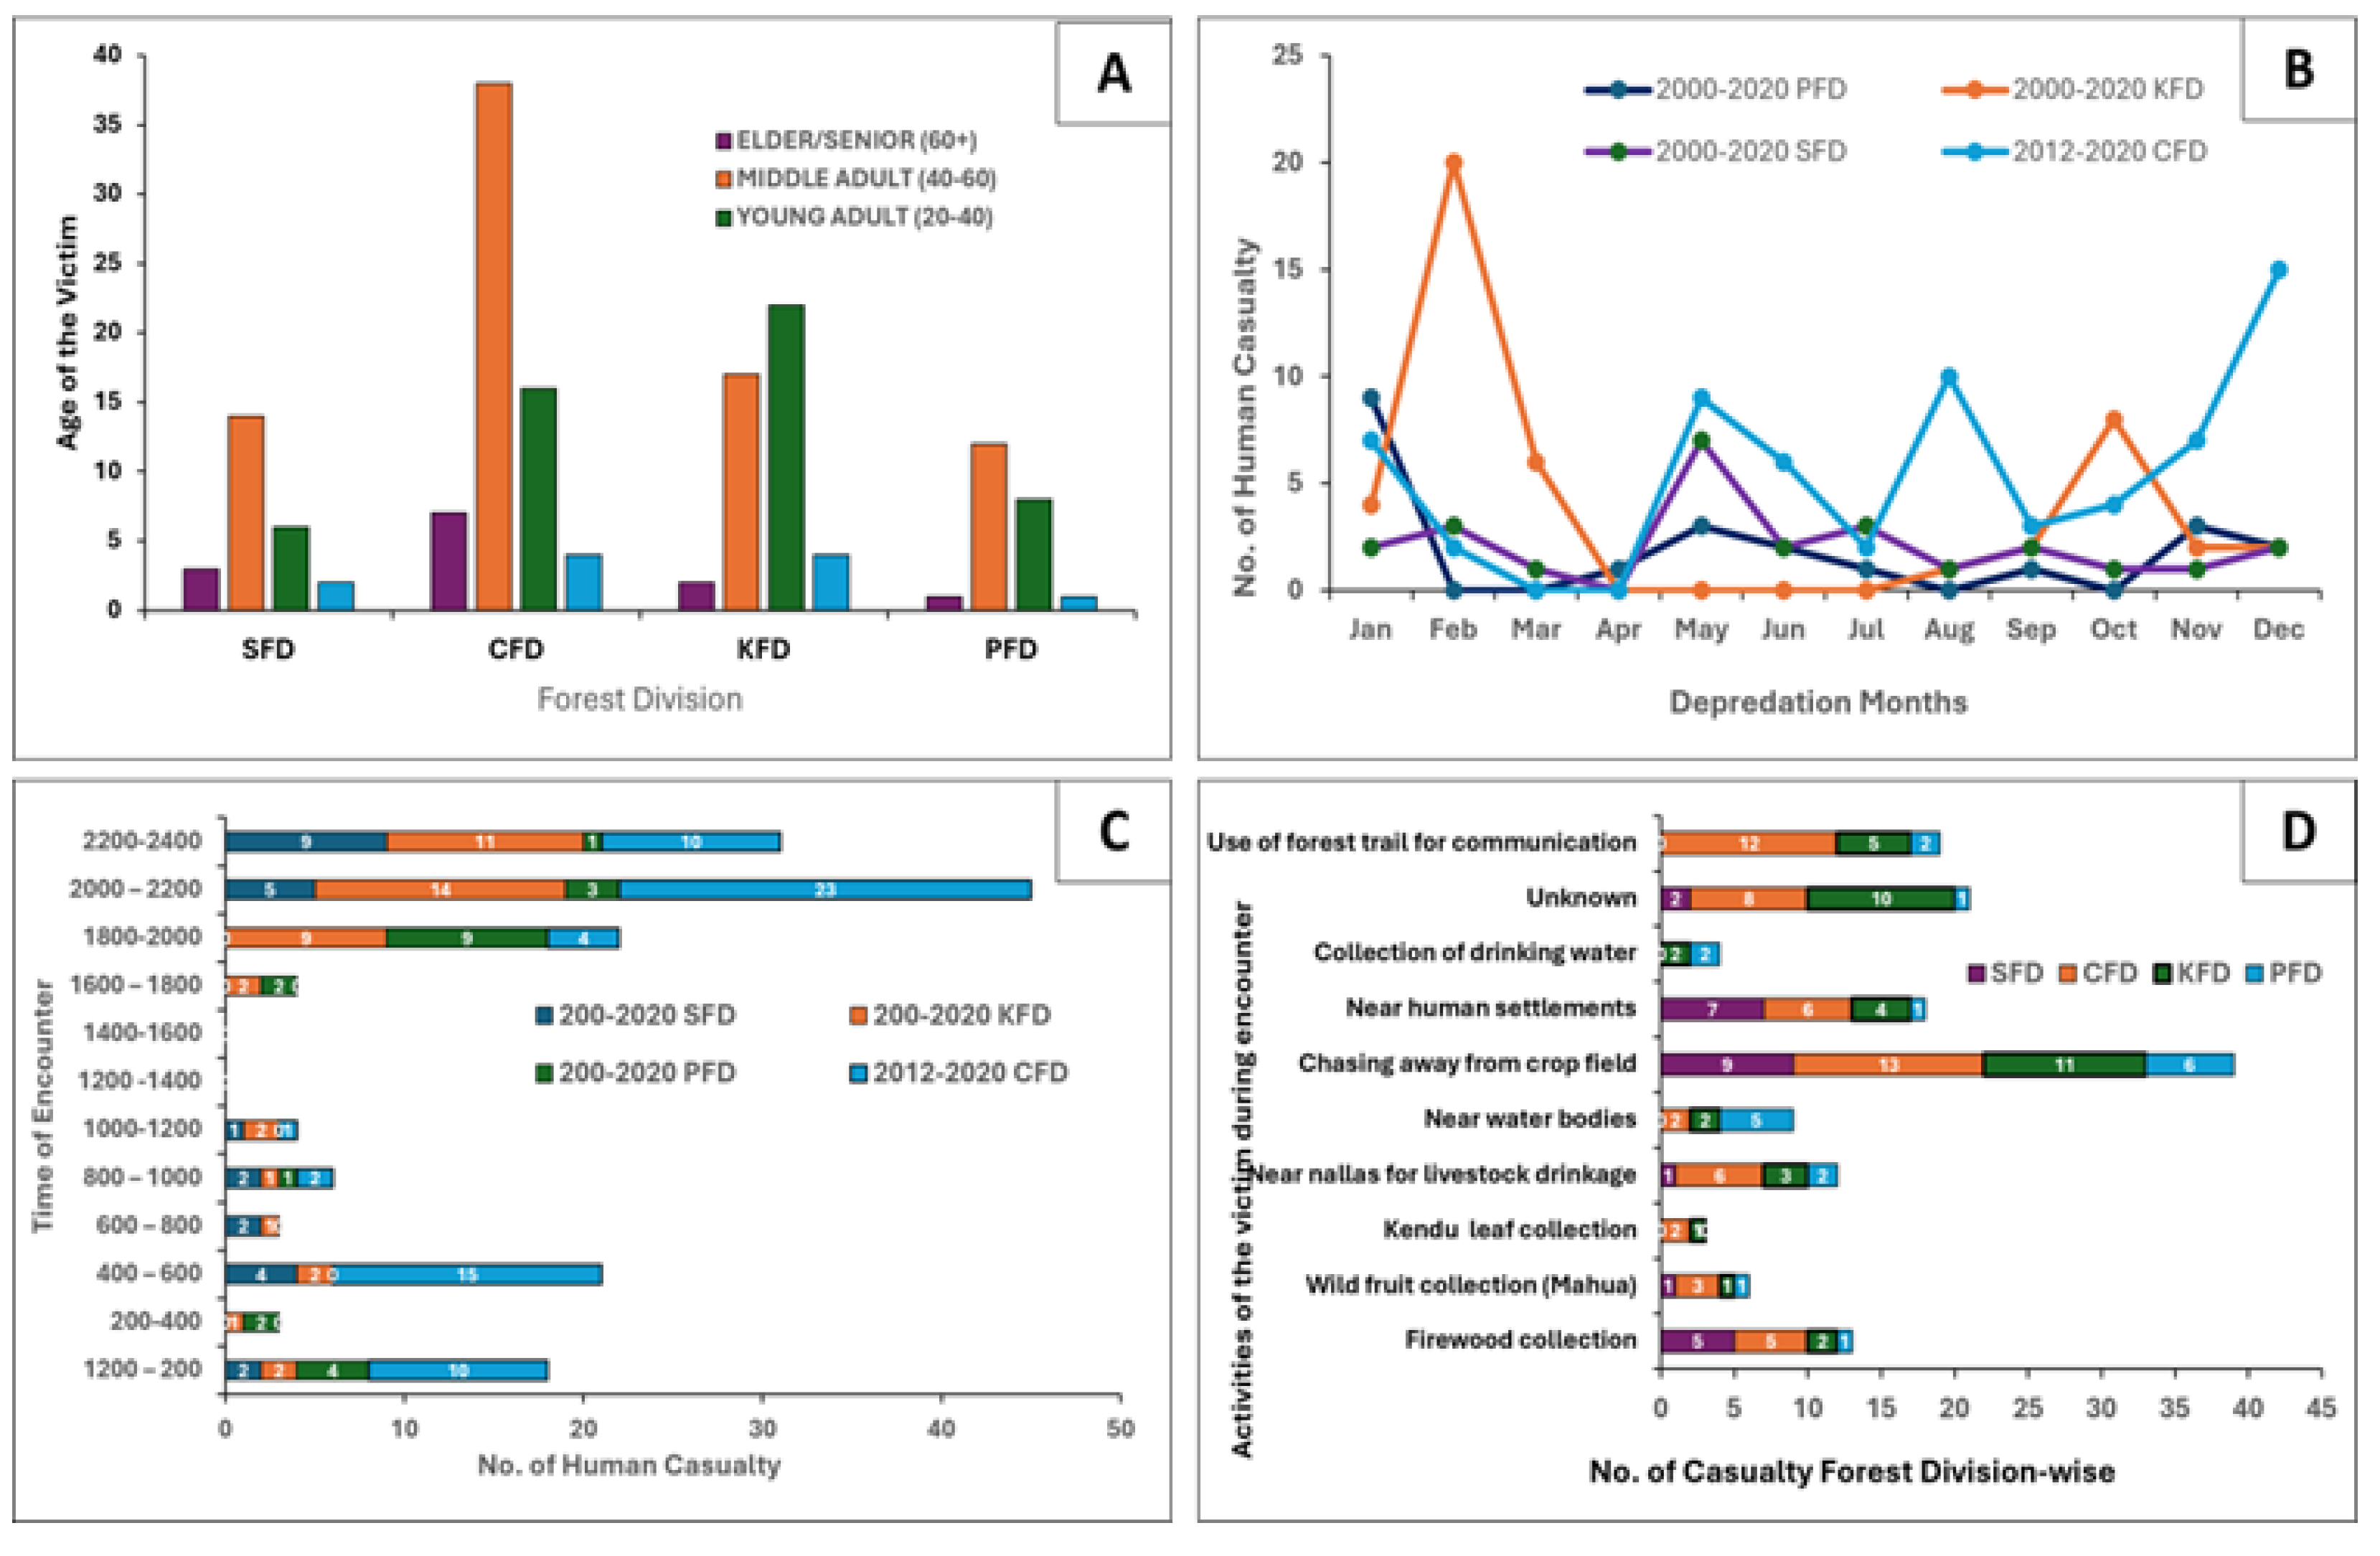
Figure 5.
House Damage by Elephants in four Forest Divisions of West Singhbhum District, Jharkhand, India. A- No. of House Damaged, B- No. of House Damaged with Grain Loss, C- Type of House Damaged, and D- Severity of House Damaged. (CFD-Chaibasa Forest Division, KFD- Kolhan Forest Division, SFD- Saranda Forest Division, and PFD- Porahat Forest Division).
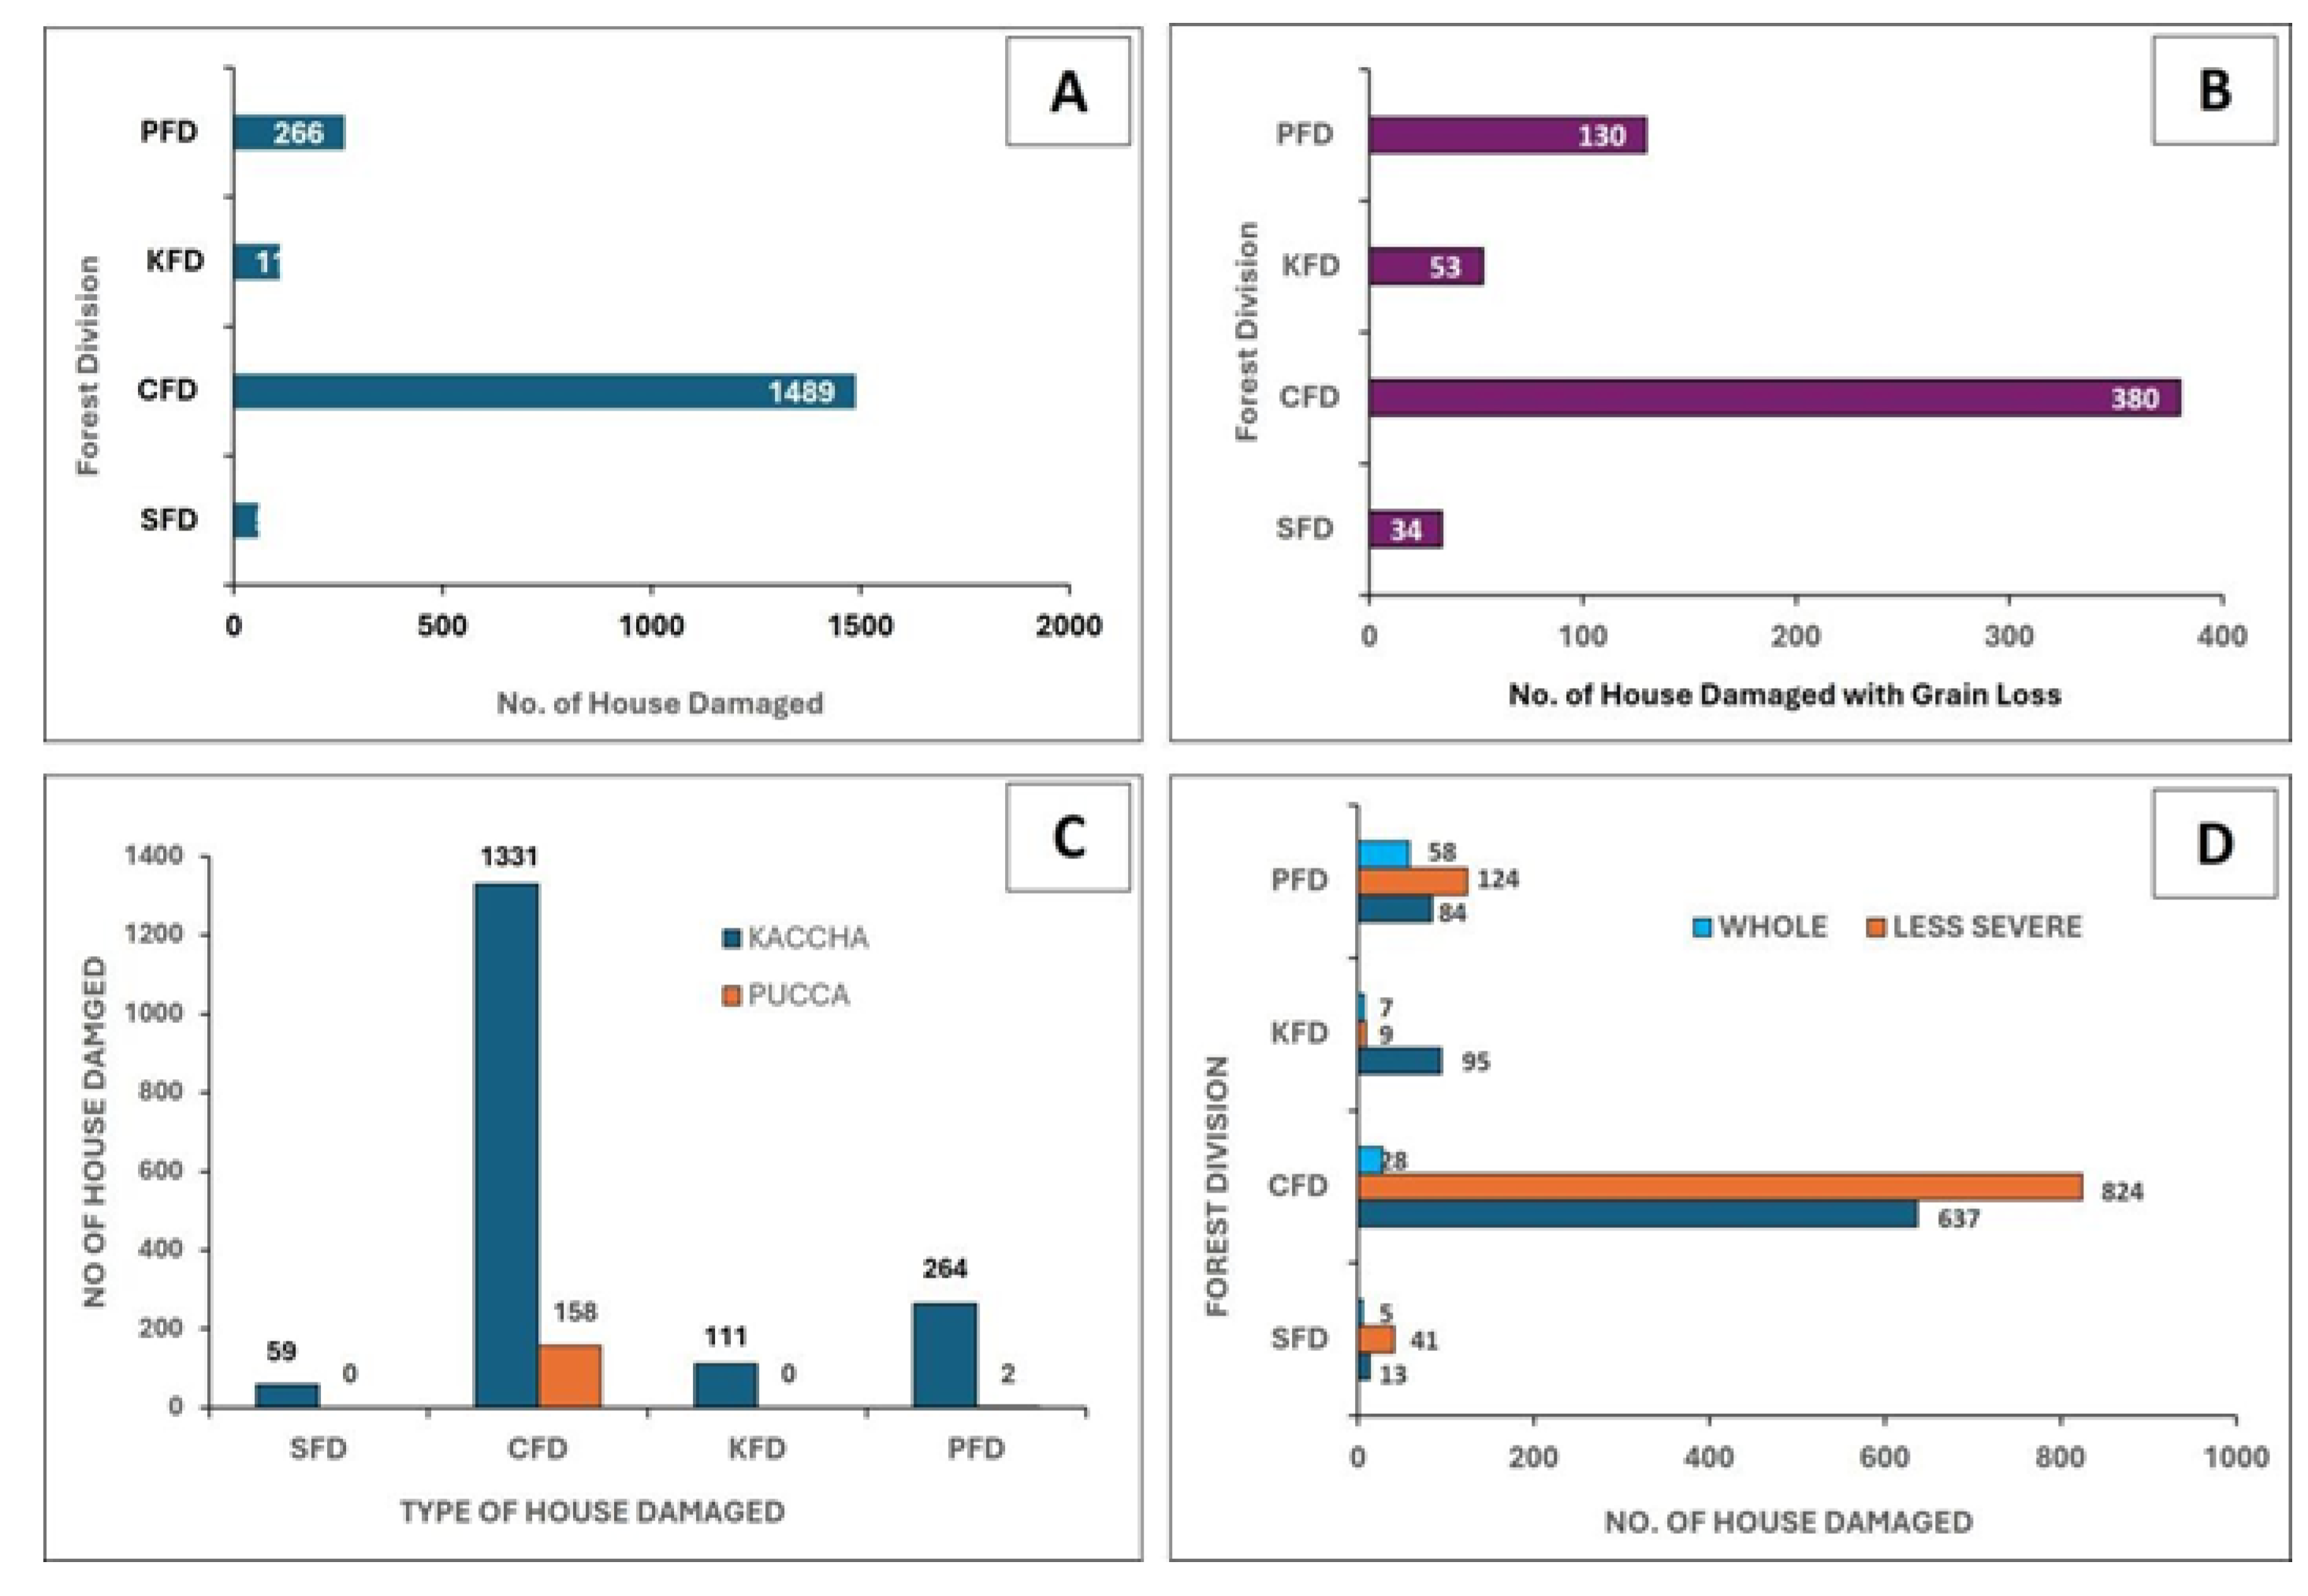
Figure 6.
Quantity of Grain loss by Elephants in four Forest Divisions of West Singhbhum District, Jharkhand, India. A. Quantity of Grain Loss (quintals) and Frequency of Raid by Elephants in Forest Divisions, B. Quantity of Grain Loss (quintals) in Forest Ranges. (CFD- Chaibasa Forest Division, KFD- Kolhan Forest Division, SFD- Saranda Forest Division, and PFD- Porahat Forest Division).
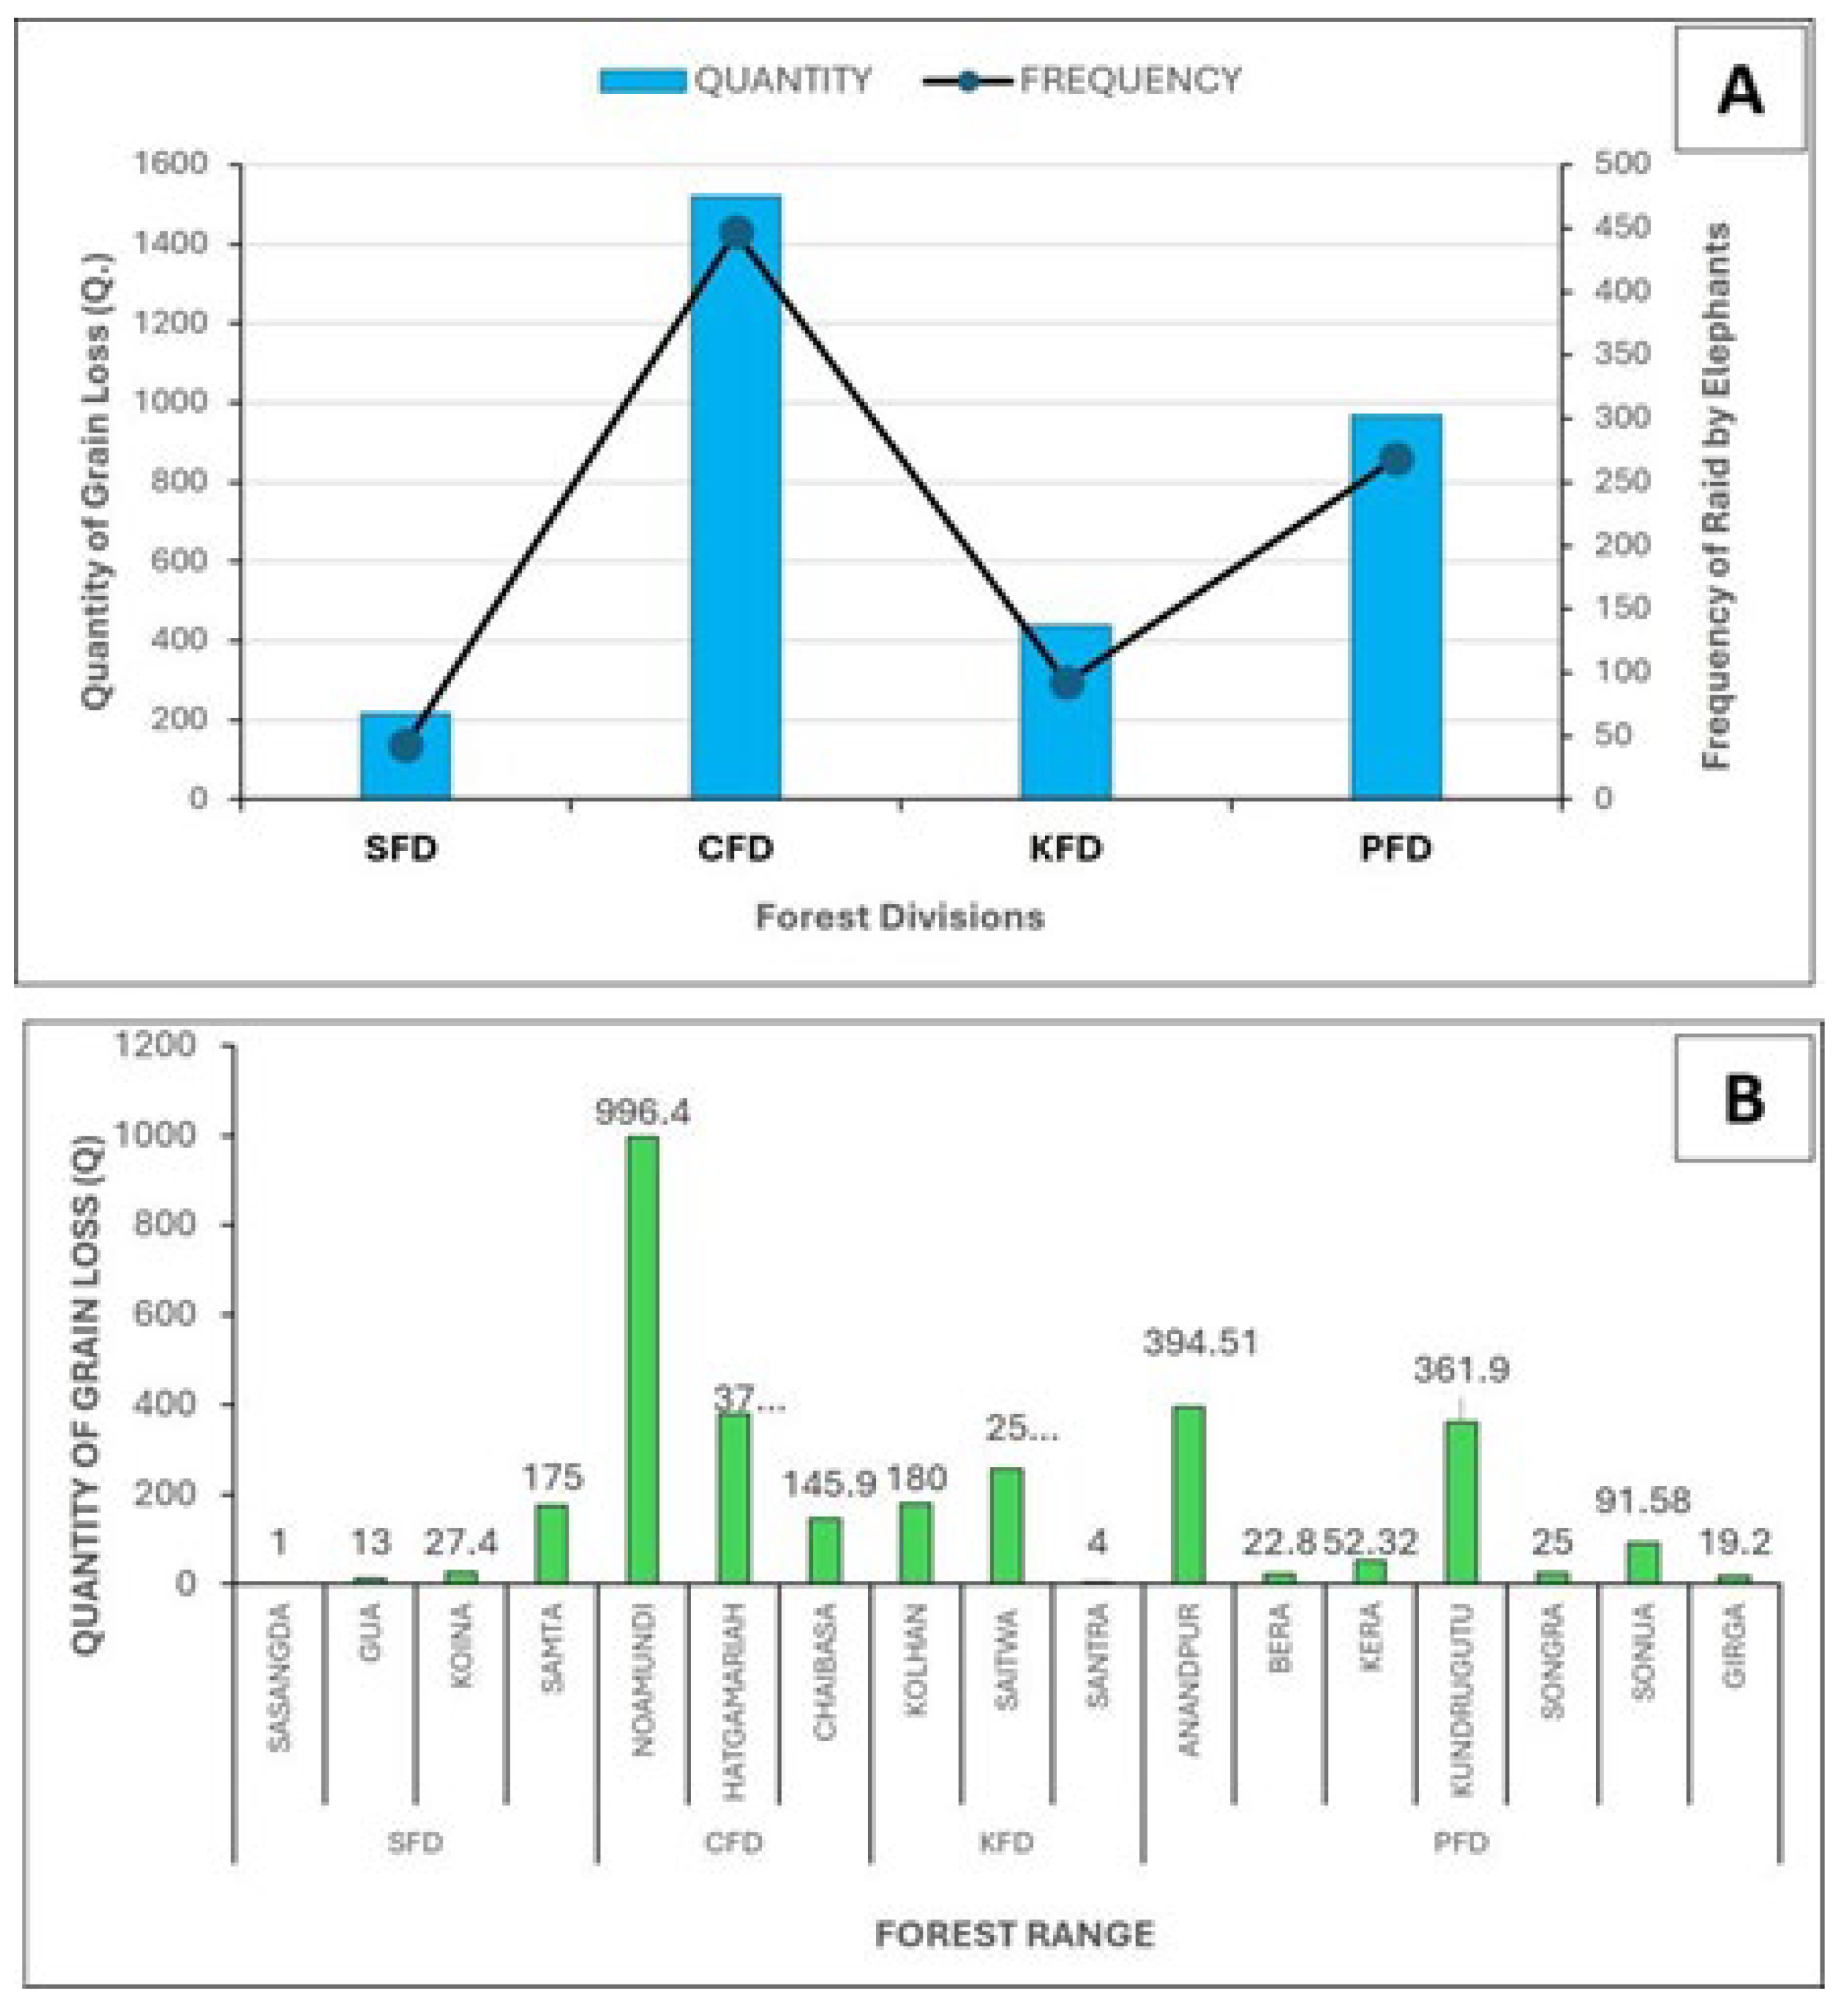
Figure 7.
Elephant mortality in four Forest Divisions of West Singhbhum District, Jharkhand, India. A- No. of Elephant deaths, B- Causes of Elephant Death, C- Age group of Elephants Died, D- Sex of the Dead Elephants (CFD-Chaibasa Forest Division, KFD- Kolhan Forest Division, SFD- Saranda Forest Division, and PFD- Porahat Forest Division).
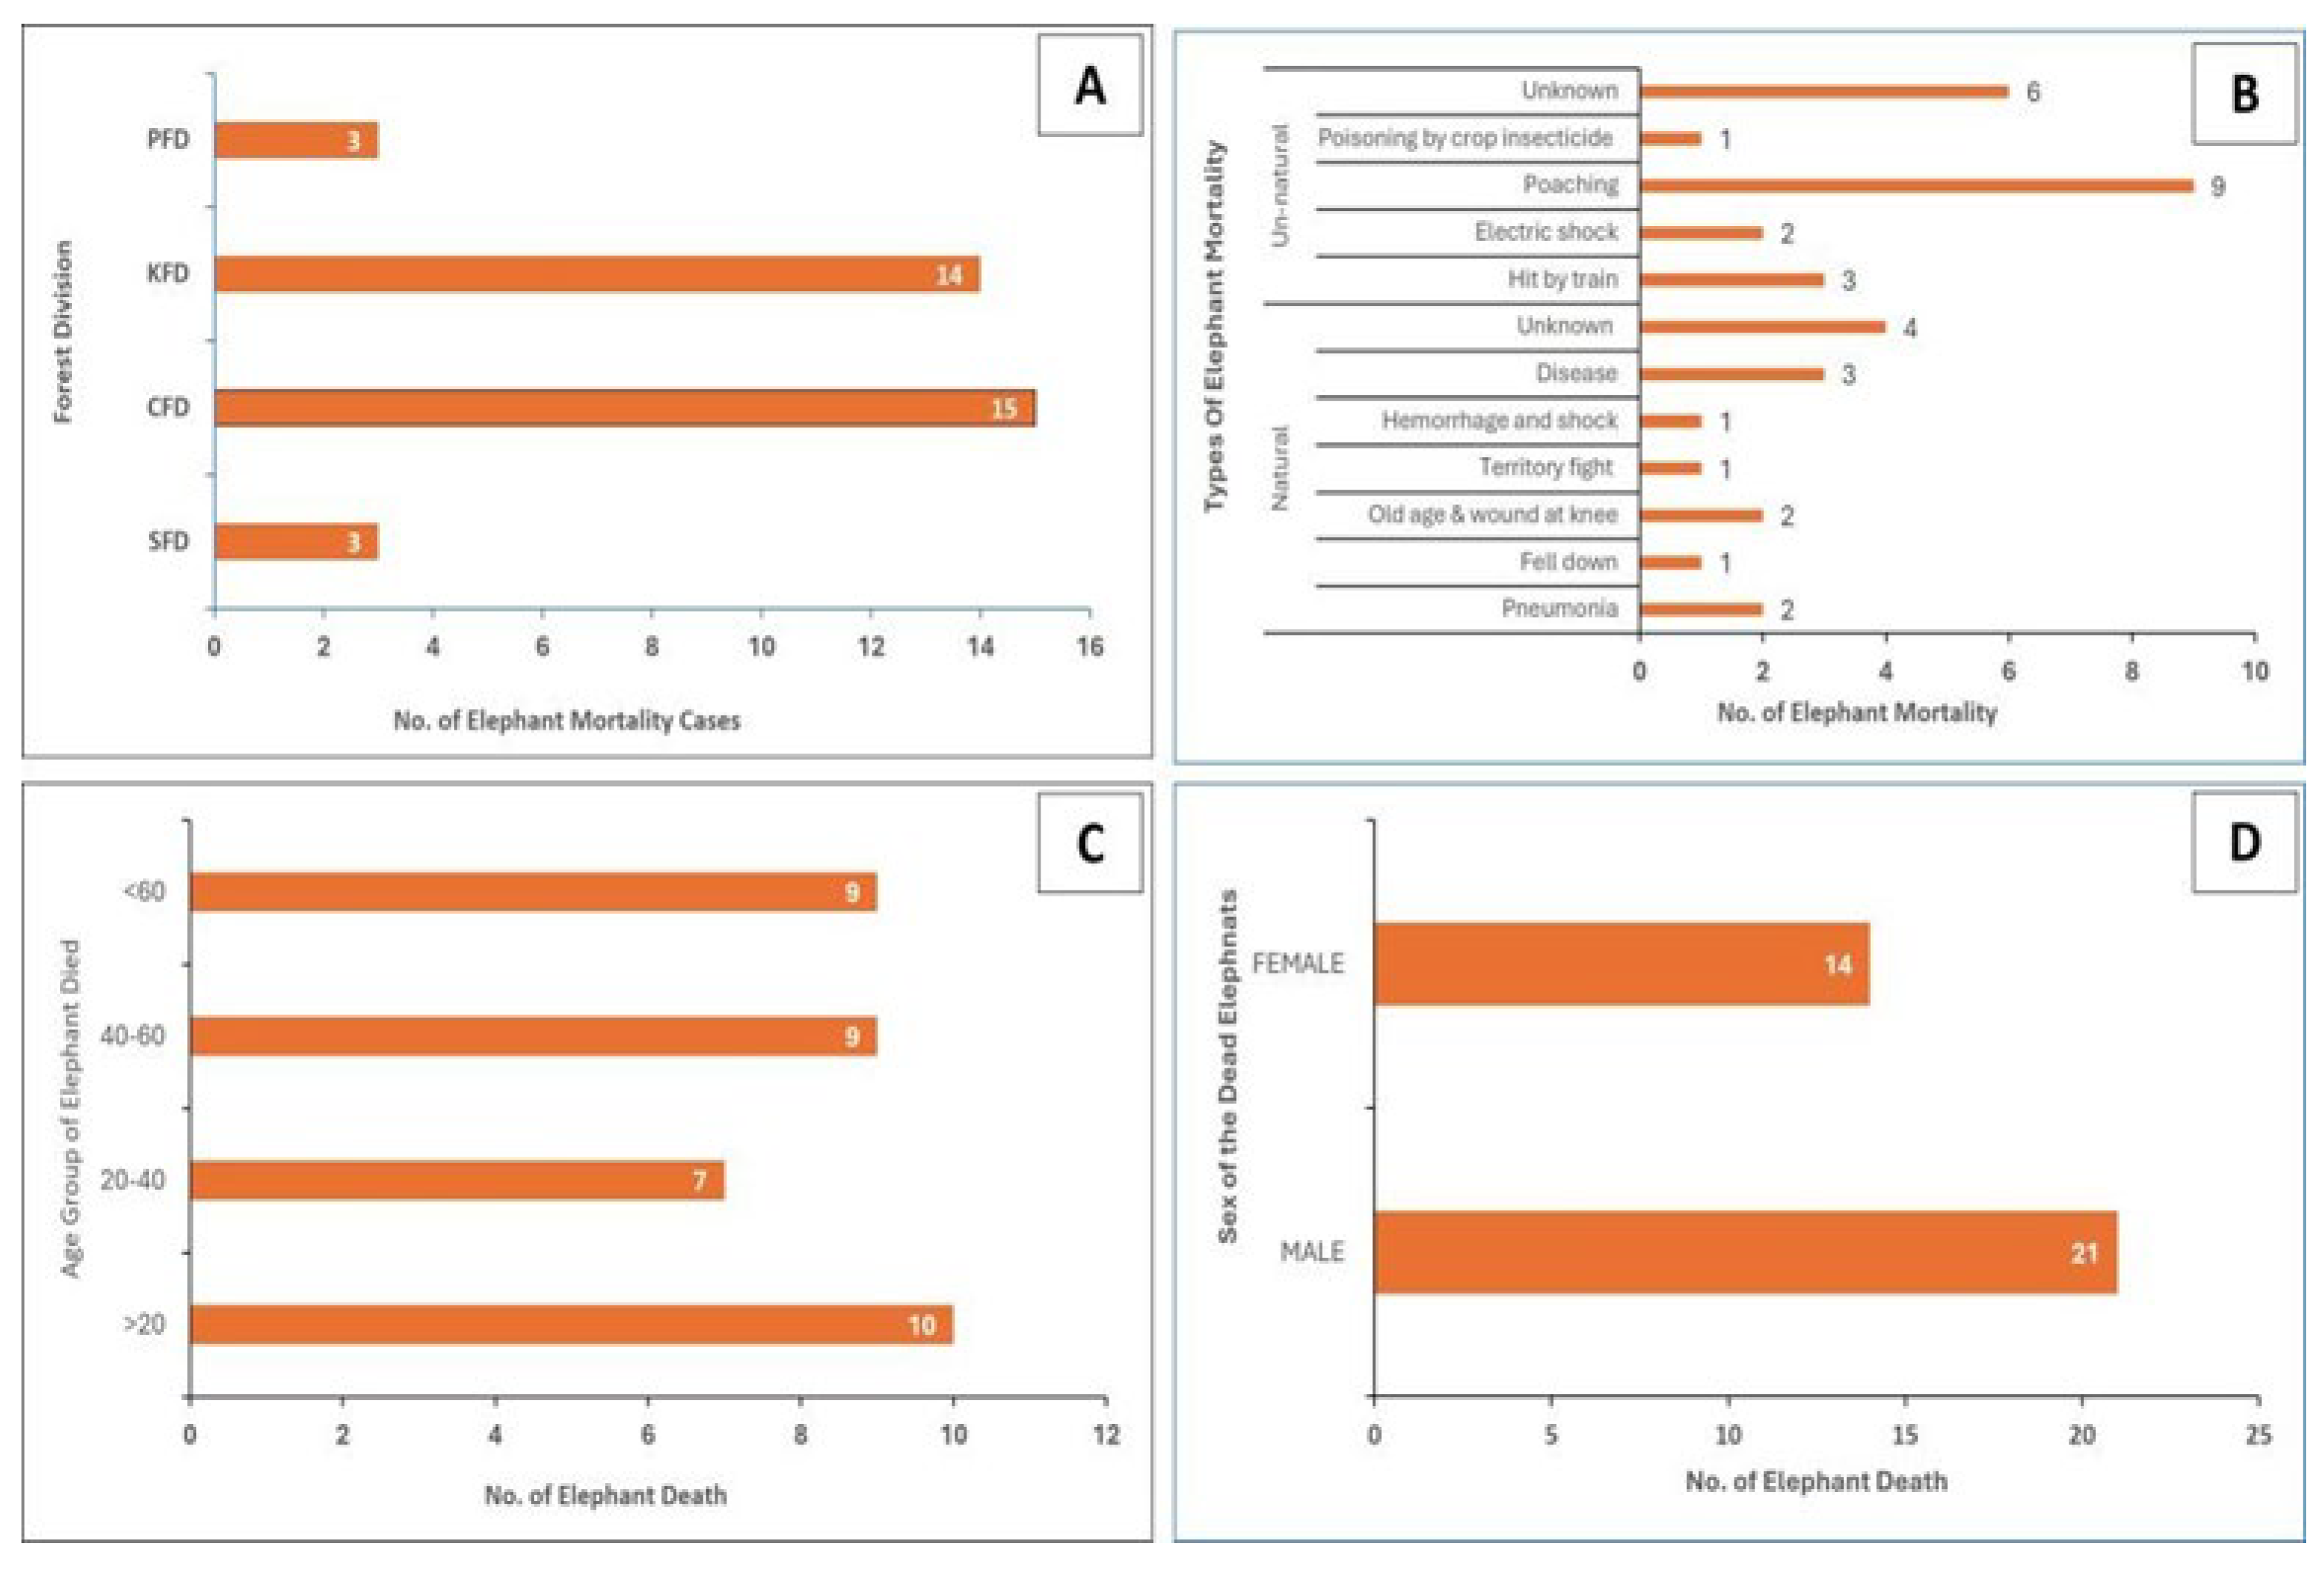
Figure 8.
HEC Hotspot Analysis Map: A: West Singhbhum; B: West Singhbhum (IDW).
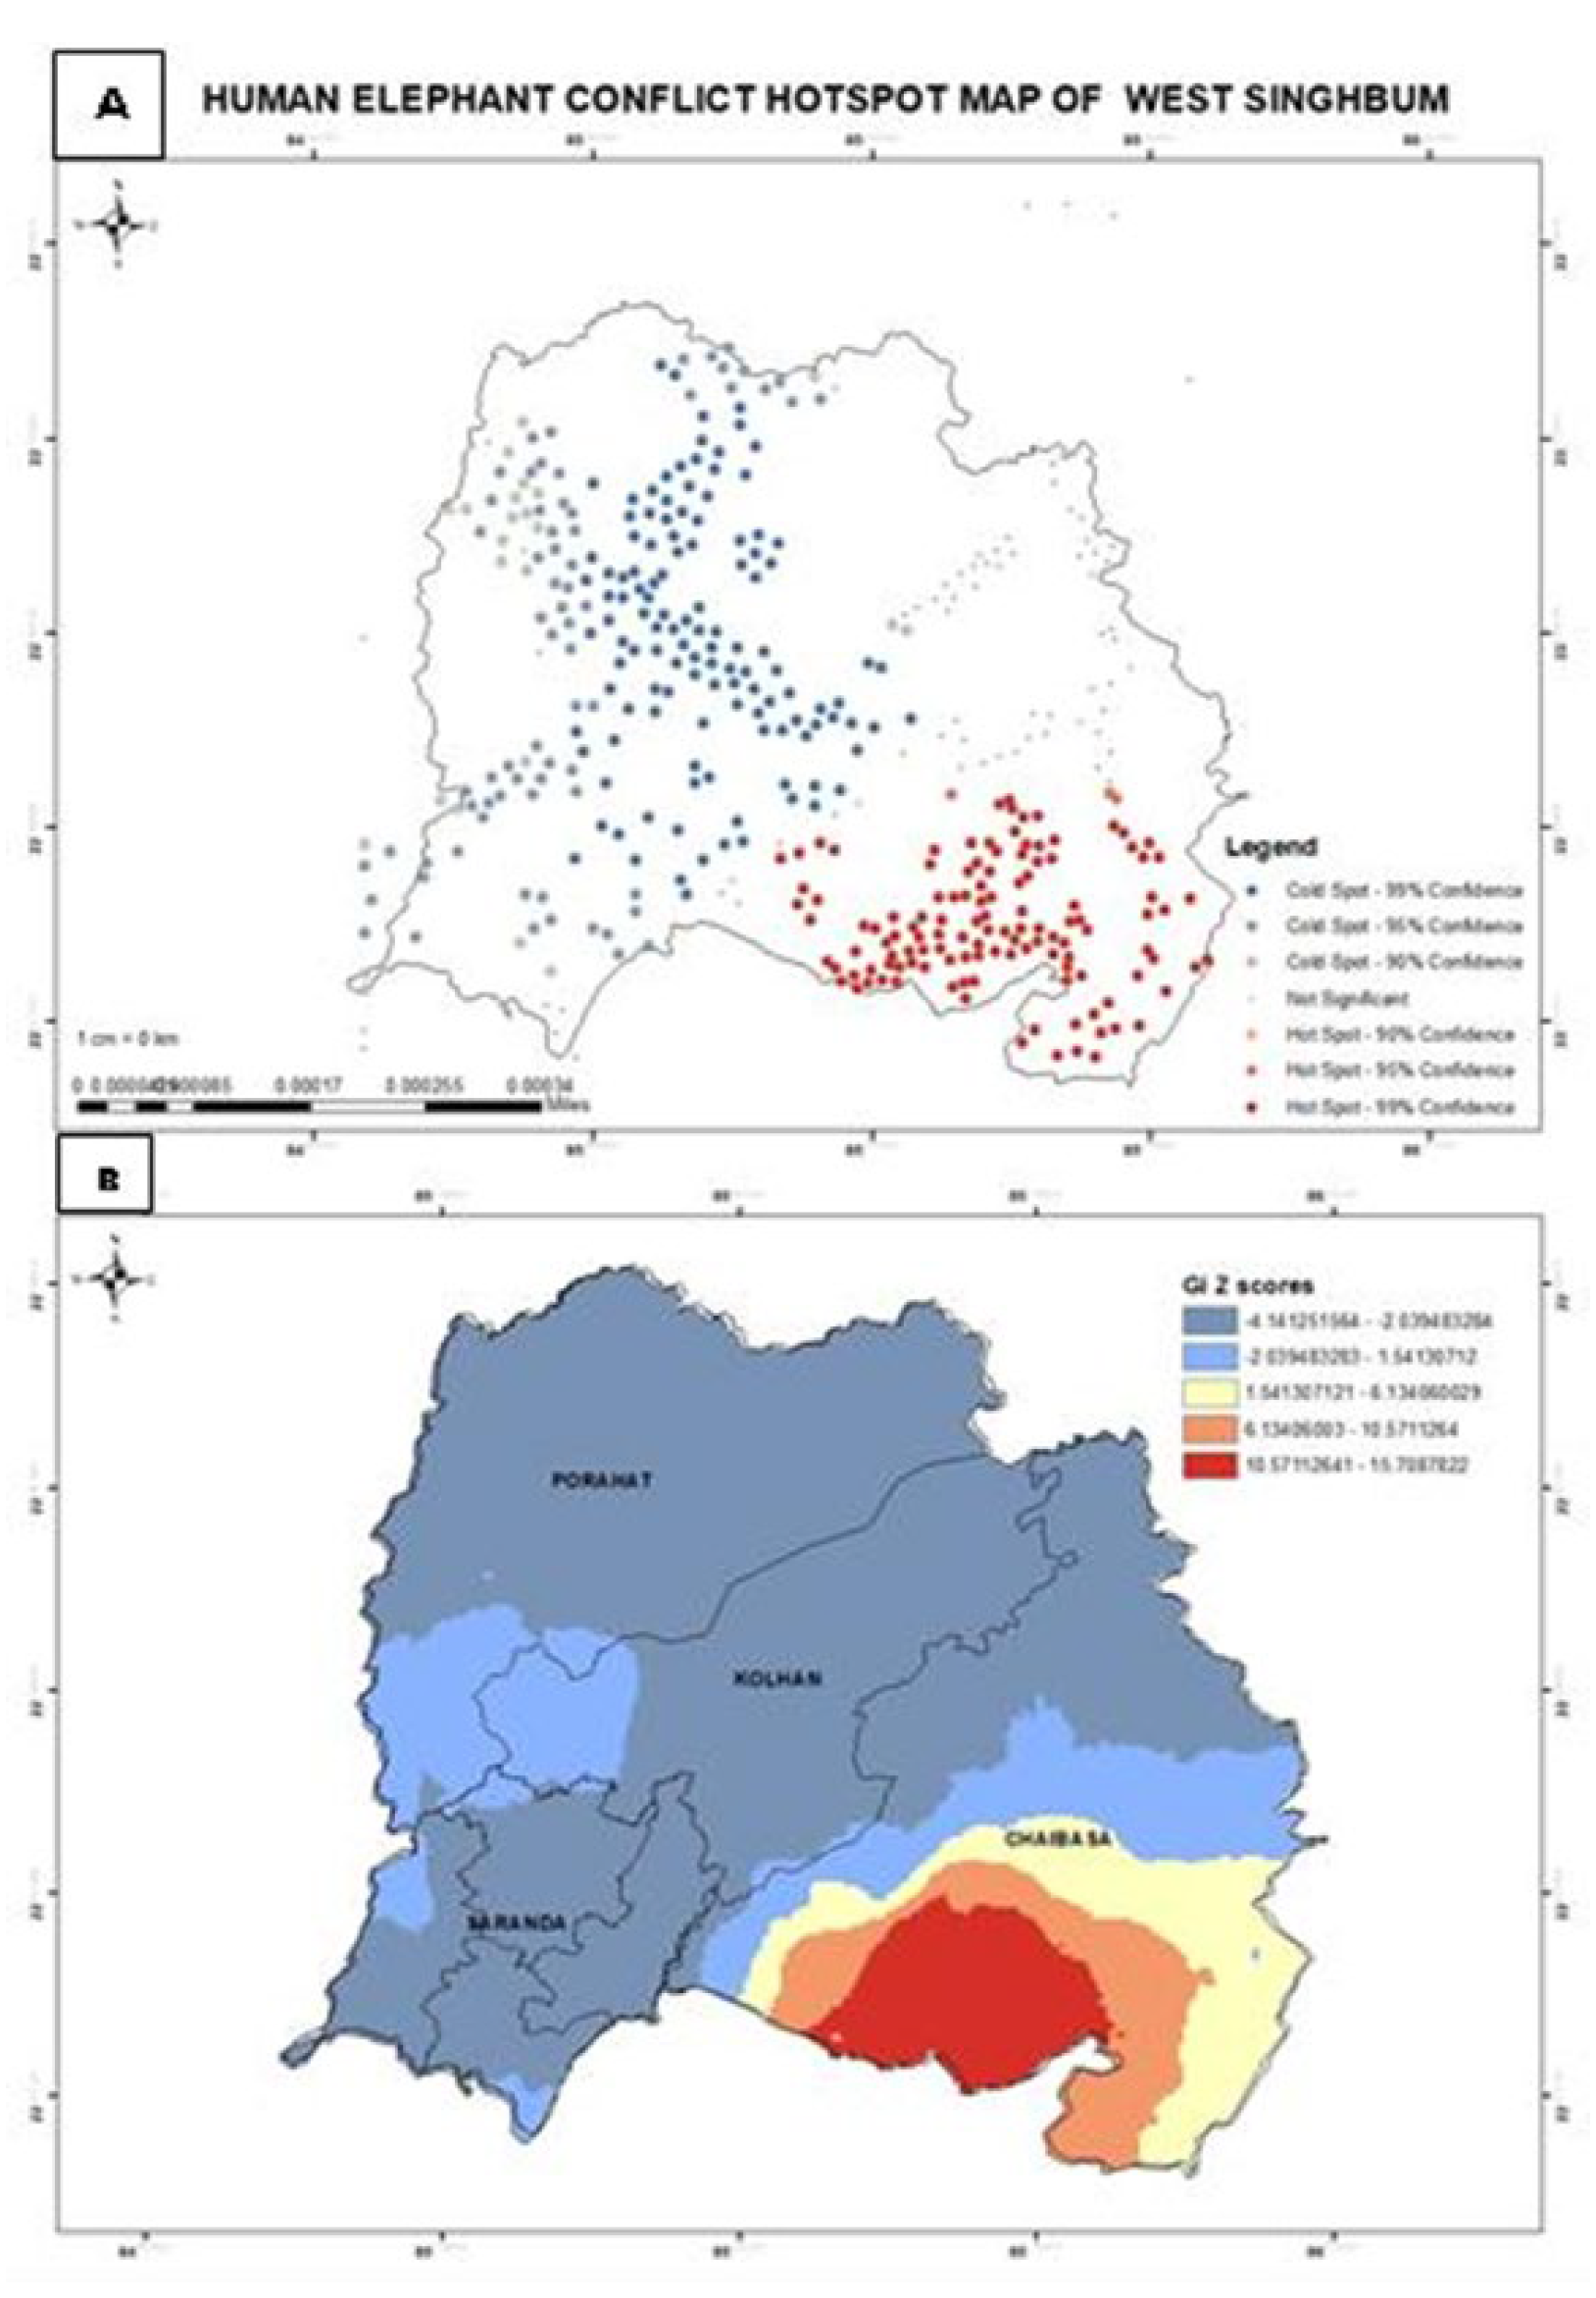
Figure 9.
Forest Division-wise HEC Hotspot Analysis Map (IDW)of West Singhbhum, Jharkhand, India. ): A- SFD; B-CFD; C-KFD; D-PFD.
Figure 9.
Forest Division-wise HEC Hotspot Analysis Map (IDW)of West Singhbhum, Jharkhand, India. ): A- SFD; B-CFD; C-KFD; D-PFD.
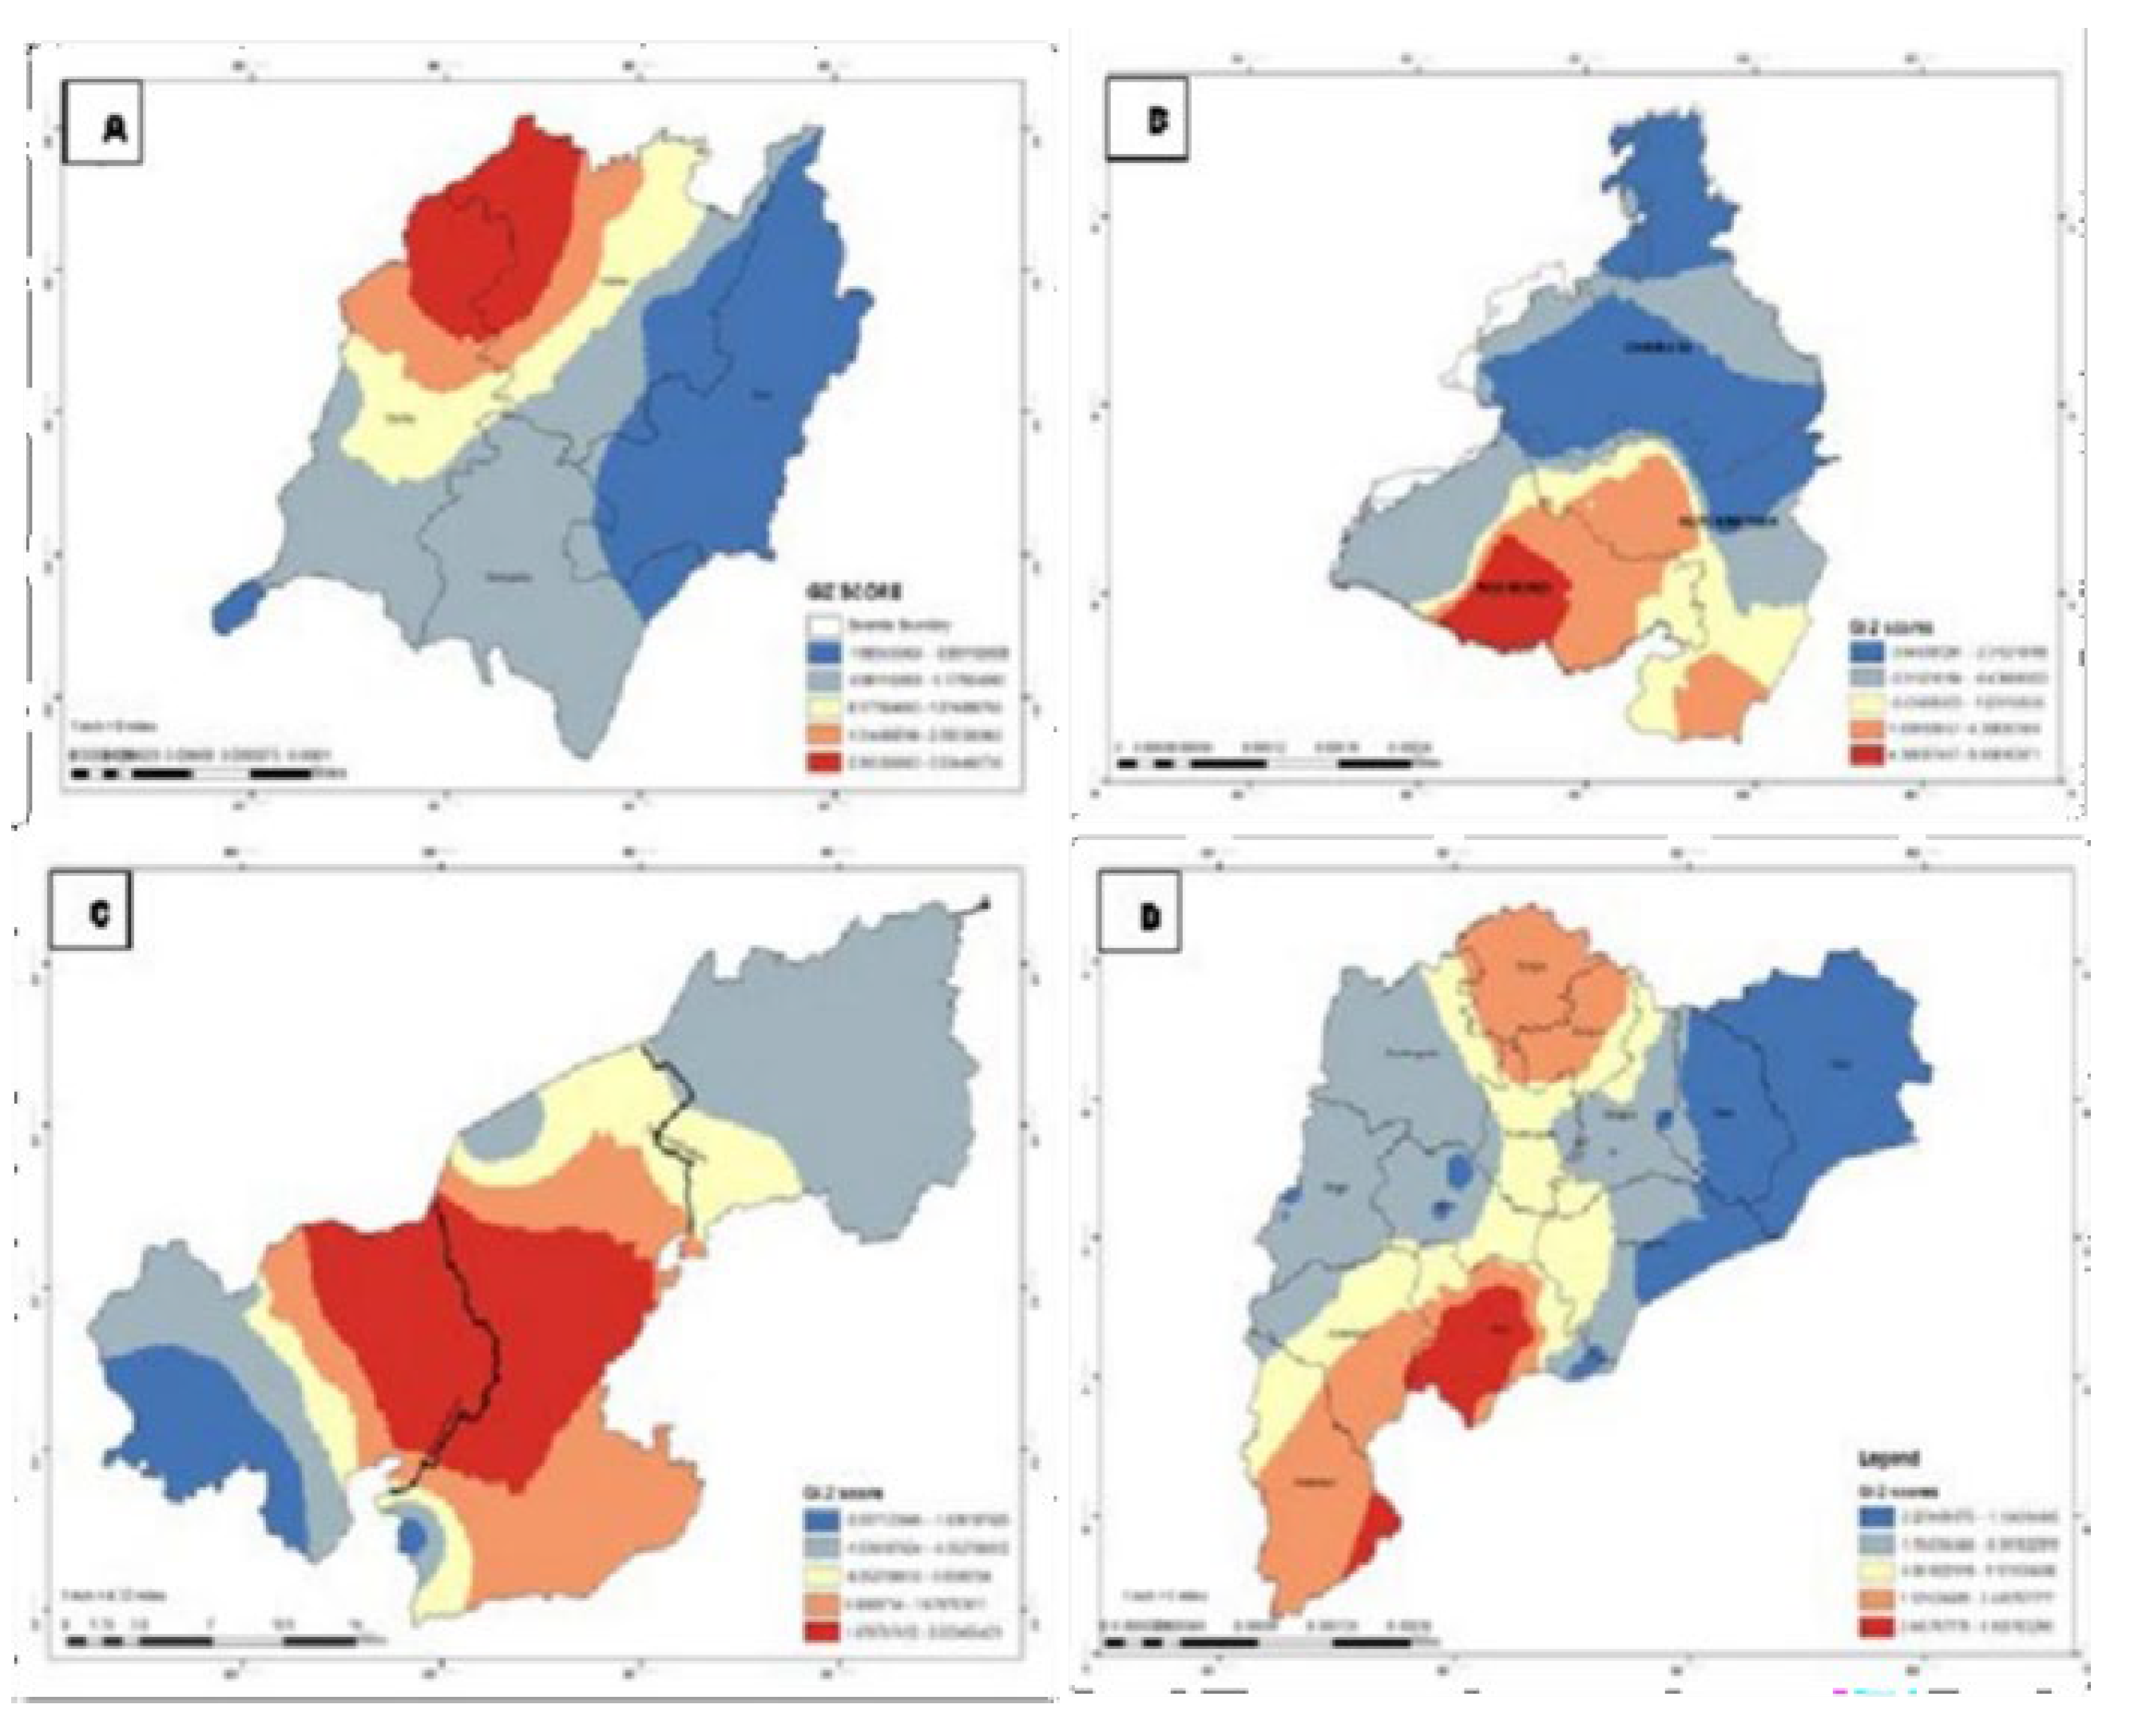
Figure 10.
Spatial Auto Correlation (SAC) Report. A- West Singhbhum District, Jharkhand, B- Saranda Forest Division (SFD), C- Chaibasa Forest Division (CFD), D- Kolhan Forest Division (KFD), and E- Porahat Forest Division (PFD).
Figure 10.
Spatial Auto Correlation (SAC) Report. A- West Singhbhum District, Jharkhand, B- Saranda Forest Division (SFD), C- Chaibasa Forest Division (CFD), D- Kolhan Forest Division (KFD), and E- Porahat Forest Division (PFD).
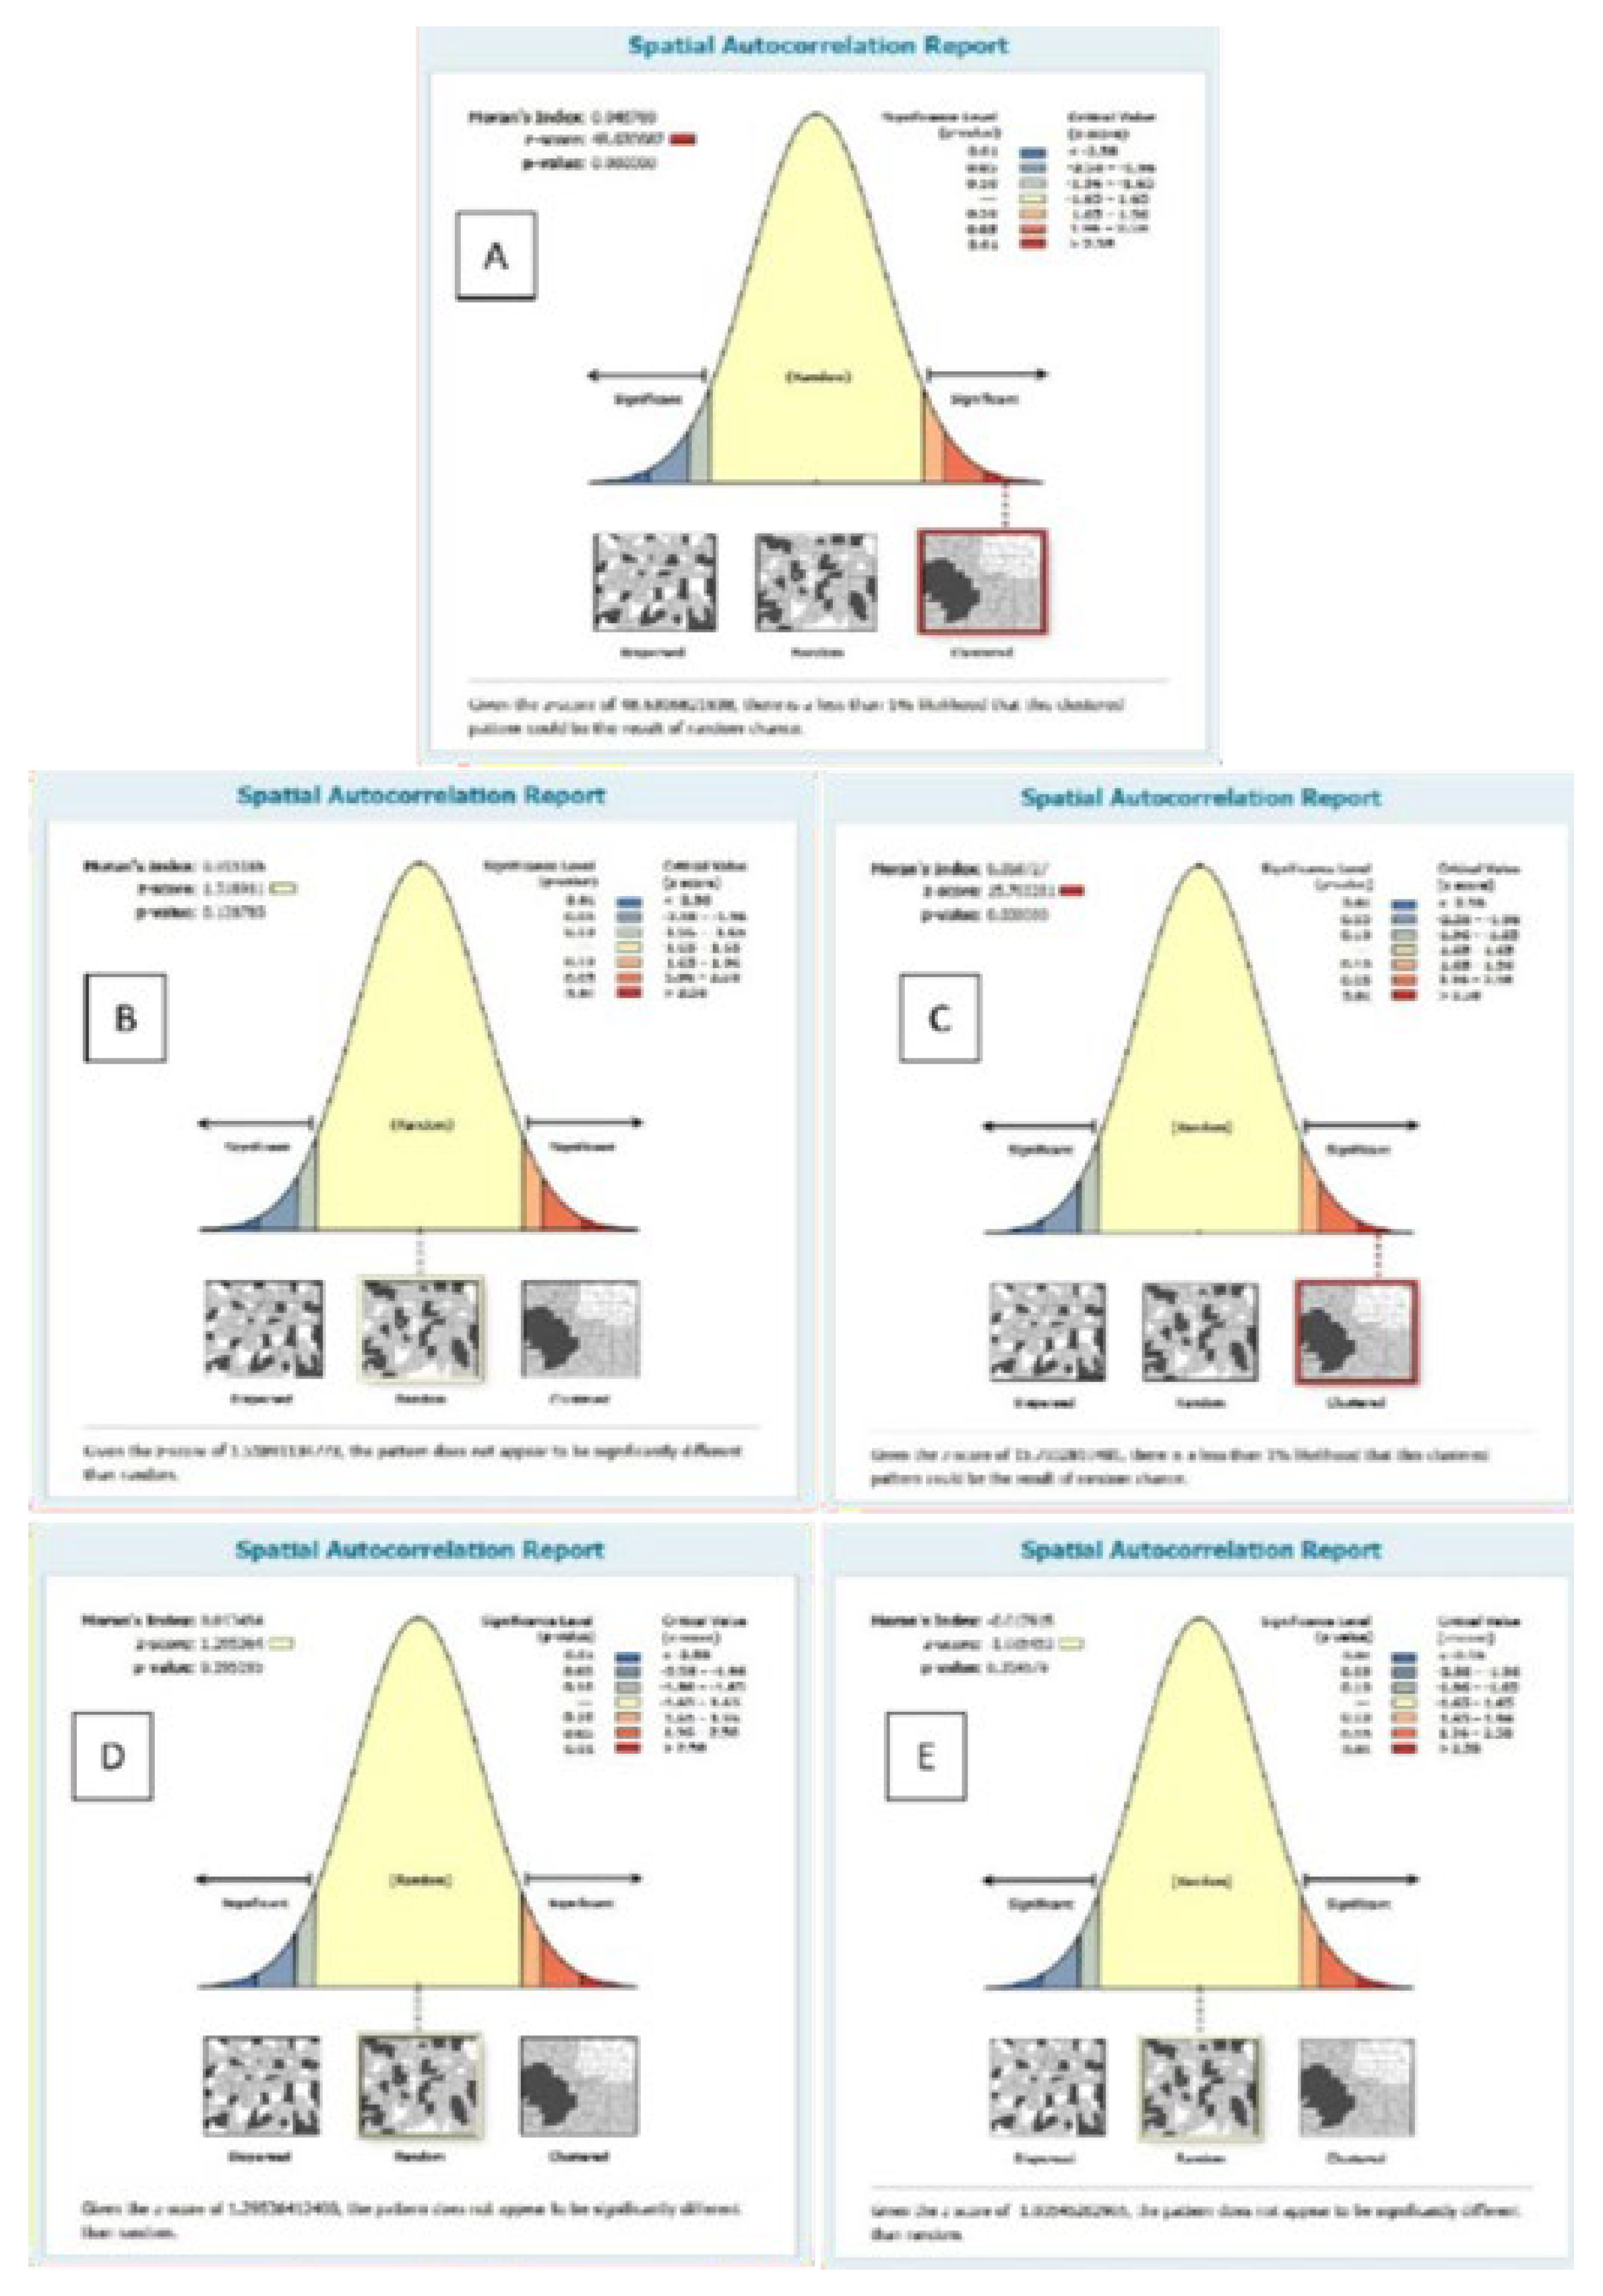
Figure 11.
Proximity Analysis. A: HEC areas in the fragmented landscape of west Singhbhum district of Jharkhand; B: HEC area in NDVI classes.
Figure 11.
Proximity Analysis. A: HEC areas in the fragmented landscape of west Singhbhum district of Jharkhand; B: HEC area in NDVI classes.
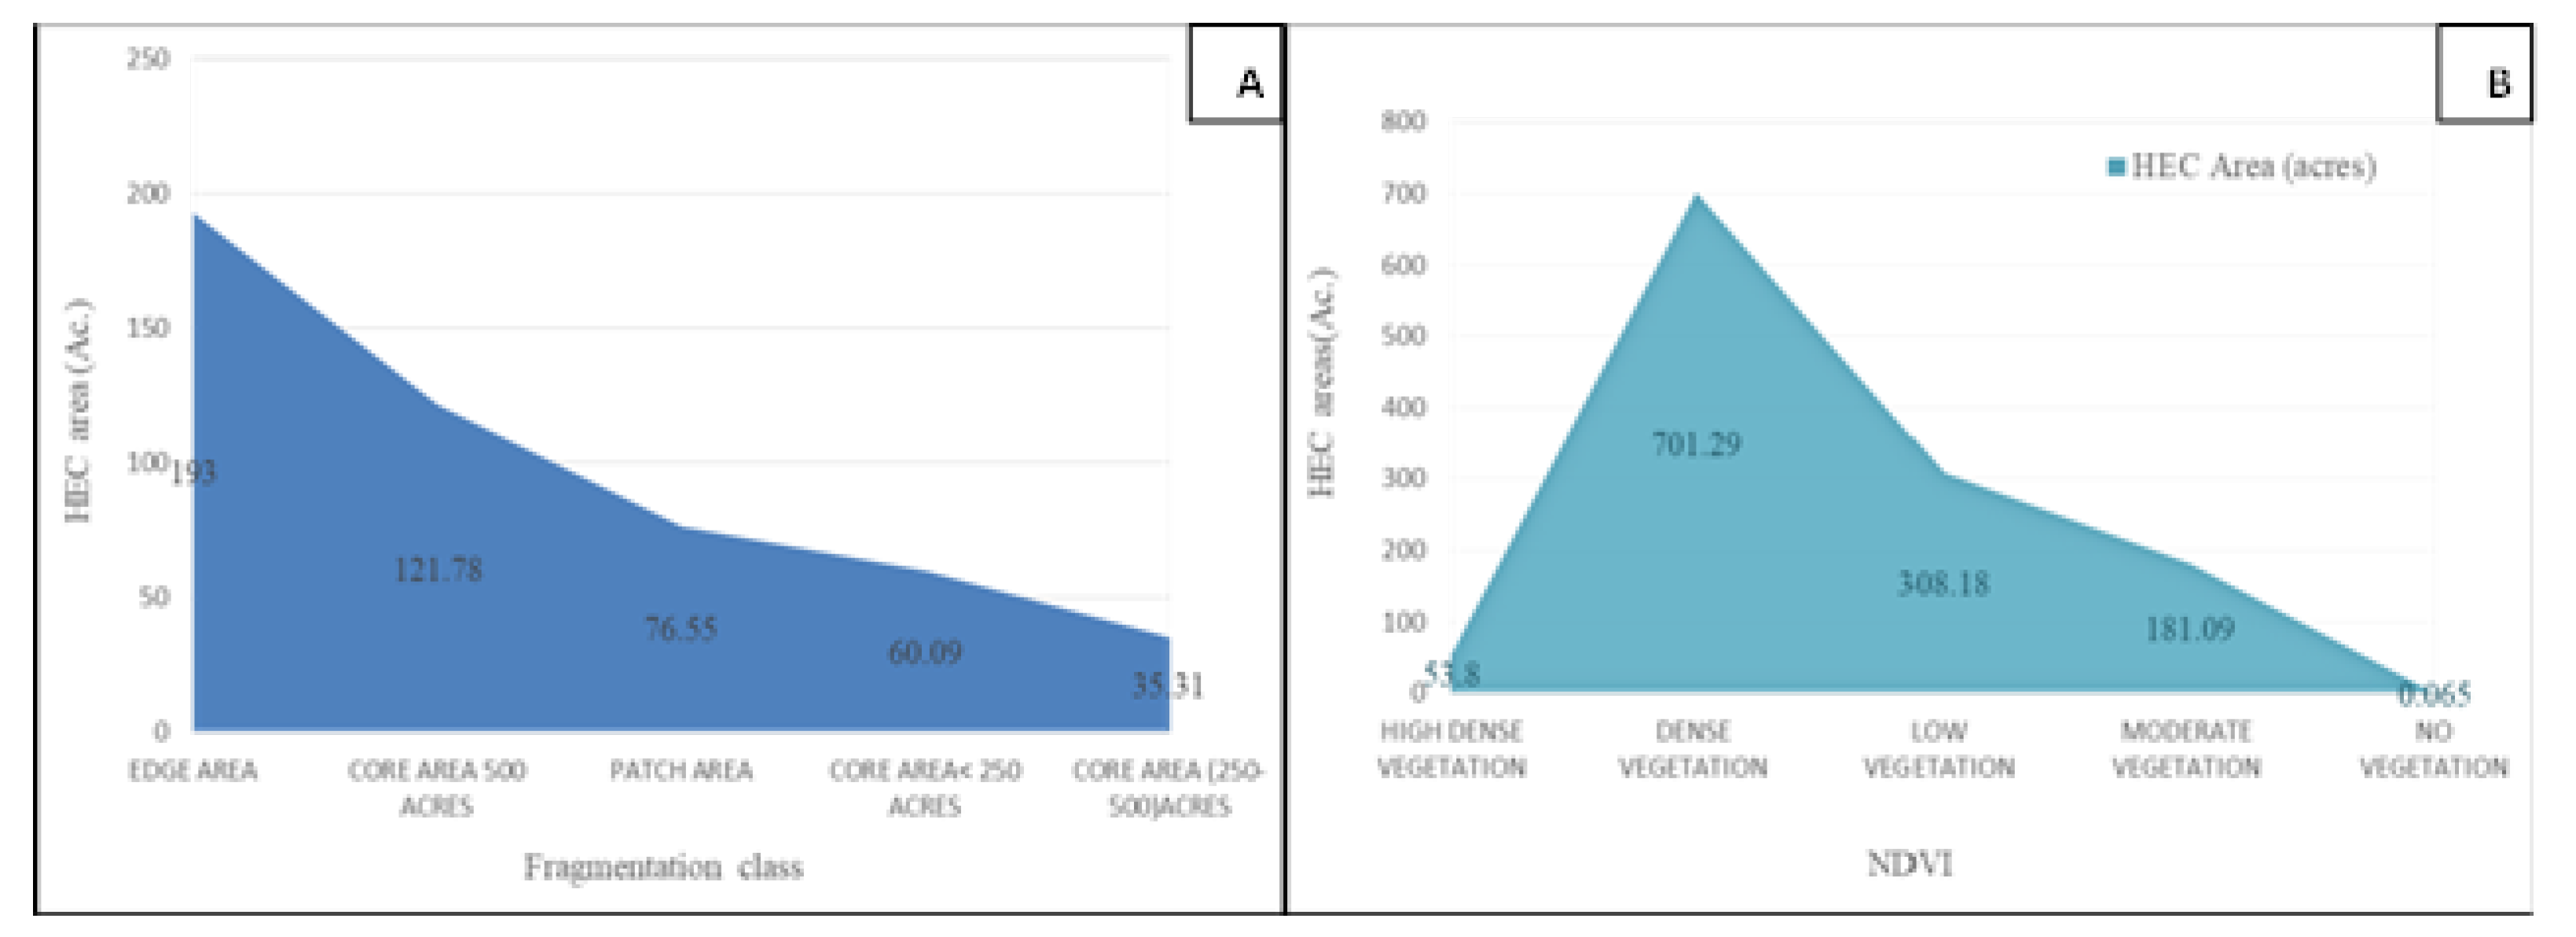
Table 1.
Land Use Land Cover (LULC) Change in four Forest Divisions of West Singhbhum, Jharkhand.
| Year | LULC CLASSES (Area in %) | |||||||||
|---|---|---|---|---|---|---|---|---|---|---|
| Forest Division | Agriculture land | Barren areas | Water body | Mines | Railway line | Road | Sand | Dense vegetation | Sparse vegetation | |
| 2000 | CFD | 33.34 | 0.03 | 1.33 | 0.13 | 0.085 | 3.57 | 2.72 | 40.81 | 17.93 |
| SFD | 5.99 | 0.18 | 0.24 | 0.89 | 0 | 0 | 0.38 | 89.39 | 2.93 | |
| KFD | 23.96 | 0.026 | 0.94 | 0 | 0.054 | 2.98 | 1.64 | 53.09 | 17.38 | |
| PFD | 27.7 | 0.037 | 1.47 | 0 | 0.037 | 4.09 | 3.33 | 42.23 | 21.07 | |
| 2011 | CFD | 41.87 | 0.76 | 1.019 | 0.16 | 0.08 | 3.51 | 0.57 | 26.93 | 25.06 |
| SFD | 6.7 | 1.07 | 0.93 | 0.87 | 0 | 0 | 0.01 | 74.09 | 16.33 | |
| KFD | 33.16 | 0.151 | 0.77 | 0 | 0.05 | 2.85 | 0.325 | 29.54 | 33.14 | |
| PFD | 33.98 | 0.187 | 1.33 | 0 | 0.7 | 3.48 | 0.705 | 23.62 | 36.12 | |
| 2020 | CFD | 37.33 | 5.26 | 0.88 | 0.16 | 0.073 | 3.49 | 0.62 | 32.77 | 19.41 |
| SFD | 5.33 | 4.65 | 0.86 | 0.8 | 0 | 0 | 0.02 | 72.18 | 16.16 | |
| KFD | 30.3 | 0.56 | 0.61 | 0 | 0.05 | 2.84 | 0.33 | 27.34 | 37.97 | |
| PFD | 31 | 3.23 | 1.24 | 0 | 0.038 | 4.01 | 0.66 | 15.65 | 44.14 | |
SFD-Saranda Forest Division, CFD -Chaibasa Forest Division, KFD -Kolhan Forest Division, and PFD-Porahat Forest Division.
Table 2.
Change in NDVI Classes between 2000- 2020 in West Singhbhum District.
| Classes | SFD | CFD | KFD | PFD |
|---|---|---|---|---|
| Area in Ha (%) | ||||
| Highly Dense -Dense Vegetation | 80172.99 (80.52) |
90542.93 (32.40) |
77607.19 (60.13) |
121213.72 (59.26) |
| Highly Dense -Highly Dense Vegetation | 3715.49 (3.74) |
2989.11 (1.06) |
9699.48 (7.5) |
16392.61 (8.02) |
| Highly Dense -Low Vegetation | 2743.26 (2.7) |
9882.04 (3.55) |
2872.29 (2.22) |
4956.55 (2.42) |
| Highly Dense -Moderate Vegetation | 6104.73 (6.11) |
18039.14 (6.45) |
7432.33 (5.71) |
11544.98 (5.04) |
| Highly Dense -No Vegetation | 0.18 (0.0001) |
0.27 (0.0002) |
3.55 (0.03) |
46.28 (0.02) |
| Moderately Dense -Dense Vegetation | 1442.26 (1.47) |
17202.12 (6.16) |
4682.90 (3.6) |
7254.21 (3.55) |
| Moderately -Highly Dense Vegetation | 4.58 (0.008) |
22.7 (0.01) |
16.73 (0.01) |
9.53 (0.0) |
| Moderately Dense -Low Vegetation | 3693.62 (3.73) |
106635.25 (38.18) |
19541.35 (15.12) |
32265.90 (15.78) |
| Moderately Dense -Moderate Vegetation | 1695.46 (1.72) |
34054.93 (12.19) |
7193.80 (5.4) |
10842.34 (5.3) |
| No vegetation -Highly Dense Vegetation | 0 | 0 | 0 | 0.005 (0.30) |
| No vegetation -No Vegetation | 0 | 0 | 0 | 0.056 (0.31) |
| Low -Low Vegetation | 0 | 0 | 0.70 (0.28) |
0 |
Table 3.
Landscape Fragmentation Classes in Four Forest Divisions of West Singhbhum District, Jharkhand.
Table 3.
Landscape Fragmentation Classes in Four Forest Divisions of West Singhbhum District, Jharkhand.
| Year | Landscape Fragment Classes (Area in %) | ||||||
|---|---|---|---|---|---|---|---|
| Forest | Patch | Edge | Perforated | Core | Core | Core | |
| Divisions | (<250 Ac.) | (250-500 Ac.) | (>500 Ac. ) | ||||
| 2000 | SFD | 1.26 | 14.18 | 2.61 | 1.25 | 1.35 | 79.32 |
| CFD | 24.21 | 30.01 | 12.07 | 7.29 | 3.7 | 22.7 | |
| KFD | 6.77 | 20.23 | 7.68 | 2.6 | 2.01 | 60.68 | |
| PFD | 8.85 | 30.51 | 9.904 | 8.52 | 6.49 | 35.7 | |
| 2011 | SFD | 1.41 | 14.34 | 10.49 | 2.13 | 1.093 | 70.52 |
| CFD | 19.58 | 33.14 | 19.82 | 8.8 | 4.82 | 13.81 | |
| KFD | 5.09 | 19.87 | 19.92 | 3.34 | 3.94 | 47.81 | |
| PFD | 7.42 | 31.55 | 20.32 | 9.66 | 6.67 | 24.36 | |
| 2020 | SFD | 1.85 | 12.41 | 24.21 | 2.63 | 1.24 | 56.88 |
| CFD | 24.75 | 31.41 | 21.69 | 9.19 | 3.09 | 9.84 | |
| KFD | 6.27 | 20.06 | 24.89 | 4.5 | 4.12 | 40.23 | |
| PFD | 8.23 | 31.61 | 24.95 | 10.28 | 7.17 | 17.74 | |
Table 4.
Land Use Land Cover (LULC) Change in four Forest Divisions of West Singhbhum, Jharkhand.
| Forest Division | Habitat Suitability Classes | |||
|---|---|---|---|---|
| Highly Suitable (%) | Moderately Suitable (%) | Less Suitable (%) | Unsuitable (%) | |
| Saranda Forest Division (SFD) | 44.22 | 34.76 | 15.28 | 5.74 |
| Kolhan Forest Division (KFD) | 28.14 | 38.21 | 21.43 | 12.22 |
| Porahat Forest Division (PFD) | 21.38 | 31.74 | 32.49 | 14.39 |
| Chaibasa Forest Division (CFD) | 9.84 | 27.12 | 41.08 | 21.96 |
Table 5.
Area of Crop damage by Elephants in Forest Divisions and Ranges of West Singhbhum District of Jharkhand, India.
Table 5.
Area of Crop damage by Elephants in Forest Divisions and Ranges of West Singhbhum District of Jharkhand, India.
| Forest Division |
Range | Area of Crop Damage in Forest Ranges (Ac.) |
Area of Crop Damage in Ac. In Forest Divisions (%) |
Frequency of Crop Raid in Forest Divisions (%) |
|---|---|---|---|---|
| Gua | 12 | |||
| SFD | Sasangda | 5.5 |
253.58 (8.93%) |
312 (8.57%) |
| Koina | 92.71 | |||
| Samta | 143.37 | |||
|
CFD |
Hatgamariah | 430.26 |
1801.23 (63.48%) |
2214 (60.84%) |
| Noamundi | 1125.3 | |||
| Chaibasa | 245.67 | |||
|
KFD |
Saitwa | 98.51 |
323.55 (11.40%) |
526 (14.45%) |
| Kolhan | 66.03 | |||
| Santra | 159.13 | |||
| Kera | 44.363 | |||
| Anandpur | 175.12 | |||
| PFD | Bera | 96.69 |
459.54 (16.19%) |
587 (16.14%) |
| Kundrugutu | 124.89 | |||
| Songra | 0.37 | |||
| Sonua | 18.1 | |||
| Total | 2837.90 | 3639 | ||
| (100%) | (100%) | |||
Table 6.
Monthly Crop Raid area (Ac.) in four Forest Divisions of West Singhbhum District, Jharkhand.
Table 6.
Monthly Crop Raid area (Ac.) in four Forest Divisions of West Singhbhum District, Jharkhand.
| Jan | Feb | Mar | Apr | May | Jun | Jul | Aug | Sep | Oct | Nov | Dec | ||
|---|---|---|---|---|---|---|---|---|---|---|---|---|---|
| Area (Ac.) | |||||||||||||
| 2000-2020 | SFD | 45.6 | 18.68 | 0 | 0 | 0 | 1.98 | 12.1 | 16.8 | 12.32 | 16.98 | 76.23 | 52.89 |
| KFD | 51.81 | 3.85 | 6.67 | 0 | 0 | 0.578 | 0.98 | 9.18 | 20.8 | 24.04 | 110.2 | 95.55 | |
| PFD | 47.26 | 22.76 | 0 | 0 | 0 | 0 | 1.53 | 44.166 | 37.48 | 103.97 | 51.1 | 151.26 | |
| 2012-2020 | CFD | 132.36 | 80.76 | 83.97 | 57.31 | 65.24 | 75.41 | 88.18 | 107.46 | 312.4 | 132.27 | 422.25 | 243.62 |
Disclaimer/Publisher’s Note: The statements, opinions and data contained in all publications are solely those of the individual author(s) and contributor(s) and not of MDPI and/or the editor(s). MDPI and/or the editor(s) disclaim responsibility for any injury to people or property resulting from any ideas, methods, instructions or products referred to in the content. |
© 2026 by the authors. Licensee MDPI, Basel, Switzerland. This article is an open access article distributed under the terms and conditions of the Creative Commons Attribution (CC BY) license (http://creativecommons.org/licenses/by/4.0/).
Copyright: This open access article is published under a Creative Commons CC BY 4.0 license, which permit the free download, distribution, and reuse, provided that the author and preprint are cited in any reuse.


