
Submitted:
21 January 2026
Posted:
22 January 2026
You are already at the latest version
Abstract
This study uses an endogenous growth framework to investigate the impact of foreign direct investment (FDI) stocks on sustainable economic growth in Türkiye between 1970 and 2024. Unlike most existing literature, this analysis uses the perpetual inventory method to construct separate stocks of domestic and foreign capital, allowing the growth effects of different types of capital to be disentangled. The model also incorporates a human capital index developed by Hall and Jones (1999) and a proxy for institutional quality based on the liberal democracy index. The study uses the autoregressive dis-tributed lag (ARDL) approach to examine the short- and long-run dynamics between real GDP per worker, FDI stocks, domestic capital, human capital, and institutional quality. Furthermore, the robustness of the findings is checked using FMOLS, DOLS and CCR cointegration estimators, which suggests that the results are robust to the choice of es-timator. The results indicate that, despite some transitory positive effects in the short run, FDI stocks exert a negative and statistically significant effect on output per worker in the long run. Human capital is also found to be negatively associated with growth, whereas improvements in institutional quality are linked to higher real GDP per worker. Do-mestic capital stock does not display a robust long-run contribution to growth.
Keywords:
foreign direct investment (FDI)
; economic growth
; endogenous growth model
; ARDL approach
; FDI stocks
1. Introduction
FDI is widely recognized as an important driver of sustainable economic growth in developing countries, as it helps to ease development bottlenecks such as the savings–investment gap [1] and institutional quality deficits [2]. In this context, many developing economies implement various policies to attract FDI inflows. In this vein, FDI is frequently considered a key channel for enhancing economic growth, particularly in developing economies facing chronic savings deficits.1
There is a considerable attention on the relationship between FDI and economic growth empirically, particularly stimulated by the emergence of endogenous growth models pioneered by Romer (1986) [3]. In neoclassical growth models, capital is subject to diminishing marginal returns, so that steady state growth is limited to advances in labour or technology. Consequently, the impact of FDI in these models is confined to technological improvements. However, endogenous growth theories take a broader view of capital, including human capital, which does not exhibit diminishing returns [4]. This broader view significantly alters the potential impact of FDI on steady-state economic growth. Endogenous growth theories suggest that FDI not only expands the domestic capital stock [5,6] but also generates Marshallian-type externalities [7]. In particular, FDI has an important role in generating knowledge and technology spillovers that enhance labor and management skills and strengthen organizational capacity [6,8,9,10,11]. Thus, these mechanisms enable the economy to achieve and maintain steady state economic growth. In this context, FDI is regarded as a key driver of sustainable economic growth, mainly by fostering innovation, accelerating technological progress, and strengthening the productive structure of host country.
The channels of FDI effects on economic growth have been widely discussed in the theoretical and empirical literature. One of the most important channels is the ability of the host country to acquire intangible and non-tradable assets [12]. This in turn leads to increasing returns [5]. Additionally, FDI especially in the form of multinational enterprises (MNEs), creates backward linkages [13]. While MNEs can increase government tax revenues, they can also help create local firms that supply inputs to these MNEs. Amighini et al.(2017) [14] highlight that MNEs could also signal to domestic firms to invest in sectors where profitable opportunities are emerging. Moreover, in emerging economies where there is a shortage of skilled labour, FDI through MNEs could improve the quality of labour [15] and boost total factor productivity [16,17]. In addition, FDI can provide a stable source of financing for these emerging economies, which are often struggling with balance of payments problems [18].
In the case of Türkiye, FDI is often considered a pivotal driver of economic growth, particularly during periods of structural transformation and integration into global markets. Especially beginning with 2000s, liberalization and reform policies has been pursued with the aim of attracting foreign investors, introducing legislative changes, tax incentives, and privatization programs. These measures, combined with Türkiye’s strategic geographic position, sizable domestic market, and status as a candidate for European Union (EU) membership, contributed to substantial inflows of foreign capital between 2002 (after 2001 crisis) and 2009. However, due to external shocks and domestic macroeconomic instability after 2018, FDI inflows have remained subdued. Given these fluctuations, Türkiye provides an important case for examining the dynamic relationship between FDI and sustainable economic growth.
The aim of this study is to examine the effects of FDI on sustainable economic growth in Türkiye over the period 1970–2024, by developing an endogenous growth model that incorporates FDI stocks. In this study, sustainable economic growth refers to the ability of the economy to achieve and maintain a higher steady-state growth path through persistent productivity and technology improvements. Unlike many previous studies, which predominantly rely on FDI flows, this study employs FDI stocks. The use of FDI stock rather than flow is more appropriate for capturing the long-term impact of FDI on growth, since stocks reflect the cumulative level of foreign capital embedded in the economy and provide a more accurate measure of its enduring influence [5,6,11]. Moreover, by separating domestic from foreign capital, the model provides an empirical framework that makes it possible to quantify and compare the distinct contributions of domestic capital accumulation and FDI stocks to economic growth. Given that the time series data used in this study are non-stationary, the Autoregressive Distributed Lag (ARDL) methodology is employed. This approach is particularly advantageous as it allows for the modelling of both short-run dynamics and long-run equilibrium relationships.
The remainder of this study is structured as follows. The next section reviews the theoretical and empirical literature relevant to the relationship between FDI and economic growth. Section 3 develops the theoretical framework of the study. Section 4 presents the empirical model, data, and results of the empirical analysis. In section 5, the empirical results are discussed in light of the existing literature. Finally, Section 6 concludes with a summary of the key findings and offers insights for future research.
2. Theoretical and Empirical Literature
The empirical literature on the FDI–growth nexus is extensive; however, it has not been able to provide conclusive results. Iamsiraroj and Ulubaşoğlu (2015) [18] reviewed the literature concerning the relationship between FDI and economic growth, analysing 108 empirical studies to conduct a meta-regression analysis.2 They concluded that 43% of the studies found a positive and significant relationship and 17% of the studies found a negative and significant relationship, while 40% of the studies could not find a significant effect.
De Gregorio (1992) [21], Blömström et al. (1994) [22], Balasubramanyam et al. (1996) [23], Basu et al. (2003) [24] are some of the leading studies that find a positive relationship between FDI and growth. However, several studies find a positive relationship conditioned on the absorptive capacity or initial characteristics of the host country [5]. As mentioned above, FDI leads to technological spillovers, but to benefit from these technological advances, the labour force should be equipped with the basic skills needed to produce [5]. Thus, the quality of the labour force is important for technological catching-up [22,25]. An educated workforce leads to reduced costs and increased efficiency as it can adopt the new technology faster [26]. On the contrary, Benetrix et. al. (2023) claim that the effect of human capital, as indicated by education, is negative after the sample periods that cover the post-1990s [27]. The authors suggest that this is due to the Global value chain (GVC) revolution, which Baldwin (2006) calls the ‘second unbundling’ [28]. GVCs outsource production to low-education, low-wage countries, and through backward linkages they could trigger domestic investment and growth.
Financial development is also vital in determining the impact of FDI on economic growth [25,29,30,31,32,33]. In countries with low levels of financial development, domestic firms may not benefit from backward linkages as they often lack the financial resources to establish firms that supply inputs to newly established foreign firms [29]. Balasubramanyam et al. (1996) [23] and Akinlo (2004) [6] stress the importance of trade openness in the relationship between FDI and economic growth. In a similar vein, Durham(2004) [34], Jude and Leviegue (2014) [35] and Yimer (2023) [11] emphasise the crucial role of institutional quality in their models and conclude that it is a key determinant in the relationship between FDI and economic growth. Melnyk et al. (2014) [36] argue that a favourable business climate and positive institutional changes are also significant contributors. Moreover, Çiftçi and Çiftçi (2021) find positive growth effects of FDI in countries characterised by regulatory efficiency and free markets [37].
There is a substantial body of research indicating a negative impact of FDI on growth such as Carkovic and Levine (2005) [38] and Akinlo (2004) [6]. These studies mainly argue that FDI can lead to the crowding out of domestic firms [39,40]. Moreover, if MNEs acquire significant market power, this could reduce domestic investment, an issue highlighted by Markusen and Venables (1998) [41]. Particularly in emerging economies, as discussed by Easterly (1993) [42] and Iwasaki and Tokunaga (2014) [43], MNEs often benefit from tax incentives that may dis-incentivise domestic firms. Ramirez (2000) [44] and Akinlo [6] also highlight the important role of capital outflows, including remittances and investment income. According to Fry (1999), this can lead to balance of payments problems [45]. Furthermore, MNEs may use host country financial markets for financing, which may lead to higher interest rates and distortions in domestic investment. Moreover, Findley (1978) argues that FDI inflows could induce Dutch disease3, causing real appreciation that undermines domestic competitiveness [46].
Akinlo (2004) finds a negative relationship between FDI and economic growth in Nigeria from 1970 to 2001, attributing this to the specific sectors targeted by FDI [6]. Since FDI in Nigeria is mainly focused on oil production, the expected spill-over effects do not materialise. Similarly, Vu and Noy (2009) report a negative impact of FDI on growth within the oil sector, highlighting the critical role of the target sector in determining the impact of FDI on growth [47]. The prevailing argument is that FDI in manufacturing is likely to lead to technology spill-overs and backward linkages [48,49]. Aykut and Sayek (2008) suggest that while FDI has a positive effect in the manufacturing sector, its impact remains negative in the primary sector [50]. In addition, Haini and Tan (2022) [51] and Ullah et al.(2023) [52] find a positive relationship between FDI and growth in other sectors, but also stress that the contribution of FDI to growth is most significant in the manufacturing sector. Marasco et al. (2024) also find a positive impact of FDI on growth in high technology sectors, which they attribute to the spill-over effects generated by FDI [53].
The methodologies used may be one possible reason for the divergent results in the literature on the impact of FDI on economic growth. Studies such as De Mello (1999) [5] , Zhang and Song (2001) [54], Basu et al.(2003) [24], Carkovic and Levine (2005) [38] , Akadiri and Ajmi (2020) [55] , Osei and Kim (2023) [33], Yimer (2023) [11] and Marasco et al. (2024) [53] have used panel data methodologies. However, these approaches often struggle to fully integrate country-specific characteristics and tend to ignore parameter heterogeneity, which is significant according to Herzer and Klasen (2008) [40]. In contrast, another strand of the literature focuses on country-specific studies that use a variety of time series methodologies. Notable studies in this category include Kokko (1994) [56], Ramirez (2000) [44], Zhang and Song (2001) [5], Blomström et al. (1996) [22], Akinlo (2004) [6], Cioabanu (2015) [57] and Ayanwale (2007) [58]. A summary of the results of selected empirical studies is presented in Table 1.4
Given Türkiye’s status as a significant host of FDI and its concurrent deficit in domestic investment, it represents an essential case study for exploring the role of FDI as a catalyst for sustainable economic growth. However, the existing literature on Türkiye’s experience with FDI is somewhat limited. Bildirici et al. (2010) [65] analyzed the impact of FDI inflows on growth using threshold co-integration analysis for the period from 1992 to 2008, using monthly data with industrial production as a proxy for output. They concluded that Türkiye’s economic growth has been positively affected by FDI inflows. İlgün et al. (2010) [66] used the VAR methodology to examine the period from 1980 to 2004 and found a bi-directional causality between FDI inflows and economic growth. Arısoy (2012) [17] also examined the impact of FDI inflows on economic growth and total factor productivity from 1960 to 2005. Using co-integration analysis, he found a long-run relationship between FDI and growth. On the contrary, Demirsel et al. (2014) [70] examined the relationship between FDI inflows and GDP from 2002-2014, using quarterly data, and found no significant long-term relationship. Aga (2014) [68] tested the interactions between FDI inflows, domestic investment, trade liberalisation and GDP and also found no positive long-term relationship. Finally, Gökmen (2021) [71] investigated the impact of net FDI inflows on real GDP using a cointegration approach and found a positive but insignificant long-term relationship.5 As can be easily seen form the Table.1, the available studies provide inconclusive evidence: while some report a positive and some report a negative contribution of FDI to economic growth, others find weak or insignificant effects depending on the period, methodology, or proxies employed. Thus, this study contributes to the developing literature on Türkiye by providing both theoretical and empirical evidence on the role of FDI stocks in economic growth.
3. Theoretical Model: An Endogenous Framework for Sustainable Economic Growth
In this study, sustainable economic growth refers to the ability of the economy to achieve and maintain a higher steady-state growth path through persistent productivity and technology improvements. More specifically, it denotes a growth process supported by long-lasting improvements in productivity, human capital and technological capabilities, rather than short-term capital accumulation. Sustainable growth implies the ability of an economy to maintain output expansion over time without generating structural imbalances or eroding its domestic productive base [3]. In this respect, foreign direct investment can contribute to sustainable growth only if it enhances domestic absorptive capacity, facilitates knowledge spillovers, and complements domestic capital accumulation rather than displacing it.
This study follows an endogenous growth framework to examine the effects of FDI on sustainable economic growth in Türkiye. In this framework, long-run sustainable growth is determined not only by capital accumulation but also by knowledge spillovers and technology transfers that are generated within the economy. FDI is incorporated into the model as both a source of physical capital and a channel for technological diffusion, aligning with the endogenous growth theory that emphasizes internal mechanisms in sustaining economic development.
The endogenous growth model is specified as Equation 1 following Akinlo (2004) [6] and Yimer (2023) [11].
In this model, A denotes factors affecting productivity in the economy like institutional factors. Y denotes real GDP and Kd denotes real domestic capital stock. Capital accumulation remains a central determinant of output growth in neoclassical and endogenous growth frameworks [3,74]. L stands for labour input and H refers to the level of human capital. Higher levels of human capital enhance productivity and foster innovation, which in turn promote long-term economic growth [75,76]. μ denotes the externality generated by the stock of FDI, while α and β represent the respective shares of labor and domestic capital. α and β is assumed to be smaller than 1, indicating diminishing returns to capital.
The externality that is generated by stock of FDI, μ, can be formulated following Yimer (2023) [11] as follows,
is the foreign capital stock, which is namely FDI stock. As FDI has a sustaining effect on growth, the FDI stock is more accurate to measure the effect of FDI on GDP [5,11,16,77]. is the marginal elasticity of substitution and is the intertemporal elasticity of substitution between and . As noted by Akinlo (2004) [6] assuming implies that the stock of FDI exerts a positive externality on GDP. Likewise, indicates the presence of intertemporal complementarity between FDI and domestic capital. Conversely, if , it suggests that FDI displaces domestic investment and consequently hampers economic growth in the host country.
In this study, sustainable economic growth is proxied by real GDP per worker. In long-run growth models, including those of Solow (1956) [74], Mankiw, Romer and Weil (1992) [4] and Barro and Sala-i-Martin (1992) [78], the production function is typically specified in terms of output per worker. This formulation provides a convenient basis for examining how capital accumulation, human capital and institutional factors are related to economic growth. In Equation 3, the production function is reformulated on a per worker basis,
Substituting Equation 4 into Equation 3 allows Equation 5 to be reformulated as
By grouping similar terms, Equation 7 takes the following form;
4. Empirical Methodology and Results
Accordingly, the equation to be estimated is specified as follows:
In this specification, represents real GDP per worker, obtained and calculated from the World Development Indicators (WDI). The variable captures institutional and political factors influencing economic growth, proxied by the “liberal democracy” index from the V-Dem dataset. Stronger legal institutions and enforcement mechanisms are widely recognized as crucial drivers of sustained economic performance, as they reduce transaction costs, protect property rights, and encourage investment [79,80]. Human capital, denoted by , is measured using a human capital index for Türkiye constructed in line with the methodology of Hall and Jones (1999) [81], as detailed in Appendix A. This index captures the effects of years of schooling and returns to education, respectively. This method is common in literature to capture the effects of human capital on growth [82]. Domestic capital stock per worker, is the domestic portion of capital; first domestic investment is calculated by subtracting the foreign capital inflows from gross capital formation and then the domestic capital is calculated using Perpetual Inventory Method (PIM) [77]. Finally, fdistock denotes the stock of foreign direct investment and is constructed using the Perpetual Inventory Method based on foreign direct investment inflows. Gross capital formation and FDI data are obtained from the WDI database. The assumptions and procedures described in Appendix B. FDI stocks can stimulate economic growth by transferring technology, enhancing managerial skills, and integrating domestic firms into global value chains [9,30]. The empirical analysis employs annual data covering the period from 1970 to 2024, based on data availability.
Equation 10 is estimated using the Autoregressive Distributed Lag (ARDL) approach to investigate both the short-run and long-run effects of FDI stock on economic growth in Türkiye. The ARDL method has become a widely employed methodology for exploring dynamic relationships among time-series variables. Its main advantage is the flexibility to include variables that are integrated of order zero, I(0) or order one, I(1) without requiring pre-testing for a common integration order [83]. By incorporating appropriate lags of the dependent and independent variables, the model can capture both immediate adjustments and long-run equilibrium relationships [84]. Furthermore, the ARDL approach produces robust and consistent estimates even when the sample size is relatively small, which makes it particularly suitable for this study, given the annual dataset covering the period 1970–2024 [85].
Rewriting Equation (10) within the ARDL specification yields the following functional form,
In Equation 11, Δ denotes the first-difference operator; , , , , represent the short-run coefficients, , , , , while correspond to the long-run coefficients, , and are the dummy variables included to capture the effects of crisis, is the error term. These dummies correspond to the 1994 currency crisis, the 2001 financial crisis and the 2009 global financial crisis respectively. The short-run dynamics and the associated error correction term are obtained through the following ARDL specification:
4.1. Unit Root Test Results
Given the specification of the ARDL model in Equation 12, it is essential to ensure that none of the variables are integrated of order two, as the validity of the bounds testing procedure relies on this condition. While the ARDL framework accommodates both I(0) and I(1) variables, Ouattara (2004) [86] emphasizes that the inclusion of I(2) variables makes the critical bounds values invalid. To verify the integration properties of the series, Augmented Dickey–Fuller (ADF), Phillips–Perron (PP) and Kwiatkowski-Phillips-Schmidt-Shin (KPSS) unit root tests are conducted. As summarized in Table 2, the results provide a comprehensive view of the integration orders. The ADF- PP-KPSS tests generally suggest that the variables are non-stationary in their levels but become stationary after the first difference, indicating that they are integrated of order one, I(1). However, the KPSS test results offer a more nuanced perspective; while most series remain I(1), certain variables (specifically lA) exhibit I(0) tendencies at the level form. As Table 2 indicates that none of the variables are integrated of order two.6 Therefore, the ARDL framework is adopted as the most suitable methodology, as it offers a flexible estimation procedure that remains valid and robust even when there is ambiguity regarding whether the underlying variables are I(0) or I(1).
In addition, given the long sample period and the presence of multiple economic and institutional shocks in Türkiye, conventional unit root tests such as ADF may suffer from loss of power and size distortions when structural breaks are ignored. To address this issue and to avoid spurious non-stationarity, the Lee–Strazicich Lagrange Multiplier (LM) unit root test is employed [89]. The Lee–Strazicich test is implemented using the crash model that permits shifts in intercept, capturing permanent structural changes rather than transitory shocks. This feature is particularly important for macroeconomic time series characterized by major crises, policy regime changes, and external shocks.7

Table 3.
Lee–Strazicich LM Unit Root Test Results (Crash Model, Model A).
| Level/Difference | Break Years | Test Statistic (τ) | Stationary | |
| ly | Level | 1987, 1994 | -4.10*** | I(0) with break |
| lA | 1st difference | 2001,2009 | -5.96*** | I(1) with break |
| lH | Level | 1991, 1998 | -8.02*** | I(0) with break |
| lkd | 1st difference | 1980, 2015 | -9.82*** | I(1) with break |
| lfdistock | Level | 2005 | -7.07*** | I(0) with break |
***Denotes significant at 1% level. The critical value for the two-break minimum LM unit root test (Crash Model A) at the 1% significance level is -4.07, as provided by Lee and Strazicich (2003) [89].
The results indicate that while all variables appear non-stationary in levels according to the ADF-PP-KPSS tests and become stationary after first differencing. ly, lh and lfdistock variables are stationary around their respective structural breaks. Both lkd and lA are found to be integrated of order one [I(1)], becoming stationary after differencing. As there is a mixed integration order [I(0) and I(1)] with no variable being I(2), the ARDL bounds testing approach is the most appropriate methodology for this study.
These results also justify including D1994, D2001 and D2009 dummy variables in the ARDL model to account for structural changes in Türkiye’s macroeconomic environment. These dummies were treated as fixed regressors in the ARDL framework to preserve the degrees of freedom while ensuring the stability of the estimated coefficients.
4.2. ARDL Long- and Short-Run Estimates
The optimal lag length (p) is selected based on the Akaike Information Criterion (AIC) and the Schwarz Information Criterion (SIC). The information criteria indicate that the appropriate lag structure for the model is ARDL (1,1,2,0,2), where the first number corresponds to the lag length of the dependent variable and the following numbers refer to the lag lengths of the explanatory variables in the order specified in Equation 11. After determining the optimal lag structure, the presence of a long-run equilibrium relationship among the variables is examined using the ARDL bounds testing procedure proposed by Pesaran et al. (2001) [82]. Given the systematic trends observed in the variables, the ARDL model includes an unrestricted constant and linear trend to adequately capture long-run dynamics. The results of the bounds test are reported in Table 4.
The bounds test results in Table 4 indicate a calculated F-statistic of 10.33 for the ARDL (1,1,2,0,2) model, which is substantially higher than the upper bound critical value at the 1% significance level (I(1) = 6.49, Narayan, 2004 [84] ). This clearly rejects the null hypothesis of no co-integration (H0: β6 = β7 = β8 = β9 = β10 = 0), providing strong statistical evidence of a long-run equilibrium relationship among the variables in the model. The result confirms that the variables move together in the long run. This finding justifies proceeding with the estimation of both short-run and long-run coefficients within the ARDL framework.
The long-run estimation results (Panel A) indicate that the rule of law (lA) variable, has a positive and statistically significant effect on GDP per worker. That means improvements in institutional quality enhance the efficiency of economic activity and support higher output levels per worker. In contrast, the human capital variable (lH) exhibits a statistically significant and negative coefficient. This counterintuitive finding may reflect structural issues in Türkiye’s education system: while the average years of schooling have increased, the quality of education and the alignment of skills with labour market needs remain persistent challenges [90]. As a result, the accumulation of formal education does not necessarily translate into productivity gains.
Domestic capital per worker (lkd) has found to be insignificant. The insignificance of domestic capital stock per worker suggests that capital accumulation alone is insufficient to enhance output per worker. Conversely, the FDI stock variable (lfdisstock) has a highly significant but negative coefficient in the long run. This finding is consistent with the earlier empirical evidence in the literature such as Akinlo (2004) [6], Carkovic and Levine (2005) [38], Herzer and Klasen (2008) [40], and Yimer (2023) [11].
Short-run estimates (Panel B) in Table 5 reveals institutional quality (lA) has a statistically significant and positive short run effect on output per worker suggesting that short-term improvements in institutional quality are positively associated with output per worker. Short-run estimates point to statistically significant but temporally differentiated effects of human capital. The contemporaneous coefficient (∆ lH) is negative, whereas the lagged change (∆lH (-1)) is positive and significant, reflecting short-run adjustment processes.
While FDI stock ( lfdistock) has a negative sign; FDI stock variable with lag ( lfdistock(-1) has a positive and significant effect. The impact effect of changes in FDI stock is negative, whereas the one-period lag enters the model with a positive and statistically significant sign. This pattern is indicative of short-run adjustment dynamics, implying that the effect of changes in FDI stock on real GDP per worker is subject to transitional frictions.
The short-run results reveal that the structural break dummies (DUM1994, DUM2001, DUM2009) enter the model with statistically significant coefficients, pointing to the presence of temporary regime shifts affecting real GDP per worker. The negative coefficients reflect the adverse short-run effects of major crisis episodes on output. The error correction term (ECM) is negative and highly significant, indicating a rapid adjustment toward the long-run equilibrium. The statistical significance of the deterministic components confirms the relevance of controlling for underlying time trends in the model specification.
As shown in Table 5, Panel C, the diagnostic test results for the ARDL (1,1,2,0,2) model indicate no evidence of serial correlation (p = 0.89), heteroskedasticity (p = 0.13), or model misspecification (p = 0.67) at the 5% significance level. Moreover, the Jarque–Bera normality test (p = 0.44) confirms that the residuals are normally distributed. These results demonstrate that the ARDL model is econometrically robust and appropriately specified. Therefore, coefficient estimates can be considered statistically reliable.
The stability of the ARDL (1,1,2,0,2) model was further assessed using the CUSUM and CUSUM of Squares tests. As shown in Figure 1, both statistics remain within the 5% significance bounds throughout the sample period, indicating that the estimated parameters are structurally stable. This suggests that there are no significant parameter shifts or changes in error variance over time. The stability of the model supports the reliability of the estimated short-run and long-run results.
4.3. Robustness Checks: FMOLS, DOLS and CCR
As a robustness check, Fully Modified Ordinary Least Squares (FMOLS), Dynamic Ordinary Least Squares (DOLS) and Canonical Cointegrating Regression (CCR) estimators are employed. This allows an evaluation of the sensitivity of the long-run coefficients to alternative cointegration-based estimation techniques.
The robustness checks in Table 6 confirm the results obtained from the ARDL model. In all three alternative specifications (FMOLS, DOLS, and CCR), the impact of FDI stock (lfdistock) on growth is negative and statistically significant. Although the DOLS estimator yields a higher coefficient magnitude, the sign of the relationship is strictly negative across all methods. This provides strong evidence that FDI inflows have failed to generate the positive spillover effects essential for achieving sustainable economic growth in the Turkish economy. Regarding the control variables, the results are equally stable. Institutional quality (lA) is consistently positive and significant, whereas human capital (lH) shows a negative coefficient in all models. The fact that these signs remain consistent across both semi-parametric (FMOLS, CCR) and parametric (DOLS) approaches reinforces the validity of main findings.
Finally, regarding domestic capital (lkd), the estimates do not yield a robust positive contribution to output per worker. The coefficient is statistically insignificant in the ARDL and DOLS models, while taking a small negative value in the FMOLS and CCR specifications. These results suggest that physical capital accumulation has not been a significant driver of growth during the analyzed period.
5. Discussion
The study robustly finds that FDI stocks exerts a negative impact on GDP per worker. In fact, these results are consistent with the evidence reported by Akinlo (2004) [6] , Carkovic and Levine (2005) [38], Herzer and Klasen (2008) [40], and Yimer (2023) [11]- for fragile economies. The negative relationship between FDI and economic growth in Türkiye may be explained by several factors. One possible channel is that foreign companies could crowd out domestic firms, as preferential tax treatment and other incentives may reduce the competitiveness of local enterprises [91]. Another explanation is that large capital inflows may appreciate the domestic currency, leading to Dutch disease effects that disincentives domestic production [46,64]. A more plausible explanation, however, relates to the sectoral composition of FDI stocks. The literature emphasizes that FDI in manufacturing sectors tends to generate positive spill overs for growth, while FDI concentrated in primary sectors may exert a negative effect [47,48,50,64]. Therefore, the negative impact observed in Türkiye could be linked to the sectoral distribution of FDI. However, due to data limitations, it is not possible within the scope of this study to test the industry-level effects of FDI empirically.
Unlike the negative results observed for FDI stock, the findings for institutional quality are positive and significant. The analysis indicates a robust link between the democracy proxy and economic performance, which is consistent with Acemoglu et al. (2019) [92]. This evidence also supports the institutionalist hypothesis of North [79] and Rodrik et al. (2004) [93].
The empirical analysis reveals a robust and statistically significant negative relationship between human capital and economic growth across all model specifications. This finding can be attributed to two critical structural factors. First, the human capital index used in this study follows the standard Hall and Jones [80] approach based on years of schooling, which measures the quantity of education rather than its quality. As emphasized by Hanushek and Woessmann (2008) [94], it is cognitive skills that truly drive economic growth, not merely the time spent in school. In Türkiye, the divergence between rising enrollment rates and stagnant educational quality suggests that the labor force has expanded in numbers without a corresponding increase in productivity-enhancing skills. Second, this negative relationship may be compounded by the “brain drain” phenomenon. Even if the stock of educated individuals increases, the emigration of high-skilled professionals to developed economies deprives the domestic market of its most productive agents [95]. Consequently, the remaining labour force may not possess the high-level competencies required to foster technological adoption and growth, turning the expansion of education into a cost rather than a productivity driver.
The results for domestic capital are not statistically significant, suggesting that physical capital accumulation has not been the primary engine of growth during this period. This indicates that solely capital expansion is insufficient to sustain long-term economic growth.
6. Conclusions and Policy Implications
FDI is widely seen as an important driver of sustainable economic growth, particularly in countries with a savings deficit. Accordingly, the FDI–growth nexus has been extensively studied both theoretically and empirically in the literature. As a developing country, Türkiye has implemented various promotion policies to attract FDI. However, the empirical literature has not been able to provide clear or consistent results, and this is also true for studies focusing on Türkiye.
To contribute to this literature, the present study examines the effects of FDI stocks on economic output per worker within the framework of endogenous growth models. Focusing on FDI stocks rather than flows, offers a more accurate way of analysing the impact of FDI, as stocks reflect the cumulative accumulation of foreign capital inflows over time.
The findings of the study indicate that FDI stocks has a negative impact on output in the long-run. This result is confirmed across ARDL, FMOLS, DOLS, and CCR models. The negative long-run coefficient on the FDI stock should be interpreted with caution, as it may reflect the sectoral composition of inflows. However, this finding also in line with the findings of Akinlo (2004) [6], Carkovic and Levine (2005) [38], Herzer and Klasen (2008) [40], and Yimer (2023) [11]. A plausible explanation relates to the sectoral composition of FDI, as highlighted in previous studies such as Aykut and Sayek (2009) [50]; Chakraborty and Nunenkamp (2008) [48], Vu and Noy (2009) [47], Bergougi and Murshed (2023) [64]. Specifically, FDI in manufacturing sectors tends to foster growth, whereas FDI concentrated in primary or non-productive sectors may fail to generate the expected spillovers. Unfortunately, due to data limitations, this study could not examine FDI at the industry level.
The analysis of control variables reveals important structural nuances. The statistical insignificance of domestic capital suggests that physical accumulation alone has not been a decisive driver of sustainable growth during this period, indicating that simply increasing investment levels fails to translate into significant economic expansion. This pattern is mirrored in the labour market, where there is a negative impact of human capital on sustainable economic growth. The adverse association between human capital and output per worker likely captures the quantitative expansion but limited quality of education over the sample period, and does not necessarily imply that human capital is intrinsically detrimental to growth. Against this backdrop, the robust positive effect of institutional quality stands out, suggesting that for the current Turkish economy, establishing the right “rules of the game” is vital for growth.
Consequently, to foster sustainable economic growth and to address the observed adverse long-run association between FDI stock and output per worker, policymakers must reconsider their incentive strategies. The findings imply that the current accumulation of foreign capital has not translated into sustainable economic growth. Therefore, future policies should prioritize attracting investments that create new industrial capacity and technology transfer, rather than focusing solely on the volume of capital inflows. Crucially, the robust positive effect of institutional quality indicates that strengthening the rule of law is the prerequisite for transforming foreign capital from a crowding-out force into a driver of long-term prosperity.
Author Contributions
All aspects of the study, including conceptualization, methodology, data collection, formal analysis, writing, and review, were carried out solely by the author. The author has read and agreed to the published version of the manuscript.
Funding
This research received no external funding.
Data Availability Statement
The data supporting the findings of this study include both publicly available datasets and newly calculated series. Public data were obtained from the World Bank’s World Development Indicators (WDI), UNCTAD Statistics, TurkStat and other databases cited in the manuscript. In addition, new data series—such as the domestic capital and FDI stock (calculated using the Perpetual Inventory Method) and the human capital index (calculated from education-related data)—were produced by the author. These calculated datasets are available from the corresponding author upon reasonable request.
Acknowledgments
The author notes that this study was conducted without external financial support.
Conflicts of Interest
The author declare no conflicts of interest.
Abbreviations
The following abbreviations are used in this manuscript:
| ARDL | Auto Regressive Distributed Lag |
| CCR | Canonical Cointegrating Regression |
| DOLS | Dynamic Ordinary Least Squares |
| EU | European Union |
| FDI | Foreign Direct Investment |
| FMOLS | Fully Modified Ordinary Least Squares |
| GCF | Gross Capital Formation |
| GDP | Gross Domestic Product |
| GVC | Global Value Chain |
| PIM | Perpetual Inventory Method |
| WDI | World Development Indicators |
Appendix A
The human capital index used in this study follows the methodology of Hall and Jones (1999) [48] and Bakış and Acar (2021) [96]. It is constructed by combining data on average years of schooling with the corresponding returns to education. This index captures the effect of education as a function of average years of schooling.
with
where Ht denotes the human capital index and Et corresponds to the average years of schooling, obtained from TurkStat.
Appendix B
In this study, the domestic capital stock and FDI Stock were calculated using the Perpetual Inventory Method (PIM). To isolate domestic investment from total gross capital formation (GCF), annual FDI inflows were subtracted from GCF, yielding the series for domestic investment. The PIM was then applied as follows:
where denotes the domestic capital stock at time t, is the depreciation rate and represents domestic investment, calculated as gross capital formation minus FDI inflows.
The initial capital stock was estimated using the standard formula:
where is domestic investment in the base year, is the long-run average growth rate of domestic investment, and is the depreciation rate. In this study , was set at 4.64%, calculated as the average growth rate of investment between 1970 and 2024, while was fixed at 6% following Bakış and Acar (2021) [90].
Gross capital formation data were obtained from the World Development Indicators (WDI) and TurkStat, while FDI inflows were sourced from WDI. The resulting domestic capital stock series was expressed in per worker terms by dividing by the labor force, which was also taken from WDI and TurkStat.
References
- Harrison, M.J. Can Corrupt Countries Attract Foreign Direct Investment? A Comparison Of FDI Inflows Between Corrupt And Non-Corrupt Countries. Int. Bus. Econ. Res. J. (IBER) 2011, 2. [CrossRef]
- Hyun, H.-J. QUALITY OF INSTITUTIONS AND FOREIGN DIRECT INVESTMENT IN DEVELOPING COUNTRIES: CAUSALITY TESTS FOR CROSS-COUNTRY PANELS. J. Bus. Econ. Manag. 2006, 7, 103–110. [CrossRef]
- Romer, P.M. Increasing Returns and Long-Run Growth. J. Politi- Econ. 1986, 94, 1002–1037. [CrossRef]
- Mankiw, N. G., Romer, D., & Weil, D. N. (1992). A contribution to the empirics of economic growth. The quarterly journal of economics, 107(2), 407-437.
- De Mello Jr, L. R. (1997). Foreign direct investment in developing countries and growth: A selective survey. The journal of development studies, 34(1), 1-34.
- Akinlo, A. Foreign direct investment and growth in NigeriaAn empirical investigation. J. Policy Model. 2004. [CrossRef]
- Iamsiraroj, S. The foreign direct investment–economic growth nexus. Int. Rev. Econ. Finance 2016, 42, 116–133. [CrossRef]
- Dunning, J. H. (1973). The determinants of international production. Oxford economic papers, 25(3), 289-336.
- Borensztein, E.; De Gregorio, J.; Lee, J.-W. How does foreign direct investment affect economic growth? J. Int. Econ. 1998, 45, 115–135. [CrossRef]
- Javorcik, B.S. Does Foreign Direct Investment Increase the Productivity of Domestic Firms? In Search of Spillovers Through Backward Linkages. Am. Econ. Rev. 2004, 94, 605–627. [CrossRef]
- Yimer, A. The effects of FDI on economic growth in Africa. J. Int. Trade Econ. Dev. 2022, 32, 2–36. [CrossRef]
- Dunning, J.H. Explaining the international direct investment position of countries: Towards a dynamic or developmental approach. Rev. World Econ. 1981, 117, 30–64. [CrossRef]
- Görg, H., & Greenaway, D. (2001). Foreign direct investment and intra-industry spillovers: a review of the literature.
- Amighini, A.; McMillan, M.; Sanfilippo, M. (2017). FDI and capital formation in developing economies: new evidence from industry-level data (No. w23049). National Bureau of Economic Research.
- Simionescu, M., & Naroş, M. S. (2019). The role of foreign direct investment in human capital formation for a competitive labour market. Management Research and Practice, 11(1), 5-14.
- Ramirez, M.D. Is foreign direct investment beneficial for Mexico? An empirical analysis, 1960–2001. World Dev. 2006, 34, 802–817. [CrossRef]
- Arısoy, İ. The Impact Of Foreign Direct Investment On Total Factor Productivity And Economic Growth In Turkey. J. Dev. Areas 2012, 46, 17–29. [CrossRef]
- Iamsiraroj, S.; Ulubaşoğlu, M.A. Foreign direct investment and economic growth: A real relationship or wishful thinking?. Econ. Model. 2015, 51, 200–213. [CrossRef]
- Bruno, R.L.; Cipollina, M. A meta-analysis of the indirect impact of foreign direct investment in old and new EU member states: Understanding productivity spillovers. World Econ. 2017, 41, 1342–1377. [CrossRef]
- Pintilie, N., Cicea, C., & Marinescu, C. (2020, November). A bibliometric study of environmental protection and economic development: revealing links and dynamics. In Proceedings of the 14th International Management Conference: Managing Sustainable Organizations, 5th-6th November, Bucharest, Romania (pp. 335-345).
- De Gregorio, J. (1992). Economic growth in latin america. Journal of development economics, 39(1), 59-84.
- Blomström, M.; Kokko, A.; Zejan, M. Host country competition, labor skills, and technology transfer by multinationals. Rev. World Econ. 1994, 130, 521–533. [CrossRef]
- Balasubramanyam, V.N.; Salisu, M.; Sapsford, D. Foreign Direct Investment and Growth in EP and is Countries. Econ. J. 1996, 106, 92. [CrossRef]
- Basu, P.; Chakraborty, C.; Reagle, D. Liberalization, FDI, and Growth in Developing Countries: A Panel Cointegration Approach. Econ. Inq. 2003, 41, 510–516. [CrossRef]
- Baharumshah, A.Z.; Almasaied, S.W. Foreign Direct Investment and Economic Growth in Malaysia: Interactions with Human Capital and Financial Deepening. Emerg. Mark. Finance Trade 2009, 45, 90–102. [CrossRef]
- Jude, C. Does FDI crowd out domestic investment in transition countries?. Econ. Transit. Institutional Chang. 2018, 27, 163–200. [CrossRef]
- Bénétrix, A.; Pallan, H.; Panizza, U. The Elusive Link between FDI and Economic Growth; World Bank: Washington, DC, United States, 2023; ISBN: .
- Baldwin, R. E. (2006). Globalisation: the great unbundling (s).
- Hermes, N.; Lensink, R. Foreign direct investment, financial development and economic growth. J. Dev. Stud. 2003, 40, 142–163. [CrossRef]
- Alfaro, L.; Chanda, A.; Kalemli-Ozcan, S.; Sayek, S. FDI and economic growth: the role of local financial markets. J. Int. Econ. 2004, 64, 89–112. [CrossRef]
- Azman-Saini, W.; Law, S.H.; Ahmad, A.H. FDI and economic growth: New evidence on the role of financial markets. Econ. Lett. 2010, 107, 211–213. [CrossRef]
- Alfaro, L.; Chanda, A.; Kalemli-Ozcan, S.; Sayek, S. Does foreign direct investment promote growth? Exploring the role of financial markets on linkages. J. Dev. Econ. 2010, 91, 242–256. [CrossRef]
- Osei, M.J.; Kim, J. Foreign direct investment and economic growth: Is more financial development better?. Econ. Model. 2020, 93, 154–161. [CrossRef]
- Durham, J. Absorptive capacity and the effects of foreign direct investment and equity foreign portfolio investment on economic growth. Eur. Econ. Rev. 2004, 48, 285–306. [CrossRef]
- Jude, C.; Levieuge, G. Growth Effect of Foreign Direct Investment in Developing Economies: The Role of Institutional Quality. World Econ. 2016, 40, 715–742. [CrossRef]
- Melnyk, L., Kubatko, O., & Pysarenko, S. (2014). The impact of foreign direct investment on economic growth: case of post communism transition economies. Problems and perspectives in Management, (12, Iss. 1), 17-24.
- Ciftci, C.; Durusu-Ciftci, D. Economic freedom, foreign direct investment, and economic growth: The role of sub-components of freedom. J. Int. Trade Econ. Dev. 2021, 31, 233–254. [CrossRef]
- Carkovic, M., & Levine, R. (2005). Does foreign direct investment accelerate economic growth. Does foreign direct investment promote development, 195, 220.
- Mišun, J.; Tomšík, V. Foreign direct investment in central europe - does it crowd in domestic investment?. Prague Econ. Pap. 2002, 11, 57–66. [CrossRef]
- Herzer, D.; Klasen, S.; D., F.N.-L. In search of FDI-led growth in developing countries: The way forward. Econ. Model. 2008, 25, 793–810. [CrossRef]
- Markusen, J.R.; Venables, A.J. Multinational firms and the new trade theory. J. Int. Econ. 1998, 46, 183–203. [CrossRef]
- Easterly, W. How much do distortions affect growth?. J. Monetary Econ. 1993, 32, 187–212. [CrossRef]
- Iwasaki, I.; Tokunaga, M. Macroeconomic Impacts of FDI in Transition Economies: A Meta-Analysis. World Dev. 2014, 61, 53–69. [CrossRef]
- Ramírez, M. Foreign Direct Investment in Mexico: A Cointegration Analysis. J. Dev. Stud. 2000, 37, 138–162. [CrossRef]
- Fry, M. J. (1999, January). Financing economic reform: mobilising domestic resources and attracting the right kind of external resources. In Growth and Competition in the New Global Economy (p. 59). OECD Publishing.
- Findlay, R. Relative Backwardness, Direct Foreign Investment, and the Transfer of Technology: A Simple Dynamic Model. Q. J. Econ. 1978, 92. [CrossRef]
- Vu, T.B.; Noy, I. Sectoral analysis of foreign direct investment and growth in the developed countries. J. Int. Financial Mark. Institutions Money 2009, 19, 402–413. [CrossRef]
- Chakraborty, D.; Nagarajan, S.; Aggarwal, P.; Gupta, V.; Tomar, R.; Garg; Sahoo; Sarkar, A.; Chopra, U.; Sarma, K.S.; et al. Effect of mulching on soil and plant water status, and the growth and yield of wheat (Triticum aestivum L.) in a semi-arid environment. Agric. Water Manag. 2008, 95, 1323–1334. [CrossRef]
- Wang, M. Manufacturing FDI and economic growth: evidence from Asian economies. Appl. Econ. 2009, 41, 991–1002. [CrossRef]
- Aykut, D., & Sayek, S. (2007). The role of the sectoral composition of foreign direct investment on growth. Do multinationals feed local development and growth, 22, 35-62.
- Haini, H.; Tan, P. Re-examining the impact of sectoral- and industrial-level FDI on growth: Does institutional quality, education levels and trade openness matter?. Aust. Econ. Pap. 2022, 61, 410–435. [CrossRef]
- Ullah, S.; Luo, R.; Ali, K.; Irfan, M. How does the sectoral composition of FDI induce economic growth in developing countries? The key role of business regulations. Econ. Res. Istraz. 2022, 36. [CrossRef]
- Marasco, A.; Khalid, A.M.; Tariq, F. Does technology shape the relationship between FDI and growth? A panel data analysis. Appl. Econ. 2023, 56, 2544–2567. [CrossRef]
- Zhang, K.H.; Song, S. Promoting exports: the role of inward FDI in China. China Econ. Rev. 2001, 11, 385–396. [CrossRef]
- Akadiri, S.S.; Ajmi, A.N. Causality relationship between energy consumption, economic growth, FDI, and globalization in SSA countries: a symbolic transfer entropy analysis. Environ. Sci. Pollut. Res. 2020, 27, 44623–44628. [CrossRef]
- Kokko, A. O. (1994). Foreign direct investment, host country characteristics, and spillovers.
- Ciobanu, M. (2015). Foreign direct investments and processing industry competitiveness in the Republic of Moldova. Meridian Ingineresc, (4), 50-57.
- Ayanwale, A. B. (2007). FDI and economic growth: Evidence from Nigeria.
- Kechagia, P.; Metaxas, T. Sixty Years of FDI Empirical Research: Review, Comparison and Critique. J. Dev. Areas 2018, 52, 169–181. [CrossRef]
- Kostoulis, D. FOREIGN DIRECT INVESTMENT AND GROWTH: A LITERATURE REVIEW FROM 1990 TO DATE. Eur. J. Econ. Financial Res. 2023, 7. [CrossRef]
- Bengoa, M.; Sanchez-Robles, B. Foreign direct investment, economic freedom and growth: new evidence from Latin America. Eur. J. Politi- Econ. 2003, 19, 529–545. [CrossRef]
- Iqbal Chaudhry, N., Mehmood, A., & Saqib Mehmood, M. (2013). Empirical relationship between foreign direct investment and economic growth: An ARDL co-integration approach for China. China Finance Review International, 3(1), 26-41.
- Chowdhury, R. A., Abdullah, M. N., & Tooheen, R. B. (2017). FDI-based business: the case of Bangladesh. World, 7(2), 1-8.
- Bergougui, B.; Murshed, S.M. Spillover effects of FDI inflows on output growth: An analysis of aggregate and disaggregated FDI inflows of 13 MENA economies. Aust. Econ. Pap. 2023, 62, 668–692. [CrossRef]
- Bildirici, M., Aykaç-Alp, E., & Kayıkçı, F. (2010, November). Effects of Foreign Direct Investment on Growth in Türkiye. In International Conference on Eurasian Economies, Istanbul, November (pp. 4-5).
- Ilgun, E., Karl-Josef, K. O. C. H., & Orhan, M. (2010). How Do Foreign Direct Investment And Growth Interact In Türkiye?. Eurasian Journal Of Business And Economics, 3(6), 41-55.
- Ekinci, A. (2011). Doğrudan yabancı yatırımların ekonomik büyüme ve istihdama etkisi: Türkiye uygulaması (1980-2010). Eskişehir Osmangazi Üniversitesi İİBF Dergisi, 6(2), 71-96.
- Aga, A. A. K. (2014). The impact of foreign direct investment on economic growth: A case study of Türkiye 1980–2012. International Journal of Economics and Finance, 6(7), 71-84.
- Cambazoglu, B., & Simay Karaalp, H. (2014). Does foreign direct investment affect economic growth? The case of Türkiye. International Journal of Social Economics, 41(6), 434-449.
- Demirsel, M. T., Adem, Ö., & Mucuk, M. (2014, October). The effect of foreign direct investment on economic growth: the case of Türkiye. In Proceedings of International Academic Conferences (No. 0702081). International Institute of Social and Economic Sciences.
- Gokmen, O. (2021). The relationship between foreign direct investment and economic growth: A case of Türkiye. arXiv preprint arXiv:2106.08144.
- Kurul, Z. (2021). Türkiye’de doğrudan yabancı yatırım girişleri ve yurtiçi yatırım ilişkisi: Doğrusal olmayan ARDL yaklaşımı. Sosyoekonomi, 29(49), 271-292.
- Saglam, B. B., & Yalta, A. Y. (2011). Dynamic linkages among foreign direct investment, public investment and private investment: Evidence from Türkiye. Applied Econometrics and International Development, 11(2), 71-82.
- Solow, R. M. (1956). A contribution to the theory of economic growth. The quarterly journal of economics, 70(1), 65-94.
- Lucas Jr, R. E. (1988). On the mechanics of economic development. Journal of monetary economics, 22(1), 3-42.
- Barro, R. J. (2001). Human capital and growth. American economic review, 91(2), 12-17.
- Neuhaus, M. (2006). The impact of FDI on economic growth: an analysis for the transition countries of Central and Eastern Europe. Heidelberg: Physica-Verlag HD.
- Barro, R. J., & Sala-i-Martin, X. (1992). Convergence. Journal of political Economy, 100(2), 223-251.
- Acemoglu, D., Johnson, S., & Robinson, J. A. (2005). Institutions as a fundamental cause of long-run growth. Handbook of economic growth, 1, 385-472.
- North, D. C. (1990). Institutions, institutional change and economic performance. Cambridge University.
- Hall, R.E.; Jones, C.I. Why do Some Countries Produce So Much More Output Per Worker than Others?. Q. J. Econ. 1999, 114, 83–116. [CrossRef]
- Barro, R.J.; Lee, J.W. A new data set of educational attainment in the world, 1950–2010. J. Dev. Econ. 2013, 104, 184–198. [CrossRef]
- Pesaran, M.H.; Shin, Y.; Smith, R.J. Bounds testing approaches to the analysis of level relationships. J. Appl. Econom. 2001, 16, 289–326. [CrossRef]
- Pesaran, M.H. & Shin, Y. (1999) An autoregressive distributed lag modelling approach to cointegration analysis ,In: S. Strom (ed.), Econometrics and Economic Theory in the 20th Century: The Ragnar Frisch Centennial Symposium, 1999, Ch. 11. Cambridge University Press, Cambridge.
- Narayan, P.K. The saving and investment nexus for China: evidence from cointegration tests. Appl. Econ. 2005, 37, 1979–1990. [CrossRef]
- Ouattara, B. (2004). Modelling the long run determinants of private investment in Senegal (No. 04/05). Credit Research Paper.
- MacKinnon, J. G. (1996). Numerical distribution functions for unit root and cointegration tests. Journal of applied econometrics, 11(6), 601-618.
- Kwiatkowski, D., Phillips, P. C., Schmidt, P., & Shin, Y. (1992). Testing the null hypothesis of stationarity against the alternative of a unit root: How sure are we that economic time series have a unit root? Journal of econometrics, 54(1-3), 159-178.
- Lee, J.; Strazicich, M.C. Minimum Lagrange Multiplier Unit Root Test with Two Structural Breaks. Rev. Econ. Stat. 2003, 85, 1082–1089. [CrossRef]
- Easterly, W.; Kremer, M.; Pritchett, L.; Summers, L.H. Good policy or good luck?. J. Monetary Econ. 1993, 32, 459–483. [CrossRef]
- Singer, H. W. (1950). The Distribution of Gains between Investing and Borrowing Countries. American Economic Review, Papers and Proceedings.
- Acemoglu, D.; Naidu, S.; Restrepo, P.; Robinson, J.A. Democracy Does Cause Growth. J. Politi- Econ. 2019, 127, 47–100. [CrossRef]
- Rodrik, D.; Subramanian, A.; Trebbi, F. Institutions Rule: The Primacy of Institutions Over Geography and Integration in Economic Development. J. Econ. Growth 2004, 9, 131–165. [CrossRef]
- Hanushek, E.; Woessmann, L. (2009). Schooling, cognitive skills, and the Latin American growth puzzle (No. w15066). National Bureau of Economic Research.
- Docquier, F.; Rapoport, H. Globalization, Brain Drain, and Development. J. Econ. Lit. 2012, 50, 681–730. [CrossRef]
- Bakış, O., & Acar, U. (2021). Türkiye ekonomisinde toplam faktör verimliliği: 1980-2019. Journal of Research in Economics, 5(1), 1-27.
Figure 1.
CUSUM and CUSUM of Squares Test Results.
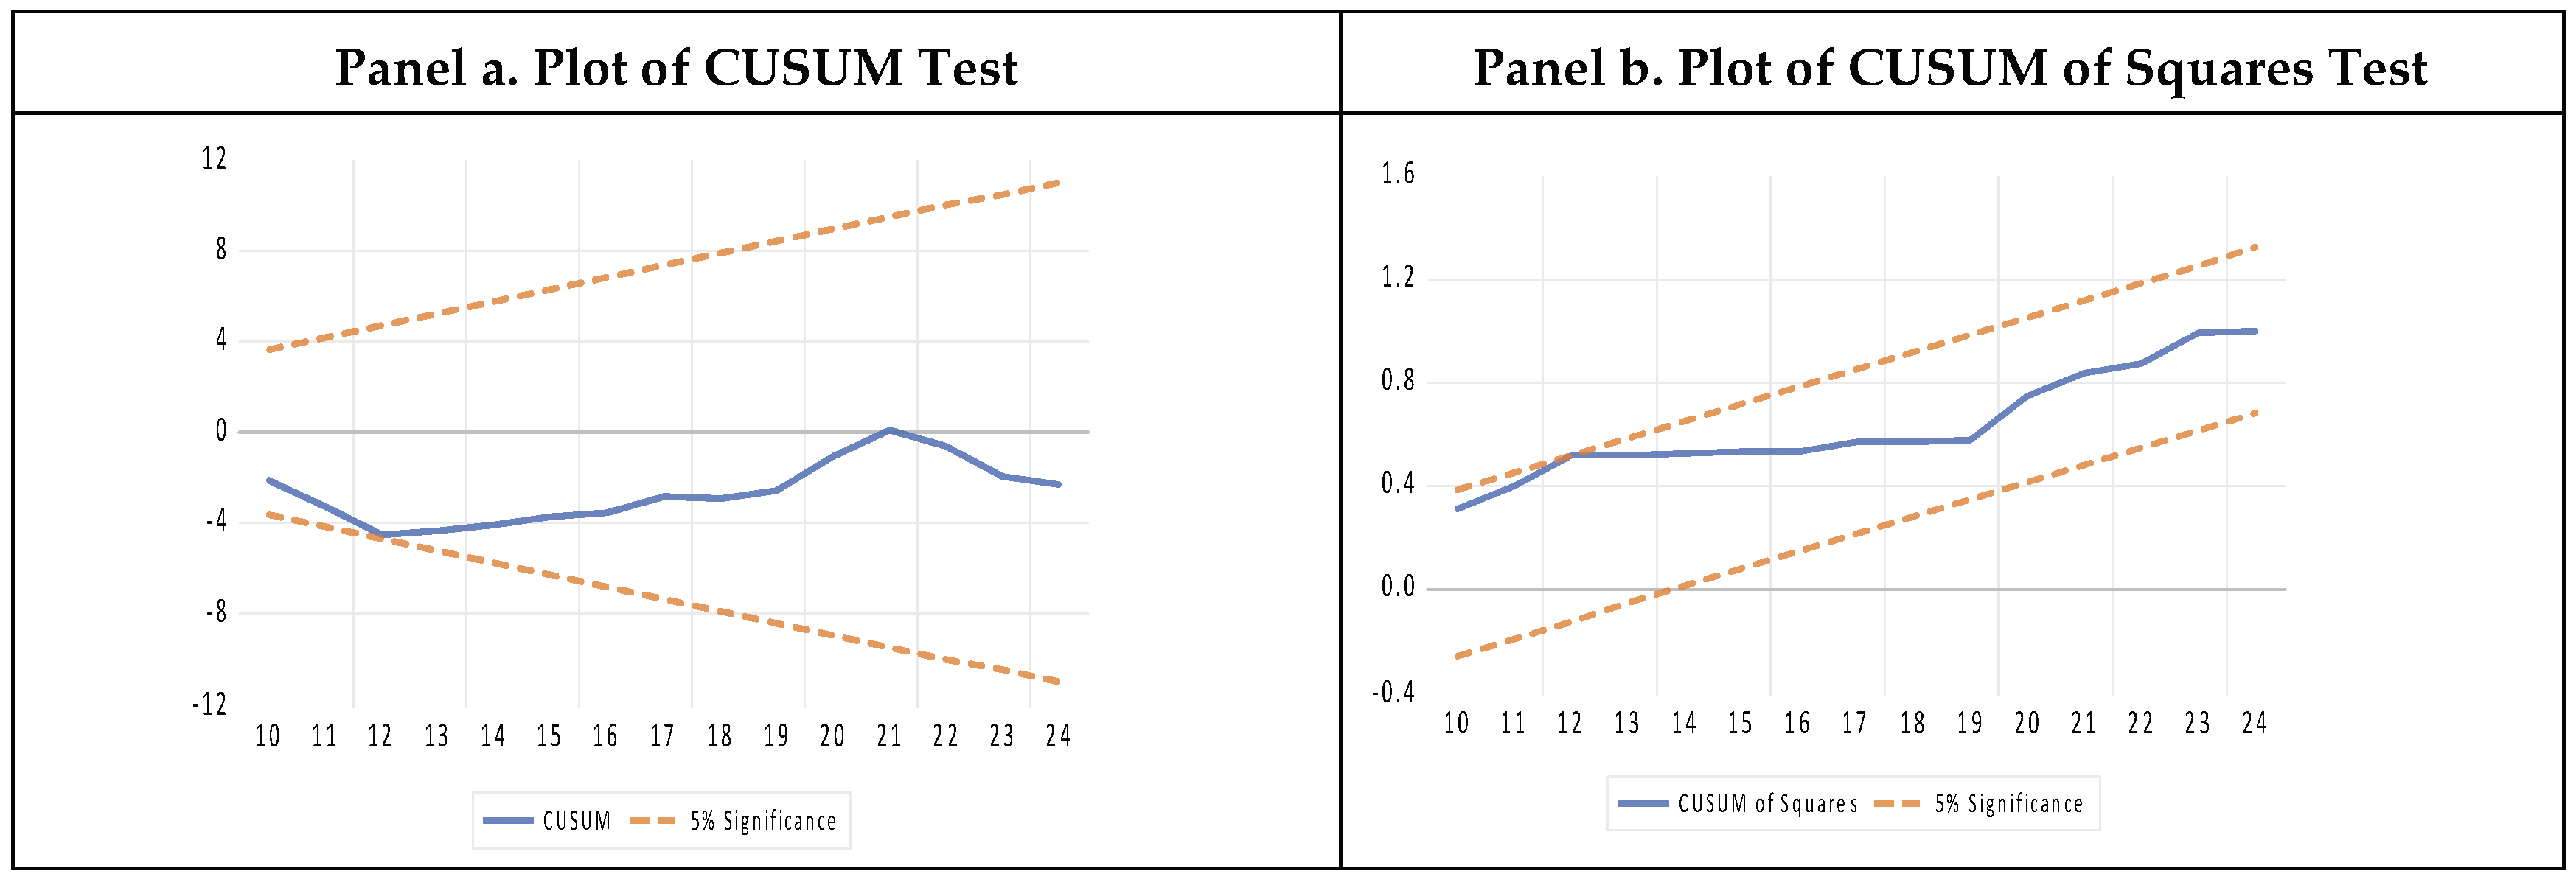
Table 1.
Summary of the Selective Empirical Literature*.
| Data Coverage | Sample | Dependent variable | FDI Stocks/ Flows | Methodology | Main Findings (+/-) | |
| Balabsubrmanyam et. al. (1994) [23] | 1970-85 | 46 countries | Real DGP growth | Flow | Cross-section regression (OLS) | + |
| Borenzstein et al. (1996) [9] | 1970-89 | 69 developing countries | Real GDP Growth | Flow | Cross-country regression | + |
| De Mello (1999) [5] | 1970-90 | 32 OECD and non OECD countries | Per capita real GDP, TFP | Flow | Panel and country specific cointegration | + |
| Zhang and Song (2001) [54] | 1984-98 | China provinces | Real GDP growth | Flow | Cross- section Panel data (OLS) | + |
| Basu et. al. (2003) [24] | 1978-96 | 23 developing countries | Real GDP | Flow | Panel Cointegration | + |
| Bengoa and Sanchez-Robbles (2003) [62] | 1970-1999 | 18 developing countries | Real GDP per capita growth | Flow | Panel cointegration | + depending on the absorptive characteristics |
| Hermes and Lensink (2003) [29] | 1975-1995 | 67 Developing countries | Real GDP growth per capita | Flow | Panel data (OLS) | + depending on the absorptive characteristics |
| Akinlo(2004) [6] | 1970-2001 | Nigeria | Real GDP | Stock | Country specific, ECM | - (only + with a considerable lag) |
| Alfaro et. al. (2004) [30] | 1975-1995 | 71 countries | Real GDP per capita | Flow | Cross sectional analysis | + depending on the absorptive characteristics |
| Carkovic and Levine (2005) [38] | 1960-1995 | 79 developed and developing countries | Real per capita GDP growth | Flow | Panel data (GMM) | - |
| Aykut and Sayek (2008) [50] | 1990-2003 | 39 countries | Real GDP per capita growth | Flow | Cross sectional analysis | + (manufacturing sector) |
| Herzer et. al. (2008) [40] | 1970-2003 | 28 developing countries | Real GDP | Flow | Country specific cointegration | Some + some – depending on the absorptive characteristics |
| Azman-Saini et. al. (2010) [31] | 1976-2004 | 85 countries | Real GDP per capita | Flow | Panel data (GMM) | + depending on the absorptive characteristics |
| Iqbal Chaudhry et al. (2013) [62] | 1985-2009 | China | GDP (USD) | Flow | Cointegration- ARDL | + |
| Iamsiraroj& Ulubaşoğlu (2015) [18] | 1970-2009 | 140 developed and developing countries | Real GDP per capita | Flow | Dynamic panel data | + |
| Chaudry et al. (2017) [63] | 1990-2014 | 25 developing countries | Real GDP | Flow | Panel data cointegration (FMOLS) | + |
| Ciobanu (2020) [57] | 1991-2018 | Romania | Real GDP | Flow | ARDL | + |
| Benetrix et. al. (2023) [27] | 1970-2017 (different samples) | 96 countries | Real GDP growth | Flow | Cross-country and panel regression | + depending on the absorptive characteristics |
| Bergougui and Murshed (2023) [64] | 2000-2020 | 13 MENA countries | Real GDP per capita/ sectoral real GDP per capita | Flow | Dynamic panel GMM | + (manufacturing sector) |
| Osei and Kim (2023) [33] | 1990-2009 | 75 countries | Real GDP | Flow | Threshold non-linear dynamic panel | + depending on the absorptive characteristics |
| Yimer (2023) [11] | 1990-2016 | 46 African countries classified as fragile, investment driven and factor driven | Real GDP | Stock | Panel data cointegration (CCE estimator) | + in investment driven in, + in factor driven only in the long run, - in fragile states |
| Morasco et.al. (2024) [53] | 1989-2019 | 48countries | Real GDP per capita growth | Flow | Dynamic Panel (GMM) | + (in high-tech and low tech, - in medium tech sectors) |
| Empirical Literature related to Türkiye | ||||||
| Bildirici et. al. (2010) [65] | 1992-2008 | Türkiye | Industrial Production | Flow | Treshold cointegration | + |
| İlgün et. al. (2010) [66] | 1980-2004 | Türkiye | Real GDP growth | Flow | VAR and causality tests | + |
| Ekinci (2011) [67] | 1980-2010 | Türkiye | Real GDP | Flow | Cointegration analysis | + |
| Arısoy (2012) [17] | 1960-2005 | Türkiye | Real GDP growth | Flow | Cointegration analysis | + |
| Aga (2014) [68] | 1980-2012 | Türkiye | GDP per capita (USD) | Flow | Cointegration analysis | + |
| Cambazoğlu and Karaalp (2014) [69] | 1980-2010 | Türkiye | Real GDP growth | Flow | VAR analysis | + |
| Demirsel et. al. (2014) [70] | 2002-2014 | Türkiye | Real GDP | Flow | Cointegration analysis | No significant relationship |
| Gökmen (2021) [71] | 1970-2019 | Türkiye | Real GDP | Flow | Cointegration analysis | No significant relationship |
| Kurul (2021) [72] | 1984-2018 | Türkiye | Real GDP growth | Flow | Non-linear ARDL | + |
* The models used in these studies incorporate several absorptive characteristics of the countries, such as human capital, financial development, institutional quality (such as quality of institutions, economic corruption), economic freedom, trade openness, etc. While these variables play a critical role, we give empirical evidence on the impact of FDI on economic growth in order to be specific. For those interested in exploring the impact of these broader variables in detail, consulting individual studies is recommended.
Table 2.
Unit Root Test Results.
| ADF Test Results | PP Test Results | KPSS Test Results | |||||
| Level | 1st difference | Level | 1st difference | Level | 1st difference | Result | |
| ly | 0.03 | -8.84*** | -0.06 | -8.94*** | 1.46 | 0.05 | I(1) |
| lA | -1.34 | -6.55*** | -1.76 | -4.43*** | 0.28 | 0.08 | I(1) |
| lH | -0.96 | -3.76*** | -0.31 | -2.98** | 1.45 | 0.10 | I(1) |
| lkd | 1.11 | -6.53*** | -2.70* | -15.09*** | 1.23 | 0.25 | I(1) |
| lfdistock | -2.02 | -8.54*** | -4.22 | -16.44*** | 1.28 | 0.03 | I(1) |
Notes: For ADF and PP tests, H0 implies the series has a unit root (non-stationary). For the KPSS test, H0 implies the series is stationary. *, ** and *** indicate statistical significance at the 10%, 5%, and 1% levels, respectively. Critical values are based on MacKinnon (1996) [87] for ADF/PP and Kwiatkowski et al. (1992) [88] for KPSS. The models reported are the models with intercept, but the other models also reveal the same result. Optimal ADF lag lengths were determined via SIC. For PP and KPSS, a fixed bandwidth of 3 (Bartlett kernel) was utilized to ensure methodological consistency and mitigate potential biases associated with small sample sizes (T=55).
Table 4.
Bounds Test Results for ARDL (1,1,2,0,2) Model.
| Bounds Critical Values | |||
|---|---|---|---|
| (no cointegration) | |||
| k=4 | I(0) | I(1) | |
| Calculated F Statistics: 10.33*** | 10% | 3.21 | 4.29 |
| 5% | 3.79 | 4.99 | |
| 1% | 5.11 | 6.49 | |
***means statistical significance at the 1% level and k is the number of regressors. Note: Critical values are drawn from Narayan (2004) [84].
Table 5.
Estimated Long-Run and Short-Run Results- ARDL Model.
| Coefficient | Std. Error | t-statistic | Probability | ||
| Dependent Variable: ly (GDP per worker) | |||||
| Panel A: Long-Run Coefficients | |||||
| lA | 0.13** | 0.07 | 1.99 | 0.05 | |
| lH | -2.19*** | 0.41 | -5.39 | 0.00 | |
| lkd | -0.01 | 0.01 | -0.28 | 0.78 | |
| lfdistock | -0.05*** | 0.01 | -3.79 | 0.00 | |
| Panel B: Short-Run Coefficients | |||||
| ∆ lA | 0.24*** | 0.08 | 2.88 | 0.00 | |
| ∆ lH | -9.59*** | 2.77 | -3.46 | 0.00 | |
| ∆ lH (-1) | 6.84** | 2.77 | 2.47 | 0.02 | |
| ∆ lfdistock | -0.02*** | 0.01 | -3.91 | 0.00 | |
| ∆ lfdistock (-1) | 0.01** | 0.01 | 2.09 | 0.04 | |
| DUM1994 | -0.11*** | 0.02 | -5.31 | 0.00 | |
| DUM2001 | -0.07** | 0.03 | -2.56 | 0.01 | |
| DUM2009 | -0.05* | 0.03 | -1.92 | 0.06 | |
| C | 8.68*** | 1.14 | 7.58 | 0.00 | |
| TREND | 0.04*** | 0.01 | 7.70 | 0.00 | |
| ECM | -0.75*** | 0.01 | -7.56 | 0.00 | |
| Panel C: Diagnostic Test Results | |||||
| Test Results | Probability | ||||
| Serial Correlation (Breusch-Godfrey) | F = 0.08 | 0.89 | |||
| Heteroskedasticity (Breusch-Pagan-Godfrey) | F = 20.02 | 0.13 | |||
| Model Specification (Ramsey RESET) | F = 0.19 | 0.67 | |||
| Normality of Residuals (Jarque-Bera) | JB = 1.60 | 0.44 | |||
***denotes significance at 1%, ** denotes significance at 5% and * denotes significance at 10%.
Table 6.
Robustness Checks: Long-Run Coefficients.
| ARDL | FMOLS | DOLS | CCR | |
|
Dependent Variable: ly (GDP per worker) | ||||
| lA | 0.13** (0.05) |
0.16*** (0.00) |
0.24* (0.09) |
0.12*** (0.00) |
| lH | -2.19*** (0.00) |
-1.60*** (0.00) |
-3.22*** (0.00) |
-1.46*** (0.00) |
| lkd | -0.01 (0.77) |
-0.01** (0.04) |
0.01 (0.85) |
-0.02*** (0.00) |
| lfdistock | -0.05*** (0.00) |
-0.01** (0.03) |
-0.14*** (0.00) |
-0.01** (0.03) |
Notes: ***denotes significance at 1%, ** denotes significance at 5% and * denotes significance at 10%. For FMOLS and CCR estimators, bandwidths were selected based on the Akaike Information Criterion (AIC) to ensure optimal adjustment for the sample size. For the DOLS estimator, lead and lag lengths were determined to correct for simultaneity bias. Structural break dummies were included in all specifications to ensure correct model specification but are not reported in this table for brevity.
| 1 | Foreign direct investment (FDI) refers to an investment in which an investor from one country acquires at least 10 per cent of the voting rights in an enterprise located in another country, with the intention of establishing a lasting interest and exerting significant influence over its management. FDI also serves as the backbone of multinational enterprises (MNEs), enabling them to establish and maintain control over operations across multiple countries. |
| 2 | |
| 3 | Dutch disease refers to the negative economic consequences that may arise when large inflows of foreign currency (e.g., from natural resources or capital inflows) lead to an appreciation of the domestic currency. This appreciation makes tradable sectors, particularly manufacturing and exports, less competitive, thereby shifting resources toward non-tradable sectors and potentially harming long-term growth. See Findlay (1978) |
| 4 | |
| 5 | Sağlam and Yalta (2011) [73], searched for the effects of FDI on private and public investments as these are important determinants of economic growth between 1970 and 2009. They could not find a long-run significant relationship between FDI and investment. |
| 6 | For convenience, variables in logarithmic form are denoted with an ‘l’ prefix (e.g. ly = log(y)) |
| 7 | The Crash Model (Model A) is specifically selected as it allows for structural breaks in the intercept, reflecting sudden and permanent shifts in the level of the macroeconomic series. Given the economic history of Türkiye, major shocks—such as the 1980 liberalization reforms, the 1994 and 2001 financial crises—typically cause abrupt level shifts (intercept) rather than fundamental changes in the long-run growth rate (slope). By focusing on intercept shifts, Model A maintains greater parsimony and statistical power, avoiding the risk of over-parameterization. |
Disclaimer/Publisher’s Note: The statements, opinions and data contained in all publications are solely those of the individual author(s) and contributor(s) and not of MDPI and/or the editor(s). MDPI and/or the editor(s) disclaim responsibility for any injury to people or property resulting from any ideas, methods, instructions or products referred to in the content. |
© 2026 by the author. Licensee MDPI, Basel, Switzerland. This article is an open access article distributed under the terms and conditions of the Creative Commons Attribution (CC BY) license.
Copyright: This open access article is published under a Creative Commons CC BY 4.0 license, which permit the free download, distribution, and reuse, provided that the author and preprint are cited in any reuse.


