Submitted:
22 January 2026
Posted:
22 January 2026
You are already at the latest version
Abstract
Background: Population aging poses a growing public health challenge in low- and middle-income countries, including Indonesia. Functional independence is a key determinant of older adults’ quality of life, yet integrated community-based health promotion models addressing this issue remain limited. Objective: This study developed and empirically validated an Integrated 5I Health Promotion Model (Identify, Inspire, Initiate, Integrate, and Impact) to enhance independence and quality of life among pre-older adults and older adults in an urban Indonesian setting. Methods: A community-based cross-sectional survey was conducted among 240 pre-older adults and older adults in Surakarta, Indonesia, using proportional cluster sampling from community activity groups. The Integrated 5I Model was constructed based on the Health Belief Model, the Logic Model, and a pentahelix approach. Data were collected using a structured questionnaire and analyzed using path analysis to examine direct and indirect relationships among internal and external factors, perceptions, participation, independence, and quality of life. Results: The model demonstrated good structural fit and explained a substantial proportion of variance in independence and quality of life. Perception and participation played significant mediating roles between internal and external factors and independence. Increased independence was significantly associated with improved quality of life among older adults. Participation showed the strongest direct effect on physical independence (β = 3.018, p < 0.001), while independence significantly predicted quality of life (β = 0.599, p < 0.001). The model demonstrated excellent fit (CFI = 1.000; RMSEA = 0.000; SRMR = 0.012). Conclusions: The Integrated 5I Health Promotion Model provides a pragmatic and scalable framework for community-based interventions designed to promote independence and quality of life among aging populations in urban low- and middle-income settings. This model has important implications for public health programs and policies targeting healthy and active aging.
Keywords:
health promotion model
; independence
; quality of life
; older adults
; path analysis
; Indonesia
1. Introduction
Population ageing is accelerating worldwide, particularly in low- and middle-income countries (LMICs), where demographic transitions occur alongside limited health and social care resources [1,2]. Maintaining physical independence has become a critical priority [3], as functional decline is strongly associated with increased healthcare utilization, long-term care dependency, and reduced quality of life [4,5]. The World Health Organization emphasizes functional ability and healthy ageing as key outcomes for ageing populations, highlighting the need for effective community-based health promotion strategies [1].
Physical independence is influenced by daily activities, including household tasks, leisure-time activities, work-related activities, and social activities or participation in religious [6,7]. These forms of activity contribute to mobility, strength, social interaction, and psychological well-being. Previous studies have demonstrated that regular participation in such activities is associated with better functional status and quality of life among older adults [7,8]. However, in many LMIC contexts, these activities remain underutilized within structured health promotion programs.
Despite growing evidence on the benefits of active ageing, existing health promotion interventions for older adults are often fragmented and narrowly focused on individual behaviors. Many programs emphasize physical activity alone without adequately addressing cognitive perceptions, social participation, or environmental and institutional support [8,9]. As a result, these interventions may have limited sustainability and impact, particularly in community settings where older adults’ behaviors are shaped by complex interactions between personal beliefs, social networks, and structural factors.
Integrated and theory-informed frameworks are therefore needed to guide health promotion strategies for older adults. Behavioral theories such as the Health Belief Model offer insights into how perceptions influence health-related behaviors [9,10]. The Logic Model. supports systematic planning, implementation, and evaluation of interventions [11,12]. In addition, multisectoral collaboration, as conceptualized by the pentahelix approach, is increasingly recognized as essential for addressing complex public health challenges, including healthy ageing, at the community level [13,14].
To address these gaps, this study developed and empirically tested an Integrated 5I Health Promotion Model comprising Identify, Inspire, Initiate, Integrate, and Impact to enhance physical independence and quality of life among older adults in Indonesia. Using structural path analysis, this study examines the relationships between internal and external factors, perception, participation, independence, and quality of life. The proposed model provides a practical and scalable framework for community-based health promotion and offers evidence relevant to healthy ageing initiatives in LMIC settings.
2. Materials and Methods
2.1. Study Design
This study employed a community-based cross-sectional analytical design to examine determinants of physical independence and quality of life among pre-older adults and older adults in Surakarta, Indonesia.
2.2. Study Setting and Population
The study was conducted in Surakarta City, Central Java, Indonesia, an urban area with an established network of community-based elderly health services. The target population consisted of community-dwelling adults aged 55 years and older, including pre-older adults (55–59 years) and older adults (60 years or older). Individuals with severe cognitive impairment or acute illness that prevented participation were excluded.
2.3. Sampling Technique and Sample Size
A proportional cluster sampling technique was applied. Community activity groups and elderly health posts (Posyandu Lansia) served as sampling clusters. Clusters were selected proportionally across administrative areas to ensure representation of different community settings. Eligible participants within the selected clusters were invited to participate.
A total of 240 respondents were selected using proportional cluster sampling. This size is adequate for path analysis [15].
2.4. Study Variables
The study examined relationships among internal factors, external factors, perception, participation, physical independence, and quality of life. Internal factors included individual characteristics such as age, sex, education, and health status. External factors reflected environmental and social support. Perception referred to beliefs and attitudes related to physical activity and ageing, as knowledge, experience (including previous program exposure), perceived benefits, perceived barriers, and self-efficacy. Participation captured involvement in individual physical activities and social-community engagement, including religious participation. Independence captured engagement in daily physical activities, including household, leisure-time, work-related, and religious activities. Physical independence and quality of life were treated as outcome variables.
2.5. Measurement Instruments
Data were collected using a structured questionnaire developed through adaptation of existing instruments and contextual modification for older adults. The questionnaire comprised sections assessing internal and external factors, perception, participation, physical independence, and quality of life. All items were assessed using Likert-type scales, and a structured yes or no questionnaire was designed. Before data collection, the instrument was reviewed for clarity and cultural appropriateness. The reliability and validity of the constructs were evaluated during data analysis.
Cognitive function was assessed using the Mini-Mental State Examination (MMSE), depressive symptoms using the Geriatric Depression Scale (GDS), physical activity independence using the Physical Activity Scale for the Elderly (PASE) expanded with items on frequency and role in religious activities, and quality of life using the WHOQOL-BREF, extended with three additional dimensions (freedom, religiosity, and happiness). All instruments have demonstrated acceptable validity and reliability in older adult populations, including Indonesian settings. The construct validity and internal consistency of the adapted instruments were assessed during data analysis to ensure suitability for the study population. All constructs demonstrated acceptable reliability for structural modeling
2.6. Data Collection Procedures
Data were collected through face-to-face interviews conducted by trained enumerators between July and August 2024. Interviews were carried out at participants’ homes or community meeting locations, depending on participant preference. Each interview lasted approximately 30–60 minutes. Written informed consent was obtained from all participants before data collection.
2.7. Data Analysis
Descriptive statistics were used to summarize participant characteristics. Path analysis was conducted to examine direct and indirect relationships among study variables in accordance with the proposed Integrated 5I Health Promotion Model. Statistical analyses were performed using StataMP version 13. Statistical significance was set at p < 0.05.
2.8. Ethical Considerations
The study was conducted in accordance with the Declaration of Helsinki and received ethical approval from the appropriate institutional review board. All participants provided informed consent, and confidentiality of data was strictly maintained.
3. Results
3.1. Participant Characteristics
A total of 240 respondents participated in this study. The participants consisted of pre-older adults aged 55–59 years and older adults aged 60 years or over. The majority were female, had completed basic to secondary education, and were living independently in the community. Most participants reported regular engagement in daily activities, including household tasks, leisure-time activities, religious activities, and, to a lesser extent, work-related activities. Detailed demographic characteristics are presented in Table 1.

Table 1.
Sociodemographic and Psychological Characteristics of Participants (N = 240) .
| Variable/Category | Mean ± SD | % | N |
| Age (years) | 66.4 ± 7.2 | — | 240 |
| Gender | Female | 62.5% | 240 |
| Marital Status | Married | 58.8% | 240 |
| Widowed/Divorced | 38.7% | 240 | |
| Occupational Status | Active / Retired | 42.3% / 57.7% | 240 |
| Cognitive function (MMSE) | ≥ 24 (Normal) | 63.0% | 240 |
| Depression (GDS ≤10) | Low–Moderate | 69.1% | 240 |
3.2. Descriptive Statistics of Study Variables
Descriptive analysis showed moderate to high mean scores for perception and participation variables. Physical independence and quality of life scores indicated generally favorable functional status among participants. Summary statistics for internal factors, external factors, perception, participation, physical independence, and quality of life are presented in Table 2.
Table 2.
Respondent Characteristics by Interview Location (n=240).
| Characteristics | Total (n=240) | Community Centers (n=217) | Home Visits (n=23) | p-value |
|---|---|---|---|---|
| Age (Mean ± SD) | 68.16 ± 6.89 | 68.07 ± 7.05 | 69.00 ± 5.22 | 0.446 |
| Gender, n (%) | 0.869 | |||
| - Female | 191 (79.6%) | 173 (79.7%) | 18 (78.3%) | |
| - Male | 49 (20.4%) | 44 (20.3%) | 5 (21.7%) | |
| Health Status scores | ||||
| - Independence (Mean ± SD) | 19.96 ± 5.69 | 20.37 ± 5.71 | 16.48 ± 4.08 | 0.001* |
| - Quality of Life (Mean ± SD) | 174.85 ± 14.21 | 175.12 ± 13.74 | 172.04 ± 20.73 | 0.951 |
3.3. Bivariate Associations
Bivariate analysis demonstrated statistically significant associations between participation and physical independence, as well as between physical independence and quality of life (p < 0.05). Perception was also significantly associated with participation. Associations among other variables are summarized in Table 3.
Table 3.
The Spearman Correlation Matrix Among The Six Major Constructs (N = 240).
| Variable | r p |
Internal Factors | External Factors | Perception | Participation | Independence |
| External Factors | r | -0.0591 | ||||
| p | 0.3623 | |||||
| Perception | r | -0.1756 | 0.5502 | |||
| p | 0.0064 | 0.0000 | ||||
| Participation | r | 0.2464 | 0.2106 | 0.1397 | ||
| p | 0.0001 | 0.0010 | 0.0305 | |||
| Independence | r | 0.0288 | 0.1671 | 0.2193 | 0.4223 | |
| p | 0.6573 | 0.0095 | 0.0006 | 0.0000 | ||
| QoL | r | 0.0906 | 0.4486 | 0.3683 | 0.3649 | 0.4232 |
| p | 0.1620 | 0.0000 | 0.0000 | 0.0000 | 0.0000 |
3.4. Path Analysis Results
Path analysis was conducted to examine direct and indirect relationships among study variables based on the Integrated 5I Health Promotion Model. The model demonstrated excellent fit (Table 7). Participation showed a significant direct effect on physical independence (β = 3.018, p < 0.05). Physical independence had a significant direct effect on quality of life (β = 2.376, p < 0.05).
Perception demonstrated an indirect effect on physical independence through participation. Internal and external factors influenced physical independence indirectly via perception and participation pathways. The total effects indicated that participation and physical independence were the strongest predictors of quality of life. Standardized path coefficients and significance levels are presented in Figure 2 and Table 4.
Figure 1. Path Analysis Diagram
The path analysis illustrates the structural relationships between predictor variables and health outcomes. Single-headed arrows represent direct paths, with standardized coefficients indicating the strength of the relationship.
Figure 1.
Path Analysis Diagram.
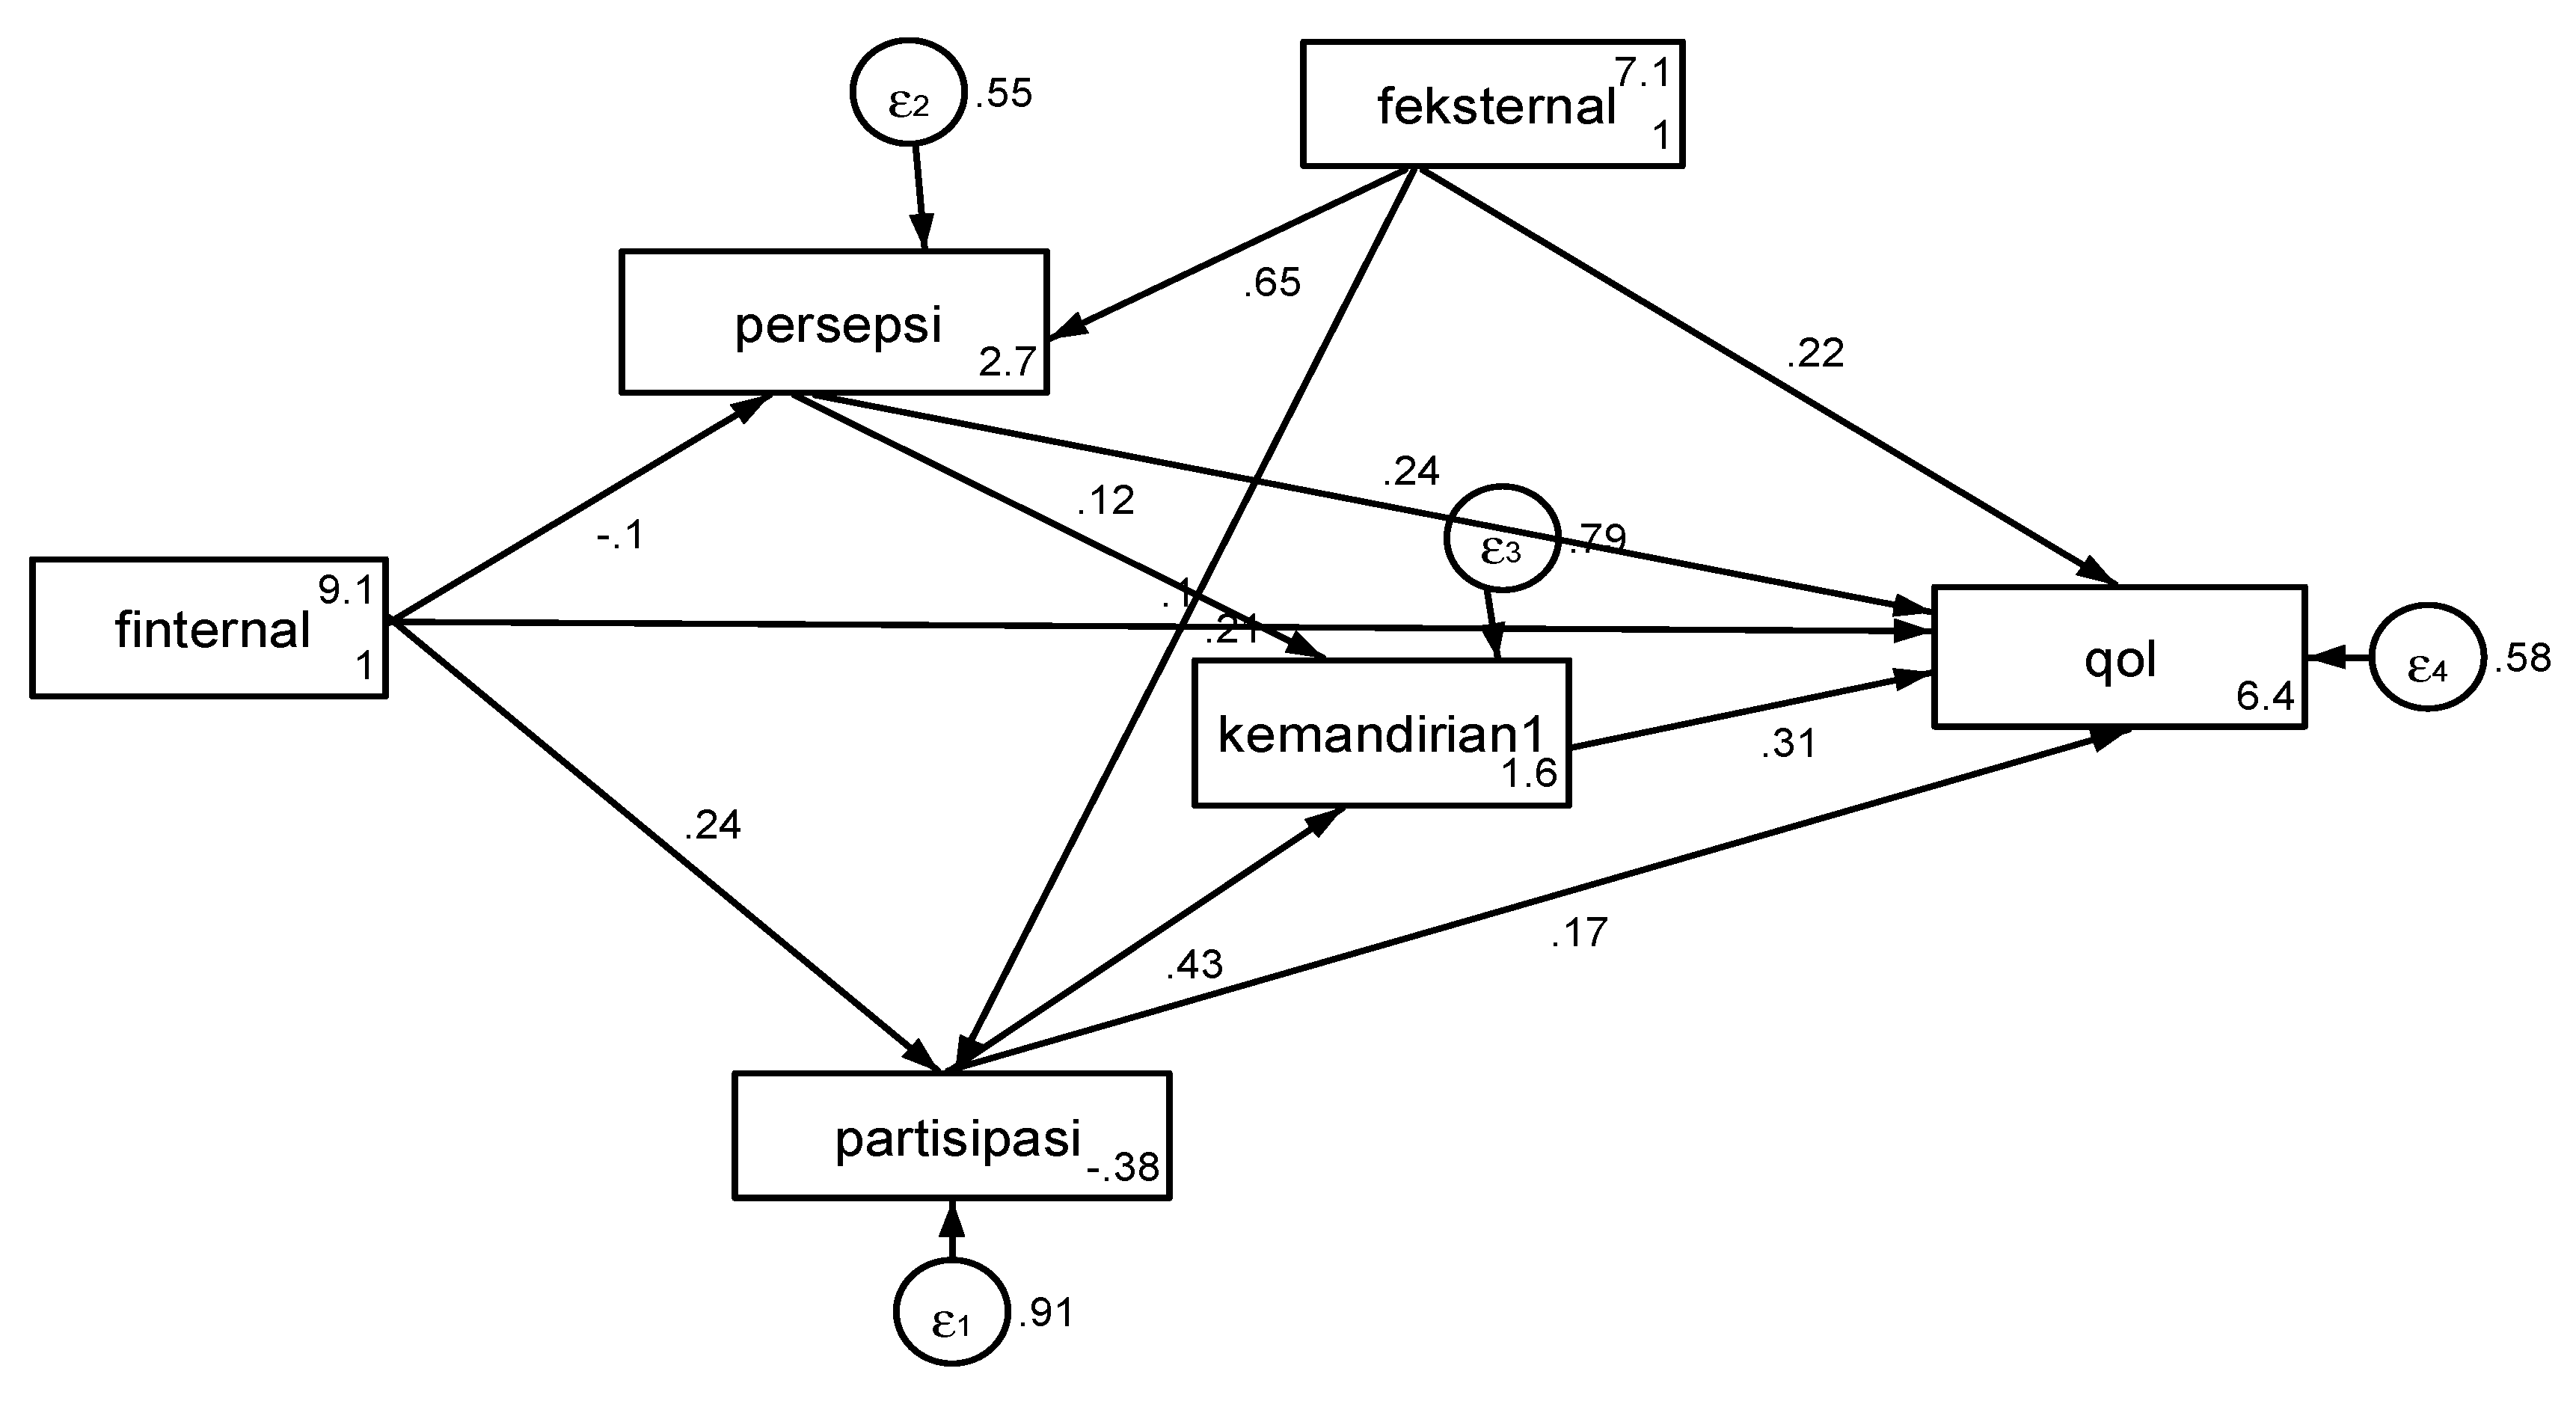
Figure 2. Integrated 5I Health Promotion Model for Active Aging * Identify: Assessment of internal and external factors. * Inspire: Motivation stage focusing on benefit perception and self-efficacy. * Initiate: Engagement in health-promoting behaviors and change stages. * Integrate: Strengthening cross-sector support via the Pentahelix approach. * Impact: Evaluation of independence, quality of life, and policy influence.
The model achieved a perfect fit (CFI = 1.000; RMSEA = 0.000). In the context of community-based health promotion in Indonesia, this indicates that the hypothesized structural paths of the 5I Model—moving from motivational factors to multisectoral integration—precisely account for the observed variances in this urban sample. This statistical robustness suggests that the 5I framework is highly applicable for predicting health outcomes in similar community settings.
Figure 2.
Integrated 5I Health Promotion Model Active Aging.
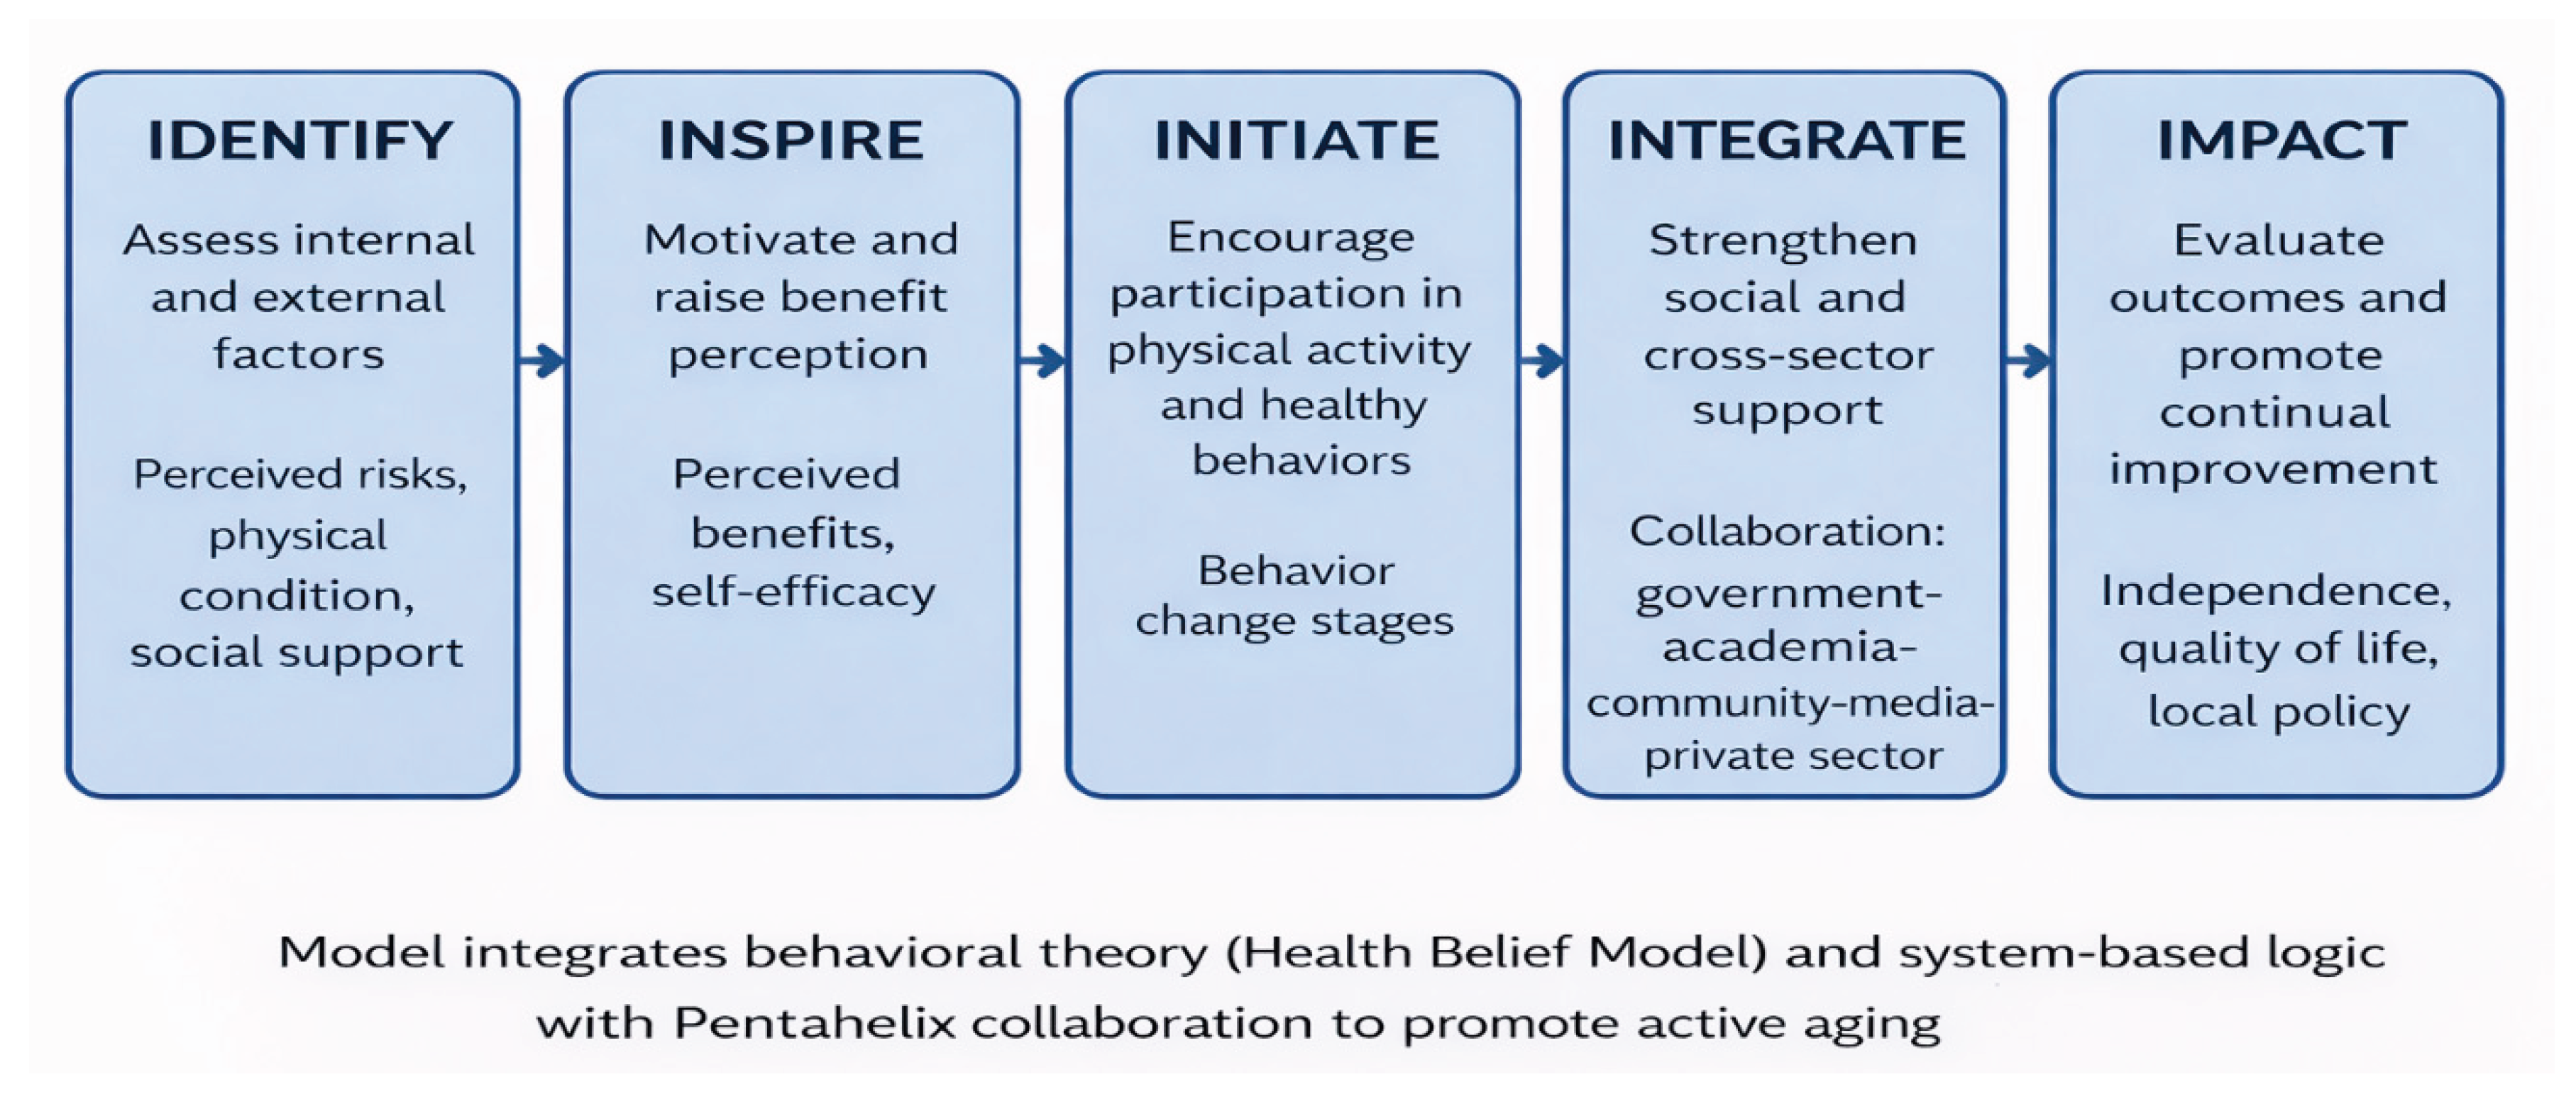
Table 4.
Structural Direct Effects.
| Endogenous Variable | Exogenous Variable | Path coefficient (β) | Error Std. | z-value | p-value | CI 95% | ||
| Lower | Upper | |||||||
| Participation | ← | Internal Factors | 0.130 | 0.033 | 3.91 | 0.000 | 0.065 | 0.195 |
| ← | External Factors | 0.038 | 0.011 | 3.37 | 0.001 | 0.016 | 0.060 | |
| Independence | ← | Participation | 3.018 | 0.410 | 7.36 | 0.000 | 2.214 | 3.822 |
| ← | Perception | 0.120 | 0.060 | 2.00 | 0.045 | 0.003 | 0.237 | |
| QoL | ← | Participation | 2.376 | 0.790 | 3.01 | 0.003 | 0.827 | 3.926 |
| ← | Perception | 0.495 | 0.135 | 3.67 | 0.000 | 0.231 | 0.760 | |
| ← | Independence | 0.599 | 0.108 | 5.52 | 0.000 | 0.386 | 0.811 | |
| ← | Internal Factors | 0.757 | 0.384 | 1.97 | 0.049 | 0.004 | 1.510 | |
| ← | External Factors | 0.543 | 0.167 | 3.24 | 0.001 | 0.215 | 0.671 | |
Table 5.
Structural Indirect Effects.
| Endogenous Variable | Exogenous Variable | Path coefficient (β) | Error Std. | z-value | p-value | CI 95% | ||
| Lower | Upper | |||||||
| Independence | ← | Internal Factors | 0.348 | 0.119 | 2.93 | 0.003 | 0.115 | 0.581 |
| ← | External Factors | 0.212 | 0.060 | 3.52 | 0.000 | 0.094 | 0.330 | |
| QoL | ← | Participation | 1.807 | 0.246 | 7.36 | 0.000 | 1.325 | 2.288 |
| ← | Perception | 0.072 | 0.036 | 2.00 | 0.045 | 0.002 | 0.142 | |
| ← | Internal Factors | 0.334 | 0.206 | 1.63 | 0.104 | -0.069 | 0.737 | |
| ← | External Factors | 0.621 | 0.129 | 4.80 | 0.000 | 0.368 | 0.874 | |
Table 6.
Structural Total Effects.
| Endogenous Variable | Exogenous Variable |
Path coefficient (β) | Error Std | z-value | p-value | CI 95% | |||
| Lower | Upper | ||||||||
| Participation | ← | Internal Factors | 0.130 | 0.033 | 3.91 | 0.000 | 0.065 | 0.195 | |
| ← | External Factors | 0.038 | 0.011 | 3.37 | 0.001 | 0.016 | 0. 600 | ||
| Independence | ← | Participation | 3.018 | 0.410 | 7.36 | 0.000 | 2.214 | 3.822 | |
| ← | Perception | 0.120 | 0.060 | 2.00 | 0.045 | 0.003 | 0.237 | ||
| ← | Internal Factors | 0.348 | 0.119 | 0.93 | 0.003 | 0.115 | 0.581 | ||
| ← | External Factors | 0.212 | 0.060 | 3.52 | 0.000 | 0.094 | 0.330 | ||
| QoL | ← | Participation | 4.183 | 0.828 | 5.05 | 0.000 | 2.560 | 5.805 | |
| ← | Perception | 0.567 | 0.140 | 4.06 | 0.000 | 0.293 | 0.841 | ||
| ← | Independence | 0.599 | 0.108 | 5.52 | 0.000 | 0.386 | 0.811 | ||
| ← | Internal Factors | 1.091 | 0.408 | 2.67 | 0.008 | 0.291 | 1.882 | ||
| ← | External Factors | 1.164 | 0.141 | 8.26 | 0.000 | 0.888 | 1.440 | ||
Table 7.
Goodness-of-Fit (GOF) Indices.
| Fit Index | Value | Interpretation |
| Chi-square (χ²) | 1.002 | Not significant (p=0.801), Model consistent with data |
| RMSEA (≤ 0.05) | 0.000 | (90% CI = [0.000–0.069]), Excellent fit |
| P(RMSEA ≤ 0.05) | 0.904 | High probability of a good fit |
| CFI (≥ 0.95) | 1.000 | Perfect comparative fit |
| TLI | 1.027 | > 1, Superior to baseline model |
| SRMR (≤ 0.08). | 0.012 | Excellent residual fit |
| AIC | 8132.155 | Moderate model complexity |
| BIC | 8198.287 | Parsimonious, predictive model structure |
4. Discussion
Our analysis empirically verified the Integrated 5I Health Promotion Model as a framework explaining how internal and external factors influence independence and quality of life among older adults engaged in health promotion activities at Posyandu Lansia. This study demonstrates a complex interaction between cognitive and behavioral components in fostering sustainable aging outcomes within the Indonesian context. The conceptual model of participants shown in Figure 2 is the Integrated 5I Health Promotion Model for Active Aging.
The model demonstrated exceptional statistical fit, highlighting its theoretical coherence and empirical strength in a critical public health context. While such values are rare in large-scale social research, in this context, they indicate that the 5I structural paths (Identify to Impact) fully capture the variance within the community-based activity groups in Surakarta. This suggests that for elderly populations already integrated into health posts (Posyandu), the progression from motivation (Inspire) to action (Initiate) and multisectoral support (Integrate) follows a highly predictable and linear trajectory.
Unique to the Indonesian context, our model shows that "Initiate" and "Integrate" stages are heavily supported by religious and cultural social capital. Activities such as communal prayers and pengajian act as informal health promotion platforms. Unlike Western models that often focus on individual gym-based exercise [16,17], health promotion for Indonesian older adults must be "embedded" within these spiritual-social structures to ensure high sustainability and participation rates [18].
The "Integrate" component underscores the necessity of the Pentahelix approach. The study reveals that independence is not merely an individual outcome but a product of systemic support—ranging from government policy to local media and academic involvement. Without the "Integrate" stage, the transition from individual behavior change to long-term quality of life (Impact) becomes fragmented [13,19].
These findings are consistent with previous studies in LMIC contexts, which emphasize the importance of daily activity engagement and social participation in maintaining functional independence among older adults [16,17,18]. Compared to intervention-based studies in high-income countries, the Integrated 5I Model highlights a more context-sensitive and scalable approach suitable for resource-limited urban settings.
However, this study has limitations. The sample was drawn from active Posyandu participants, which may introduce a "healthy volunteer bias." Therefore, the 5I model's effectiveness among homebound or frail older adults remains to be tested. Future interventions should use the "Identify" stage to specifically target those currently excluded from community groups.
4.1. Principal Findings
This study developed and empirically tested the Integrated 5I Health Promotion Model to examine determinants of physical independence and quality of life among older adults in Indonesia. The findings demonstrate that participation in daily activities plays a central role in enhancing physical independence, which in turn has a direct association with quality of life. These results highlight the importance of engagement in everyday activities as a key pathway for promoting healthy ageing in community settings. The present study contributes to the growing body of evidence on healthy ageing by empirically demonstrating that participation in daily activities is a central pathway to physical independence, which subsequently influences quality of life. This finding aligns with global ageing frameworks that emphasize functional ability rather than disease-centered outcomes as the core objective of ageing policies [1,3].
4.2. Participation as a Driver of Independence
Our findings demonstrate that participation is the single strongest predictor of physical independence (β = 3.018). Practically, this proves that older adults in urban Indonesia who remain socially active within community groups tend to maintain superior physical functionality. This aligns with global evidence suggesting that daily social-physical engagement serves as a dual protective factor against both cognitive and functional decline [6,7].
The strong association between participation and physical independence is consistent with previous studies showing that engagement in daily and social activities reduces functional decline and disability among older adults [6,7,15]. Research from both high-income and low- and middle-income countries indicates that household activities, leisure participation, and social or religious engagement have meaningfully contributed to maintaining mobility and autonomy in later life [8,16,20].
Compared with structured exercise programs, daily activity-based participation is more sustainable and contextually appropriate for community-dwelling older adults, particularly in LMIC settings where access to formal exercise facilities may be limited [17,21]. This supports calls for broader conceptualizations of physical activity within public health interventions for ageing populations.
4.3. Cultural Integration and Spiritual Capital (Novelty)
A unique dimension identified in this validation of the 5I model is the crucial role of the "Initiate" and "Integrate" stages when rooted in local values. In Surakarta, health-promoting behaviors are inextricably linked to religious structures, such as pengajian (communal religious gatherings). Unlike Western health promotion models that often emphasize individualistic gym-based interventions [17], the 5I model in Indonesia leverages "spiritual capital" as a catalyst. This cultural embedding ensures higher self-efficacy and long-term sustainability of health behaviors among the elderly [8,18].
4.4. The Pentahelix Approach for Sustained Impact
The "Integrate" component underscores the necessity of a Pentahelix approach. The study reveals that independence is not merely an individual achievement but a product of systemic synergy—ranging from academic mentorship and government policy to local media advocacy. Without this multisectoral integration, health interventions remain fragmented and fail to achieve a permanent improvement in the quality of life (Impact) [13,19].
4.5. The Role of Perception in Shaping Participation
The indirect effect of perception on physical independence through participation underscores the importance of cognitive and motivational factors in health behavior. This finding aligns with behavioral theories suggesting that individuals’ beliefs about ageing, physical activity, and perceived benefits influence their willingness to engage in active behaviors [9]. Previous studies have similarly reported that positive perceptions of ageing and physical activity are associated with higher levels of participation and functional outcomes among older adults [22,23]. By empirically positioning perception as an intermediate pathway, the Integrated 5I Model extends prior work that often examines beliefs and behaviors separately, offering a more coherent explanation of how cognitive factors translate into functional outcomes.
4.6. Independence as a Determinant of Quality of Life
Physical independence emerged as a key determinant of quality of life, consistent with extensive literature demonstrating that functional ability strongly predicts well-being, social participation, and perceived life satisfaction among older adults [3,8,19]. Studies across diverse cultural contexts have shown that loss of independence is associated with poorer mental health outcomes and increased healthcare utilization [24,25].
4.7. Implications of the Integrated 5I Health Promotion Model
The Integrated 5I Health Promotion Model advances existing frameworks by integrating behavioral, social, and contextual determinants within a single empirically tested pathway. While previous studies have examined individual components such as physical activity or social participation in isolation [15,20], this study provides evidence for their interconnected effects on independence and quality of life.
4.8. Strengths, Limitations, and Future Directions
Despite the model’s robust fit, this study is limited by its focus on active Posyandu Lansia participants in an urban setting. This may introduce a "healthy volunteer bias." Future research should apply the 5I framework to homebound or socially isolated older adults to test the model's consistency across diverse socio-environmental variables.
4.9. Public Health Implications
From a public health perspective, the findings suggest that promoting engagement in daily activities may represent a cost-effective strategy to enhance independence and quality of life among older adults. Health promotion programs that incorporate perception-building, participation facilitation, and community support may be particularly effective in LMIC contexts. The Integrated 5I Model provides a structured yet flexible framework that can inform community-based healthy ageing initiatives.
5. Conclusions
This study demonstrates that participation in daily activities is a key determinant of physical independence among older adults, which in turn is directly associated with quality of life. The path analysis results indicate that participation and physical independence function as central pathways linking individual and contextual factors to well-being in later life. These findings support the importance of community-based engagement as a feasible strategy for promoting healthy ageing.
This model provides an empirically supported framework that integrates perception, participation, and social support into a coherent pathway for enhancing independence and quality of life. By emphasizing everyday activities rather than structured exercise alone, the model offers practical relevance for implementation in resource-limited community settings. Future research using longitudinal designs and diverse populations is recommended to further validate and refine the model.
The Integrated 5I Model (Identify, Inspire, Initiate, Integrate, Impact) provides a pragmatic and culturally sensitive framework for health promotion in Indonesia. Participation remains the key determinant of independence, which directly correlates with the quality of life in old age.
Author: Contributions; Conceptualization, S.S. and A.K.; methodology, S.S. and A.K.; software, S.S.; validation, S.S., A.K., S.A., and A.L.; formal analysis, S.S. and A.K.; investigation, S.S.; resources, S.A. and A.L.; data curation, S.S.; writing, original draft preparation, S.S.; writing—review and editing, A.K., S.A., and A.L.; visualization, S.S.; supervision, A.K.; project administration, S.S.; funding acquisition, S.S. All authors have read and agreed to the published version of the manuscript.
Funding
The corresponding author will fund the Article Processing Charge (APC). We extend our appreciation to the Research and Training Division of PPSDM, Ministry of Health, Indonesia, for funding support that made this research possible, as Keputusan Menteri Kesehatan Republik Indonesia No HK.01.07/F/1953/2022.
Institutional Review Board Statement
The study was conducted in accordance with the Declaration of Helsinki and approved by the Institutional Review Board (Ethics Committee) protocol code 1274/UN27.06.6.1/KEPK/2024; date of approval: 08 May 2024, of Dr Moewardi General Hospital.
Informed Consent Statement
Informed consent was obtained from all subjects involved in the study.
Data Availability Statement
The data presented in this study are available on reasonable request from the corresponding author. The data are not publicly archived due to privacy concerns and ethical restrictions concerning the sensitive health information of the participants. However, the complete datasets and Stata code supporting the reported results of the path analysis are available from the corresponding author upon a reasonable request, justified request, subject to review by the institutional ethics committee.
Use of Artificial Intelligence
During the preparation of this manuscript, artificial intelligence tools were used for language editing and clarity improvement. The authors reviewed and edited all content and take full responsibility for the accuracy and integrity of the work.
Acknowledgments
The authors would like to thank all study participants and community health workers for their cooperation and support during data collection.
Conflict: of Interest: The authors declare no conflict of interest.
References
- World Health Organization. World Report on Ageing and Health; WHO: Geneva, Switzerland, 2015. [Google Scholar]
- United Nations. World Population Ageing 2023; UN DESA: New York, NY, USA, 2023. [Google Scholar]
- Task Force on Community Preventive Services. Recommendations to increase physical activity in communities. Am. J. Prev. Med. 2002, 22, 67–72. [Google Scholar] [CrossRef] [PubMed]
- Beard, J.R.; Officer, A.; de Carvalho, I.A.; et al. The World report on ageing and health: A policy framework for healthy ageing. Lancet 2016, 387, 2145–2154. [Google Scholar] [CrossRef] [PubMed]
- Piotrowicz, K.; Gąsowski, J.; Michel, J.P.; Veronese, N. Post-COVID-19 acute sarcopenia: physiopathology and management. Aging clinical and experimental research 2021, 33(10), 2887–2898. [Google Scholar] [CrossRef] [PubMed]
- Paterson, D.H.; Warburton, D.E.R. Physical activity and functional limitations in older adults: A systematic review. Appl. Physiol. Nutr. Metab. 2010, 35, 237–245. [Google Scholar]
- Sun, F.; Norman, I.J.; While, A.E. Physical activity in older people: A systematic review. BMC Public Health 2013, 13, 449. [Google Scholar] [CrossRef] [PubMed]
- Tak, E.; Kuiper, R.; Chorus, A.; Hopman-Rock, M. Prevention of onset and progression of basic ADL disability by physical activity in community-dwelling older adults: A meta-analysis. Ageing Res. Rev. 2013, 12, 329–338. [Google Scholar] [CrossRef] [PubMed]
- Glanz, K.; et al. Health Behavior: Theory, Research, and Practice, 5th ed.; Jossey-Bass: San Francisco, CA, USA, 2015. [Google Scholar]
- Naseer, K.; Qazi, J.; Qazi, A.; Avuglah, B.K.; Tahir, R.; Rasheed, R.A.; Naseem, U. Travel behaviour prediction amid COVID-19 underlaying situational awareness theory and health belief model. Behaviour & Information Technology 2022, 41(15), 3318–3328. [Google Scholar]
- McKenzie, J.F.; Neiger, B.L.; Thackeray, R. Planning, Implementing, and Evaluating Health Promotion Programs, 7th ed.; Pearson: Boston, MA, USA, 2017. [Google Scholar]
- Mills, T.; Lawton, R.; Sheard, L. Advancing complexity science in healthcare research: the logic of logic models. BMC Medical Research Methodology 2019, 19(1), 1–11. [Google Scholar] [CrossRef] [PubMed]
- Kickbusch, I.; Gleicher, D. Governance for Health in the 21st Century; WHO Europe: Copenhagen, Denmark, 2012. [Google Scholar]
- Ministry of Tourism. Regulation of the Minister of Tourism No. 14 of 2016; Jakarta, Indonesia, 2016. [Google Scholar]
- Kock, N.; Hadaya, P. Minimum sample size estimation in PLS-SEM. Inf. Syst. J. 2018, 28, 227–261. [Google Scholar] [CrossRef]
- Levasseur, M.; Roy, M.; Michallet, B.; St-Hilaire, F.; Maltais, D.; Génier, S.; Desrosiers, J. Associations between resilience, community belonging, and social participation among community-dwelling older adults. Age and Ageing 2015, 44, 125–131. [Google Scholar] [CrossRef]
- Sallis, J.F.; Bull, F.; Guthold, R.; Heath, G.W.; Inoue, S.; Kelly, P.; Oyeyemi, A.L.; Perez, L.G.; Richards, J.; Hallal, P.C. Progress in physical activity over the Olympic quadrennium. The Lancet 2016, 388, 1325–1336. [Google Scholar] [CrossRef] [PubMed]
- World Health Organization (WHO); World Health Organization. Decade of Healthy Ageing 2021–2030. Geneva, Switzerland, 2020. Available online: https://www.who.int/initiatives/decade-of-healthy-ageing (accessed on 2025).
- Netuveli, G.; Blane, D. Quality of life in older ages. Age Ageing 2008, 37, 13–18. [Google Scholar] [CrossRef] [PubMed]
- James, B.D.; Boyle, P.A.; Buchman, A.S.; Bennett, D.A. Relation of late-life social activity with incident disability among community-dwelling older adults. The Journals of Gerontology: Series B 2011, 66B, 467–473. [Google Scholar] [CrossRef] [PubMed]
- Bauman, A.E.; Reis, R.S.; Sallis, J.F.; Wells, J.C.; Loos, R.J.F.; Martin, B.W. Correlates of physical activity: Why are some people physically active and others not? The Lancet 2012, 380, 258–271. [Google Scholar] [CrossRef] [PubMed]
- Wurm, S.; Tesch-Römer, C.; Tomasik, M.J. Longitudinal findings on aging-related cognitions, control beliefs, and health in later life. Psychology and Aging 2013, 28, 364–373. [Google Scholar] [CrossRef] [PubMed]
- Marques, A.; Santos, D.A.; Hillman, C.H.; Sardinha, L.B. How does physical activity impact quality of life of older adults? International Journal of Environmental Research and Public Health 2020, 17, 525. [Google Scholar] [CrossRef]
- Stuck, A.E.; Egger, M.; Hammer, A.; Minder, C.E.; Beck, J.C. Home visits to prevent nursing home admission and functional decline in elderly people: Systematic review and meta-regression analysis. The Lancet 1999, 354, 1361–1367. [Google Scholar] [CrossRef] [PubMed]
- Verbrugge, L.M.; Jette, A.M. The disablement process. Social Science & Medicine 1994, 38, 1–14. [Google Scholar] [CrossRef] [PubMed]
Disclaimer/Publisher’s Note: The statements, opinions and data contained in all publications are solely those of the individual author(s) and contributor(s) and not of MDPI and/or the editor(s). MDPI and/or the editor(s) disclaim responsibility for any injury to people or property resulting from any ideas, methods, instructions or products referred to in the content. |
© 2026 by the authors. Licensee MDPI, Basel, Switzerland. This article is an open access article distributed under the terms and conditions of the Creative Commons Attribution (CC BY) license.
Copyright: This open access article is published under a Creative Commons CC BY 4.0 license, which permit the free download, distribution, and reuse, provided that the author and preprint are cited in any reuse.


